Embed Size (px)
Citation preview
Arizona Office of Economic Opportunity Page 1
Monthly Employment Report
Unemployment Rate Decreases to 4.7%;
Above-Average Monthly Gains in Construction
Arizona’s seasonally adjusted unemployment
rate decreased from 4.9% in April to 4.7% in May.
The U.S. seasonally adjusted unemployment rate
declined from 3.9% in April to 3.8% in May. A
year ago, the Arizona seasonally adjusted rate
was 4.9% and the U.S. rate was 4.3% (see Figure
1). Over the month, Arizona’s seasonally
adjusted labor force level increased 2,904
individuals from April to May. From May 2017 to
May 2018 Arizona’s seasonally adjusted labor
force level increased 74,733 individuals.
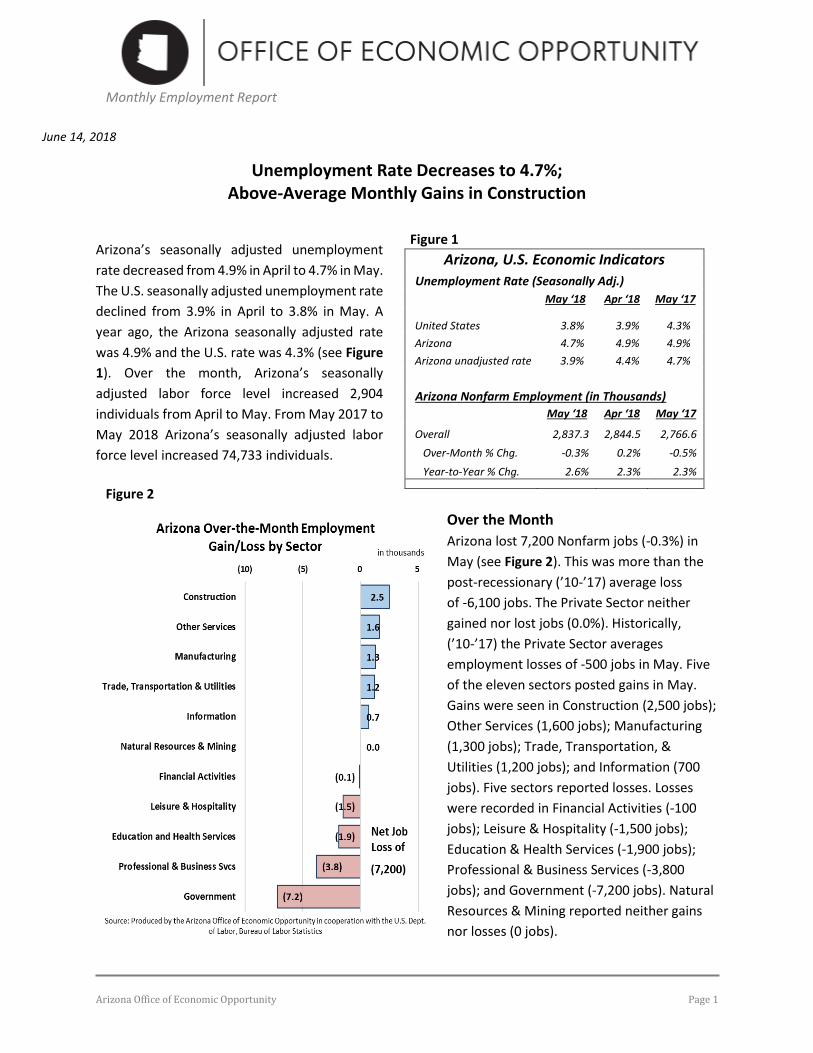
Over the Month
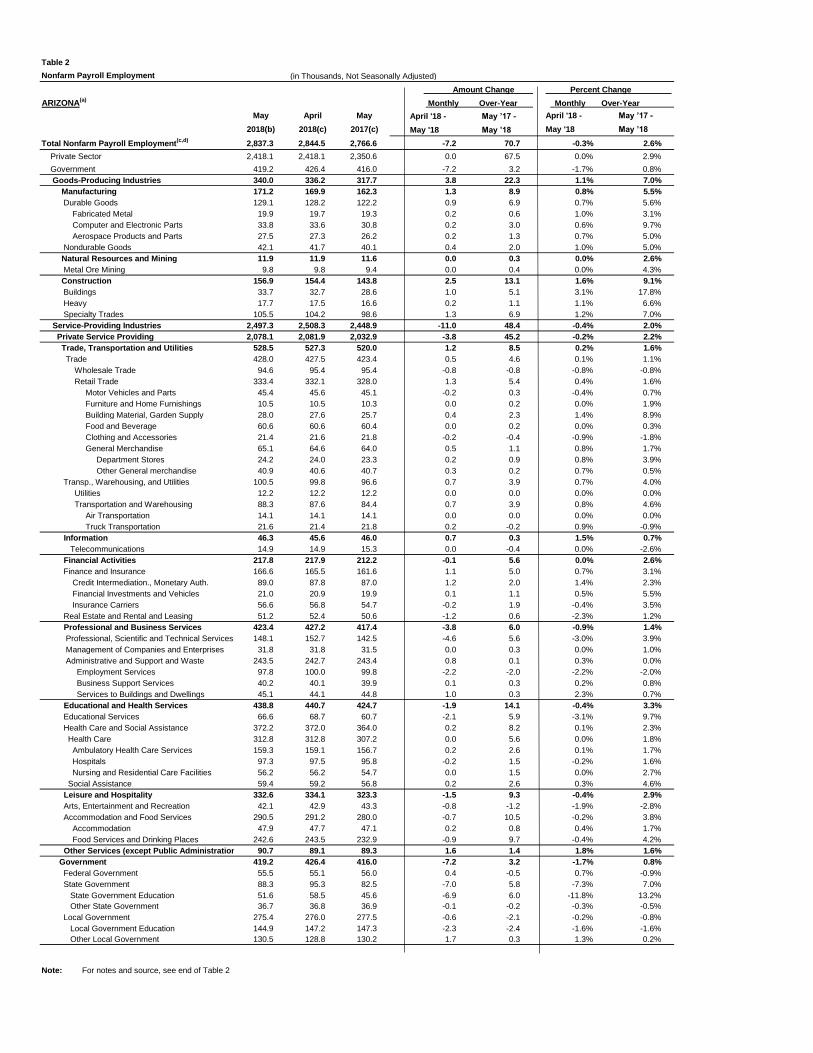
Arizona lost 7,200 Nonfarm jobs (-0.3%) in
May (see Figure 2). This was more than the
post-recessionary (’10-’17) average loss
of -6,100 jobs. The Private Sector neither
gained nor lost jobs (0.0%). Historically,
(’10-’17) the Private Sector averages
employment losses of -500 jobs in May. Five
of the eleven sectors posted gains in May.
Gains were seen in Construction (2,500 jobs);
Other Services (1,600 jobs); Manufacturing
(1,300 jobs); Trade, Transportation, &
Utilities (1,200 jobs); and Information (700
jobs). Five sectors reported losses. Losses
were recorded in Financial Activities (-100
jobs); Leisure & Hospitality (-1,500 jobs);
Education & Health Services (-1,900 jobs);
Professional & Business Services (-3,800
jobs); and Government (-7,200 jobs). Natural
Resources & Mining reported neither gains
nor losses (0 jobs).
June 14, 2018
Arizona, U.S. Economic Indicators
Unemployment Rate (Seasonally Adj.)
May ‘18 Apr ‘18 May ‘17
United States 3.8% 3.9% 4.3%
Arizona 4.7% 4.9% 4.9%
Arizona unadjusted rate 3.9% 4.4% 4.7%
Arizona Nonfarm Employment (in Thousands)
May ‘18 Apr ‘18 May ‘17
Overall 2,837.3 2,844.5 2,766.6
Over-Month % Chg. -0.3% 0.2% -0.5%
Year-to-Year % Chg. 2.6% 2.3% 2.3%
Figure 1
Figure 2
Arizona Office of Economic Opportunity Page 2
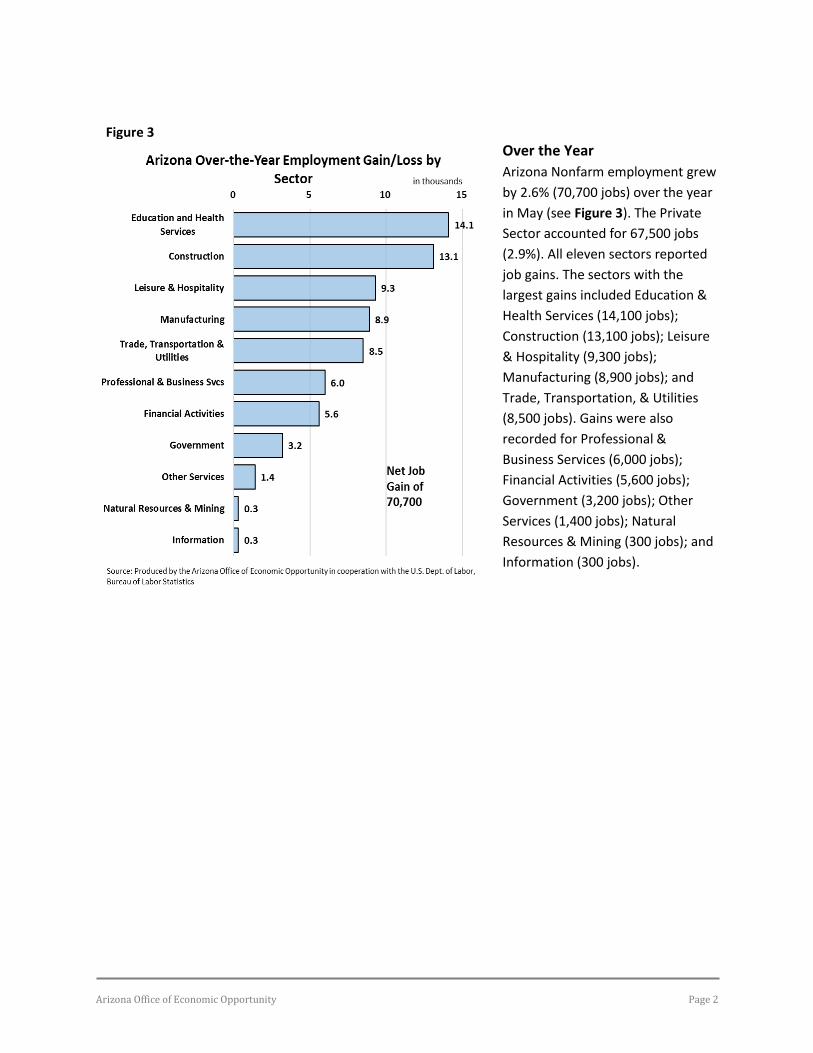
Over the Year
Arizona Nonfarm employment grew
by 2.6% (70,700 jobs) over the year
in May (see Figure 3). The Private
Sector accounted for 67,500 jobs
(2.9%). All eleven sectors reported
job gains. The sectors with the
largest gains included Education &
Health Services (14,100 jobs);
Construction (13,100 jobs); Leisure
& Hospitality (9,300 jobs);
Manufacturing (8,900 jobs); and
Trade, Transportation, & Utilities
(8,500 jobs). Gains were also
recorded for Professional &
Business Services (6,000 jobs);
Financial Activities (5,600 jobs);
Government (3,200 jobs); Other
Services (1,400 jobs); Natural
Resources & Mining (300 jobs); and
Information (300 jobs).
Figure 3

Source: Prepared by the Arizona Office of Economic Opportunity, in cooperation with the U.S. Dept. of Labor, Bureau of Labor Statistics
2.1%
5.5%
-15%
-10%
-5%
0%
5%
10%
Arizona & U.S. Manufacturing EmploymentYear-to-Year Percent Change
U.S. AZ
1.6%
2.6%
-10%
-8%
-6%
-4%
-2%
0%
2%
4%
Arizona & U.S. Nonfarm EmploymentYear-to-Year Percent Change
U.S. AZ
3.8%
4.7%
2%
3%
4%
5%
6%
7%
8%
9%
10%
11%
12%
Arizona & U.S. Unemployment RateSeasonally Adjusted
U.S. AZ
4.2%
9.1%
-35%
-30%
-25%
-20%
-15%
-10%
-5%
0%
5%
10%
15%
Arizona & U.S. Construction EmploymentYear-to-Year Percent Change
U.S. AZ
LABOR MARKET TRENDS CHARTS

LABOR MARKET TRENDS CHARTS
Source: Prepared by the Arizona Office of Economic Opportunity, in cooperation with the U.S. Dept. of Labor, Bureau of Labor Statistics
1.6%
2.9%
-8%
-6%
-4%
-2%
0%
2%
4%
6%
8%
Arizona & U.S. Leisure & HospitalityYear-to-Year Percent Change
U.S. AZ
2.0%
1.8%
0%
1%
2%
3%
4%
5%
6%
7%
Arizona & U.S. Health Care Year-to-Year Percent Change
U.S. AZ
0.8%
1.6%
-10%
-8%
-6%
-4%
-2%
0%
2%
4%
6%
Arizona & U.S. Retail TradeYear-to-Year Percent Change
U.S. AZ
3.1%
-2.0%
-30%
-25%
-20%
-15%
-10%
-5%
0%
5%
10%
15%
20%
Arizona & U.S. Employment ServicesYear-to-Year Percent Change
U.S. AZ
ARIZONA May April May April ’18 - May ’17 -
2018(c)
2018(d)
2017(d) May ’18 May ’18
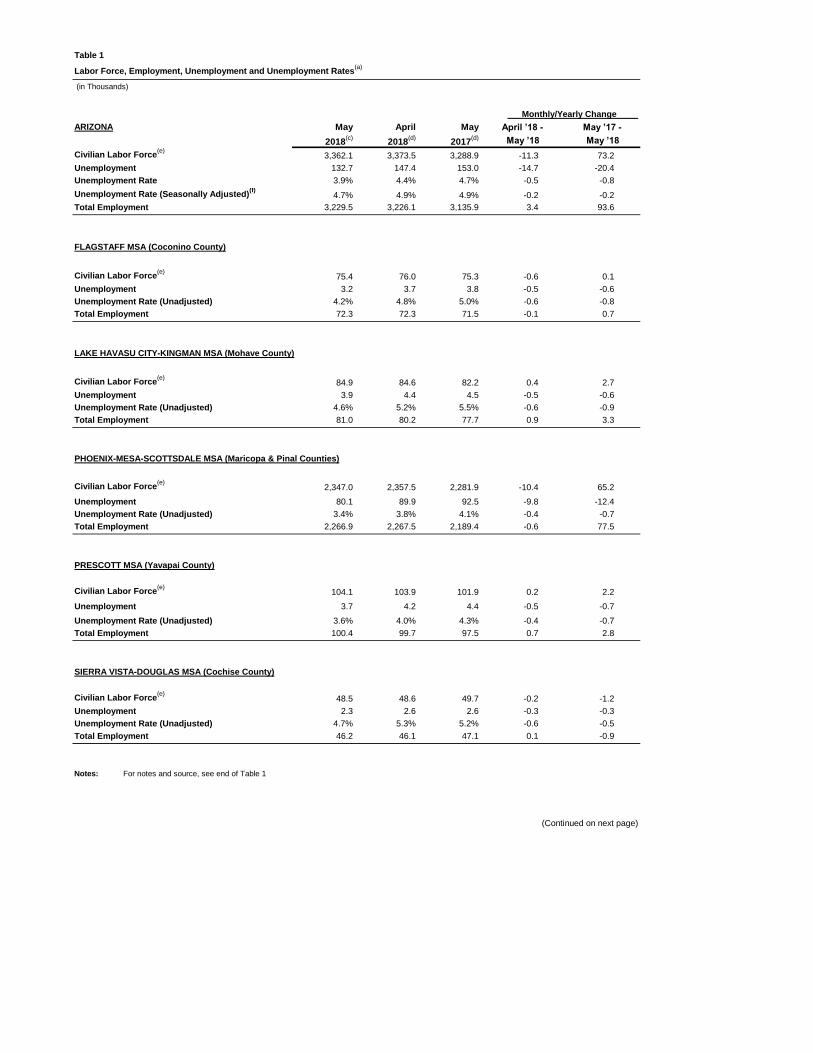
3,362.1 3,373.5 3,288.9 -11.3 73.2
132.7 147.4 153.0 -14.7 -20.4
3.9% 4.4% 4.7% -0.5 -0.8
4.7% 4.9% 4.9% -0.2 -0.2
3,229.5 3,226.1 3,135.9 3.4 93.6
FLAGSTAFF MSA (Coconino County)
75.4 76.0 75.3 -0.6 0.1
3.2 3.7 3.8 -0.5 -0.6
4.2% 4.8% 5.0% -0.6 -0.8
72.3 72.3 71.5 -0.1 0.7
LAKE HAVASU CITY-KINGMAN MSA (Mohave County)
84.9 84.6 82.2 0.4 2.7
3.9 4.4 4.5 -0.5 -0.6
4.6% 5.2% 5.5% -0.6 -0.9
81.0 80.2 77.7 0.9 3.3
PHOENIX-MESA-SCOTTSDALE MSA (Maricopa & Pinal Counties)
2,347.0 2,357.5 2,281.9 -10.4 65.2
80.1 89.9 92.5 -9.8 -12.4
3.4% 3.8% 4.1% -0.4 -0.7
2,266.9 2,267.5 2,189.4 -0.6 77.5
PRESCOTT MSA (Yavapai County)
104.1 103.9 101.9 0.2 2.2
3.7 4.2 4.4 -0.5 -0.7
3.6% 4.0% 4.3% -0.4 -0.7
100.4 99.7 97.5 0.7 2.8
SIERRA VISTA-DOUGLAS MSA (Cochise County)
48.5 48.6 49.7 -0.2 -1.2
2.3 2.6 2.6 -0.3 -0.3
4.7% 5.3% 5.2% -0.6 -0.5
46.2 46.1 47.1 0.1 -0.9
Notes: For notes and source, see end of Table 1
(Continued on next page)
Civilian Labor Force(e)
Unemployment
Unemployment Rate (Unadjusted)
Total Employment
Civilian Labor Force(e)
Unemployment
Unemployment Rate (Unadjusted)
Total Employment
Civilian Labor Force(e)
Unemployment
Unemployment Rate (Unadjusted)
Total Employment
Civilian Labor Force(e)
Unemployment
Unemployment Rate (Unadjusted)
Total Employment
Unemployment Rate (Unadjusted)
Total Employment
Unemployment
Table 1
Labor Force, Employment, Unemployment and Unemployment Rates(a)
(in Thousands)
Monthly/Yearly Change
Civilian Labor Force(e)
Unemployment Rate
Unemployment Rate (Seasonally Adjusted)(f)
Total Employment
Civilian Labor Force(e)
Unemployment
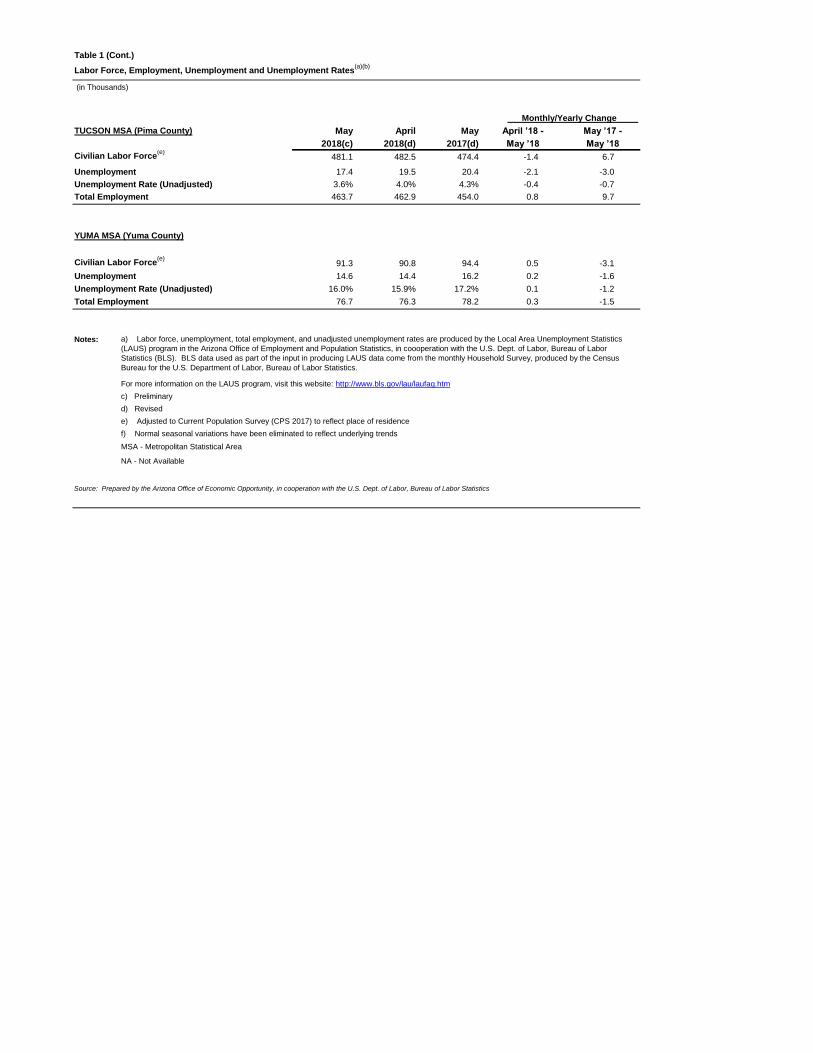
Table 1 (Cont.)
Labor Force, Employment, Unemployment and Unemployment Rates(a)(b)
(in Thousands)
TUCSON MSA (Pima County) May April May April ’18 - May ’17 -
2018(c) 2018(d) 2017(d) May ’18 May ’18
481.1 482.5 474.4 -1.4 6.7
17.4 19.5 20.4 -2.1 -3.0
3.6% 4.0% 4.3% -0.4 -0.7
463.7 462.9 454.0 0.8 9.7
YUMA MSA (Yuma County)
91.3 90.8 94.4 0.5 -3.1
14.6 14.4 16.2 0.2 -1.6
16.0% 15.9% 17.2% 0.1 -1.2
76.7 76.3 78.2 0.3 -1.5
Notes:
For more information on the LAUS program, visit this website: http://www.bls.gov/lau/laufaq.htm
Source: Prepared by the Arizona Office of Economic Opportunity, in cooperation with the U.S. Dept. of Labor, Bureau of Labor Statistics
Unemployment
Unemployment Rate (Unadjusted)
Total Employment
a) Labor force, unemployment, total employment, and unadjusted unemployment rates are produced by the Local Area Unemployment Statistics
(LAUS) program in the Arizona Office of Employment and Population Statistics, in coooperation with the U.S. Dept. of Labor, Bureau of Labor
Statistics (BLS). BLS data used as part of the input in producing LAUS data come from the monthly Household Survey, produced by the Census
Bureau for the U.S. Department of Labor, Bureau of Labor Statistics.
c) Preliminary
e) Adjusted to Current Population Survey (CPS 2017) to reflect place of residence
f) Normal seasonal variations have been eliminated to reflect underlying trends
MSA - Metropolitan Statistical Area
NA - Not Available
Civilian Labor Force(e)
d) Revised
Unemployment
Unemployment Rate (Unadjusted)
Total Employment
Monthly/Yearly Change
Civilian Labor Force(e)
Nonfarm Payroll Employment (in Thousands, Not Seasonally Adjusted)
ARIZONA(a)
May April May April '18 - May ’17 - April '18 - May ’17 -
2018(b) 2018(c) 2017(c) May '18 May ’18 May '18 May ’18
2,837.3 2,844.5 2,766.6 -7.2 70.7 -0.3% 2.6%
2,418.1 2,418.1 2,350.6 0.0 67.5 0.0% 2.9%
419.2 426.4 416.0 -7.2 3.2 -1.7% 0.8%
340.0 336.2 317.7 3.8 22.3 1.1% 7.0%
171.2 169.9 162.3 1.3 8.9 0.8% 5.5%
129.1 128.2 122.2 0.9 6.9 0.7% 5.6%
19.9 19.7 19.3 0.2 0.6 1.0% 3.1%
33.8 33.6 30.8 0.2 3.0 0.6% 9.7%
27.5 27.3 26.2 0.2 1.3 0.7% 5.0%
42.1 41.7 40.1 0.4 2.0 1.0% 5.0%
11.9 11.9 11.6 0.0 0.3 0.0% 2.6%
9.8 9.8 9.4 0.0 0.4 0.0% 4.3%
156.9 154.4 143.8 2.5 13.1 1.6% 9.1%
33.7 32.7 28.6 1.0 5.1 3.1% 17.8%
17.7 17.5 16.6 0.2 1.1 1.1% 6.6%
105.5 104.2 98.6 1.3 6.9 1.2% 7.0%
2,497.3 2,508.3 2,448.9 -11.0 48.4 -0.4% 2.0%
2,078.1 2,081.9 2,032.9 -3.8 45.2 -0.2% 2.2%
528.5 527.3 520.0 1.2 8.5 0.2% 1.6%
428.0 427.5 423.4 0.5 4.6 0.1% 1.1%
Wholesale Trade 94.6 95.4 95.4 -0.8 -0.8 -0.8% -0.8%
Retail Trade 333.4 332.1 328.0 1.3 5.4 0.4% 1.6%
Motor Vehicles and Parts 45.4 45.6 45.1 -0.2 0.3 -0.4% 0.7%
Furniture and Home Furnishings 10.5 10.5 10.3 0.0 0.2 0.0% 1.9%
Building Material, Garden Supply 28.0 27.6 25.7 0.4 2.3 1.4% 8.9%
Food and Beverage 60.6 60.6 60.4 0.0 0.2 0.0% 0.3%
Clothing and Accessories 21.4 21.6 21.8 -0.2 -0.4 -0.9% -1.8%
General Merchandise 65.1 64.6 64.0 0.5 1.1 0.8% 1.7%
Department Stores 24.2 24.0 23.3 0.2 0.9 0.8% 3.9%
Other General merchandise 40.9 40.6 40.7 0.3 0.2 0.7% 0.5%
Transp., Warehousing, and Utilities 100.5 99.8 96.6 0.7 3.9 0.7% 4.0%
Utilities 12.2 12.2 12.2 0.0 0.0 0.0% 0.0%
Transportation and Warehousing 88.3 87.6 84.4 0.7 3.9 0.8% 4.6%
Air Transportation 14.1 14.1 14.1 0.0 0.0 0.0% 0.0%
Truck Transportation 21.6 21.4 21.8 0.2 -0.2 0.9% -0.9%
46.3 45.6 46.0 0.7 0.3 1.5% 0.7%
14.9 14.9 15.3 0.0 -0.4 0.0% -2.6%
217.8 217.9 212.2 -0.1 5.6 0.0% 2.6%
166.6 165.5 161.6 1.1 5.0 0.7% 3.1%
89.0 87.8 87.0 1.2 2.0 1.4% 2.3%
21.0 20.9 19.9 0.1 1.1 0.5% 5.5%
56.6 56.8 54.7 -0.2 1.9 -0.4% 3.5%
51.2 52.4 50.6 -1.2 0.6 -2.3% 1.2%
423.4 427.2 417.4 -3.8 6.0 -0.9% 1.4%
148.1 152.7 142.5 -4.6 5.6 -3.0% 3.9%
31.8 31.8 31.5 0.0 0.3 0.0% 1.0%
243.5 242.7 243.4 0.8 0.1 0.3% 0.0%
97.8 100.0 99.8 -2.2 -2.0 -2.2% -2.0%
40.2 40.1 39.9 0.1 0.3 0.2% 0.8%
45.1 44.1 44.8 1.0 0.3 2.3% 0.7%
438.8 440.7 424.7 -1.9 14.1 -0.4% 3.3%
66.6 68.7 60.7 -2.1 5.9 -3.1% 9.7%
372.2 372.0 364.0 0.2 8.2 0.1% 2.3%
312.8 312.8 307.2 0.0 5.6 0.0% 1.8%
159.3 159.1 156.7 0.2 2.6 0.1% 1.7%
97.3 97.5 95.8 -0.2 1.5 -0.2% 1.6%
56.2 56.2 54.7 0.0 1.5 0.0% 2.7%
59.4 59.2 56.8 0.2 2.6 0.3% 4.6%
332.6 334.1 323.3 -1.5 9.3 -0.4% 2.9%
42.1 42.9 43.3 -0.8 -1.2 -1.9% -2.8%
290.5 291.2 280.0 -0.7 10.5 -0.2% 3.8%
47.9 47.7 47.1 0.2 0.8 0.4% 1.7%
242.6 243.5 232.9 -0.9 9.7 -0.4% 4.2%
90.7 89.1 89.3 1.6 1.4 1.8% 1.6%
419.2 426.4 416.0 -7.2 3.2 -1.7% 0.8%
55.5 55.1 56.0 0.4 -0.5 0.7% -0.9%
88.3 95.3 82.5 -7.0 5.8 -7.3% 7.0%
51.6 58.5 45.6 -6.9 6.0 -11.8% 13.2%
36.7 36.8 36.9 -0.1 -0.2 -0.3% -0.5%
275.4 276.0 277.5 -0.6 -2.1 -0.2% -0.8%
144.9 147.2 147.3 -2.3 -2.4 -1.6% -1.6%
130.5 128.8 130.2 1.7 0.3 1.3% 0.2%
Note: For notes and source, see end of Table 2
Private Sector
Government
Goods-Producing Industries
Table 2
Amount Change Percent Change
Monthly Over-Year Monthly Over-Year
Total Nonfarm Payroll Employment(c,d)
Service-Providing Industries
Private Service Providing
Manufacturing
Durable Goods
Heavy
Specialty Trades
Trade, Transportation and Utilities
Trade
Fabricated Metal
Computer and Electronic Parts
Aerospace Products and Parts
Nondurable Goods
Natural Resources and Mining
Metal Ore Mining
Construction
Buildings
Information
Telecommunications
Financial Activities
Real Estate and Rental and Leasing
Finance and Insurance
Credit Intermediation., Monetary Auth.
Financial Investments and Vehicles
Insurance Carriers
Professional and Business Services
Professional, Scientific and Technical Services
Management of Companies and Enterprises
Administrative and Support and Waste
Employment Services
Business Support Services
Services to Buildings and Dwellings
Ambulatory Health Care Services
Hospitals
Educational and Health Services
Educational Services
Health Care and Social Assistance
Health Care
Accommodation and Food Services
Accommodation
Food Services and Drinking Places
Other Services (except Public Administration)
Government
State Government Education
Local Government
Other Local Government
Federal Government
State Government
Nursing and Residential Care Facilities
Social Assistance
Leisure and Hospitality
Arts, Entertainment and Recreation
Other State Government
Local Government Education
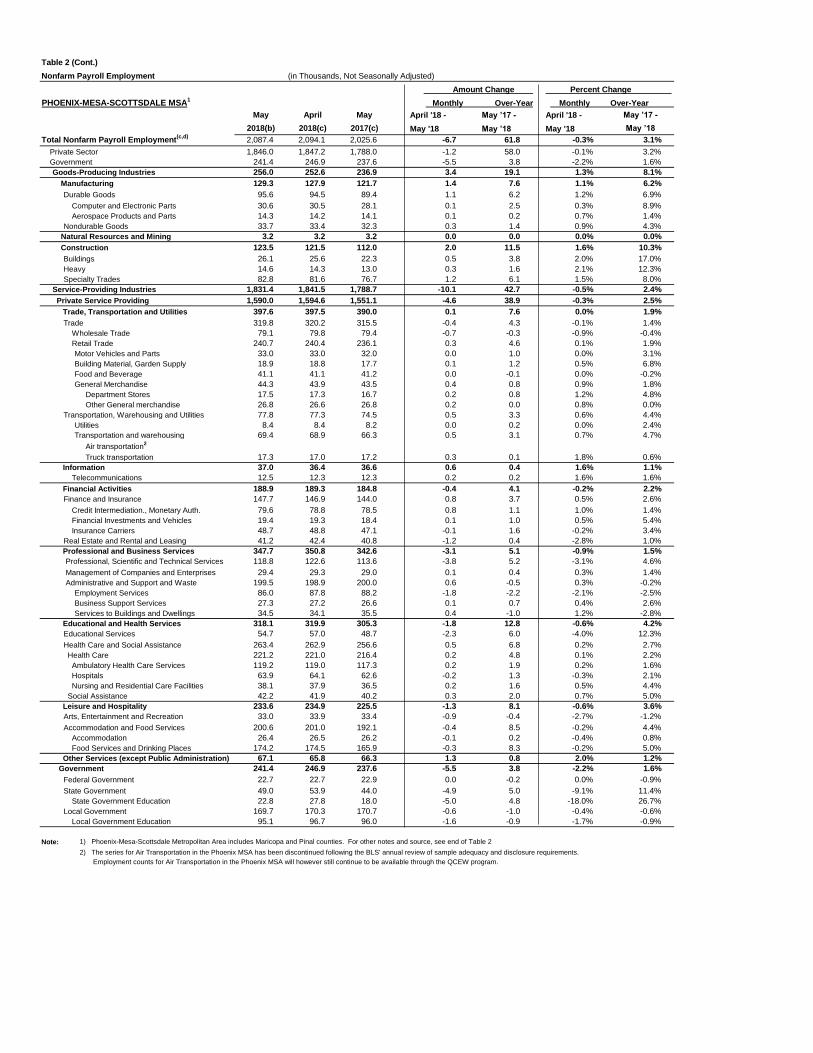
Table 2 (Cont.)
Nonfarm Payroll Employment (in Thousands, Not Seasonally Adjusted)
PHOENIX-MESA-SCOTTSDALE MSA1
May April May April '18 - May ’17 - April '18 - May ’17 -
2018(b) 2018(c) 2017(c) May '18 May ’18 May '18 May ’18
2,087.4 2,094.1 2,025.6 -6.7 61.8 -0.3% 3.1%
1,846.0 1,847.2 1,788.0 -1.2 58.0 -0.1% 3.2%
241.4 246.9 237.6 -5.5 3.8 -2.2% 1.6%
256.0 252.6 236.9 3.4 19.1 1.3% 8.1%
129.3 127.9 121.7 1.4 7.6 1.1% 6.2%
95.6 94.5 89.4 1.1 6.2 1.2% 6.9%
30.6 30.5 28.1 0.1 2.5 0.3% 8.9%
14.3 14.2 14.1 0.1 0.2 0.7% 1.4%
33.7 33.4 32.3 0.3 1.4 0.9% 4.3%
3.2 3.2 3.2 0.0 0.0 0.0% 0.0%
123.5 121.5 112.0 2.0 11.5 1.6% 10.3%
26.1 25.6 22.3 0.5 3.8 2.0% 17.0%
14.6 14.3 13.0 0.3 1.6 2.1% 12.3%
82.8 81.6 76.7 1.2 6.1 1.5% 8.0%
1,831.4 1,841.5 1,788.7 -10.1 42.7 -0.5% 2.4%
1,590.0 1,594.6 1,551.1 -4.6 38.9 -0.3% 2.5%
Trade, Transportation and Utilities 397.6 397.5 390.0 0.1 7.6 0.0% 1.9%
Trade 319.8 320.2 315.5 -0.4 4.3 -0.1% 1.4%
Wholesale Trade 79.1 79.8 79.4 -0.7 -0.3 -0.9% -0.4%
Retail Trade 240.7 240.4 236.1 0.3 4.6 0.1% 1.9%
Motor Vehicles and Parts 33.0 33.0 32.0 0.0 1.0 0.0% 3.1%
Building Material, Garden Supply 18.9 18.8 17.7 0.1 1.2 0.5% 6.8%
Food and Beverage 41.1 41.1 41.2 0.0 -0.1 0.0% -0.2%
General Merchandise 44.3 43.9 43.5 0.4 0.8 0.9% 1.8%
Department Stores 17.5 17.3 16.7 0.2 0.8 1.2% 4.8%
Other General merchandise 26.8 26.6 26.8 0.2 0.0 0.8% 0.0%
Transportation, Warehousing and Utilities 77.8 77.3 74.5 0.5 3.3 0.6% 4.4%
Utilities 8.4 8.4 8.2 0.0 0.2 0.0% 2.4%
Transportation and warehousing 69.4 68.9 66.3 0.5 3.1 0.7% 4.7%
Air transportation2
Truck transportation 17.3 17.0 17.2 0.3 0.1 1.8% 0.6%
37.0 36.4 36.6 0.6 0.4 1.6% 1.1%
12.5 12.3 12.3 0.2 0.2 1.6% 1.6%
188.9 189.3 184.8 -0.4 4.1 -0.2% 2.2%
147.7 146.9 144.0 0.8 3.7 0.5% 2.6%
79.6 78.8 78.5 0.8 1.1 1.0% 1.4%
19.4 19.3 18.4 0.1 1.0 0.5% 5.4%
48.7 48.8 47.1 -0.1 1.6 -0.2% 3.4%
41.2 42.4 40.8 -1.2 0.4 -2.8% 1.0%
347.7 350.8 342.6 -3.1 5.1 -0.9% 1.5%
118.8 122.6 113.6 -3.8 5.2 -3.1% 4.6%
29.4 29.3 29.0 0.1 0.4 0.3% 1.4%
199.5 198.9 200.0 0.6 -0.5 0.3% -0.2%
86.0 87.8 88.2 -1.8 -2.2 -2.1% -2.5%
27.3 27.2 26.6 0.1 0.7 0.4% 2.6%
34.5 34.1 35.5 0.4 -1.0 1.2% -2.8%
318.1 319.9 305.3 -1.8 12.8 -0.6% 4.2%
54.7 57.0 48.7 -2.3 6.0 -4.0% 12.3%
263.4 262.9 256.6 0.5 6.8 0.2% 2.7%
221.2 221.0 216.4 0.2 4.8 0.1% 2.2%
119.2 119.0 117.3 0.2 1.9 0.2% 1.6%
63.9 64.1 62.6 -0.2 1.3 -0.3% 2.1%
38.1 37.9 36.5 0.2 1.6 0.5% 4.4%
42.2 41.9 40.2 0.3 2.0 0.7% 5.0%
233.6 234.9 225.5 -1.3 8.1 -0.6% 3.6%
33.0 33.9 33.4 -0.9 -0.4 -2.7% -1.2%
200.6 201.0 192.1 -0.4 8.5 -0.2% 4.4%
26.4 26.5 26.2 -0.1 0.2 -0.4% 0.8%
174.2 174.5 165.9 -0.3 8.3 -0.2% 5.0%
67.1 65.8 66.3 1.3 0.8 2.0% 1.2%
241.4 246.9 237.6 -5.5 3.8 -2.2% 1.6%
22.7 22.7 22.9 0.0 -0.2 0.0% -0.9%
49.0 53.9 44.0 -4.9 5.0 -9.1% 11.4%
22.8 27.8 18.0 -5.0 4.8 -18.0% 26.7%
169.7 170.3 170.7 -0.6 -1.0 -0.4% -0.6%
95.1 96.7 96.0 -1.6 -0.9 -1.7% -0.9%
Note: 1) Phoenix-Mesa-Scottsdale Metropolitan Area includes Maricopa and Pinal counties. For other notes and source, see end of Table 2
2) The series for Air Transportation in the Phoenix MSA has been discontinued following the BLS' annual review of sample adequacy and disclosure requirements.
Employment counts for Air Transportation in the Phoenix MSA will however still continue to be available through the QCEW program.
Percent Change Amount Change
Construction
Buildings
Heavy
Specialty Trades
Government
Goods-Producing Industries
Monthly Over-Year
Aerospace Products and Parts
Nondurable Goods
Natural Resources and Mining
Monthly Over-Year
Private Service Providing
Service-Providing Industries
Computer and Electronic Parts
Manufacturing
Durable Goods
Total Nonfarm Payroll Employment(c,d)
Private Sector
Educational and Health Services
Educational Services
Health Care and Social Assistance
Health Care
Nursing and Residential Care Facilities
Social Assistance
Food Services and Drinking Places
Ambulatory Health Care Services
Hospitals
Leisure and Hospitality
Arts, Entertainment and Recreation
Accommodation and Food Services
Financial Activities
Telecommunications
Information
Local Government Education
Local Government
State Government Education
State Government
Federal Government
Government
Other Services (except Public Administration)
Accommodation
Real Estate and Rental and Leasing
Services to Buildings and Dwellings
Administrative and Support and Waste
Employment Services
Business Support Services
Professional and Business Services
Professional, Scientific and Technical Services
Management of Companies and Enterprises
Finance and Insurance
Credit Intermediation., Monetary Auth.
Financial Investments and Vehicles
Insurance Carriers
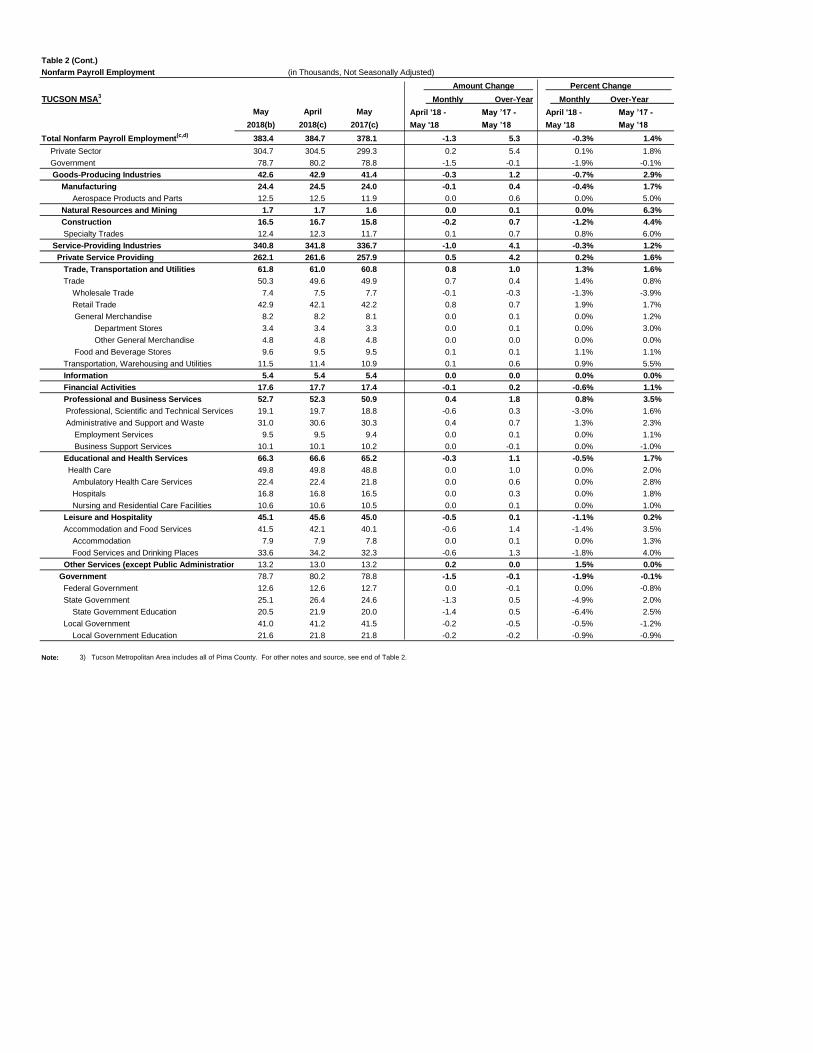
Table 2 (Cont.)
Nonfarm Payroll Employment (in Thousands, Not Seasonally Adjusted)
TUCSON MSA3
May April May April '18 - May ’17 - April '18 - May ’17 -
2018(b) 2018(c) 2017(c) May '18 May ’18 May '18 May ’18
383.4 384.7 378.1 -1.3 5.3 -0.3% 1.4%
Private Sector 304.7 304.5 299.3 0.2 5.4 0.1% 1.8%
Government 78.7 80.2 78.8 -1.5 -0.1 -1.9% -0.1%
Goods-Producing Industries 42.6 42.9 41.4 -0.3 1.2 -0.7% 2.9%
Manufacturing 24.4 24.5 24.0 -0.1 0.4 -0.4% 1.7%
12.5 12.5 11.9 0.0 0.6 0.0% 5.0%
1.7 1.7 1.6 0.0 0.1 0.0% 6.3%
16.5 16.7 15.8 -0.2 0.7 -1.2% 4.4%
12.4 12.3 11.7 0.1 0.7 0.8% 6.0%
340.8 341.8 336.7 -1.0 4.1 -0.3% 1.2%
262.1 261.6 257.9 0.5 4.2 0.2% 1.6%
61.8 61.0 60.8 0.8 1.0 1.3% 1.6%
50.3 49.6 49.9 0.7 0.4 1.4% 0.8%
7.4 7.5 7.7 -0.1 -0.3 -1.3% -3.9%
42.9 42.1 42.2 0.8 0.7 1.9% 1.7%
8.2 8.2 8.1 0.0 0.1 0.0% 1.2%
3.4 3.4 3.3 0.0 0.1 0.0% 3.0%
4.8 4.8 4.8 0.0 0.0 0.0% 0.0%
9.6 9.5 9.5 0.1 0.1 1.1% 1.1%
11.5 11.4 10.9 0.1 0.6 0.9% 5.5%
5.4 5.4 5.4 0.0 0.0 0.0% 0.0%
17.6 17.7 17.4 -0.1 0.2 -0.6% 1.1%
52.7 52.3 50.9 0.4 1.8 0.8% 3.5%
19.1 19.7 18.8 -0.6 0.3 -3.0% 1.6%
31.0 30.6 30.3 0.4 0.7 1.3% 2.3%
9.5 9.5 9.4 0.0 0.1 0.0% 1.1%
10.1 10.1 10.2 0.0 -0.1 0.0% -1.0%
66.3 66.6 65.2 -0.3 1.1 -0.5% 1.7%
49.8 49.8 48.8 0.0 1.0 0.0% 2.0%
22.4 22.4 21.8 0.0 0.6 0.0% 2.8%
16.8 16.8 16.5 0.0 0.3 0.0% 1.8%
10.6 10.6 10.5 0.0 0.1 0.0% 1.0%
45.1 45.6 45.0 -0.5 0.1 -1.1% 0.2%
41.5 42.1 40.1 -0.6 1.4 -1.4% 3.5%
7.9 7.9 7.8 0.0 0.1 0.0% 1.3%
33.6 34.2 32.3 -0.6 1.3 -1.8% 4.0%
13.2 13.0 13.2 0.2 0.0 1.5% 0.0%
78.7 80.2 78.8 -1.5 -0.1 -1.9% -0.1%
12.6 12.6 12.7 0.0 -0.1 0.0% -0.8%
25.1 26.4 24.6 -1.3 0.5 -4.9% 2.0%
20.5 21.9 20.0 -1.4 0.5 -6.4% 2.5%
41.0 41.2 41.5 -0.2 -0.5 -0.5% -1.2%
21.6 21.8 21.8 -0.2 -0.2 -0.9% -0.9%
Note: 3) Tucson Metropolitan Area includes all of Pima County. For other notes and source, see end of Table 2.
Percent Change
Monthly Over-Year Monthly Over-Year
Trade, Transportation and Utilities
Trade
Wholesale Trade
Retail Trade
Amount Change
Specialty Trades
Service-Providing Industries
Nursing and Residential Care Facilities
General Merchandise
Department Stores
Other General Merchandise
Information
Financial Activities
Food and Beverage Stores
Transportation, Warehousing and Utilities
Ambulatory Health Care Services
Private Service Providing
Construction
Natural Resources and Mining
Aerospace Products and Parts
Total Nonfarm Payroll Employment(c,d)
Accommodation and Food Services
Professional and Business Services
Professional, Scientific and Technical Services
Administrative and Support and Waste
Employment Services
Business Support Services
Educational and Health Services
Health Care
State Government Education
Leisure and Hospitality
Hospitals
Local Government Education
Local Government
State Government
Federal Government
Government
Other Services (except Public Administration)
Food Services and Drinking Places
Accommodation
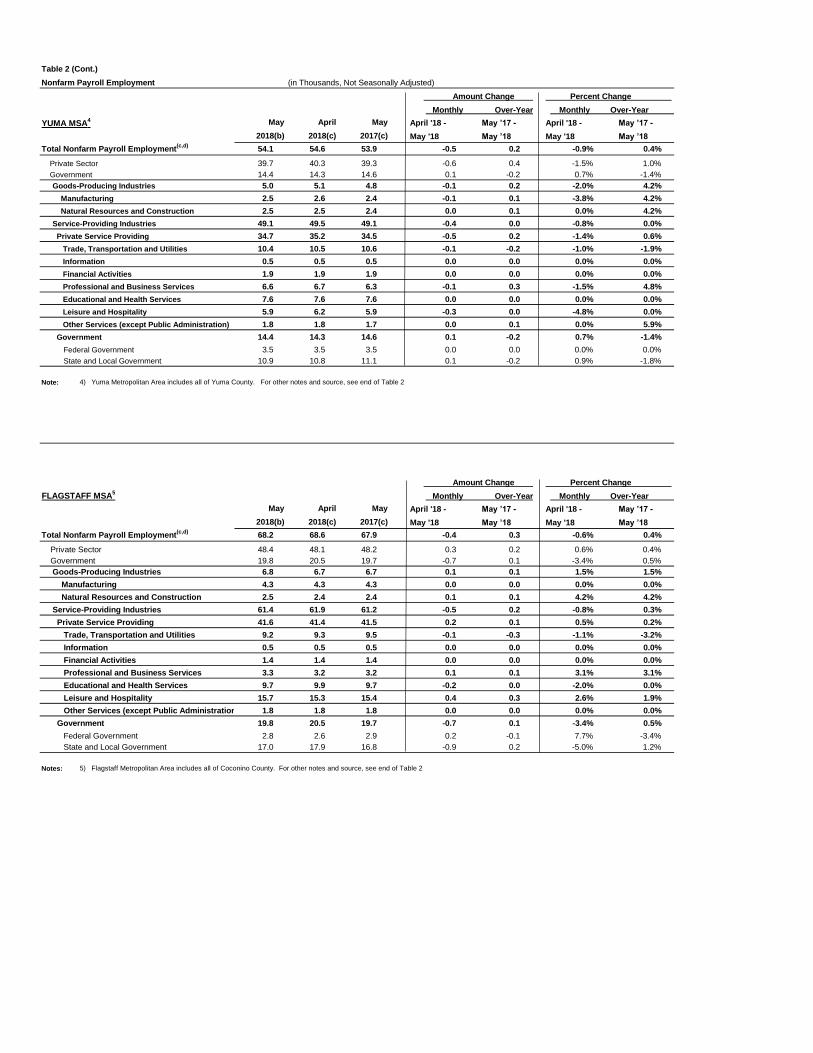
Table 2 (Cont.)
Nonfarm Payroll Employment (in Thousands, Not Seasonally Adjusted)
YUMA MSA4 May April May April '18 - May ’17 - April '18 - May ’17 -
2018(b) 2018(c) 2017(c) May '18 May ’18 May '18 May ’18
54.1 54.6 53.9 -0.5 0.2 -0.9% 0.4%
Private Sector 39.7 40.3 39.3 -0.6 0.4 -1.5% 1.0%
Government 14.4 14.3 14.6 0.1 -0.2 0.7% -1.4%
Goods-Producing Industries 5.0 5.1 4.8 -0.1 0.2 -2.0% 4.2%
Manufacturing 2.5 2.6 2.4 -0.1 0.1 -3.8% 4.2%
2.5 2.5 2.4 0.0 0.1 0.0% 4.2%
49.1 49.5 49.1 -0.4 0.0 -0.8% 0.0%
34.7 35.2 34.5 -0.5 0.2 -1.4% 0.6%
10.4 10.5 10.6 -0.1 -0.2 -1.0% -1.9%
0.5 0.5 0.5 0.0 0.0 0.0% 0.0%
1.9 1.9 1.9 0.0 0.0 0.0% 0.0%
6.6 6.7 6.3 -0.1 0.3 -1.5% 4.8%
7.6 7.6 7.6 0.0 0.0 0.0% 0.0%
5.9 6.2 5.9 -0.3 0.0 -4.8% 0.0%
1.8 1.8 1.7 0.0 0.1 0.0% 5.9%
14.4 14.3 14.6 0.1 -0.2 0.7% -1.4%
3.5 3.5 3.5 0.0 0.0 0.0% 0.0%
10.9 10.8 11.1 0.1 -0.2 0.9% -1.8%
Note: 4) Yuma Metropolitan Area includes all of Yuma County. For other notes and source, see end of Table 2
FLAGSTAFF MSA5
May April May April '18 - May ’17 - April '18 - May ’17 -
2018(b) 2018(c) 2017(c) May '18 May ’18 May '18 May ’18
68.2 68.6 67.9 -0.4 0.3 -0.6% 0.4%
Private Sector 48.4 48.1 48.2 0.3 0.2 0.6% 0.4%
Government 19.8 20.5 19.7 -0.7 0.1 -3.4% 0.5%
Goods-Producing Industries 6.8 6.7 6.7 0.1 0.1 1.5% 1.5%
Manufacturing 4.3 4.3 4.3 0.0 0.0 0.0% 0.0%
2.5 2.4 2.4 0.1 0.1 4.2% 4.2%
61.4 61.9 61.2 -0.5 0.2 -0.8% 0.3%
41.6 41.4 41.5 0.2 0.1 0.5% 0.2%
9.2 9.3 9.5 -0.1 -0.3 -1.1% -3.2%
0.5 0.5 0.5 0.0 0.0 0.0% 0.0%
1.4 1.4 1.4 0.0 0.0 0.0% 0.0%
3.3 3.2 3.2 0.1 0.1 3.1% 3.1%
9.7 9.9 9.7 -0.2 0.0 -2.0% 0.0%
15.7 15.3 15.4 0.4 0.3 2.6% 1.9%
1.8 1.8 1.8 0.0 0.0 0.0% 0.0%
19.8 20.5 19.7 -0.7 0.1 -3.4% 0.5%
2.8 2.6 2.9 0.2 -0.1 7.7% -3.4%
17.0 17.9 16.8 -0.9 0.2 -5.0% 1.2%
Notes: 5) Flagstaff Metropolitan Area includes all of Coconino County. For other notes and source, see end of Table 2
Monthly Over-Year Monthly Over-Year
Amount Change Percent Change
Information
Financial Activities
Total Nonfarm Payroll Employment(c,d)
Natural Resources and Construction
Service-Providing Industries
Private Service Providing
Trade, Transportation and Utilities
Federal Government
Percent Change
Professional and Business Services
Educational and Health Services
Leisure and Hospitality
Other Services (except Public Administration)
State and Local Government
Government
Federal Government
Amount Change
State and Local Government
Leisure and Hospitality
Other Services (except Public Administration)
Monthly Over-Year
Private Service Providing
Trade, Transportation and Utilities
Information
Total Nonfarm Payroll Employment(c,d)
Natural Resources and Construction
Service-Providing Industries
Monthly Over-Year
Financial Activities
Professional and Business Services
Educational and Health Services
Government
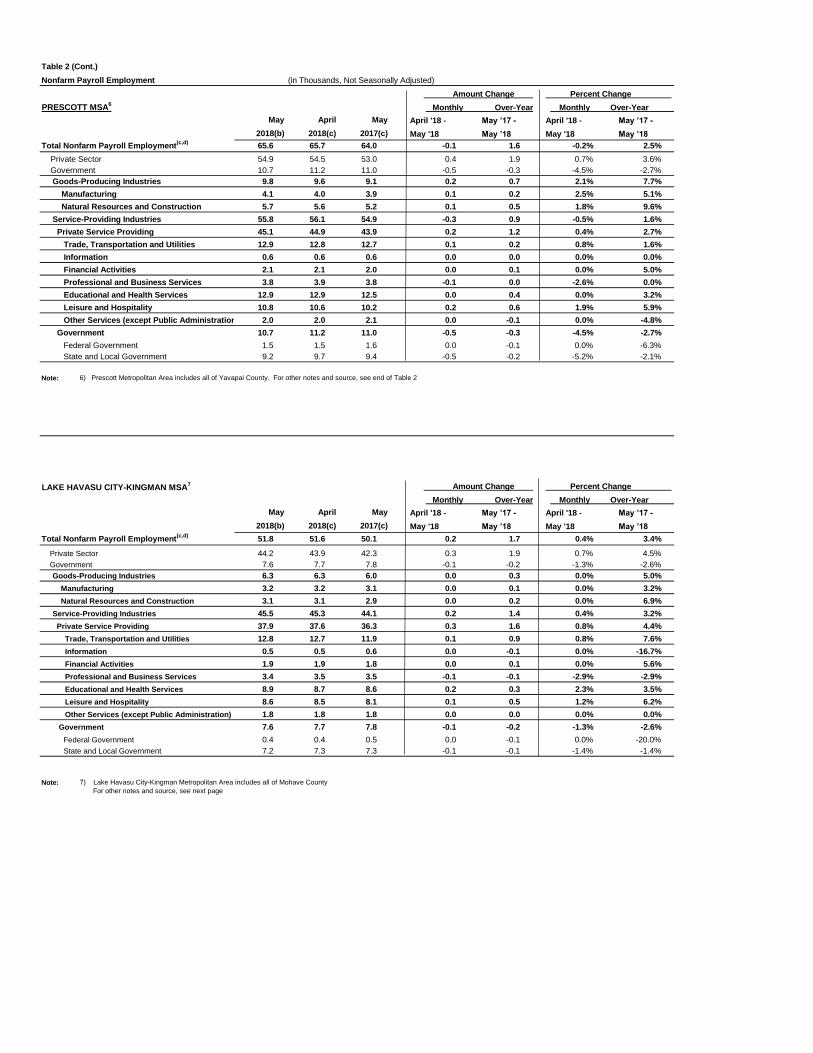
Table 2 (Cont.)
Nonfarm Payroll Employment (in Thousands, Not Seasonally Adjusted)
PRESCOTT MSA6
May April May April '18 - May ’17 - April '18 - May ’17 -
2018(b) 2018(c) 2017(c) May '18 May ’18 May '18 May ’18
65.6 65.7 64.0 -0.1 1.6 -0.2% 2.5%
Private Sector 54.9 54.5 53.0 0.4 1.9 0.7% 3.6%
Government 10.7 11.2 11.0 -0.5 -0.3 -4.5% -2.7%
Goods-Producing Industries 9.8 9.6 9.1 0.2 0.7 2.1% 7.7%
Manufacturing 4.1 4.0 3.9 0.1 0.2 2.5% 5.1%
5.7 5.6 5.2 0.1 0.5 1.8% 9.6%
55.8 56.1 54.9 -0.3 0.9 -0.5% 1.6%
45.1 44.9 43.9 0.2 1.2 0.4% 2.7%
12.9 12.8 12.7 0.1 0.2 0.8% 1.6%
0.6 0.6 0.6 0.0 0.0 0.0% 0.0%
2.1 2.1 2.0 0.0 0.1 0.0% 5.0%
3.8 3.9 3.8 -0.1 0.0 -2.6% 0.0%
12.9 12.9 12.5 0.0 0.4 0.0% 3.2%
10.8 10.6 10.2 0.2 0.6 1.9% 5.9%
2.0 2.0 2.1 0.0 -0.1 0.0% -4.8%
10.7 11.2 11.0 -0.5 -0.3 -4.5% -2.7%
1.5 1.5 1.6 0.0 -0.1 0.0% -6.3%
9.2 9.7 9.4 -0.5 -0.2 -5.2% -2.1%
Note: 6) Prescott Metropolitan Area includes all of Yavapai County. For other notes and source, see end of Table 2
LAKE HAVASU CITY-KINGMAN MSA7
May April May April '18 - May ’17 - April '18 - May ’17 -
2018(b) 2018(c) 2017(c) May '18 May ’18 May '18 May ’18
51.8 51.6 50.1 0.2 1.7 0.4% 3.4%
Private Sector 44.2 43.9 42.3 0.3 1.9 0.7% 4.5%
Government 7.6 7.7 7.8 -0.1 -0.2 -1.3% -2.6%
Goods-Producing Industries 6.3 6.3 6.0 0.0 0.3 0.0% 5.0%
Manufacturing 3.2 3.2 3.1 0.0 0.1 0.0% 3.2%
Natural Resources and Construction 3.1 3.1 2.9 0.0 0.2 0.0% 6.9%
Service-Providing Industries 45.5 45.3 44.1 0.2 1.4 0.4% 3.2%
Private Service Providing 37.9 37.6 36.3 0.3 1.6 0.8% 4.4%
Trade, Transportation and Utilities 12.8 12.7 11.9 0.1 0.9 0.8% 7.6%
Information 0.5 0.5 0.6 0.0 -0.1 0.0% -16.7%
Financial Activities 1.9 1.9 1.8 0.0 0.1 0.0% 5.6%
Professional and Business Services 3.4 3.5 3.5 -0.1 -0.1 -2.9% -2.9%
Educational and Health Services 8.9 8.7 8.6 0.2 0.3 2.3% 3.5%
Leisure and Hospitality 8.6 8.5 8.1 0.1 0.5 1.2% 6.2%
Other Services (except Public Administration) 1.8 1.8 1.8 0.0 0.0 0.0% 0.0%
Government 7.6 7.7 7.8 -0.1 -0.2 -1.3% -2.6%
Federal Government 0.4 0.4 0.5 0.0 -0.1 0.0% -20.0%
7.2 7.3 7.3 -0.1 -0.1 -1.4% -1.4%
Note:
Total Nonfarm Payroll Employment(c,d)
Natural Resources and Construction
Educational and Health Services
Private Service Providing
Trade, Transportation and Utilities
Leisure and Hospitality
Other Services (except Public Administration)
Government
Information
Financial Activities
Professional and Business Services
Service-Providing Industries
Amount Change Percent Change
Monthly Over-Year Monthly Over-Year
Federal Government
State and Local Government
Total Nonfarm Payroll Employment(c,d)
State and Local Government
7) Lake Havasu City-Kingman Metropolitan Area includes all of Mohave County
For other notes and source, see next page
Monthly Over-Year Monthly Over-Year
Amount Change Percent Change

Table 2 (Cont.)
Nonfarm Payroll Employment (in Thousands, Not Seasonally Adjusted)
SIERRA VISTA-DOUGLAS MSA8 Amount Change Percent Change
May April May April '18 - May ’17 - April '18 - May ’17 -
2018(b) 2018(c) 2017(c) May '18 May ’18 May '18 May ’18
33.4 33.5 34.0 -0.1 -0.6 -0.3% -1.8%
Private Sector 22.1 22.1 22.6 0.0 -0.5 0.0% -2.2%
Government 11.3 11.4 11.4 -0.1 -0.1 -0.9% -0.9%
Goods-Producing Industries 2.1 2.1 2.0 0.0 0.1 0.0% 5.0%
Manufacturing 0.6 0.6 0.6 0.0 0.0 0.0% 0.0%
Natural Resources and Construction 1.5 1.5 1.4 0.0 0.1 0.0% 7.1%
Service-Providing Industries 31.3 31.4 32.0 -0.1 -0.7 -0.3% -2.2%
Private Service Providing 20.0 20.0 20.6 0.0 -0.6 0.0% -2.9%
Trade, Transportation and Utilities 5.8 5.8 5.8 0.0 0.0 0.0% 0.0%
Information 0.4 0.4 0.5 0.0 -0.1 0.0% -20.0%
Financial Activities 1.2 1.2 1.2 0.0 0.0 0.0% 0.0%
Professional and Business Services 3.5 3.5 4.0 0.0 -0.5 0.0% -12.5%
Educational and Health Services 4.7 4.7 4.8 0.0 -0.1 0.0% -2.1%
Leisure and Hospitality 3.6 3.6 3.6 0.0 0.0 0.0% 0.0%
Other Services (except Public Administration) 0.8 0.8 0.7 0.0 0.1 0.0% 14.3%
Government 11.3 11.4 11.4 -0.1 -0.1 -0.9% -0.9%
Federal Government 4.8 4.8 4.8 0.0 0.0 0.0% 0.0%
6.5 6.6 6.6 -0.1 -0.1 -1.5% -1.5%
Note:
Other notes and sources:
Source: Prepared by the Arizona Office of Economic Opportunity, in cooperation with the U.S. Dept. of Labor, Bureau of Labor Statistics
c) Revised
d) By place of work; does not include agricultural workers, self-employed, unpaid family members, and domestic workers
e) Detail may not add up exactly due to rounding
MSA — Metropolitan Statistical Area
NA — Not Available
Monthly Over-Year Monthly Over-Year
Total Nonfarm Payroll Employment(c,d)
State and Local Government
8) Sierra Vista Douglas Metropolitan Area includes all of Cochise County
For other notes and source, see next page)
a) Nonfarm employment at the state and substate level is produced from the monthly establishment survey by the Current Employment Statistics (CES)
program of the Arizona Office of Employment and Population Statistics, in cooperation with U.S. Dept. of Labor, Bureau of Labor Statistics. For more information on the establishment survey, see: http://www.bls.gov/bls/empsitquickguide.htm
b) Preliminary and subject to revision the following month

JAN FEB MAR APR MAY JUN JUL AUG SEP OCT NOV DEC
Total Civilian Labor Force 20,649 20,605 20,590 20,204 20,066 - - - - - - -
Total Employment 18,346 18,359 18,472 18,348 18,464 - - - - - - -
Total Unemployment 2,303 2,246 2,118 1,856 1,602 - - - - - - -
Unemployment Rate 11.2% 10.9% 10.3% 9.2% 8.0% - - - - - - -
JAN FEB MAR APR MAY JUN JUL AUG SEP OCT NOV DEC
Total Civilian Labor Force 48,574 49,038 49,220 48,636 48,454 - - - - - - -
Total Employment 45,576 46,102 46,474 46,071 46,194 - - - - - - -
Total Unemployment 2,998 2,936 2,746 2,565 2,260 - - - - - - -
Unemployment Rate 6.2% 6.0% 5.6% 5.3% 4.7% - - - - - - -
JAN FEB MAR APR MAY JUN JUL AUG SEP OCT NOV DEC
Total Civilian Labor Force 74,630 75,350 75,682 76,009 75,449 - - - - - - -
Total Employment 69,923 70,820 71,559 72,349 72,266 - - - - - - -
Total Unemployment 4,707 4,530 4,123 3,660 3,183 - - - - - - -
Unemployment Rate 6.3% 6.0% 5.4% 4.8% 4.2% - - - - - - -
Adjusted to the Current Population Survey (CPS 2018) to reflect place of residence.
Prepared in cooperation with the U.S. Department of Labor, Bureau of Labor Statistics, by the Office of Economic Opportunity.
APACHE COUNTY
LABOR FORCE
2018
COCHISE COUNTY (SIERRA VISTA-DOUGLAS MSA)
LABOR FORCE
2018
COCONINO COUNTY (FLAGSTAFF MSA)
LABOR FORCE
2018
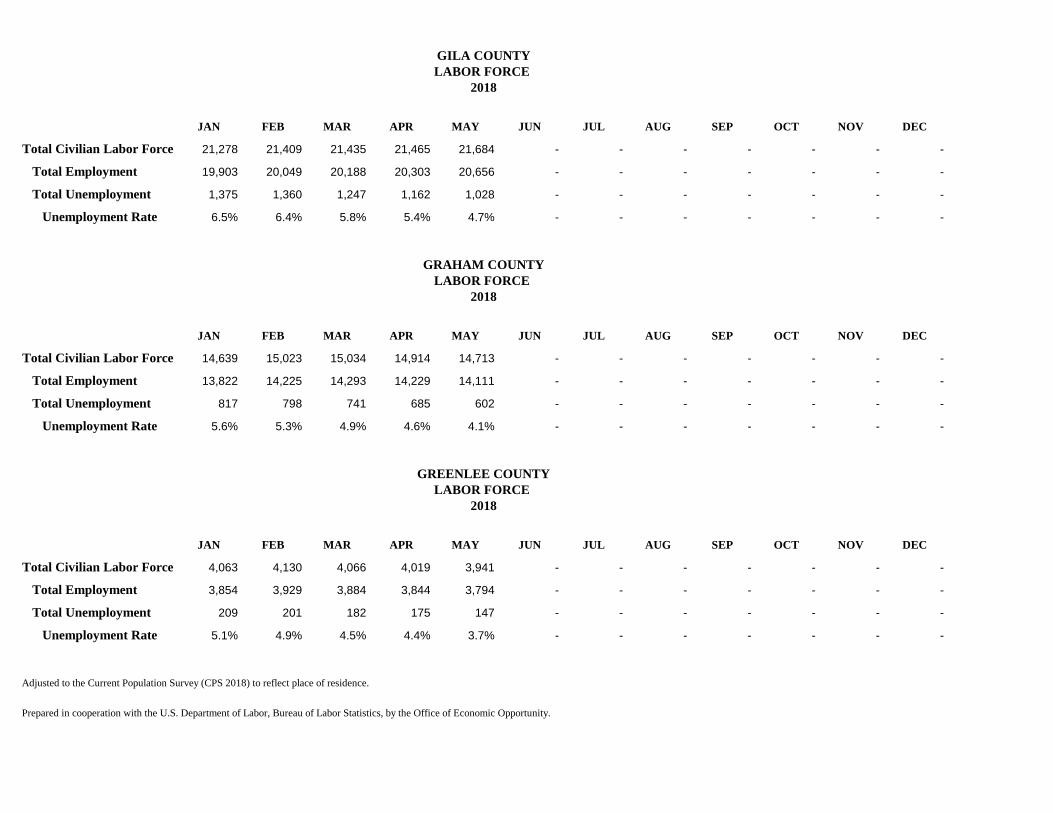
JAN FEB MAR APR MAY JUN JUL AUG SEP OCT NOV DEC
Total Civilian Labor Force 21,278 21,409 21,435 21,465 21,684 - - - - - - -
Total Employment 19,903 20,049 20,188 20,303 20,656 - - - - - - -
Total Unemployment 1,375 1,360 1,247 1,162 1,028 - - - - - - -
Unemployment Rate 6.5% 6.4% 5.8% 5.4% 4.7% - - - - - - -
JAN FEB MAR APR MAY JUN JUL AUG SEP OCT NOV DEC
Total Civilian Labor Force 14,639 15,023 15,034 14,914 14,713 - - - - - - -
Total Employment 13,822 14,225 14,293 14,229 14,111 - - - - - - -
Total Unemployment 817 798 741 685 602 - - - - - - -
Unemployment Rate 5.6% 5.3% 4.9% 4.6% 4.1% - - - - - - -
JAN FEB MAR APR MAY JUN JUL AUG SEP OCT NOV DEC
Total Civilian Labor Force 4,063 4,130 4,066 4,019 3,941 - - - - - - -
Total Employment 3,854 3,929 3,884 3,844 3,794 - - - - - - -
Total Unemployment 209 201 182 175 147 - - - - - - -
Unemployment Rate 5.1% 4.9% 4.5% 4.4% 3.7% - - - - - - -
Adjusted to the Current Population Survey (CPS 2018) to reflect place of residence.
Prepared in cooperation with the U.S. Department of Labor, Bureau of Labor Statistics, by the Office of Economic Opportunity.
2018
GILA COUNTY
LABOR FORCE
GRAHAM COUNTY
LABOR FORCE
2018
GREENLEE COUNTY
LABOR FORCE
2018
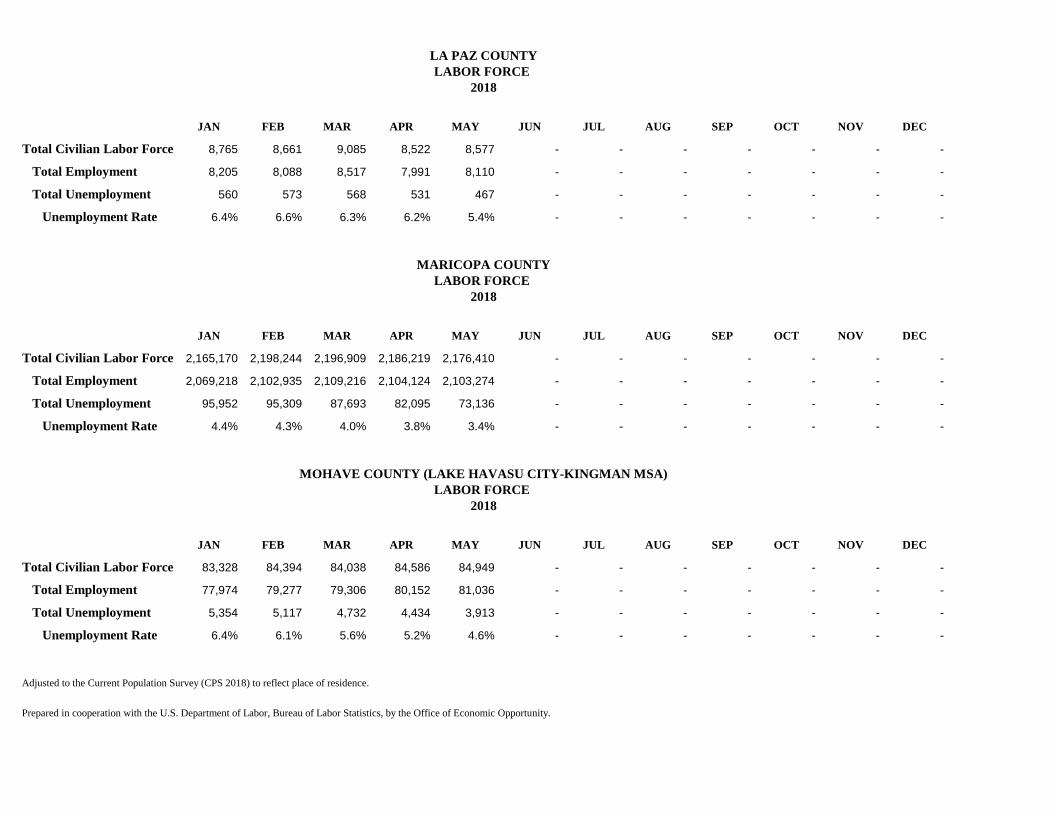
JAN FEB MAR APR MAY JUN JUL AUG SEP OCT NOV DEC
Total Civilian Labor Force 8,765 8,661 9,085 8,522 8,577 - - - - - - -
Total Employment 8,205 8,088 8,517 7,991 8,110 - - - - - - -
Total Unemployment 560 573 568 531 467 - - - - - - -
Unemployment Rate 6.4% 6.6% 6.3% 6.2% 5.4% - - - - - - -
JAN FEB MAR APR MAY JUN JUL AUG SEP OCT NOV DEC
Total Civilian Labor Force 2,165,170 2,198,244 2,196,909 2,186,219 2,176,410 - - - - - - -
Total Employment 2,069,218 2,102,935 2,109,216 2,104,124 2,103,274 - - - - - - -
Total Unemployment 95,952 95,309 87,693 82,095 73,136 - - - - - - -
Unemployment Rate 4.4% 4.3% 4.0% 3.8% 3.4% - - - - - - -
JAN FEB MAR APR MAY JUN JUL AUG SEP OCT NOV DEC
Total Civilian Labor Force 83,328 84,394 84,038 84,586 84,949 - - - - - - -
Total Employment 77,974 79,277 79,306 80,152 81,036 - - - - - - -
Total Unemployment 5,354 5,117 4,732 4,434 3,913 - - - - - - -
Unemployment Rate 6.4% 6.1% 5.6% 5.2% 4.6% - - - - - - -
Adjusted to the Current Population Survey (CPS 2018) to reflect place of residence.
Prepared in cooperation with the U.S. Department of Labor, Bureau of Labor Statistics, by the Office of Economic Opportunity.
2018
LA PAZ COUNTY
LABOR FORCE
2018
MARICOPA COUNTY
LABOR FORCE
MOHAVE COUNTY (LAKE HAVASU CITY-KINGMAN MSA)
LABOR FORCE
2018
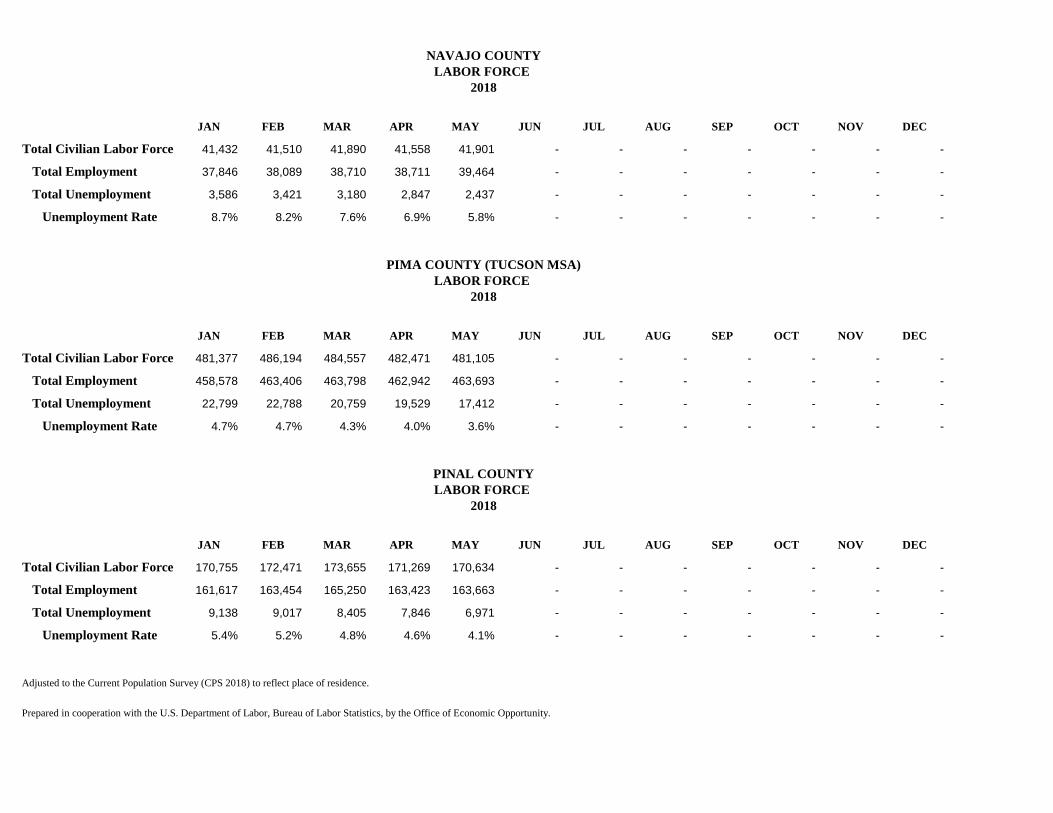
JAN FEB MAR APR MAY JUN JUL AUG SEP OCT NOV DEC
Total Civilian Labor Force 41,432 41,510 41,890 41,558 41,901 - - - - - - -
Total Employment 37,846 38,089 38,710 38,711 39,464 - - - - - - -
Total Unemployment 3,586 3,421 3,180 2,847 2,437 - - - - - - -
Unemployment Rate 8.7% 8.2% 7.6% 6.9% 5.8% - - - - - - -
JAN FEB MAR APR MAY JUN JUL AUG SEP OCT NOV DEC
Total Civilian Labor Force 481,377 486,194 484,557 482,471 481,105 - - - - - - -
Total Employment 458,578 463,406 463,798 462,942 463,693 - - - - - - -
Total Unemployment 22,799 22,788 20,759 19,529 17,412 - - - - - - -
Unemployment Rate 4.7% 4.7% 4.3% 4.0% 3.6% - - - - - - -
JAN FEB MAR APR MAY JUN JUL AUG SEP OCT NOV DEC
Total Civilian Labor Force 170,755 172,471 173,655 171,269 170,634 - - - - - - -
Total Employment 161,617 163,454 165,250 163,423 163,663 - - - - - - -
Total Unemployment 9,138 9,017 8,405 7,846 6,971 - - - - - - -
Unemployment Rate 5.4% 5.2% 4.8% 4.6% 4.1% - - - - - - -
Adjusted to the Current Population Survey (CPS 2018) to reflect place of residence.
Prepared in cooperation with the U.S. Department of Labor, Bureau of Labor Statistics, by the Office of Economic Opportunity.
2018
NAVAJO COUNTY
LABOR FORCE
2018
PIMA COUNTY (TUCSON MSA)
LABOR FORCE
2018
PINAL COUNTY
LABOR FORCE
JAN FEB MAR APR MAY JUN JUL AUG SEP OCT NOV DEC
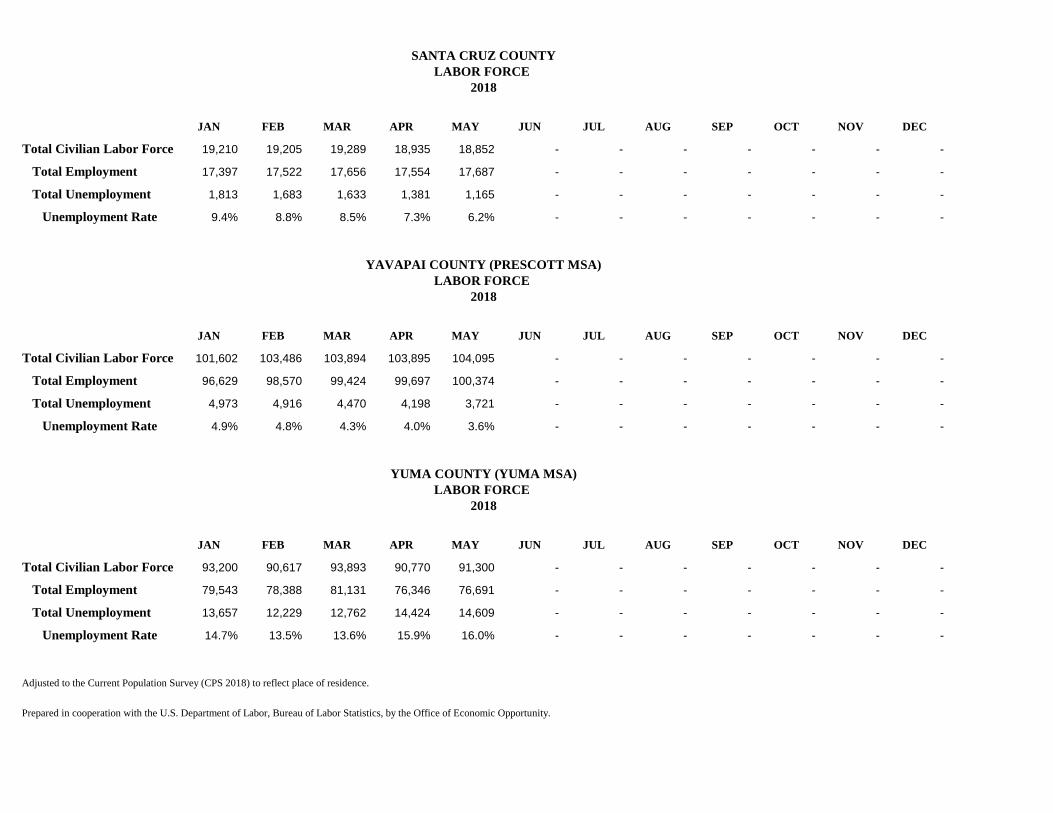
Total Civilian Labor Force 19,210 19,205 19,289 18,935 18,852 - - - - - - -
Total Employment 17,397 17,522 17,656 17,554 17,687 - - - - - - -
Total Unemployment 1,813 1,683 1,633 1,381 1,165 - - - - - - -
Unemployment Rate 9.4% 8.8% 8.5% 7.3% 6.2% - - - - - - -
JAN FEB MAR APR MAY JUN JUL AUG SEP OCT NOV DEC
Total Civilian Labor Force 101,602 103,486 103,894 103,895 104,095 - - - - - - -
Total Employment 96,629 98,570 99,424 99,697 100,374 - - - - - - -
Total Unemployment 4,973 4,916 4,470 4,198 3,721 - - - - - - -
Unemployment Rate 4.9% 4.8% 4.3% 4.0% 3.6% - - - - - - -
JAN FEB MAR APR MAY JUN JUL AUG SEP OCT NOV DEC
Total Civilian Labor Force 93,200 90,617 93,893 90,770 91,300 - - - - - - -
Total Employment 79,543 78,388 81,131 76,346 76,691 - - - - - - -
Total Unemployment 13,657 12,229 12,762 14,424 14,609 - - - - - - -
Unemployment Rate 14.7% 13.5% 13.6% 15.9% 16.0% - - - - - - -
Adjusted to the Current Population Survey (CPS 2018) to reflect place of residence.
Prepared in cooperation with the U.S. Department of Labor, Bureau of Labor Statistics, by the Office of Economic Opportunity.
SANTA CRUZ COUNTY
LABOR FORCE
2018
YAVAPAI COUNTY (PRESCOTT MSA)
LABOR FORCE
2018
YUMA COUNTY (YUMA MSA)
LABOR FORCE
2018
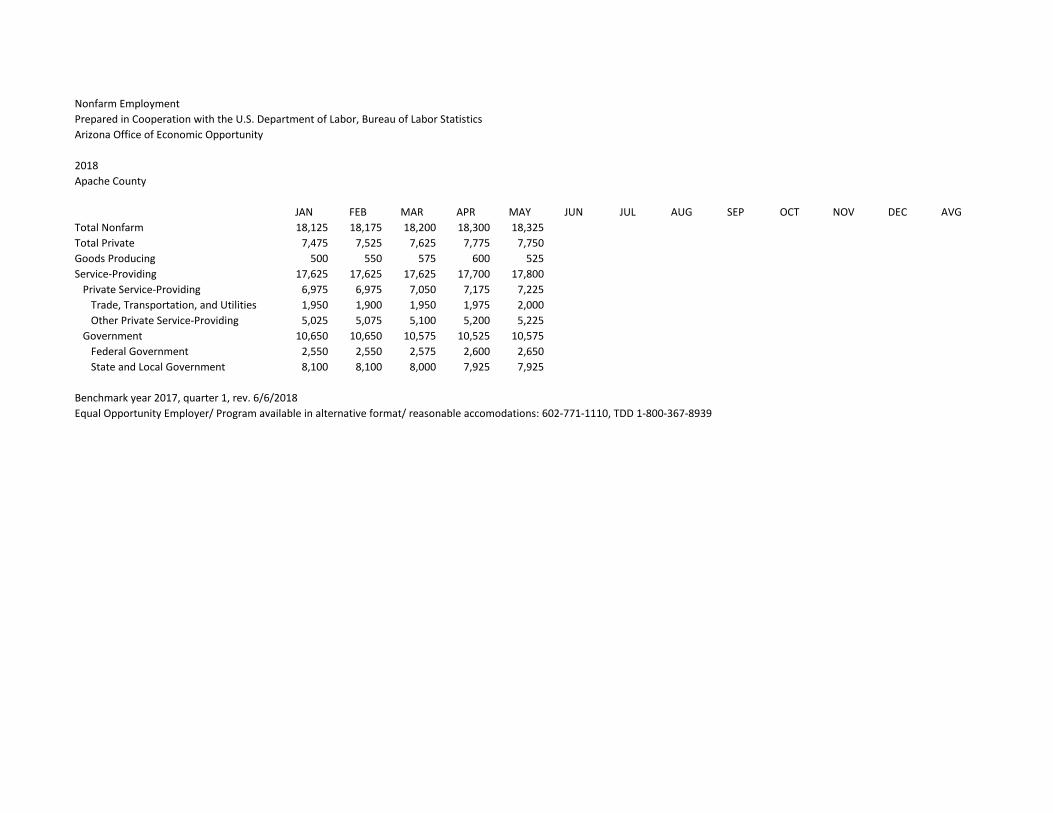
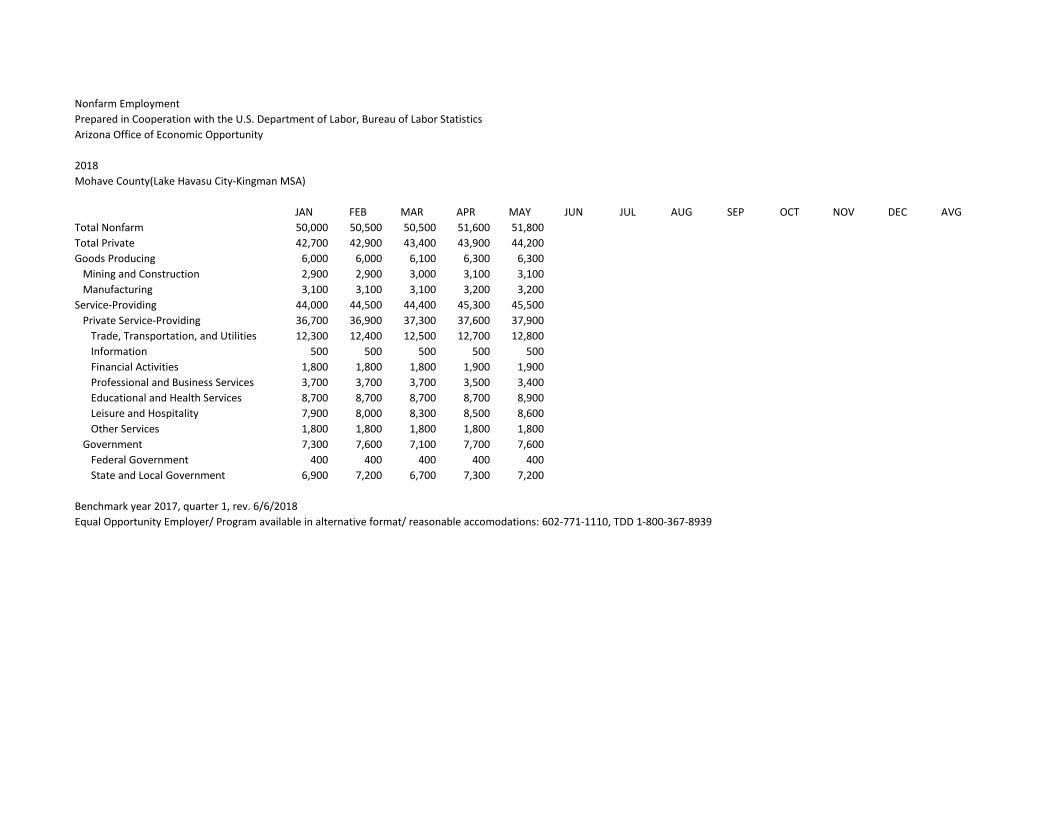
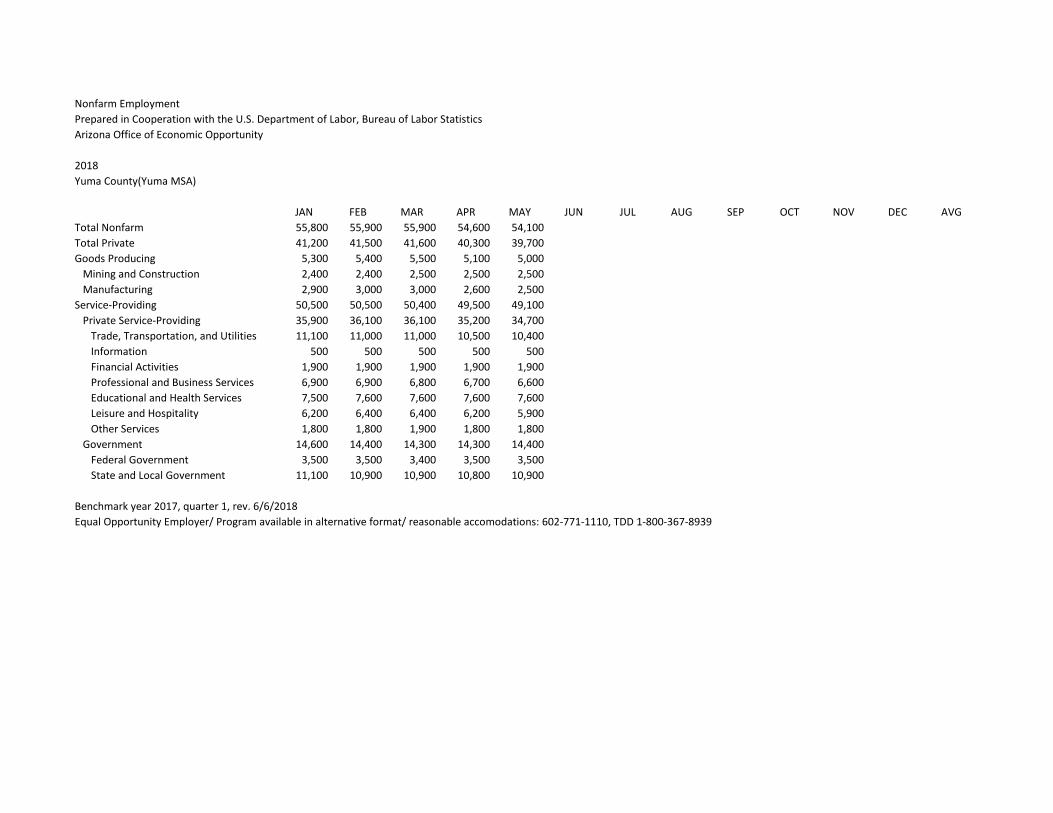
Nonfarm Employment
Prepared in Cooperation with the U.S. Department of Labor, Bureau of Labor Statistics
Arizona Office of Economic Opportunity
2018
Apache County
JAN FEB MAR APR MAY JUN JUL AUG SEP OCT NOV DEC AVG
Total Nonfarm 18,125 18,175 18,200 18,300 18,325
Total Private 7,475 7,525 7,625 7,775 7,750
Goods Producing 500 550 575 600 525
Service-Providing 17,625 17,625 17,625 17,700 17,800
Private Service-Providing 6,975 6,975 7,050 7,175 7,225
Trade, Transportation, and Utilities 1,950 1,900 1,950 1,975 2,000
Other Private Service-Providing 5,025 5,075 5,100 5,200 5,225
Government 10,650 10,650 10,575 10,525 10,575
Federal Government 2,550 2,550 2,575 2,600 2,650
State and Local Government 8,100 8,100 8,000 7,925 7,925
Benchmark year 2017, quarter 1, rev. 6/6/2018
Equal Opportunity Employer/ Program available in alternative format/ reasonable accomodations: 602-771-1110, TDD 1-800-367-8939
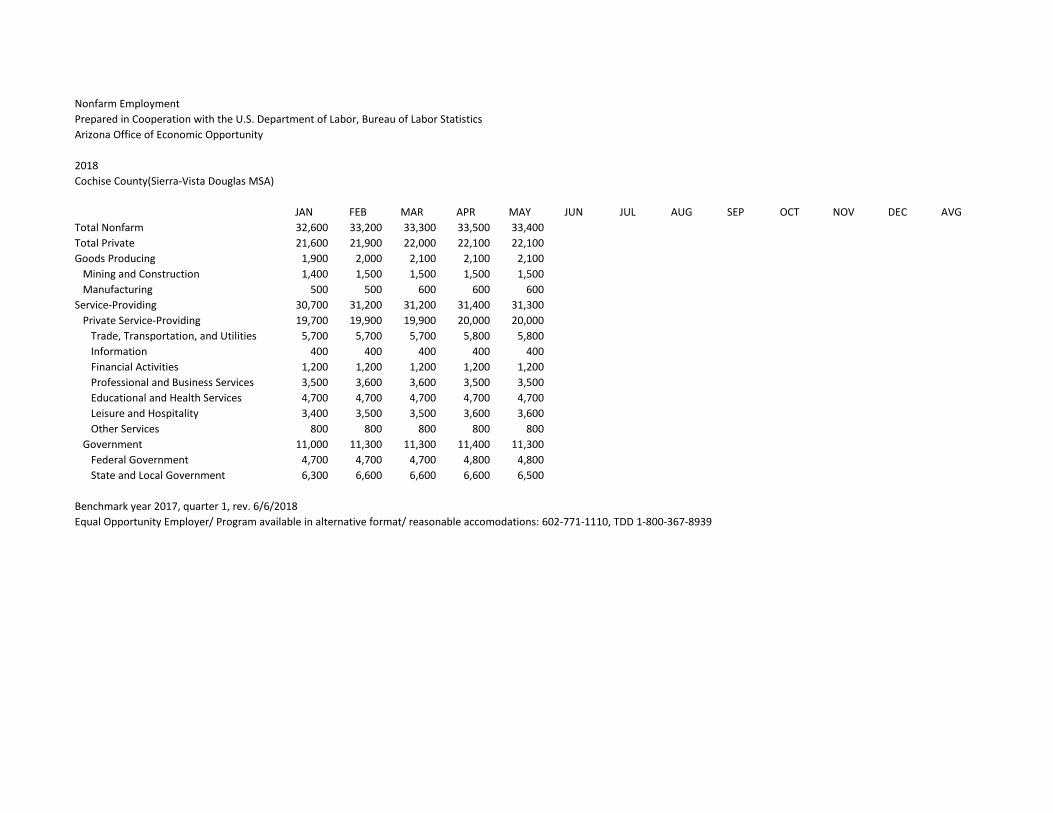
Nonfarm Employment
Prepared in Cooperation with the U.S. Department of Labor, Bureau of Labor Statistics
Arizona Office of Economic Opportunity
2018
Cochise County(Sierra-Vista Douglas MSA)
JAN FEB MAR APR MAY JUN JUL AUG SEP OCT NOV DEC AVG
Total Nonfarm 32,600 33,200 33,300 33,500 33,400
Total Private 21,600 21,900 22,000 22,100 22,100
Goods Producing 1,900 2,000 2,100 2,100 2,100
Mining and Construction 1,400 1,500 1,500 1,500 1,500
Manufacturing 500 500 600 600 600
Service-Providing 30,700 31,200 31,200 31,400 31,300
Private Service-Providing 19,700 19,900 19,900 20,000 20,000
Trade, Transportation, and Utilities 5,700 5,700 5,700 5,800 5,800
Information 400 400 400 400 400
Financial Activities 1,200 1,200 1,200 1,200 1,200
Professional and Business Services 3,500 3,600 3,600 3,500 3,500
Educational and Health Services 4,700 4,700 4,700 4,700 4,700
Leisure and Hospitality 3,400 3,500 3,500 3,600 3,600
Other Services 800 800 800 800 800
Government 11,000 11,300 11,300 11,400 11,300
Federal Government 4,700 4,700 4,700 4,800 4,800
State and Local Government 6,300 6,600 6,600 6,600 6,500
Benchmark year 2017, quarter 1, rev. 6/6/2018
Equal Opportunity Employer/ Program available in alternative format/ reasonable accomodations: 602-771-1110, TDD 1-800-367-8939
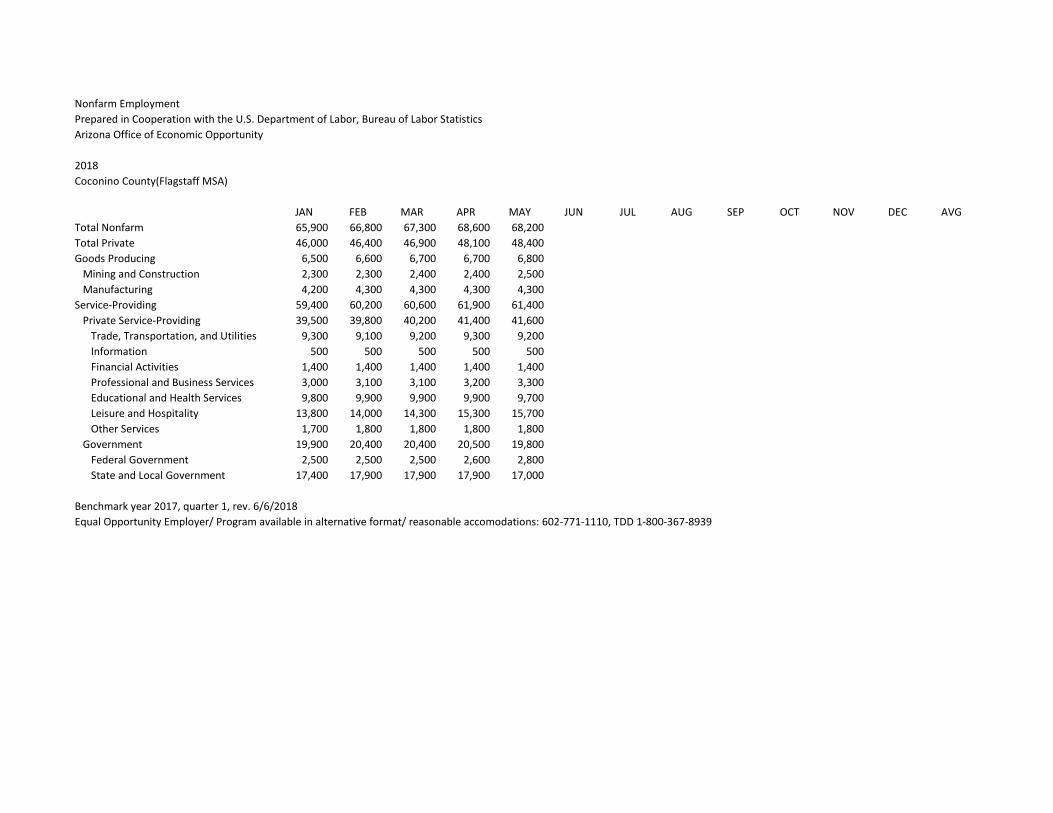
Nonfarm Employment
Prepared in Cooperation with the U.S. Department of Labor, Bureau of Labor Statistics
Arizona Office of Economic Opportunity
2018
Coconino County(Flagstaff MSA)
JAN FEB MAR APR MAY JUN JUL AUG SEP OCT NOV DEC AVG
Total Nonfarm 65,900 66,800 67,300 68,600 68,200
Total Private 46,000 46,400 46,900 48,100 48,400
Goods Producing 6,500 6,600 6,700 6,700 6,800
Mining and Construction 2,300 2,300 2,400 2,400 2,500
Manufacturing 4,200 4,300 4,300 4,300 4,300
Service-Providing 59,400 60,200 60,600 61,900 61,400
Private Service-Providing 39,500 39,800 40,200 41,400 41,600
Trade, Transportation, and Utilities 9,300 9,100 9,200 9,300 9,200
Information 500 500 500 500 500
Financial Activities 1,400 1,400 1,400 1,400 1,400
Professional and Business Services 3,000 3,100 3,100 3,200 3,300
Educational and Health Services 9,800 9,900 9,900 9,900 9,700
Leisure and Hospitality 13,800 14,000 14,300 15,300 15,700
Other Services 1,700 1,800 1,800 1,800 1,800
Government 19,900 20,400 20,400 20,500 19,800
Federal Government 2,500 2,500 2,500 2,600 2,800
State and Local Government 17,400 17,900 17,900 17,900 17,000
Benchmark year 2017, quarter 1, rev. 6/6/2018
Equal Opportunity Employer/ Program available in alternative format/ reasonable accomodations: 602-771-1110, TDD 1-800-367-8939
Nonfarm Employment
Prepared in Cooperation with the U.S. Department of Labor, Bureau of Labor Statistics
Arizona Office of Economic Opportunity
2018
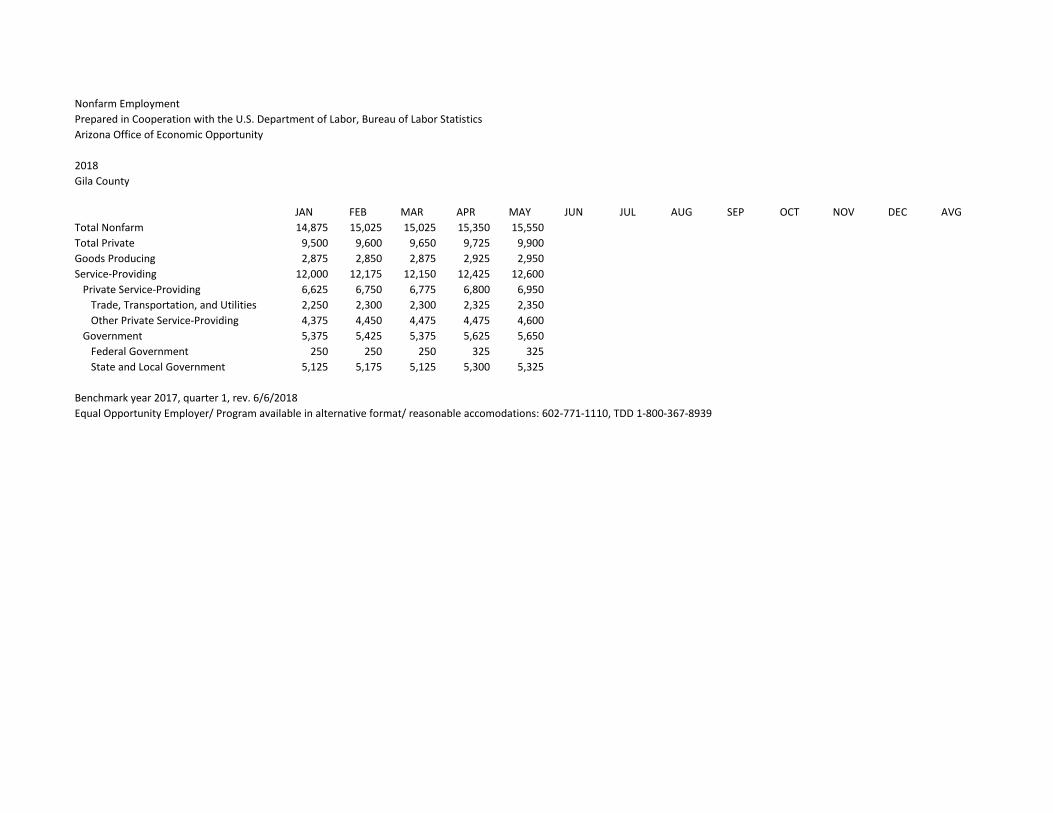
Gila County
JAN FEB MAR APR MAY JUN JUL AUG SEP OCT NOV DEC AVG
Total Nonfarm 14,875 15,025 15,025 15,350 15,550
Total Private 9,500 9,600 9,650 9,725 9,900
Goods Producing 2,875 2,850 2,875 2,925 2,950
Service-Providing 12,000 12,175 12,150 12,425 12,600
Private Service-Providing 6,625 6,750 6,775 6,800 6,950
Trade, Transportation, and Utilities 2,250 2,300 2,300 2,325 2,350
Other Private Service-Providing 4,375 4,450 4,475 4,475 4,600
Government 5,375 5,425 5,375 5,625 5,650
Federal Government 250 250 250 325 325
State and Local Government 5,125 5,175 5,125 5,300 5,325
Benchmark year 2017, quarter 1, rev. 6/6/2018
Equal Opportunity Employer/ Program available in alternative format/ reasonable accomodations: 602-771-1110, TDD 1-800-367-8939
Nonfarm Employment
Prepared in Cooperation with the U.S. Department of Labor, Bureau of Labor Statistics
Arizona Office of Economic Opportunity
2018
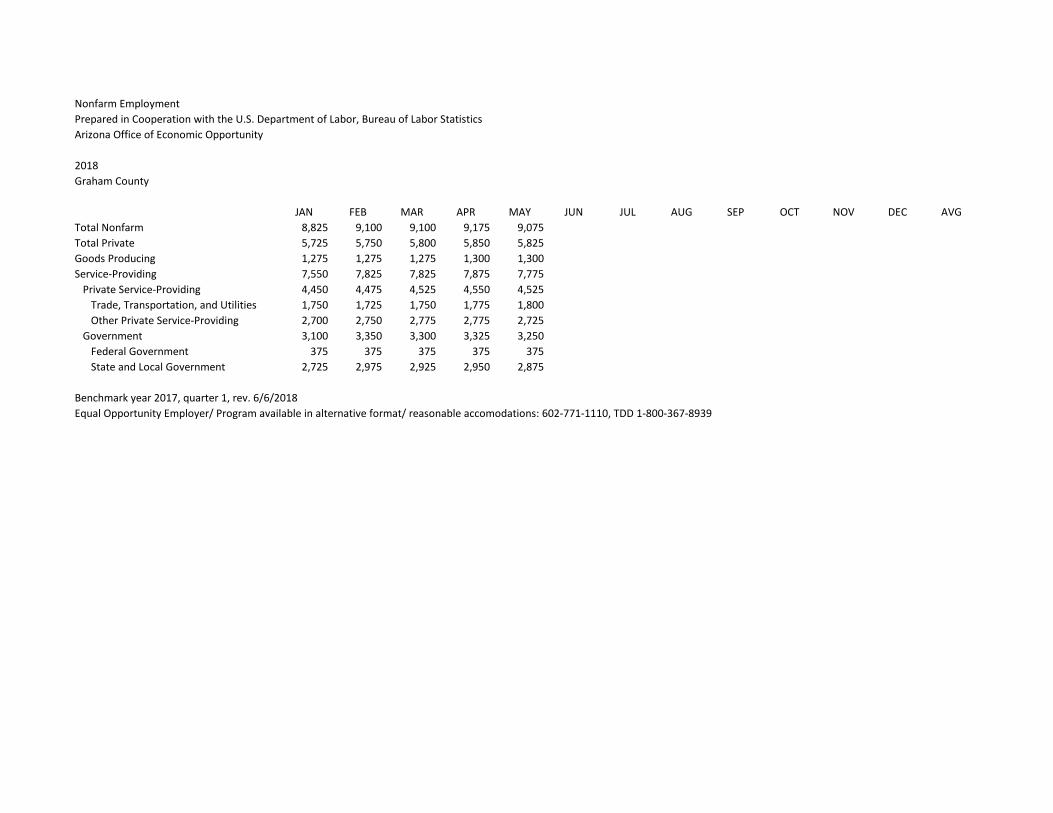
Graham County
JAN FEB MAR APR MAY JUN JUL AUG SEP OCT NOV DEC AVG
Total Nonfarm 8,825 9,100 9,100 9,175 9,075
Total Private 5,725 5,750 5,800 5,850 5,825
Goods Producing 1,275 1,275 1,275 1,300 1,300
Service-Providing 7,550 7,825 7,825 7,875 7,775
Private Service-Providing 4,450 4,475 4,525 4,550 4,525
Trade, Transportation, and Utilities 1,750 1,725 1,750 1,775 1,800
Other Private Service-Providing 2,700 2,750 2,775 2,775 2,725
Government 3,100 3,350 3,300 3,325 3,250
Federal Government 375 375 375 375 375
State and Local Government 2,725 2,975 2,925 2,950 2,875
Benchmark year 2017, quarter 1, rev. 6/6/2018
Equal Opportunity Employer/ Program available in alternative format/ reasonable accomodations: 602-771-1110, TDD 1-800-367-8939
Nonfarm Employment
Prepared in Cooperation with the U.S. Department of Labor, Bureau of Labor Statistics
Arizona Office of Economic Opportunity
2018
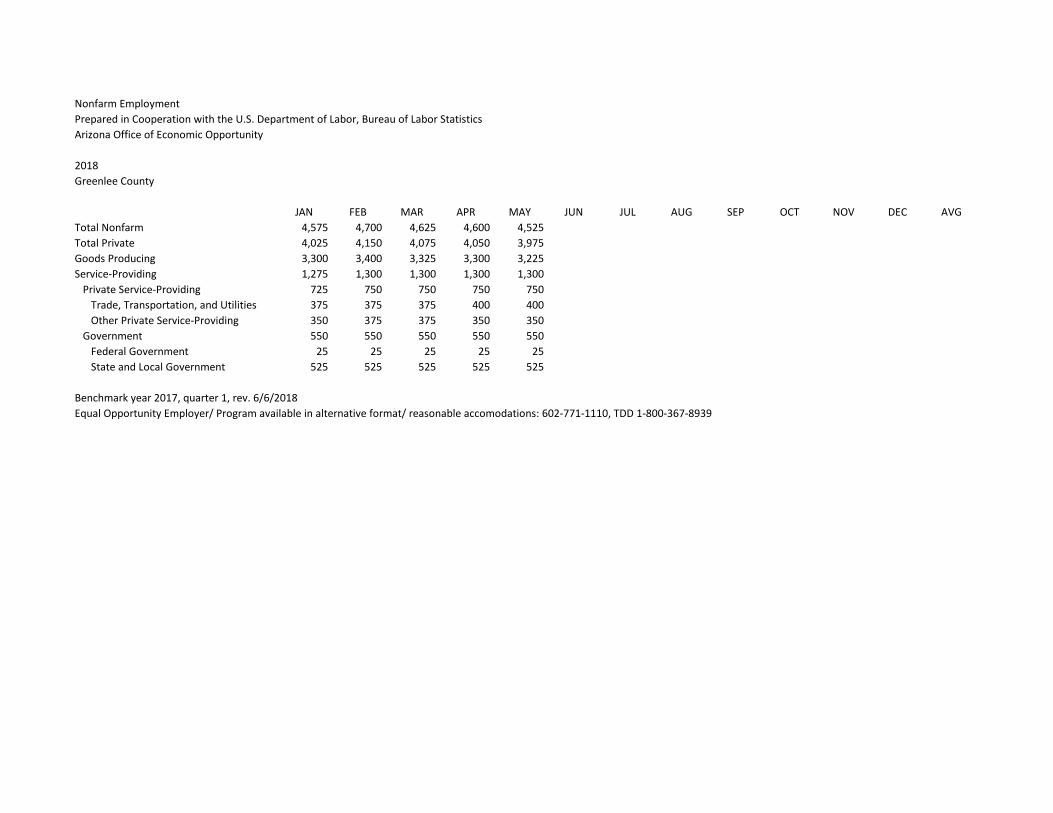
Greenlee County
JAN FEB MAR APR MAY JUN JUL AUG SEP OCT NOV DEC AVG
Total Nonfarm 4,575 4,700 4,625 4,600 4,525
Total Private 4,025 4,150 4,075 4,050 3,975
Goods Producing 3,300 3,400 3,325 3,300 3,225
Service-Providing 1,275 1,300 1,300 1,300 1,300
Private Service-Providing 725 750 750 750 750
Trade, Transportation, and Utilities 375 375 375 400 400
Other Private Service-Providing 350 375 375 350 350
Government 550 550 550 550 550
Federal Government 25 25 25 25 25
State and Local Government 525 525 525 525 525
Benchmark year 2017, quarter 1, rev. 6/6/2018
Equal Opportunity Employer/ Program available in alternative format/ reasonable accomodations: 602-771-1110, TDD 1-800-367-8939

Nonfarm Employment
Prepared in Cooperation with the U.S. Department of Labor, Bureau of Labor Statistics
Arizona Office of Economic Opportunity
2018
La Paz County
JAN FEB MAR APR MAY JUN JUL AUG SEP OCT NOV DEC AVG
Total Nonfarm 5,450 5,500 5,500 5,475 5,450
Total Private 3,300 3,350 3,350 3,325 3,300
Goods Producing 250 275 300 300 300
Service-Providing 5,200 5,225 5,200 5,175 5,150
Private Service-Providing 3,050 3,075 3,050 3,025 3,000
Trade, Transportation, and Utilities 1,400 1,400 1,375 1,375 1,375
Other Private Service-Providing 1,650 1,675 1,675 1,650 1,625
Government 2,150 2,150 2,150 2,150 2,150
Federal Government 325 325 325 325 325
State and Local Government 1,825 1,825 1,825 1,825 1,825
Benchmark year 2017, quarter 1, rev. 6/6/2018
Equal Opportunity Employer/ Program available in alternative format/ reasonable accomodations: 602-771-1110, TDD 1-800-367-8939
Nonfarm Employment
Prepared in Cooperation with the U.S. Department of Labor, Bureau of Labor Statistics
Arizona Office of Economic Opportunity
2018
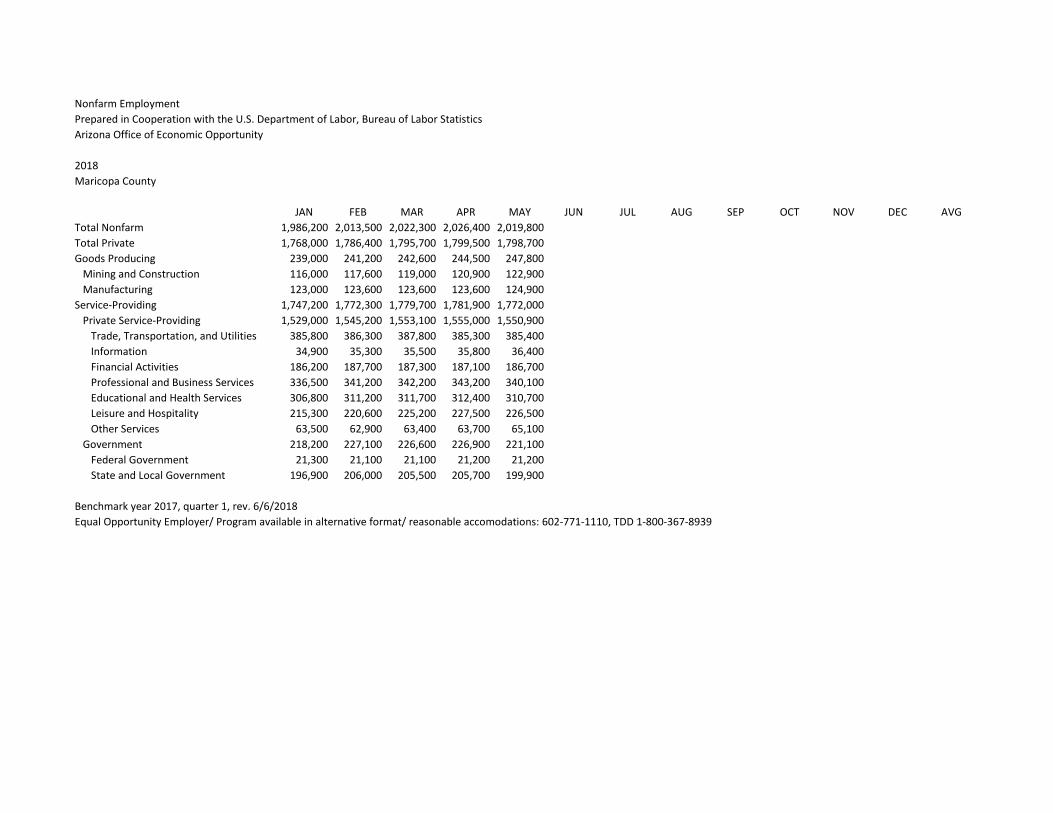
Maricopa County
JAN FEB MAR APR MAY JUN JUL AUG SEP OCT NOV DEC AVG
Total Nonfarm 1,986,200 2,013,500 2,022,300 2,026,400 2,019,800
Total Private 1,768,000 1,786,400 1,795,700 1,799,500 1,798,700
Goods Producing 239,000 241,200 242,600 244,500 247,800
Mining and Construction 116,000 117,600 119,000 120,900 122,900
Manufacturing 123,000 123,600 123,600 123,600 124,900
Service-Providing 1,747,200 1,772,300 1,779,700 1,781,900 1,772,000
Private Service-Providing 1,529,000 1,545,200 1,553,100 1,555,000 1,550,900
Trade, Transportation, and Utilities 385,800 386,300 387,800 385,300 385,400
Information 34,900 35,300 35,500 35,800 36,400
Financial Activities 186,200 187,700 187,300 187,100 186,700
Professional and Business Services 336,500 341,200 342,200 343,200 340,100
Educational and Health Services 306,800 311,200 311,700 312,400 310,700
Leisure and Hospitality 215,300 220,600 225,200 227,500 226,500
Other Services 63,500 62,900 63,400 63,700 65,100
Government 218,200 227,100 226,600 226,900 221,100
Federal Government 21,300 21,100 21,100 21,200 21,200
State and Local Government 196,900 206,000 205,500 205,700 199,900
Benchmark year 2017, quarter 1, rev. 6/6/2018
Equal Opportunity Employer/ Program available in alternative format/ reasonable accomodations: 602-771-1110, TDD 1-800-367-8939
Nonfarm Employment
Prepared in Cooperation with the U.S. Department of Labor, Bureau of Labor Statistics
Arizona Office of Economic Opportunity
2018
Mohave County(Lake Havasu City-Kingman MSA)
JAN FEB MAR APR MAY JUN JUL AUG SEP OCT NOV DEC AVG
Total Nonfarm 50,000 50,500 50,500 51,600 51,800
Total Private 42,700 42,900 43,400 43,900 44,200
Goods Producing 6,000 6,000 6,100 6,300 6,300
Mining and Construction 2,900 2,900 3,000 3,100 3,100
Manufacturing 3,100 3,100 3,100 3,200 3,200
Service-Providing 44,000 44,500 44,400 45,300 45,500
Private Service-Providing 36,700 36,900 37,300 37,600 37,900
Trade, Transportation, and Utilities 12,300 12,400 12,500 12,700 12,800
Information 500 500 500 500 500
Financial Activities 1,800 1,800 1,800 1,900 1,900
Professional and Business Services 3,700 3,700 3,700 3,500 3,400
Educational and Health Services 8,700 8,700 8,700 8,700 8,900
Leisure and Hospitality 7,900 8,000 8,300 8,500 8,600
Other Services 1,800 1,800 1,800 1,800 1,800
Government 7,300 7,600 7,100 7,700 7,600
Federal Government 400 400 400 400 400
State and Local Government 6,900 7,200 6,700 7,300 7,200
Benchmark year 2017, quarter 1, rev. 6/6/2018
Equal Opportunity Employer/ Program available in alternative format/ reasonable accomodations: 602-771-1110, TDD 1-800-367-8939
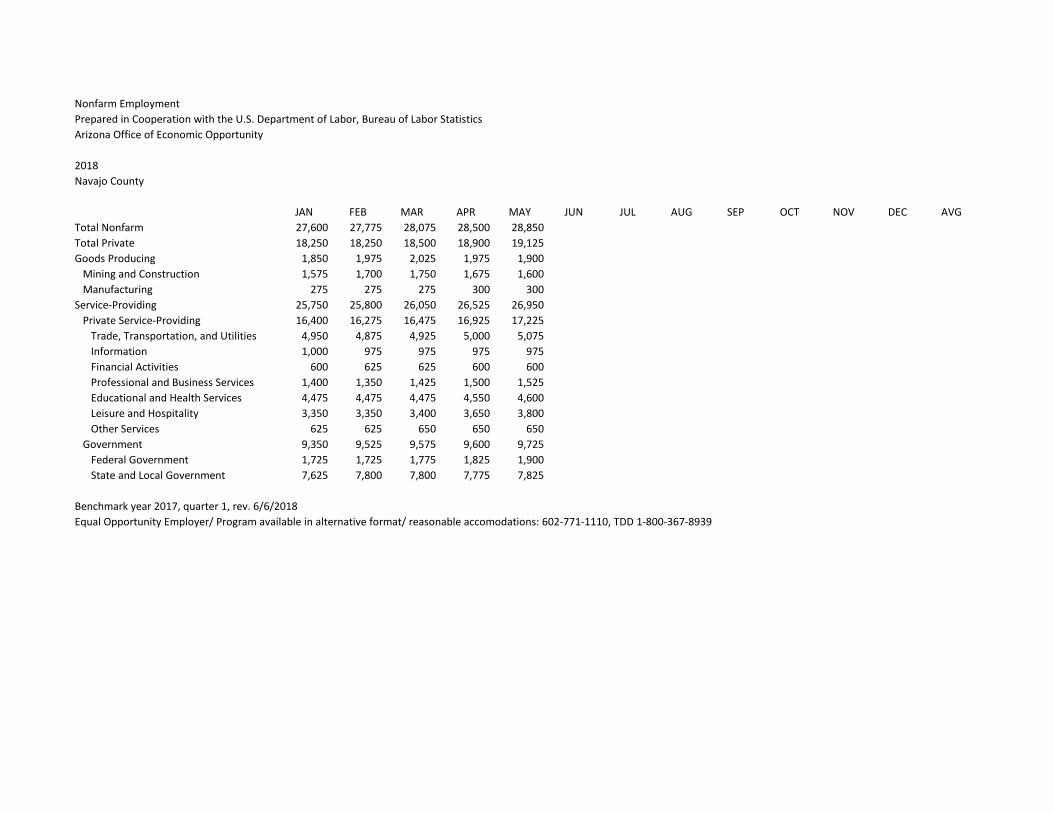
Nonfarm Employment
Prepared in Cooperation with the U.S. Department of Labor, Bureau of Labor Statistics
Arizona Office of Economic Opportunity
2018
Navajo County
JAN FEB MAR APR MAY JUN JUL AUG SEP OCT NOV DEC AVG
Total Nonfarm 27,600 27,775 28,075 28,500 28,850
Total Private 18,250 18,250 18,500 18,900 19,125
Goods Producing 1,850 1,975 2,025 1,975 1,900
Mining and Construction 1,575 1,700 1,750 1,675 1,600
Manufacturing 275 275 275 300 300
Service-Providing 25,750 25,800 26,050 26,525 26,950
Private Service-Providing 16,400 16,275 16,475 16,925 17,225
Trade, Transportation, and Utilities 4,950 4,875 4,925 5,000 5,075
Information 1,000 975 975 975 975
Financial Activities 600 625 625 600 600
Professional and Business Services 1,400 1,350 1,425 1,500 1,525
Educational and Health Services 4,475 4,475 4,475 4,550 4,600
Leisure and Hospitality 3,350 3,350 3,400 3,650 3,800
Other Services 625 625 650 650 650
Government 9,350 9,525 9,575 9,600 9,725
Federal Government 1,725 1,725 1,775 1,825 1,900
State and Local Government 7,625 7,800 7,800 7,775 7,825
Benchmark year 2017, quarter 1, rev. 6/6/2018
Equal Opportunity Employer/ Program available in alternative format/ reasonable accomodations: 602-771-1110, TDD 1-800-367-8939

Nonfarm Employment
Prepared in Cooperation with the U.S. Department of Labor, Bureau of Labor Statistics
Arizona Office of Economic Opportunity
2018
Pima County(Tucson MSA)
JAN FEB MAR APR MAY JUN JUL AUG SEP OCT NOV DEC AVG
Total Nonfarm 380,600 383,000 383,800 384,700 383,400
Total Private 302,400 302,600 303,600 304,500 304,700
Goods Producing 42,100 42,500 42,400 42,900 42,600
Mining and Construction 17,900 18,100 18,200 18,400 18,200
Manufacturing 24,200 24,400 24,200 24,500 24,400
Service-Providing 338,500 340,500 341,400 341,800 340,800
Private Service-Providing 260,300 260,100 261,200 261,600 262,100
Trade, Transportation, and Utilities 60,900 60,500 61,100 61,000 61,800
Information 5,300 5,400 5,300 5,400 5,400
Financial Activities 17,600 17,800 17,800 17,700 17,600
Professional and Business Services 51,800 52,300 52,200 52,300 52,700
Educational and Health Services 66,400 66,200 66,300 66,600 66,300
Leisure and Hospitality 45,500 44,900 45,400 45,600 45,100
Other Services 12,800 13,000 13,100 13,000 13,200
Government 78,200 80,400 80,200 80,200 78,700
Federal Government 12,600 12,600 12,600 12,600 12,600
State and Local Government 65,600 67,800 67,600 67,600 66,100
Benchmark year 2017, quarter 1, rev. 6/6/2018
Equal Opportunity Employer/ Program available in alternative format/ reasonable accomodations: 602-771-1110, TDD 1-800-367-8939
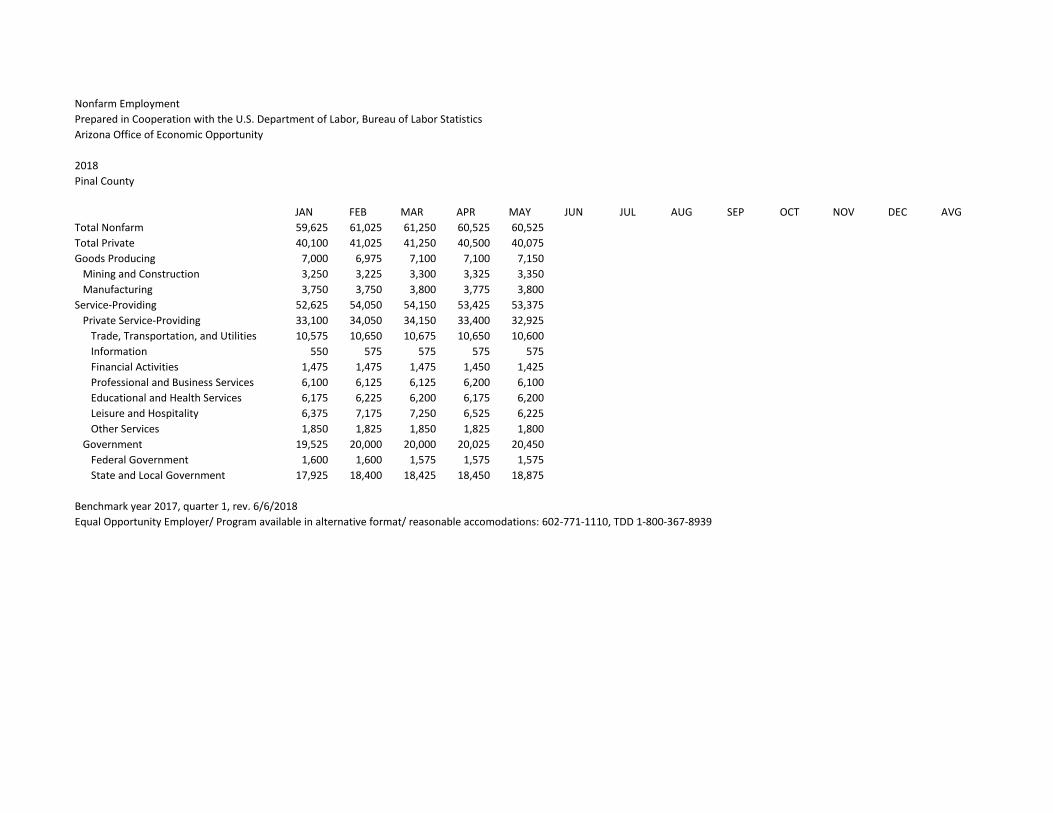
Nonfarm Employment
Prepared in Cooperation with the U.S. Department of Labor, Bureau of Labor Statistics
Arizona Office of Economic Opportunity
2018
Pinal County
JAN FEB MAR APR MAY JUN JUL AUG SEP OCT NOV DEC AVG
Total Nonfarm 59,625 61,025 61,250 60,525 60,525
Total Private 40,100 41,025 41,250 40,500 40,075
Goods Producing 7,000 6,975 7,100 7,100 7,150
Mining and Construction 3,250 3,225 3,300 3,325 3,350
Manufacturing 3,750 3,750 3,800 3,775 3,800
Service-Providing 52,625 54,050 54,150 53,425 53,375
Private Service-Providing 33,100 34,050 34,150 33,400 32,925
Trade, Transportation, and Utilities 10,575 10,650 10,675 10,650 10,600
Information 550 575 575 575 575
Financial Activities 1,475 1,475 1,475 1,450 1,425
Professional and Business Services 6,100 6,125 6,125 6,200 6,100
Educational and Health Services 6,175 6,225 6,200 6,175 6,200
Leisure and Hospitality 6,375 7,175 7,250 6,525 6,225
Other Services 1,850 1,825 1,850 1,825 1,800
Government 19,525 20,000 20,000 20,025 20,450
Federal Government 1,600 1,600 1,575 1,575 1,575
State and Local Government 17,925 18,400 18,425 18,450 18,875
Benchmark year 2017, quarter 1, rev. 6/6/2018
Equal Opportunity Employer/ Program available in alternative format/ reasonable accomodations: 602-771-1110, TDD 1-800-367-8939

Nonfarm Employment
Prepared in Cooperation with the U.S. Department of Labor, Bureau of Labor Statistics
Arizona Office of Economic Opportunity
2018
Santa Cruz County
JAN FEB MAR APR MAY JUN JUL AUG SEP OCT NOV DEC AVG
Total Nonfarm 13,050 13,075 13,125 13,175 13,150
Total Private 9,375 9,375 9,425 9,475 9,475
Goods Producing 750 750 775 750 725
Service-Providing 12,300 12,325 12,350 12,425 12,425
Private Service-Providing 8,625 8,625 8,650 8,725 8,750
Trade, Transportation, and Utilities 5,675 5,650 5,650 5,675 5,725
Other Private Service-Providing 2,950 2,975 3,000 3,050 3,025
Government 3,675 3,700 3,700 3,700 3,675
Federal Government 1,550 1,550 1,550 1,550 1,525
State and Local Government 2,125 2,150 2,150 2,150 2,150
Benchmark year 2017, quarter 1, rev. 6/6/2018
Equal Opportunity Employer/ Program available in alternative format/ reasonable accomodations: 602-771-1110, TDD 1-800-367-8939
Nonfarm Employment
Prepared in Cooperation with the U.S. Department of Labor, Bureau of Labor Statistics
Arizona Office of Economic Opportunity
2018
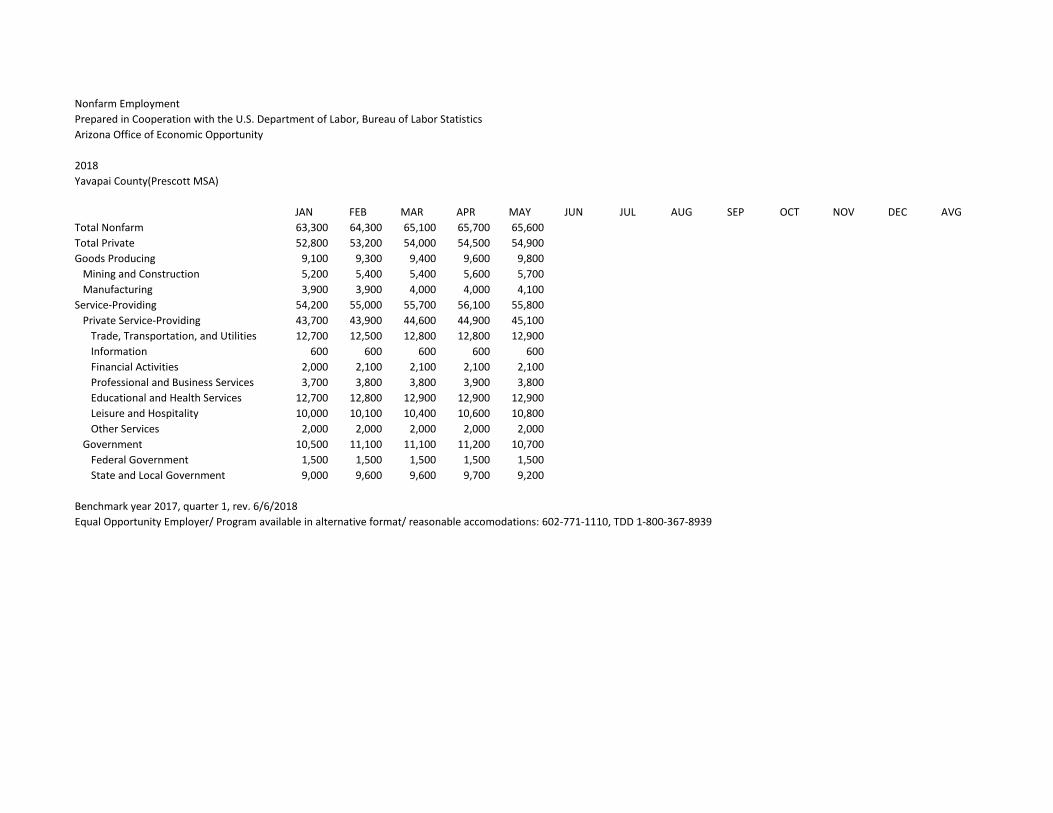
Yavapai County(Prescott MSA)
JAN FEB MAR APR MAY JUN JUL AUG SEP OCT NOV DEC AVG
Total Nonfarm 63,300 64,300 65,100 65,700 65,600
Total Private 52,800 53,200 54,000 54,500 54,900
Goods Producing 9,100 9,300 9,400 9,600 9,800
Mining and Construction 5,200 5,400 5,400 5,600 5,700
Manufacturing 3,900 3,900 4,000 4,000 4,100
Service-Providing 54,200 55,000 55,700 56,100 55,800
Private Service-Providing 43,700 43,900 44,600 44,900 45,100
Trade, Transportation, and Utilities 12,700 12,500 12,800 12,800 12,900
Information 600 600 600 600 600
Financial Activities 2,000 2,100 2,100 2,100 2,100
Professional and Business Services 3,700 3,800 3,800 3,900 3,800
Educational and Health Services 12,700 12,800 12,900 12,900 12,900
Leisure and Hospitality 10,000 10,100 10,400 10,600 10,800
Other Services 2,000 2,000 2,000 2,000 2,000
Government 10,500 11,100 11,100 11,200 10,700
Federal Government 1,500 1,500 1,500 1,500 1,500
State and Local Government 9,000 9,600 9,600 9,700 9,200
Benchmark year 2017, quarter 1, rev. 6/6/2018
Equal Opportunity Employer/ Program available in alternative format/ reasonable accomodations: 602-771-1110, TDD 1-800-367-8939
Nonfarm Employment
Prepared in Cooperation with the U.S. Department of Labor, Bureau of Labor Statistics
Arizona Office of Economic Opportunity
2018
Yuma County(Yuma MSA)
JAN FEB MAR APR MAY JUN JUL AUG SEP OCT NOV DEC AVG
Total Nonfarm 55,800 55,900 55,900 54,600 54,100
Total Private 41,200 41,500 41,600 40,300 39,700
Goods Producing 5,300 5,400 5,500 5,100 5,000
Mining and Construction 2,400 2,400 2,500 2,500 2,500
Manufacturing 2,900 3,000 3,000 2,600 2,500
Service-Providing 50,500 50,500 50,400 49,500 49,100
Private Service-Providing 35,900 36,100 36,100 35,200 34,700
Trade, Transportation, and Utilities 11,100 11,000 11,000 10,500 10,400
Information 500 500 500 500 500
Financial Activities 1,900 1,900 1,900 1,900 1,900
Professional and Business Services 6,900 6,900 6,800 6,700 6,600
Educational and Health Services 7,500 7,600 7,600 7,600 7,600
Leisure and Hospitality 6,200 6,400 6,400 6,200 5,900
Other Services 1,800 1,800 1,900 1,800 1,800
Government 14,600 14,400 14,300 14,300 14,400
Federal Government 3,500 3,500 3,400 3,500 3,500
State and Local Government 11,100 10,900 10,900 10,800 10,900
Benchmark year 2017, quarter 1, rev. 6/6/2018
Equal Opportunity Employer/ Program available in alternative format/ reasonable accomodations: 602-771-1110, TDD 1-800-367-8939
— Equal Opportunity Employer/Program —
Under Titles VI and VII of the Civil Rights Act of 1964 (Title VI & VII), and the Americans with Disabilities
Act of 1990 (ADA), Section 504 of the Rehabilitation Act of 1973, and the Age Discrimination Act of 1975,
the Department prohibits discrimination in admissions, programs, services, activities, or employment based
on race, color, religion, sex, national origin, age, and disability. The Department must make a reasonable
accommodation to allow a person with a disability to take part in a program, service or activity. For
example, this means if necessary, the Department must provide sign language interpreters for people who
are deaf, a wheelchair accessible location, or enlarged print materials. It also means that the Department
will take any other reasonable action that allows you to take part in and understand a program or activity,
including making reasonable changes to an activity. If you believe that you will not be able to understand or
take part in a program or activity because of your disability, please let us know of your disability needs in
advance if at all possible. To request this document in alternative format or for further information about
this policy, contact the Department of Economic Security, Division of Developmental Disabilities ADA
Coordinator at 602 542-6825 ; TTY/TDD Services: 7-1-1.
About This Publication
Arizona’s Workforce is published 14 times a year by the State of Arizona Office of Economic
Opportunity (OEO) — 12 times as the monthly Employment Report and twice a year as a two-year
Forecast Report. OEO is the state agency responsible for labor market information and
demographic data for the state of Arizona.
Material published in Arizona’s Workforce is in the public domain and can be reproduced without
further permission. Appropriate citations are requested.
Next Release:
June Employment Report, Thursday, July 19th, 2018, 10:00 am
Location: AZ Dept. of Administration, 100 N. 15th Ave, Suite 103, Phoenix, AZ
Office of Economic Opportunity
Sandra Watson Interim Director
Frank Curtis Director of Labor Statistics
On the web: https://laborstats.az.gov/
Phone: 602-771-2222
To be placed on the Arizona Workforce email distribution list, or to send feedback or questions,
contact:

This page left intentionally blank.