Embed Size (px)
Citation preview
About the interactive influence of culture and regulatorybarriers on entrepreneurial activity
José Fernández-Serrano & Isidoro Romero
# Springer Science+Business Media New York 2014
Abstract In this paper cultural values and regulatory barriers to start-up are presentedas characteristics of the business environment which influence the international differ-ences in the level of entrepreneurial activity. A first objective of this paper is to measurethe importance of a country’s cultural values in determining the national level ofentrepreneurial activity, calculated by the Total Entrepreneurial Activity rate from theGlobal Entrepreneurship Monitor. Culture is studied using Schwartz’s value structure(Schwartz 1994). This allows for the differentiating of seven cultural orientations thatare then arranged around three bipolar dimensions: Autonomy- Embeddedness,Egalitarianism-Hierarchy and Harmony-Mastery. The paper also studies the effect ofregulatory barriers for business start-ups on the Total Entrepreneurial Activity indifferent countries. Regulatory barriers are determined using data from the “DoingBusiness” project of the World Bank. The role of cultural values and regulatory barriersin entrepreneurial activity is tested using data from 56 countries and Structural EquationModeling. The paper shows that cultural values and regulatory barriers are not relatedto entrepreneurship in the same way in countries with differing levels of development.On the contrary, the strength and nature of the influence of both factors on entrepre-neurial activity depends on a country’s per capita GDP. Furthermore, the impact ofregulatory barriers on entrepreneurship is moderated by cultural values. Thus, thediscouraging effect of the regulatory barriers on entrepreneurial activity is moreimportant in those countries with a societal culture characterized by autonomy, egali-tarianism and harmony values.
Keywords Entrepreneurship . Cultural values . Regulatory barriers . Economicdevelopment
JEL Classifications A13 . L26 . L53 . R11
Int Entrep Manag JDOI 10.1007/s11365-014-0296-5
J. Fernández-Serrano (*) : I. RomeroDepartment of Applied Economics, Faculty of Economics and Business Sciences, University of Seville,Av. Ramón y Cajal, 1, Seville, Spain 41018e-mail: [email protected]
I. Romeroe-mail: [email protected]
Introduction
In the last decades entrepreneurs have been receiving increasing attention from policy-makers and the academic community and there is a growing interest in understandingwhich factors determine the level of entrepreneurship in an economic area. Three mainapproaches can be adopted in the study of entrepreneurial activity and its determinants:the psychological, the economic and the sociological or institutional approach. Amongthem, the sociological or institutional approach is defined by stressing the importanceof the environment in the decision to create a company (Álvarez et al. 2011). Hence thecharacteristics of the business environment have been considered as a crucial factor forentrepreneurship and SMEs (Hallberg 2000; Schiffer and Weder 2001; Kaufmann et al.2002; World Bank 2004; Romero 2006; Ardagna and Lusardi 2010; Fernández-Serranoand Romero 2012). A business environment that is favorable to entrepreneurship canfacilitate firm creation and development, whereas an unfavorable business environmentcould hamper them.
The expression “business environment” encompasses a set of socio-economic andinstitutional elements, external to businesses, that conditions their activity, affectingtheir cost and incomes and, consequently, influencing their profitability. Among otheraspects, socio-political conditions, macroeconomic conditions (fluctuations, inflationrate, exchange rate stability, etc.), regulatory conditions (business freedom, povertyrights and contract enforcement, free trade, administrative procedures to start-up, taxregulation, and so on), the provision of public goods and services (infrastructures,education, R&D, public support services for businesses, and so forth) and also thesocio-cultural conditions are relevant elements shaping the business environment. Thispaper focuses on two specific aspects of the business environment: the regulatoryconditions –and more specifically the regulations directly affecting business creation-and the predominant cultural values in the society.
On the one hand, regulatory conditions for business creation have a direct influenceon entrepreneurial activity. Higher start-up costs associated with administrative proce-dures might discourage potential entrepreneurs. Consequently, countries with higherregulatory barriers should exhibit lower start-up rates. However, this paper shows thatthe issue is more complex than this simple deduction and other factors moderate thisrelationship between regulatory barriers and entrepreneurial activity. Particularly, theimpact of regulatory barriers is not the same in countries with different levels ofdevelopment and different cultural values.
On the other hand, a number of contributions have already pointed out that thesocietal value structure that shapes a culture may play a significant role in determiningthe entrepreneurial activity of its members (Davidsson and Wiklund 1997; Frederking2004; Davidsson 1995). However, up until now, research on culture and entrepreneur-ship has been limited. It has mainly focused on the individualism-collectivism contin-uum as explaining entrepreneurial activity (Morris et al. 1994; Tiessen 1997; Pinillosand Reyes 2011). Results from these studies have normally led to the conclusion thatindividualistic values favor entrepreneurial activity (Thomas and Mueller 2000). Butculture is a multidimensional phenomenon (Hofstede 2003; Schwartz 1999). Therefore,this value-dimension alone may not reflect the complex influence of culture onentrepreneurship. Other authors have considered alternative cultural variables, such asuncertainty avoidance (Wennekers et al. 2007). Attempts at analyzing several of these
Int Entrep Manag J
dimensions together are still rare. One exception is Mueller and Thomas (2001), whojointly analyzed the role of individualism and uncertainty avoidance, or Shane (1993),who analyzed the effect of four cultural variables on innovation.
The vast majority of this research has been based on Hofstede’s (1980, 1991, 2003)classification of cultural values. Yet concerns have been raised regarding its method-ological strength (Jabri 2005; Tang and Koveos 2008). At the same time, alternativeclassifications have emerged. In particular, Schwartz (1992) defines the personal valuestructure as being made up of ten basic universal values. Shared individual values formthe basis of a society’s cultural values (Schwartz et al. 2001). Overall, there is a clearlack of comprehensive research on the effect of cultural values on entrepreneurshipusing up-to-date multidimensional measures.
This paper aims to fill this gap in the literature by assessing the specific effect ofcultural dimensions on entrepreneurship using Schwartz’s value classification. It alsoinvestigates the link between regulatory barriers to start-up and entrepreneurial activityat country level in economies with different levels of development. The paper as wellmakes a contribution by showing that the effect of the regulatory barriers to start-up onentrepreneurship rates is conditioned by the cultural values predominating in a society.This interaction, which has not been previously considered in the literature, should betaken into consideration when designing interventions whose purpose is to improve thebusiness environment in order to foster entrepreneurship.
This paper is organized as follows: after this introduction, the next section outlinesthe relevant theory and the hypotheses derived from it. The following section describesthe Empirical analysis and discusses its results. The paper ends by presenting someconclusions and policy implications.
Theory and hypotheses
In this section, the effect of regulatory barriers on the start-up of entrepreneurial activitywill firstly be addressed. This influence might differ between countries with differentlevels of development. In this respect, this section will also discuss the relationshipbetween entrepreneurship and economic development. Next, the role of culture and itsrelationship with economic development and entrepreneurship are studied.
Economic development, entrepreneurship and regulatory barriers to start-up
Entrepreneurship plays a very important role in the process of national and regionaleconomic development. It increases employment opportunities, enhances technicalinnovation, and promotes economic growth (OECD 1998; Reynolds et al. 2002; vanStel and Storey 2004; Fritsch and Mueller 2004). From a dynamic perspective,entrepreneurs are agents of change since entrepreneurship implies starting new busi-nesses, experimenting with new techniques and a new organization of production,introducing new products or even creating new markets (Wennekers et al. 2002).
Minniti et al. (2006) and Lee and Peterson (2000) found the income level to have aneffect on the stage of entrepreneurial activity. In particular, the rate of growth in incomehas been found to have an influence on entrepreneurship rates (Armington and Acs2002; Lee et al. 2004). Similarly, when income is measured as per capita GDP, the
Int Entrep Manag J
effect on entrepreneurship is positive as well (Parker and Robson 2004; Fishman andSarria-Allende 2004). The level of economic development might induce new firmformation since the environmental opportunities and expected rewards of starting abusiness are higher (Reynolds et al. 1994; Carree et al. 2002). In this sense, there isevidence that the average level of income and wealth determines the variety ofconsumer demand increasing the opportunities for the entrepreneurs. A high differen-tiation in demand favors the suppliers of new and specialized products and diminishesthe scale advantages of large incumbent firms (Wennekers et al. 2002; Jovanovic 1993).
However, development is accompanied by raising real wages. This in turn increasesthe opportunity costs for self-employment, and so a high per capita GDP could reduceentrepreneurial activity (Noorderhaven et al. 2004; Bjornskov and Foss 2008).Moreover, some authors (Carree et al. 2002; van Stel et al. 2005) have found asignificant positive effect of the square of per capita GDP, suggesting a U-shapedimpact of this income variable on entrepreneurship. Therefore, only after a certain levelof per capita GDP—which has been set by some authors around US$ 7000 (Pinillosand Reyes 2011)—does increased income lead to higher start-up rates.
According to the Global Entrepreneurship Monitor (GEM) reports, the contributionof entrepreneurs to an economy varies according to its phase of economic development(Wennekers et al. 2005; Gries and Naude 2008). The revised GEM model introduced amore nuanced distinction between phases of economic development, in line withPorter’s typology (Porter et al. 2002). Thus, the motivations to start businesses differvastly across countries: entrepreneurs in factor-driven economies tend to be equallydriven by necessity and improvement-driven opportunity (IDO) motives (Hessels et al.2008). When there are higher economic development levels, necessity gradually fallsoff as a motivator, while IDO motives increase. Necessity motives can be impacted byeconomic conditions, while IDO motives may be less dependent on the economicenvironment and of a more intrinsic nature, as the individual opts for pursuing anopportunity that is believed to increase income and/or independence. The GEM’sresults confirm the presence of an overall negative linear relationship between theincome level and Total Entrepreneurial Activity (TEA) when countries of differentlevels of development are compared (Reynolds et al. 2002; Kelley et al. 2012).
Based on these findings, we formulate the following hypothesis:
Hypothesis 1: A negative relationship between GDP per capita and entrepreneurshipexists: low-income countries exhibit higher entrepreneurship rates thanhigh-income countries.
On the order hand, regulatory barriers to business creation are related to the cost andefficiency of regulatory processes for starting a business. These include the number andcomplexity of compulsory administrative procedures, the time and cost derived fromthem or the paid-in minimum capital required for a limited liability company to start upand formally operate, among other issues. In this respect, higher entry costs have beenobserved to deter firm creation (Fonseca et al. 2001; Bertrand and Kramarz 2002;Klapper et al. 2006). Dreher and Gassebner (2013) have particularly found that moreprocedures being required to start a business and larger minimum capital requirementsare detrimental to entrepreneurship, whereas the days and the costs to start up abusiness are not robust determinants of entrepreneurial activity. Therefore,
Int Entrep Manag J
improvements in business regulations should favor a greater new business registrationand many countries in the world have been introducing reforms in the last decades inorder to reduce start-up costs (World Bank 2012; Djankov 2009).1
Interestingly, the effect of regulatory barriers could be different depending on theentrepreneurs’ type of motivation. Ho and Wong (2007) have shown that high regula-tory entry costs deter opportunity-driven entrepreneurship, but have no impact onnecessity entrepreneurship. Ardagna and Lusardi (2010) have also pointed out thatthe negative effects of regulations are particularly relevant for those individuals whobecome entrepreneurs to pursue a business opportunity.
Moreover, high start-up costs might have other effects on the economy. They canincrease the fraction of the population who become workers (Fonseca et al. 2001),reduce output per worker–as a result of lowering total factor productivity—(Barseghyan 2008) or force new entrants to be larger and cause incumbent firms innaturally high-entry industries to grow more slowly (Klapper et al. 2006). Furthermore,Djankov et al. (2002) have pointed out that countries with stronger entry regulationsalso have more corruption and larger unofficial economies, but not a better quality ofpublic or private goods.
A relationship can be observed between regulatory barriers for business activity andeconomic development. Throughout the development process, countries achieve grad-ual improvements in the quality of their institutions. As a result, highly-developedeconomies in general have more business-friendly regulatory environments than de-veloping economies (World Bank 2012). On the contrary, developing countries usuallylack efficient institutions which could facilitate the functioning of markets and theprocess of business creation.
However, in developing nations the potential negative effect of these institutionaldeficiencies on entrepreneurship might be compensated for by the importance of theinformal economy. In developing economies, entrepreneurs and companies oftenignore the regulation and administrative requirements or deliberately avoid compli-ance—by not registering for social security, for example. Therefore, where regulation isparticularly onerous, levels of informality tend to be higher (Ayyagari et al. 2007;Schneider et al. 2010). Due to this escape towards informality, bad regulations mightnot necessarily have an observable negative effect on start-up rates when comparingcountries with different levels of development. However, informality is associated withimportant social costs and also with relevant constraints for firm development. Thus,compared to their formal sector counterparts, firms in the informal sector typically growmore slowly (World Bank 2012).
In this respect, we formulate the following hypotheses:
Hypothesis 2: A negative relationship between GDP per capita and regulatory bar-riers exists: Low-income countries exhibit higher regulatory barriersthan high-income countries.
Hypothesis 3: A negative relationship between regulatory barriers and entrepreneurialactivity exists: Regulatory barriers to start-up have a negative effect onentrepreneurial activity.
1 For a survey of the literature about regulation of entry and its effects see Djankov (2009).
Int Entrep Manag J
Hypothesis 4: The relationship between regulatory barriers and entrepreneurial activ-ity is moderated by the national income level: the negative influence ofregulatory barriers for starting a business on the rates of entrepreneurialactivity is greater in countries with a higher GDP per capita.
Economic development, entrepreneurship and culture
Inglehart (1997) defines culture as the set of basic common values which contributes toshaping people’s behavior in a society. Cultural values operate unconsciously, sincethey are deeply rooted within the political institutions and technical systems. The firstand most common classification of cultures distinguishes between those that areindividualist or collectivist (Hofstede 1980; Triandis 1995; Schwartz 1999).Nevertheless, alternative characterizations have also been made. From an empiricalpoint of view, Hofstede’s cultural dimensions (Hofstede 1980, 1991, 2003) have oftenbeen used as a reference in research works about the influence of culture on entrepre-neurship (Mcgrath and MacMillan 1992; Mitchell et al. 2000; Mueller and Thomas2001; Hayton et al. 2002; Mueller et al. 2002; Liñán and Chen 2009). Yet Hofstede’smeasures have been criticized due to their methodological weaknesses (Dorfman andHowell 1988; Jabri 2005; McSweeney 2002; Tang and Koveos 2008).2
Another alternative approach to culture is proposed by Schwartz (1990). Accordingto his proposal, values shape the individual’s motivational goals. This theory is stronglybased on a universal system of values that guide human behavior. Specific culturalcontexts mean that some of them prevail over others (Schwartz 2006, 2008). Thismechanism works through social institutions and their actions (via legislation, govern-ment directives, the education system, etc.), selecting and prioritizing some values overothers. In this sense, people tend to carry out what they believe is socially appropriatebehavior (Markus and Kitayama 1991; Schwartz 1994).
In the present study, Schwartz’s theory will be followed. This considers culturalvalues as averaged individual values (Schwartz 1994, 1999, 2004). According toSchwartz (2004), at the aggregate level, seven types of cultural value orientationsmay be identified: Embeddedness, Intellectual Autonomy, Affective Autonomy,Hierarchy, Egalitarianism, Mastery and Harmony. These cultural value orientationsalso present a framework of cultural compatibility and opposition (Schwartz 1994,1999), since some of them share common basic assumptions. For instance, Hierarchyand Embeddedness are positively related, sharing the idea that personal roles andobligations to social groups are more important than individual ideas and aspirations.These values, therefore, are more present in collectivist countries. A similar relationshipis also found with respect to Egalitarianism and Intellectual Autonomy. These share theidea of social actors who assume individual responsibility and make personal decisionsbased on their understanding of situations. These values thus predominate in individ-ualist countries (Schwartz 1994, 1999). In practice, high Egalitarianism and IntellectualAutonomy are usually found together (Schwartz and Ros 1995).
2 For instance, Dorfman and Howell (1988) found that in his analysis Hofstede has, on occasion, used thesame questionnaire item on more than one scale, and several have significant cross-loadings. Furthermore,McSweeney (2002) criticized Hostede’s cultural dimensions for implying a rather simplistic view of culture.
Int Entrep Manag J
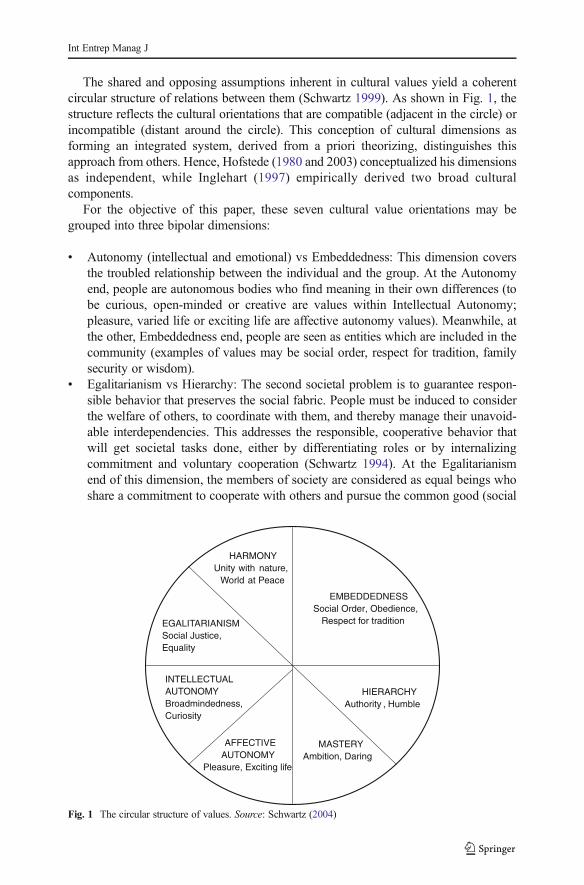
The shared and opposing assumptions inherent in cultural values yield a coherentcircular structure of relations between them (Schwartz 1999). As shown in Fig. 1, thestructure reflects the cultural orientations that are compatible (adjacent in the circle) orincompatible (distant around the circle). This conception of cultural dimensions asforming an integrated system, derived from a priori theorizing, distinguishes thisapproach from others. Hence, Hofstede (1980 and 2003) conceptualized his dimensionsas independent, while Inglehart (1997) empirically derived two broad culturalcomponents.
For the objective of this paper, these seven cultural value orientations may begrouped into three bipolar dimensions:
& Autonomy (intellectual and emotional) vs Embeddedness: This dimension coversthe troubled relationship between the individual and the group. At the Autonomyend, people are autonomous bodies who find meaning in their own differences (tobe curious, open-minded or creative are values within Intellectual Autonomy;pleasure, varied life or exciting life are affective autonomy values). Meanwhile, atthe other, Embeddedness end, people are seen as entities which are included in thecommunity (examples of values may be social order, respect for tradition, familysecurity or wisdom).
& Egalitarianism vs Hierarchy: The second societal problem is to guarantee respon-sible behavior that preserves the social fabric. People must be induced to considerthe welfare of others, to coordinate with them, and thereby manage their unavoid-able interdependencies. This addresses the responsible, cooperative behavior thatwill get societal tasks done, either by differentiating roles or by internalizingcommitment and voluntary cooperation (Schwartz 1994). At the Egalitarianismend of this dimension, the members of society are considered as equal beings whoshare a commitment to cooperate with others and pursue the common good (social
HARMONYUnity with nature,
World at Peace
HIERARCHYAuthority , Humble
EGALITARIANISMSocial Justice, Equality
EMBEDDEDNESSSocial Order, Obedience,
Respect for tradition
MASTERYAmbition, Daring
AFFECTIVE AUTONOMY
Pleasure, Exciting life
INTELLECTUAL AUTONOMYBroadmindedness, Curiosity
Fig. 1 The circular structure of values. Source: Schwartz (2004)
Int Entrep Manag J
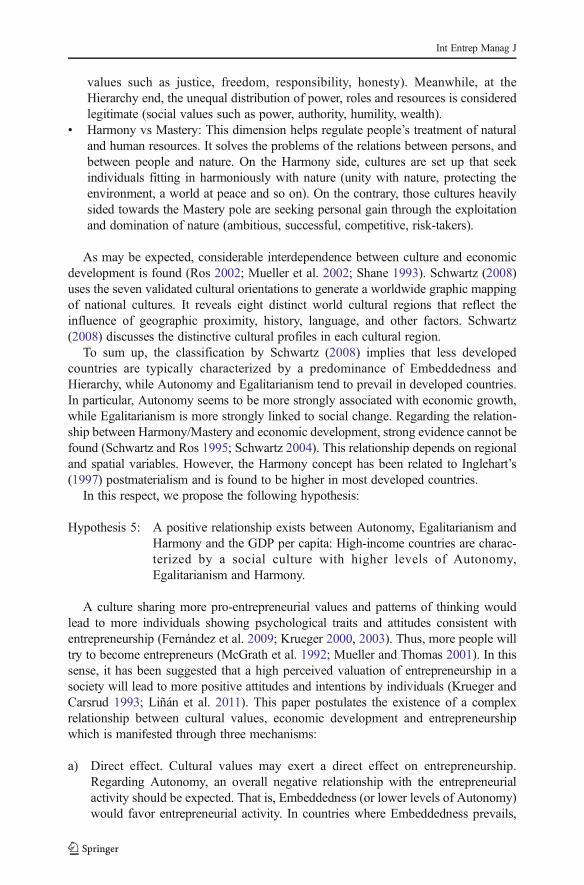
values such as justice, freedom, responsibility, honesty). Meanwhile, at theHierarchy end, the unequal distribution of power, roles and resources is consideredlegitimate (social values such as power, authority, humility, wealth).
& Harmony vs Mastery: This dimension helps regulate people’s treatment of naturaland human resources. It solves the problems of the relations between persons, andbetween people and nature. On the Harmony side, cultures are set up that seekindividuals fitting in harmoniously with nature (unity with nature, protecting theenvironment, a world at peace and so on). On the contrary, those cultures heavilysided towards the Mastery pole are seeking personal gain through the exploitationand domination of nature (ambitious, successful, competitive, risk-takers).
As may be expected, considerable interdependence between culture and economicdevelopment is found (Ros 2002; Mueller et al. 2002; Shane 1993). Schwartz (2008)uses the seven validated cultural orientations to generate a worldwide graphic mappingof national cultures. It reveals eight distinct world cultural regions that reflect theinfluence of geographic proximity, history, language, and other factors. Schwartz(2008) discusses the distinctive cultural profiles in each cultural region.
To sum up, the classification by Schwartz (2008) implies that less developedcountries are typically characterized by a predominance of Embeddedness andHierarchy, while Autonomy and Egalitarianism tend to prevail in developed countries.In particular, Autonomy seems to be more strongly associated with economic growth,while Egalitarianism is more strongly linked to social change. Regarding the relation-ship between Harmony/Mastery and economic development, strong evidence cannot befound (Schwartz and Ros 1995; Schwartz 2004). This relationship depends on regionaland spatial variables. However, the Harmony concept has been related to Inglehart’s(1997) postmaterialism and is found to be higher in most developed countries.
In this respect, we propose the following hypothesis:
Hypothesis 5: A positive relationship exists between Autonomy, Egalitarianism andHarmony and the GDP per capita: High-income countries are charac-terized by a social culture with higher levels of Autonomy,Egalitarianism and Harmony.
A culture sharing more pro-entrepreneurial values and patterns of thinking wouldlead to more individuals showing psychological traits and attitudes consistent withentrepreneurship (Fernández et al. 2009; Krueger 2000, 2003). Thus, more people willtry to become entrepreneurs (McGrath et al. 1992; Mueller and Thomas 2001). In thissense, it has been suggested that a high perceived valuation of entrepreneurship in asociety will lead to more positive attitudes and intentions by individuals (Krueger andCarsrud 1993; Liñán et al. 2011). This paper postulates the existence of a complexrelationship between cultural values, economic development and entrepreneurshipwhich is manifested through three mechanisms:
a) Direct effect. Cultural values may exert a direct effect on entrepreneurship.Regarding Autonomy, an overall negative relationship with the entrepreneurialactivity should be expected. That is, Embeddedness (or lower levels of Autonomy)would favor entrepreneurial activity. In countries where Embeddedness prevails,
Int Entrep Manag J
the sense of community would facilitate support for nascent entrepreneurs and, inparticular, for small-scale necessity initiatives. Moreover, societies in whichMastery prevails (instead of Harmony) tend to encourage active self-assertion inorder to master, direct and change the natural and social environment to attain owngoals (Schwartz 2006). Therefore, since entrepreneurship represents changes ineconomic and competition conditions in the market, it would be favorably lookedupon in societies in which Mastery values are prevailing. In turn, the predominanceof Harmony promotes the acceptance of the world (nature and society) as it is,trying to understand and appreciate it, rather than to change it. This would beassociated with a lower entrepreneurial activity. Finally, Egalitarianism, whichimplies considering the members of society as equal beings, might hamper thepursuit for leadership and, therefore, discourage entrepreneurial activity. In thisrespect, we formulate the following hypothesis:
Hypothesis 6: A negative relationship exists between Autonomy, Egalitarianismand Harmony and entrepreneurial activity. A social culture char-acterized by low levels of Autonomy, Egalitarianism and Harmonyis associated with a high entrepreneurship rate.
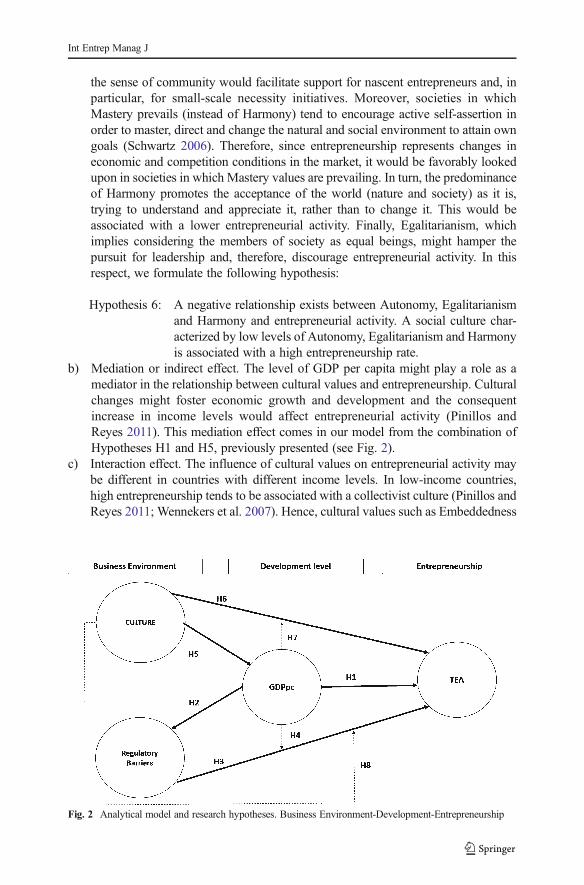
b) Mediation or indirect effect. The level of GDP per capita might play a role as amediator in the relationship between cultural values and entrepreneurship. Culturalchanges might foster economic growth and development and the consequentincrease in income levels would affect entrepreneurial activity (Pinillos andReyes 2011). This mediation effect comes in our model from the combination ofHypotheses H1 and H5, previously presented (see Fig. 2).
c) Interaction effect. The influence of cultural values on entrepreneurial activity maybe different in countries with different income levels. In low-income countries,high entrepreneurship tends to be associated with a collectivist culture (Pinillos andReyes 2011; Wennekers et al. 2007). Hence, cultural values such as Embeddedness
Fig. 2 Analytical model and research hypotheses. Business Environment-Development-Entrepreneurship
Int Entrep Manag J
and Hierarchy should be connected here with higher overall entrepreneurial activ-ity. In contrast, in developed countries (with high levels of economic opportunities),a higher individualism is linked to increased entrepreneurial activity (Busenitz andLau 1996; Mueller et al. 2002). In this sense, Schwartz (1999) finds individualismas positively related to Autonomy and Egalitarianism, while it is opposed toEmbeddedness. This result has been confirmed by Ros (2002). So, in the case ofdeveloped countries, Autonomy and Egalitarianism should be positively related toentrepreneurial activity (in particular, to opportunity-driven entrepreneurship). Theopposed values of Embeddedness and Hierarchy should, instead, be negativelyrelated to entrepreneurship (Liñán et al. 2012). In this respect, we propose thefollowing hypothesis:
Hypothesis 7: The relationship between culture and entrepreneurship is moder-ated by GDP per capita: In high-income countries a culture char-acterized by high levels of Autonomy, Egalitarianism andHarmony is positively associated with the rate of entrepreneurialactivity.
Moreover, the extent to which specific cultural variables can be tied to the rate ortype of entrepreneurship in a particular economy is not fully understood. In this respect,the influence of the institutional environment might be critical, because it could create(or not) the conditions in which a particular culture effectively stimulates the individ-uals’ entrepreneurial initiatives. This paper has a specific interest in the role ofregulatory barriers to business start-up. Regarding this, a cultural environment charac-terized by Autonomy, Egalitarianism and Harmony could provide the best conditionsfor opportunity-driven entrepreneurs to develop their business projects (Liñán et al.2012). This type of entrepreneurs might be especially sensible to regulatory barriers tostart-up which impose high initial costs or make the start-up process excessivelycomplicated or cumbersome. However, in societies in which values associated withEmbeddedness, Hierarchy and Mastery prevail, necessity entrepreneurs could be forcedto face these regulatory barriers as an inevitable obstacle, either fulfilling them oravoiding compliance with them.
In this respect, we propose the following hypothesis:Hypothesis 8: Culture moderates the influence of regulatory barriers for start-up on
entrepreneurship: the negative effect of the regulatory barriers to start-up on the rate ofentrepreneurial activity is higher in countries with a culture characterized byAutonomy, Egalitarianism and Harmony.
Figure 2 shows our final analytical model and our research hypotheses.
Empirical analysis
The empirical analysis was carried out on a sample of developing and developedcountries. The selection of countries was made based on the available data (countriesparticipating in both the GEM project and the Schwartz Value Survey -SVS- study wereincluded). Of the total sample of 56 countries (Annex 1), 27 are developed and the restdeveloping (29).
Int Entrep Manag J
Methodology
Structural equations modeling (SEM) and, specifically, partial least squares (PLS), wasapplied for this analysis. According to Gefen et al. (2000), when exploratory studies arecarried out and relatively small samples are used, PLS is more suitable than themultivariate statistical techniques, such as LISREL, based on covariance analysis.
The model tries to explain the Total Entrepreneurial Activity (TEA) rate of countriesbased on their per capita GDP, culture and regulatory barriers. The variables included inthe analysis are the following (see Annex 2 for descriptive statistics):
& For entrepreneurship, data come from the GEM statistics3:
a) TEA: the percentage of the population aged 18–64 who are either nascententrepreneurs (starting a venture, or having just started one—with no more than3 months of existence) or owner-managers of a new business (i.e., owning andmanaging a running business that has paid salaries, wages or any other paymentsto the owners for more than three months but not more than 42 months). Thevalues used in this analysis are averaged annual data for the period 2001–2011.
& For economic development, the following income indicator is used:
b) Gross Domestic Product per capita (GDPpc). Data are obtained from theWorld Development Indicators of the World Bank (average for the period2001–2011).
& For regulatory barriers to business start-up, the following synthetic index is proposed:
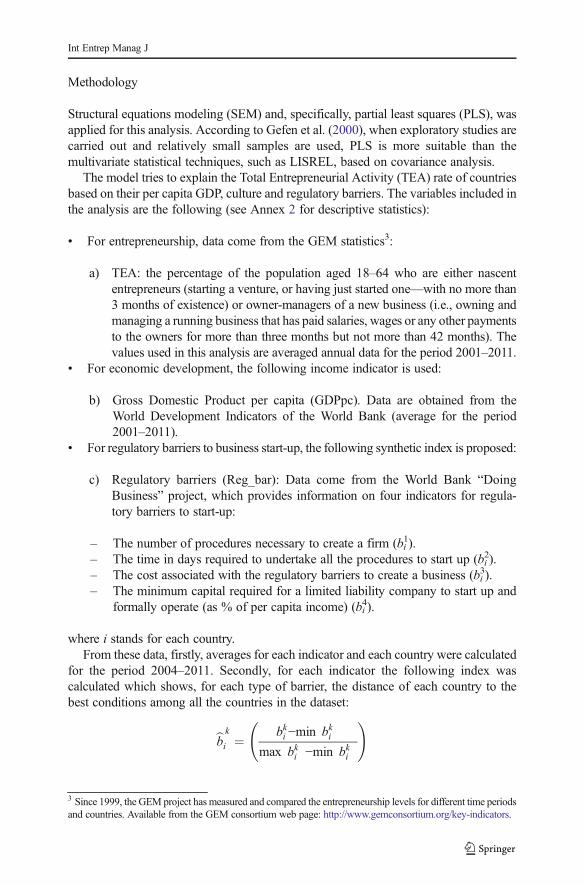
c) Regulatory barriers (Reg_bar): Data come from the World Bank “DoingBusiness” project, which provides information on four indicators for regula-tory barriers to start-up:
– The number of procedures necessary to create a firm (bi1).
– The time in days required to undertake all the procedures to start up (bi2).
– The cost associated with the regulatory barriers to create a business (bi3).
– The minimum capital required for a limited liability company to start up andformally operate (as % of per capita income) (bi
4).
where i stands for each country.From these data, firstly, averages for each indicator and each country were calculated
for the period 2004–2011. Secondly, for each indicator the following index wascalculated which shows, for each type of barrier, the distance of each country to thebest conditions among all the countries in the dataset:
bb k
i ¼ bki −min bki� �
max bki� �
−min bki� �
!
3 Since 1999, the GEM project has measured and compared the entrepreneurship levels for different time periodsand countries. Available from the GEM consortium web page: http://www.gemconsortium.org/key-indicators.
Int Entrep Manag J
The index takes values between 0 and 1 (1 for the country with the highest barrierwithin the data set and 0 for the country with the lowest barrier).
Finally, an overall index was calculated as a simple average of the individual indices,as follows:
Reg bari ¼ 1
4
Xk¼1
4 bbki
Consequently, the final index, which takes values from 0 to 1, measures, for eachcountry, the distance to the best possible regulatory environment to start-up a business.
& For cultural values, the Schwartz Value Survey (SVS) is used in this paper(Hebrew University). Schwartz’s theory defines cultural values as averagedindividual values (Schwartz 1992, 1994, 1999, 2004). The SVS consists of 57items which represent 7 value orientations at the cultural level. The data areavailable for more than 60 countries during the period 1985–2005. Theaverage for each country has been computed for the 57 value-items. Thesenational-level scores were them averaged into seven cultural orientations(Schwartz 2004; Schwartz and Ros 1995): Embeddedness, IntellectualAutonomy, Affective Autonomy, Hierarchy, Egalitarianism, Mastery andHarmony. The seven cultural values were grouped into three latent bipolarcultural dimensions or reflective first-order constructs with PLS analysis:
d) Autonomy vs Embeddedness (Auto-Emb). This construct is modeledreflectively using two items: Autonomy4 and (reversed) Embeddedness.So, higher values for the Auto-Emb variable indicate the predominanceof the Autonomy dimension versus the Embeddedness value orientation.Average 1985–2005.
e) Egalitarianism vs Hierarchy (Egal-Hier). This constructs includes twoitems: Egalitarianism and (reversed) Hierarchy. This latent variable mea-sures the predominance of Egalitarianism versus Hierarchy. Average1985–2005.
f) Harmony vs Mastery (Har-Mas). This construct is modeled using Harmonyand (reversed) Mastery items. This first-order construct reflects the predomi-nance of Harmony versus Mastery. Average 1985–2005.
These three reflective first-order constructs were then used to build thevariable “Culture” as a formative second-order factor. As a result, the threedimensions or first-order factors become the observed indicators of this formativesecond-order factor.
& Finally, three moderating effects (Culture x GDPpc, Reg_bar x GDPpc andReg_bar x Culture) were included in the model.
4 Autonomy being the union of intellectual and affective autonomy.
Int Entrep Manag J
Results
A PLS model is analyzed and interpreted in two stages: firstly, the assessment ofthe reliability and validity of the measurement model and, secondly, the assess-ment of the structural model (hypothesized relationships) (Chin 1998). Thissequence ensures that the constructs’ measures are valid and reliable beforeattempting to draw conclusions regarding relationships between constructs(Barclay et al. 1995).
Measurement model
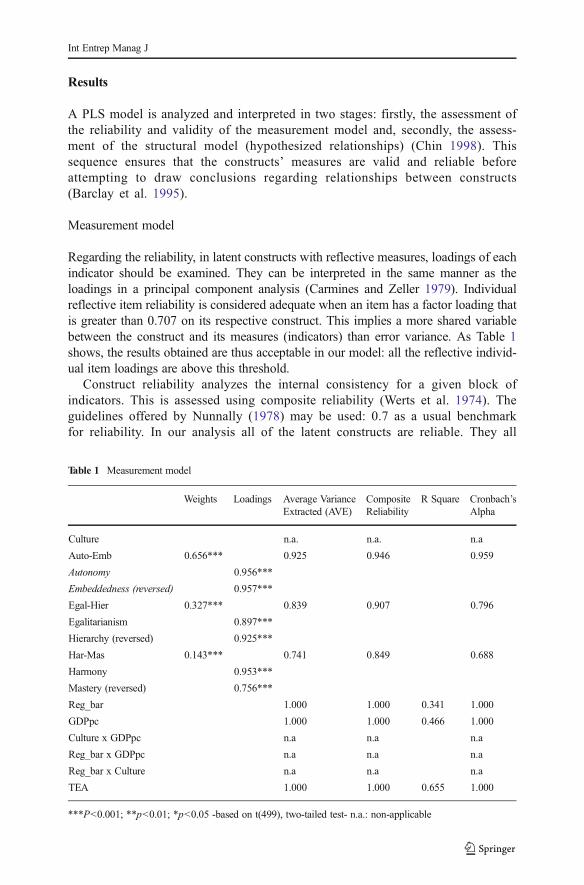
Regarding the reliability, in latent constructs with reflective measures, loadings of eachindicator should be examined. They can be interpreted in the same manner as theloadings in a principal component analysis (Carmines and Zeller 1979). Individualreflective item reliability is considered adequate when an item has a factor loading thatis greater than 0.707 on its respective construct. This implies a more shared variablebetween the construct and its measures (indicators) than error variance. As Table 1shows, the results obtained are thus acceptable in our model: all the reflective individ-ual item loadings are above this threshold.
Construct reliability analyzes the internal consistency for a given block ofindicators. This is assessed using composite reliability (Werts et al. 1974). Theguidelines offered by Nunnally (1978) may be used: 0.7 as a usual benchmarkfor reliability. In our analysis all of the latent constructs are reliable. They all
Table 1 Measurement model
Weights Loadings Average VarianceExtracted (AVE)
CompositeReliability
R Square Cronbach’sAlpha
Culture n.a. n.a. n.a
Auto-Emb 0.656*** 0.925 0.946 0.959
Autonomy 0.956***
Embeddedness (reversed) 0.957***
Egal-Hier 0.327*** 0.839 0.907 0.796
Egalitarianism 0.897***
Hierarchy (reversed) 0.925***
Har-Mas 0.143*** 0.741 0.849 0.688
Harmony 0.953***
Mastery (reversed) 0.756***
Reg_bar 1.000 1.000 0.341 1.000
GDPpc 1.000 1.000 0.466 1.000
Culture x GDPpc n.a n.a n.a
Reg_bar x GDPpc n.a n.a n.a
Reg_bar x Culture n.a n.a n.a
TEA 1.000 1.000 0.655 1.000
***P<0.001; **p<0.01; *p<0.05 -based on t(499), two-tailed test- n.a.: non-applicable
Int Entrep Manag J
have measures of internal consistency that exceed 0.7. Also, the significance ofthe loadings was checked with a re-sampling procedure (500 sub-samples) toobtain t-statistic values. They are all significant in the model (see Table 1).
Average variance extracted (AVE) assesses the amount of variance that aconstruct captures from its indicators relative to the amount due to measurementerror (Fornell and Larcker 1981). It is recommended that the AVE should begreater than 0.5. In this case, more than 50 % of the variance in each indicatoris accounted for by the construct. The latent variables in this model complywith this condition.
As has been said before, “Culture” was included as a formative second-orderdimension, encompassing three reflective first-order constructs (Auto-Emb, Egal-Hierand Har-Mas), and calculated using repeated indicators (Becker et al. 2012; Ringleet al. 2012). For constructs using formative measures, the weights provide informationas to what the makeup and relative importance are for each indicator in the creation/formation of the component. The low variation inflation factors (VIF < 3) indicate thatmulticollinearity is not a concern for this analysis. Table 1 shows that all the items aresignificant and Auto-Emb is the dimension with the highest weight (0.656), followedby Egal-Hier.
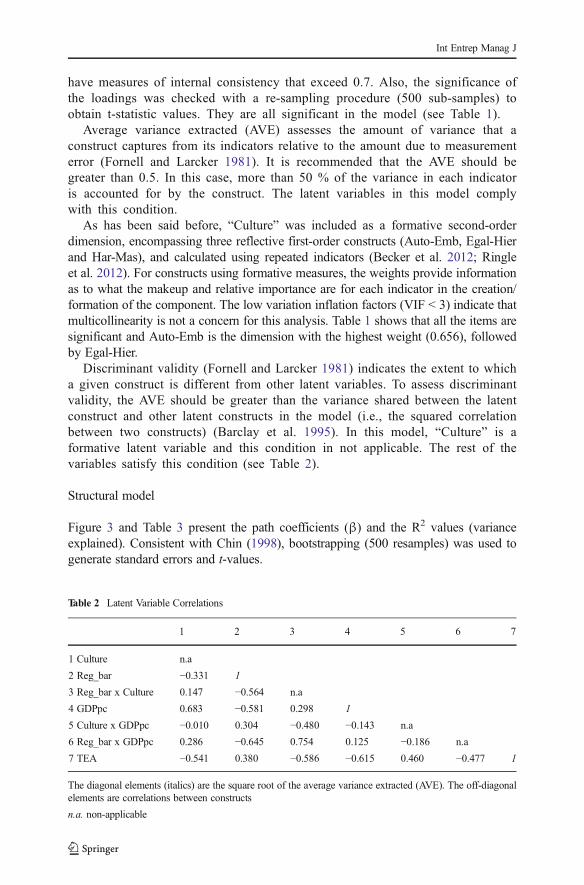
Discriminant validity (Fornell and Larcker 1981) indicates the extent to whicha given construct is different from other latent variables. To assess discriminantvalidity, the AVE should be greater than the variance shared between the latentconstruct and other latent constructs in the model (i.e., the squared correlationbetween two constructs) (Barclay et al. 1995). In this model, “Culture” is aformative latent variable and this condition in not applicable. The rest of thevariables satisfy this condition (see Table 2).
Structural model
Figure 3 and Table 3 present the path coefficients (β) and the R2 values (varianceexplained). Consistent with Chin (1998), bootstrapping (500 resamples) was used togenerate standard errors and t-values.
Table 2 Latent Variable Correlations
1 2 3 4 5 6 7
1 Culture n.a
2 Reg_bar −0.331 1
3 Reg_bar x Culture 0.147 −0.564 n.a
4 GDPpc 0.683 −0.581 0.298 1
5 Culture x GDPpc −0.010 0.304 −0.480 −0.143 n.a
6 Reg_bar x GDPpc 0.286 −0.645 0.754 0.125 −0.186 n.a
7 TEA −0.541 0.380 −0.586 −0.615 0.460 −0.477 1
The diagonal elements (italics) are the square root of the average variance extracted (AVE). The off-diagonalelements are correlations between constructs
n.a. non-applicable
Int Entrep Manag J
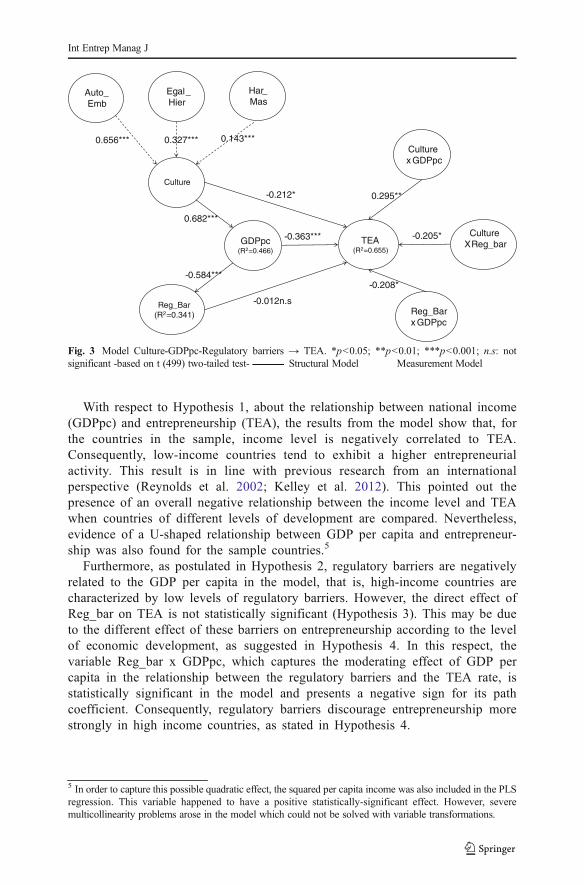
With respect to Hypothesis 1, about the relationship between national income(GDPpc) and entrepreneurship (TEA), the results from the model show that, forthe countries in the sample, income level is negatively correlated to TEA.Consequently, low-income countries tend to exhibit a higher entrepreneurialactivity. This result is in line with previous research from an internationalperspective (Reynolds et al. 2002; Kelley et al. 2012). This pointed out thepresence of an overall negative relationship between the income level and TEAwhen countries of different levels of development are compared. Nevertheless,evidence of a U-shaped relationship between GDP per capita and entrepreneur-ship was also found for the sample countries.5
Furthermore, as postulated in Hypothesis 2, regulatory barriers are negativelyrelated to the GDP per capita in the model, that is, high-income countries arecharacterized by low levels of regulatory barriers. However, the direct effect ofReg_bar on TEA is not statistically significant (Hypothesis 3). This may be dueto the different effect of these barriers on entrepreneurship according to the levelof economic development, as suggested in Hypothesis 4. In this respect, thevariable Reg_bar x GDPpc, which captures the moderating effect of GDP percapita in the relationship between the regulatory barriers and the TEA rate, isstatistically significant in the model and presents a negative sign for its pathcoefficient. Consequently, regulatory barriers discourage entrepreneurship morestrongly in high income countries, as stated in Hypothesis 4.
-0.012 n.s
0.295**-0.212*
0.682***
-0.584***-0.208*
0.143***0.327***0.656***
-0.363*** -0.205*
Har_ Mas
Egal_ Hier
Auto_ Emb
TEA(R2=0.655)
Culture
Reg_Bar(R2=0.341) Reg_Bar
x GDPpc
CultureX Reg_bar
Culture x GDPpc
GDPpc(R2=0.466)
Fig. 3 Model Culture-GDPpc-Regulatory barriers → TEA. *p<0.05; **p<0.01; ***p<0.001; n.s: notsignificant -based on t (499) two-tailed test- Structural Model Measurement Model
5 In order to capture this possible quadratic effect, the squared per capita income was also included in the PLSregression. This variable happened to have a positive statistically-significant effect. However, severemulticollinearity problems arose in the model which could not be solved with variable transformations.
Int Entrep Manag J
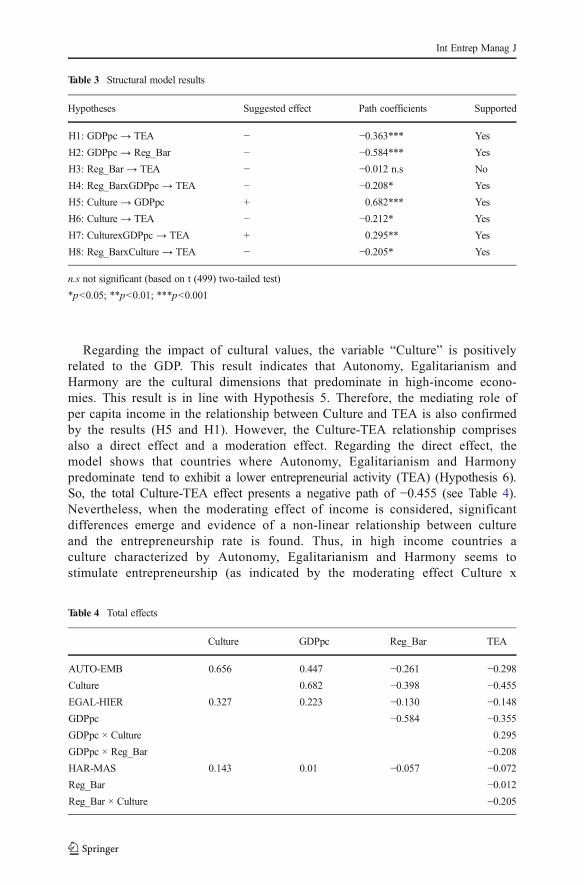
Regarding the impact of cultural values, the variable “Culture” is positivelyrelated to the GDP. This result indicates that Autonomy, Egalitarianism andHarmony are the cultural dimensions that predominate in high-income econo-mies. This result is in line with Hypothesis 5. Therefore, the mediating role ofper capita income in the relationship between Culture and TEA is also confirmedby the results (H5 and H1). However, the Culture-TEA relationship comprisesalso a direct effect and a moderation effect. Regarding the direct effect, themodel shows that countries where Autonomy, Egalitarianism and Harmonypredominate tend to exhibit a lower entrepreneurial activity (TEA) (Hypothesis 6).So, the total Culture-TEA effect presents a negative path of −0.455 (see Table 4).Nevertheless, when the moderating effect of income is considered, significantdifferences emerge and evidence of a non-linear relationship between cultureand the entrepreneurship rate is found. Thus, in high income countries aculture characterized by Autonomy, Egalitarianism and Harmony seems tostimulate entrepreneurship (as indicated by the moderating effect Culture x
Table 4 Total effects
Culture GDPpc Reg_Bar TEA
AUTO-EMB 0.656 0.447 −0.261 −0.298Culture 0.682 −0.398 −0.455EGAL-HIER 0.327 0.223 −0.130 −0.148GDPpc −0.584 −0.355GDPpc × Culture 0.295
GDPpc × Reg_Bar −0.208HAR-MAS 0.143 0.01 −0.057 −0.072Reg_Bar −0.012Reg_Bar × Culture −0.205
Table 3 Structural model results
Hypotheses Suggested effect Path coefficients Supported
H1: GDPpc → TEA − −0.363*** Yes
H2: GDPpc → Reg_Bar − −0.584*** Yes
H3: Reg_Bar → TEA − −0.012 n.s No
H4: Reg_BarxGDPpc → TEA − −0.208* Yes
H5: Culture → GDPpc + 0.682*** Yes
H6: Culture → TEA − −0.212* Yes
H7: CulturexGDPpc → TEA + 0.295** Yes
H8: Reg_BarxCulture → TEA − −0.205* Yes
n.s not significant (based on t (499) two-tailed test)
*p<0.05; **p<0.01; ***p<0.001
Int Entrep Manag J
GDPpc with a positive and statistically-significant coefficient). These resultssupport Hypothesis 7.
Finally, Hypothesis 8—referring to the moderating role of culture in the relationshipbetween regulatory barriers and TEA—is also confirmed in the model. Therefore, incountries characterized by a culture with a predominance of Autonomy, Egalitarianismand Harmony, regulatory barriers have a larger negative impact on TEA.
Conclusion
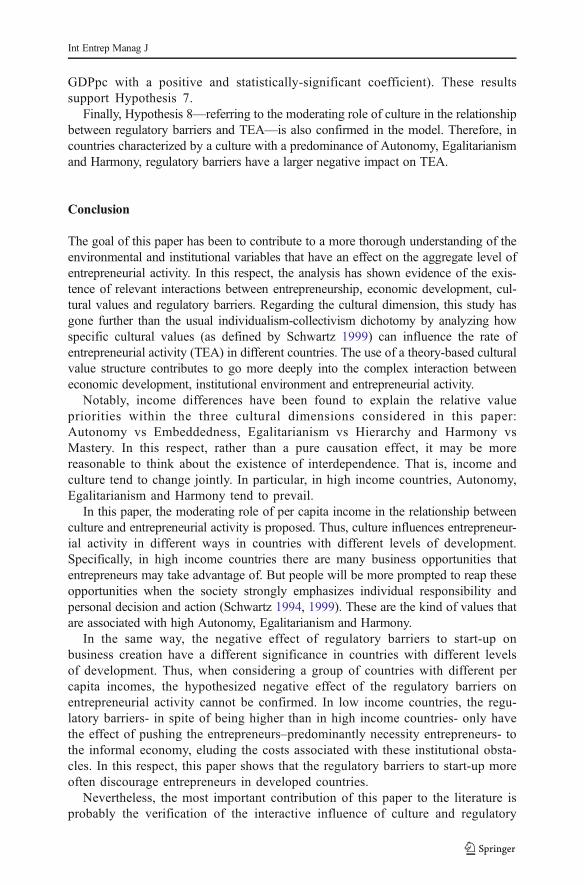
The goal of this paper has been to contribute to a more thorough understanding of theenvironmental and institutional variables that have an effect on the aggregate level ofentrepreneurial activity. In this respect, the analysis has shown evidence of the exis-tence of relevant interactions between entrepreneurship, economic development, cul-tural values and regulatory barriers. Regarding the cultural dimension, this study hasgone further than the usual individualism-collectivism dichotomy by analyzing howspecific cultural values (as defined by Schwartz 1999) can influence the rate ofentrepreneurial activity (TEA) in different countries. The use of a theory-based culturalvalue structure contributes to go more deeply into the complex interaction betweeneconomic development, institutional environment and entrepreneurial activity.
Notably, income differences have been found to explain the relative valuepriorities within the three cultural dimensions considered in this paper:Autonomy vs Embeddedness, Egalitarianism vs Hierarchy and Harmony vsMastery. In this respect, rather than a pure causation effect, it may be morereasonable to think about the existence of interdependence. That is, income andculture tend to change jointly. In particular, in high income countries, Autonomy,Egalitarianism and Harmony tend to prevail.
In this paper, the moderating role of per capita income in the relationship betweenculture and entrepreneurial activity is proposed. Thus, culture influences entrepreneur-ial activity in different ways in countries with different levels of development.Specifically, in high income countries there are many business opportunities thatentrepreneurs may take advantage of. But people will be more prompted to reap theseopportunities when the society strongly emphasizes individual responsibility andpersonal decision and action (Schwartz 1994, 1999). These are the kind of values thatare associated with high Autonomy, Egalitarianism and Harmony.
In the same way, the negative effect of regulatory barriers to start-up onbusiness creation have a different significance in countries with different levelsof development. Thus, when considering a group of countries with different percapita incomes, the hypothesized negative effect of the regulatory barriers onentrepreneurial activity cannot be confirmed. In low income countries, the regu-latory barriers- in spite of being higher than in high income countries- only havethe effect of pushing the entrepreneurs–predominantly necessity entrepreneurs- tothe informal economy, eluding the costs associated with these institutional obsta-cles. In this respect, this paper shows that the regulatory barriers to start-up moreoften discourage entrepreneurs in developed countries.
Nevertheless, the most important contribution of this paper to the literature isprobably the verification of the interactive influence of culture and regulatory
Int Entrep Manag J
barriers on entrepreneurial activity. Thus, evidence has been provided about themoderating role of culture in the relationship between regulatory barriers andentrepreneurial activity. In countries with a culture characterized by Autonomy,Egalitarianism and Harmony, regulatory barriers may have an especially impor-tant negative effect on business creation. These cultural values favor the emer-gence of opportunity-driven entrepreneurs in comparison to necessity entrepre-neurs. Since the former might be more sensitive to regulatory barriers than thelatter, the negative impact of the regulatory obstacles for start-up gains relevancein this specific cultural context.
The policy implications of this analysis may be substantial. In order to fosterentrepreneurial activity, policy makers should promote a business environmentwhich stimulates business creation. This paper shows that in developed coun-tries, the optimal conditions imply low regulatory barriers to start-up and asocial culture in which values associated with Autonomy, Egalitarianism andHarmony predominate. Therefore, enterprise policies should be concerned aboutthese issues and try to improve the business environment through regulatorychanges and entrepreneurship education. Moreover, this paper suggests that arelevant synergy can be generated by acting simultaneously in the two afore-mentioned directions.
The paper is not without limitations. In particular, the sample size is rela-tively small and the results may be sensitive to the inclusion of any additionalcountry in the sample. Nevertheless, all countries for which data were availablehave been included. Of course, much is yet to be known regarding the way inwhich cultural values influence entrepreneurial activity. The present study offersrelevant indications that the relationship exists by presenting an aggregatedanalysis at a macroeconomic level to complement the existing literature at amicro level. However, additional work is needed to better understand themechanisms through which this influences take place. In this respect, it couldbe interesting to explore the potential of multilevel analysis in future researchon this topic.
Acknowledgments This study is part of the VIE Project (Cultural Values and Socioeconomic Factors asdeterminants of the Entrepreneurial Intention), which has been financed by the regional government ofAndalusia (Department of Innovation, Science and Enterprise; Reference Number: P08-SEJ-03542).
Appendices
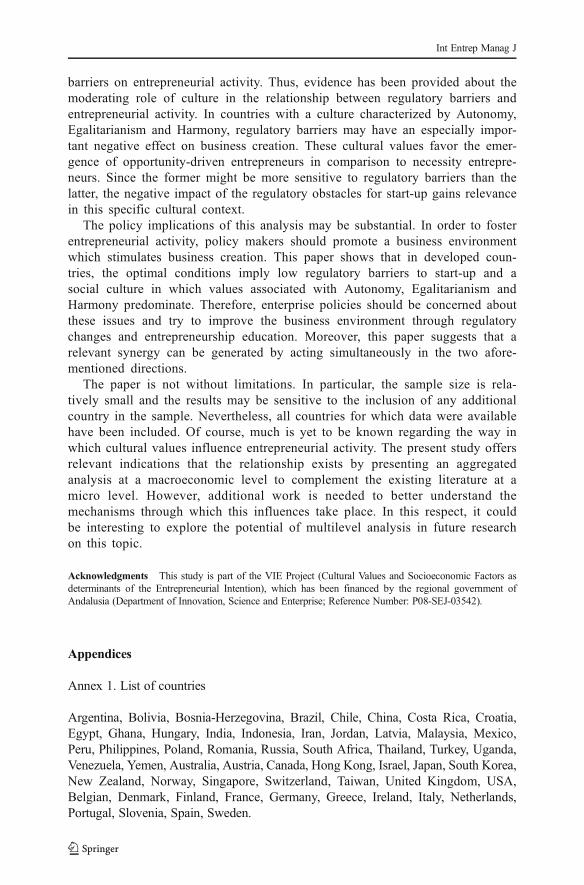
Annex 1. List of countries
Argentina, Bolivia, Bosnia-Herzegovina, Brazil, Chile, China, Costa Rica, Croatia,Egypt, Ghana, Hungary, India, Indonesia, Iran, Jordan, Latvia, Malaysia, Mexico,Peru, Philippines, Poland, Romania, Russia, South Africa, Thailand, Turkey, Uganda,Venezuela, Yemen, Australia, Austria, Canada, Hong Kong, Israel, Japan, South Korea,New Zealand, Norway, Singapore, Switzerland, Taiwan, United Kingdom, USA,Belgian, Denmark, Finland, France, Germany, Greece, Ireland, Italy, Netherlands,Portugal, Slovenia, Spain, Sweden.
Int Entrep Manag J
References
Álvarez, C., Urbano, D., Coduras, A., & Ruiz-Navarro, J. (2011). Environmental conditions and entrepre-neurial activity: a regional comparison in Spain. Journal of Small Business and Enterprise Development,18(1), 120–140.
Ardagna, S., & Lusardi, A. (2010). Heterogeneity in the effect of regulation on entrepreneurship and entrysize. Journal of the European Economic Association, 8(2-3), 594–605.
Armington, C., & Acs, Z. J. (2002). The Determinants of Regional Variation in New Firm Formation.Regional Studies, 36(1), 33–45.
Ayyagari, M., Beck, T., & Demirguc-Kunt, A. (2007). Small and Medium Enterprises Across the Globe. SmallBusiness Economics, 29(4), 415–434.
Barclay, D., Higgins, C., & Thompson, R. (1995). The Partial Least Squares (PLS) Approach to CausalModelling: Personal Computer Adoption and Use as an Illustration. Technology Studies, Special Issue onResearch Methodology, 2(2), 285–309.
Barseghyan, L. (2008). Entry Costs and Cross-Country Differences in Productivity and Output. Journal ofEconomic Growth, 13, 145–167.
Becker, J.-M., Klein, K., & Wetzels, M. (2012). Hierarchical latent variable models in PLS-SEM: guidelinesfor using reflective-formative type models. Long Range Planning, 45(5/6), 359–394.
Bertrand, M., & Kramarz, F. (2002). Does Entry Regulation Hinder Job Creation? Evidence from the FrenchRetail Industry. Quarterly Journal of Economics, 117(4), 1369–1413.
Bjornskov, C., & Foss, N. J. (2008). Economic freedom and entrepreneurial activity: Some cross-countryevidence. Public Choice 134, 307–328.
Busenitz, L. W., & Lau, C. M. (1996). A cross-cultural cognitive model of new venture creation.Entrepreneurship: Theory and Practice, 20(4), 25–39.
Carmines, E. G., & Zeller, R. A. (1979). Reliability and Validity Assessments, Sage University Paper Series onQuantitative Applications in the Social Sciences (Vol. 7). Beverly Hills: Sage. nº 07.
Carree, M. A., van Stel, A., Thurik, A. R., & Wennekers, A. R. M. (2002). Economic development andbusiness ownership: an analysis using data of 23 OECD countries in the period 1976–1996. SmallBusiness Economics, 19(3), 271–290.
Chin, W. W. (1998). The Partial Least Squares Approach to Structural Equation Modeling. In G. A.Marcoulides (Ed.), Modern Methods for Business Research (pp. 295–336). Mahwah: LawrenceErlbaum Associates, Publisher.
Davidsson, P. (1995). Culture, structure and regional levels of entrepreneurship. Entrepreneurship andRegional Development, 7(1), 41–62.
Davidsson, P., & Wiklund, J. (1997). Values, beliefs and regional variations in new firm formation rates.Journal of Economic Psychology, 18(2–3), 179–199.
Djankov, S. (2009). The Regulation of Entry: a Survey. World Bank Research Observer, 24(2), 183–203.
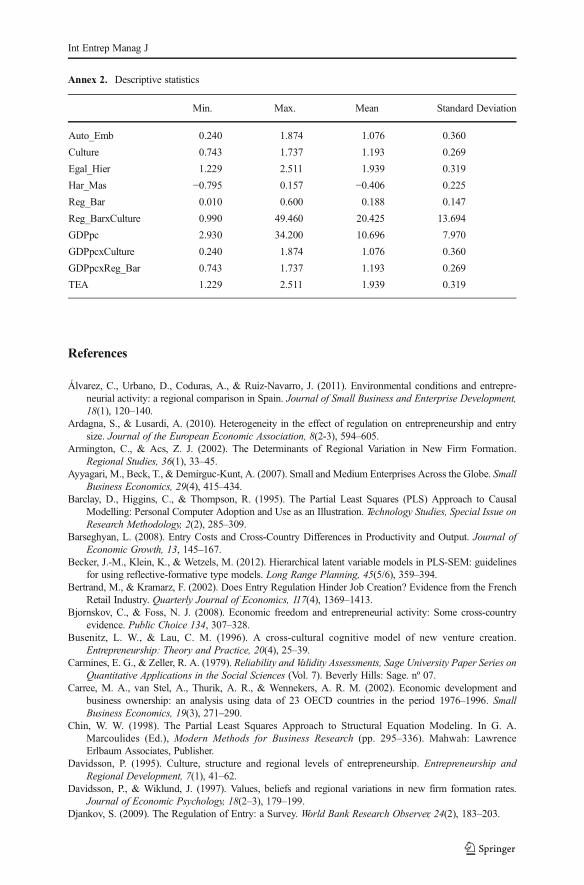
Annex 2. Descriptive statistics
Min. Max. Mean Standard Deviation
Auto_Emb 0.240 1.874 1.076 0.360
Culture 0.743 1.737 1.193 0.269
Egal_Hier 1.229 2.511 1.939 0.319
Har_Mas −0.795 0.157 −0.406 0.225
Reg_Bar 0.010 0.600 0.188 0.147
Reg_BarxCulture 0.990 49.460 20.425 13.694
GDPpc 2.930 34.200 10.696 7.970
GDPpcxCulture 0.240 1.874 1.076 0.360
GDPpcxReg_Bar 0.743 1.737 1.193 0.269
TEA 1.229 2.511 1.939 0.319
Int Entrep Manag J
Djankov, S., La Porta, R., Lopez-de-Silanes, F., & Shleifer, A. (2002). The Regulation of Entry. QuarterlyJournal of Economics, 117(1), 1–37.
Dorfman, P. W., & Howell, J. P. (1988). Dimensions of national culture and effective leadership patterns:Hofstede revisited. In E. G. McGoun (Ed.), Advances in international comparative management (3rd ed.,pp. 127–149). Greenwich: JAI Press.
Dreher, A., & Gassebner, M. (2013). Greasing the Wheels of Entrepreneurship? Impact of Regulations andCorruption on Firm Entry. Public Choice, 155(3-4), 413–432.
Fernández, J., Liñán, F., & Santos, F. J. (2009). Cognitive Aspects of Potential Entrepreneurs in Southern andNothern Europe: an Analysis Using Gem-Data. Revista de Economía Mundial, 23, 151–178.
Fernández-Serrano, J., &Romero, I. (2012). Entrepreneurial quality and regional development: Characterizing SMEsectors in low income areas. Papers in Regional Science, 92(3), 495–513. doi:10.1111/j.1435-5957.2012.00421.x.
Fishman, R., & Sarria-Allende, V. (2004). Regulation of entry and the distortion of industrial organization.Working Paper No. 10929. Cambridge: National Bureau of Economic Research.
Fonseca, R., López-García, P., & Pissarides, C. (2001). Entrepreneurship, Start-Up Costs and Employment.European Economic Review, 45(4–6), 692–705.
Fornell, C., & Larcker, D. F. (1981). Evaluating Structural Equation Models with Unobservable Variables andMeasurement Error. Journal of Marketing Research, 18, 39–50.
Frederking, L. C. (2004). A cross-national study of culture, organization and entrepreneurship in threeneighbourhoods. Entrepreneurship and Regional Development, 16(3), 197–215.
Fritsch, M., & Mueller, P. (2004). Effects of New Business Formation on Regional Development over Time.Regional Studies, 38(8), 961–975.
Gefen, D., Straub, D. W., & Boudreau, M. C. (2000). Structural equation modeling and regression: guidelinesfor research practice. Communications of the Association for Information Society, 4(7), 1–77.
Gries, T., & Naude, W. (2008). Entrepreneurship and Structural Economic Transformation (Working PaperRP2008/62). Helsinki: UNU World Institute for Development Economics Research (UNU-WIDER).
Hallberg, K. (2000). A Market-Oriented Strategy For Small and Medium-Scale Enterprises, Discussion Paperno. 40. Washington D.C: International Finance Corporation.
Hayton, J. C., George, G., & Zahra, S. A. (2002). National culture and entrepreneurship: a review ofbehavioral research. Entrepreneurship: Theory and Practice, 26(4), 33–52.
Hessels, J., Van Gelderen, M., & Thurik, A. R. (2008). Entrepreneurial aspirations, motivations, and theirdrivers. Small Business Economics, 31(3), 323–339.
Ho, Y.-P., & Wong, P.-K. (2007). Financing, Regulatory Costs and Entrepreneurial Propensity. Small BusinessEconomics, 28(2–3), 187–204.
Hofstede, G. (1980). Culture’s consequences: international differences in work-related values. Beverly Hills:Sage Publications.
Hofstede, G. (1991). Cultures and organizations: software of the mind. London: McGraw-Hill.Hofstede, G. (2003). Culture’s consequences: comparing values, behaviors, institutions and organizations
across nations (2nd ed.). Newbury Park: Sage Publications.Inglehart, R. (1997). Modernization and Postmodernization. Princeton: Princeton University Press.Jabri, M. M. (2005). Commentaries and critical articles: Text-context relationships and their implications for
cross cultural management. International Journal of Cross Cultural Management, 5(3), 349–360.Jovanovic, T. B. (1993). The Diversification of Production. Brookings Papers on Economic Activity,
Microeconomics, 1993(1), 197–235.Kaufmann, D., Kraay, A., & Zoido-Lobatón, P. (2002). Governance Matters II–Updated Indicators 2001/02-.
Washington, D. C: World. Bank Policy Research Department. Working Paper no. 2772.Kelley, D. J., Singer, S., & Herrington, M. (2012). The Global Entrepreneurship Monitor 2011 Global Report.
Wellesley, MA: Babson College.Klapper, L., Laeven, L., & Rajan, R. (2006). Entry Regulation as a Barrier to Entrepreneurship. Journal of
Financial Economics, 82(3), 591–629.Krueger, N. F. (2000). The cognitive infrastructure of opportunity emergence. Entrepreneurship: Theory and
Practice, 24(3), 5–23.Krueger, N. F. (2003). The cognitive psychology of entrepreneurship. In Z. J. Acs & D. B. Audretsch (Eds.),
Handbook of entrepreneurship research: An interdisciplinary survey and introduction (pp. 105–140).London: Kluwer.
Krueger, N. F., & Carsrud, A. L. (1993). Entrepreneurial intentions: applying the theory of planned behavior.Entrepreneurship and Regional Development, 5(4), 315–330.
Lee, S. M., & Peterson, S. J. (2000). Culture, entrepreneurial orientation, and global competitiveness. Journalof World Business, 35(4), 401–416.
Int Entrep Manag J
Lee, S. Y., Florida, R., & Acs, Z. J. (2004). Creativity and entrepreneurship: A regional analysis of new firmformation. Regional Studies, 38(8), 879–891.
Liñán, F., & Chen, Y. W. (2009). Development and cross-cultural application of a specific instrument tomeasure entrepreneurial intentions. Entrepreneurship: Theory and Practice, 33(3), 593–617.
Liñán, F., Urbano, D.,&Guerrero,M. (2011). Regional variations in entrepreneurial cognitions: Start-up intentionsof university students in Spain. Entrepreneurship and Regional Development, 23(3&4), 187–215. doi:10.1080/0898562090323392.
Liñán, F., Fernández-Serrano, J., & Romero, I. (2012). Necessity and Opportunity Entrepreneurship: TheMediating Effect of Culture. Revista de Economía Mundial, 33, 21–47.
Markus, H. R., & Kitayama, S. (1991). Culture and the self: Implications for cognition, emotion andmotivation. Psychological Review, 98, 224–253.
McGrath, R. G., & MacMillan, I. C. (1992). More Like Each Other Than Anyone Else—a Cross-CulturalStudy of Entrepreneurial Perceptions. Journal of Business Venturing, 7(5), 419–429.
McGrath, R. G., MacMillan, I. C., Yang, E. A., & Tsai, W. (1992). Does Culture Endure, or Is It Malleable?Issues for Entrepreneurial Economic Development. Journal of Business Venturing, 7(6), 441–458.
McSweeney, B. (2002). Hofstede’s model of national cultural differences and their consequences: A triumphof faith—a failure of analysis. Human Relations, 55(1), 89–118.
Minniti, M., Bygrave, W. D., & Autio, E. (2006). GEM, Global Entrepreneurship Monitor, 2005 ExecutiveReport. London: London Business School & Babson College.
Mitchell, R. K., Smith, B., Seawright, K. W., &Morse, E. A. (2000). Cross-cultural cognitions and the venturecreation decision. Academy of Management Journal, 43(5), 974–993.
Morris, M. H., Davis, D. L., & Allen, J. (1994). Fostering corporate entrepreneurship: cross-culturalcomparisons of the importance of individualism versus collectivism. Journal of International BusinessStudies, 25(1), 65–89.
Mueller, S. L., & Thomas, A. S. (2001). Culture and entrepreneurial potential: A nine country study of locus ofcontrol and innovativeness. Journal of Business Venturing, 16(1), 51–75.
Mueller, S. L., Thomas, A. S., & Jaeger, A. M. (2002). National entrepreneurial potential: the role of culture,economic development and political history. In M. A. Hitt & J. L. C. Cheng (Eds.), ManagingTransnational Firms: Resources, Market Entry and Strategic Alliances (Advances in InternationalManagement, Vol. 14, pp. 221–257). Amsterdam: JAI Press.
Noorderhaven, N., Thurik, R., Wennekers, A. R. M., & van Stel, A. (2004). The role of dissatisfaction and percapita income in explaining self-employment across 15 European countries. Entrepreneurship-Theory andPractice, 28(5), 447–466.
Nunnally, J. C. (1978). Psychometric Theory. New York: McGraw-Hill.OECD. (1998). Fostering entrepreneurship (OECD policy briefing no. 9). Paris: Organization for Economic
Co-operation and Development.Parker, S. C., & Robson, M. (2004). Explaining International Variations in Self-Employment: Evidence from a
Panel of OECD Countries. Southern Economic Journal, 71(2), 287–301.Pinillos, M. J., & Reyes, L. (2011). Relationship between individualist–collectivist culture and entrepreneurial
activity: evidence from Global Entrepreneurship Monitor data. Small Business Economics, 37(1), 23–37.Porter, M. E., Sachs, J. J., & McArthur, J. (2002). Executive Summary: Competitiveness and Stages of
Economic Development. In the Global Competitiveness Report 2001–2002, 16–25. New York: OxfordUniversity Press.
Reynolds, P. D., Storey, D. J., & Westhead, P. (1994). Cross-national comparison of the variation in new firmrates. Regional Studies, 28(4), 443–456.
Reynolds, P. D., Bygrave, W., Autio, E., & Hay, M. (2002). Global Entrepreneurship Monitor. 2002 summaryreport. Kansas City: Ewin Marion Kauffman Foundation.
Ringle, C. M., Sarstedt, M., & Straub, D. W. (2012). A critical look at the use of PLS-SEM in MIS quarterly.MIS Quarterly, 36(1), iii–xiv.
Romero, I. (2006). Las PYME en la economía global. Hacia una estrategia de fomento empresarial. Problemasdel desarrollo. Revista Latinoamericana de Economía, UNAM-IIEC, 37(146), 31–50.
Ros, M. (2002). Los valores culturales y el desarrollo socioeconómico: una comparación entre teoríasculturales. Revista Española de Investigaciones Sociológicas, 99, 9–33.
Schiffer, M., & Weder, B. (2001). Firm Size and the Business Environment: Worldwide Survey Results,Discussion Paper no. 43. Washington DC: International Finance Corporation.
Schneider, F., Buehn, A., & Montenegro, C. E. (2010). New Estimates for the Shadow Economies All Overthe World. International Economic Journal, 24(4), 443–461.
Schwartz, S. H. (1990). Individualism-Collectivism. Critique and proposed refinements. Journal of Cross-Cultural Psychology, 21(2), 139–157.
Int Entrep Manag J
Schwartz, S. H. (1992). Universals in the content and structure of values: Theoretical advances and empiricaltests in 20 countries. InM. P. Zanna (Ed.),Advances in Experimental Social Pychology (Vol. 25, pp. 1–65).New York: Academic.
Schwartz, S. H. (1994). Beyond Individualism-Collectivism: New cultural dimensions of values. In U. Kim,H. C. Triandis, C. Kagitçibasi, S. C. Choi, & G. Yoon (Eds.), Individualism and collectivism. Theory,method, and applications (pp. 85–119). Thousand Oaks: Sage.
Schwartz, S. H. (1999). Cultural value differences: some implications for work. Applied Psychology: AnInternational Review, 48, 23–48.
Schwartz, S. H. (2004). Mapping and Interpreting Cultural Differences around the World. In H. Vinken, J.Soeters, & P. Ester (Eds.), Comparing Cultures, Dimensions of Culture in a Comparative Perspective.Leiden: Brill.
Schwartz, S. H. (2006). Les valeurs de base de la personne: théorie, mesures et applications. Revue FrançaiseDe Sociologie, 47(4), 929–968.
Schwartz, S. H. (2008). Cultural value orientations: Nature and implications of national differences. Moscow:Publishing House of SU HSE.
Schwartz, S. H., & Ros, M. (1995). Values in the West: A theoretical and empirical challenge to theIndividualism-Collectivism cultural dimension. World Psychology, 1, 99–122.
Schwartz, S. H., Melech, G., Lehmann, A., Burgess, S., & Harris, M. (2001). Extending the cross-culturalvalidity of the theory of basic human values with a different method of measurement. Journal of Cross-Cultural Psychology, 32(5), 519–542.
Shane, S. (1993). Cultural Influences on National Rates of Innovation. Journal of Business Venturing, 8(1),59–73.
Tang, L., & Koveos, P. E. (2008). A framework to update Hofstede’s cultural value indices: Economicdynamics and institutional stability. Journal of International Business Studies, 39(6), 1045–1063.
Thomas, A. S., & Mueller, S. L. (2000). A case for comparative entrepreneurship: assessing the relevance ofculture. Journal of International Business Studies, 31(2), 287–301.
Tiessen, J. H. (1997). Individualism, collectivism and entrepreneurship: A framework for internationalcomparative research. Journal of Business Venturing, 12(5), 367–384.
Triandis, H. C. (1995). Individualism & collectivism (New directions in social psychology). Westview: Boulder.van Stel, A., & Storey, D. J. (2004). The Link Between Firm Births and Job Creation: Is there a Upas Tree
Effect? Regional Studies, 38(8), 893–909.van Stel, A., Carree, M., & Thurik, R. (2005). The Effect of Entrepreneurial Activity on National Economic
Growth. Small Business Economics, 24(3), 311–321. doi:10.1007/s11187-005-1996-6.Wennekers, A. R. M., Uhlaner, L. M., & Thurik, A. R. (2002). Entrepreneurship and its conditions: A macro
perspective. International Journal of Entrepreneurship Education, 1(1), 25–64.Wennekers, A. R. M., van Stel, A., Thurik, A. R., & Reynolds, P. D. (2005). Nascent Entrepreneurship and the
Level of Economic Development. Small Business Economics, 24(3), 293–309.Wennekers, A. R. M., Thurik, R., van Stel, A., & Noorderhaven, N. (2007). Uncertainty avoidance and the
rate of business ownership across 21 OECD countries, 1976–2004. Journal of Evolutionary Economics,17(2), 133–160.
Werts, C. E., Linn, R. L., & Jöreskog, K. G. (1974). Interclass Reliability Estimates: Testing StructuralAssumptions. Educational and Psychological Measurement, 34, 25–33.
World Bank. (2004). World Development Report 2005: A Better Investment Climate for Anyone. WashingtonDC: World Bank.
World Bank. (2012). Doing Business 2013. Smarter Regulations for Small and Medium-Size Enterprises.Washington DC: International Bank for Reconstruction and Development.
Int Entrep Manag J