Embed Size (px)
Citation preview
About the Egyptian Center for Economic Studies
The Egyptian Center for Economic Studies (ECES) is an independent, non-profit think tank
that conducts specialized economic research, drawing on international experience and
constructive discussions among various stakeholders. ECES’s main objective is to propose
sound economic policies, and institutional and legislative reforms that contribute to sustainable
development in Egypt, all on the basis of combined economic efficiency and social justice.
Strategic Direction
Economic efficiency and social justice are of core interest to ECES. Combined, they constitute
the Center’s strategic direction. ECES research and activities focus on studying past, present
and future challenges facing the Egyptian economy, whether they are related to macroeconomic
stability, microeconomic efficiency, or political economy aspects both on the internal and
external dimensions. In its analysis, ECES is keen on adopting a comprehensive approach that
encompasses legislative, institutional, policy and structural aspects of whatever problem or area
addressed, not to mention implementation mechanisms. In all its activities, ECES relies on its
competent team of in-house researchers, in addition to collaboration with external experts and
like-minded think tanks as needed.
About the Business Barometer
This edition of the Business Barometer reports the results of a stratified sample of 130
public and private firms. The survey covers their assessment of economic growth and
the results of their operations over the second quarter of FY 2016/2017. It also
summarizes their expectations for overall future economic performance as well as their
own activities for the third quarter of FY 2016/2017.
ECES Board of Directors Omar Mohanna, ECES Chairman, and Chairman, Suez Cement Group of Companies Mohamed Taymour, ECES Vice Chairman, and Chairman Pharos Holding Co. for Financial
Investments Tarek Zakaria Tawfik, ECES Secretary General, and Managing Director, Cairo Poultry
Group (CPG) Alaa Hashim, ECES Treasurer, and Chairman, TRANSCENDIUM Ahmed Abou Ali, Partner, Hassouna & Abou Ali Law Offices Aladdin Sabaa, Founder, Beltone Financial Holding Co. Ahmed Fikry Abdel Wahab, General Manager and CEO, EGA - Egyptian German
Automotive Hazem Hassan, Chairman, KPMG Hazem Hassan Management Consultants
Hisham El Khazindar, Co-Founder and Managing Director, Qalaa Holdings
Mohamed Kassem, Chairman, World Trading Co., Egypt Mohamed Zakaria Mohie El Din, Chairman & Managing Director, National Company for Chemical Industries – NASYDCO
ECES Staff The Center’s staff is comprised of a high-caliber and interactive team of economists,
researchers, editors and administrators. Read more about the ECES team in the following link:
http://www.eces.org.eg/Staff.aspx
Executive Management Abla Abdel Latif - Executive Director and Director of Research Magda Awadallah - Deputy Executive Director for Finance and Administration Research Department Diaa Noureddine – Advisor Mohsen Adel – Advisor* Rama Said - Senior Economist Noura Abdelwahab - Senior Economist Maye Ehab - Economist Mohamed Ali – Economist Racha Seif – Economist Khaled Wahid – Statistical Analyst* Alia Abdallah - Research Analyst Yara Helal - Research Analyst Hoda El-Abbadi - Research Analyst Hossam Khater - Research Assistant* Ahmed Fathy - Research Assistant*
Editorial and Translation Department Yasser Selim - Managing Editor Fatima Ali - Editor/ Translator Information Technology Kadry Sayed - IT Manager Ebrahim El Embaby - IT Assistant Finance and Administration Department Mohamed Leheta - Senior Accountant Amani Medhat - Executive Assistant to the Executive Director Mohamed Atef - Staff Assistant Hussein Mohamed - Support Staff Omar Mowafy - Support Staff Tarek Abdel Baky - Support Staff Waleed Ibrahim – Support Staff

* The Business Barometer research team.
Business Barometer
Issue No. 42 - 2017
Contents
Overview
Performance Indicators
Business Strategy Going Forward
Constraints Facing the Business Sector
Commentary on Survey Results
1
This edition of Business Barometer (BB) presents
the survey results of a stratified panel of 130 firms
regarding their perceptions about the performance
of the Egyptian economy and own business for the
second quarter of FY16/17 (October-December)
and their outlook for the third quarter (January-
March) of the same year, respectively. As for the
outlook, the Business Barometer Index (BBI)
witnessed a relative increase, reflecting uncertainty on
the part of the business community.
Results of exchange rate liberalization combine
negative and positive elements. The negative elements
include rising operating costs and the effect thereof on
prices. The positive elements include signs of a future
desire to increase investment in order to replace imports
or increase productivity, which requires controlling the
negative elements.
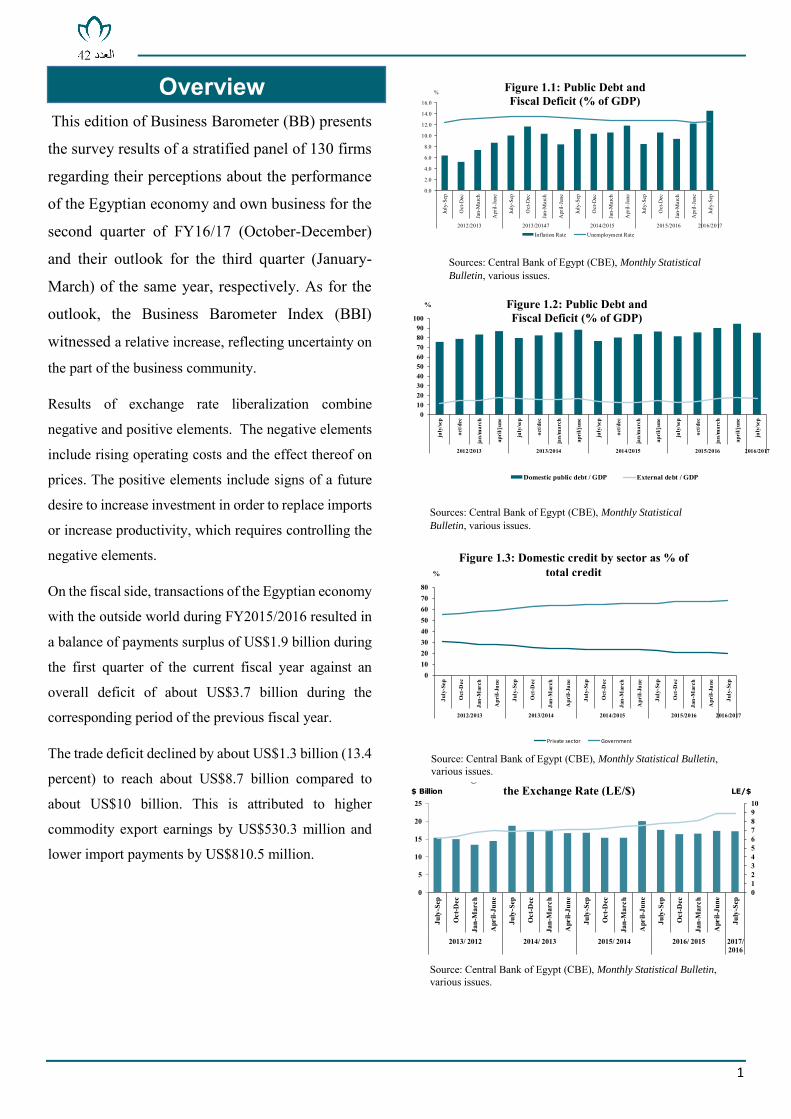
On the fiscal side, transactions of the Egyptian economy
with the outside world during FY2015/2016 resulted in
a balance of payments surplus of US$1.9 billion during
the first quarter of the current fiscal year against an
overall deficit of about US$3.7 billion during the
corresponding period of the previous fiscal year.
The trade deficit declined by about US$1.3 billion (13.4
percent) to reach about US$8.7 billion compared to
about US$10 billion. This is attributed to higher
commodity export earnings by US$530.3 million and
lower import payments by US$810.5 million.
01020304050607080
July
-Sep
Oct
-Dec
Jan-
Mar
ch
Apr
il-Ju
ne
July
-Sep
Oct
-Dec
Jan-
Mar
ch
Apr
il-Ju
ne
July
-Sep
Oct
-Dec
Jan-
Mar
ch
Apr
il-Ju
ne
July
-Sep
Oct
-Dec
Jan-
Mar
ch
Apr
il-Ju
ne
July
-Sep
2012/2013 2013/2014 2014/2015 2015/2016 2016/2017
%
Private sector Government
0102030405060708090
100
july
/sep
oct/d
ec
jan/
mar
ch
apri
l/jun
e
july
/sep
oct/d
ec
jan/
mar
ch
apri
l/jun
e
july
/sep
oct/d
ec
jan/
mar
ch
apri
l/jun
e
july
/sep
oct/d
ec
jan/
mar
ch
apri
l/jun
e
july
/sep
2012/2013 2013/2014 2014/2015 2015/2016 2016/2017
%
Domestic public debt / GDP External debt / GDP
0.0
2.0
4.0
6.0
8.0
10.0
12.0
14.0
16.0
July
-Sep
Oct
-Dec
Jan-
Mar
ch
Apr
il-Ju
ne
July
-Sep
Oct
-Dec
Jan-
Mar
ch
Apr
il-Ju
ne
July
-Sep
Oct
-Dec
Jan-
Mar
ch
Apr
il-Ju
ne
July
-Sep
Oct
-Dec
Jan-
Mar
ch
Apr
il-Ju
ne
July
-Sep
2012/2013 2013/20147 2014/2015 2015/2016 2016/2017
%
Inflation Rate Unemployment Rate
Overview Figure 1.1: Public Debt and Fiscal Deficit (% of GDP)
Sources: Central Bank of Egypt (CBE), Monthly Statistical
Bulletin, various issues.
012345678910
0
5
10
15
20
25
July
-Sep
Oct
-Dec
Jan-
Mar
ch
Apr
il-Ju
ne
July
-Sep
Oct
-Dec
Jan-
Mar
ch
Apr
il-Ju
ne
July
-Sep
Oct
-Dec
Jan-
Mar
ch
Apr
il-Ju
ne
July
-Sep
Oct
-Dec
Jan-
Mar
ch
Apr
il-Ju
ne
July
-Sep
2013/ 2012 2014/ 2013 2015/ 2014 2016/ 2015 2017/2016
LE/$$ Billion
Net International Reserves LE/$
Figure 1.4: Net International Reserves and the Exchange Rate (LE/$)
Source: Central Bank of Egypt (CBE), Monthly Statistical Bulletin, various issues.
Figure 1.2: Public Debt and Fiscal Deficit (% of GDP)
Sources: Central Bank of Egypt (CBE), Monthly Statistical
Bulletin, various issues.
Figure 1.3: Domestic credit by sector as % of total credit
Source: Central Bank of Egypt (CBE), Monthly Statistical Bulletin, various issues.
2
The services surplus narrowed by 50.2 percent, driven
by the drop in tourism revenues by 56.1 percent, to only
US$758.2 million (from US$1.7 billion). This is due to the decline in the number of tourist nights by 61.3
percent, to 9.2 million (against 23.7 million),
notwithstanding the increase in the average spending
per visitor/night from US$72.7 to US$82.5.
The budget deficit reached LE 144.4 billion (4.4 percent
of GDP) during July-November 2016, compared to LE
138.5 billion (5 percent of GDP) during the
corresponding period of the previous year.
As reported by the Ministry of Finance (MoF), total
revenues increased to LE 174.3 billion compared to LE
160.1 billion during the corresponding period of the
previous fiscal year. These developments could be
explained mainly in light of the increase in tax revenue
and non-tax revenue to LE 122.4 billion and LE 51.9
billion, respectively.
According to the MoF, total expenditures rose to LE
314.4 billion over five months compared to LE 289.4
billion during the corresponding period in the previous
fiscal year. The increase in expenditure is considered
the lowest if compared to 29 percent representing the
average over the last three fiscal years during the same
period of time, driven by the reforms implemented by
the Ministry of Finance to control the increase in
expenditures. The MoF noted that wages and
compensation of employees rose by 1.5 percent to LE
86.2 billion; purchase of goods and services increased
to LE 12.3 billion; and interest payments rose to LE
113.7 billion.
Concerning public debt, the Central Bank of Egypt
(CBE) reported that domestic public debt increased by
22 percent during the first quarter of the current fiscal
year (on an annual basis). It further noted in its monthly
report that domestic public debt amounted to LE 2.75
trillion in the three months ended in September,
compared to about LE 2.25 trillion by the end of the
corresponding period of the previous year.
Domestic debt instruments accounted for LE 2.37
trillion out of the total amount, of which Treasury bills
and bonds were auctioned at EGP 846.3 billion and LE
1.52 trillion, respectively.
The report noted that aggregate foreign investment in
Treasury bills went down to LE 989 million by the end
of October against LE 1.01 billion in last September.
Public debt rose to LE 2.61 trillion in June 2016, from
LE 2.49 trillion in March 2016.
3
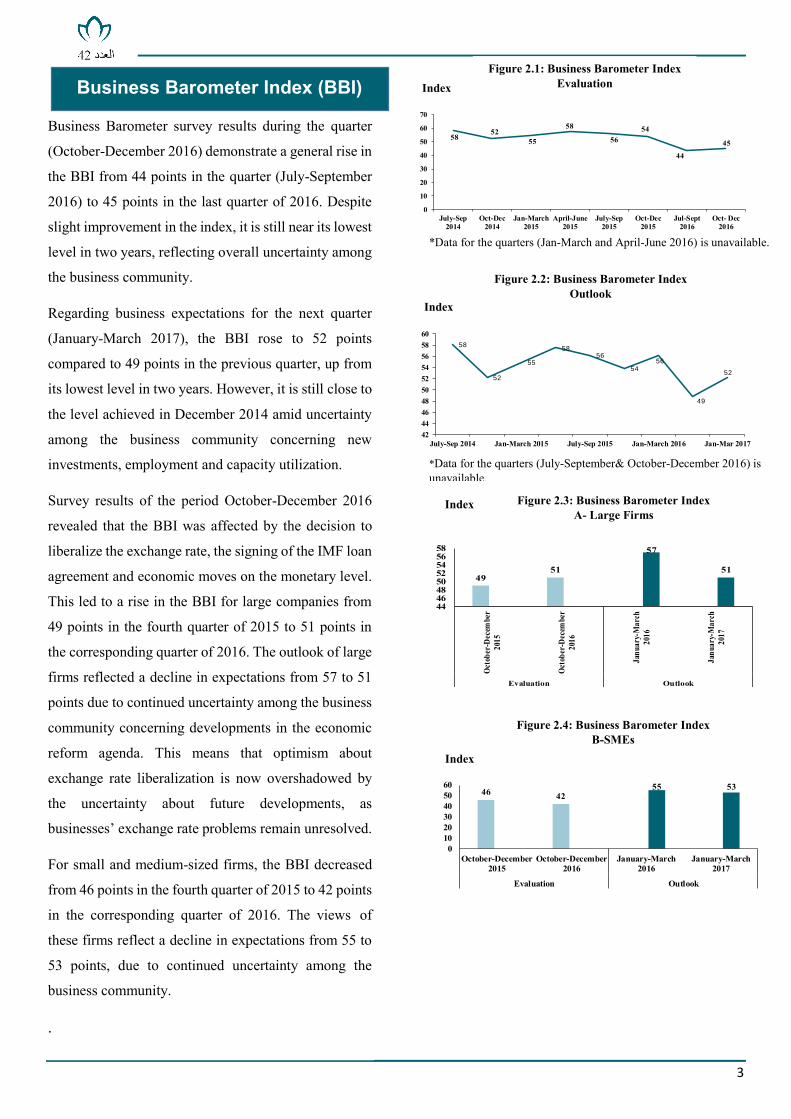
Business Barometer survey results during the quarter
(October-December 2016) demonstrate a general rise in
the BBI from 44 points in the quarter (July-September
2016) to 45 points in the last quarter of 2016. Despite
slight improvement in the index, it is still near its lowest
level in two years, reflecting overall uncertainty among
the business community.
Regarding business expectations for the next quarter
(January-March 2017), the BBI rose to 52 points
compared to 49 points in the previous quarter, up from
its lowest level in two years. However, it is still close to
the level achieved in December 2014 amid uncertainty
among the business community concerning new
investments, employment and capacity utilization.
Survey results of the period October-December 2016
revealed that the BBI was affected by the decision to
liberalize the exchange rate, the signing of the IMF loan
agreement and economic moves on the monetary level.
This led to a rise in the BBI for large companies from
49 points in the fourth quarter of 2015 to 51 points in
the corresponding quarter of 2016. The outlook of large
firms reflected a decline in expectations from 57 to 51
points due to continued uncertainty among the business
community concerning developments in the economic
reform agenda. This means that optimism about
exchange rate liberalization is now overshadowed by
the uncertainty about future developments, as
businesses’ exchange rate problems remain unresolved.
For small and medium-sized firms, the BBI decreased
from 46 points in the fourth quarter of 2015 to 42 points
in the corresponding quarter of 2016. The views of
these firms reflect a decline in expectations from 55 to
53 points, due to continued uncertainty among the
business community.
.
Business Barometer Index (BBI) Figure 2.1: Business Barometer Index
Evaluation
5852
55
58
5654
44
45
0
10
20
30
40
50
60
70
July-Sep2014
Oct-Dec2014
Jan-March2015
April-June2015
July-Sep2015
Oct-Dec2015
Jul-Sept2016
Oct- Dec2016
Index
58
52
55
5856
5456
49
52
42444648505254565860
July-Sep 2014 Jan-March 2015 July-Sep 2015 Jan-March 2016 Jan-Mar 2017
Index
4951
57
51
4446485052545658
Octo
ber-
Dece
mbe
r20
15
Octo
ber-
Dece
mbe
r20
16
Janu
ary-
Mar
ch20
16
Janu
ary-
Mar
ch20
17
Evaluation Outlook
Figure 2.2: Business Barometer Index Outlook
Figure 2.3: Business Barometer Index A- Large Firms
Index
46 4255 53
0102030405060
October-December2015
October-December2016
January-March2016
January-March2017
Evaluation Outlook
Figure 2.4: Business Barometer Index B-SMEs
Index
Index
Index
*Data for the quarters (Jan-March and April-June 2016) is unavailable.
*Data for the quarters (July-September& October-December 2016) is unavailable.
4
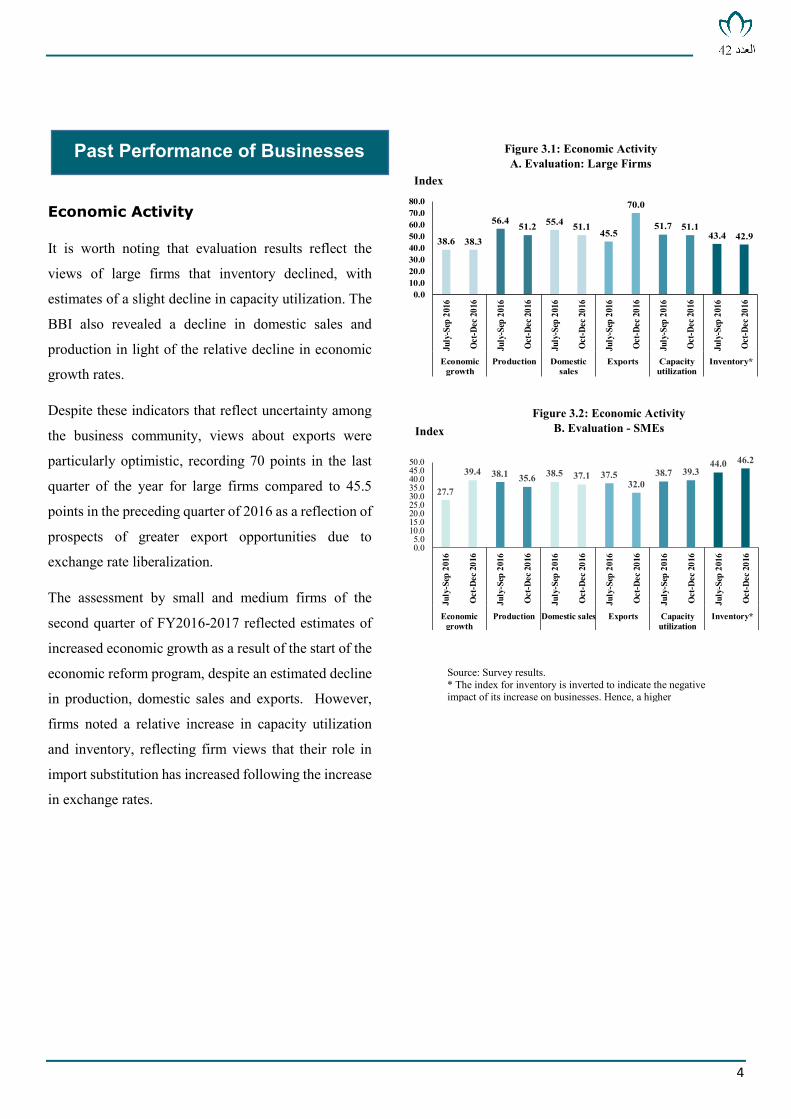
Economic Activity
It is worth noting that evaluation results reflect the
views of large firms that inventory declined, with
estimates of a slight decline in capacity utilization. The
BBI also revealed a decline in domestic sales and
production in light of the relative decline in economic
growth rates.
Despite these indicators that reflect uncertainty among
the business community, views about exports were
particularly optimistic, recording 70 points in the last
quarter of the year for large firms compared to 45.5
points in the preceding quarter of 2016 as a reflection of
prospects of greater export opportunities due to
exchange rate liberalization.
The assessment by small and medium firms of the
second quarter of FY2016-2017 reflected estimates of
increased economic growth as a result of the start of the
economic reform program, despite an estimated decline
in production, domestic sales and exports. However,
firms noted a relative increase in capacity utilization
and inventory, reflecting firm views that their role in
import substitution has increased following the increase
in exchange rates.
27.7
39.4 38.1 35.6 38.5 37.1 37.532.0
38.7 39.344.0 46.2
0.05.0
10.015.020.025.030.035.040.045.050.0
July
-Sep
201
6
Oct
-Dec
201
6
July
-Sep
201
6
Oct
-Dec
201
6
July
-Sep
201
6
Oct
-Dec
201
6
July
-Sep
201
6
Oct
-Dec
201
6
July
-Sep
201
6
Oct
-Dec
201
6
July
-Sep
201
6
Oct
-Dec
201
6
Economicgrowth
Production Domestic sales Exports Capacityutilization
Inventory*
Past Performance of Businesses
Figure 3.2: Economic Activity B. Evaluation - SMEs
Index
38.6 38.3
56.4 51.2 55.4 51.145.5
70.0
51.7 51.143.4 42.9
0.010.020.030.040.050.060.070.080.0
July
-Sep
201
6
Oct
-Dec
201
6
July
-Sep
201
6
Oct
-Dec
201
6
July
-Sep
201
6
Oct
-Dec
201
6
July
-Sep
201
6
Oct
-Dec
201
6
July
-Sep
201
6
Oct
-Dec
201
6
July
-Sep
201
6
Oct
-Dec
201
6
Economicgrowth
Production Domesticsales
Exports Capacityutilization
Inventory*
Figure 3.1: Economic Activity A. Evaluation: Large Firms
Index
Source: Survey results. * The index for inventory is inverted to indicate the negative impact of its increase on businesses. Hence, a higher inventory index indicates lower inventory.
5
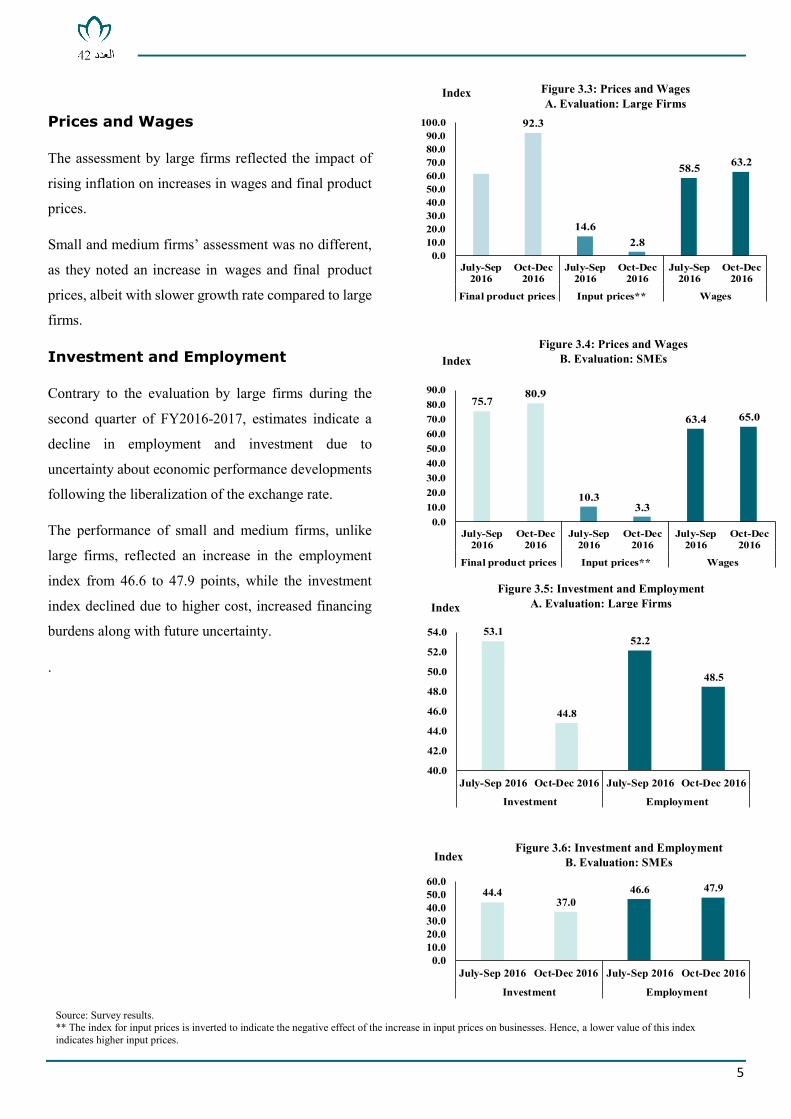
Prices and Wages
The assessment by large firms reflected the impact of
rising inflation on increases in wages and final product
prices.
Small and medium firms’ assessment was no different,
as they noted an increase in wages and final product
prices, albeit with slower growth rate compared to large
firms.
Investment and Employment
Contrary to the evaluation by large firms during the
second quarter of FY2016-2017, estimates indicate a
decline in employment and investment due to
uncertainty about economic performance developments
following the liberalization of the exchange rate.
The performance of small and medium firms, unlike
large firms, reflected an increase in the employment
index from 46.6 to 47.9 points, while the investment
index declined due to higher cost, increased financing
burdens along with future uncertainty.
.
92.3
14.62.8
58.5 63.2
0.010.020.030.040.050.060.070.080.090.0
100.0
July-Sep2016
Oct-Dec2016
July-Sep2016
Oct-Dec2016
July-Sep2016
Oct-Dec2016
Final product prices Input prices** Wages
75.780.9
10.33.3
63.4 65.0
0.010.020.030.040.050.060.070.080.090.0
July-Sep2016
Oct-Dec2016
July-Sep2016
Oct-Dec2016
July-Sep2016
Oct-Dec2016
Final product prices Input prices** Wages
Figure 3.3: Prices and Wages A. Evaluation: Large Firms
Index
Figure 3.4: Prices and Wages B. Evaluation: SMEs Index
Figure 3.5: Investment and Employment A. Evaluation: Large Firms
Index
53.1
44.8
52.2
48.5
40.0
42.0
44.0
46.0
48.0
50.0
52.0
54.0
July-Sep 2016 Oct-Dec 2016 July-Sep 2016 Oct-Dec 2016
Investment Employment
44.437.0
46.6 47.9
0.010.020.030.040.050.060.0
July-Sep 2016 Oct-Dec 2016 July-Sep 2016 Oct-Dec 2016
Investment Employment
Figure 3.6: Investment and Employment B. Evaluation: SMEs Index
Source: Survey results. ** The index for input prices is inverted to indicate the negative effect of the increase in input prices on businesses. Hence, a lower value of this index indicates higher input prices.
6
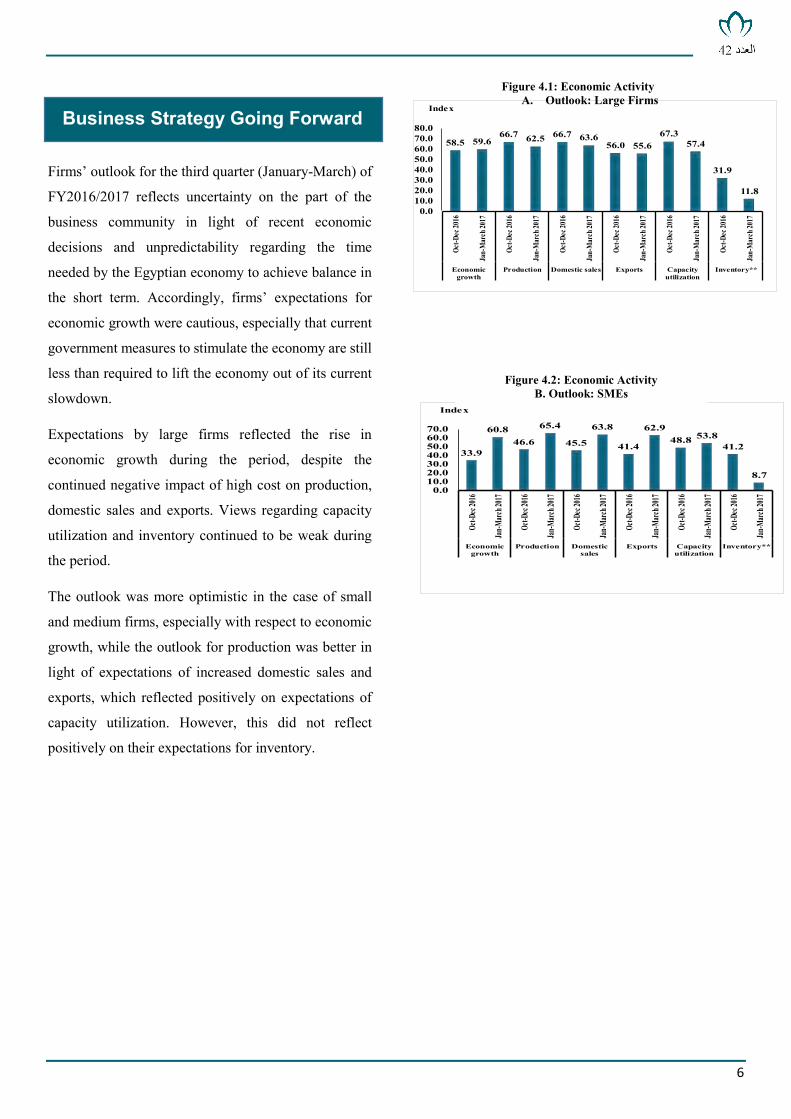
Firms’ outlook for the third quarter (January-March) of
FY2016/2017 reflects uncertainty on the part of the
business community in light of recent economic
decisions and unpredictability regarding the time
needed by the Egyptian economy to achieve balance in
the short term. Accordingly, firms’ expectations for
economic growth were cautious, especially that current
government measures to stimulate the economy are still
less than required to lift the economy out of its current
slowdown.
Expectations by large firms reflected the rise in
economic growth during the period, despite the
continued negative impact of high cost on production,
domestic sales and exports. Views regarding capacity
utilization and inventory continued to be weak during
the period.
The outlook was more optimistic in the case of small
and medium firms, especially with respect to economic
growth, while the outlook for production was better in
light of expectations of increased domestic sales and
exports, which reflected positively on expectations of
capacity utilization. However, this did not reflect
positively on their expectations for inventory.
33.9
60.846.6
65.4
45.5
63.8
41.4
62.948.8 53.8
41.2
8.7
0.010.020.030.040.050.060.070.0
Oct-D
ec 20
16
Jan-M
arch 2
017
Oct-D
ec 20
16
Jan-M
arch 2
017
Oct-D
ec 20
16
Jan-M
arch 2
017
Oct-D
ec 20
16
Jan-M
arch 2
017
Oct-D
ec 20
16
Jan-M
arch 2
017
Oct-D
ec 20
16
Jan-M
arch 2
017
Economicgrowth
Production Domesticsales
Exports Capacityutilization
Inventory**
Index
58.5 59.666.7 62.5 66.7 63.6
56.0 55.667.3
57.4
31.9
11.8
0.010.020.030.040.050.060.070.080.0
Oct-D
ec 20
16
Jan-
Mar
ch 20
17
Oct-D
ec 20
16
Jan-
Mar
ch 20
17
Oct-D
ec 20
16
Jan-
Mar
ch 20
17
Oct-D
ec 20
16
Jan-
Mar
ch 20
17
Oct-D
ec 20
16
Jan-
Mar
ch 20
17
Oct-D
ec 20
16
Jan-
Mar
ch 20
17
Economicgrowth
Production Domestic sales Exports Capacityutilization
Inventory**
IndexBusiness Strategy Going Forward
Figure 4.1: Economic Activity A. Outlook: Large Firms
Figure 4.2: Economic Activity B. Outlook: SMEs
7
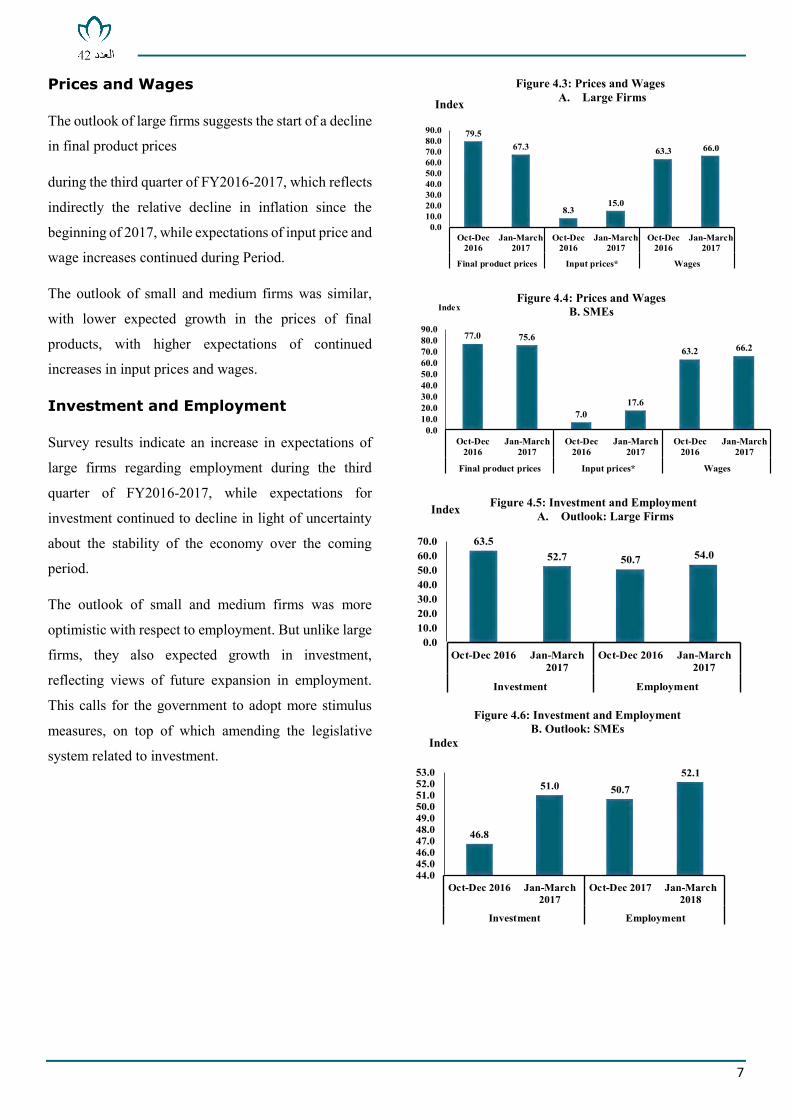
Prices and Wages
The outlook of large firms suggests the start of a decline
in final product prices
during the third quarter of FY2016-2017, which reflects
indirectly the relative decline in inflation since the
beginning of 2017, while expectations of input price and
wage increases continued during Period.
The outlook of small and medium firms was similar,
with lower expected growth in the prices of final
products, with higher expectations of continued
increases in input prices and wages.
Investment and Employment
Survey results indicate an increase in expectations of
large firms regarding employment during the third
quarter of FY2016-2017, while expectations for
investment continued to decline in light of uncertainty
about the stability of the economy over the coming
period.
The outlook of small and medium firms was more
optimistic with respect to employment. But unlike large
firms, they also expected growth in investment,
reflecting views of future expansion in employment.
This calls for the government to adopt more stimulus
measures, on top of which amending the legislative
system related to investment.
77.0 75.6
7.017.6
63.2 66.2
0.010.020.030.040.050.060.070.080.090.0
Oct-Dec2016
Jan-March2017
Oct-Dec2016
Jan-March2017
Oct-Dec2016
Jan-March2017
Final product prices Input prices* Wages
Index
79.567.3
8.315.0
63.3 66.0
0.010.020.030.040.050.060.070.080.090.0
Oct-Dec2016
Jan-March2017
Oct-Dec2016
Jan-March2017
Oct-Dec2016
Jan-March2017
Final product prices Input prices* Wages
Index
Figure 4.3: Prices and Wages A. Large Firms
Figure 4.4: Prices and Wages B. SMEs
63.552.7 50.7 54.0
0.010.020.030.040.050.060.070.0
Oct-Dec 2016 Jan-March2017
Oct-Dec 2016 Jan-March2017
Investment Employment
IndexFigure 4.5: Investment and Employment
A. Outlook: Large Firms
Figure 4.6: Investment and Employment B. Outlook: SMEs
46.8
51.0 50.752.1
44.045.046.047.048.049.050.051.052.053.0
Oct-Dec 2016 Jan-March2017
Oct-Dec 2017 Jan-March2018
Investment Employment
Index
Index
Index
Index
8
The sector’s indicators, compared to the other sectors of
the economy for the whole sample of firms (October –
November - December 2016), reflect a decline in
growth and economic activity expectations, especially
that it was the most affected sector by cost increases as
a result of liberalization of exchange rate. This was
reflected on estimates of decreased production in light
of the increase in the marginal cost of products, with
estimates of lower domestic sales and exports during the
period as a result of uncertainty regarding economic
policy developments.
The manufacturing sector expected the least increase in
employment during the period in light of the high
operating cost, slowdown in domestic consumption and
the high foreign content in many industries, weakening
export growth rates. Across sectors, the manufacturing
sector expected the least investment due to the high cost
of financing, production inputs, and machinery and
equipment. Add to this the lack of provision of
incentives to promote investment in the sector and
failure to address the problems dogging the industry,
including licensing, approvals, land allocation, and
rising energy costs.
Compared to the whole sample of firms at the sectoral
level (January - February - March 2017), the sector’s
expectations continued in the same direction, albeit with
a relative expected improvement in investment and
employment during the period.
Addressing the declining industry indicators requires
the Ministry of Industry to identify idle production
capacities in different sectors. It also requires launching
an integrated program for employment and upgrading
unutilized production capacities through entering into
international agreements that facilitate the transfer of
technology, particularly with China, Russia and the
European Union, with concessional credit drawn from
these sources. It is also important to complete the
investment plan of the state, which will help identify the
sectors and industries that need to be incentivized over
the coming period.
In addition, it is important to finalize the industrial
licensing law, the unified land law, and the investment
law as well as to encourage the banking sector to finance
working capital and investments in this sector at a
reasonable cost.
The Manufacturing Sector’s
9
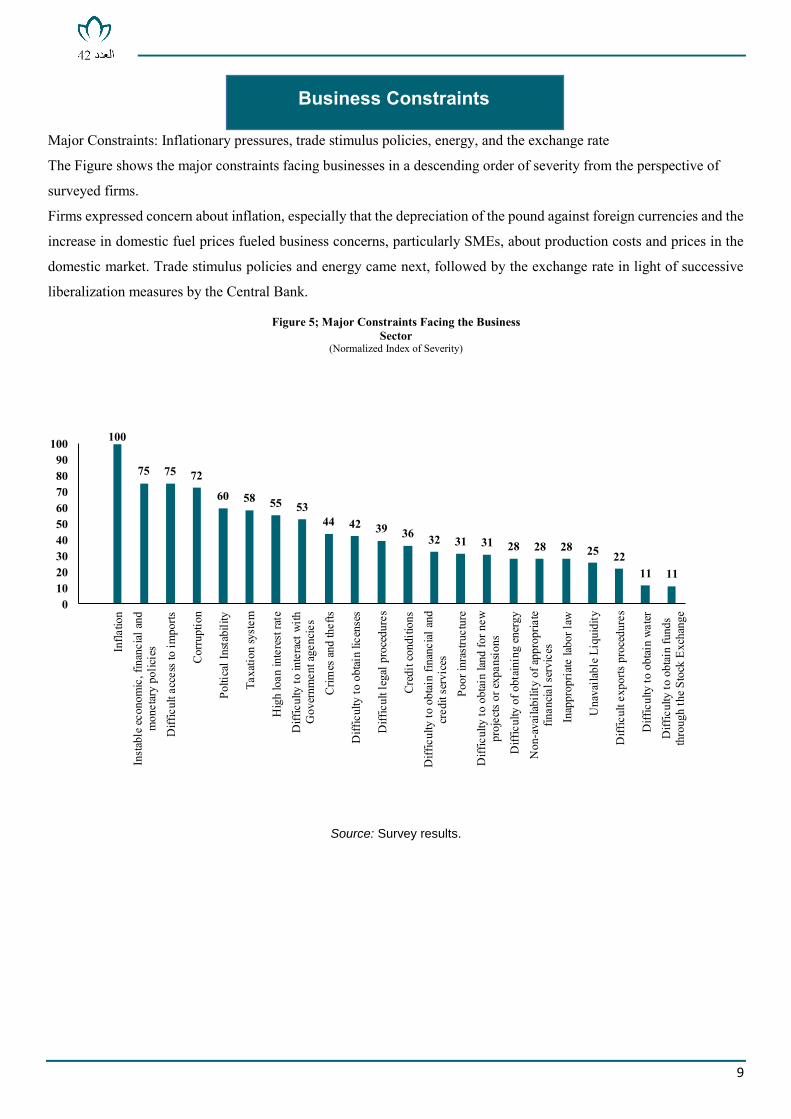
Major Constraints: Inflationary pressures, trade stimulus policies, energy, and the exchange rate
The Figure shows the major constraints facing businesses in a descending order of severity from the perspective of
surveyed firms.
Firms expressed concern about inflation, especially that the depreciation of the pound against foreign currencies and the
increase in domestic fuel prices fueled business concerns, particularly SMEs, about production costs and prices in the
domestic market. Trade stimulus policies and energy came next, followed by the exchange rate in light of successive
liberalization measures by the Central Bank.
Source: Survey results.
100
75 75 72
60 58 55 5344 42 39 36 32 31 31 28 28 28 25 22
11 11
0102030405060708090
100
Infla
tion
Insta
ble e
cono
mic
, fin
anci
al an
dm
onet
ary
polic
ies
Diff
icul
t acc
ess t
o im
ports
Cor
rupt
ion
Polti
cal I
nsta
bilit
y
Taxa
tion
syst
em
Hig
h lo
an in
tere
st ra
teD
iffic
ulty
to in
tera
ct w
ithG
over
nmen
t age
ncie
sC
rimes
and
thef
ts
Diff
icul
ty to
obt
ain
licen
ses
Diff
icul
t leg
al p
roce
dure
s
Cre
dit c
ondi
tions
Diff
icul
ty to
obt
ain
finan
cial
and
cred
it se
rvic
esPo
or in
rast
ruct
ure
Diff
icul
ty to
obt
ain
land
for n
ewpr
ojec
ts or
expa
nsio
nsD
iffic
ulty
of o
btai
ning
ene
rgy
Non
-ava
ilabi
lity
of a
ppro
pria
tefin
ancia
l ser
vice
sIn
appr
opria
te la
bor l
aw
Una
vaila
ble
Liqu
idity
Diff
icul
t exp
orts
pro
cedu
res
Diff
icul
ty to
obt
ain
wat
erD
iffic
ulty
to o
btai
n fu
nds
thro
ugh
the
Stoc
k E
xcha
nge
Business Constraints
Figure 5; Major Constraints Facing the Business Sector
(Normalized Index of Severity)
10
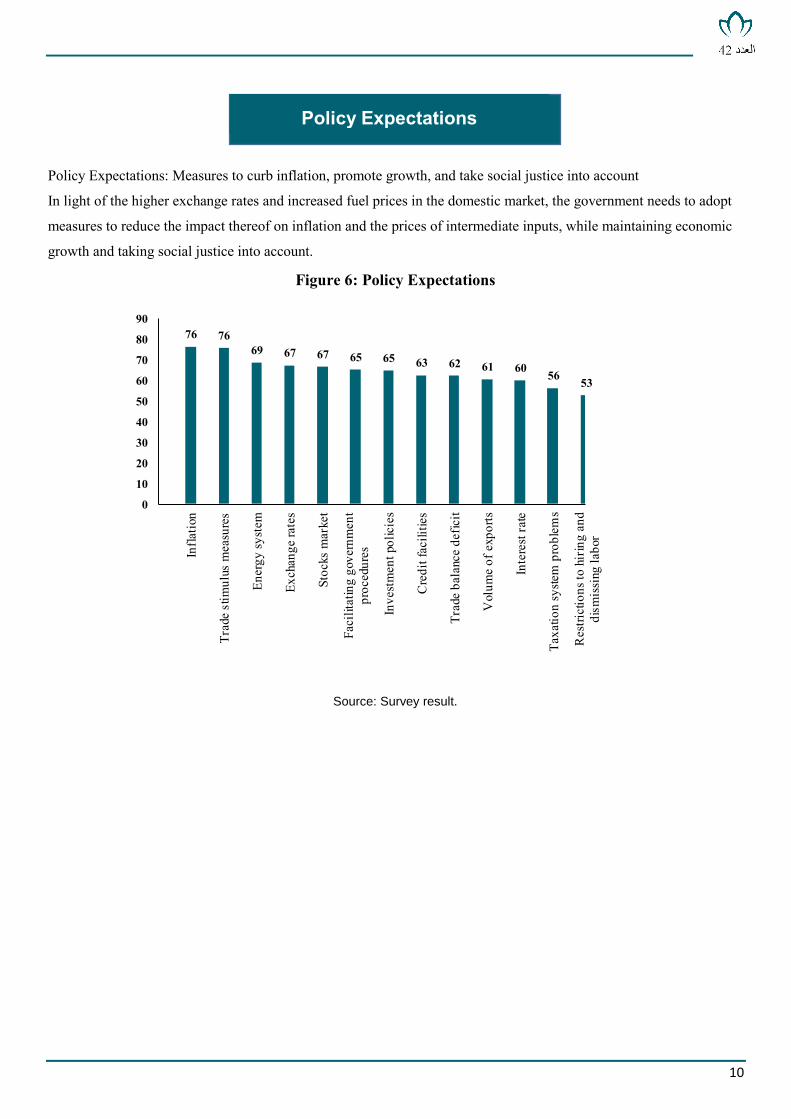
Policy Expectations: Measures to curb inflation, promote growth, and take social justice into account
In light of the higher exchange rates and increased fuel prices in the domestic market, the government needs to adopt
measures to reduce the impact thereof on inflation and the prices of intermediate inputs, while maintaining economic
growth and taking social justice into account.
Policy Expectations
Figure 6: Policy Expectations
Source: Survey result.
76 7669 67 67 65 65 63 62 61 60 56 53
0
10
20
30
40
50
60
70
80
90
Infla
tion
Trad
e st
imul
us m
easu
res
Ener
gy sy
stem
Exch
ange
rate
s
Stoc
ks m
arke
t
Faci
litat
ing
gove
rnm
ent
proc
edur
es
Inve
stm
ent p
olic
ies
Cre
dit f
acili
ties
Trad
e ba
lanc
e de
ficit
Vol
ume
of e
xpor
ts
Inte
rest
rate
Taxa
tion
syste
m p
robl
ems
Res
trict
ions
to h
irin
g an
ddi
smis
sing
labo
r
11
Despite the varying indicators, the exchange rate liberalization and the adoption of a strong economic reform program
still reflect optimism in the medium and long terms. We see signs of improved confidence in economic growth
potential, even if these signs are temporary and subject to government’s commitment to a comprehensive economic
reform program that includes stimulus policies.
However, survey results still point out the need to boost external demand through measures such as export
development, attracting more investments and addressing investment climate problems in light of the current
fluctuations in foreign currency rates, which are expected to continue until the end of the third quarter of
FY2016/2017. Stability in foreign currency rates is a prerequisite for achieving economic stability, especially that
further inflationary pressures may lead to more government deflationary policies.
Also, improving the legislative infrastructure of the economic environment would improve economic performance,
especially if substantive measures are taken to reform the tax and industrial licensing systems; modify the investment
law and land allocation mechanisms; and issue a law to regulate and stimulate the SMEs sector.
Egypt’s economic policy is in need of urgent rebalancing. The existing risks are due to unusually low productivity
growth, which reflects negatively on possible improvements in living standards in the future. Domestic and external
debt levels are historically high, posing risks to financial stability. Further, the room for maneuver on the monetary
front is notably tight.
Hence, the Egyptian economy requires substantive changes in the direction of both fiscal and monetary policies. It
also needs redesigning fiscal policy to cope with the boom-bust cycles in a more systematic manner, and that
monetary policy monitor those cycles in terms of overall risk with a view to maintaining financial balance.
Appendix Following an elaboration of the methodology used in calculating the index, this appendix will present tables
that give a numerical representation of survey results.
Methodology of the Index
The index aims at calculating a single figure for the responses of firms on each variable.
The index’s equation is: where I is the share of firms reporting an increase and S the share of firms report ing same. The index is designed to have a maximum of 100 when all firms report an increase, a minimum of 0 when all firms
report a decrease and a middle value of 50 when all firms report no change. Between 0 and 100, the index grows
proportionally with larger shares of “increase,” and inversely with larger shares of “decrease,” while the change in
“same” is given less effect by including it in the numerator and the denominator. A higher index thus reflects a better
business climate and vice versa. It is worth noting that the index is inverted for inventories and input prices as
increases of these two variables reflect an adverse business climate for firms.
The Business Environment Index is a simple average of the variables’ indexes, calculated once for large firms and
once for SMEs, both for evaluations and expectations.
Commentary on Survey Results
12
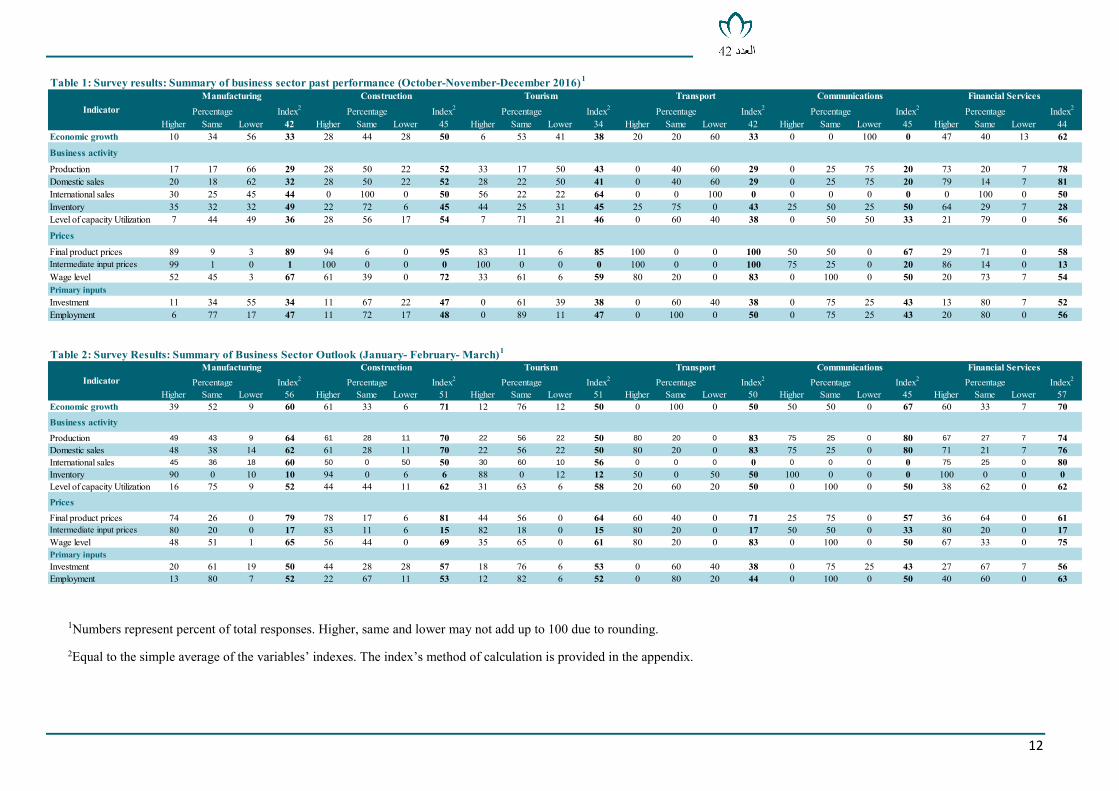
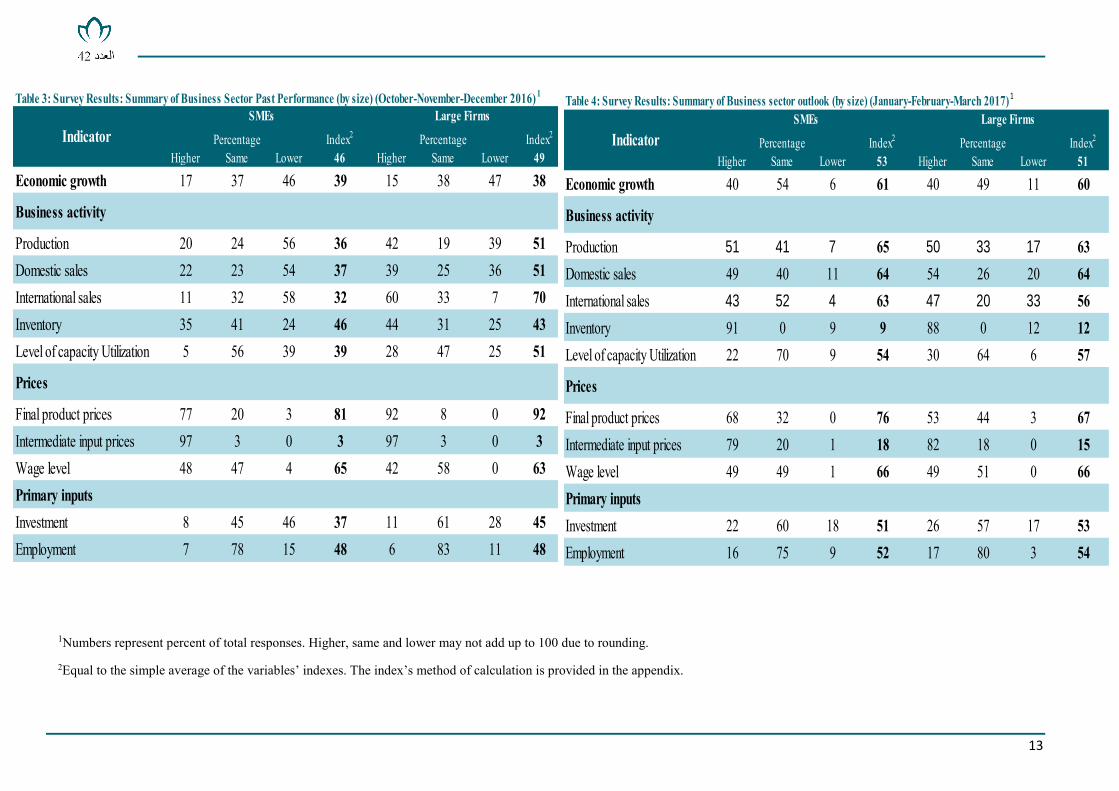
1Numbers represent percent of total responses. Higher, same and lower may not add up to 100 due to rounding.
2Equal to the simple average of the variables’ indexes. The index’s method of calculation is provided in the appendix.
Index2 Index2 Index2 Index2 Index2 Index2
Higher Same Lower 42 Higher Same Lower 45 Higher Same Lower 34 Higher Same Lower 42 Higher Same Lower 45 Higher Same Lower 44 Economic growth 10 34 56 33 28 44 28 50 6 53 41 38 20 20 60 33 0 0 100 0 47 40 13 62
Business activity
Production 17 17 66 29 28 50 22 52 33 17 50 43 0 40 60 29 0 25 75 20 73 20 7 78Domestic sales 20 18 62 32 28 50 22 52 28 22 50 41 0 40 60 29 0 25 75 20 79 14 7 81International sales 30 25 45 44 0 100 0 50 56 22 22 64 0 0 100 0 0 0 0 0 0 100 0 50Inventory 35 32 32 49 22 72 6 45 44 25 31 45 25 75 0 43 25 50 25 50 64 29 7 28Level of capacity Utilization 7 44 49 36 28 56 17 54 7 71 21 46 0 60 40 38 0 50 50 33 21 79 0 56
Prices
Final product prices 89 9 3 89 94 6 0 95 83 11 6 85 100 0 0 100 50 50 0 67 29 71 0 58Intermediate input prices 99 1 0 1 100 0 0 0 100 0 0 0 100 0 0 100 75 25 0 20 86 14 0 13Wage level 52 45 3 67 61 39 0 72 33 61 6 59 80 20 0 83 0 100 0 50 20 73 7 54Primary inputsInvestment 11 34 55 34 11 67 22 47 0 61 39 38 0 60 40 38 0 75 25 43 13 80 7 52Employment 6 77 17 47 11 72 17 48 0 89 11 47 0 100 0 50 0 75 25 43 20 80 0 56
Table 1: Survey results: Summary of business sector past performance (October-November-December 2016)1
IndicatorFinancial Services
Percentage Percentage Percentage Percentage Percentage PercentageManufacturing Construction Tourism Transport Communications
Table 2: Survey Results: Summary of Business Sector Outlook (January- February- March)1
Index2 Index2 Index2 Index2 Index2 Index2
Higher Same Lower 56 Higher Same Lower 51 Higher Same Lower 51 Higher Same Lower 50 Higher Same Lower 45 Higher Same Lower 57 Economic growth 39 52 9 60 61 33 6 71 12 76 12 50 0 100 0 50 50 50 0 67 60 33 7 70
Business activity
Production 49 43 9 64 61 28 11 70 22 56 22 50 80 20 0 83 75 25 0 80 67 27 7 74Domestic sales 48 38 14 62 61 28 11 70 22 56 22 50 80 20 0 83 75 25 0 80 71 21 7 76International sales 45 36 18 60 50 0 50 50 30 60 10 56 0 0 0 0 0 0 0 0 75 25 0 80Inventory 90 0 10 10 94 0 6 6 88 0 12 12 50 0 50 50 100 0 0 0 100 0 0 0Level of capacity Utilization 16 75 9 52 44 44 11 62 31 63 6 58 20 60 20 50 0 100 0 50 38 62 0 62
Prices
Final product prices 74 26 0 79 78 17 6 81 44 56 0 64 60 40 0 71 25 75 0 57 36 64 0 61Intermediate input prices 80 20 0 17 83 11 6 15 82 18 0 15 80 20 0 17 50 50 0 33 80 20 0 17Wage level 48 51 1 65 56 44 0 69 35 65 0 61 80 20 0 83 0 100 0 50 67 33 0 75Primary inputsInvestment 20 61 19 50 44 28 28 57 18 76 6 53 0 60 40 38 0 75 25 43 27 67 7 56Employment 13 80 7 52 22 67 11 53 12 82 6 52 0 80 20 44 0 100 0 50 40 60 0 63
Communications Financial ServicesPercentage Percentage Percentage Percentage Percentage Percentage
TransportIndicator
Manufacturing Construction Tourism
13
Index2 Index2
Higher Same Lower 46 Higher Same Lower 49
Economic growth 17 37 46 39 15 38 47 38
Business activity
Production 20 24 56 36 42 19 39 51Domestic sales 22 23 54 37 39 25 36 51International sales 11 32 58 32 60 33 7 70Inventory 35 41 24 46 44 31 25 43Level of capacity Utilization 5 56 39 39 28 47 25 51
Prices
Final product prices 77 20 3 81 92 8 0 92Intermediate input prices 97 3 0 3 97 3 0 3Wage level 48 47 4 65 42 58 0 63Primary inputsInvestment 8 45 46 37 11 61 28 45Employment 7 78 15 48 6 83 11 48
Table 3: Survey Results: Summary of Business Sector Past Performance (by size) (October-November-December 2016) 1
IndicatorSMEs Large Firms
Percentage Percentage Index2 Index2
Higher Same Lower 53 Higher Same Lower 51
Economic growth 40 54 6 61 40 49 11 60
Business activity
Production 51 41 7 65 50 33 17 63Domestic sales 49 40 11 64 54 26 20 64International sales 43 52 4 63 47 20 33 56Inventory 91 0 9 9 88 0 12 12Level of capacity Utilization 22 70 9 54 30 64 6 57
Prices
Final product prices 68 32 0 76 53 44 3 67Intermediate input prices 79 20 1 18 82 18 0 15Wage level 49 49 1 66 49 51 0 66Primary inputsInvestment 22 60 18 51 26 57 17 53Employment 16 75 9 52 17 80 3 54
Table 4: Survey Results: Summary of Business sector outlook (by size) (January-February-March 2017)1
IndicatorSMEs Large Firms
Percentage Percentage
1Numbers represent percent of total responses. Higher, same and lower may not add up to 100 due to rounding.
2Equal to the simple average of the variables’ indexes. The index’s method of calculation is provided in the appendix.