Embed Size (px)
Citation preview
Consumers’ knowledge
about the determinants fo a
sustainable diet
Deliverable No. 2.1
Emily Bouwman, Muriel Verain, and
Harriëtte Snoek (Wageningen
Economic Research)
The deliverable will report on Task 2.1.
Drawing on the results of a web-survey,
it will discuss the importance of
incorporating national and regional
habits into metrics and models for the
SFNS diet.
Version Release date Changed Status Distribution V1 19/09/2016 -
This project has received funding from the European Union’s Horizon 2020
research and innovation programme under grant agreement No 633692.

SUSFANS
Report No. 2.1
SUSFANS DELIVERABLE
Document information Project name SUSFANS
Project title: Metrics, Models and Foresight for European
SUStainable Food And Nutrition Security
Project no 633692
Start date: April 2015
Report:
D2.1 Analysis of the web-survey on consumers’
knowledge about nutrition, environment and
the importance of relevant determinants
Work package WP 2
WP title (acronym): Drivers and data: food consumption and diets
WP leader: INRA, Stéphan Marette
Period, year: Month 18; September, 2016
Responsible Authors: Emily Bouwman, Muriel Verain, Harriëtte Snoek
Participant acronyms: WUR
Dissemination level: Public
Version V1
Release Date 16-09-2016
Planned delivery date: 30-09-2016
Status Internal review
Distribution
Dissemination level of this report Public
SUSFANS
Report No. 2.1
ACKNOWLEDGMENT & DISCLAIMER This research leading to these results has received funding from the European
Union’s Horizon 2020 research and innovation programme under grant agreement No 633692 (SUSFANS). Neither the European Commission nor any person acting on behalf of the Commission is responsible for how the following information is used. The views expressed in this publication are the sole responsibility of the author and do not necessarily reflect the views of the European Commission.
Reproduction and translation for non-commercial purposes are authorised,
provided the source is acknowledged and the publisher is given prior notice and sent a copy.

SUSFANS
Report No. 2.1
Table of Content
Abstract ......................................................................................................... 5 Introduction .................................................................................................... 6
Aim ........................................................................................................... 6 Sustainable food consumption ........................................................................... 6 Determinants of food choices ............................................................................ 7 Content ...................................................................................................... 7
Method ......................................................................................................... 8 Procedure and respondents .............................................................................. 8 Measures .................................................................................................... 8
Results ......................................................................................................... 14 Preparatory analyses and sample demographics ..................................................... 14 Sustainable and healthy (food) behaviour ............................................................. 14 Sustainable food specific underlying values, motives, etc. .......................................... 25 Explaining sustainable consumption behaviour ...................................................... 33
Conclusion and general discussion ........................................................................ 36 Summary of the main results and their implications ................................................. 36 Drivers of change .......................................................................................... 38 Discussion: limitations of the study ..................................................................... 39 Conclusion .................................................................................................. 40
References ..................................................................................................... 41 Annexes ........................................................................................................ 43
Annex I Demographic characteristics of the sample ................................................. 43 Annex II Regressions on openness to different categories of meat alternatives ................. 45
SUSFANS
Report No. 2.1
Abstract
Background. The aim of the survey is to determine sustainable food behaviour from a consumer perspective, to get insights in consumer perceptions of sustainability, to measure determinants of sustainable food behaviour and to
identify similarities and differences across European countries. The goal of identifying such determinants is to find out which behaviour consumers are willing to change under which conditions and translate this into metrics and models for a sustainable and healthy diet.
Methods. In this study we conducted a web-survey among 5043 respondents in total from 5 countries (The Netherlands, Denmark, Czech Republic, France,
Italy). Respondents were retrieved from existing consumer panels and roughly equally distributed over countries. The sample was representative for age, gender, degree of urbanisation and education level.
Results. The data suggest that important aspects of consumer perceptions of sustainable food consumption are: seasonal fruits and vegetables, food waste, water use and use of natural resources. Self-reported intake of sustainable foods shows that seasonal/local food was the most frequent sustainable food
behaviour, followed by free range products/products with a sustainability logo/smaller portions, followed by organic/fair trade products, and least frequently vegetarian products. When they were asked about replacers of meat, the respondents were most open to animal-based products (fish, cheese and eggs), to which they are, on average, moderately open. The second favourite
alternative are plant-based products to which they are, on average, not so open. Consumers are least open to new products like insects or in vitro meat. Overall, consumers are, on average, not really conscious when it comes to sustainable consumption. Within domains of sustainable consumption, consumers are most conscious about sustainable consumption from an economic viewpoint (caring
for long-term economic and personal well-being), followed by the social viewpoint (maximize beneficial impact on society) and least conscious about sustainable consumption from an environmental viewpoint (including recycling, packaging , resources and energy, local production, climate). Country, demographics, general and specific psychographic, and food choice motives are all important determinants of openness to meat alternatives.
Conclusion. The results give us insight in how consumers see sustainable food
behaviour and to what degree they perform sustainable behaviours. We see that consumers are not really conscious about sustainable consumption. When we look at domains within sustainable consumption, results show that consumers are most conscious about sustainable consumption from an economic viewpoint compared to a social or environmental viewpoint. Results also show that
consumers have a positive attitude and a neutral interest in sustainable consumption which suggests they might be somewhat willing to change towards
SUSFANS
Report No. 2.1
sustainable food consumption. Consumers’ most frequent sustainable consumption behaviour is eating seasonal/local food and eating free range products/products with a sustainability logo/smaller portions. In terms of openness to alternatives for meat, animal-based products are most popular. The
degree to which consumers are open to sustainable food depends on their demographic as well as psychographic characteristics.
Introduction
Aim The overall aim of SUSFANS is to strengthen food and nutrition security in Europe, by advising food policy makers regarding healthy and sustainable food production and consumption. Work package 2 contributes to this aim by providing a better understanding of consumers’ drivers of dietary change and
their responses to dietary recommendations regarding sustainable and health food consumption. Recommendations for improvement of dietary patterns will only be effective when consumers are willing to change their diets. Therefore, insight into the drivers of food choices is crucial.
The aim of the web-survey in task 2.1 is to identify drivers of change of food diets across different countries. Determinants of sustainable and healthy food
consumption will be studied and similarities and differences across European countries (DK, IT, FR, CZ and NL) will be investigated. The goal of identifying such determinants is to find out which behaviour consumers are willing to change under which conditions. Such insights are important to take into consideration in modelling the options for more sustainable and healthy diets.
Sustainable food consumption Sustainable food consumption covers a wide variety of topics. The Dutch government uses a definition comprising respect for the environment, animals and humans (LNV, 2009). Many studies define sustainability in a similar way by
including the environment, animal welfare and Fair Trade (e.g. Grunert & Juhl, 1995; Lockie, Lyons, Lawrence, & Mummery, 2002; Raynolds, 2002). In addition, the definition of the World Commission on Environmental Development (WCED, 1987), focussing on balancing the needs of current consumer and future generations is often used for describing sustainability. In
short, sustainable food can be defined as food that is produced, processed, packaged, transported and traded with respect for people, animals and the environment, without compromising future generations.
In 2011, the Health Council of the Netherlands published a report in which guidelines for a healthy diet were evaluated from an ecological perspective (Health Council of the Netherlands, 2011). This report formulated two dietary guidelines which would lead to health and ecological gains simultaneously: the
SUSFANS
Report No. 2.1
use of less animal-based and more plant-based diets and a decrease in energy intake from snacks and beverages for those with excess body weight. The strategy where consumption of unsustainable products is reduced (and replaced by other foods with a lower environmental impact) is called curtailment and is
an important pathway to reduce the environmental impact of one’s diet (Foresight, 2011; Garnett, 2011; Jungbluth et al., 2000; Verain at al., 2015). In addition a food product can be replaced by similar products that are produced in a more environmentally-friendly and/or animal-friendly way (e.g. organic food or free-range meat) (see Vanhonacker; van Loo, Gellynck & Verbeke, 2013; Verain et al., 2015).
In this study we define sustainable food consumption as consumption of
sustainable food products in combination with curtailment of food intake, especially the intake of unsustainable product categories. This entails a diet that contains high levels of plant-based products and low levels of animal-based products.
Determinants of food choices Consumer food choices are determined by consumer characteristics. These determinants include demographics (e.g. gender, age) and psychographics (e.g. knowledge, attitude). Demographic variables that turn out to be important in food choice are age, gender, income, and education. Psychographic
determinants of general food choice include for example several food-related motives such as the importance of price, taste, health, involvement with food, food neophobia, and openness to new foods. More specific, determinants of sustainable food choice include sustainable food knowledge, attitudes toward sustainable food consumption, social and personal norms, and perceived
effectiveness of sustainable behaviour (Aertsens, Verbeke, Mondelaers, & van Huylenbroeck, 2009; Arvola et al., 2008; Bezencon & Blili, 2011; de Boer, Hoogland, & Boersema, 2007; Dowd & Burke, 2013; Lindeman and Vaananen, 2000; Tanner & Kast, 2003; Toma, McVittie, Hubbard, & Stotta, 2011; Verain et al., 2012; Vermeir & Verbeke, 2006).
Content This report presents an overview of the web-survey, in which the determinants of sustainable and healthy food consumption are explored. The report includes
the method, the results and the discussion. In the section where we discuss the method we will elaborate on how the survey was conducted, who participated and which measures were included. In the section where we discuss the results we report our findings about consumers’ perceptions on sustainable and healthy food, their behaviours regarding sustainable and healthy food consumption and
determinants of food consumption. Also, differences between the Netherlands, Denmark, Czech Republic, France and Italy are discussed. Finally in the discussion we write down our conclusions and take a critical look at our work.
SUSFANS
Report No. 2.1
Method
Procedure and respondents Data collection took place with an online survey in five European countries: The Netherlands, Denmark, Czech-Republic, France and Italy. These countries were selected to obtain a spread across North, South and Eastern Europe.
The survey has been developed in English and has been translated with forward and backward translation by professional translators. In addition, these translations were checked by native speaking researchers from the SUSFANS
consortium on understanding of the wording and jargon used in the questionnaire.
The draft questionnaire was tested in a quantitative pilot. It was an online questionnaire in which we tested a range of questions and items that had not been validated before. The pilot was conducted in the Netherlands (N=100) and Czech Republic (N=100). Reliability of items was tested with factor structures and reliability analysis (Cronbach’s alpha) and by looking at the means and
percentages of the answers. Small adaptations in terms of terminology or including items have been done after the pilot and the knowledge questions were adapted.
Respondents were recruited by MSI-ACI, a market research company that can blend different consumer panels and sample sources for each study through one controlled platform, coordinated from The Netherlands. Quota were set to get a good spread on gender, age, education and degree of urbanisation. Participants
had to be 18 years of age or more to be eligible for participation. Data collection took place in spring 2016, in all countries simultaneously. All respondents from the survey and pilots were paid for their participation.
For the final survey, a total of 5116 respondents was recruited:1021 in the Netherlands,1021 in Denmark, 1038 in Czech Republic, 1018 in France and 1018 in Italy. 73 participants have been excluded from the analyses because they
showed now dispersion on a whole range of items, indicating that they did not seriously filled out the questions. 17 participants show zero variation in their answers to all of the seven-point scales, indicating no serious participation. 56 participants show zero variation in their answers to the final ten seven-point scale questionnaires, indicating boredom at the end of the survey.
Measures The questionnaire consisted of three parts. First, measures on sustainable and healthy food behaviours have been included. Second, specific psychosocial variables related to healthy and sustainable food choices have been included.
Third, general underlying factors such as values, motives and socio-demographic characteristics have been included. For all scales, items were presented in a random order, unless indicated otherwise. All scales have been

SUSFANS
Report No. 2.1
checked by conducting exploratory factor analyses with oblique rotation. Reliability of the scales have been checked with Cronbach’s alpha.
Consumer perception of sustainable and healthy food behaviour Respondents were asked to select from a long list of items, which of the aspects in their opinion have to do with sustainability of food. From the items they selected, they were asked to indicate their top 5 of most important aspects. The
same questions were repeated for healthiness of food, with a different set of items related on healthiness. Next, respondents were asked to rank the four sustainability domains on which SUSFANS focusses (balanced and sufficient diets; reduced environmental impact; viable and socially balanced agri-food business; global food and nutrition security), from most important to least important.
Sustainable food intake Respondents were asked to indicate for a range of sustainable food behaviours how many days a week they eat them at their main meal. The items were based on Verain, Dagevos and Antonides (2015) for the measurement of the consumption of sustainable food products and curtailment of unsustainable food categories. Factor analysis identified four underlying factors with a total
explained variance of 67%. The first factor included 5 items measuring the consumption of organic and fair trade consumption (Cronbach’s alpha .903). The second factor consists of three items on the consumption of seasonal and local products (Cronbach’s alpha .779). The third factor included five items on meat replacement (Cronbach’s alpha .830) and the last factor combined seven
items on free range products, products with a sustainability logo and small portions of meat and dairy (Cronbach’s alpha .891).
Hierarchy of foods Respondents were asked ‘If you were to eat less meat during dinner in the future, to what extent would you be open for the following alternatives?’. A range of possible meat-replacing products was included. Respondents had to rate their openness to these alternatives on a seven-point scale from ‘Not at all’
to ‘A lot’. The included products call to mind the hierarchy of food (Twigg, 1983), including both animal-based and plant-based options. Factor analysis shows three underlying factors: one factor combining all animal-based alternatives (Cronbach’s alpha .751), one factor combining all plant-based alternatives (Cronbach’s alpha .842) and one factor combining new innovative
alternatives (insects and in vitro meat) (Cronbach’s alpha .741). Together, the factors explain 58% of the variance.
Consciousness for fair consumption and pro-environmental
lifestyle Consciousness for fair consumption was measured with a scale developed by
Balderjahn, Peyer and Paulssen (2013). Respondents were asked to indicate on
SUSFANS
Report No. 2.1
a 7-point scale (1= strongly disagree, 7=strongly agree) to what extent they agreed with 19 sustainability beliefs. The beliefs included environmental, social and economic aspects of sustainability. The question for the environmental and social aspects was as follows: ‘I buy a product only if I believe that (during the
manufacturing)… (e.g. ‘... it is made from recycled materials’ or ‘…workers are not abused’). The question for the economic aspects was as follows: ‘Even if I can financially afford a product, I buy a product only if I believe that… (e.g. ‘…I really need this product’). In the second part of the question, the respondents were asked for the same aspects what the importance of them is for them. The
question for the environmental and social aspects was as follows: ‘How important is it for you personally that (during the manufacturing)…’. The question for the economic aspects was as follows: ‘Even if you can financially afford a product, how important is it for you personally that…’. The corresponding items for the beliefs-part and the importance-part were
multiplied in order to obtain one score per aspect. For interpretation purposes, the score was divided by 7 to allow interpretation at the same 7-point scale level as most other variables. The reliability (Cronbach’s alpha) of the three subscales was high: .951 for the environmental component, .969 for social component and .933 for the economic component.
To measure general pro-environmental lifestyle, respondents were asked to indicate the frequency (1=never, 7=always) with which they perform 17
sustainable actions. The scale has been developed by Whithmarsh and O’Neill in 2010. Example items include ‘turn off lights you’re not using’, ‘share a car journey with someone else’ and ‘recycle’. The items were combined into one scale, explaining 32% of the variance (Cronbach’s alpha .857).
Knowledge Both objective and subjective knowledge have been included in the survey. Subjective knowledge was measured with the scale developed by Flynn and
Goldsmith (1999) and was framed for sustainable food and healthy food respectively. Respondents were asked ‘In your opinion, how informed are you about sustainable/healthy food?’ and was answered on a seven-point scale from ‘totally disagree’ to ‘totally agree’. The scale consists of five items. Example items are ‘I know pretty much about sustainable food’ and ‘Compared to most
other people, I know less about healthy food’ (reversed). The items scored on two factors, that we due to reversed items and therefore we forced them on one factor. The explained variance was 50% for subjective knowledge towards sustainable food with a Cronbach’s alpha of .744. For subjective knowledge towards healthy food, the explained variance was 53% with a Cronbach’s alpha of .770.
For objective knowledge, a scale was developed with statements that had to be
answered with ‘true’ or ‘false’. 16 statements about sustainability and 12 statements about health were included. The statements were mainly self-developed. The health statements were partly based on ISAFRUIT deliverable D

SUSFANS
Report No. 2.1
1.2.4. The items had been piloted and were adopted if necessary. Example statements for sustainability were ‘Fairtrade food is always organic’ and ‘In terms of environmental impact there is no difference between eating chicken or eating beef’. Example statements for healthy food were ‘It is generally
recommended to eat at least two portions of fruit each day’ and ‘Meat is a source of iron’. The percentage of correct answers for sustainability and health respectively has been calculated. In addition, in order to check the perceived difficulty of the selected statements, respondents were asked to indicate what they thought about the sustainability and health questions respectively, on a
seven-point scale from ‘very difficult’ to ‘very easy’ and from ‘hard to understand’ to ‘easy to understand’.
Willingness to pay for environmentally friendly products Willingness to pay for environmentally friendly products was assessed with three items developed by Laroche, Bergeron and Barbaro-Forleo (2001). The items had to be answered on a seven-point scale from ‘Totally disagree’ to ‘Totally agree’. The items were ‘It is acceptable to pay 10 percent more for a food
product that is produced, processed and packaged in an environmentally friendly way’, ‘I would accept paying 10 percent more taxes to pay for an environmental clean-up program’ and ‘I would be willing to spend an extra 8 euros a week in order to buy less environmentally harmful products’. The items load on a single factor, explaining 79% of the variance. Cronbach’s alpha is .863.
Attitude towards sustainable and healthy food Attitude towards sustainable food and attitude towards healthy food have been
asked with six bipolar items. Three items for cognitive attitude (worthless-valuable, useless-useful and harmful-beneficial) and three items for affective attitude (unattractive-attractive, bad-good, annoying-nice) have been included, based on Crites et al. (1994). The items for attitude towards sustainable food load on a single factor and explain 80% of the variance and have a Cronbach’s
alpha of .950. The items for attitude towards healthy food also load on a single factor and explain 77% of the variance and have a Cronbach’s alpha of .939.
General sustainability and health interest General health interest was assessed with eight items, developed by Roininen et al. (1999). Respondents were asked to rate on a 7-point scale (1=totally disagree, 7=totally agree) to what extent they agree with the eight items. Example items are ‘The healthiness of food has little impact on my food choices’ (reversed) and
‘I always follow a healthy and balanced diet’. Factor analysis resulted in two underlying factors, due to reversed items. Therefore we forced the items onto a single factor, explaining 43% of the variance (Cronbach’s alpha=.808). General sustainability interest was assessed in a similar way. Items were based on Roininen et al. (1999) and were adapted for sustainability. Example items are
‘The sustainability of food has little impact on my food choices’ (reversed) and ‘I always follow a sustainable diet’. Again, factor analysis resulted in two

SUSFANS
Report No. 2.1
underlying factors due to reversed items. Therefore we forced the items onto a single factor explaining 45% of the variance (Cronbach’s alpha=.824).
Descriptive social norm Descriptive social norms on sustainable diets was assessed with five items, adapted from Povey et al. (2000). Respondents were asked to indicate on a 7-point scale (1=not at all, 7=to a great extent) whether they think several groups
eat sustainable diets. Items included ‘people who are important to me’, ‘my colleagues/classmates’, ‘my friends’, ‘my family’, ‘the average Dutch [adjusted to the country of the respondent] person’. The five items belong to one underlying factor, explaining 72% of the item variance. The reliability is very high, with a Cronbach’s alpha of .901.
Perceived effectiveness of sustainable behaviour Perceived effectiveness of sustainable behaviour was measured with three items
developed by Vanhonacker et al. (2013) (based on Ellen, Wiener and Cobb-Walgren, 1991) and adjusted for sustainable food consumption instead of meat consumption. Respondents were asked to rate on a 7-point scale to what extent they agreed (1=totally disagree, 7=totally agree) with the statements (e.g. One person alone can do very little for the sustainability of our food consumption.).
The items loaded on a single factor, but the reliability seriously improved by deleting one of the items (‘An individual person can make a difference in the sustainability of our food consumption by carefully selecting the products’). Therefore, only the two remaining items were combined in one perceived effectiveness score with a Cronbach’s alpha of .700.
General food motives General food motives were assessed with the food choice questionnaire,
developed by Steptoe, Pollard and Wardle (1995). Three or four items for each of the original 9 components were included in the questionnaire, as well as a range of self-developed items on sustainability. Respondents were asked to indicate for 42 aspects to what extent the aspects were important to them for the food they eat on a typical day (1=not at all important, 7=very important). Based
on a factor analysis, the best option was to combine the items into eight underlying factors: price (2 items, Cronbach’s alpha=.745), weight control (4 items, Cronbach’s alpha=.845), familiarity (3 items, Cronbach’s alpha=.728), convenience (3 items, Cronbach’s alpha=.825), sensory appeal (4 items, Cronbach’s alpha=.812), natural and seasonal (6 items, Cronbach’s
alpha=.900), mood (4 items, Cronbach’s alpha=.829) and sustainable (15 items, Cronbach’s alpha=.946). The three items to measure importance of health do not load on a single factor. One of the items (contains a lot of vitamins and minerals) was included in the weight control factor, the other two items were not included in the further analyses. In addition, the item measuring importance of fair trade was deleted.
SUSFANS
Report No. 2.1
General food involvement General food involvement was measured with seven items developed by Bell and Marshall (2003). Respondents were asked to indicate on a 7-point scale
(1=totally disagree, 7=totally agree) to what extent they agree with the statements. Example statements are ‘during the day I think a lot about food’ and ‘a good meal is important to me’. The items load on a single factor, explaining 59% of the variance with a Cronbach’s alpha of .875.
Food neophobia Food neophobia was measured with the food neophobia scale developed by
Pliner and Hobden (1992). Respondents were asked to indicate on a 7-point scale (1=totally disagree, 7=totally agree) to what extent they agree with ten statements, such as ‘I am constantly sampling new and different foods’ and ‘I don’t trust new foods (reversed)’. The items load on two factors due to reversed items, therefore they were forced onto a single factor, explaining 34% of item variance. Cronbach’s alpha is .762.
Socio-demographic variables Finally, a range of socio-demographic characteristics were asked: gender, age, education, income, degree of urbanisation, family status, height and weight. Height and weight were combined into one Body Mass Index score (BMI), by dividing square-height (in meters) by weight (in kilograms).
SUSFANS
Report No. 2.1
Results
Preparatory analyses and sample demographics In total 5043 participants were analysed in this web-survey. 2483 participants were male (49.2%) and the mean age was 42.3 (SD=13.4) with a range from 18 to 65. Participants were from five different countries (NL: 1002; DK: 1006; CZ: 1034; FR: 1003; IT: 998). The demographic profile of the respondents in terms of education, income, degree of urbanisation of living area and family status are
described in Appendix I. The mean BMI of the sample is 25.4, and in the different countries the BMI is as followed: NL: 25.5; DK: 26.2; CZ: 26.3; FR: 24.3; IT: 24.4.
Sustainable and healthy (food) behaviour In this part, we aim to measure sustainable food behaviour. How do consumer conceptualise this and which behaviour do they report. The goal is to: First, get a better operationalisation of sustainable food behaviour. Second, quantify per country which aspects of sustainability are important to consumers and how often certain behaviours are reported. This can also be translated to the
different strategies for sustainable food consumption that consumers can use. Third, these variables will be the outcome variables when we analyse which determinants are underlying consumers’ sustainable food behaviour and choices for the different strategies.
Perception of food sustainability & the most important aspects
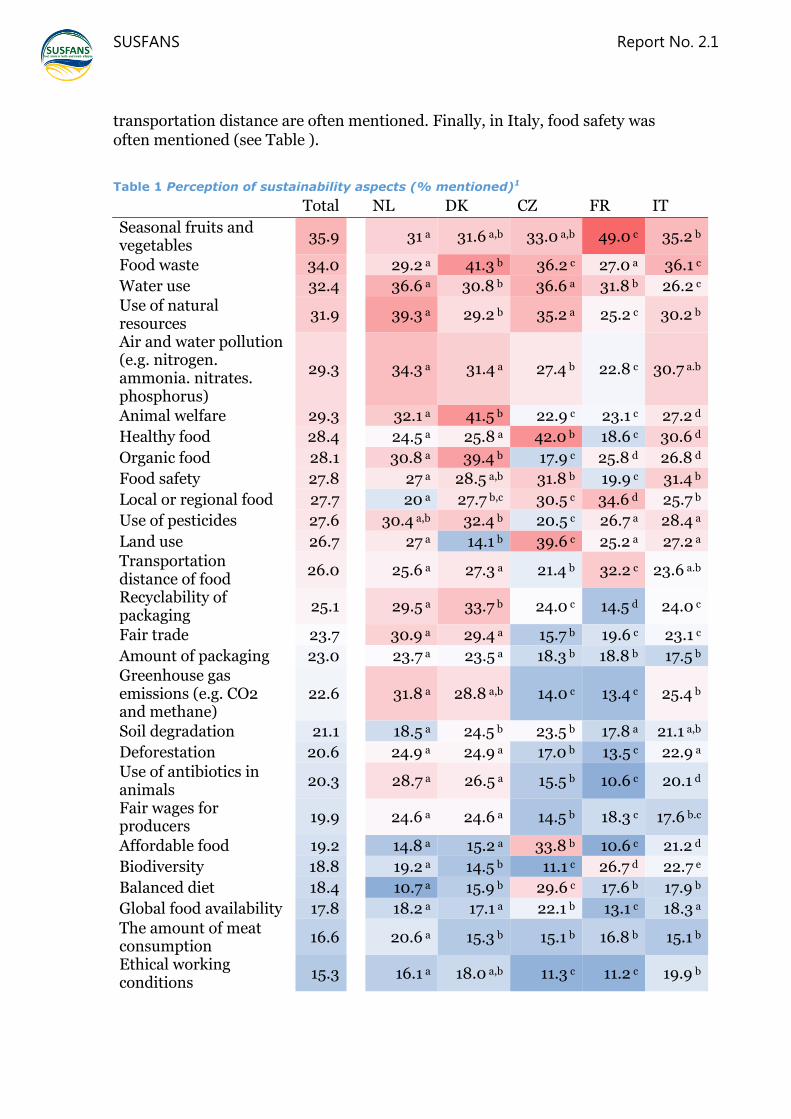
of sustainability in food Respondents were asked to select from a long list of aspects, which of the aspects in their opinion had to do with sustainable food. In the total sample, seasonal fruits and vegetables, food waste, water use and use of natural resources are most often perceived as aspects of sustainable food. Countries
differ in their perceptions, but these four aspects are often mentioned in all five countries. Seasonal fruits and vegetables is particularly often mentioned in France (by 49,0%) and food waste in Denmark (by 41,3%).
In addition to these four aspects, in the Netherlands air and water pollution is often perceived as an aspect of sustainability. In Denmark, organic food consumption and animal welfare are often mentioned. In Czech Republic, healthy food and land use stand out. In France, local and regional food and
In this study we analysed data of 5043 respondents in total from 5 countries (The Netherlands, Denmark, Czech Republic, France, and Italy). Respondents were roughly equally distributed over countries and sexes.
SUSFANS
Report No. 2.1
transportation distance are often mentioned. Finally, in Italy, food safety was often mentioned (see Table ).
Table 1 Perception of sustainability aspects (% mentioned)1
Total NL DK CZ FR IT
Seasonal fruits and vegetables
35.9
31 a 31.6 a,b 33.0 a,b 49.0 c 35.2 b
Food waste 34.0
29.2 a 41.3 b 36.2 c 27.0 a 36.1 c
Water use 32.4
36.6 a 30.8 b 36.6 a 31.8 b 26.2 c
Use of natural resources
31.9
39.3 a 29.2 b 35.2 a 25.2 c 30.2 b
Air and water pollution (e.g. nitrogen. ammonia. nitrates. phosphorus)
29.3
34.3 a 31.4 a 27.4 b 22.8 c 30.7 a.b
Animal welfare 29.3
32.1 a 41.5 b 22.9 c 23.1 c 27.2 d
Healthy food 28.4
24.5 a 25.8 a 42.0 b 18.6 c 30.6 d
Organic food 28.1
30.8 a 39.4 b 17.9 c 25.8 d 26.8 d
Food safety 27.8
27 a 28.5 a,b 31.8 b 19.9 c 31.4 b
Local or regional food 27.7
20 a 27.7 b,c 30.5 c 34.6 d 25.7 b
Use of pesticides 27.6
30.4 a,b 32.4 b 20.5 c 26.7 a 28.4 a
Land use 26.7
27 a 14.1 b 39.6 c 25.2 a 27.2 a
Transportation distance of food
26.0
25.6 a 27.3 a 21.4 b 32.2 c 23.6 a.b
Recyclability of packaging
25.1
29.5 a 33.7 b 24.0 c 14.5 d 24.0 c
Fair trade 23.7
30.9 a 29.4 a 15.7 b 19.6 c 23.1 c
Amount of packaging 23.0
23.7 a 23.5 a 18.3 b 18.8 b 17.5 b
Greenhouse gas emissions (e.g. CO2 and methane)
22.6
31.8 a 28.8 a,b 14.0 c 13.4 c 25.4 b
Soil degradation 21.1
18.5 a 24.5 b 23.5 b 17.8 a 21.1 a,b
Deforestation 20.6
24.9 a 24.9 a 17.0 b 13.5 c 22.9 a
Use of antibiotics in animals
20.3
28.7 a 26.5 a 15.5 b 10.6 c 20.1 d
Fair wages for producers
19.9
24.6 a 24.6 a 14.5 b 18.3 c 17.6 b.c
Affordable food 19.2
14.8 a 15.2 a 33.8 b 10.6 c 21.2 d
Biodiversity 18.8
19.2 a 14.5 b 11.1 c 26.7 d 22.7 e
Balanced diet 18.4
10.7 a 15.9 b 29.6 c 17.6 b 17.9 b
Global food availability 17.8
18.2 a 17.1 a 22.1 b 13.1 c 18.3 a
The amount of meat consumption
16.6
20.6 a 15.3 b 15.1 b 16.8 b 15.1 b
Ethical working conditions
15.3
16.1 a 18.0 a,b 11.3 c 11.2 c 19.9 b
SUSFANS
Report No. 2.1
Child labour 9.7
16.4 a 12.0 b 4.4 c 5.4 c 10.2 b
Malnutrition 7.6 6.8 a,b 6.0 a,b 5.2 b 8.0 a 11.9 c 1 More than one answer allowed; therefore percentages do not add up to 100 . Colours correspond with the value from dark red to dark blue. *Different subscripts per row indicate significant different values.
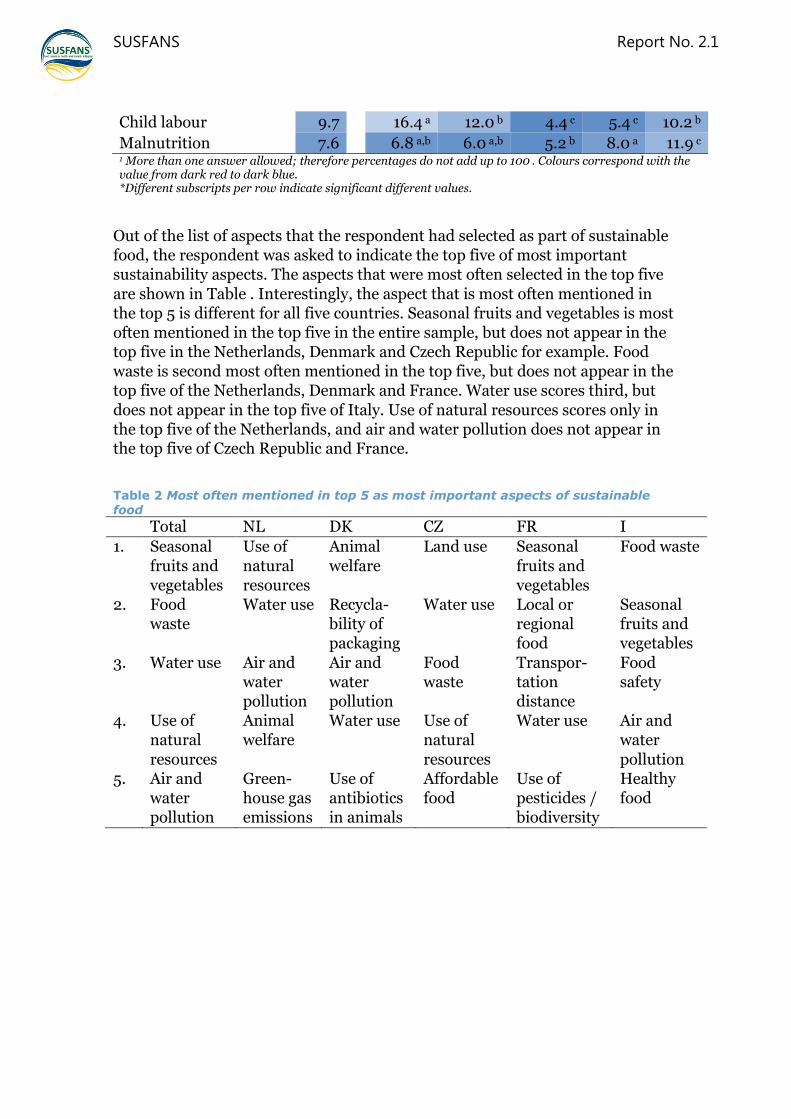
Out of the list of aspects that the respondent had selected as part of sustainable food, the respondent was asked to indicate the top five of most important sustainability aspects. The aspects that were most often selected in the top five
are shown in Table . Interestingly, the aspect that is most often mentioned in the top 5 is different for all five countries. Seasonal fruits and vegetables is most often mentioned in the top five in the entire sample, but does not appear in the top five in the Netherlands, Denmark and Czech Republic for example. Food waste is second most often mentioned in the top five, but does not appear in the top five of the Netherlands, Denmark and France. Water use scores third, but
does not appear in the top five of Italy. Use of natural resources scores only in the top five of the Netherlands, and air and water pollution does not appear in the top five of Czech Republic and France.
Table 2 Most often mentioned in top 5 as most important aspects of sustainable food
Total NL DK CZ FR I
1. Seasonal
fruits and vegetables
Use of
natural resources
Animal
welfare
Land use Seasonal
fruits and vegetables
Food waste
2. Food waste
Water use Recycla-bility of packaging
Water use Local or regional food
Seasonal fruits and vegetables
3. Water use Air and water pollution
Air and water pollution
Food waste
Transpor-tation distance
Food safety
4. Use of natural
resources
Animal welfare
Water use Use of natural
resources
Water use Air and water
pollution 5. Air and
water pollution
Green-house gas emissions
Use of antibiotics in animals
Affordable food
Use of pesticides / biodiversity
Healthy food
SUSFANS
Report No. 2.1
In addition to looking at the frequencies of which the aspects were mentioned in the top five, we also checked which of the aspects were most often mentioned on place one of the top five, without considering the answers on place two to place five (not shown in the Tables). Unexpectedly, different aspects come up now.
This means that these aspects are either mentioned as most important, or are not mentioned at all in the top 5. In the total sample, healthy food is mentioned most often (by 7,3%) as the most important aspect of sustainability. In the Netherlands, animal welfare (7,3%) and use of natural resources (7,3%) are most often mentioned on the first place. For Denmark this is animal welfare
(9,7%), for Czech Republic this is healthy food (14,3%), for France seasonal fruits and vegetables (10,2%) and for Italy healthy food (7,5%).
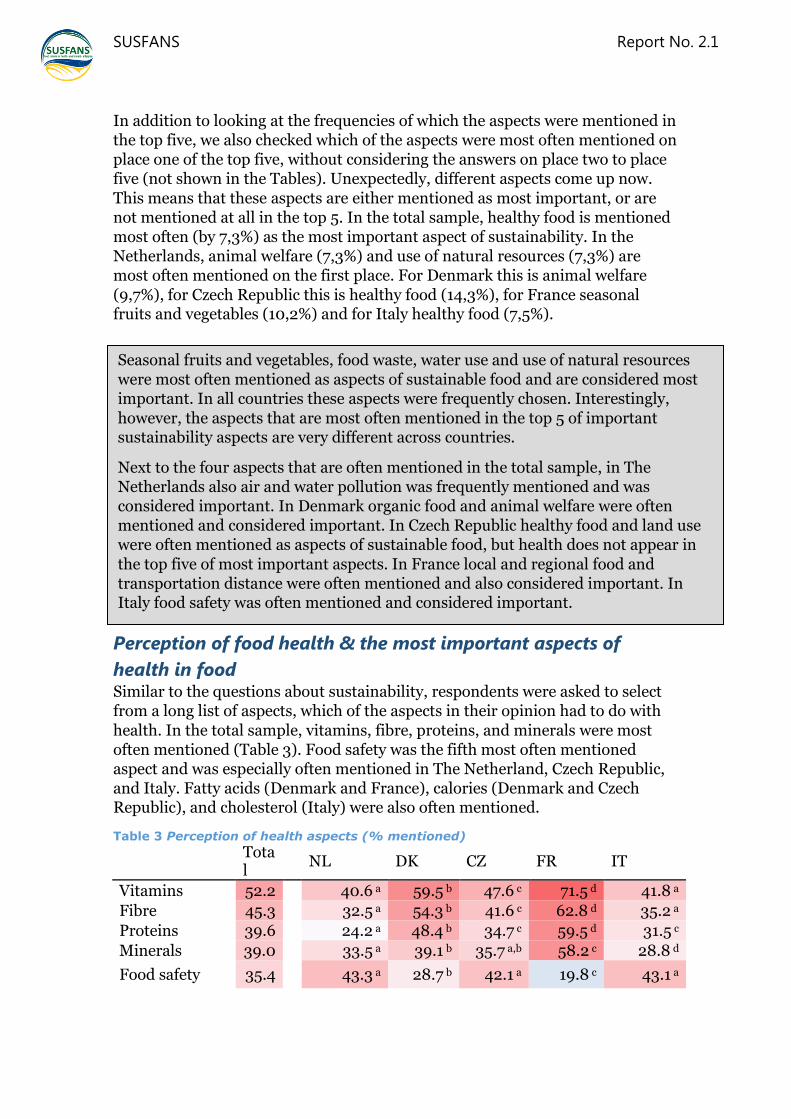
Perception of food health & the most important aspects of
health in food Similar to the questions about sustainability, respondents were asked to select from a long list of aspects, which of the aspects in their opinion had to do with
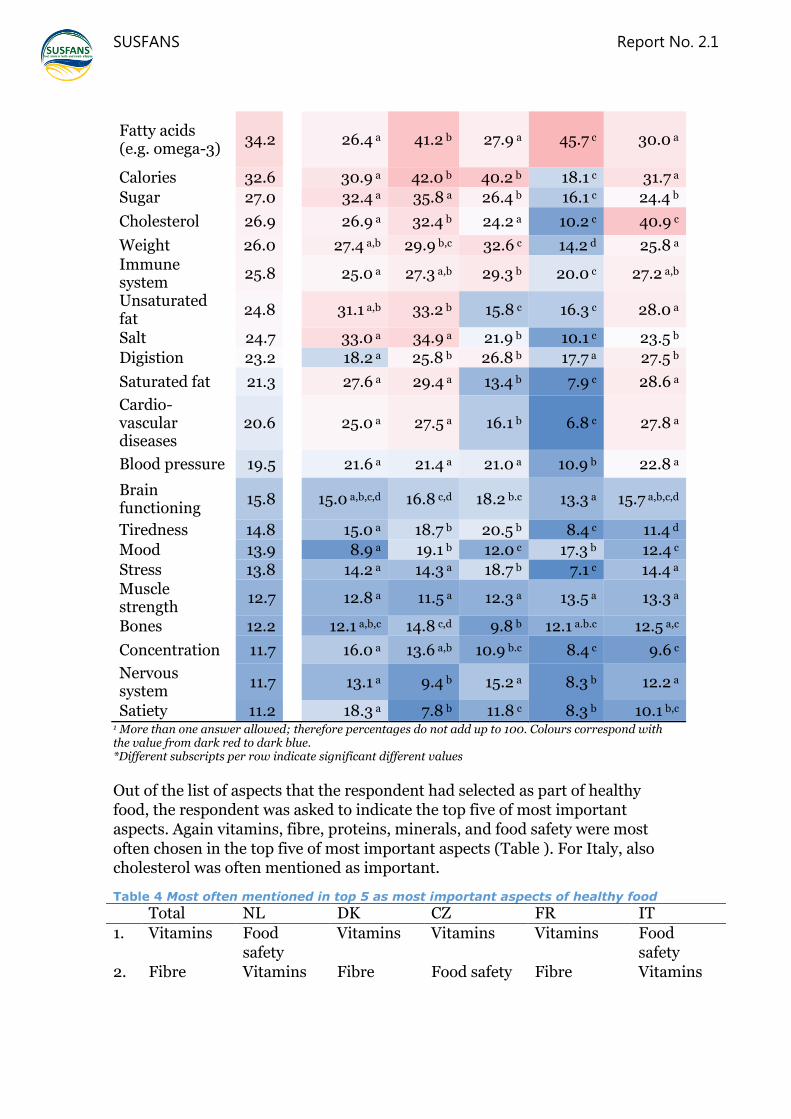
health. In the total sample, vitamins, fibre, proteins, and minerals were most often mentioned (Table 3). Food safety was the fifth most often mentioned aspect and was especially often mentioned in The Netherland, Czech Republic, and Italy. Fatty acids (Denmark and France), calories (Denmark and Czech Republic), and cholesterol (Italy) were also often mentioned.
Table 3 Perception of health aspects (% mentioned)
Total
NL DK CZ FR IT
Vitamins 52.2
40.6 a 59.5 b 47.6 c 71.5 d 41.8 a
Fibre 45.3
32.5 a 54.3 b 41.6 c 62.8 d 35.2 a
Proteins 39.6
24.2 a 48.4 b 34.7 c 59.5 d 31.5 c
Minerals 39.0
33.5 a 39.1 b 35.7 a,b 58.2 c 28.8 d
Food safety 35.4
43.3 a 28.7 b 42.1 a 19.8 c 43.1 a
Seasonal fruits and vegetables, food waste, water use and use of natural resources were most often mentioned as aspects of sustainable food and are considered most important. In all countries these aspects were frequently chosen. Interestingly,
however, the aspects that are most often mentioned in the top 5 of important sustainability aspects are very different across countries.
Next to the four aspects that are often mentioned in the total sample, in The Netherlands also air and water pollution was frequently mentioned and was considered important. In Denmark organic food and animal welfare were often mentioned and considered important. In Czech Republic healthy food and land use were often mentioned as aspects of sustainable food, but health does not appear in
the top five of most important aspects. In France local and regional food and transportation distance were often mentioned and also considered important. In Italy food safety was often mentioned and considered important.
SUSFANS
Report No. 2.1
Fatty acids (e.g. omega-3)
34.2
26.4 a 41.2 b 27.9 a 45.7 c 30.0 a
Calories 32.6
30.9 a 42.0 b 40.2 b 18.1 c 31.7 a
Sugar 27.0
32.4 a 35.8 a 26.4 b 16.1 c 24.4 b
Cholesterol 26.9
26.9 a 32.4 b 24.2 a 10.2 c 40.9 c
Weight 26.0
27.4 a,b 29.9 b,c 32.6 c 14.2 d 25.8 a Immune system
25.8
25.0 a 27.3 a,b 29.3 b 20.0 c 27.2 a,b
Unsaturated fat
24.8
31.1 a,b 33.2 b 15.8 c 16.3 c 28.0 a
Salt 24.7
33.0 a 34.9 a 21.9 b 10.1 c 23.5 b
Digistion 23.2
18.2 a 25.8 b 26.8 b 17.7 a 27.5 b
Saturated fat 21.3
27.6 a 29.4 a 13.4 b 7.9 c 28.6 a
Cardio-vascular diseases
20.6
25.0 a 27.5 a 16.1 b 6.8 c 27.8 a
Blood pressure 19.5
21.6 a 21.4 a 21.0 a 10.9 b 22.8 a
Brain functioning
15.8
15.0 a,b,c,d 16.8 c,d 18.2 b.c 13.3 a 15.7 a,b,c,d
Tiredness 14.8
15.0 a 18.7 b 20.5 b 8.4 c 11.4 d
Mood 13.9
8.9 a 19.1 b 12.0 c 17.3 b 12.4 c
Stress 13.8
14.2 a 14.3 a 18.7 b 7.1 c 14.4 a Muscle strength
12.7
12.8 a 11.5 a 12.3 a 13.5 a 13.3 a
Bones 12.2
12.1 a,b,c 14.8 c,d 9.8 b 12.1 a.b.c 12.5 a,c
Concentration 11.7
16.0 a 13.6 a,b 10.9 b.c 8.4 c 9.6 c
Nervous system
11.7
13.1 a 9.4 b 15.2 a 8.3 b 12.2 a
Satiety 11.2 18.3 a 7.8 b 11.8 c 8.3 b 10.1 b,c 1 More than one answer allowed; therefore percentages do not add up to 100. Colours correspond with the value from dark red to dark blue. *Different subscripts per row indicate significant different values
Out of the list of aspects that the respondent had selected as part of healthy food, the respondent was asked to indicate the top five of most important aspects. Again vitamins, fibre, proteins, minerals, and food safety were most
often chosen in the top five of most important aspects (Table ). For Italy, also cholesterol was often mentioned as important.
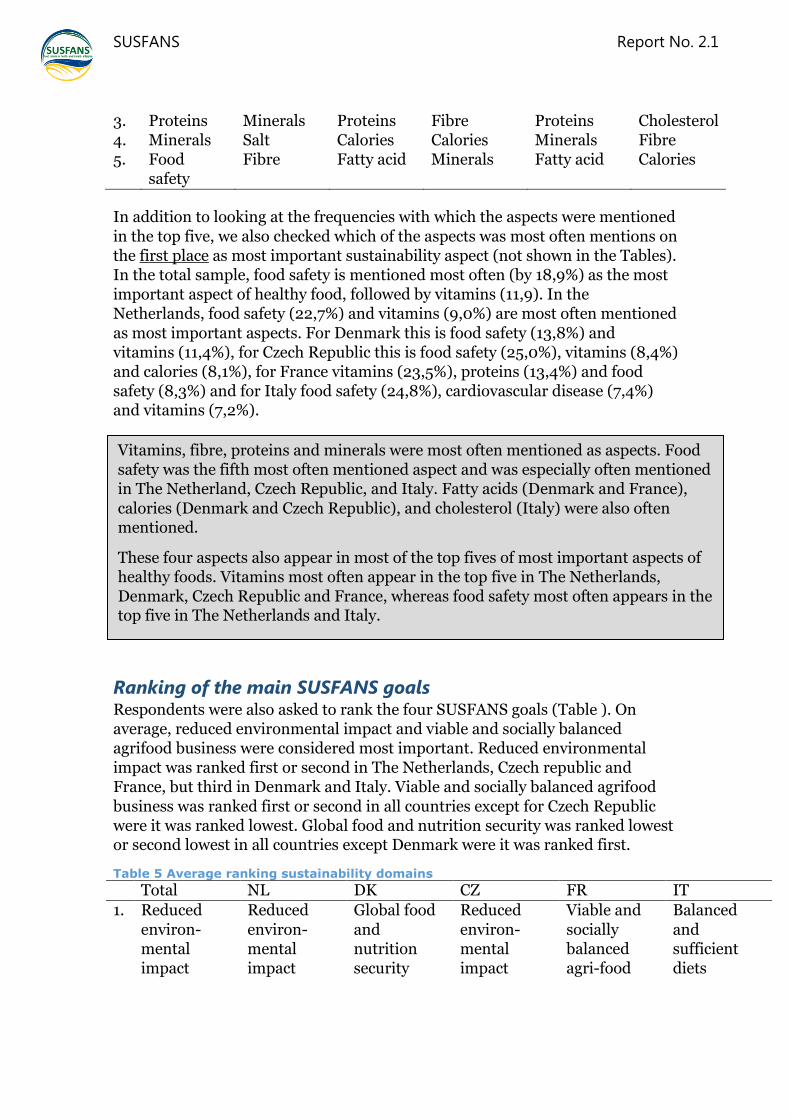
Table 4 Most often mentioned in top 5 as most important aspects of healthy food
Total NL DK CZ FR IT
1. Vitamins Food safety
Vitamins Vitamins Vitamins Food safety
2. Fibre Vitamins Fibre Food safety Fibre Vitamins
SUSFANS
Report No. 2.1
3. Proteins Minerals Proteins Fibre Proteins Cholesterol 4. Minerals Salt Calories Calories Minerals Fibre 5. Food
safety Fibre Fatty acid Minerals Fatty acid Calories
In addition to looking at the frequencies with which the aspects were mentioned
in the top five, we also checked which of the aspects was most often mentions on the first place as most important sustainability aspect (not shown in the Tables). In the total sample, food safety is mentioned most often (by 18,9%) as the most important aspect of healthy food, followed by vitamins (11,9). In the Netherlands, food safety (22,7%) and vitamins (9,0%) are most often mentioned
as most important aspects. For Denmark this is food safety (13,8%) and vitamins (11,4%), for Czech Republic this is food safety (25,0%), vitamins (8,4%) and calories (8,1%), for France vitamins (23,5%), proteins (13,4%) and food safety (8,3%) and for Italy food safety (24,8%), cardiovascular disease (7,4%) and vitamins (7,2%).
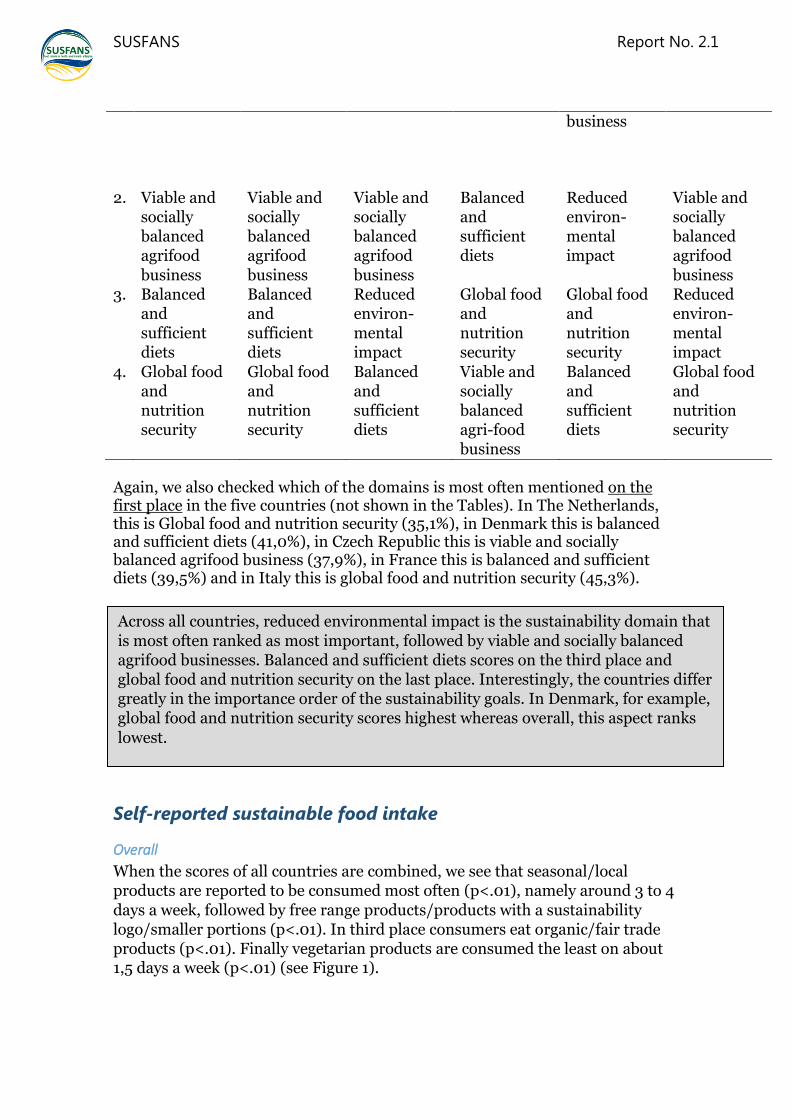
Ranking of the main SUSFANS goals Respondents were also asked to rank the four SUSFANS goals (Table ). On average, reduced environmental impact and viable and socially balanced agrifood business were considered most important. Reduced environmental impact was ranked first or second in The Netherlands, Czech republic and France, but third in Denmark and Italy. Viable and socially balanced agrifood
business was ranked first or second in all countries except for Czech Republic were it was ranked lowest. Global food and nutrition security was ranked lowest or second lowest in all countries except Denmark were it was ranked first.
Table 5 Average ranking sustainability domains
Total NL DK CZ FR IT
1. Reduced
environ-mental impact
Reduced
environ-mental impact
Global food
and nutrition security
Reduced
environ-mental impact
Viable and
socially balanced agri-food
Balanced
and sufficient diets
Vitamins, fibre, proteins and minerals were most often mentioned as aspects. Food safety was the fifth most often mentioned aspect and was especially often mentioned in The Netherland, Czech Republic, and Italy. Fatty acids (Denmark and France),
calories (Denmark and Czech Republic), and cholesterol (Italy) were also often mentioned.
These four aspects also appear in most of the top fives of most important aspects of healthy foods. Vitamins most often appear in the top five in The Netherlands, Denmark, Czech Republic and France, whereas food safety most often appears in the top five in The Netherlands and Italy.
SUSFANS
Report No. 2.1
business
2. Viable and socially balanced agrifood
business
Viable and socially balanced agrifood
business
Viable and socially balanced agrifood
business
Balanced and sufficient diets
Reduced environ-mental impact
Viable and socially balanced agrifood
business 3. Balanced
and sufficient diets
Balanced and sufficient diets
Reduced environ-mental impact
Global food and nutrition security
Global food and nutrition security
Reduced environ-mental impact
4. Global food and nutrition security
Global food and nutrition security
Balanced and sufficient diets
Viable and socially balanced agri-food business
Balanced and sufficient diets
Global food and nutrition security
Again, we also checked which of the domains is most often mentioned on the first place in the five countries (not shown in the Tables). In The Netherlands, this is Global food and nutrition security (35,1%), in Denmark this is balanced and sufficient diets (41,0%), in Czech Republic this is viable and socially balanced agrifood business (37,9%), in France this is balanced and sufficient diets (39,5%) and in Italy this is global food and nutrition security (45,3%).
Self-reported sustainable food intake
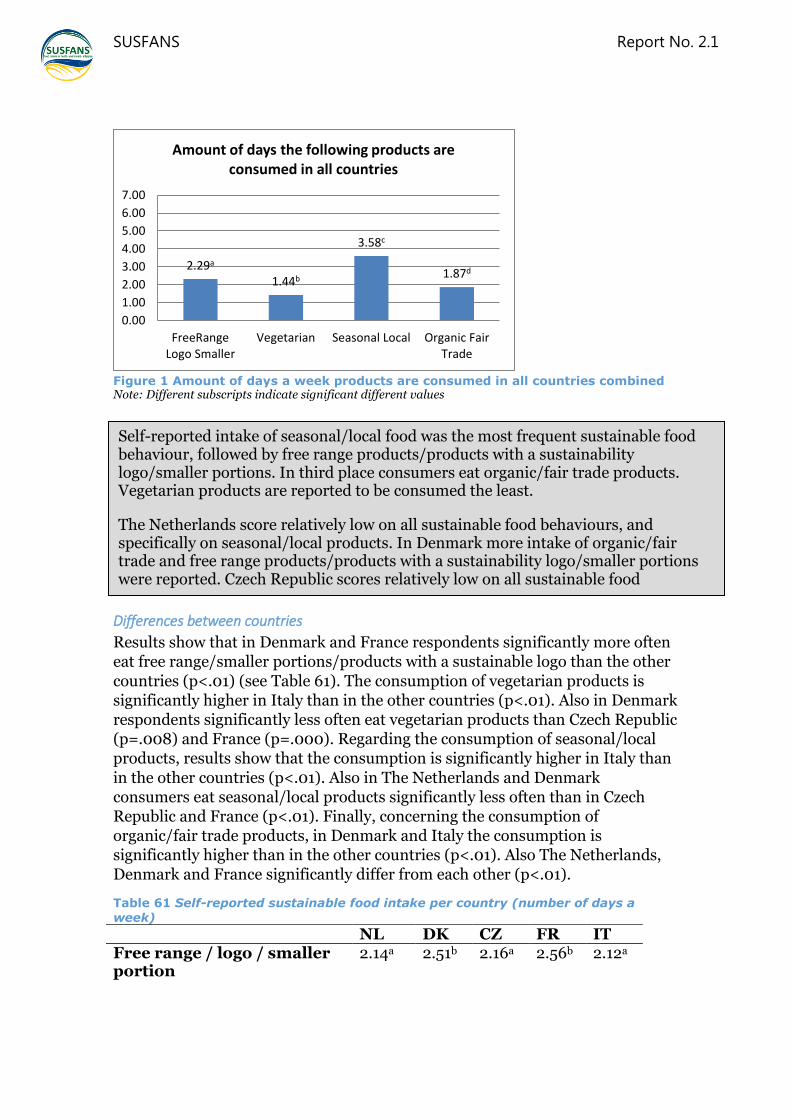
Overall
When the scores of all countries are combined, we see that seasonal/local products are reported to be consumed most often (p<.01), namely around 3 to 4
days a week, followed by free range products/products with a sustainability logo/smaller portions (p<.01). In third place consumers eat organic/fair trade products (p<.01). Finally vegetarian products are consumed the least on about 1,5 days a week (p<.01) (see Figure 1).
Across all countries, reduced environmental impact is the sustainability domain that
is most often ranked as most important, followed by viable and socially balanced agrifood businesses. Balanced and sufficient diets scores on the third place and global food and nutrition security on the last place. Interestingly, the countries differ greatly in the importance order of the sustainability goals. In Denmark, for example, global food and nutrition security scores highest whereas overall, this aspect ranks
lowest.
SUSFANS
Report No. 2.1
Figure 1 Amount of days a week products are consumed in all countries combined Note: Different subscripts indicate significant different values
Differences between countries
Results show that in Denmark and France respondents significantly more often eat free range/smaller portions/products with a sustainable logo than the other
countries (p<.01) (see Table 61). The consumption of vegetarian products is significantly higher in Italy than in the other countries (p<.01). Also in Denmark respondents significantly less often eat vegetarian products than Czech Republic (p=.008) and France (p=.000). Regarding the consumption of seasonal/local products, results show that the consumption is significantly higher in Italy than
in the other countries (p<.01). Also in The Netherlands and Denmark consumers eat seasonal/local products significantly less often than in Czech Republic and France (p<.01). Finally, concerning the consumption of organic/fair trade products, in Denmark and Italy the consumption is significantly higher than in the other countries (p<.01). Also The Netherlands, Denmark and France significantly differ from each other (p<.01).
Table 61 Self-reported sustainable food intake per country (number of days a
week)
NL DK CZ FR IT Free range / logo / smaller portion
2.14a 2.51b 2.16a 2.56b 2.12a
2.29a 1.44b
3.58c
1.87d
0.00
1.00
2.00
3.00
4.00
5.00
6.00
7.00
FreeRangeLogo Smaller
Vegetarian Seasonal Local Organic FairTrade
Amount of days the following products are consumed in all countries
Self-reported intake of seasonal/local food was the most frequent sustainable food behaviour, followed by free range products/products with a sustainability logo/smaller portions. In third place consumers eat organic/fair trade products. Vegetarian products are reported to be consumed the least.
The Netherlands score relatively low on all sustainable food behaviours, and specifically on seasonal/local products. In Denmark more intake of organic/fair trade and free range products/products with a sustainability logo/smaller portions were reported. Czech Republic scores relatively low on all sustainable food behaviours, and specifically on organic/fair trade consumption. French respondents had a relatively high intake of free range products/products with a sustainability logo/smaller portions. Finally, in Italy relatively higher intake of seasonal/local food, vegetarian food and organic/fair trade food was reported.
SUSFANS
Report No. 2.1
Vegetarian 1.33a,b 1.18a 1.39b 1.48b 1.82c
Seasonal / local 3.02a 3.08a 3.67b 3.79b 4.35c
Organic / Fair Trade 1.66a 2.23b 1.30c 1.96d 2.26b
Note: Different subscripts per row indicate significant different values
Hierarchy of foods
Overall
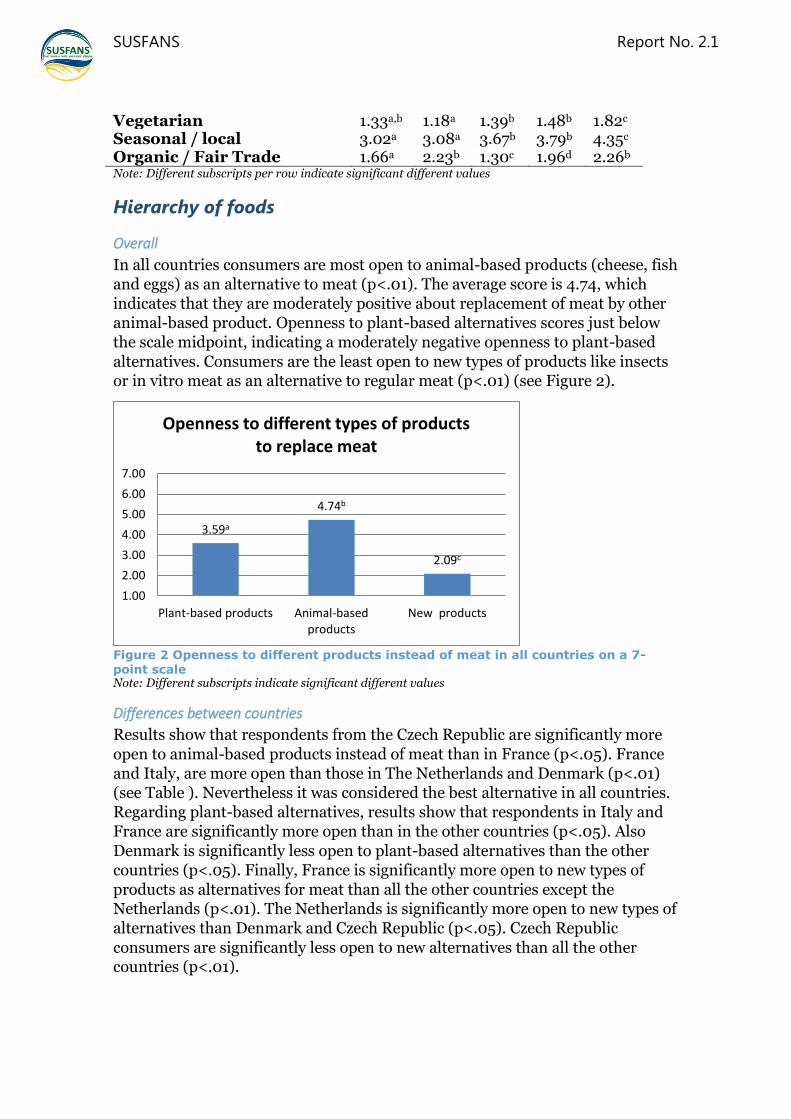
In all countries consumers are most open to animal-based products (cheese, fish and eggs) as an alternative to meat (p<.01). The average score is 4.74, which indicates that they are moderately positive about replacement of meat by other animal-based product. Openness to plant-based alternatives scores just below the scale midpoint, indicating a moderately negative openness to plant-based
alternatives. Consumers are the least open to new types of products like insects or in vitro meat as an alternative to regular meat (p<.01) (see Figure 2).
Figure 2 Openness to different products instead of meat in all countries on a 7-point scale Note: Different subscripts indicate significant different values
Differences between countries
Results show that respondents from the Czech Republic are significantly more
open to animal-based products instead of meat than in France (p<.05). France and Italy, are more open than those in The Netherlands and Denmark (p<.01) (see Table ). Nevertheless it was considered the best alternative in all countries. Regarding plant-based alternatives, results show that respondents in Italy and France are significantly more open than in the other countries (p<.05). Also
Denmark is significantly less open to plant-based alternatives than the other countries (p<.05). Finally, France is significantly more open to new types of products as alternatives for meat than all the other countries except the Netherlands (p<.01). The Netherlands is significantly more open to new types of alternatives than Denmark and Czech Republic (p<.05). Czech Republic
consumers are significantly less open to new alternatives than all the other countries (p<.01).
3.59a
4.74b
2.09c
1.00
2.00
3.00
4.00
5.00
6.00
7.00
Plant-based products Animal-basedproducts
New products
Openness to different types of products to replace meat

SUSFANS
Report No. 2.1
Table 7 Openness to several types of meat-replacing products per country
NL DK CZ FR IT Animal-based products
4.50a 4.55a 5.00b 4.82c 4.85b,c
Plant-based products
3.52a 3.33b 3.51a 3.72c 3.88d
New products 2.22a,b 2.04c 1.77d 2.34a 2.08b,c
Note: Different subscripts per row indicate significant different values
Consciousness for sustainable consumption: beliefs x importance
Overall
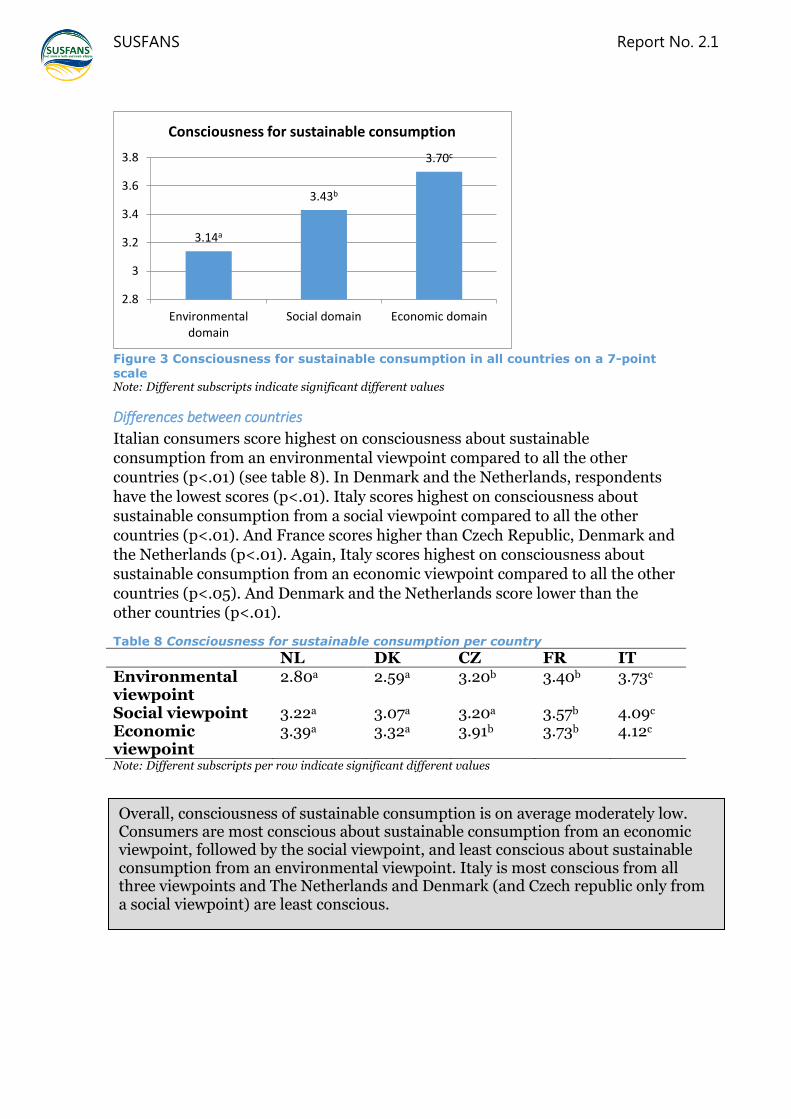
All countries taken together, consumers are most conscious about sustainable consumption from an economic viewpoint (even if I can afford a product, do I need it / is it useful, etc.) (p<.01) (see Figure 3). Consumers are least conscious about sustainable consumption from an environmental viewpoint (I only buy a
product when: It is made of recycled materials/ can be disposed of in an environmentally friendly way, etc.) (p<.01). Consciousness about sustainable consumption from a social viewpoint (I only buy a product when: No child labour is involved / No workers are abused, etc.) scores in the middle. Overall, however, consciousness of sustainable consumption is on average moderately
low, with scores between 3.14 (environmental viewpoint) and 3.70 (economic viewpoint).
Overall, consumers are most open to animal-based products (fish, cheese and eggs) as an alternative to meat, on average, they are moderately positive. The second favourite alternative are plant-based products to which they are, on average, a moderately negative. Consumers are least open to new products like insects or in vitro meat.
Noticeably, in Czech Republic consumers are more open to animal-based meat alternatives as compared to the other countries and least open to new products as meat alternatives. Italian consumers are most open to plant-based alternatives as compared to the other countries.
SUSFANS
Report No. 2.1
Figure 3 Consciousness for sustainable consumption in all countries on a 7-point
scale Note: Different subscripts indicate significant different values
Differences between countries
Italian consumers score highest on consciousness about sustainable consumption from an environmental viewpoint compared to all the other countries (p<.01) (see table 8). In Denmark and the Netherlands, respondents
have the lowest scores (p<.01). Italy scores highest on consciousness about sustainable consumption from a social viewpoint compared to all the other countries (p<.01). And France scores higher than Czech Republic, Denmark and the Netherlands (p<.01). Again, Italy scores highest on consciousness about sustainable consumption from an economic viewpoint compared to all the other
countries (p<.05). And Denmark and the Netherlands score lower than the other countries (p<.01).
Table 8 Consciousness for sustainable consumption per country
NL DK CZ FR IT Environmental viewpoint
2.80a 2.59a 3.20b 3.40b 3.73c
Social viewpoint 3.22a 3.07a 3.20a 3.57b 4.09c
Economic viewpoint
3.39a 3.32a 3.91b 3.73b 4.12c
Note: Different subscripts per row indicate significant different values
3.14a
3.43b
3.70c
2.8
3
3.2
3.4
3.6
3.8
Environmentaldomain
Social domain Economic domain
Consciousness for sustainable consumption
Overall, consciousness of sustainable consumption is on average moderately low. Consumers are most conscious about sustainable consumption from an economic viewpoint, followed by the social viewpoint, and least conscious about sustainable consumption from an environmental viewpoint. Italy is most conscious from all three viewpoints and The Netherlands and Denmark (and Czech republic only from a social viewpoint) are least conscious.

SUSFANS
Report No. 2.1
Sustainable behaviour
Overall
Consumers were asked to what extent they perform sustainable behaviours, like turning of the lights, drive economically, recycle etc. (see Figure 4). All the countries taken together, consumers score 4.2 out of 7 (SD=1.0) on sustainable
behaviour, which indicates that on average they rate their sustainable behaviour neither frequent nor infrequent.
Differences between countries
Results show that in Denmark respondents perform significantly less sustainable behaviours than the other countries (p<.01) and that in Italy respondents perform significantly most sustainable behaviours (p<.01). French consumers also performs significantly more sustainable behaviour than those in Czech Republic, Denmark and The Netherlands (p<.01).
Figure 4 Sustainable behaviour scores on a 7-point scale Note: Different subscripts indicate significant different values
Sustainable food specific underlying values, motives,
etc. The variables described in this section will be used to determine which determinants are underlying consumers’ sustainable food behaviour and choices
4.05a 3.90b 4.13a 4.33c 4.66d
1.00
2.00
3.00
4.00
5.00
6.00
7.00
TheNetherlands
Denmark CzechRepublic
France Italy
Sustainable behavior
Overall, respondents score their self-reported frequency of performing a range of sustainable behaviours (e.g. turning off lights) as neither frequent nor infrequent. Danish consumers perform significantly less sustainable behaviours than those in the other countries and Italians perform significantly most sustainable behaviours.
SUSFANS
Report No. 2.1
for the different strategies. These are variables framed specifically for sustainable (and healthy) food behaviour and are based on the literature study.
Knowledge
Overall
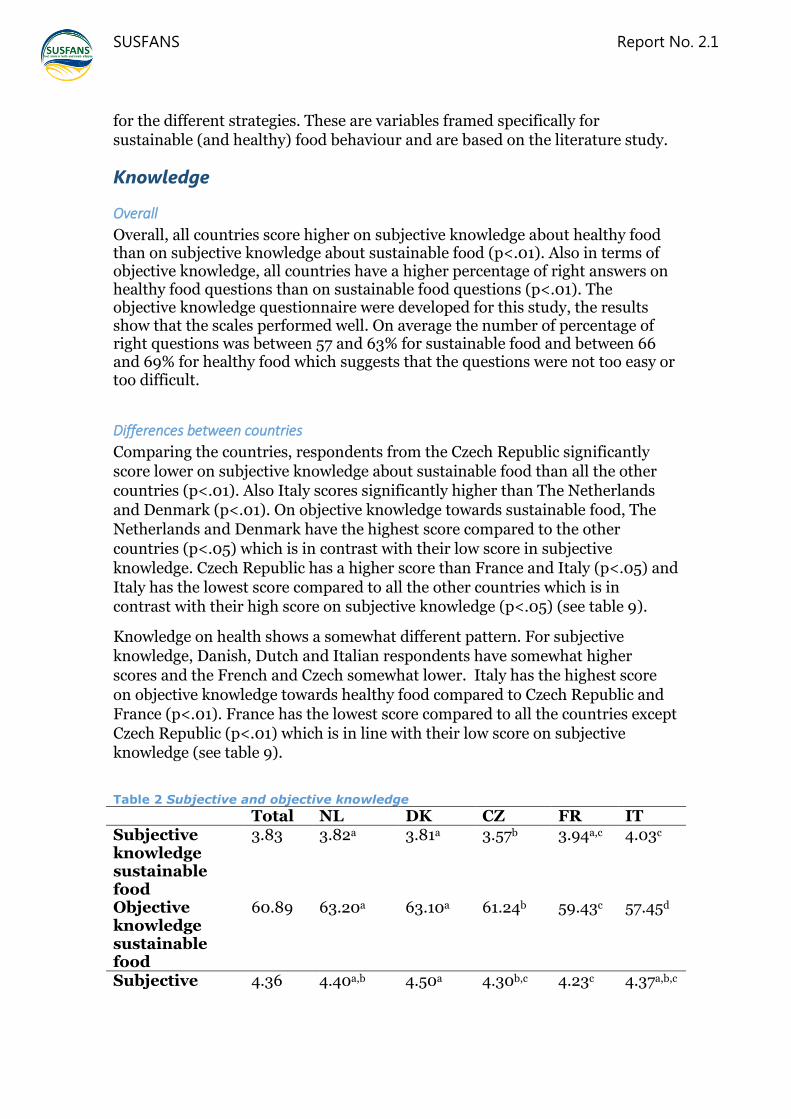
Overall, all countries score higher on subjective knowledge about healthy food than on subjective knowledge about sustainable food (p<.01). Also in terms of objective knowledge, all countries have a higher percentage of right answers on healthy food questions than on sustainable food questions (p<.01). The objective knowledge questionnaire were developed for this study, the results show that the scales performed well. On average the number of percentage of right questions was between 57 and 63% for sustainable food and between 66 and 69% for healthy food which suggests that the questions were not too easy or too difficult.
Differences between countries
Comparing the countries, respondents from the Czech Republic significantly score lower on subjective knowledge about sustainable food than all the other countries (p<.01). Also Italy scores significantly higher than The Netherlands and Denmark (p<.01). On objective knowledge towards sustainable food, The Netherlands and Denmark have the highest score compared to the other
countries (p<.05) which is in contrast with their low score in subjective knowledge. Czech Republic has a higher score than France and Italy (p<.05) and Italy has the lowest score compared to all the other countries which is in contrast with their high score on subjective knowledge (p<.05) (see table 9).
Knowledge on health shows a somewhat different pattern. For subjective knowledge, Danish, Dutch and Italian respondents have somewhat higher scores and the French and Czech somewhat lower. Italy has the highest score
on objective knowledge towards healthy food compared to Czech Republic and France (p<.01). France has the lowest score compared to all the countries except Czech Republic (p<.01) which is in line with their low score on subjective knowledge (see table 9).
Table 2 Subjective and objective knowledge
Total NL DK CZ FR IT Subjective knowledge sustainable food
3.83 3.82a 3.81a 3.57b 3.94a,c 4.03c
Objective knowledge sustainable food
60.89 63.20a 63.10a 61.24b 59.43c 57.45d
Subjective 4.36 4.40a,b 4.50a 4.30b,c 4.23c 4.37a,b,c
SUSFANS
Report No. 2.1
knowledge healthy food Objective knowledge healthy food
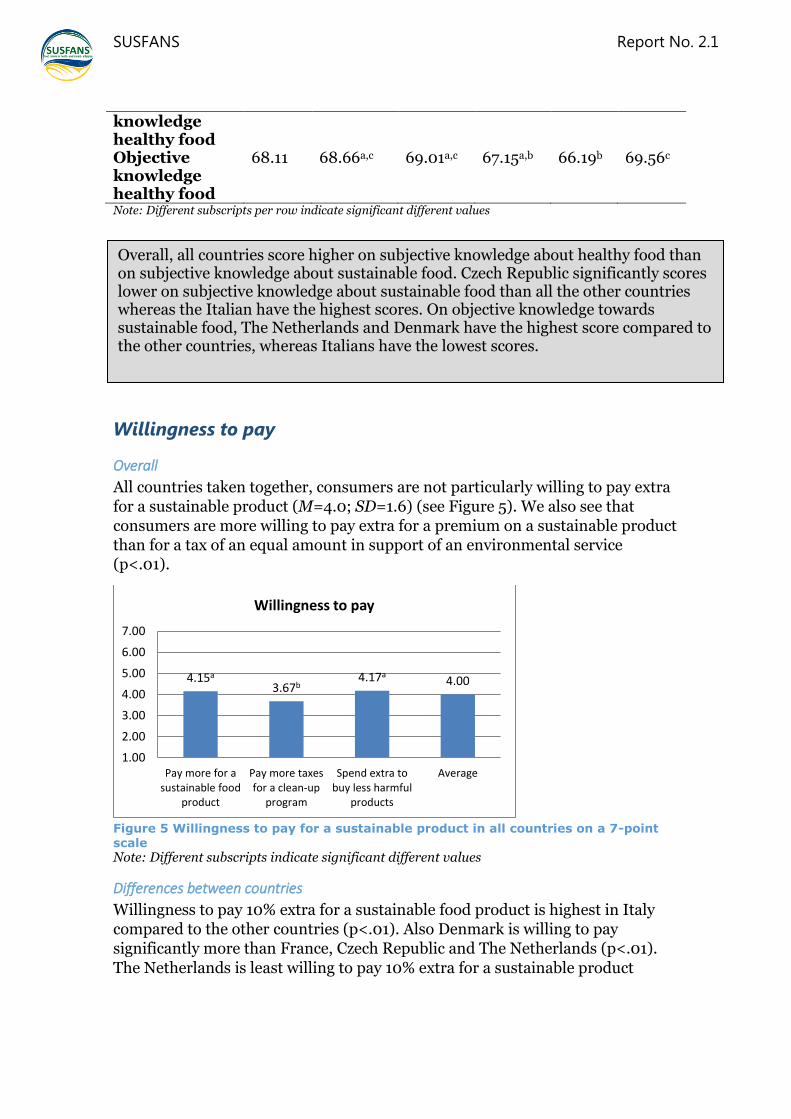
68.11 68.66a,c 69.01a,c 67.15a,b 66.19b 69.56c
Note: Different subscripts per row indicate significant different values
Willingness to pay
Overall
All countries taken together, consumers are not particularly willing to pay extra for a sustainable product (M=4.0; SD=1.6) (see Figure 5). We also see that consumers are more willing to pay extra for a premium on a sustainable product than for a tax of an equal amount in support of an environmental service (p<.01).
Figure 5 Willingness to pay for a sustainable product in all countries on a 7-point scale Note: Different subscripts indicate significant different values
Differences between countries
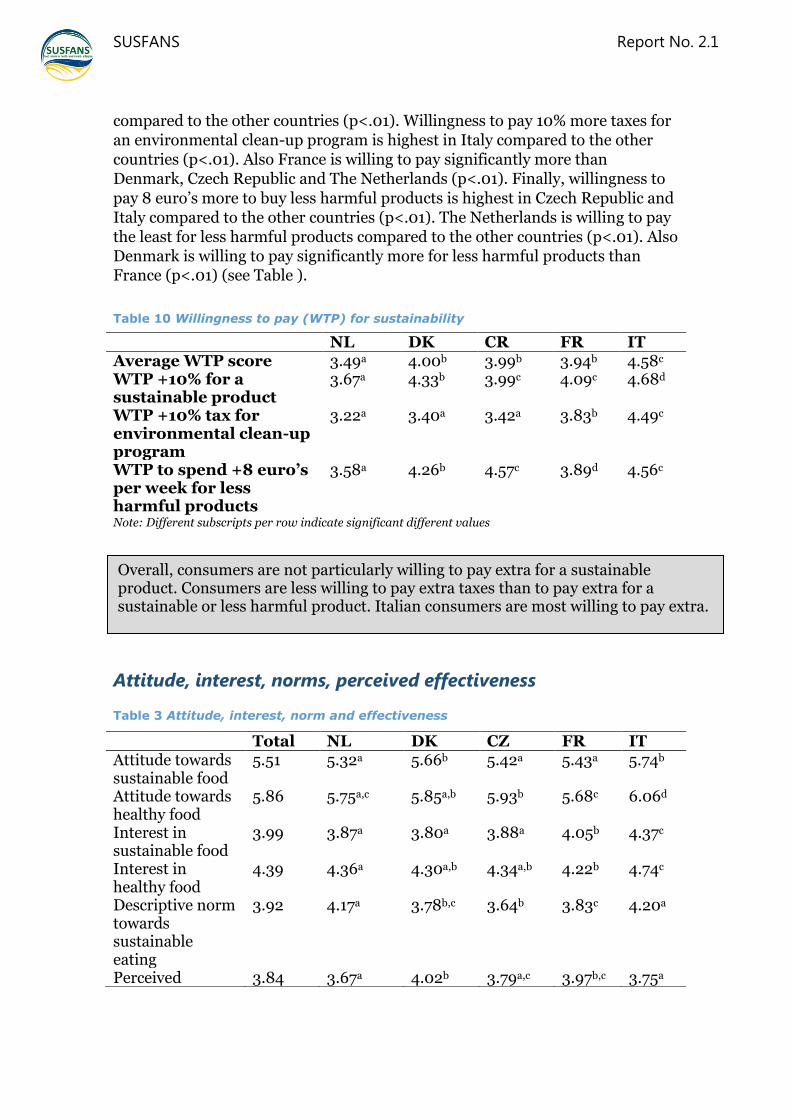
Willingness to pay 10% extra for a sustainable food product is highest in Italy compared to the other countries (p<.01). Also Denmark is willing to pay significantly more than France, Czech Republic and The Netherlands (p<.01).
The Netherlands is least willing to pay 10% extra for a sustainable product
4.15a 3.67b
4.17a 4.00
1.00
2.00
3.00
4.00
5.00
6.00
7.00
Pay more for asustainable food
product
Pay more taxesfor a clean-up
program
Spend extra tobuy less harmful
products
Average
Willingness to pay
Overall, all countries score higher on subjective knowledge about healthy food than on subjective knowledge about sustainable food. Czech Republic significantly scores lower on subjective knowledge about sustainable food than all the other countries whereas the Italian have the highest scores. On objective knowledge towards sustainable food, The Netherlands and Denmark have the highest score compared to the other countries, whereas Italians have the lowest scores.
SUSFANS
Report No. 2.1
compared to the other countries (p<.01). Willingness to pay 10% more taxes for an environmental clean-up program is highest in Italy compared to the other countries (p<.01). Also France is willing to pay significantly more than Denmark, Czech Republic and The Netherlands (p<.01). Finally, willingness to
pay 8 euro’s more to buy less harmful products is highest in Czech Republic and Italy compared to the other countries (p<.01). The Netherlands is willing to pay the least for less harmful products compared to the other countries (p<.01). Also Denmark is willing to pay significantly more for less harmful products than France (p<.01) (see Table ).
Table 10 Willingness to pay (WTP) for sustainability
Note: Different subscripts per row indicate significant different values
Attitude, interest, norms, perceived effectiveness
Table 3 Attitude, interest, norm and effectiveness
NL DK CR FR IT Average WTP score 3.49a 4.00b 3.99b 3.94b 4.58c
WTP +10% for a sustainable product
3.67a 4.33b 3.99c 4.09c 4.68d
WTP +10% tax for environmental clean-up program
3.22a 3.40a 3.42a 3.83b 4.49c
WTP to spend +8 euro’s per week for less harmful products
3.58a 4.26b 4.57c 3.89d 4.56c
Total NL DK CZ FR IT Attitude towards sustainable food
5.51 5.32a 5.66b 5.42a 5.43a 5.74b
Attitude towards healthy food
5.86 5.75a,c 5.85a,b 5.93b 5.68c 6.06d
Interest in sustainable food
3.99 3.87a 3.80a 3.88a 4.05b 4.37c
Interest in healthy food
4.39 4.36a 4.30a,b 4.34a,b 4.22b 4.74c
Descriptive norm towards sustainable eating
3.92 4.17a 3.78b,c 3.64b 3.83c 4.20a
Perceived 3.84 3.67a 4.02b 3.79a,c 3.97b,c 3.75a
Overall, consumers are not particularly willing to pay extra for a sustainable product. Consumers are less willing to pay extra taxes than to pay extra for a sustainable or less harmful product. Italian consumers are most willing to pay extra.
SUSFANS
Report No. 2.1
Note: Different subscripts per row indicate significant different values
Overall attitude
Overall, consumers in all countries have positive attitudes towards sustainable
food as well as towards healthy food. Attitude towards healthy food is significantly more positive than towards sustainable food (p<.01) (see
Table 3).
Differences between countries in attitudes
Italy and Denmark have the highest attitude towards sustainable food compared to the other countries (p<.01). Italy also has the highest attitude towards healthy food compared to the other countries (p<.05) and Czech Republic has a higher attitude towards healthy food than The Netherlands and France (p<.01). Finally France has the lowest attitude towards healthy food compared to the other countries (except the Netherlands) (p<.01).
Overall interest
Overall, consumers’ score neutral on interest in sustainable food. Interest in
healthy food is slightly above neutral. Consumers are generally more interested in the healthiness of food than in the sustainability of food (p<.01) (see
Table 3).
Differences between countries in interest
Italy has most interest in sustainable food than all the other countries (p<.01), and France has more interest in sustainable food than Czech Republic, Denmark and The Netherlands (p<.01) (see Table 11). Italy also has most interest in healthy food than all the other countries (p<.01). Also France has less interest in healthy food than the Netherland (p<.05).
Overall descriptive norm
All countries taken together, consumers report to have a descriptive norm of 3.92 out of 7 (SD=1.2), indicating a neutral norm (see
Table 3).
Differences between countries in descriptive norm
Italy and the Netherlands have a higher descriptive norm than the other countries (p<.01). Czech Republic has a lower descriptive norm than France, but Denmark does not differ from either Czech Republic or France.
effectiveness towards sustainable food consumption
SUSFANS
Report No. 2.1
Overall perceived effectiveness towards sustainable food consumption
All countries taken together, consumers report to have a perceived effectiveness score of 3.84 (SD=1.5) (see
Table 3).
Differences between countries in perceived effectiveness towards sustainable food
consumption
Denmark has the highest perceived effectiveness towards sustainable food
consumption compared to the other countries (except for France) (p<.01). France has a higher perceived effectiveness than The Netherlands and Italy (p<.05).
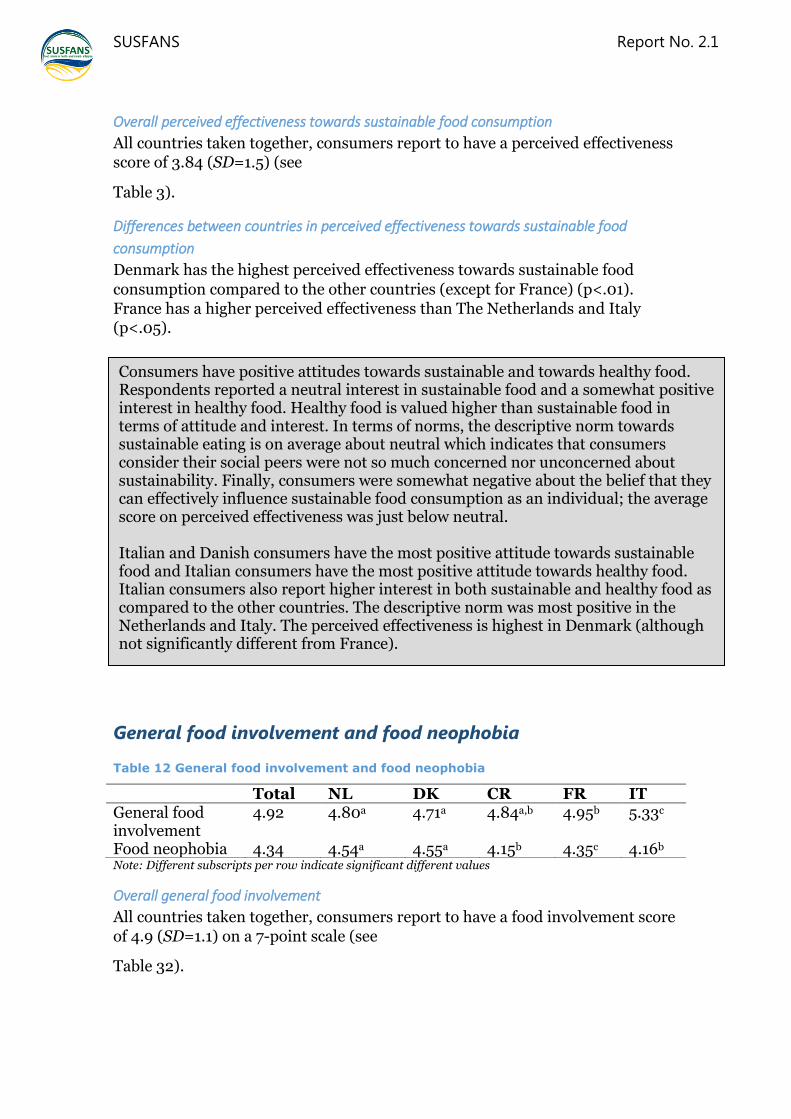
General food involvement and food neophobia Table 12 General food involvement and food neophobia
Note: Different subscripts per row indicate significant different values
Overall general food involvement
All countries taken together, consumers report to have a food involvement score of 4.9 (SD=1.1) on a 7-point scale (see
Table 32).
Total NL DK CR FR IT General food involvement
4.92 4.80a 4.71a 4.84a,b 4.95b 5.33c
Food neophobia 4.34 4.54a 4.55a 4.15b 4.35c 4.16b
Consumers have positive attitudes towards sustainable and towards healthy food. Respondents reported a neutral interest in sustainable food and a somewhat positive interest in healthy food. Healthy food is valued higher than sustainable food in terms of attitude and interest. In terms of norms, the descriptive norm towards sustainable eating is on average about neutral which indicates that consumers consider their social peers were not so much concerned nor unconcerned about sustainability. Finally, consumers were somewhat negative about the belief that they can effectively influence sustainable food consumption as an individual; the average score on perceived effectiveness was just below neutral. Italian and Danish consumers have the most positive attitude towards sustainable food and Italian consumers have the most positive attitude towards healthy food. Italian consumers also report higher interest in both sustainable and healthy food as compared to the other countries. The descriptive norm was most positive in the Netherlands and Italy. The perceived effectiveness is highest in Denmark (although not significantly different from France).
SUSFANS
Report No. 2.1
Differences between countries in general food involvement
Italy has the highest involvement with food compared to the other countries (p<.01). And France has a higher food involvement than The Netherlands and Denmark (p<.05).
Overall food neophobia
All countries taken together, consumers report to have a food neophobia score of 4.3 (SD=0.9) on a 7-point scale (see
Table 32).
Differences between countriesin food neophobia
The Netherlands and Denmark have the lowest food neophobia compared to all
the other countries (p<.01). On the other hand Italy and Czech Republica have the highest food neophobia compared to all the other countries (p<.01).
General food motives
Overall
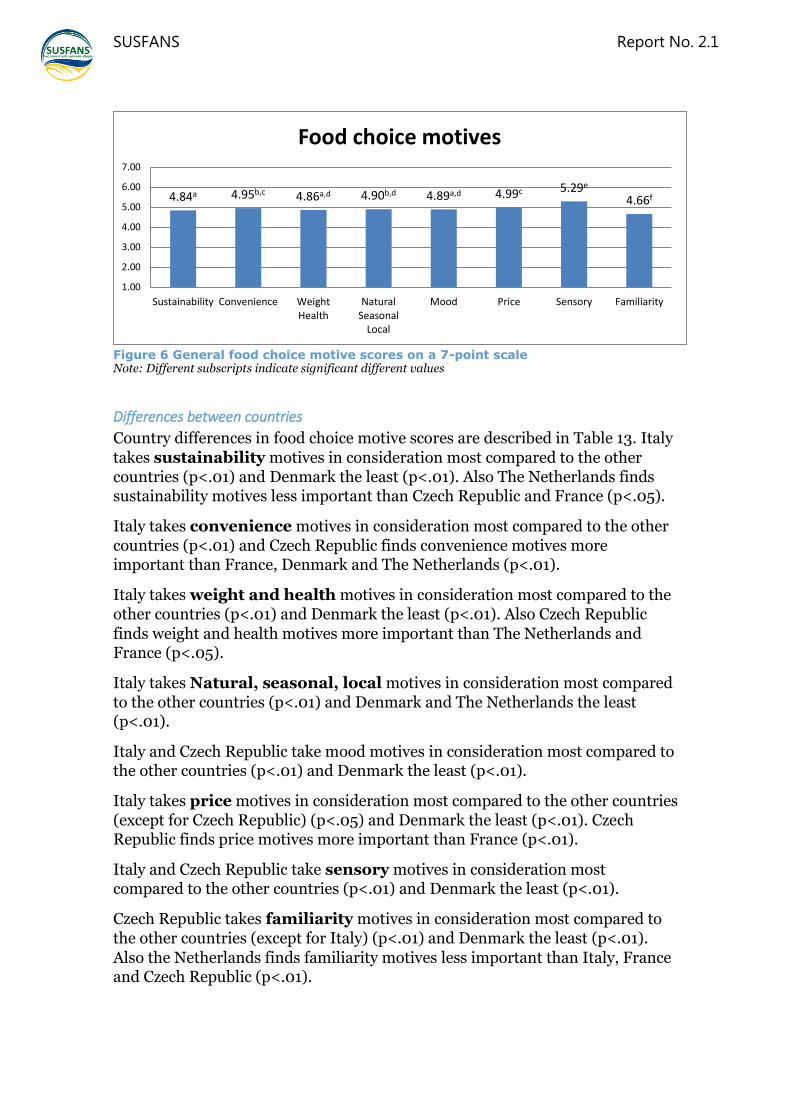
All countries taken together, consumers base their food choices mostly on sensory characteristics, like smell and taste (p<.01) (see Figure 6). Consumers base their food choices the least on familiarity (p<.01). Sustainability and health motives are less important than convenience, natural/seasonal/local, price and sensory characteristics, but more important than familiarity motives (p<.05).
Overall, consumer are rather involved with food. Consumers in Italy are most involved. Overall, consumers score average on food neophobia, not being very food neophobic nor very open to new foods. Consumers in The Netherland and Denmark are most open to new products and consumers from Italy and Czech Republic are least open.
SUSFANS
Report No. 2.1
Figure 6 General food choice motive scores on a 7-point scale Note: Different subscripts indicate significant different values
Differences between countries
Country differences in food choice motive scores are described in Table 13. Italy
takes sustainability motives in consideration most compared to the other countries (p<.01) and Denmark the least (p<.01). Also The Netherlands finds sustainability motives less important than Czech Republic and France (p<.05).
Italy takes convenience motives in consideration most compared to the other countries (p<.01) and Czech Republic finds convenience motives more important than France, Denmark and The Netherlands (p<.01).
Italy takes weight and health motives in consideration most compared to the other countries (p<.01) and Denmark the least (p<.01). Also Czech Republic
finds weight and health motives more important than The Netherlands and France (p<.05).
Italy takes Natural, seasonal, local motives in consideration most compared to the other countries (p<.01) and Denmark and The Netherlands the least (p<.01).
Italy and Czech Republic take mood motives in consideration most compared to the other countries (p<.01) and Denmark the least (p<.01).
Italy takes price motives in consideration most compared to the other countries (except for Czech Republic) (p<.05) and Denmark the least (p<.01). Czech Republic finds price motives more important than France (p<.01).
Italy and Czech Republic take sensory motives in consideration most compared to the other countries (p<.01) and Denmark the least (p<.01).
Czech Republic takes familiarity motives in consideration most compared to the other countries (except for Italy) (p<.01) and Denmark the least (p<.01).
Also the Netherlands finds familiarity motives less important than Italy, France and Czech Republic (p<.01).
4.84a 4.95b,c 4.86a,d 4.90b,d 4.89a,d 4.99c 5.29e 4.66f
1.00
2.00
3.00
4.00
5.00
6.00
7.00
Sustainability Convenience WeightHealth
NaturalSeasonal
Local
Mood Price Sensory Familiarity
Food choice motives

SUSFANS
Report No. 2.1
Table 13 Food choice motives
Note: Different subscripts per row indicate significant different values
Explaining sustainable consumption behaviour In this section we will look into which characteristics influence openness to different types of products as replacers of meat (animal-based, plant-based, new/unknown).
Three hierarchical regression analyses have been conducted with openness to
animal-based product, plant-based products and new product as alternatives of meat as the dependent variables. In Block 1, country and demographic variables have been included. In the second block, general psychosocial variables (general food involvement and food neophobia) were added. In the third block, specific psychosocial variables for sustainable food were added and in block 4, specific
psychosocial variables for health were added. In the last block, general food choice motives were introduced.
Almost all underlying values, motives, and characteristics that we included in this study were associated with openness to different types of products as
NL DK CZ FR IT Sustainability 4.71a 4.48b 4.89c 4.89c 5.25d
Convenience 4.86a 4.73a 5.08b 4.81a 5.28c
Weight control and health
4.82a 4.47b 4.99c 4.70a 5.32d
Natural, seasonal and local
4.51a 4.37a 5.06b 5.08b 5.49c
Mood 4.75a 4.39b 5.18c 4.86a 5.25c
Price 5.06a,b 4.41c 5.21a,d 5.01b 5.23d
Sensory appeal 5.28a 5.12b 5.26a 5.29a 5.49c
Familiarity 4.58a 3.84b 5.07c 4.87d 4.94c,d
All countries taken together, consumers base their food choices mostly on sensory characteristics, like smell and taste and least on familiarity. In addition, sustainability and health motives are less important than convenience, natural/seasonal/local, price and sensory characteristics. Looking at differences between countries it is striking that Italian consumers attach the most value to almost all the motives, except for familiarity. Denmark considers sustainability motives as well as health/weight motives least important, and Denmark together with the Netherlands attaches the least importance to natural/ seasonal/ local.
SUSFANS
Report No. 2.1
replacers of meat (animal-based, plant-based, new/unknown) but effect sizes were generally small (See appendix II). For demographics in the first block, the results confirm the country differences that were reported earlier. Most countries differed from each other in openness to the different categories of
meat alternatives. Women, older respondents, and higher educated consumers were more open to animal-based meat alternatives, whereas consumers with a lower income were less. Women, younger respondents, and higher educated consumers were more open to plant-based meat alternatives, whereas consumers with a lower income were less. Men, younger respondents, and
higher educated consumers were more open to new meat alternatives, whereas consumers with a lower income were less.
For aspects related to general food choice in the second block both a higher food involvement and higher food neophobia were related to higher openness to all categories of meat alternatives. For the other variables in the third and fourth block (aspects related more directly to sustainable food and aspects related to healthy food respectively) more mixed results were found. For animal-based products consumers with a positive attitude towards sustainable food and towards healthy food, a lower subjective knowledge about sustainable food, a lower general sustainability interest and a higher descriptive norm towards sustainable eating are more open. For plant-based products, consumers with a more positive attitude towards sustainable food, a higher general sustainability interest, a higher descriptive norm towards sustainable eating, higher subjective knowledge about healthy food, and higher general interest in health food are more open. For new products, consumers with a less positive attitude towards sustainable food and towards healthy food, lower perceived effectiveness towards sustainable food consumption, a higher descriptive norm towards sustainable eating and lower general interest in health food are more open.
Finally, for general food motives (in the fifth block) the following patterns were found: Natural/seasonal/local motives and sensory motives were related to higher openness towards animal-based products. Sustainability motives, weight control and health, and natural/seasonal/local motives were related to more openness towards plant-based products while sensory motives and familiarity
motives were related to lower openness. Weight control and health and mood motives were related to more openness and sensory motives to less openness towards new products.
Almost all underlying values, motives, and characteristics that we included in this study were associated with openness to different types of products alternatives for meat (animal-based, plant-based, new/unknown) but effect sizes were generally small. For all alternatives, country differences were found. For plant-based products, consumers who have a higher general food interest, who are less neophobic, and who have a more positive attitude towards sustainability, a higher sustainability interest and a higher descriptive norm towards sustainable eating are most open. For animal-based products, consumers who have a higher general food interest, who are less neophobic, who have a more positive attitude towards sustainable food and healthy food are most open. For new products, consumers who are male and younger, have a more positive descriptive norm towards sustainable eating, more negative attitude towards health, and find sensory motives for food in general less important are most open.

SUSFANS
Report No. 2.1
SUSFANS
Report No. 2.1
Conclusion and general discussion
Summary of the main results and their implications
Sustainable behaviour For consumers, important aspects of sustainability are: Seasonal fruits and vegetables, food waste, water use and use of natural resources. These aspects were most often mentioned as aspects of sustainable food and are considered most important. Interestingly, ethical aspects such as fair trade and global food availability and health aspects scored low. For most consumers, the definition of
sustainable food thus seems more narrow and focussed on the environmental aspect.
Self-reported intake of sustainable foods shows that seasonal/local food was the most frequent sustainable food behaviour, followed by free range products/products with a sustainability logo/smaller portions, followed by organic/fair trade products, and least frequently vegetarian products. It would be interesting to see to which degree consumers are actually aware of these
aspects in the supermarket. Previous studies on logos for example, showed that consumers are not so aware of sustainability logos (Grunert, Hieke & Wills, 2014).
When respondents were asked about alternatives for meat, they were most open to animal-based products (fish, cheese and eggs), but on average, still only moderately positive. The second favourite alternative for meat are plant-based products to which they are, on average, moderately negative. Consumers are
least open to new products like insects or in vitro meat. Consumers are thus most open for the alternative that has the least benefits in terms of (environmental) sustainability. For a replacement of meat by plant-based alternatives there seems to be a longer way to go and for new products consumers are generally not open. It would be interesting to see to what degree
consumers are aware of the different sustainability impacts of meat alternatives. And to further explore which subgroups of the populations are open to the more sustainable alternatives. The paragraph on drivers later in this section gives some first insights on this topic.
Overall, consciousness of sustainable consumption is on average moderately low. Consumers are most conscious about sustainable consumption from an economic viewpoint, followed by the social viewpoint, and least conscious about
sustainable consumption from an environmental viewpoint. For general sustainable behaviours (e.g. turning off lights) consumers indicate to perform these neither frequent nor infrequent. For policy, it thus seems most relevant to focus communication and interventions on the economic (e.g. only buy what you really need) and social viewpoint rather than on environmental viewpoint
(e.g. recycling). Or to focus on increasing consciousness from an environmental

SUSFANS
Report No. 2.1
viewpoint. Note that consumers are thus most conscious to the economic and social viewpoint but that their perception of the concept “sustainability” is more focussed on the environmental aspect.
Underlying factors of sustainable behaviour In terms of attitude, we see that healthy food is higher valued than sustainable food. On average, consumers report to have positive attitudes towards both
sustainable and healthy food and they have a somewhat positive interest in heathy food, but a neutral interest in sustainable food. Also, consumers (believe to) know more about healthy food than about sustainable food. On average, they score moderately positive on their perception of their own health knowledge and moderately negative on perception of their own sustainability knowledge.
The finding that health is perceived more positive by consumers than sustainability confirms earlier results that health can function as a carrier for sustainable food behaviour, because those concepts are often linked in the perception of consumers (Verain et al., 2016).
In terms of norms, the descriptive norm towards sustainable eating is neutral, which indicates that consumers didn’t think their social peers eat sustainable diets frequently nor infrequently. Consumers are also not particularly willing to
pay extra for a sustainable product and if they do, they would rather pay extra for a product than pay extra taxes on a product for clean-up programs. Finally, consumers weren’t totally convinced that they could effectively influence sustainable food consumption as an individual. Overall, this confirms that social norms and perceived efficacy are not strong drivers towards sustainable food
consumptions. Again, more research in needed to see how these underlying factors could be influenced.
For food in general, consumers are rather involved with food and not food neophobic nor very open to new foods. The results on drivers of behaviour show that food involvement and (lack of) food neophobia are also important factors related to openness to meat alternatives. This might thus be a way to increase sustainable food consumption, by increasing involvement in food and decreasing food neophobia.
Consumers base their food choices mostly on sensory characteristics, (e.g. smell and taste) and least on familiarity. Sustainability and health motives are less important than convenience, natural/seasonal/local, price and sensory characteristics. So when introducing new food choices, these results should be taken into consideration. A good sensory quality seems an important
prerequisite to successfully introduce new food choices (De Boer, Schösler & Boursema, 2013).
Differences between countries In The Netherlands air and water pollution were frequently mentioned as aspects of sustainable food, and also considered important. Consumers in The Netherlands score relatively low on all sustainable food behaviours, and
SUSFANS
Report No. 2.1
specifically on seasonal/local products. For food choice in general, they find natural/ seasonal/ local the least important. They are also among the countries that are least conscious about sustainable food and least open to new products. On objective knowledge towards sustainable food, however, they have one of the
highest scores and also the descriptive norm was most positive in the Netherlands.
In Denmark organic food and animal welfare were most often mentioned as aspects of sustainable food and considered important. Also, more intake of organic/fair trade and free range products/products with a sustainability logo/smaller portions were reported. They have one of the most positive attitudes towards sustainable food, highest perceived effectiveness, and highest
objective knowledge score. On the other hand, Danish consumers perform significantly less sustainable behaviours, are also among the countries that are least conscious about sustainable food, and are least open to new products. For food in general, the Danish considered sustainability motives, natural/ seasonal/ local, and health/weight motives less important.
In Czech Republic healthy food and land use were often mentioned as aspects of sustainable food. Czech Republic scores relatively low on all sustainable food
behaviours, and specifically on organic/fair trade consumption, and also low on subjective knowledge. Noticeably, in Czech Republic consumers are more open to animal-based meat alternatives as compared to the other countries and least open to new products as meat alternatives.
In France local and regional food and transportation distance were often mentioned and also considered important. French respondents had a relatively high intake of free range products/products with a sustainability logo/smaller portions.
In Italy food safety was often mentioned and considered important. Italian consumers scored high on many sustainable behaviours and underlying factors. They reported higher intake of seasonal/local food, vegetarian food and organic/fair trade food and reported to perform sustainable behaviours the most. They were most open to plant-based alternatives, most conscious from all
three viewpoints, have the highest scores on subjective knowledge, are most willing to pay extra, have the most positive attitude towards sustainable food, have higher interest in sustainable food and report a more positive norm. In contrast, Italians have the lowest scores on objective knowledge about sustainable food. For food in general, they are most involved and attach the most value to almost all the motives for food choice, except for familiarity.
Drivers of change Almost all underlying values, motives, and characteristics that we included in this study were predictors of openness to different categories of meat
alternatives (animal-based, plant-based, new/unknown) but effect sizes were generally small. For openness for plant-based products, consumers who have a
SUSFANS
Report No. 2.1
higher general food interest, who are less neophobic, and who have a more positive attitude towards sustainability, a higher sustainability interest and a higher descriptive norm towards sustainable eating are most open. For animal-based meat alternatives, consumers who have a higher general food interest,
who are less neophobic, who have a more positive attitude towards sustainable food and healthy food are most open. For new products, consumers who are male and younger, have a more positive descriptive norm towards sustainable eating, more negative attitude towards health, and find sensory motives for food in general less important are most open.
Discussion: limitations of the study The main strength of the study are the methods and data collection procedures.
We used mostly validated questionnaires and also the self-developed
questionnaires performed well. A large sample was included from 5 countries
and divers in terms of demographic characteristics. Finally, the research
procedure was thorough with translations - back translations and a quantitative
pilot to ensure a good quality of the instruments. As with any research design, a
number of limitations need to be kept in mind:
The main caveat of the study relates to the interpretation of self-reported
data. The replies of the respondents are of hypothetical nature since they
are not measured while the actual behaviour is conducted (e.g. choosing
food in supermarkets). This means that self-reported behaviour such as
sustainable food intake might not always correspond with true behaviour,
for example due to imperfect recall. Also, reported intentions, such as
importance of food motives or willingness to pay may in the end not
determine purchase and eating behaviour due to the presence of other
(contextual) factors (e.g. price promotions, lack of time, etc.). This effect
of upward bias in hypothetical settings has been studied extensively for
choice experiments in the lab (e.g. List and Wallet, 2001). Finally, self-
reported answers can always be influenced by social desirability. It is
therefore likely that the positive attitudes and reported sustainable and
health behaviour are positively biased.
Related to this, we cannot exclude the possibility that differences in the
results between countries are attributable to cultural differences in scale
use.
The items of the objective knowledge questionnaire were developed by
Dutch researchers. This might (partly) explain the higher scores in The
Netherlands since the topics and specific examples could by biased by the
topics in Dutch media.
Since there are no theoretical models on sustainable food consumption the
nature of the results is mostly descriptive with many underlying variables and
SUSFANS
Report No. 2.1
different outcome variables. This resulted in a large number of analyses. Also, a
large sample results in a higher power of the study where small differences are
significant. Therefore, the effect sizes should also be considered when
translating the results to implications.
Conclusion Recommendations for improving dietary patterns towards a more sustainable diet are most effective when they are in line with consumers’ attitudes and willingness to change. The aim of this task was therefore to get a better
understanding of consumers’ drivers of dietary change regarding sustainable consumption.
The results give us insights in how consumers see sustainable food behaviour and to what degree they perform sustainable behaviour. As discussed in the introduction, consumers can adopt different strategies or behaviours to change or replace their unsustainable food intake (e.g. meat). Eating seasonal/local food and to a lesser degree free range products/products are the most popular
strategies. In terms of directions for willingness to change their meat-consumption, other animal-based products (e.g. cheese, eggs and fish) are the most popular alternatives. For new products like in vitro meat or insects their doesn’t seem to be a lot of enthusiasm. A survey cannot directly answer the question how willing consumers are to change but the results give some insights
that are small but positive in favour of sustainable food consumption. We see that on average, consumers report to have a positive attitude and a neutral interest in sustainable food.
Consumers are most conscious about sustainable consumption from an economic viewpoint (even if I can afford a product, do I need it / is it useful, etc.) compared to a social (I only buy a product when: No child labour is involved / No workers are abused, etc.) and an environmental viewpoint (I only
buy a product when: It is made of recycled materials/ can be disposed of in an environmentally friendly way, etc.). Also, the degree to which they perform sustainable food behaviours depends on their demographic as well as psychographic characteristics. Almost all underlying values, motives, and characteristics that we included in this study were associated with openness to
different types of products as alternatives for meat (animal-based, plant-based, new/unknown). Only, the general food motives convenience and price were unrelated.
Finally, country differences give us some insights in specific points of attention that should be considered in the final recommendation. Consumers in the different countries have somewhat different views on sustainability and are to some degree driven by different variables underlying sustainable food behaviour.

SUSFANS
Report No. 2.1
References Aertsens, J., Verbeke, W., Mondelaers, K., & Van Huylenbroeck, G. (2009). Personal determinants of organic food consumption: a review. British Food Journal, 111(10), 1140-1167. Arvola, A., Vassallo, M., Dean, M., Lampila, P., Saba, A., Lähteenmäki, L., & Shepherd, R. (2008). Predicting intentions to purchase organic food: The role of affective and moral attitudes in the Theory of Planned Behaviour. Appetite, 50(2), 443-454. Bezençon, V., & Blili, S. (2011). Segmenting the market through the determinants of involvement: The case of fair trade. Psychology & Marketing, 28(7), 682-708. De Boer, J., Hoogland, C. T., & Boersema, J. J. (2007). Towards more sustainable food choices: Value priorities and motivational orientations. Food Quality and Preference, 18(7), 985-996. De Boer, J., Schösler, H., & Boersema, J. J. (2013). Motivational differences in food orientation and the choice of snacks made from lentils, locusts, seaweed or “hybrid” meat. Food Quality and Preference, 28(1), 32-35. Dowd, K., & Burke, K. J. (2013). The influence of ethical values and food choice motivations on intentions to purchase sustainably sourced foods. Appetite, 69, 137-144. Grunert, S. C., & Juhl, H. J. (1995). Values, environmental attitudes, and buying of organic foods. Journal of Economic Psychology, 16(1), 39-62. Health Council of the Netherlands (2011). Richtlijnen geode voeding ecologisch belicht. Den Haag: Gezondheidsraad. LNV. (2009). Nota Duurzaam Voedsel: Naar een duurzame consumptie en productie van ons voedsel. Lockie, S., Lyons, K., Lawrence, G., & Mummery, K. (2002). Eating 'green': Motivations behind organic food consumption in Australia. Sociologia Ruralis, 42(1), 23-40. Lindeman, M., & Väänänen, M. (2000). Measurement of ethical food choice motives. Appetite, 34(1), 55-59. List, J.A. & Gallet, C.A. (2001). What Experimental Protocol Influence Disparities Between Actual and Hypothetical Stated Values? Environmental and Resource Economics, 20, 241. Grunert, K. G., Hieke, S., & Wills, J. (2014). Sustainability labels on food products: Consumer motivation, understanding and use. Food Policy, 44(0), 177-189. Raynolds, L. T. (2002). Consumer/Producer Links in Fair Trade Coffee Networks. Sociologia Ruralis, 42(4), 404-424. Tanner, C., & Wölfing Kast, S. (2003). Promoting sustainable consumption: Determinants of green purchases by Swiss consumers. Psychology & Marketing, 20(10), 883-902. Toma, L., McVittie, A., Hubbard, C., & Stott, A. W. (2011). A structural equation model of the factors influencing British consumers' behaviour toward animal welfare. Journal of Food Products Marketing, 17(2-3), 261-278. Verain, M. C. D., Sijtsema, S. J., & Antonides, G. (2016). Consumer segmentation based on food-category attribute importance: The relation with
SUSFANS
Report No. 2.1
healthiness and sustainability perceptions. Food Quality and Preference, 48, 99-106. Vermeir, I., & Verbeke, W. (2006). Sustainable food consumption: Exploring the consumer “attitude–behavioural intention” gap. Journal of Agricultural and Environmental ethics, 19(2), 169-194.
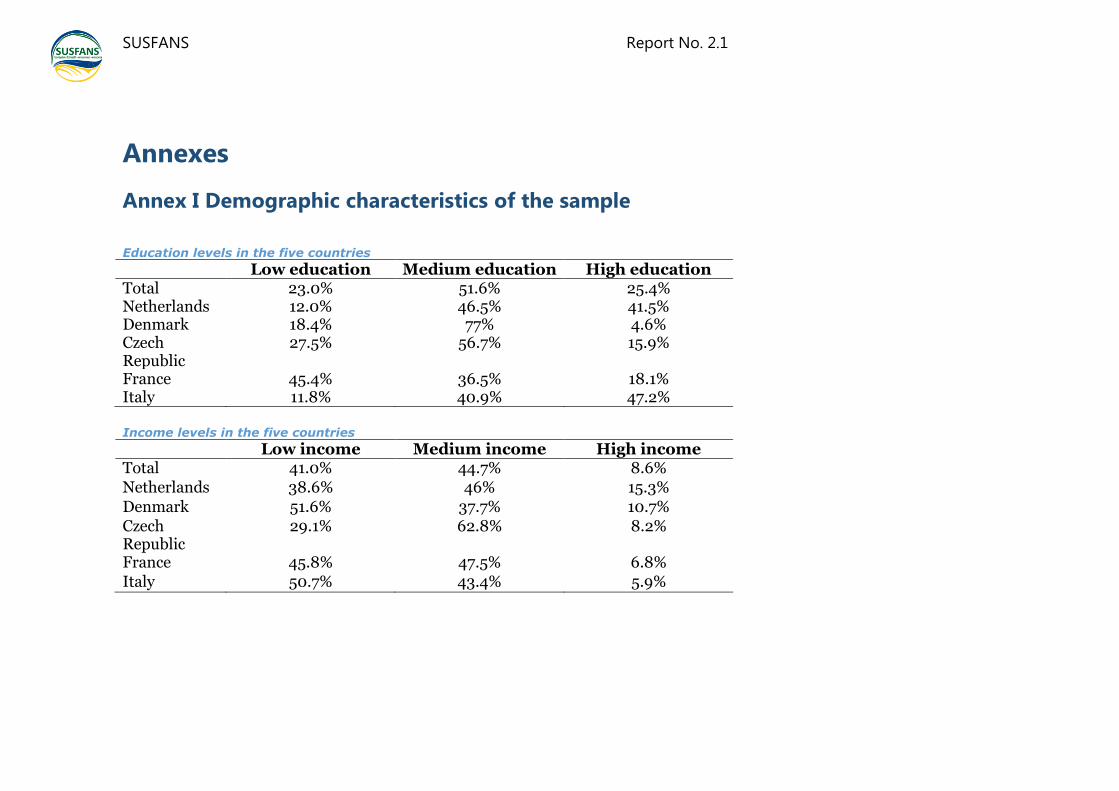
SUSFANS
Report No. 2.1
Annexes
Annex I Demographic characteristics of the sample
Education levels in the five countries
Low education Medium education High education Total 23.0% 51.6% 25.4% Netherlands 12.0% 46.5% 41.5% Denmark 18.4% 77% 4.6% Czech Republic
27.5% 56.7% 15.9%
France 45.4% 36.5% 18.1% Italy 11.8% 40.9% 47.2% Income levels in the five countries
Low income Medium income High income Total 41.0% 44.7% 8.6% Netherlands 38.6% 46% 15.3%
Denmark 51.6% 37.7% 10.7% Czech Republic
29.1% 62.8% 8.2%
France 45.8% 47.5% 6.8% Italy 50.7% 43.4% 5.9%
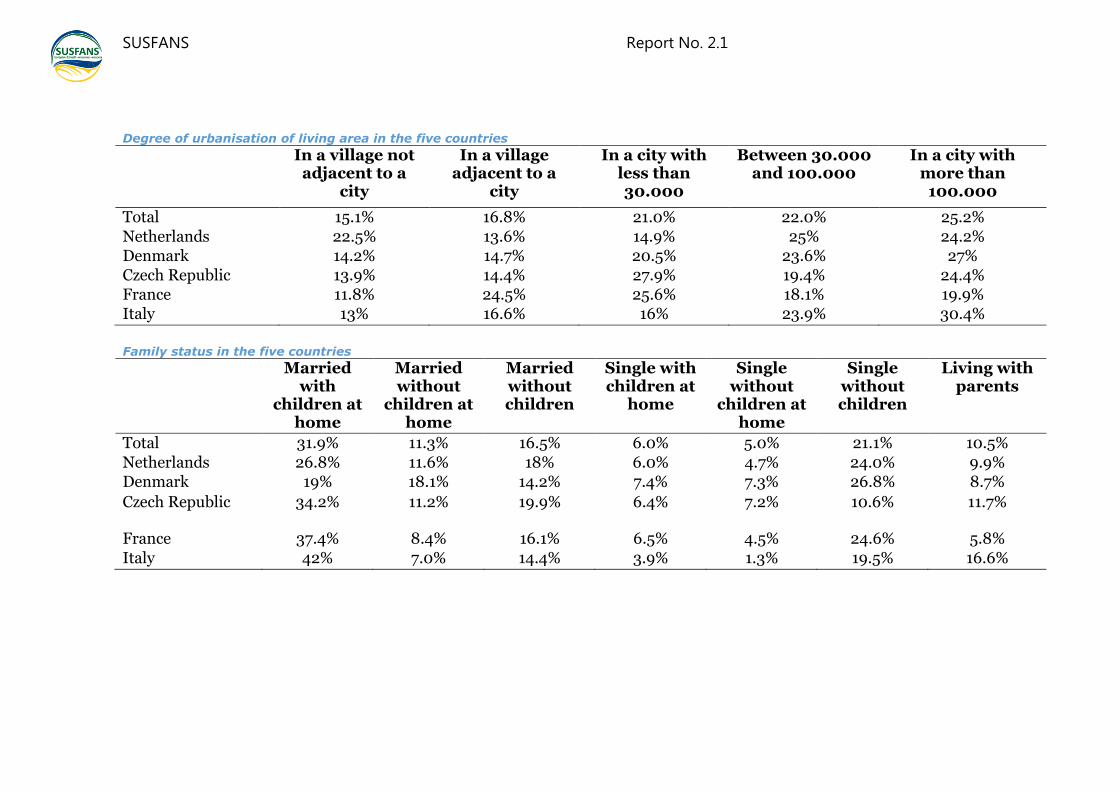
SUSFANS
Report No. 2.1
Degree of urbanisation of living area in the five countries
In a village not adjacent to a
city
In a village adjacent to a
city
In a city with less than 30.000
Between 30.000 and 100.000
In a city with more than
100.000
Total 15.1% 16.8% 21.0% 22.0% 25.2%
Netherlands 22.5% 13.6% 14.9% 25% 24.2% Denmark 14.2% 14.7% 20.5% 23.6% 27% Czech Republic 13.9% 14.4% 27.9% 19.4% 24.4% France 11.8% 24.5% 25.6% 18.1% 19.9% Italy 13% 16.6% 16% 23.9% 30.4%
Family status in the five countries
Married with
children at home
Married without
children at home
Married without children
Single with children at
home
Single without
children at home
Single without children
Living with parents
Total 31.9% 11.3% 16.5% 6.0% 5.0% 21.1% 10.5%
Netherlands 26.8% 11.6% 18% 6.0% 4.7% 24.0% 9.9% Denmark 19% 18.1% 14.2% 7.4% 7.3% 26.8% 8.7%
Czech Republic 34.2% 11.2% 19.9% 6.4% 7.2% 10.6% 11.7%
France 37.4% 8.4% 16.1% 6.5% 4.5% 24.6% 5.8%
Italy 42% 7.0% 14.4% 3.9% 1.3% 19.5% 16.6%

SUSFANS
Report No. 2.1
Annex II Regressions on openness to different categories of meat alternatives
Animal-based products Plant-based products New products B SE B β B SE B β B SE B Β
Step 1 Constant 4.587 0.086 4.117 0.087 3.175 0.093 Dummy Netherlands -0.102 0.063 -0.029 0.122 0.063 0.034 0.135 0.068 0.034* Dummy Czech Republic 0.434 0.059 0.135*** 0.134 0.059 0.041* -0.358 0.063 -0.099*** Dummy France 0.298 0.059 0.094*** 0.411 0.059 0.127*** 0.284 0.064 0.080***
Dummy Italy 0.233 0.060 0.073*** 0.419 0.061 0.130*** -0.050 0.065 -0.014 Gender -0.312 0.037 -0.120*** -0.297 0.037 -0.113*** 0.495 0.040 0.170*** Age 0.007 0.001 0.076*** -0.007 0.001 -0.066*** -0.025 0.002 -0.225*** Dummy low education -0.305 0.059 -0.099*** -0.548 0.059 -0.176*** -0.276 0.064 -0.080*** Dummy medium education -0.099 0.049 -0.038* -0.282 0.049 -0.107*** -0.272 0.053 -0.093*** Dummy low income -0.124 0.040 -0.048** -0.100 0.040 -0.038* -0.166 0.043 -0.056***
Dummy high income 0.018 0.067 0.004 0.055 0.068 0.012 -0.111 0.073 -0.022
Step 2 General food involvement 0.277 0.017 0.234*** 0.246 0.017 0.206*** 0.045 0.019 0.034* Food neophobia 0.237 0.019 0.171*** 0.171 0.020 0.121*** 0.066 0.022 0.042**
Step 3 Subjective knowledge about sustainable food
-0.045 0.017 -0.040** 0.012 0.017 0.011 0.037 0.019 0.029
Attitude towards sustainable food 0.165 0.016 0.155*** 0.143 0.016 0.133*** -0.051 0.018 -0.043** General sustainability interest -0.043 0.021 -0.035* 0.212 0.021 0.169*** -0.002 0.024 -0.002
Descriptive norm towards eating sustainable
0.088 0.016 0.083*** 0.112 0.016 0.105*** 0.294 0.017 0.249***
Perceived effectiveness towards sustainable food consumption
-0.018 0.012 -0.021 -0.013 0.012 -0.016 -0.055 0.013 -0.058***
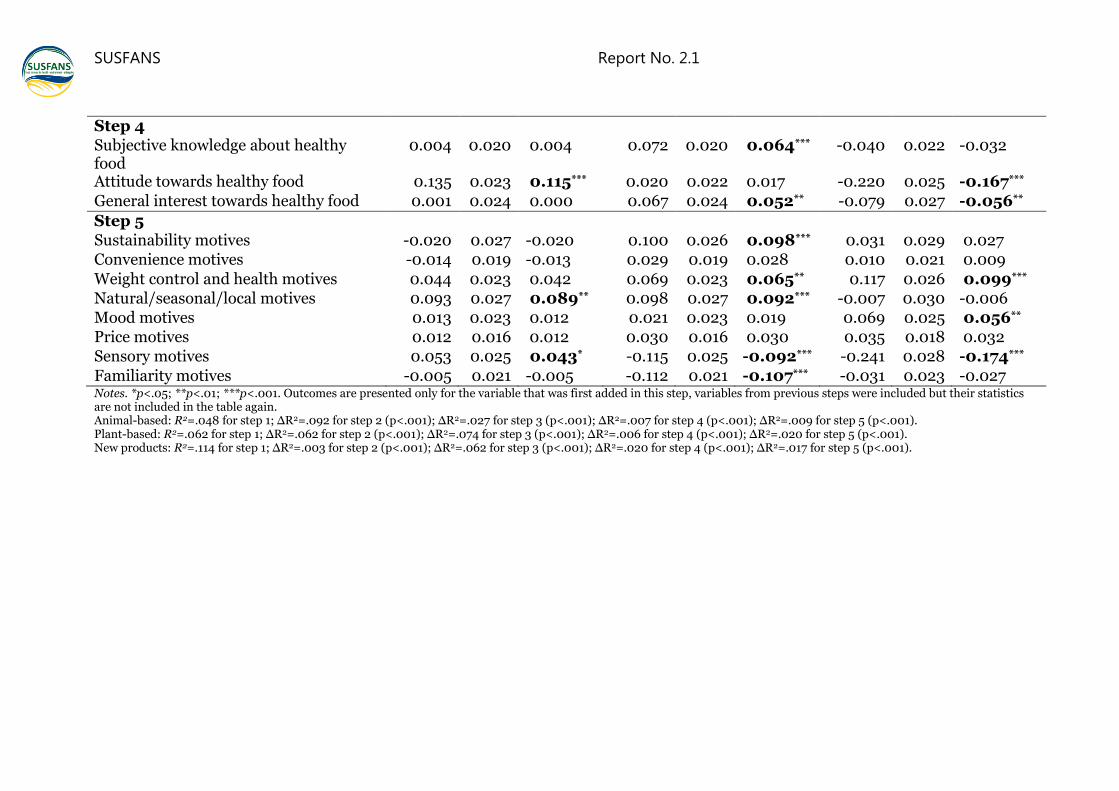
SUSFANS
Report No. 2.1
Step 4 Subjective knowledge about healthy food
0.004 0.020 0.004 0.072 0.020 0.064*** -0.040 0.022 -0.032
Attitude towards healthy food 0.135 0.023 0.115*** 0.020 0.022 0.017 -0.220 0.025 -0.167***
General interest towards healthy food 0.001 0.024 0.000 0.067 0.024 0.052** -0.079 0.027 -0.056**
Step 5 Sustainability motives -0.020 0.027 -0.020 0.100 0.026 0.098*** 0.031 0.029 0.027 Convenience motives -0.014 0.019 -0.013 0.029 0.019 0.028 0.010 0.021 0.009
Weight control and health motives 0.044 0.023 0.042 0.069 0.023 0.065** 0.117 0.026 0.099*** Natural/seasonal/local motives 0.093 0.027 0.089** 0.098 0.027 0.092*** -0.007 0.030 -0.006 Mood motives 0.013 0.023 0.012 0.021 0.023 0.019 0.069 0.025 0.056** Price motives 0.012 0.016 0.012 0.030 0.016 0.030 0.035 0.018 0.032 Sensory motives 0.053 0.025 0.043* -0.115 0.025 -0.092*** -0.241 0.028 -0.174***
Familiarity motives -0.005 0.021 -0.005 -0.112 0.021 -0.107*** -0.031 0.023 -0.027 Notes. *p<.05; **p<.01; ***p<.001. Outcomes are presented only for the variable that was first added in this step, variables from previous steps were included but their statistics are not included in the table again. Animal-based: R2=.048 for step 1; ΔR2=.092 for step 2 (p<.001); ΔR2=.027 for step 3 (p<.001); ΔR2=.007 for step 4 (p<.001); ΔR2=.009 for step 5 (p<.001). Plant-based: R2=.062 for step 1; ΔR2=.062 for step 2 (p<.001); ΔR2=.074 for step 3 (p<.001); ΔR2=.006 for step 4 (p<.001); ΔR2=.020 for step 5 (p<.001). New products: R2=.114 for step 1; ΔR2=.003 for step 2 (p<.001); ΔR2=.062 for step 3 (p<.001); ΔR2=.020 for step 4 (p<.001); ΔR2=.017 for step 5 (p<.001).