Embed Size (px)
Citation preview
About the Authors
ETTI BARANOFFDr. Etti Baranoff is an associate professor of risk management, insurance, and financeat the School of Business at Virginia Commonwealth University (VCU) in Richmond,Virginia, where she has taught since 1995. She has been in the insurance field for overthirty years. Prior to entering academia, she worked in the insurance industry and as aTexas insurance regulator. She began her insurance career as a pension administratorand market and product research analyst at American Founder’s Life Insurance Com-pany in Austin, Texas, in 1978. In 1982 she began a twelve-year career as a Texas insur-ance regulator, beginning with actuarial work for the rate promulgation of property/casualty lines of insurance, following with legislative research work on all topics.
Dr. Baranoff has spoken at many insurance and finance forums and won variousawards for her research and teaching. She is a member of the prestigious Risk TheorySeminar and has published in prominent journals, including the Journal of Risk and In-surance, the Journal of Banking and Finance, the Geneva Papers on Risk and Insurance,the Journal of Insurance Regulation, Best’s Review, and Contingencies of the AmericanAcademy of Actuaries, among others. She is also one of the authors of another textbook: Risk Assessment by the American Institutefor CPCU.
Dr. Baranoff has authored or co-authored more than fifty papers relating to risk management and insurance. Her work, whichconsiders issues such as capital structure, detection of potential insolvencies, asset allocation and performance, and market discip-line, is all within the context of enterprise risk and enterprise risk management. She has received various honors and recognitionsduring her career, including five awards given by the International Insurance Society (2008, 2006, 2004, 1996, and 1995). She was re-cognized as the 2005 Distinguished Scholar by the VCU School of Business and was a seven-time winner of research awards given bythe business school. She was also the recipient of the 1990 Spencer Scholarship Award (RIMS) and the 1989 Vestal Lemmon Presid-ential Scholarship at the University of Texas at Austin.
Along with her articles published in academic and nonacademic journals and periodicals, her textbooks, and countless present-ations at various meetings and conferences, Dr. Baranoff is often quoted in major newspapers and has appeared on various TV sta-tions on matters of insurance and risk management. Her presentations are available at the VCU School of Business Web site, whichfeatures a video, “On the Topic,” about her expertise in risk management.
Dr. Baranoff has been a member of several professional societies, including the already noted Risk Theory Seminar (aninvitation-only society), the Financial Management Association (FMA), the American Risk and Insurance Association (ARIA), theWestern Risk and Insurance Association (WRIA), and the Southern Risk and Insurance Association (SRIA).
In addition to her PhD in finance with minors in insurance and statistics from the University of Texas at Austin in 1993 and herBA in economics and statistics from the University of Tel Aviv, Israel, in 1971, Dr. Baranoff also holds the fellow of Life Manage-ment Institute designation with distinction. She was a high school economics and social sciences teacher and earned a teaching cer-tificate in social sciences from the University of Tel Aviv in 1974. She has served as an expert in a number of cases.
E-mail: [email protected] or [email protected]: http://www.professorofinsurance.com.
PATRICK L. BROCKETTDr. Patrick L. Brockett holds the Gus S. Wortham Memorial Chair in Risk Manage-ment and Insurance in the Department of Information, Risk, and Operations Manage-ment at the University of Texas at Austin. He is the director of the risk managementprogram and the director of the Center for Risk Management and Insurance Researchand holds a joint appointment as a full professor in the departments of Information,Risk, and Operations Management; Finance; and Mathematics. Prior to becoming thedirector of the risk management program, he served as the director of the actuarial sci-ence program at the University of Texas at Austin. He is the former director of theCenter for Cybernetic Studies and is a fellow of the Institute of Risk Management, a fel-low of the Institute of Mathematical Statistics, a fellow of the American Statistical Asso-ciation, a fellow of the Royal Statistical Society, and a fellow of the American Associ-ation for the Advancement of Science.
Dr. Brockett has taught and done research in the fields of risk, insurance, and actu-arial science for almost thirty years. His research articles have won awards from the
American Risk and Insurance Association, the American Statistical Association, the Society of Actuaries, the International Insur-ance Society, and the Casualty Actuarial Society, as well as from the Faculty of Actuaries of Scotland and Institute of Actuaries inEngland. He is listed as one of the top ten most published researchers in the world in the seventy-five-year history of the Journal ofRisk and Insurance (the premier academic journal in risk management and insurance in the world) in terms of the number of pagespublished. He was presented with the American Risk and Insurance Association Outstanding Achievement Award, won the RobertI. Mehr Award given by the American Risk and Insurance Association “for that journal article making a ten-year lasting contribu-tion to risk management” and having “withstood the test of time,” and won the Halmsted Prize for the Most Outstanding EnglishLanguage Publication in Actuarial Science in the World, presented by the Society of Actuaries. He served as editor of the Journal ofRisk and Insurance for nine years and in this capacity also became familiar with multiple aspects of insurance, including institutionaldetails, market performance, agent behavior and responsibilities, and standard practice in the insurance industry.
Dr. Brockett worked with the Texas Department of Insurance on credit scoring and did a study for the Texas legislature oncredit scoring as well. He currently serves as a member of the board of directors of the Texas Property and Casualty Guaranty Asso-ciation. He is a past president of the American Risk and Insurance Association, the premier academic organization in risk manage-ment and insurance in the world. He has published four books or monographs and over 130 scientific research papers. He regularlyteaches classes involving insurance and risk management. He received his PhD in mathematics in 1975 from the University of Cali-fornia at Irvine, California.
E-mail: [email protected].
YEHUDA KAHANEDr. Yehuda Kahane is active in both the academic and business areas. He is a professorof insurance and finance, Faculty of Management, Tel Aviv University, and head of theAkirov Institute for Business and the Environment. He founded and served as the deanof the first academic school of insurance in Israel (now a part of Netanya AcademicCollege). At Tel Aviv University he directed the Erhard Insurance Center and the actu-arial studies program and coordinated the executive development program. He is a lifeand nonlife actuary.
Over more than forty years, Dr. Kahane has taught at universities around theglobe, including the Wharton School at the University of Pennsylvania, the Universityof Texas at Austin, the Hebrew University of Jerusalem, the University of Florida, andthe University of Toronto, among others. He founded and has directed the Israel CLUprogram. He has also organized and lectured in hundreds of seminars and conferences.
Dr. Kahane, the author of several books and numerous articles, was ranked amongthe most prolific researchers in insurance (Journal of Risk and Insurance, June 1990). In
the late 1960s he was among the pioneers that applied multiple regressions for insurance rate making. In the early 1970s he de-veloped the concept of balancing assets and liabilities of financial intermediaries, in works that are still quoted thirty years later.These studies laid the foundations for theories of insurance rate making, solvency, insurance regulation, and the vast area that isnow known as ERM—enterprise risk management. He has major contributions to the theory and practice of loss reserving, agricul-ture and crop insurance, and the use of data mining in insurance.
Dr. Kahane also has a rich entrepreneurial experience. He is a co-founder, director, and major shareholder in Ituran Locationand Control (ITRN). He was a co-initiator of the concept of “new” balanced pension funds in Israel and was the co-founder and co-owner of the managing firm of the first fund (Teshura) that became the fourth largest fund in Israel in 1995. He is highly involved inthe formation and management of start-up companies in a variety of advanced and high-tech areas, specializing in seed money
2 RISK MANAGEMENT FOR ENTERPRISES AND INDIVIDUALS
investments. He owns the Weizman Hi-Tech Incubator and is a co-owner of Capital Point Ltd. (traded on TASE), which ownsOfakim and Kazrin technological incubators. In addition, he is involved in many voluntary NGO activities, including thePIBF—Palestinian International Business Forum—and chairman of the Association of Visually Impaired People in Sharon District,Or Yarok—an association for prevention of traffic accident victims.
He started his business career in a large multinational corporation and in the management of various businesses. In addition, heserved as a consultant on risk management, insurance, and actuarial and financial topics to the government, large organizations, andmajor companies both in Israel and internationally. Dr. Kahane has served on the Israeli Insurance Council and on several govern-ment committees on a variety of insurance-related topics.
Dr. Kahane earned a BA in economics and statistics in 1965, an MA in business administration, cum laude, in 1967, and a PhDin finance in 1973, all from the Hebrew University of Jerusalem. He has served as an associate editor of the leading journals on riskand insurance. He has taught courses in technological forecasting (the first teacher of this subject in Israel), finance, insurance, riskmanagement, and actuarial topics. His research focus is on the portfolio implications for insurance, rate making, automobile insur-ance, natural hazards, pension and life insurance, reserving, and environmental risks.
E-mail: [email protected]: http://recanati.tau.ac.il/~kahane.
ABOUT THE AUTHORS 3
Preface
INTRODUCTION AND BACKGROUNDThis textbook is designed to reflect the dynamic nature of the field of risk management as an introduction to intermediate-level stu-dents. With co-author experts Etti Baranoff, Patrick L. Brockett, and Yehuda Kahane, the timely issues of the field are kept alive. Thecatastrophes of the first decade of the new millennium, including the credit crisis of 2008–2009, are well depicted and used to illus-trate the myriad of old and new risks of our times. With such major man-made and natural catastrophes, this field is of utmost im-portance for sustainability. The need to educate students to consider risks at every phase in a business undertaking is central, andthis textbook provides such educational foundation.
This field requires timeliness as new risk management techniques and products are being developed in response to risks derivedfrom innovations and sophistication. As such, this book allows the reader to be on the forefront of knowledge in the arena of riskmanagement. Tomorrow’s leaders in business and politics and tomorrow’s citizens, consumers, and voters need to understand risksto make successful decisions. This book provides you with the background for doing so.
With the pedagogical enhancements of Flat World Knowledge and the ability to make changes dynamically, this textbookbrings the best to educators. An important advantage of this book’s publication format is that it can be updated in real time online asnew risks appear (e.g., pandemic risk, financial crisis, terrorist attacks). Risk management consequences can be discussedimmediately.
The management of risk is, essentially, the strategy for surviving and thriving in a volatile, uncertain, complex, and ambiguousworld. Prior to the industrial revolution and the advanced communication age, decisions could be made easily using heuristics or“gut level feel” based on past experience. As long as the world faced by the decision maker was more or less the same as that facedyesterday, gut level decision making worked fairly well. The consequences of failure were concentrated in small locations. Entire vil-lages were extinguished due to lack of crop risk planning or diseases. There were no systemic contagious interlocking risks, such asthose that brought the financial markets to their knees worldwide in 2008–2009.
Today the stakes are higher; the decision making is more complex, and consequences more severe, global, and fundamental.Risk managers have become part of executive teams with titles, such as chief risk officer (CRO), and are empowered to bridge acrossall business activities with short-term, long-term, and far-reaching goals. The credit crisis revealed that lack of understanding ofrisks, and their combined and correlated ramifications has far-reaching consequences worldwide. The study of risk management isdesigned to give business stakeholders the weapons necessary to foresee and combat potential calamities both internal to the busi-ness and external to society overall. The “green movement” is an important risk management focus.
At the time of this writing (December 2009), more than 190 nations’ leaders are gathered at the Copenhagen Climate Summit tocome to some resolutions about saving Earth. The evolution into industrialized nations brought a sense of urgency to finding riskmanagement solutions to risks posed by the supply chain of production with wastes flowing into the environment, polluting the airand waters. The rapid population growth in countries such as China and India that joined the industrialized nations accelerated theecological destruction of the water and air and has impacted our food chain. The UN 2005 World Millennium Ecosystem Report—adocument written by thousands of scientists—displays a gloomy picture of the current and expected future situation of our air, wa-ter, land, flora, and fauna. The environmental issue has become important on risk managers’ agendas.
Other global worries that fall into the risk management arena are new diseases, such as the mutation in the H1N1 (swine) fluvirus with the bird flu (50 percent mortality rate of infected). One of China’s leading disease experts and the director of the Guang-zhou Institute of Respiratory Diseases predicted that the combined effect of both H1N1 (swine) and the H5N1 (bird) flu virusescould become a disastrous deadly hybrid with high mortality due to its efficient transmission among people. With systemic and per-vasive travel and communication, such diseases are no longer localized environmental risks and are at the forefront of both indi-viduals’ and firms’ risks.
With these global risks in mind and other types of risks, as are featured throughout the textbook, this book enables students towork with risks effectively. In addition, you will be able to launch your professional career with a deep sense of understanding of theimportance of the long-term handling of risks.
Critical to the modern management of risk is the realization that all risks should be treated in a holistic, global, and integratedmanner, as opposed to having individual divisions within a firm treating the risk separately. Enterprise-wide risk management wasnamed one of the top ten breakthrough ideas in business by the Harvard Business Review in 2004.
L. Buchanan, “Breakthrough Ideas for 2004,” Harvard Business Review 2 (2004): 13–16.Throughout, this book also takes this enterprise risk management perspective as well.
FEATURES< An emphasis on the big picture—the Links section. Every chapter begins with an introduction and a links section to high-
light the relationships between various concepts and components of risk and risk management, so that students know howthe pieces fit together. This feature is to ensure the holistic aspects of risk management are always upfront.
< Every chapter is focused on the risk management aspects. While many solutions are insurance solutions, the main object-ive of this textbook is to ensure the student realizes the fact that insurance is a risk management solution. As such there aredetails explaining insurance in many chapters—from the nature of insurance in Chapter 5, to insurance operations andmarkets in Chapter 6 and Chapter 7, to specifics of insurance contracts and insurance coverage throughout the whole text.
< Chapter 1 and Chapter 2 are completely dedicated to explaining risks and risk measurement.< Chapter 4 was created by Dr. Puneet Prakash to introduce the concepts of attitudes toward risk and the solutions.< Chapter 3 and Chapter 13 provide risk management techniques along with financial risk management.< [MISSING REF: #baranoff-ch17]–[MISSING REF: #baranoff-ch22] focus on all aspects of risk management throughout
the life cycle. These can be used to study employee benefits as a special course.< Cases are embedded within each chapter, and boxes feature issues that represent ethical dilemmas. [MISSING REF:
#baranoff-ch23] provides extra risk management and employee benefits cases.< Student-friendly. A clear, readable writing style helps to keep a complicated subject from becoming overwhelming. Most
important is the pedagogical structure of the Flat World Knowledge system.
PREFACE 5

6 RISK MANAGEMENT FOR ENTERPRISES AND INDIVIDUALS
C H A P T E R 1The Nature of Risk: Lossesand OpportunitiesIn his novel A Tale of Two Cities, set during the French Revolution of the late eighteenth century, Charles Dickens
wrote, “It was the best of times; it was the worst of times.” Dickens may have been premature, since the same might
well be said now, at the beginning of the twenty-first century.
When we think of large risks, we often think in terms of natural hazards such as hurricanes, earthquakes, or
tornados. Perhaps man-made disasters come to mind—such as the terrorist attacks that occurred in the United
States on September 11, 2001. We typically have overlooked financial crises, such as the credit crisis of 2008.
However, these types of man-made disasters have the potential to devastate the global marketplace. Losses in
multiple trillions of dollars and in much human suffering and insecurity are already being totaled as the U.S.
Congress fights over a $700 billion bailout. The financial markets are collapsing as never before seen.
Many observers consider this credit crunch, brought on by subprime mortgage lending and deregulation of
the credit industry, to be the worst global financial calamity ever. Its unprecedented worldwide consequences have
hit country after country—in many cases even harder than they hit the United States.[1] The world is now a global
village; we’re so fundamentally connected that past regional disasters can no longer be contained locally.
We can attribute the 2008 collapse to financially risky behavior of a magnitude never before experienced. Its
implications dwarf any other disastrous events. The 2008 U.S. credit markets were a financial house of cards with a
faulty foundation built by unethical behavior in the financial markets:
1. Lenders gave home mortgages without prudent risk management to underqualified home buyers, starting
the so-called subprime mortgage crisis.
2. Many mortgages, including subprime mortgages, were bundled into new instruments called mortgage-
backed securities, which were guaranteed by U.S. government agencies such as Fannie Mae and Freddie
Mac.
3. These new bundled instruments were sold to financial institutions around the world. Bundling the
investments gave these institutions the impression that the diversification effect would in some way protect
them from risk.
4. Guarantees that were supposed to safeguard these instruments, called credit default swaps, were designed
to take care of an assumed few defaults on loans, but they needed to safeguard against a systemic failure of
many loans.
5. Home prices started to decline simultaneously as many of the unqualified subprime mortgage holders had
to begin paying larger monthly payments. They could not refinance at lower interest rates as rates rose after
the 9/11 attacks.
6. These subprime mortgage holders started to default on their loans. This dramatically increased the number
of foreclosures, causing nonperformance on some mortgage-backed securities.
7. Financial institutions guaranteeing the mortgage loans did not have the appropriate backing to sustain the
large number of defaults. These firms thus lost ground, including one of the largest global insurers, AIG
(American International Group).
8. Many large global financial institutions became insolvent, bringing the whole financial world to the brink of
collapse and halting the credit markets.
9. Individuals and institutions such as banks lost confidence in the ability of other parties to repay loans, causing
credit to freeze up.
10. Governments had to get into the action and bail many of these institutions out as a last resort. This unfroze
the credit mechanism that propels economic activity by enabling lenders to lend again.
As we can see, a basic lack of risk management (and regulators’ inattention or inability to control these overt
failures) lay at the heart of the global credit crisis. This crisis started with a lack of improperly underwritten
mortgages and excessive debt. Companies depend on loans and lines of credit to conduct their routine business. If
such credit lines dry up, production slows down and brings the global economy to the brink of deep recession—or
even depression. The snowballing effect of this failure to manage the risk associated with providing mortgage
loans to unqualified home buyers has been profound, indeed. The world is in a global crisis due to the prevailing
(in)action by companies and regulators who ignored and thereby increased some of the major risks associated with
mortgage defaults. When the stock markets were going up and homeowners were paying their mortgages,
everything looked fine and profit opportunities abounded. But what goes up must come down, as Flannery
O’Conner once wrote. When interest rates rose and home prices declined, mortgage defaults became more
common. This caused the expected bundled mortgage-backed securities to fail. When the mortgages failed
because of greater risk taking on Wall Street, the entire house of cards collapsed.
Additional financial instruments (called credit derivatives)[2] gave the illusion of insuring the financial risk of the
bundled collateralized mortgages without actually having a true foundation—claims, that underlie all of risk
management.[3] Lehman Brothers represented the largest bankruptcy in history, which meant that the U.S.
government (in essence) nationalized banks and insurance giant AIG. This, in turn, killed Wall Street as we
previously knew it and brought about the restructuring of government’s role in society. We can lay all of this at the
feet of the investment banking industry and their inadequate risk recognition and management. Probably no other
risk-related event has had, and will continue to have, as profound an impact worldwide as this risk management
failure (and this includes the terrorist attacks of 9/11). Ramifications of this risk management failure will echo for
decades. It will affect all voters and taxpayers throughout the world and potentially change the very structure of
American government.
How was risk in this situation so badly managed? What could firms and individuals have done to protect
themselves? How can government measure such risks (beforehand) to regulate and control them? These and other
questions come immediately to mind when we contemplate the fateful consequences of this risk management
fiasco.
8 RISK MANAGEMENT FOR ENTERPRISES AND INDIVIDUALS
With his widely acclaimed book Against the Gods: The Remarkable Story of Risk (New York City: John Wiley &
Sons, 1996), Peter L. Bernstein teaches us how human beings have progressed so magnificently with their
mathematics and statistics to overcome the unknown and the uncertainty associated with risk. However, no one
fully practiced his plans of how to utilize the insights gained from this remarkable intellectual progression. The
terrorist events of September 11, 2001; Hurricanes Katrina, Wilma, and Rita in 2005 and Hurricane Ike in 2008; and
the financial meltdown of September 2008 have shown that knowledge of risk management has never, in our long
history, been more important. Standard risk management practice would have identified subprime mortgages and
their bundling into mortgage-backed securities as high risk. As such, people would have avoided these investments
or wouldn’t have put enough money into reserve to be able to withstand defaults. This did not happen.
Accordingly, this book may represent one of the most critical topics of study that the student of the twenty-first
century could ever undertake.
Risk management will be a major focal point of business and societal decision making in the twenty-first
century. A separate focused field of study, it draws on core knowledge bases from law, engineering, finance,
economics, medicine, psychology, accounting, mathematics, statistics, and other fields to create a holistic decision-
making framework that is sustainable and value-enhancing. This is the subject of this book.
In this chapter we discuss the following:
1. Links
2. The notion and definition of risks
3. Attitudes toward risks
4. Types of risk exposures
5. Perils and hazards
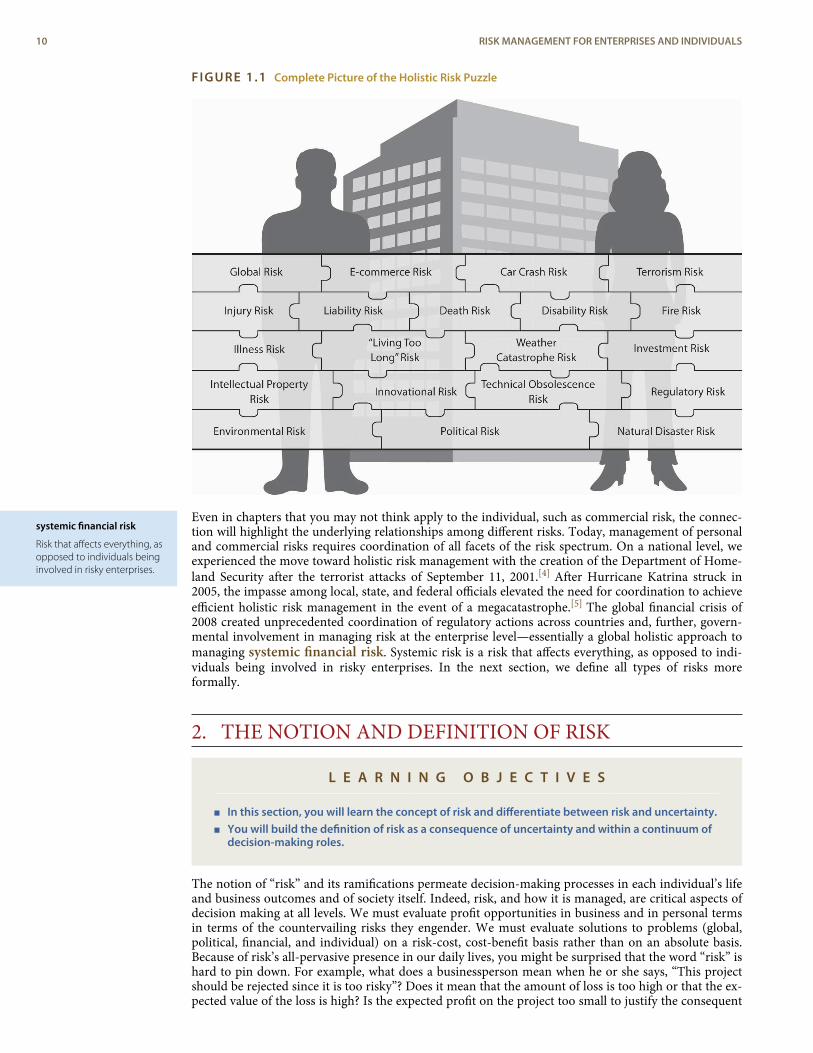
1. LINKSOur “links” section in each chapter ties each concept and objective in the chapter into the realm ofglobally or holistically managing risk. The solutions to risk problems require a compilation of tech-niques and perspectives, shown as the pieces completing a puzzle of the myriad of personal and busi-ness risks we face. These are shown in the “connection” puzzle in Figure 1.1. As we progress throughthe text, each chapter will begin with a connection section to show how links between personal and en-terprise holistic risk picture arise.
CHAPTER 1 THE NATURE OF RISK: LOSSES AND OPPORTUNITIES 9
systemic financial risk
Risk that affects everything, asopposed to individuals beinginvolved in risky enterprises.
FIGURE 1.1 Complete Picture of the Holistic Risk Puzzle
Even in chapters that you may not think apply to the individual, such as commercial risk, the connec-tion will highlight the underlying relationships among different risks. Today, management of personaland commercial risks requires coordination of all facets of the risk spectrum. On a national level, weexperienced the move toward holistic risk management with the creation of the Department of Home-land Security after the terrorist attacks of September 11, 2001.[4] After Hurricane Katrina struck in2005, the impasse among local, state, and federal officials elevated the need for coordination to achieveefficient holistic risk management in the event of a megacatastrophe.[5] The global financial crisis of2008 created unprecedented coordination of regulatory actions across countries and, further, govern-mental involvement in managing risk at the enterprise level—essentially a global holistic approach tomanaging systemic financial risk. Systemic risk is a risk that affects everything, as opposed to indi-viduals being involved in risky enterprises. In the next section, we define all types of risks moreformally.
2. THE NOTION AND DEFINITION OF RISK
L E A R N I N G O B J E C T I V E S
< In this section, you will learn the concept of risk and differentiate between risk and uncertainty.< You will build the definition of risk as a consequence of uncertainty and within a continuum of
decision-making roles.
The notion of “risk” and its ramifications permeate decision-making processes in each individual’s lifeand business outcomes and of society itself. Indeed, risk, and how it is managed, are critical aspects ofdecision making at all levels. We must evaluate profit opportunities in business and in personal termsin terms of the countervailing risks they engender. We must evaluate solutions to problems (global,political, financial, and individual) on a risk-cost, cost-benefit basis rather than on an absolute basis.Because of risk’s all-pervasive presence in our daily lives, you might be surprised that the word “risk” ishard to pin down. For example, what does a businessperson mean when he or she says, “This projectshould be rejected since it is too risky”? Does it mean that the amount of loss is too high or that the ex-pected value of the loss is high? Is the expected profit on the project too small to justify the consequent
10 RISK MANAGEMENT FOR ENTERPRISES AND INDIVIDUALS
uncertainty
Having two potentialoutcomes for an event orsituation.
risk
Uncertainty about a futureoutcome, particularly theconsequences of a negativeoutcome.
risk exposure and the potential losses that might ensue? The reality is that the term “risk” (as used inthe English language) is ambiguous in this regard. One might use any of the previous interpretations.Thus, professionals try to use different words to delineate each of these different interpretations. Wewill discuss possible interpretations in what follows.
2.1 Risk as a Consequence of UncertaintyWe all have a personal intuition about what we mean by the term “risk.” We all use and interpret theword daily. We have all felt the excitement, anticipation, or anxiety of facing a new and uncertain event(the “tingling” aspect of risk taking). Thus, actually giving a single unambiguous definition of what wemean by the notion of “risk” proves to be somewhat difficult. The word “risk” is used in many differentcontexts. Further, the word takes many different interpretations in these varied contexts. In all cases,however, the notion of risk is inextricably linked to the notion of uncertainty. We provide here asimple definition of uncertainty: Uncertainty is having two potential outcomes for an event or situation.
Certainty refers to knowing something will happen or won’t happen. We may experience no doubtin certain situations. Nonperfect predictability arises in uncertain situations. Uncertainty causes theemotional (or physical) anxiety or excitement felt in uncertain volatile situations. Gambling and parti-cipation in extreme sports provide examples. Uncertainty causes us to take precautions. We simplyneed to avoid certain business activities or involvements that we consider too risky. For example, un-certainty causes mortgage issuers to demand property purchase insurance. The person or corporationoccupying the mortgage-funded property must purchase insurance on real estate if we intend to lendthem money. If we knew, without a doubt, that something bad was about to occur, we would call it ap-prehension or dread. It wouldn’t be risk because it would be predictable. Risk will be forever, inextric-ably linked to uncertainty.
As we all know, certainty is elusive. Uncertainty and risk are pervasive. While we typically associ-ate “risk” with unpleasant or negative events, in reality some risky situations can result in positive out-comes. Take, for example, venture capital investing or entrepreneurial endeavors. Uncertainty aboutwhich of several possible outcomes will occur circumscribes the meaning of risk. Uncertainty lies be-hind the definition of risk.
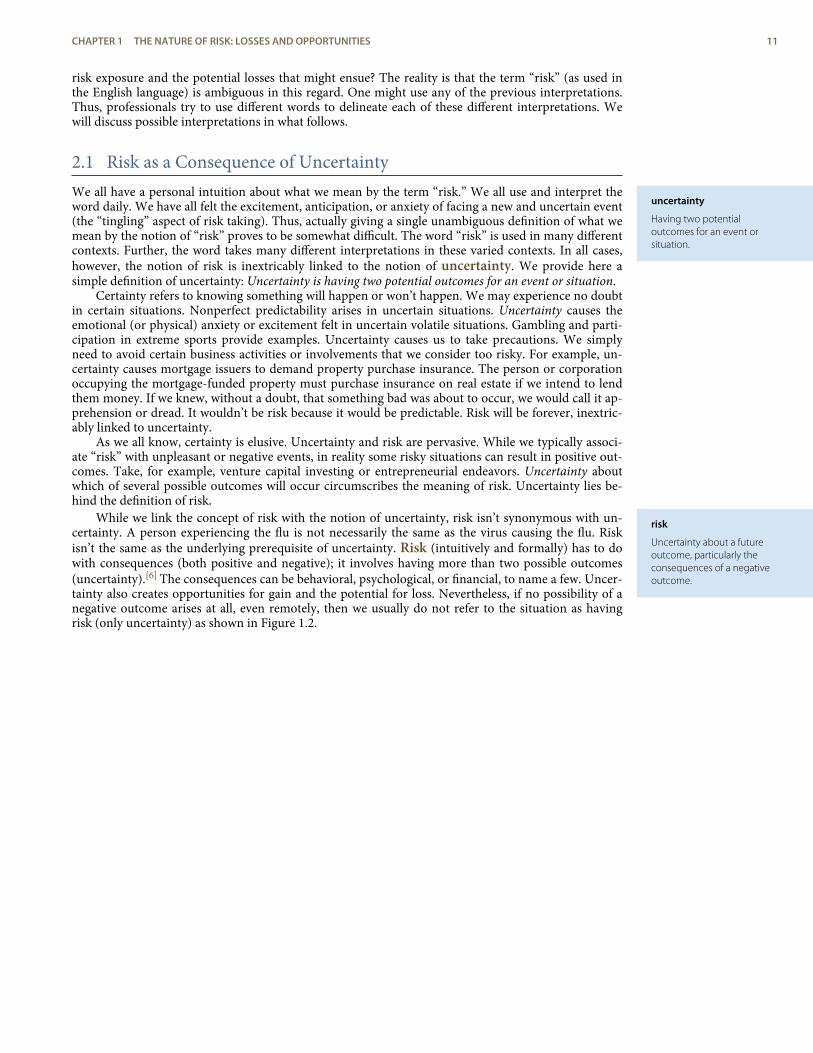
While we link the concept of risk with the notion of uncertainty, risk isn’t synonymous with un-certainty. A person experiencing the flu is not necessarily the same as the virus causing the flu. Riskisn’t the same as the underlying prerequisite of uncertainty. Risk (intuitively and formally) has to dowith consequences (both positive and negative); it involves having more than two possible outcomes(uncertainty).[6] The consequences can be behavioral, psychological, or financial, to name a few. Uncer-tainty also creates opportunities for gain and the potential for loss. Nevertheless, if no possibility of anegative outcome arises at all, even remotely, then we usually do not refer to the situation as havingrisk (only uncertainty) as shown in Figure 1.2.
CHAPTER 1 THE NATURE OF RISK: LOSSES AND OPPORTUNITIES 11
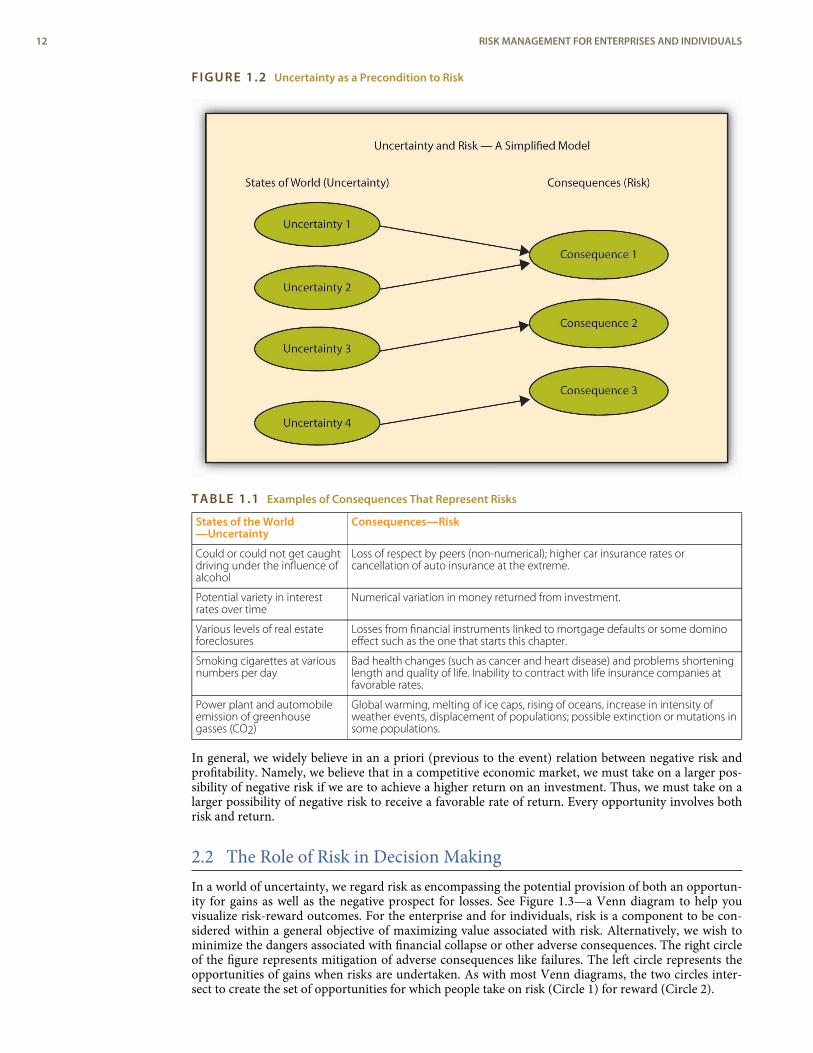
FIGURE 1.2 Uncertainty as a Precondition to Risk
TABLE 1.1 Examples of Consequences That Represent Risks
States of the World—Uncertainty
Consequences—Risk
Could or could not get caughtdriving under the influence ofalcohol
Loss of respect by peers (non-numerical); higher car insurance rates orcancellation of auto insurance at the extreme.
Potential variety in interestrates over time
Numerical variation in money returned from investment.
Various levels of real estateforeclosures
Losses from financial instruments linked to mortgage defaults or some dominoeffect such as the one that starts this chapter.
Smoking cigarettes at variousnumbers per day
Bad health changes (such as cancer and heart disease) and problems shorteninglength and quality of life. Inability to contract with life insurance companies atfavorable rates.
Power plant and automobileemission of greenhousegasses (CO2)
Global warming, melting of ice caps, rising of oceans, increase in intensity ofweather events, displacement of populations; possible extinction or mutations insome populations.
In general, we widely believe in an a priori (previous to the event) relation between negative risk andprofitability. Namely, we believe that in a competitive economic market, we must take on a larger pos-sibility of negative risk if we are to achieve a higher return on an investment. Thus, we must take on alarger possibility of negative risk to receive a favorable rate of return. Every opportunity involves bothrisk and return.
2.2 The Role of Risk in Decision MakingIn a world of uncertainty, we regard risk as encompassing the potential provision of both an opportun-ity for gains as well as the negative prospect for losses. See Figure 1.3—a Venn diagram to help youvisualize risk-reward outcomes. For the enterprise and for individuals, risk is a component to be con-sidered within a general objective of maximizing value associated with risk. Alternatively, we wish tominimize the dangers associated with financial collapse or other adverse consequences. The right circleof the figure represents mitigation of adverse consequences like failures. The left circle represents theopportunities of gains when risks are undertaken. As with most Venn diagrams, the two circles inter-sect to create the set of opportunities for which people take on risk (Circle 1) for reward (Circle 2).
12 RISK MANAGEMENT FOR ENTERPRISES AND INDIVIDUALS
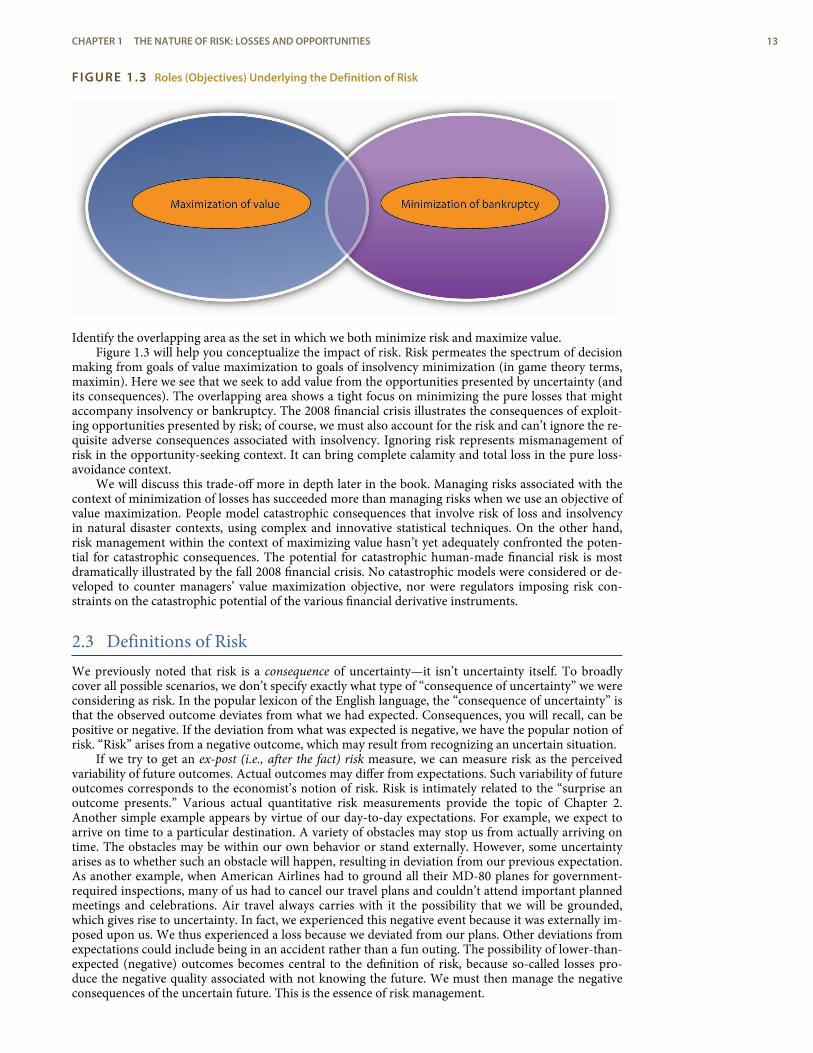
FIGURE 1.3 Roles (Objectives) Underlying the Definition of Risk
Identify the overlapping area as the set in which we both minimize risk and maximize value.Figure 1.3 will help you conceptualize the impact of risk. Risk permeates the spectrum of decision
making from goals of value maximization to goals of insolvency minimization (in game theory terms,maximin). Here we see that we seek to add value from the opportunities presented by uncertainty (andits consequences). The overlapping area shows a tight focus on minimizing the pure losses that mightaccompany insolvency or bankruptcy. The 2008 financial crisis illustrates the consequences of exploit-ing opportunities presented by risk; of course, we must also account for the risk and can’t ignore the re-quisite adverse consequences associated with insolvency. Ignoring risk represents mismanagement ofrisk in the opportunity-seeking context. It can bring complete calamity and total loss in the pure loss-avoidance context.
We will discuss this trade-off more in depth later in the book. Managing risks associated with thecontext of minimization of losses has succeeded more than managing risks when we use an objective ofvalue maximization. People model catastrophic consequences that involve risk of loss and insolvencyin natural disaster contexts, using complex and innovative statistical techniques. On the other hand,risk management within the context of maximizing value hasn’t yet adequately confronted the poten-tial for catastrophic consequences. The potential for catastrophic human-made financial risk is mostdramatically illustrated by the fall 2008 financial crisis. No catastrophic models were considered or de-veloped to counter managers’ value maximization objective, nor were regulators imposing risk con-straints on the catastrophic potential of the various financial derivative instruments.
2.3 Definitions of RiskWe previously noted that risk is a consequence of uncertainty—it isn’t uncertainty itself. To broadlycover all possible scenarios, we don’t specify exactly what type of “consequence of uncertainty” we wereconsidering as risk. In the popular lexicon of the English language, the “consequence of uncertainty” isthat the observed outcome deviates from what we had expected. Consequences, you will recall, can bepositive or negative. If the deviation from what was expected is negative, we have the popular notion ofrisk. “Risk” arises from a negative outcome, which may result from recognizing an uncertain situation.
If we try to get an ex-post (i.e., after the fact) risk measure, we can measure risk as the perceivedvariability of future outcomes. Actual outcomes may differ from expectations. Such variability of futureoutcomes corresponds to the economist’s notion of risk. Risk is intimately related to the “surprise anoutcome presents.” Various actual quantitative risk measurements provide the topic of Chapter 2.Another simple example appears by virtue of our day-to-day expectations. For example, we expect toarrive on time to a particular destination. A variety of obstacles may stop us from actually arriving ontime. The obstacles may be within our own behavior or stand externally. However, some uncertaintyarises as to whether such an obstacle will happen, resulting in deviation from our previous expectation.As another example, when American Airlines had to ground all their MD-80 planes for government-required inspections, many of us had to cancel our travel plans and couldn’t attend important plannedmeetings and celebrations. Air travel always carries with it the possibility that we will be grounded,which gives rise to uncertainty. In fact, we experienced this negative event because it was externally im-posed upon us. We thus experienced a loss because we deviated from our plans. Other deviations fromexpectations could include being in an accident rather than a fun outing. The possibility of lower-than-expected (negative) outcomes becomes central to the definition of risk, because so-called losses pro-duce the negative quality associated with not knowing the future. We must then manage the negativeconsequences of the uncertain future. This is the essence of risk management.
CHAPTER 1 THE NATURE OF RISK: LOSSES AND OPPORTUNITIES 13
risk averse
Refers to shying away fromrisks and preferring to have asmuch security and certaintyas is reasonably affordable.
risk seeker
Someone who will enter intoan endeavor as long as apositive long run return onthe money is possible,however unlikely.
Our perception of risk arises from our perception of and quantification of uncertainty. In scientificsettings and in actuarial and financial contexts, risk is usually expressed in terms of the probability ofoccurrence of adverse events. In other fields, such as political risk assessment, risk may be very qualitat-ive or subjective. This is also the subject of Chapter 2.
K E Y T A K E A W A Y S
< Uncertainty is precursor to risk.
< Risk is a consequence of uncertainty; risk can be emotional, financial, or reputational.
< The roles of Maximization of Value and Minimization of Losses form a continuum on which risk isanchored.
< One consequence of uncertainty is that actual outcomes may vary from what is expected and as suchrepresents risk.
D I S C U S S I O N Q U E S T I O N S
1. What is the relationship between uncertainty and risk?
2. What roles contribute to the definition of risk?
3. What examples fit under uncertainties and consequences? Which are the risks?
4. What is the formal definition of risk?
5. What examples can you cite of quantitative consequences of uncertainty and a qualitative or emotionalconsequence of uncertainty?
3. ATTITUDES TOWARD RISKS
L E A R N I N G O B J E C T I V E S
< In this section, you will learn that people’s attitudes toward risk affect their decision making.< You will learn about the three major types of “risk attitudes.”
An in-depth exploration into individual and firms’ attitudes toward risk appears in Chapter 4. Here wetouch upon this important subject, since it is key to understanding behavior associated with risk man-agement activities. The following box illustrates risk as a psychological process. Different people havedifferent attitudes toward the risk-return tradeoff. People are risk averse when they shy away fromrisks and prefer to have as much security and certainty as is reasonably affordable in order to lowertheir discomfort level. They would be willing to pay extra to have the security of knowing that unpleas-ant risks would be removed from their lives. Economists and risk management professionals considermost people to be risk averse. So, why do people invest in the stock market where they confront thepossibility of losing everything? Perhaps they are also seeking the highest value possible for their pen-sions and savings and believe that losses may not be pervasive—very much unlike the situation in thefall of 2008.
A risk seeker, on the other hand, is not simply the person who hopes to maximize the value of re-tirement investments by investing the stock market. Much like a gambler, a risk seeker is someone whowill enter into an endeavor (such as blackjack card games or slot machine gambling) as long as a posit-ive long run return on the money is possible, however unlikely.
14 RISK MANAGEMENT FOR ENTERPRISES AND INDIVIDUALS
risk neutral
When one’s risk preferencelies between the extremes ofrisk averse and risk seeking.
diversify away risk
To take actions that areseemingly not related or haveopposite effects or to investin many possible unrelatedproducts or entities such thatthe impact of any one eventdecreases the overall risk.
fortuitous
A matter of chance.
Finally, an entity is said to be risk neutral when its risk preference lies in between these two ex-tremes. Risk neutral individuals will not pay extra to have the risk transferred to someone else, nor willthey pay to engage in a risky endeavor. To them, money is money. They don’t pay for insurance, norwill they gamble. Economists consider most widely held or publicly traded corporations as making de-cisions in a risk-neutral manner since their shareholders have the ability to diversify away risk—totake actions that seemingly are not related or have opposite effects, or to invest in many possible unre-lated products or entities such that the impact of any one event decreases the overall risk. Risks that thecorporation might choose to transfer remain for diversification. In the fall of 2008, everyone felt like agambler. This emphasizes just how fluidly risk lies on a continuum like that in Figure 1.3. Financialtheories and research pay attention to the nature of the behavior of firms in their pursuit to maximizevalue. Most theories agree that firms work within risk limits to ensure they do not “go broke.” In thefollowing box we provide a brief discussion of people’s attitudes toward risk. A more elaborate discus-sion can be found in Chapter 4.
Feelings Associated with Risk
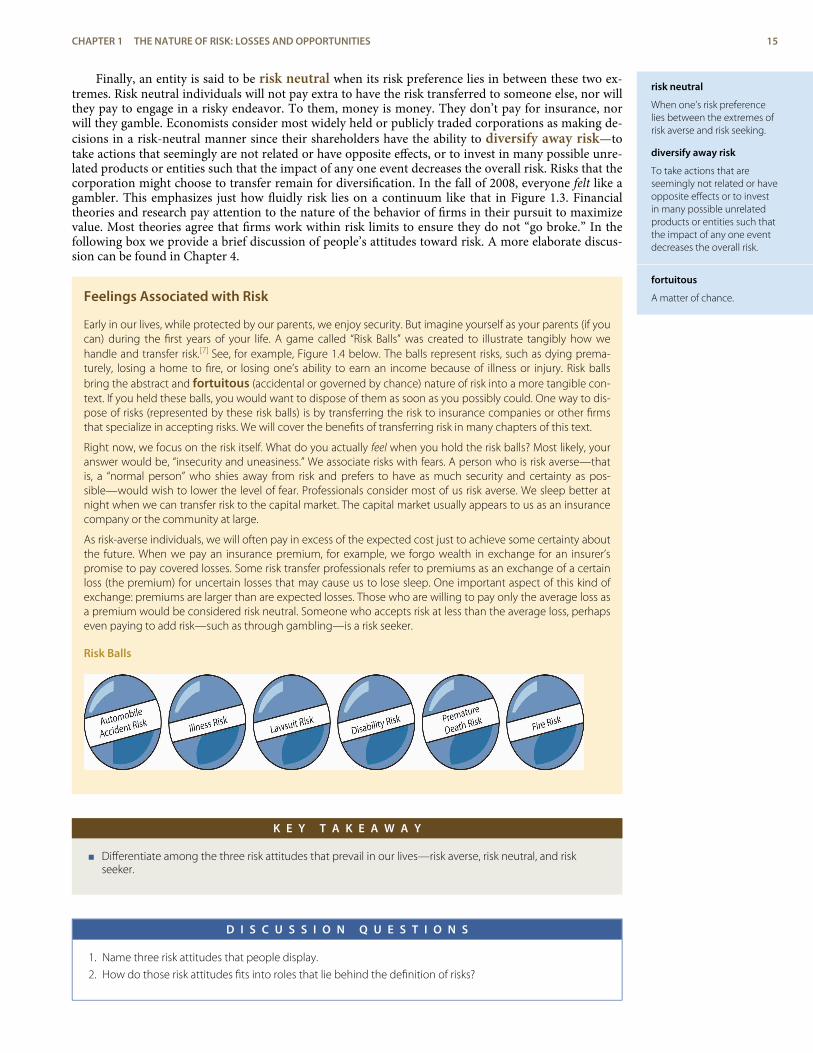
Early in our lives, while protected by our parents, we enjoy security. But imagine yourself as your parents (if youcan) during the first years of your life. A game called “Risk Balls” was created to illustrate tangibly how wehandle and transfer risk.[7] See, for example, Figure 1.4 below. The balls represent risks, such as dying prema-turely, losing a home to fire, or losing one’s ability to earn an income because of illness or injury. Risk ballsbring the abstract and fortuitous (accidental or governed by chance) nature of risk into a more tangible con-text. If you held these balls, you would want to dispose of them as soon as you possibly could. One way to dis-pose of risks (represented by these risk balls) is by transferring the risk to insurance companies or other firmsthat specialize in accepting risks. We will cover the benefits of transferring risk in many chapters of this text.
Right now, we focus on the risk itself. What do you actually feel when you hold the risk balls? Most likely, youranswer would be, “insecurity and uneasiness.” We associate risks with fears. A person who is risk averse—thatis, a “normal person” who shies away from risk and prefers to have as much security and certainty as pos-sible—would wish to lower the level of fear. Professionals consider most of us risk averse. We sleep better atnight when we can transfer risk to the capital market. The capital market usually appears to us as an insurancecompany or the community at large.
As risk-averse individuals, we will often pay in excess of the expected cost just to achieve some certainty aboutthe future. When we pay an insurance premium, for example, we forgo wealth in exchange for an insurer’spromise to pay covered losses. Some risk transfer professionals refer to premiums as an exchange of a certainloss (the premium) for uncertain losses that may cause us to lose sleep. One important aspect of this kind ofexchange: premiums are larger than are expected losses. Those who are willing to pay only the average loss asa premium would be considered risk neutral. Someone who accepts risk at less than the average loss, perhapseven paying to add risk—such as through gambling—is a risk seeker.
Risk Balls
K E Y T A K E A W A Y
< Differentiate among the three risk attitudes that prevail in our lives—risk averse, risk neutral, and riskseeker.
D I S C U S S I O N Q U E S T I O N S
1. Name three risk attitudes that people display.
2. How do those risk attitudes fits into roles that lie behind the definition of risks?
CHAPTER 1 THE NATURE OF RISK: LOSSES AND OPPORTUNITIES 15
anticipated variability
An expected deviation of anoccurrence from what oneexpects.
exposure
Term used to describe theenterprise, property, person,or activity facing a potentialloss.
pure risk
Risk that features somechance of loss and no chanceof gain.
speculative risk
Risk that features a chance toeither gain or lose.
hedging
Activities that are taken toreduce or eliminate risks.
securitization
Packaging and transferringthe insurance risks to thecapital markets through theissuance of a financialsecurity.
risk retention
When a firm retains its risk,self-insuring against adversecontingencies out of its owncash flows.
product liability
Situation in which amanufacturer may be liablefor harm caused by use of itsproduct, even if themanufacturer wasresponsible in producing it.
4. TYPES OF RISKS—RISK EXPOSURES
L E A R N I N G O B J E C T I V E S
< In this section, you will learn what a risk professional means by exposure.< You will also learn several different ways to split risk exposures according to the risk types in-
volved (pure versus speculative, systemic versus idiosyncratic, diversifiable versusnondiversifiable).
< You will learn how enterprise-wide risk approaches combine risk categories.
Most risk professionals define risk in terms of an expected deviation of an occurrence from what theyexpect—also known as anticipated variability. In common English language, many people continueto use the word “risk” as a noun to describe the enterprise, property, person, or activity that will be ex-posed to losses. In contrast, most insurance industry contracts and education and training materialsuse the term exposure to describe the enterprise, property, person, or activity facing a potential loss.So a house built on the coast near Galveston, Texas, is called an “exposure unit” for the potentiality ofloss due to a hurricane. Throughout this text, we will use the terms “exposure” and “risk” to note thoseunits that are exposed to losses.
4.1 Pure versus Speculative Risk ExposuresSome people say that Eskimos have a dozen or so words to name or describe snow. Likewise, profes-sional people who study risk use several words to designate what others intuitively and popularly knowas “risk.” Professionals note several different ideas for risk, depending on the particular aspect of the“consequences of uncertainty” that they wish to consider. Using different terminology to describedifferent aspects of risk allows risk professionals to reduce any confusion that might arise as they dis-cuss risks.
As we noted in Table 1.2, risk professionals often differentiate between pure risk that featuressome chance of loss and no chance of gain (e.g., fire risk, flood risk, etc.) and those they refer to as spec-ulative risk. Speculative risks feature a chance to either gain or lose (including investment risk, repu-tational risk, strategic risk, etc.). This distinction fits well into Figure 1.3. The right-hand side focuseson speculative risk. The left-hand side represents pure risk. Risk professionals find this distinction use-ful to differentiate between types of risk.
Some risks can be transferred to a third party—like an insurance company. These third parties canprovide a useful “risk management solution.” Some situations, on the other hand, require risk transfersthat use capital markets, known as hedging or securitizations. Hedging refers to activities that aretaken to reduce or eliminate risks. Securitization is the packaging and transferring of insurance risksto the capital markets through the issuance of a financial security. We explain such risk retention inChapter 3 and Chapter 13. Risk retention is when a firm retains its risk. In essence it is self-insuringagainst adverse contingencies out of its own cash flows. For example, firms might prefer to capture up-side return potential at the same time that they mitigate while mitigating the downside loss potential.
In the business environment, when evaluating the expected financial returns from the introductionof a new product (which represents speculative risk), other issues concerning product liability must beconsidered. Product liability refers to the possibility that a manufacturer may be liable for harmcaused by use of its product, even if the manufacturer was reasonable in producing it.
Table 1.2 provides examples of the pure versus speculative risks dichotomy as a way to cross classi-fy risks. The examples provided in Table 1.2 are not always a perfect fit into the pure versus speculativerisk dichotomy since each exposure might be regarded in alternative ways. Operational risks, for ex-ample, can be regarded as operations that can cause only loss or operations that can provide also gain.However, if it is more specifically defined, the risks can be more clearly categorized.
16 RISK MANAGEMENT FOR ENTERPRISES AND INDIVIDUALS
enterprise riskmanagement (ERM)
The simultaneousconsideration of all risks andthe management of risks inan enterprise-wide (andrisk-wide) context.
The simultaneous consideration of pure and speculative risks within the objectives continuum ofFigure 1.3 is an approach to managing risk, which is known as enterprise risk management (ERM).ERM is one of today’s key risk management approaches. It considers all risks simultaneously and man-ages risk in a holistic or enterprise-wide (and risk-wide) context. ERM was listed by the Harvard Busi-ness Review as one of the key breakthrough areas in their 2004 evaluation of strategic management ap-proaches by top management.[8] In today’s environment, identifying, evaluating, and mitigating allrisks confronted by the entity is a key focus. Firms that are evaluated by credit rating organizationssuch as Moody’s or Standard & Poor’s are required to show their activities in the areas of enterpriserisk management. As you will see in later chapters, the risk manager in businesses is no longer buriedin the tranches of the enterprise. Risk managers are part of the executive team and are essential toachieving the main objectives of the enterprise. A picture of the enterprise risk map of life insurers isshown later in Figure 1.5.
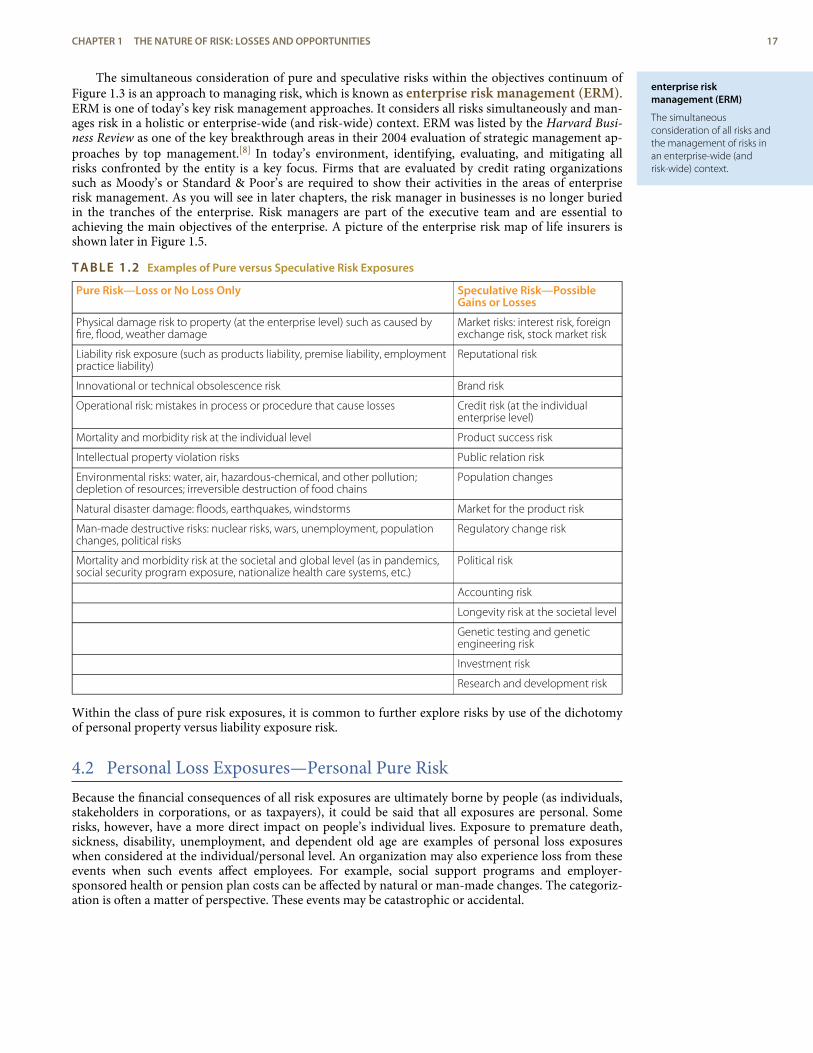
TABLE 1.2 Examples of Pure versus Speculative Risk Exposures
Pure Risk—Loss or No Loss Only Speculative Risk—PossibleGains or Losses
Physical damage risk to property (at the enterprise level) such as caused byfire, flood, weather damage
Market risks: interest risk, foreignexchange risk, stock market risk
Liability risk exposure (such as products liability, premise liability, employmentpractice liability)
Reputational risk
Innovational or technical obsolescence risk Brand risk
Operational risk: mistakes in process or procedure that cause losses Credit risk (at the individualenterprise level)
Mortality and morbidity risk at the individual level Product success risk
Intellectual property violation risks Public relation risk
Environmental risks: water, air, hazardous-chemical, and other pollution;depletion of resources; irreversible destruction of food chains
Population changes
Natural disaster damage: floods, earthquakes, windstorms Market for the product risk
Man-made destructive risks: nuclear risks, wars, unemployment, populationchanges, political risks
Regulatory change risk
Mortality and morbidity risk at the societal and global level (as in pandemics,social security program exposure, nationalize health care systems, etc.)
Political risk
Accounting risk
Longevity risk at the societal level
Genetic testing and geneticengineering risk
Investment risk
Research and development risk
Within the class of pure risk exposures, it is common to further explore risks by use of the dichotomyof personal property versus liability exposure risk.
4.2 Personal Loss Exposures—Personal Pure RiskBecause the financial consequences of all risk exposures are ultimately borne by people (as individuals,stakeholders in corporations, or as taxpayers), it could be said that all exposures are personal. Somerisks, however, have a more direct impact on people’s individual lives. Exposure to premature death,sickness, disability, unemployment, and dependent old age are examples of personal loss exposureswhen considered at the individual/personal level. An organization may also experience loss from theseevents when such events affect employees. For example, social support programs and employer-sponsored health or pension plan costs can be affected by natural or man-made changes. The categoriz-ation is often a matter of perspective. These events may be catastrophic or accidental.
CHAPTER 1 THE NATURE OF RISK: LOSSES AND OPPORTUNITIES 17
consequential or indirectlosses
A nonphysical loss such asloss of business.
property loss exposures
Losses associated with bothreal property such asbuildings and personalproperty such as automobilesand the contents of abuilding.
liability loss
Loss caused by a third partywho is considered at fault.
fundamental risk orsystemic risk
Risks that are pervasive toand affect the wholeeconomy, as opposed toaccidental risk for anindividual.
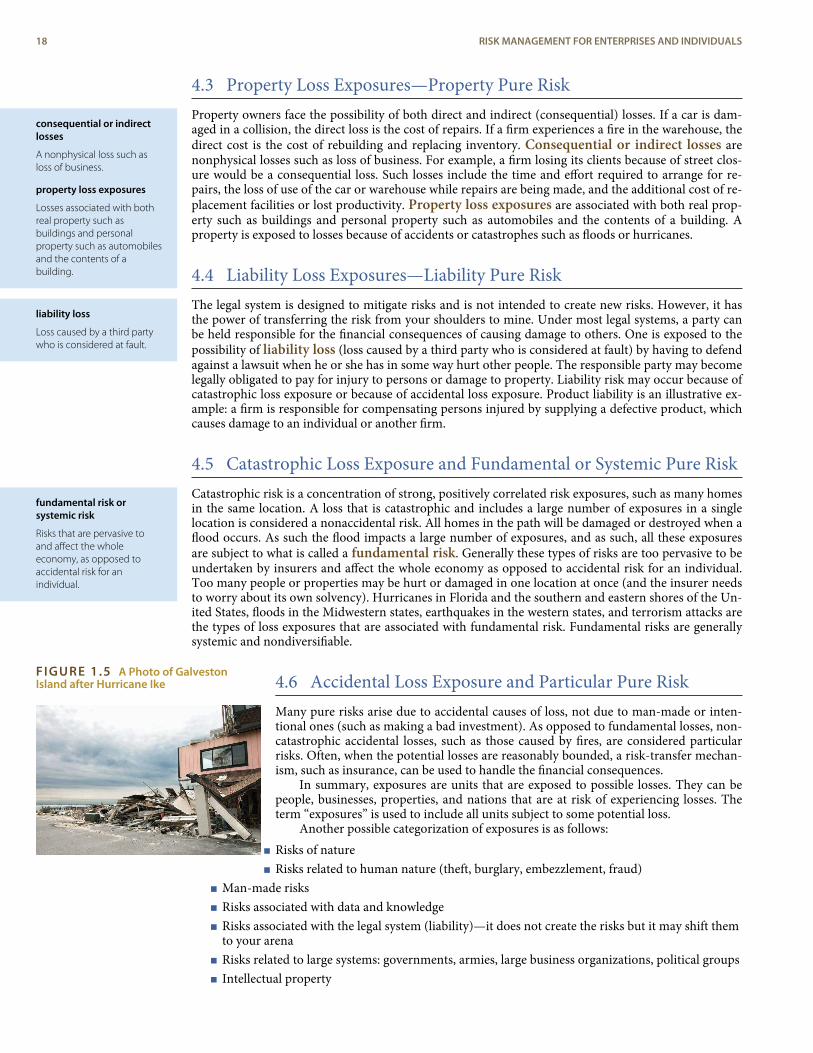
FIGURE 1.5 A Photo of GalvestonIsland after Hurricane Ike
4.3 Property Loss Exposures—Property Pure RiskProperty owners face the possibility of both direct and indirect (consequential) losses. If a car is dam-aged in a collision, the direct loss is the cost of repairs. If a firm experiences a fire in the warehouse, thedirect cost is the cost of rebuilding and replacing inventory. Consequential or indirect losses arenonphysical losses such as loss of business. For example, a firm losing its clients because of street clos-ure would be a consequential loss. Such losses include the time and effort required to arrange for re-pairs, the loss of use of the car or warehouse while repairs are being made, and the additional cost of re-placement facilities or lost productivity. Property loss exposures are associated with both real prop-erty such as buildings and personal property such as automobiles and the contents of a building. Aproperty is exposed to losses because of accidents or catastrophes such as floods or hurricanes.
4.4 Liability Loss Exposures—Liability Pure RiskThe legal system is designed to mitigate risks and is not intended to create new risks. However, it hasthe power of transferring the risk from your shoulders to mine. Under most legal systems, a party canbe held responsible for the financial consequences of causing damage to others. One is exposed to thepossibility of liability loss (loss caused by a third party who is considered at fault) by having to defendagainst a lawsuit when he or she has in some way hurt other people. The responsible party may becomelegally obligated to pay for injury to persons or damage to property. Liability risk may occur because ofcatastrophic loss exposure or because of accidental loss exposure. Product liability is an illustrative ex-ample: a firm is responsible for compensating persons injured by supplying a defective product, whichcauses damage to an individual or another firm.
4.5 Catastrophic Loss Exposure and Fundamental or Systemic Pure RiskCatastrophic risk is a concentration of strong, positively correlated risk exposures, such as many homesin the same location. A loss that is catastrophic and includes a large number of exposures in a singlelocation is considered a nonaccidental risk. All homes in the path will be damaged or destroyed when aflood occurs. As such the flood impacts a large number of exposures, and as such, all these exposuresare subject to what is called a fundamental risk. Generally these types of risks are too pervasive to beundertaken by insurers and affect the whole economy as opposed to accidental risk for an individual.Too many people or properties may be hurt or damaged in one location at once (and the insurer needsto worry about its own solvency). Hurricanes in Florida and the southern and eastern shores of the Un-ited States, floods in the Midwestern states, earthquakes in the western states, and terrorism attacks arethe types of loss exposures that are associated with fundamental risk. Fundamental risks are generallysystemic and nondiversifiable.
4.6 Accidental Loss Exposure and Particular Pure RiskMany pure risks arise due to accidental causes of loss, not due to man-made or inten-tional ones (such as making a bad investment). As opposed to fundamental losses, non-catastrophic accidental losses, such as those caused by fires, are considered particularrisks. Often, when the potential losses are reasonably bounded, a risk-transfer mechan-ism, such as insurance, can be used to handle the financial consequences.
In summary, exposures are units that are exposed to possible losses. They can bepeople, businesses, properties, and nations that are at risk of experiencing losses. Theterm “exposures” is used to include all units subject to some potential loss.
Another possible categorization of exposures is as follows:< Risks of nature< Risks related to human nature (theft, burglary, embezzlement, fraud)
< Man-made risks< Risks associated with data and knowledge< Risks associated with the legal system (liability)—it does not create the risks but it may shift them
to your arena< Risks related to large systems: governments, armies, large business organizations, political groups< Intellectual property
18 RISK MANAGEMENT FOR ENTERPRISES AND INDIVIDUALS
diversifiable risks
Risks whose adverseconsequences can bemitigated simply by having awell-diversified portfolio ofrisk exposures.
idiosyncratic
Risks viewed as beingamenable to having theirfinancial consequencesreduced or eliminated byholding a well-diversifiedportfolio.
Pure and speculative risks are not the only way one might dichotomize risks. Another breakdown isbetween catastrophic risks, such as flood and hurricanes, as opposed to accidental losses such as thosecaused by accidents such as fires. Another differentiation is by systemic or nondiversifiable risks, as op-posed to idiosyncratic or diversifiable risks; this is explained below.
4.7 Diversifiable and Nondiversifiable RisksAs noted above, another important dichotomy risk professionals use is between diversifiable and non-diversifiable risk. Diversifiable risks are those that can have their adverse consequences mitigatedsimply by having a well-diversified portfolio of risk exposures. For example, having some factories loc-ated in nonearthquake areas or hotels placed in numerous locations in the United States diversifies therisk. If one property is damaged, the others are not subject to the same geographical phenomenoncausing the risks. A large number of relatively homogeneous independent exposure units pooled to-gether in a portfolio can make the average, or per exposure, unit loss much more predictable, and sincethese exposure units are independent of each other, the per-unit consequences of the risk can then besignificantly reduced, sometimes to the point of being ignorable. These will be further explored in alater chapter about the tools to mitigate risks. Diversification is the core of the modern portfolio theoryin finance and in insurance. Risks, which are idiosyncratic (with particular characteristics that are notshared by all) in nature, are often viewed as being amenable to having their financial consequences re-duced or eliminated by holding a well-diversified portfolio.
Systemic risks that are shared by all, on the other hand, such as global warming, or movements ofthe entire economy such as that precipitated by the credit crisis of fall 2008, are considered nondiver-sifiable. Every asset or exposure in the portfolio is affected. The negative effect does not go away byhaving more elements in the portfolio. This will be discussed in detail below and in later chapters. Thefield of risk management deals with both diversifiable and nondiversifiable risks. As the events ofSeptember 2008 have shown, contrary to some interpretations of financial theory, the idiosyncraticrisks of some banks could not always be diversified away. These risks have shown they have the abilityto come back to bite (and poison) the entire enterprise and others associated with them.
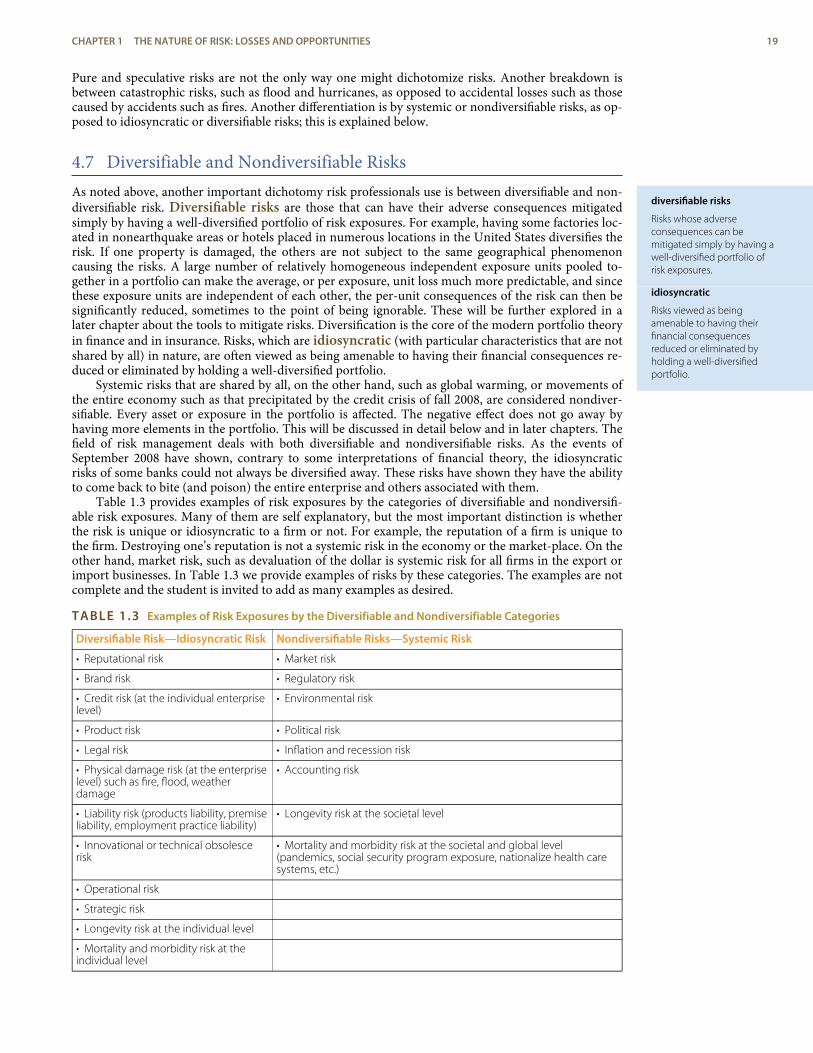
Table 1.3 provides examples of risk exposures by the categories of diversifiable and nondiversifi-able risk exposures. Many of them are self explanatory, but the most important distinction is whetherthe risk is unique or idiosyncratic to a firm or not. For example, the reputation of a firm is unique tothe firm. Destroying one’s reputation is not a systemic risk in the economy or the market-place. On theother hand, market risk, such as devaluation of the dollar is systemic risk for all firms in the export orimport businesses. In Table 1.3 we provide examples of risks by these categories. The examples are notcomplete and the student is invited to add as many examples as desired.
TABLE 1.3 Examples of Risk Exposures by the Diversifiable and Nondiversifiable Categories
Diversifiable Risk—Idiosyncratic Risk Nondiversifiable Risks—Systemic Risk
• Reputational risk • Market risk
• Brand risk • Regulatory risk
• Credit risk (at the individual enterpriselevel)
• Environmental risk
• Product risk • Political risk
• Legal risk • Inflation and recession risk
• Physical damage risk (at the enterpriselevel) such as fire, flood, weatherdamage
• Accounting risk
• Liability risk (products liability, premiseliability, employment practice liability)
• Longevity risk at the societal level
• Innovational or technical obsolescerisk
• Mortality and morbidity risk at the societal and global level(pandemics, social security program exposure, nationalize health caresystems, etc.)
• Operational risk
• Strategic risk
• Longevity risk at the individual level
• Mortality and morbidity risk at theindividual level
CHAPTER 1 THE NATURE OF RISK: LOSSES AND OPPORTUNITIES 19
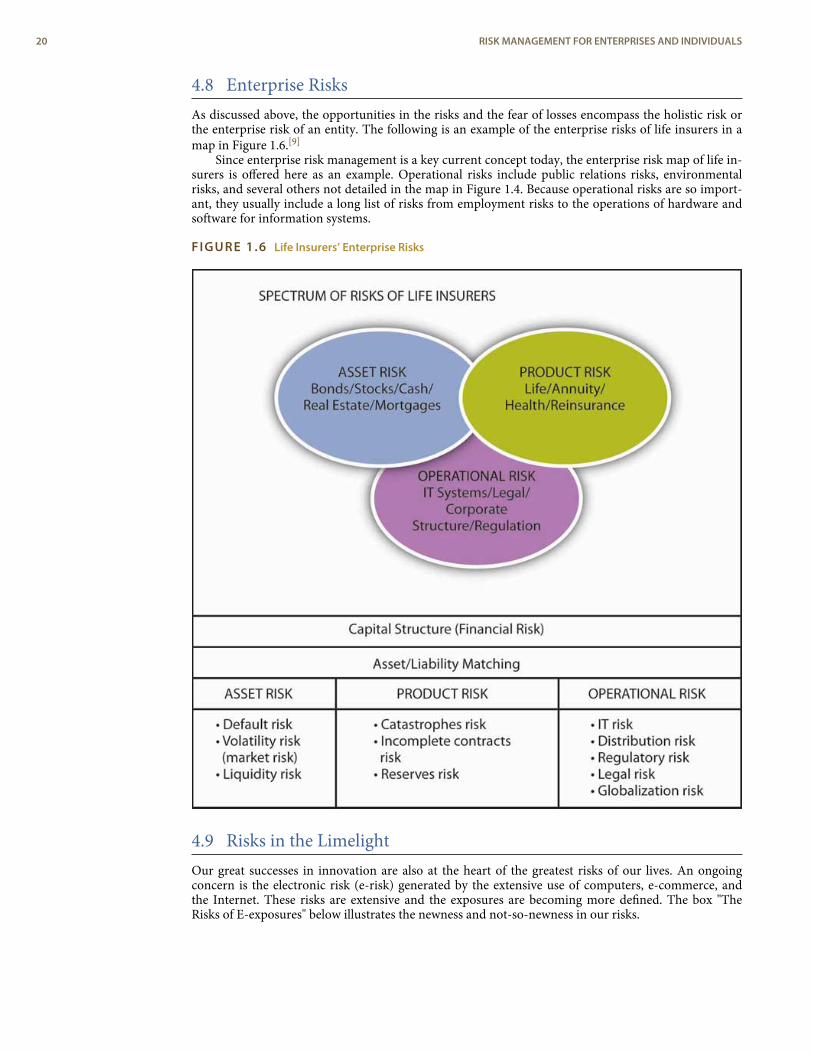
4.8 Enterprise RisksAs discussed above, the opportunities in the risks and the fear of losses encompass the holistic risk orthe enterprise risk of an entity. The following is an example of the enterprise risks of life insurers in amap in Figure 1.6.[9]
Since enterprise risk management is a key current concept today, the enterprise risk map of life in-surers is offered here as an example. Operational risks include public relations risks, environmentalrisks, and several others not detailed in the map in Figure 1.4. Because operational risks are so import-ant, they usually include a long list of risks from employment risks to the operations of hardware andsoftware for information systems.
FIGURE 1.6 Life Insurers’ Enterprise Risks
4.9 Risks in the LimelightOur great successes in innovation are also at the heart of the greatest risks of our lives. An ongoingconcern is the electronic risk (e-risk) generated by the extensive use of computers, e-commerce, andthe Internet. These risks are extensive and the exposures are becoming more defined. The box "TheRisks of E-exposures" below illustrates the newness and not-so-newness in our risks.
20 RISK MANAGEMENT FOR ENTERPRISES AND INDIVIDUALS
The Risks of E-exposures
Electronic risk, or e-risk, comes in many forms. Like any property, computers are vulnerable to theft and em-ployee damage (accidental or malicious). Certain components are susceptible to harm from magnetic or elec-trical disturbance or extremes of temperature and humidity. More important than replaceable hardware orsoftware is the data they store; theft of proprietary information costs companies billions of dollars. Most datatheft is perpetrated by employees, but “netspionage”—electronic espionage by rival companies—is on therise.
Companies that use the Internet commercially—who create and post content or sell services or merchand-ise—must follow the laws and regulations that traditional businesses do and are exposed to the same risks. Anonline newsletter or e-zine can be sued for libel, defamation, invasion of privacy, or misappropriation (e.g., re-producing a photograph without permission) under the same laws that apply to a print newspaper. Web siteowners and companies conducting business over the Internet have three major exposures to protect: intellec-tual property (copyrights, patents, trade secrets); security (against viruses and hackers); and business continuity(in case of system crashes).
All of these losses are covered by insurance, right? Wrong. Some coverage is provided through commercialproperty and liability policies, but traditional insurance policies were not designed to include e-risks. In fact,standard policies specifically exclude digital risks (or provide minimal coverage). Commercial property policiescover physical damage to tangible assets—and computer data, software, programs, and networks are gener-ally not counted as tangible property. (U.S. courts are still debating the issue.)
This coverage gap can be bridged either by buying a rider or supplemental coverage to the traditional policiesor by purchasing special e-risk or e-commerce coverage. E-risk property policies cover damages to the in-sured’s computer system or Web site, including lost income because of a computer crash. An increasing num-ber of insurers are offering e-commerce liability policies that offer protection in case the insured is sued forspreading a computer virus, infringing on property or intellectual rights, invading privacy, and so forth.
Cybercrime is just one of the e-risk-related challenges facing today’s risk managers. They are preparing for it asthe world evolves faster around cyberspace, evidenced by record-breaking online sales during the 2005 Christ-mas season.
Sources: Harry Croydon, “Making Sense of Cyber-Exposures,” National Underwriter, Property & Casualty/Risk & Benefits Management Edition, 17 June2002; Joanne Wojcik, “Insurers Cut E-Risks from Policies,” Business Insurance, 10 September 2001; Various media resources at the end of 2005 such asWall Street Journal and local newspapers.
Today, there is no media that is not discussing the risks that brought us to the calamity we are enduringduring our current financial crisis. Thus, as opposed to the megacatastrophes of 2001 and 2005, ourconcentration is on the failure of risk management in the area of speculative risks or the opportunity inrisks and not as much on the pure risk. A case at point is the little media coverage of the devastation ofGalveston Island from Hurricane Ike during the financial crisis of September 2008. The following boxdescribes the risks of the first decade of the new millennium.
Risks in the New Millennium
While man-made and natural disasters are the stamps of this decade, another type of man-made disastermarks this period.[10] Innovative financial products without appropriate underwriting and risk managementcoupled with greed and lack of corporate controls brought us to the credit crisis of 2007 and 2008 and thedeepest recession in a generation. The capital market has become an important player in the area of risk man-agement with creative new financial instruments, such as Catastrophe Bonds and securitized instruments.However, the creativity and innovation also introduced new risky instruments, such as credit default swapsand mortgage-backed securities. Lack of careful underwriting of mortgages coupled with lack of understand-ing of the new creative “insurance” default swaps instruments and the resulting instability of the two largestremaining bond insurers are at the heart of the current credit crisis.
As such, within only one decade we see the escalation in new risk exposures at an accelerated rate. This dec-ade can be named “the decade of extreme risks with inadequate risk management.” The late 1990s saw extremerisks with the stock market bubble without concrete financial theory. This was followed by the worst terroristattack in a magnitude not experienced before on U.S. soil. The corporate corruption at extreme levels in cor-porations such as Enron just deepened the sense of extreme risks. The natural disasters of Katrina, Rita, andWilma added to the extreme risks and were exacerbated by extraordinary mismanagement. Today, the ex-treme risks of mismanaged innovations in the financial markets combined with greed are stretching the fieldof risk management to new levels of governmental and private controls.
CHAPTER 1 THE NATURE OF RISK: LOSSES AND OPPORTUNITIES 21
However, did the myopic concentration on terrorism risk derail the holistic view of risk management and pre-paredness? The aftermath of Katrina is a testimonial to the lack of risk management. The increase of awarenessand usage of enterprise risk management (ERM) post–September 11 failed to encompass the already well-known risks of high-category hurricanes on the sustainability of New Orleans levies. The newly created holisticHomeland Security agency, which houses FEMA, not only did not initiate steps to avoid the disaster, it also didnot take the appropriate steps to reduce the suffering of those afflicted once the risk materialized. This out-come also points to the importance of having a committed stakeholder who is vested in the outcome andcares to lower and mitigate the risk. Since the insurance industry did not own the risk of flood, there was a gapin the risk management. The focus on terrorism risk could be regarded as a contributing factor to the neglectof the natural disasters risk in New Orleans. The ground was fertile for mishandling the extreme hurricane cata-strophes. Therefore, from such a viewpoint, it can be argued that September 11 derailed our comprehensivenational risk management and contributed indirectly to the worsening of the effects of Hurricane Katrina.
Furthermore, in an era of financial technology and creation of innovative modeling for predicting the most in-frequent catastrophes, the innovation and growth in human capacity is at the root of the current credit crisis.While the innovation allows firms such as Risk Management Solutions (RMS) and AIR Worldwide to providemodels[11] that predict potential man-made and natural catastrophes, financial technology also advanced thecreation of financial instruments, such as credit default derivatives and mortgage-backed securities. The cre-ation of the products provided “black boxes” understood by few and without appropriate risk management.Engineers, mathematicians, and quantitatively talented people moved from the low-paying jobs in their re-spective fields into Wall Street. They used their skills to create models and new products but lacked the busi-ness acumen and the required safety net understanding to ensure product sustenance. Management of largefinancial institutions globally enjoyed the new creativity and endorsed the adoption of the new productswithout clear understanding of their potential impact or just because of greed. This lack of risk management isat the heart of the credit crisis of 2008. No wonder the credit rating organizations are now adding ERM scoresto their ratings of companies.
The following quote is a key to today’s risk management discipline: “Risk management has been a significantpart of the insurance industry…, but in recent times it has developed a wider currency as an emerging man-agement philosophy across the globe…. The challenge facing the risk management practitioner of thetwenty-first century is not just breaking free of the mantra that risk management is all about insurance, and ifwe have insurance, then we have managed our risks, but rather being accepted as a provider of advice andservice to the risk makers and the risk takers at all levels within the enterprise. It is the risk makers and the risktakers who must be the owners of risk and accountable for its effective management.”[12]
K E Y T A K E A W A Y S
< You should be able to delineate the main categories of risks: pure versus speculative, diversifiable versusnondiversifiable, idiosyncratic versus systemic.
< You should also understand the general concept of enterprise-wide risk.
< Try to illustrate each cross classification of risk with examples.
< Can you discuss the risks of our decade?
D I S C U S S I O N Q U E S T I O N S
1. Name the main categories of risks.
2. Provide examples of risk categories.
3. How would you classify the risks embedded in the financial crisis of fall 2008 within each of cross-classification?
4. How does e-risk fit into the categories of risk?
22 RISK MANAGEMENT FOR ENTERPRISES AND INDIVIDUALS
perils
The causes of loss.
natural perils
Causes of losses over whichpeople have little control.
human perils
Causes of losses that liewithin individuals’ control.
economic perils
Causes of losses resultingfrom the state of theeconomy.
5. PERILS AND HAZARDS
L E A R N I N G O B J E C T I V E S
< In this section you will learn the terminology used by risk professionals to note different riskconcepts.
< You will learn about causes of losses—perils and the hazards, which are the items increasingthe chance of loss.
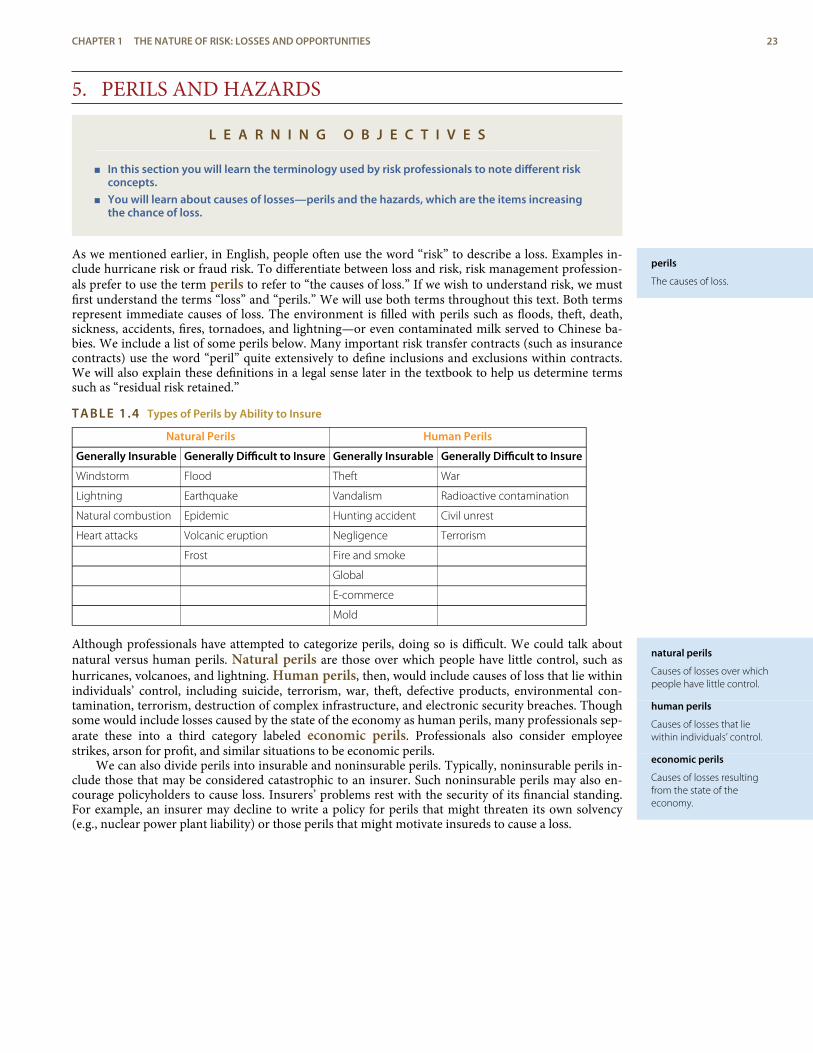
As we mentioned earlier, in English, people often use the word “risk” to describe a loss. Examples in-clude hurricane risk or fraud risk. To differentiate between loss and risk, risk management profession-als prefer to use the term perils to refer to “the causes of loss.” If we wish to understand risk, we mustfirst understand the terms “loss” and “perils.” We will use both terms throughout this text. Both termsrepresent immediate causes of loss. The environment is filled with perils such as floods, theft, death,sickness, accidents, fires, tornadoes, and lightning—or even contaminated milk served to Chinese ba-bies. We include a list of some perils below. Many important risk transfer contracts (such as insurancecontracts) use the word “peril” quite extensively to define inclusions and exclusions within contracts.We will also explain these definitions in a legal sense later in the textbook to help us determine termssuch as “residual risk retained.”
TABLE 1.4 Types of Perils by Ability to Insure
Natural Perils Human Perils
Generally Insurable Generally Difficult to Insure Generally Insurable Generally Difficult to Insure
Windstorm Flood Theft War
Lightning Earthquake Vandalism Radioactive contamination
Natural combustion Epidemic Hunting accident Civil unrest
Heart attacks Volcanic eruption Negligence Terrorism
Frost Fire and smoke
Global
E-commerce
Mold
Although professionals have attempted to categorize perils, doing so is difficult. We could talk aboutnatural versus human perils. Natural perils are those over which people have little control, such ashurricanes, volcanoes, and lightning. Human perils, then, would include causes of loss that lie withinindividuals’ control, including suicide, terrorism, war, theft, defective products, environmental con-tamination, terrorism, destruction of complex infrastructure, and electronic security breaches. Thoughsome would include losses caused by the state of the economy as human perils, many professionals sep-arate these into a third category labeled economic perils. Professionals also consider employeestrikes, arson for profit, and similar situations to be economic perils.
We can also divide perils into insurable and noninsurable perils. Typically, noninsurable perils in-clude those that may be considered catastrophic to an insurer. Such noninsurable perils may also en-courage policyholders to cause loss. Insurers’ problems rest with the security of its financial standing.For example, an insurer may decline to write a policy for perils that might threaten its own solvency(e.g., nuclear power plant liability) or those perils that might motivate insureds to cause a loss.
CHAPTER 1 THE NATURE OF RISK: LOSSES AND OPPORTUNITIES 23
hazards
Conditions that increase thecause of loss.
frequency
The number of losses duringa specified period.
severity
The average dollar value of aloss per claim.
physical hazards
Tangible environmentalconditions that affect thefrequency and/or severity ofloss.
intangible hazards
Attitudes and nonphysicalcultural conditions can affectloss probabilities andseverities of loss.
moral hazards
Hazards that involve behaviorthat can be construed asnegligence bordering oncriminality.
morale hazards
Hazards that involve attitudesof carelessness and lack ofconcern.
5.1 HazardsRisk professionals refer to hazards as conditions that increase the cause of losses. Hazards may in-crease the probability of losses, their frequency, their severity, or both. That is, frequency refers to thenumber of losses during a specified period. Severity refers to the average dollar value of a loss per oc-currence, respectively. Professionals refer to certain conditions as being “hazardous.” For example,when summer humidity declines and temperature and wind velocity rise in heavily forested areas, thelikelihood of fire increases. Conditions are such that a forest fire could start very easily and be difficultto contain. In this example, low humidity increases both loss probability and loss severity. The morehazardous the conditions, the greater the probability and/or severity of loss. Two kinds of haz-ards—physical and intangible—affect the probability and severity of losses.
Physical Hazards
We refer to physical hazards as tangible environmental conditions that affect the frequency and/orseverity of loss. Examples include slippery roads, which often increase the number of auto accidents;poorly lit stairwells, which add to the likelihood of slips and falls; and old wiring, which may increasethe likelihood of a fire.
Physical hazards that affect property include location, construction, and use. Building locationsaffect their susceptibility to loss by fire, flood, earthquake, and other perils. A building located near afire station and a good water supply has a lower chance that it will suffer a serious loss by fire than if itis in an isolated area with neither water nor firefighting service. Similarly, a company that has built abackup generator will have lower likelihood of a serious financial loss in the event of a power losshazard.
Construction affects both the probability and severity of loss. While no building is fireproof, someconstruction types are less susceptible to loss from fire than others. But a building that is susceptible toone peril is not necessarily susceptible to all. For example, a frame building is more apt to burn than abrick building, but frame buildings may suffer less damage from an earthquake.
Use or occupancy may also create physical hazards. For example, buildings used to manufacture orstore fireworks will have greater probability of loss by fire than do office buildings. Likewise, buildingsused for dry cleaning (which uses volatile chemicals) will bear a greater physical hazard than do ele-mentary schools. Cars used for business purposes may be exposed to greater chance of loss than a typ-ical family car since businesses use vehicles more extensively and in more dangerous settings. Similarly,people have physical characteristics that affect loss. Some of us have brittle bones, weak immune sys-tems, or vitamin deficiencies. Any of these characteristics could increase the probability or severity ofhealth expenses.
Intangible Hazards
Here we distinguish between physical hazards and intangible hazards—attitudes and nonphysicalcultural conditions can affect loss probabilities and severities of loss. Their existence may lead to phys-ical hazards. Traditionally, authors of insurance texts categorize these conditions as moral and moralehazards, which are important concepts but do not cover the full range of nonphysical hazards. Even thedistinction between moral and morale hazards is fuzzy.
Moral hazards are hazards that involve behavior that can be construed as negligence or that bor-ders on criminality. They involve dishonesty on the part of people who take out insurance (called“insureds”). Risk transfer through insurance invites moral hazard by potentially encouraging thosewho transfer risks to cause losses intentionally for monetary gain. Generally, moral hazards exist whena person can gain from the occurrence of a loss. For example, an insured that will be reimbursed for thecost of a new stereo system following the loss of an old one has an incentive to cause loss. An insuredbusiness that is losing money may have arson as a moral hazard. Such incentives increase loss probabil-ities; as the name “moral” implies, moral hazard is a breach of morality (honesty).
Morale hazards, in contrast, do not involve dishonesty. Rather, morale hazards involve attitudesof carelessness and lack of concern. As such, morale hazards increase the chance a loss will occur or in-crease the size of losses that do occur. Poor housekeeping (e.g., allowing trash to accumulate in attics orbasements) or careless cigarette smoking are examples of morale hazards that increase the probabilityfire losses. Often, such lack of concern occurs because a third party (such as an insurer) is available topay for losses. A person or company that knows they are insured for a particular loss exposure maytake less precaution to protect this exposure than otherwise. Nothing dishonest lurks in not lockingyour car or in not taking adequate care to reduce losses, so these don’t represent morality breaches.Both practices, however, increase the probability of loss severity.
Many people unnecessarily and often unconsciously create morale hazards that can affect theirhealth and life expectancy. Such hazards include excessive use of tobacco, drugs, and other harmful
24 RISK MANAGEMENT FOR ENTERPRISES AND INDIVIDUALS
substances; poor eating, sleeping, and exercise habits; unnecessary exposure to falls, poisoning, electro-cution, radiation, venomous stings and bites, and air pollution; and so forth.
Hazards are critical because our ability to reduce their effects will reduce both overall costs andvariability. Hazard management, therefore, can be a highly effective risk management tool. At thispoint, many corporations around the world emphasize disaster control management to reduce the im-pact of biological or terrorist attacks. Safety inspections in airports are one example of disaster controlmanagement that intensified after September 11. See "Is Airport Security Worth It to You?" for a dis-cussion of safety in airports.
Is Airport Security Worth It to You?
Following the September 11, 2001, terrorist attacks, the Federal Aviation Administration (now the Transporta-tion Security Administration [TSA] under the U.S. Department of Homeland Security [DHS]) wrestled with alarge question: how could a dozen or more hijackers armed with knives slip through security checkpoints attwo major airports? Sadly, it wasn’t hard. Lawmakers and security experts had long complained about laxsafety measures at airports, citing several studies over the years that had documented serious security lapses. “Ithink a major terrorist incident was bound to happen,” Paul Bracken, a Yale University professor who teachesnational security issues and international business, told Wired magazine a day after the attacks. “I think this in-cident exposed airport security for what any frequent traveler knows it is—a complete joke. It’s effective instopping people who may have a cigarette lighter or a metal belt buckle, but against people who want tohijack four planes simultaneously, it is a failure.”
Two days after the attacks, air space was reopened under extremely tight security measures, including placingarmed security guards on flights; ending curbside check-in; banning sharp objects (at first, even tweezers, nailclippers, and eyelash curlers were confiscated); restricting boarding areas to ticket-holding passengers; andconducting extensive searches of carry-on bags.
In the years since the 2001 terrorist attacks, U.S. airport security procedures have undergone many changes,often in response to current events and national terrorism threat levels. Beginning in December 2005, theTransportation Security Administration (TSA) refocused its efforts to detect suspicious persons, items, andactivities. The new measures called for increased random passenger screenings. They lifted restrictions oncertain carry-on items. Overall, the changes were viewed as a relaxation of the extremely strict protocols thathad been in place subsequent to the events of 9/11.
The TSA had to revise its airline security policy yet again shortly after the December 2005 adjustments. OnAugust 10, 2006, British police apprehended over twenty suspects implicated in a plot to detonate liquid-based explosives on flights originating from the United Kingdom bound for several major U.S. cities. Followingnews of this aborted plot, the U.S. Terror Alert Level soared to red (denoting a severe threat level). As a result,the TSA quickly barred passengers from carrying on most liquids and other potentially explosives-concealingcompounds to flights in U.S. airports. Beverages, gels, lotions, toothpastes, and semisolid cosmetics (such aslipstick) were thus expressly forbidden.
Less-burdensome modifications were made to the list of TSA-prohibited items not long after publication ofthe initial requirements. Nevertheless, compliance remains a controversial issue among elected officials andthe public, who contend that the many changes are difficult to keep up with. Many contended that thechanges represented too great a tradeoff of comfort or convenience for the illusion of safety. To many citizens,though, the 2001 terrorist plot served as a wake-up call, reminding a nation quietly settling into a state of com-placency of the need for continued vigilance. Regardless of the merits of these viewpoints, air travel securitywill no doubt remain a hot topic in the years ahead as the economic, financial, regulatory, and sociological is-sues become increasingly complex.
Questions for Discussion
1. Discuss whether the government has the right to impose great cost to many in terms of lost time inusing air travel, inconvenience, and affronts to some people’s privacy to protect a few individuals.
2. Do you see any morale or moral hazards associated with the homeland security monitoring andactively searching people and doing preflight background checks on individuals prior to boarding?
3. Discuss the issue of personal freedom versus national security as it relates to this case.
Sources: Tsar’s Press release at http://www.tsa.gov/public/display?theme=44&content=090005198018c27e. For more information regarding TSA, visitour Web site at http://www.TSA.gov; Dave Linkups, “Airports Vulnerable Despite Higher Level of Security,” Business Insurance, 6 May 2002; “U.S. FlyersStill at Risk,” National Underwriter Property & Casualty/Risk & Benefits Management Edition, 1 April 2002; Stephen Power, “Background Checks AwaitFliers,” The Wall Street Journal, 7 June 2002. For media sources related to 2006 terrorist plot, see http://en.wikipedia.org/wiki/2006_transatlantic_aircraft_plot#References.
CHAPTER 1 THE NATURE OF RISK: LOSSES AND OPPORTUNITIES 25
K E Y T A K E A W A Y S
< You should be able to differentiate between different types of hazards.
< You should be able to differentiate between different types of perils.
< Can you differentiate between a hazard and a peril?
D I S C U S S I O N Q U E S T I O N S
1. What are perils?
2. What are hazards?
3. Why do we not just call perils and hazards by the name “risk,” as is often done in common Englishconversations?
4. Discuss the perils and hazards in box "Is Airport Security Worth It to You?".
6. REVIEW AND PRACTICE1. What are underlying objectives for the definition of risk?2. How does risk fit on the spectrum of certainty and uncertainty?3. Provide the formal definition of risk.4. What are three major categories of risk attitudes?5. Explain the categories and risk and provide examples for each category.6. What are exposures? Give examples of exposures.7. What are perils? Give examples of perils.8. What are hazards? Give examples of hazards.9. In a particular situation, it may be difficult to distinguish between moral hazard and morale
hazard. Why? Define both terms.10. Some people with complete health insurance coverage visit doctors more often than required. Is
this tendency a moral hazard, a morale hazard, or simple common sense? Explain.11. Give examples of perils, exposures, and hazards for a university or college. Define each term.12. Give examples of exposure for speculative risks in a company such as Google.13. Inflation causes both pure and speculative risks in our society. Can you give some examples of
each?14. Define holistic risk and enterprise risk and give examples of each.15. Describe the new risks facing society today. Give examples of risks in electronic commerce.16. Read the box "The Risks of E-exposures" in this chapter. Can you help the risk managers identify
all the risk exposures associated with e-commerce and the Internet?17. Read the box "Is Airport Security Worth It to You?" in this chapter and respond to the discussion
questions at the end. What additional risk exposures do you see that the article did not cover?18. One medical practice that has been widely discussed in recent years involves defensive medicine,
in which a doctor orders more medical tests and X-rays than she or he might have in thepast—not because of the complexity of the case, but because the doctor fears being sued by thepatient for medical malpractice. The extra tests may establish that the doctor did everythingreasonable and prudent to diagnose and treat the patient.
a. What does this tell you about the burden of risk?b. What impact does this burden place on you and your family in your everyday life?c. Is the doctor wrong to do this, or is it a necessary precaution?d. Is there some way to change this situation?
19. Thompson’s department store has a fleet of delivery trucks. The store also has a restaurant, a sodafountain, a babysitting service for parents shopping there, and an in-home appliance serviceprogram.
a. Name three perils associated with each of these operations.
26 RISK MANAGEMENT FOR ENTERPRISES AND INDIVIDUALS
b. For the pure risk situations you noted in part 1 of this exercise, name three hazards thatcould be controlled by the employees of the department store.
c. If you were manager of the store, would you want all these operations? Which—ifany—would you eliminate? Explain.
20. Omer Laskwood, the major income earner for a family of four, was overheard saying to his friendVince, “I don’t carry any life insurance because I’m young, and I know from statistics few peopledie at my age.”
a. What are your feelings about this statement?b. How does Omer perceive risk relative to his situation?c. What characteristic in this situation is more important than the likelihood of Mr.
Laskwood dying?d. Are there other risks Omer should consider?
21. The council members of Flatburg are very proud of the proposed new airport they are discussingat a council meeting. When it is completed, Flatburg will finally have regular commercial airservice. Some type of fire protection is needed at the new airport, but a group of citizens isprotesting that Flatburg cannot afford to purchase another fire engine. The airport could sharethe downtown fire station, or the firehouse could be moved to the airport five miles away.Someone suggested a compromise—move the facilities halfway. As the council members left theirmeeting that evening, they had questions regarding this problem.
a. What questions would you raise?b. How would you handle this problem using the information discussed in this chapter?
CHAPTER 1 THE NATURE OF RISK: LOSSES AND OPPORTUNITIES 27
1.
2.
3.
4.5.
6.7.
8.9.
10.
11.
12.
ENDNOTES
David J. Lynch, “Global Financial Crisis May Hit Hardest Outside U.S.,” USA Today,October 30, 2008. The initial thought that the trouble was more a U.S. isolatedtrouble “laid low by a Wall Street culture of heedless risk-taking” and the thinkingwas that “the U.S. will lose its status as the superpower of the global financial sys-tem…. Now everyone realizes they are in this global mess together. Reflecting thatshared fate, Asian and European leaders gathered Saturday in Beijing to brainstormahead of a Nov. 15 international financial summit in Washington, D.C.”
In essence, a credit derivative is a financial instrument issued by one firm, whichguarantees payment for contracts of another party. The guarantees are provided un-der a second contract. Should the issuer of the second contract not perform—for ex-ample, by defaulting or going bankrupt—the second contract goes into effect.When the mortgages defaulted, the supposed guarantor did not have enoughmoney to pay their contract obligations. This caused others (who were counting onthe payment) to default as well on other obligations. This snowball effect thencaused others to default, and so forth. It became a chain reaction that generated aglobal financial market collapse.
This lack of risk management cannot be blamed on lack of warning of the risk alone.Regulators and firms were warned to adhere to risk management procedures.However, these warnings were ignored in pursuit of profit and “free markets.” See“The Crash: Risk and Regulation, What Went Wrong” by Anthony Faiola, EllenNakashima, and Jill Drew, Washington Post, October 15, 2008, A01.
See http://www.dhs.gov/dhspublic/.
The student is invited to read archival articles from all media sources about thecalamity of the poor response to the floods in New Orleans. The insurance studies ofVirginia Commonwealth University held a town hall meeting the week after Katrinato discuss the natural and man-made disasters and their impact both financially andsocially. The PowerPoint basis for the discussion is available to the readers.
See http://www.dhs.gov/dhspublic/.
Etti G. Baranoff, “The Risk Balls Game: Transforming Risk and Insurance Into TangibleConcept,” Risk Management & Insurance Review 4, no. 2 (2001): 51–59.
L. Buchanan, “Breakthrough Ideas for 2004,” Harvard Business Review 2 (2004): 13–16.
Etti G. Baranoff and Thomas W. Sager, “Integrated Risk Management in Life InsuranceCompanies,” an award winning paper, International Insurance Society Seminar, Chica-go, July 2006 and in Special Edition of the Geneva Papers on Risk and Insurance.
Reprinted with permission from the author; Etti G. Baranoff, “Risk Management andInsurance During the Decade of September 11,” in The Day that Changed Everything?An Interdisciplinary Series of Edited Volumes on the Impact of 9/11, vol. 2.
http://www.rms.com, http://www.iso.com/index.php?option=com_content&task=view&id=932&Itemid=587, and http://www.iso.com/index.php?option= com_content&task=view&id=930&Itemid=585.
Laurent Condamin, Jean-Paul Louisot, and Patrick Maim, “Risk Quantification: Man-agement, Diagnosis and Hedging” (Chichester, UK: John Wiley & Sons Ltd., 2006).
28 RISK MANAGEMENT FOR ENTERPRISES AND INDIVIDUALS
C H A P T E R 2Risk Measurement andMetricsIn Chapter 1, we discussed how risk arises as a consequence of uncertainty. Recall also that risk is not the state of
uncertainty itself. Risk and uncertainty are connected and yet are distinct concepts.
In this chapter, we will discuss the ways in which we measure risk and uncertainty. If we wish to understand
and use the concepts of risk and uncertainty, we need to be able to measure these concepts’ outcomes.
Psychological and economic research shows that emotions such as fear, dread, ambiguity avoidance, and feelings
of emotional loss represent valid risks. Such feelings are thus relevant to decision making under uncertainty. Our
focus here, however, will draw more on financial metrics rather than emotional or psychological measures of risk
perception. In this chapter, we thus discuss measurable and quantifiable outcomes and how we can measure risk
and uncertainty using numerical methods.
A “metric” in this context is a system of related measures that helps us quantify characteristics or qualities. Any
individual or enterprise needs to be able to quantify risk before they can decide whether or not a particular risk is
critical enough to commit resources to manage. If such resources have been committed, then we need
measurements to see whether the risk management process or procedure has reduced risk. And all forms of
enterprises, for financial profit or for social profit, must strive to reduce risk. Without risk metrics, enterprises cannot
tell whether or not they have reached risk management objectives. Enterprises including businesses hold risk
management to be as important as any other objective, including profitability. Without risk metrics to measure
success, failure, or incremental improvement, we cannot judge progress in the control of risk.
Risk management provides a framework for assessing opportunities for profit, as well as for gauging threats of
loss. Without measuring risk, we cannot ascertain what action of the available alternatives the enterprise should
take to optimize the risk-reward tradeoff. The risk-reward tradeoff is essentially a cost-benefit analysis taking
uncertainty into account. In (economic) marginal analysis terms, we want to know how many additional units of risk
we need to take on in order to get an additional unit of reward or profit. A firm, for example, wants to know how
much capital it needs to keep from going insolvent if a bad risk is realized.[1] Indeed, if they cannot measure risk,
enterprises are stuck in the ancient world of being helpless to act in the face of uncertainty. Risk metrics allow us to
measure risk, giving us an ability to control risk and simultaneously exploit opportunities as they arise. No one
profits from establishing the existence of an uncertain state of nature. Instead, managers must measure and assess
their enterprise’s degree of vulnerability (risk) and sensitivity to the various potential states of nature. After reading
this chapter, you should be able to define several different risk metrics and be able to discuss when each metric is
appropriate for a given situation.
We will discuss several risk measures here, each of which comes about from the progression of mathematical
approaches to describing and evaluating risk. We emphasize from the start, however, that measuring risk using
these risk metrics is only one step as we assess any opportunity-risk issue. Risk metrics cannot stand alone. We must
also evaluate how appropriate each underlying model might be for the occasion. Further, we need to evaluate
each question in terms of the risk level that each entity is willing to assume for the gain each hopes to receive.
Firms must understand the assumptions behind worst-case or ruin scenarios, since most firms do not want to take
on risks that “bet the house.” To this end, knowing the severity of losses that might be expected in the future
(severity is the dollar value per claim) using forecasting models represents one aspect of quantifying risk. However,
financial decision making requires that we evaluate severity levels based upon what an individual or a firm can
comfortably endure (risk appetite). Further, we must evaluate the frequency with which a particular outcome will
occur. As with the common English language usage of the term, frequency is the number of times the event is
expected to occur in a specified period of time. The 2008 financial crisis provides an example: Poor risk
management of the financial models used for creating mortgage-backed securities and credit default derivatives
contributed to a worldwide crisis. The assessment of loss frequency, particularly managers’ assessment of the
severity of losses, was grossly underestimated. We discuss risk assessment using risk metrics in the pages that follow.
As we noted in Chapter 1, risk is a concept encompassing perils, hazards, exposures, and perception (with a
strong emphasis on perception). It should come as no surprise that the metrics for measuring risk are also quite
varied. The aspect of risk being considered in a particular situation dictates the risk measure used. If we are
interested in default risk (the risk that a contracting party will be unable to live up to the terms of some financial
contract, usually due to total ruin or bankruptcy), then one risk measure might be employed. If, on the other hand,
we are interested in expected fluctuations of retained earnings for paying future losses, then we would likely use
another risk measure. If we wish to know how much risk is generated by a risky undertaking that cannot be
diversified away in the marketplace, then we would use yet another risk measure. Each risk measure has its place
and appropriate application. One part of the art of risk management is to pick the appropriate risk measure for each
situation.
In this chapter, we will cover the following:
1. Links
2. Quantification of uncertain outcomes via probability models
3. Measures of risk: putting it together
1. LINKSThe first step in developing any framework for the measuring risk quantitatively involves creating aframework for addressing and studying uncertainty itself. Such a framework lies within the realm ofprobability. Since risk arises from uncertainty, measures of risk must also take uncertainty into ac-count. The process of quantifying uncertainty, also known as probability theory, actually proved to besurprisingly difficult and took millennia to develop. Progress on this front required that we develop twofundamental ideas. The first is a way to quantify uncertainty (probability) of potential states of theworld. Second, we had to develop the notion that the outcomes of interest to human events, the risks,were subject to some kind of regularity that we could predict and that would remain stable over time.Developing and accepting these two notions represented path-breaking, seminal changes from previ-ous mindsets. Until research teams made and accepted these steps, any firm, scientific foundation fordeveloping probability and risk was impossible.
Solving risk problems requires that we compile a puzzle of the many personal and business risks.First, we need to obtain quantitative measures of each risk. Again, as in Chapter 1, we repeat the Linkpuzzle in Figure 2.1. The point illustrated in Figure 2.1 is that we face many varied risk exposures,
30 RISK MANAGEMENT FOR ENTERPRISES AND INDIVIDUALS
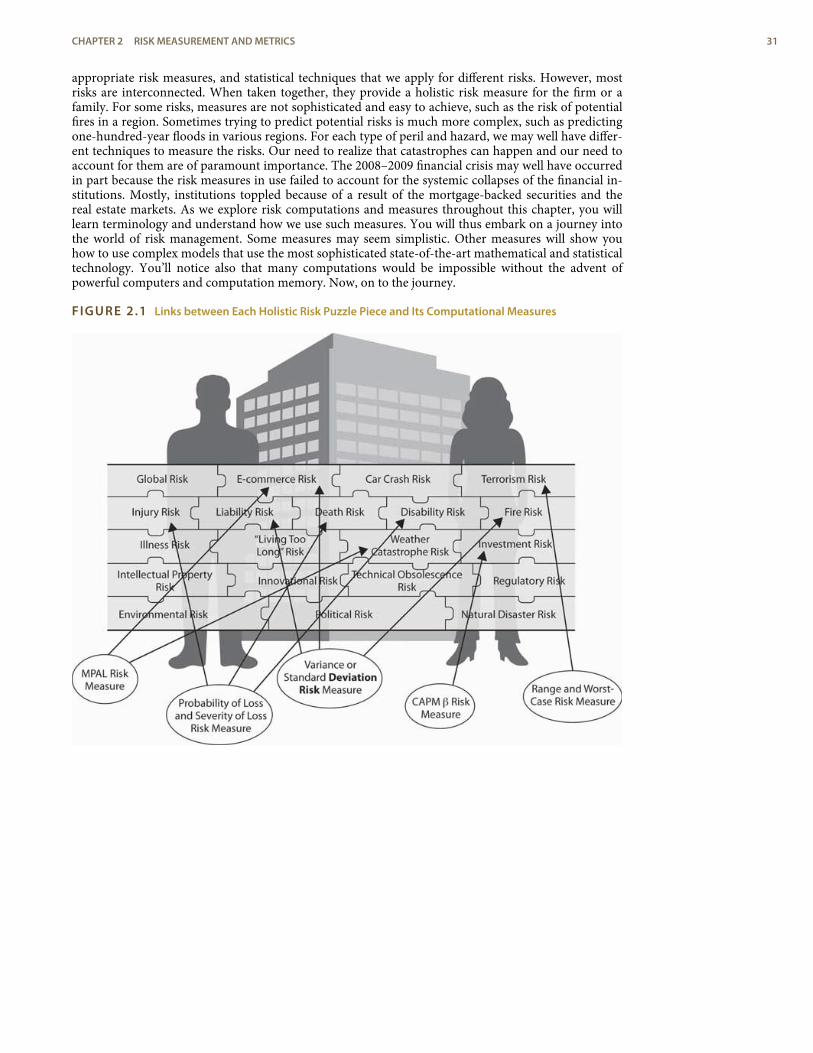
appropriate risk measures, and statistical techniques that we apply for different risks. However, mostrisks are interconnected. When taken together, they provide a holistic risk measure for the firm or afamily. For some risks, measures are not sophisticated and easy to achieve, such as the risk of potentialfires in a region. Sometimes trying to predict potential risks is much more complex, such as predictingone-hundred-year floods in various regions. For each type of peril and hazard, we may well have differ-ent techniques to measure the risks. Our need to realize that catastrophes can happen and our need toaccount for them are of paramount importance. The 2008–2009 financial crisis may well have occurredin part because the risk measures in use failed to account for the systemic collapses of the financial in-stitutions. Mostly, institutions toppled because of a result of the mortgage-backed securities and thereal estate markets. As we explore risk computations and measures throughout this chapter, you willlearn terminology and understand how we use such measures. You will thus embark on a journey intothe world of risk management. Some measures may seem simplistic. Other measures will show youhow to use complex models that use the most sophisticated state-of-the-art mathematical and statisticaltechnology. You’ll notice also that many computations would be impossible without the advent ofpowerful computers and computation memory. Now, on to the journey.
FIGURE 2.1 Links between Each Holistic Risk Puzzle Piece and Its Computational Measures
CHAPTER 2 RISK MEASUREMENT AND METRICS 31
model
A symbolic representation ofthe possible outcomes.
2. QUANTIFICATION OF UNCERTAINTY VIAPROBABILITY MODELS
L E A R N I N G O B J E C T I V E S
< In this section, you will learn how to quantify the relative frequency of occurrences of uncertainevents by using probability models.
< You will learn about the measures of frequency, severity, likelihood, statistical distributions,and expected values.
< You will use examples to compute these values.
As we consider uncertainty, we use rigorous quantitative studies of chance, the recognition of its em-pirical regularity in uncertain situations. Many of these methods are used to quantify the occurrence ofuncertain events that represent intellectual milestones. As we create models based upon probability andstatistics, you will likely recognize that probability and statistics touch nearly every field of study today.As we have internalized the predictive regularity of repeated chance events, our entire worldview haschanged. For example, we have convinced ourselves of the odds of getting heads in a coin flip so muchthat it’s hard to imagine otherwise. We’re used to seeing statements such as “average life of 1,000hours” on a package of light bulbs. We understand such a phrase because we can think of the length oflife of a light bulb as being uncertain but statistically predictable. We routinely hear such statements as“The chance of rain tomorrow is 20 percent.” It’s hard for us to imagine that only a few centuries agopeople did not believe even in the existence of chance occurrences or random events or in accidents,much less explore any method of quantifying seemingly chance events. Up until very recently, peoplehave believed that God controlled every minute detail of the universe. This belief rules out any kind ofconceptualization of chance as a regular or predictable phenomenon. For example, until recently thecost of buying a life annuity that paid buyers $100 per month for life was the same for a thirty-year-oldas it was for a seventy-year-old. It didn’t matter that empirically, the “life expectancy” of a thirty-year-old was four times longer than that of a seventy-year-old.[2] After all, people believed that a person’sparticular time of death was “God’s will.” No one believed that the length of someone’s life could bejudged or predicted statistically by any noticed or exhibited regularity across people. In spite of the ad-vancements in mathematics and science since the beginning of civilization, remarkably, the develop-ment of measures of relative frequency of occurrence of uncertain events did not occur until the 1600s.This birth of the “modern” ideas of chance occurred when a problem was posed to mathematicianBlaisé Pascal by a frequent gambler. As often occurs, the problem turned out to be less important in thelong run than the solution developed to solve the problem.
The problem posed was: If two people are gambling and the game is interrupted and discontinuedbefore either one of the two has won, what is a fair way to split the pot of money on the table? Clearlythe person ahead at that time had a better chance of winning the game and should have gotten more.The player in the lead would receive the larger portion of the pot of money. However, the person losingcould come from behind and win. It could happen and such a possibility should not be excluded. Howshould the pot be split fairly? Pascal formulated an approach to this problem and, in a series of letterswith Pierre de Fermat, developed an approach to the problem that entailed writing down all possibleoutcomes that could possibly occur and then counting the number of times the first gambler won. Theproportion of times that the first gambler won (calculated as the number of times the gambler won di-vided by the total number of possible outcomes) was taken to be the proportion of the pot that the firstgambler could fairly claim. In the process of formulating this solution, Pascal and Fermat more gener-ally developed a framework to quantify the relative frequency of uncertain outcomes, which is nowknown as probability. They created the mathematical notion of expected value of an uncertain event.They were the first to model the exhibited regularity of chance or uncertain events and apply it to solvea practical problem. In fact, their solution pointed to many other potential applications to problems inlaw, economics, and other fields.
From Pascal and Fermat’s work, it became clear that to manage future risks under uncertainty, weneed to have some idea about not only the possible outcomes or states of the world but also how likelyeach outcome is to occur. We need a model, or in other words, a symbolic representation of the pos-sible outcomes and their likelihoods or relative frequencies.
32 RISK MANAGEMENT FOR ENTERPRISES AND INDIVIDUALS
likelihood
The probability that an eventwill occur in a specifiedamount of time.
distribution
The display of the events on amap that tells us thelikelihood that the event orevents will occur.
A Historical Prelude to the Quantification of Uncertainty Via Probabilities
Historically, the development of measures of chance (probability) only began in the mid-1600s. Why in themiddle ages, and not with the Greeks? The answer, in part, is that the Greeks and their predecessors did nothave the mathematical concepts. Nor, more importantly, did the Greeks have the psychological perspective toeven contemplate these notions, much less develop them into a cogent theory capable of reproduction andexpansion. First, the Greeks did not have the mathematical notational system necessary to contemplate aformal approach to risk. They lacked, for example, the simple and complete symbolic system including a zeroand an equal sign useful for computation, a contribution that was subsequently developed by the Arabs andlater adopted by the Western world. The use of Roman numerals might have been sufficient for counting, andperhaps sufficient for geometry, but certainly it was not conducive to complex calculations. The equal signwas not in common use until the late middle ages. Imagine doing calculations (even such simple computa-tions as dividing fractions or solving an equation) in Roman numerals without an equal sign, a zero element, ora decimal point!
But mathematicians and scientists settled these impediments a thousand years before the advent of probabil-ity. Why did risk analysis not emerge with the advent of a more complete numbering system just as sophistic-ated calculations in astronomy, engineering, and physics did? The answer is more psychological than math-ematical and goes to the heart of why we consider risk as both a psychological and a numerical concept inthis book. To the Greeks (and to the millennia of others who followed them), the heavens, divinely created,were believed to be static and perfect and governed by regularity and rules of perfection—circles, spheres,the six perfect geometric solids, and so forth. The earthly sphere, on the other hand, was the source of imper-fection and chaos. The Greeks accepted that they would find no sense in studying the chaotic events of Earth.The ancient Greeks found the path to truth in contemplating the perfection of the heavens and other perfectunspoiled or uncorrupted entities. Why would a god (or gods) powerful enough to know and createeverything intentionally create a world using a less than perfect model? The Greeks, and others who followed,believed pure reasoning, not empirical, observation would lead to knowledge. Studying regularity in thechaotic earthly sphere was worst than a futile waste of time; it distracted attention from important contempla-tions actually likely to impart true knowledge.
It took a radical change in mindset to start to contemplate regularity in events in the earthly domain. We are allcreatures of our age, and we could not pose the necessary questions to develop a theory of probability andrisk until we shook off these shackles of the mind. Until the age of reason, when church reforms and a growingmerchant class (who pragmatically examined and counted things empirically) created a tremendous growthin trade, we remained trapped in the old ways of thinking. As long as society was static and stationary, with vil-lages this year being essentially the same as they were last year or a decade or century before, there was littleneed to pose or solve these problems. M. G. Kendall captures this succinctly when he noted that “mathematicsnever leads thought, but only expresses it.”* The western world was simply not yet ready to try to quantify riskor event likelihood (probability) or to contemplate uncertainty. If all things are believed to be governed by anomnipotent god, then regularity is not to be trusted, perhaps it can even be considered deceptive, and vari-ation is irrelevant and illusive, being merely reflective of God’s will. Moreover, the fact that things like dice anddrawing of lots were simultaneously used by magicians, by gamblers, and by religious figures for divinationdid not provide any impetus toward looking for regularity in earthly endeavors.
* M. G. Kendall, “The Beginnings of a Probability Calculus,” in Studies in the History of Statistics and Probability,vol. 1, ed. E. S. Pearson and Sir Maurice Kendall (London: Charles Griffin & Co., 1970), 30.
2.1 Measurement Techniques for Frequency, Severity, and ProbabilityDistribution Measures for Quantifying Uncertain EventsWhen we can see the pattern of the losses and/or gains experienced in the past, we hope that the samepattern will continue in the future. In some cases, we want to be able to modify the past results in a lo-gical way like inflating them for the time value of money discussed in Chapter 3. If the patterns of gainsand losses continue, our predictions of future losses or gains will be informative. Similarly, we may de-velop a pattern of losses based on theoretical or physical constructs (such as hurricane forecastingmodels based on physics or likelihood of obtaining a head in a flip of a coin based on theoretical mod-els of equal likelihood of a head and a tail). Likelihood is the notion of how often a certain event willoccur. Inaccuracies in our abilities to create a correct distribution arise from our inability to predictfutures outcomes accurately. The distribution is the display of the events on a map that tells us the like-lihood that the event or events will occur. In some ways, it resembles a picture of the likelihood andregularity of events that occur. Let’s now turn to creating models and measures of the outcomes andtheir frequency.
CHAPTER 2 RISK MEASUREMENT AND METRICS 33
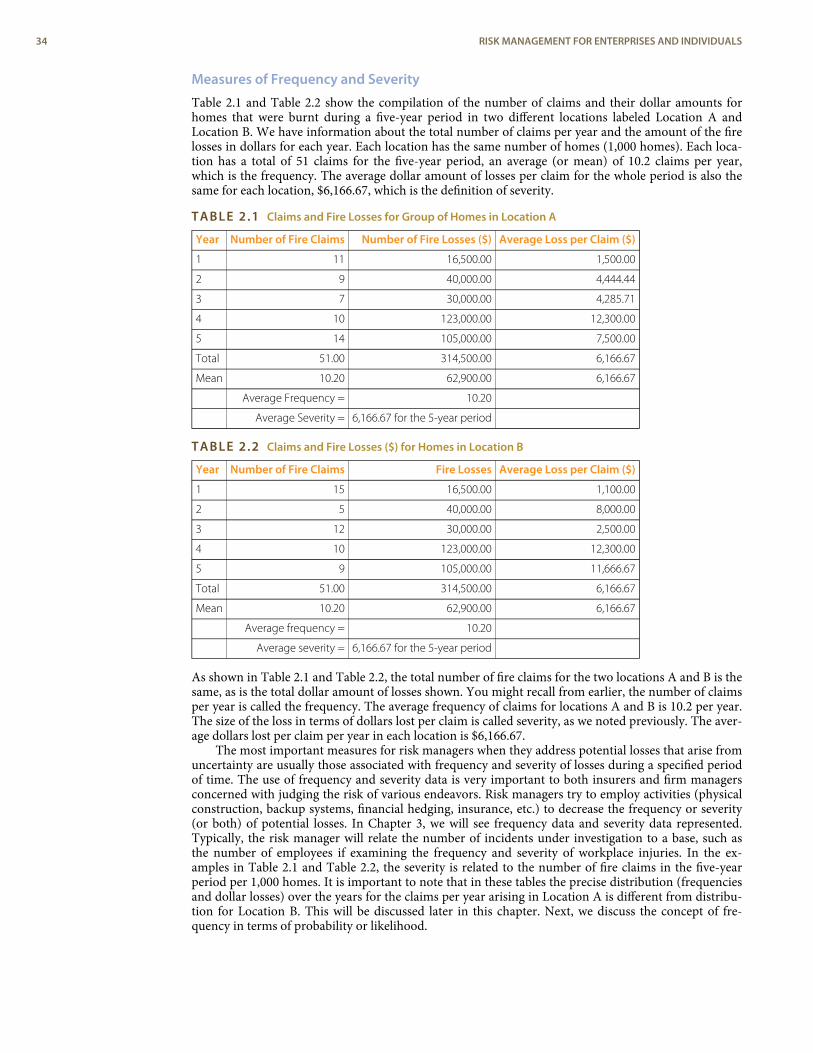
Measures of Frequency and Severity
Table 2.1 and Table 2.2 show the compilation of the number of claims and their dollar amounts forhomes that were burnt during a five-year period in two different locations labeled Location A andLocation B. We have information about the total number of claims per year and the amount of the firelosses in dollars for each year. Each location has the same number of homes (1,000 homes). Each loca-tion has a total of 51 claims for the five-year period, an average (or mean) of 10.2 claims per year,which is the frequency. The average dollar amount of losses per claim for the whole period is also thesame for each location, $6,166.67, which is the definition of severity.
TABLE 2.1 Claims and Fire Losses for Group of Homes in Location A
Year Number of Fire Claims Number of Fire Losses ($) Average Loss per Claim ($)
1 11 16,500.00 1,500.00
2 9 40,000.00 4,444.44
3 7 30,000.00 4,285.71
4 10 123,000.00 12,300.00
5 14 105,000.00 7,500.00
Total 51.00 314,500.00 6,166.67
Mean 10.20 62,900.00 6,166.67
Average Frequency = 10.20
Average Severity = 6,166.67 for the 5-year period
TABLE 2.2 Claims and Fire Losses ($) for Homes in Location B
Year Number of Fire Claims Fire Losses Average Loss per Claim ($)
1 15 16,500.00 1,100.00
2 5 40,000.00 8,000.00
3 12 30,000.00 2,500.00
4 10 123,000.00 12,300.00
5 9 105,000.00 11,666.67
Total 51.00 314,500.00 6,166.67
Mean 10.20 62,900.00 6,166.67
Average frequency = 10.20
Average severity = 6,166.67 for the 5-year period
As shown in Table 2.1 and Table 2.2, the total number of fire claims for the two locations A and B is thesame, as is the total dollar amount of losses shown. You might recall from earlier, the number of claimsper year is called the frequency. The average frequency of claims for locations A and B is 10.2 per year.The size of the loss in terms of dollars lost per claim is called severity, as we noted previously. The aver-age dollars lost per claim per year in each location is $6,166.67.
The most important measures for risk managers when they address potential losses that arise fromuncertainty are usually those associated with frequency and severity of losses during a specified periodof time. The use of frequency and severity data is very important to both insurers and firm managersconcerned with judging the risk of various endeavors. Risk managers try to employ activities (physicalconstruction, backup systems, financial hedging, insurance, etc.) to decrease the frequency or severity(or both) of potential losses. In Chapter 3, we will see frequency data and severity data represented.Typically, the risk manager will relate the number of incidents under investigation to a base, such asthe number of employees if examining the frequency and severity of workplace injuries. In the ex-amples in Table 2.1 and Table 2.2, the severity is related to the number of fire claims in the five-yearperiod per 1,000 homes. It is important to note that in these tables the precise distribution (frequenciesand dollar losses) over the years for the claims per year arising in Location A is different from distribu-tion for Location B. This will be discussed later in this chapter. Next, we discuss the concept of fre-quency in terms of probability or likelihood.
34 RISK MANAGEMENT FOR ENTERPRISES AND INDIVIDUALS
Frequency and Probability
Returning back to the quantification of the notion of uncertainty, we first observe that our intuitive us-age of the word probability can have two different meanings or forms as related to statements of uncer-tain outcomes. This is exemplified by two different statements:[3]
1. “If I sail west from Europe, I have a 50 percent chance that I will fall off the edge of the earth.”2. “If I flip a coin, I have a 50 percent chance that it will land on heads.”
Conceptually, these represent two distinct types of probability statements. The first is a statement aboutprobability as a degree of belief about whether an event will occur and how firmly this belief is held.The second is a statement about how often a head would be expected to show up in repeated flips of acoin. The important difference is that the first statement’s validity or truth will be stated. We can clearup the statement’s veracity for all by sailing across the globe.
The second statement, however, still remains unsettled. Even after the first coin flip, we still have a50 percent chance that the next flip will result in a head. The second provides a different interpretationof “probability,” namely, as a relative frequency of occurrence in repeated trials. This relative frequencyconceptualization of probability is most relevant for risk management. One wants to learn from pastevents about the likelihood of future occurrences. The discoverers of probability theory adopted the re-lative frequency approach to formalizing the likelihood of chance events.
Pascal and Fermat ushered in a major conceptual breakthrough: the concept that, in repeatedgames of chance (or in many other situations encountered in nature) involving uncertainty, fixed relat-ive frequencies of occurrence of the individual possible outcomes arose. These relative frequencies wereboth stable over time and individuals could calculate them by simply counting the number of ways thatthe outcome could occur divided by the total number of equally likely possible outcomes. In addition,empirically the relative frequency of occurrence of events in a long sequence of repeated trials (e.g., re-peated gambling games) corresponded with the theoretical calculation of the number of ways an eventcould occur divided by the total number of possible outcomes. This is the model of equally likely out-comes or relative frequency definition of probability. It was a very distinct departure from the previousconceptualization of uncertainty that had all events controlled by God with no humanly discernablepattern. In the Pascal-Fermat framework, prediction became a matter of counting that could be doneby anyone. Probability and prediction had become a tool of the people! Figure 2.2 provides an examplerepresenting all possible outcomes in the throw of two colored dice along with their associatedprobabilities.
CHAPTER 2 RISK MEASUREMENT AND METRICS 35
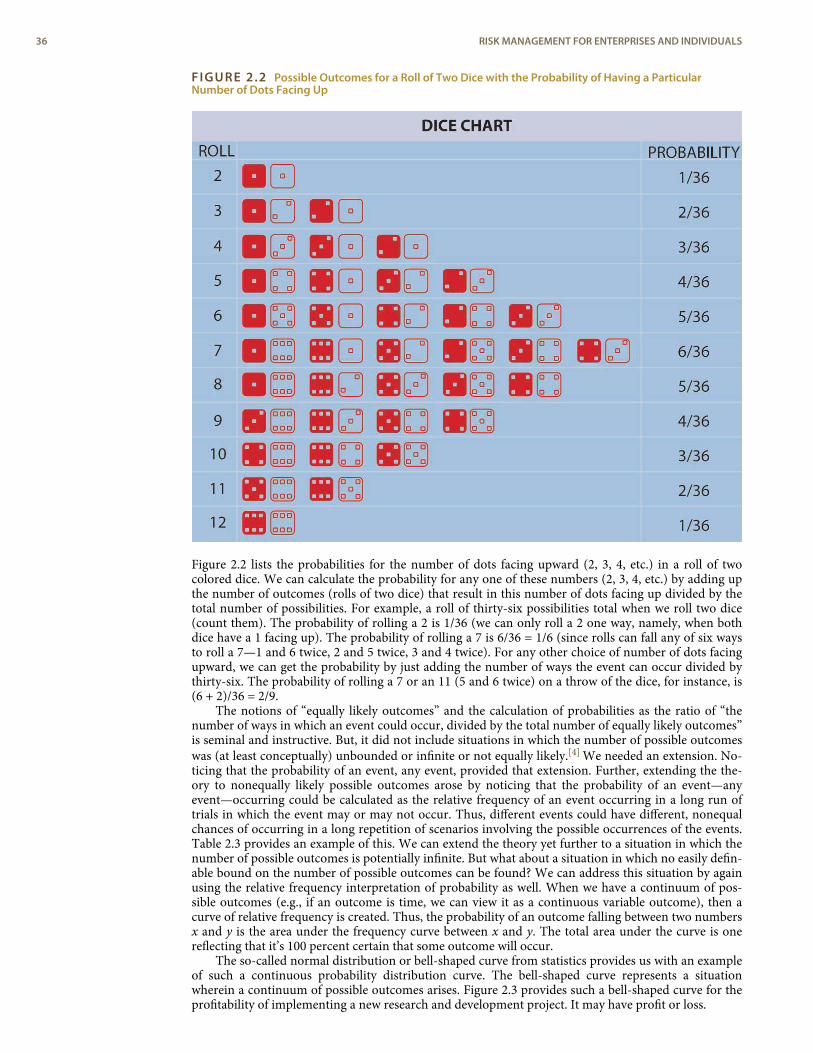
FIGURE 2.2 Possible Outcomes for a Roll of Two Dice with the Probability of Having a ParticularNumber of Dots Facing Up
Figure 2.2 lists the probabilities for the number of dots facing upward (2, 3, 4, etc.) in a roll of twocolored dice. We can calculate the probability for any one of these numbers (2, 3, 4, etc.) by adding upthe number of outcomes (rolls of two dice) that result in this number of dots facing up divided by thetotal number of possibilities. For example, a roll of thirty-six possibilities total when we roll two dice(count them). The probability of rolling a 2 is 1/36 (we can only roll a 2 one way, namely, when bothdice have a 1 facing up). The probability of rolling a 7 is 6/36 = 1/6 (since rolls can fall any of six waysto roll a 7—1 and 6 twice, 2 and 5 twice, 3 and 4 twice). For any other choice of number of dots facingupward, we can get the probability by just adding the number of ways the event can occur divided bythirty-six. The probability of rolling a 7 or an 11 (5 and 6 twice) on a throw of the dice, for instance, is(6 + 2)/36 = 2/9.
The notions of “equally likely outcomes” and the calculation of probabilities as the ratio of “thenumber of ways in which an event could occur, divided by the total number of equally likely outcomes”is seminal and instructive. But, it did not include situations in which the number of possible outcomeswas (at least conceptually) unbounded or infinite or not equally likely.[4] We needed an extension. No-ticing that the probability of an event, any event, provided that extension. Further, extending the the-ory to nonequally likely possible outcomes arose by noticing that the probability of an event—anyevent—occurring could be calculated as the relative frequency of an event occurring in a long run oftrials in which the event may or may not occur. Thus, different events could have different, nonequalchances of occurring in a long repetition of scenarios involving the possible occurrences of the events.Table 2.3 provides an example of this. We can extend the theory yet further to a situation in which thenumber of possible outcomes is potentially infinite. But what about a situation in which no easily defin-able bound on the number of possible outcomes can be found? We can address this situation by againusing the relative frequency interpretation of probability as well. When we have a continuum of pos-sible outcomes (e.g., if an outcome is time, we can view it as a continuous variable outcome), then acurve of relative frequency is created. Thus, the probability of an outcome falling between two numbersx and y is the area under the frequency curve between x and y. The total area under the curve is onereflecting that it’s 100 percent certain that some outcome will occur.
The so-called normal distribution or bell-shaped curve from statistics provides us with an exampleof such a continuous probability distribution curve. The bell-shaped curve represents a situationwherein a continuum of possible outcomes arises. Figure 2.3 provides such a bell-shaped curve for theprofitability of implementing a new research and development project. It may have profit or loss.
36 RISK MANAGEMENT FOR ENTERPRISES AND INDIVIDUALS
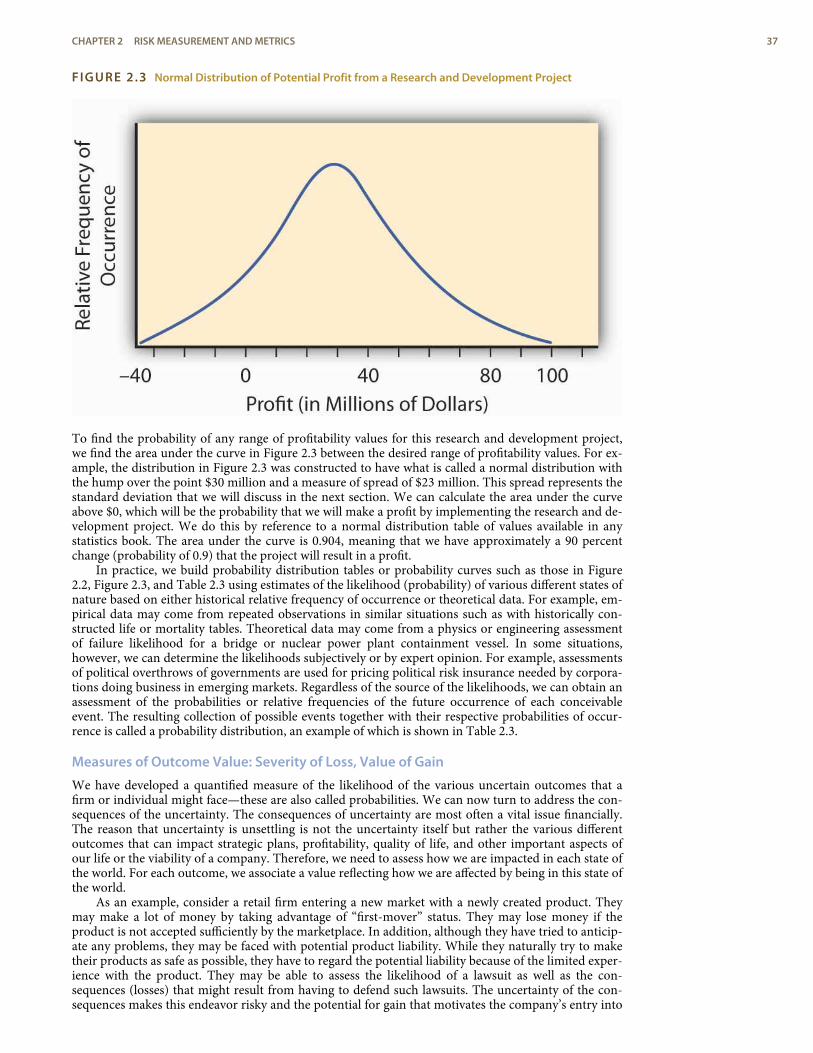
FIGURE 2.3 Normal Distribution of Potential Profit from a Research and Development Project
To find the probability of any range of profitability values for this research and development project,we find the area under the curve in Figure 2.3 between the desired range of profitability values. For ex-ample, the distribution in Figure 2.3 was constructed to have what is called a normal distribution withthe hump over the point $30 million and a measure of spread of $23 million. This spread represents thestandard deviation that we will discuss in the next section. We can calculate the area under the curveabove $0, which will be the probability that we will make a profit by implementing the research and de-velopment project. We do this by reference to a normal distribution table of values available in anystatistics book. The area under the curve is 0.904, meaning that we have approximately a 90 percentchange (probability of 0.9) that the project will result in a profit.
In practice, we build probability distribution tables or probability curves such as those in Figure2.2, Figure 2.3, and Table 2.3 using estimates of the likelihood (probability) of various different states ofnature based on either historical relative frequency of occurrence or theoretical data. For example, em-pirical data may come from repeated observations in similar situations such as with historically con-structed life or mortality tables. Theoretical data may come from a physics or engineering assessmentof failure likelihood for a bridge or nuclear power plant containment vessel. In some situations,however, we can determine the likelihoods subjectively or by expert opinion. For example, assessmentsof political overthrows of governments are used for pricing political risk insurance needed by corpora-tions doing business in emerging markets. Regardless of the source of the likelihoods, we can obtain anassessment of the probabilities or relative frequencies of the future occurrence of each conceivableevent. The resulting collection of possible events together with their respective probabilities of occur-rence is called a probability distribution, an example of which is shown in Table 2.3.
Measures of Outcome Value: Severity of Loss, Value of Gain
We have developed a quantified measure of the likelihood of the various uncertain outcomes that afirm or individual might face—these are also called probabilities. We can now turn to address the con-sequences of the uncertainty. The consequences of uncertainty are most often a vital issue financially.The reason that uncertainty is unsettling is not the uncertainty itself but rather the various differentoutcomes that can impact strategic plans, profitability, quality of life, and other important aspects ofour life or the viability of a company. Therefore, we need to assess how we are impacted in each state ofthe world. For each outcome, we associate a value reflecting how we are affected by being in this state ofthe world.
As an example, consider a retail firm entering a new market with a newly created product. Theymay make a lot of money by taking advantage of “first-mover” status. They may lose money if theproduct is not accepted sufficiently by the marketplace. In addition, although they have tried to anticip-ate any problems, they may be faced with potential product liability. While they naturally try to maketheir products as safe as possible, they have to regard the potential liability because of the limited exper-ience with the product. They may be able to assess the likelihood of a lawsuit as well as the con-sequences (losses) that might result from having to defend such lawsuits. The uncertainty of the con-sequences makes this endeavor risky and the potential for gain that motivates the company’s entry into
CHAPTER 2 RISK MEASUREMENT AND METRICS 37
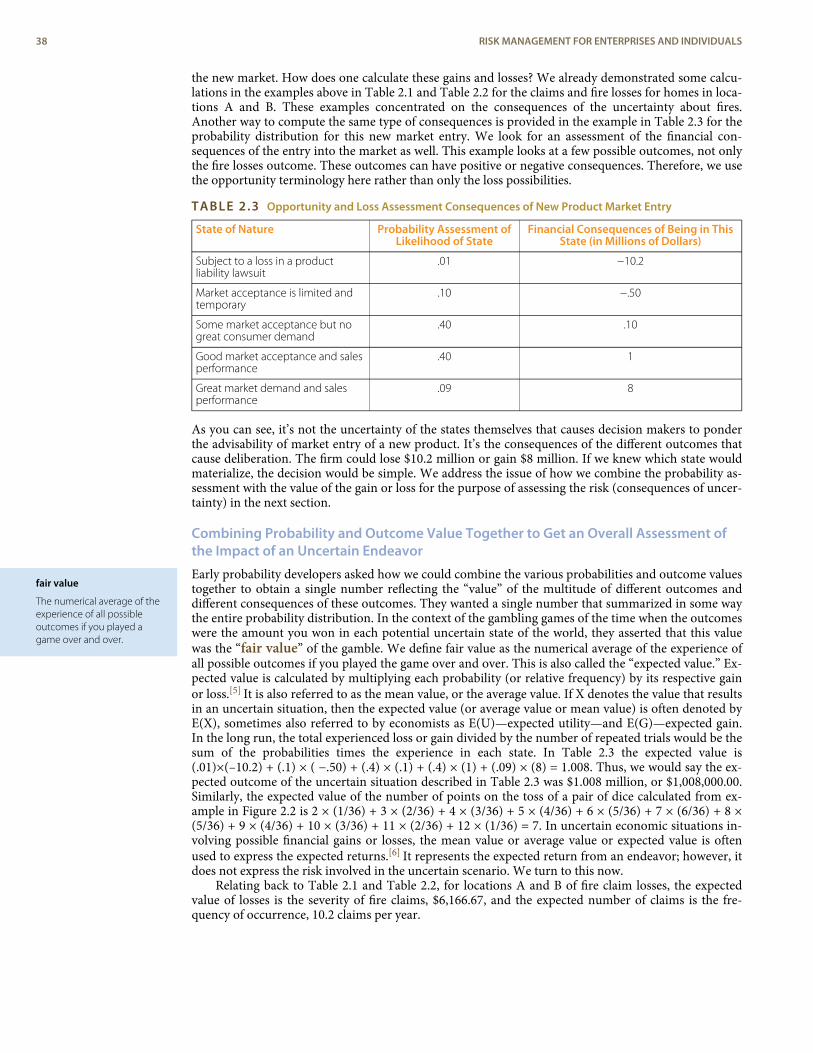
fair value
The numerical average of theexperience of all possibleoutcomes if you played agame over and over.
the new market. How does one calculate these gains and losses? We already demonstrated some calcu-lations in the examples above in Table 2.1 and Table 2.2 for the claims and fire losses for homes in loca-tions A and B. These examples concentrated on the consequences of the uncertainty about fires.Another way to compute the same type of consequences is provided in the example in Table 2.3 for theprobability distribution for this new market entry. We look for an assessment of the financial con-sequences of the entry into the market as well. This example looks at a few possible outcomes, not onlythe fire losses outcome. These outcomes can have positive or negative consequences. Therefore, we usethe opportunity terminology here rather than only the loss possibilities.
TABLE 2.3 Opportunity and Loss Assessment Consequences of New Product Market Entry
State of Nature Probability Assessment ofLikelihood of State
Financial Consequences of Being in ThisState (in Millions of Dollars)
Subject to a loss in a productliability lawsuit
.01 −10.2
Market acceptance is limited andtemporary
.10 −.50
Some market acceptance but nogreat consumer demand
.40 .10
Good market acceptance and salesperformance
.40 1
Great market demand and salesperformance
.09 8
As you can see, it’s not the uncertainty of the states themselves that causes decision makers to ponderthe advisability of market entry of a new product. It’s the consequences of the different outcomes thatcause deliberation. The firm could lose $10.2 million or gain $8 million. If we knew which state wouldmaterialize, the decision would be simple. We address the issue of how we combine the probability as-sessment with the value of the gain or loss for the purpose of assessing the risk (consequences of uncer-tainty) in the next section.
Combining Probability and Outcome Value Together to Get an Overall Assessment ofthe Impact of an Uncertain Endeavor
Early probability developers asked how we could combine the various probabilities and outcome valuestogether to obtain a single number reflecting the “value” of the multitude of different outcomes anddifferent consequences of these outcomes. They wanted a single number that summarized in some waythe entire probability distribution. In the context of the gambling games of the time when the outcomeswere the amount you won in each potential uncertain state of the world, they asserted that this valuewas the “fair value” of the gamble. We define fair value as the numerical average of the experience ofall possible outcomes if you played the game over and over. This is also called the “expected value.” Ex-pected value is calculated by multiplying each probability (or relative frequency) by its respective gainor loss.[5] It is also referred to as the mean value, or the average value. If X denotes the value that resultsin an uncertain situation, then the expected value (or average value or mean value) is often denoted byE(X), sometimes also referred to by economists as E(U)—expected utility—and E(G)—expected gain.In the long run, the total experienced loss or gain divided by the number of repeated trials would be thesum of the probabilities times the experience in each state. In Table 2.3 the expected value is(.01)×(–10.2) + (.1) × ( −.50) + (.4) × (.1) + (.4) × (1) + (.09) × (8) = 1.008. Thus, we would say the ex-pected outcome of the uncertain situation described in Table 2.3 was $1.008 million, or $1,008,000.00.Similarly, the expected value of the number of points on the toss of a pair of dice calculated from ex-ample in Figure 2.2 is 2 × (1/36) + 3 × (2/36) + 4 × (3/36) + 5 × (4/36) + 6 × (5/36) + 7 × (6/36) + 8 ×(5/36) + 9 × (4/36) + 10 × (3/36) + 11 × (2/36) + 12 × (1/36) = 7. In uncertain economic situations in-volving possible financial gains or losses, the mean value or average value or expected value is oftenused to express the expected returns.[6] It represents the expected return from an endeavor; however, itdoes not express the risk involved in the uncertain scenario. We turn to this now.
Relating back to Table 2.1 and Table 2.2, for locations A and B of fire claim losses, the expectedvalue of losses is the severity of fire claims, $6,166.67, and the expected number of claims is the fre-quency of occurrence, 10.2 claims per year.
38 RISK MANAGEMENT FOR ENTERPRISES AND INDIVIDUALS
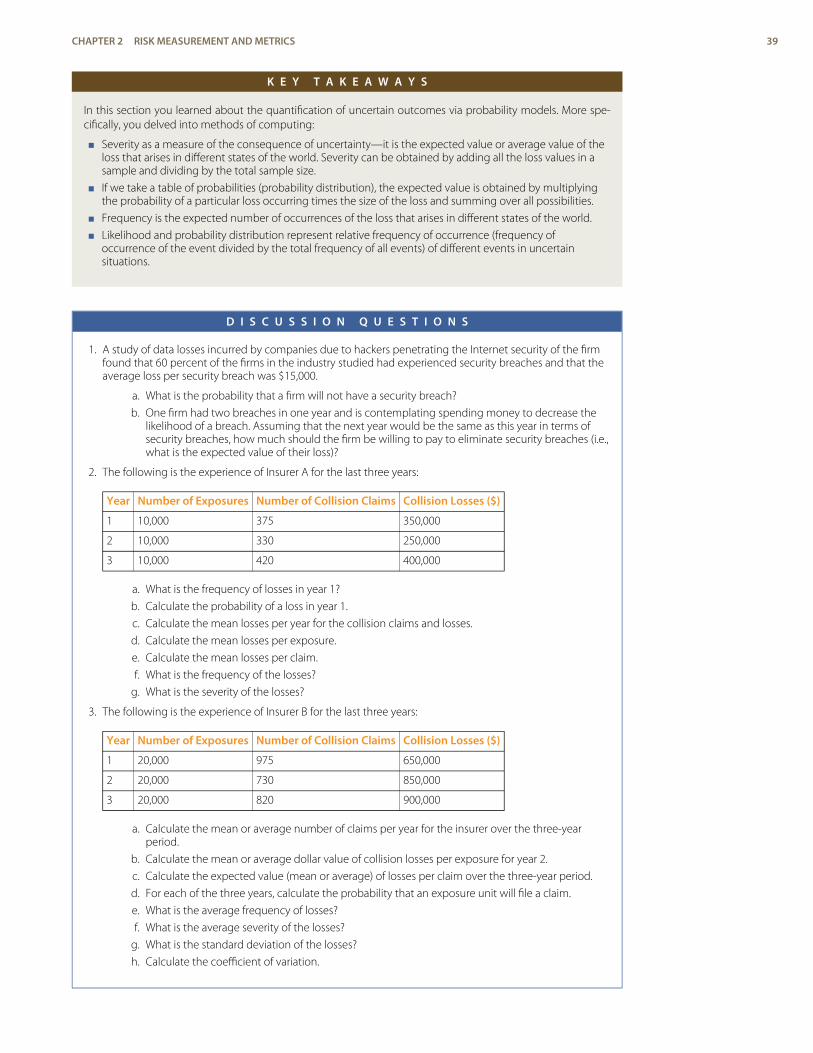
K E Y T A K E A W A Y S
In this section you learned about the quantification of uncertain outcomes via probability models. More spe-cifically, you delved into methods of computing:
< Severity as a measure of the consequence of uncertainty—it is the expected value or average value of theloss that arises in different states of the world. Severity can be obtained by adding all the loss values in asample and dividing by the total sample size.
< If we take a table of probabilities (probability distribution), the expected value is obtained by multiplyingthe probability of a particular loss occurring times the size of the loss and summing over all possibilities.
< Frequency is the expected number of occurrences of the loss that arises in different states of the world.
< Likelihood and probability distribution represent relative frequency of occurrence (frequency ofoccurrence of the event divided by the total frequency of all events) of different events in uncertainsituations.
D I S C U S S I O N Q U E S T I O N S
1. A study of data losses incurred by companies due to hackers penetrating the Internet security of the firmfound that 60 percent of the firms in the industry studied had experienced security breaches and that theaverage loss per security breach was $15,000.
a. What is the probability that a firm will not have a security breach?
b. One firm had two breaches in one year and is contemplating spending money to decrease thelikelihood of a breach. Assuming that the next year would be the same as this year in terms ofsecurity breaches, how much should the firm be willing to pay to eliminate security breaches (i.e.,what is the expected value of their loss)?
2. The following is the experience of Insurer A for the last three years:
Year Number of Exposures Number of Collision Claims Collision Losses ($)
1 10,000 375 350,000
2 10,000 330 250,000
3 10,000 420 400,000
a. What is the frequency of losses in year 1?
b. Calculate the probability of a loss in year 1.
c. Calculate the mean losses per year for the collision claims and losses.
d. Calculate the mean losses per exposure.
e. Calculate the mean losses per claim.
f. What is the frequency of the losses?
g. What is the severity of the losses?
3. The following is the experience of Insurer B for the last three years:
Year Number of Exposures Number of Collision Claims Collision Losses ($)
1 20,000 975 650,000
2 20,000 730 850,000
3 20,000 820 900,000
a. Calculate the mean or average number of claims per year for the insurer over the three-yearperiod.
b. Calculate the mean or average dollar value of collision losses per exposure for year 2.
c. Calculate the expected value (mean or average) of losses per claim over the three-year period.
d. For each of the three years, calculate the probability that an exposure unit will file a claim.
e. What is the average frequency of losses?
f. What is the average severity of the losses?
g. What is the standard deviation of the losses?
h. Calculate the coefficient of variation.
CHAPTER 2 RISK MEASUREMENT AND METRICS 39
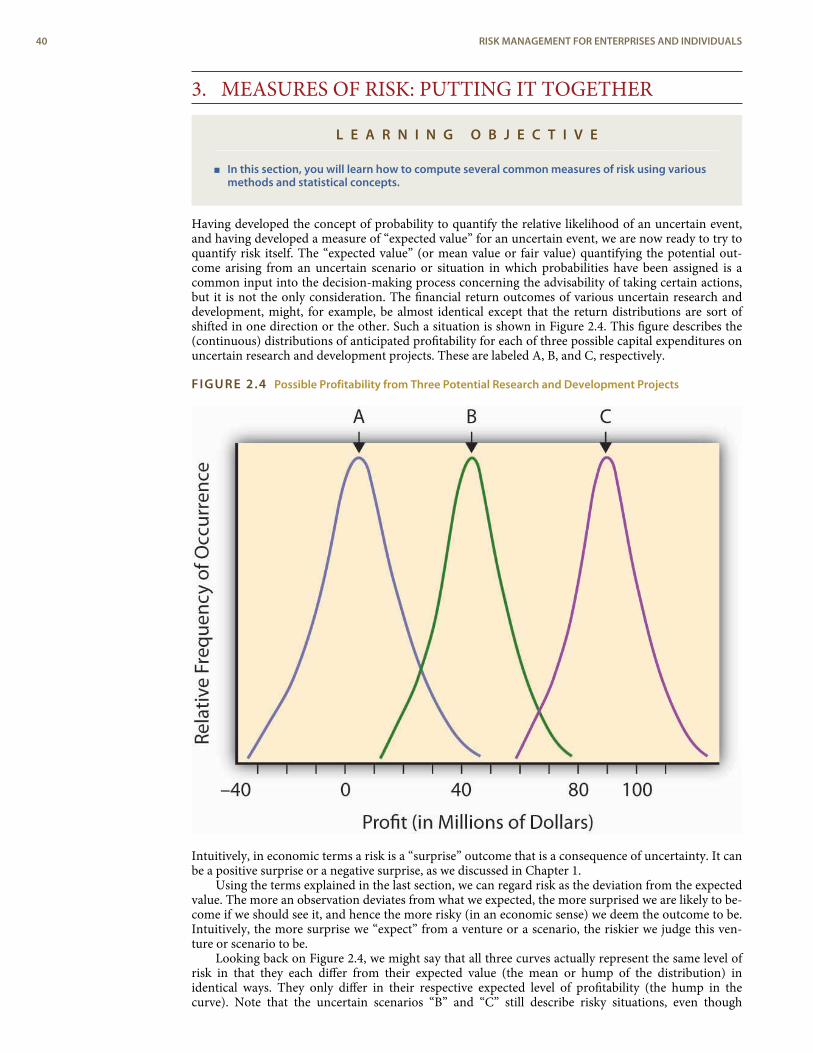
3. MEASURES OF RISK: PUTTING IT TOGETHER
L E A R N I N G O B J E C T I V E
< In this section, you will learn how to compute several common measures of risk using variousmethods and statistical concepts.
Having developed the concept of probability to quantify the relative likelihood of an uncertain event,and having developed a measure of “expected value” for an uncertain event, we are now ready to try toquantify risk itself. The “expected value” (or mean value or fair value) quantifying the potential out-come arising from an uncertain scenario or situation in which probabilities have been assigned is acommon input into the decision-making process concerning the advisability of taking certain actions,but it is not the only consideration. The financial return outcomes of various uncertain research anddevelopment, might, for example, be almost identical except that the return distributions are sort ofshifted in one direction or the other. Such a situation is shown in Figure 2.4. This figure describes the(continuous) distributions of anticipated profitability for each of three possible capital expenditures onuncertain research and development projects. These are labeled A, B, and C, respectively.
FIGURE 2.4 Possible Profitability from Three Potential Research and Development Projects
Intuitively, in economic terms a risk is a “surprise” outcome that is a consequence of uncertainty. It canbe a positive surprise or a negative surprise, as we discussed in Chapter 1.
Using the terms explained in the last section, we can regard risk as the deviation from the expectedvalue. The more an observation deviates from what we expected, the more surprised we are likely to be-come if we should see it, and hence the more risky (in an economic sense) we deem the outcome to be.Intuitively, the more surprise we “expect” from a venture or a scenario, the riskier we judge this ven-ture or scenario to be.
Looking back on Figure 2.4, we might say that all three curves actually represent the same level ofrisk in that they each differ from their expected value (the mean or hump of the distribution) inidentical ways. They only differ in their respective expected level of profitability (the hump in thecurve). Note that the uncertain scenarios “B” and “C” still describe risky situations, even though
40 RISK MANAGEMENT FOR ENTERPRISES AND INDIVIDUALS
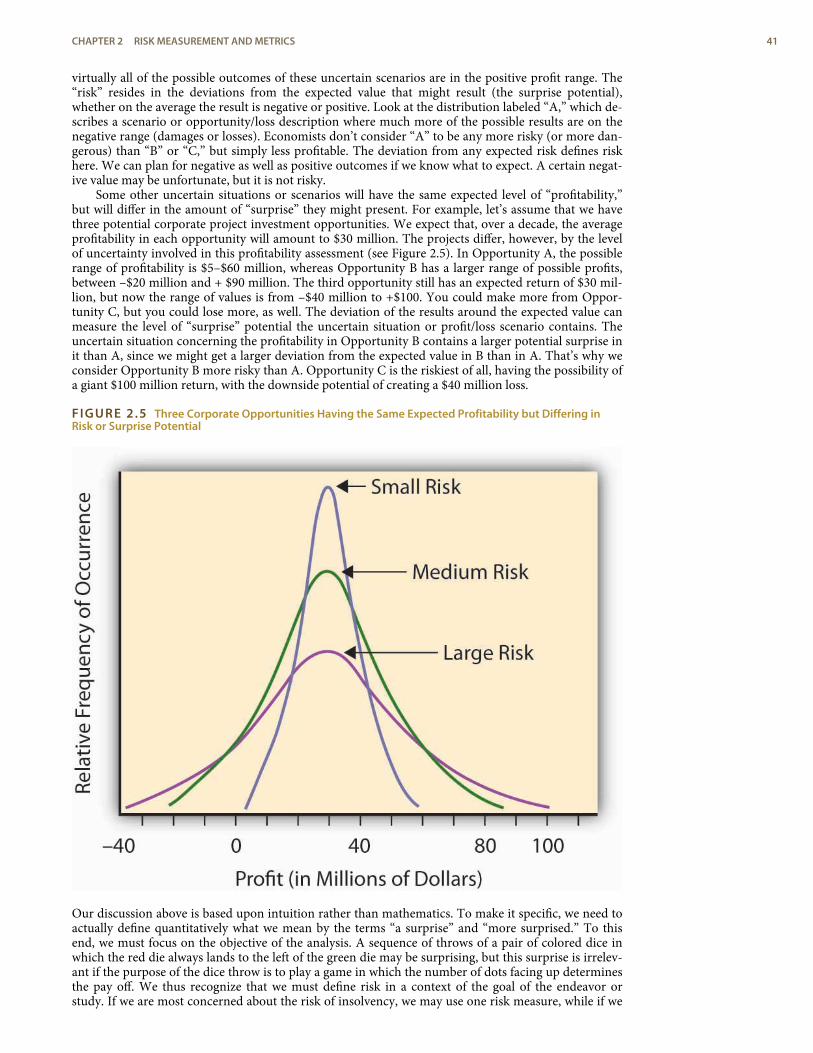
virtually all of the possible outcomes of these uncertain scenarios are in the positive profit range. The“risk” resides in the deviations from the expected value that might result (the surprise potential),whether on the average the result is negative or positive. Look at the distribution labeled “A,” which de-scribes a scenario or opportunity/loss description where much more of the possible results are on thenegative range (damages or losses). Economists don’t consider “A” to be any more risky (or more dan-gerous) than “B” or “C,” but simply less profitable. The deviation from any expected risk defines riskhere. We can plan for negative as well as positive outcomes if we know what to expect. A certain negat-ive value may be unfortunate, but it is not risky.
Some other uncertain situations or scenarios will have the same expected level of “profitability,”but will differ in the amount of “surprise” they might present. For example, let’s assume that we havethree potential corporate project investment opportunities. We expect that, over a decade, the averageprofitability in each opportunity will amount to $30 million. The projects differ, however, by the levelof uncertainty involved in this profitability assessment (see Figure 2.5). In Opportunity A, the possiblerange of profitability is $5–$60 million, whereas Opportunity B has a larger range of possible profits,between –$20 million and + $90 million. The third opportunity still has an expected return of $30 mil-lion, but now the range of values is from –$40 million to +$100. You could make more from Oppor-tunity C, but you could lose more, as well. The deviation of the results around the expected value canmeasure the level of “surprise” potential the uncertain situation or profit/loss scenario contains. Theuncertain situation concerning the profitability in Opportunity B contains a larger potential surprise init than A, since we might get a larger deviation from the expected value in B than in A. That’s why weconsider Opportunity B more risky than A. Opportunity C is the riskiest of all, having the possibility ofa giant $100 million return, with the downside potential of creating a $40 million loss.
FIGURE 2.5 Three Corporate Opportunities Having the Same Expected Profitability but Differing inRisk or Surprise Potential
Our discussion above is based upon intuition rather than mathematics. To make it specific, we need toactually define quantitatively what we mean by the terms “a surprise” and “more surprised.” To thisend, we must focus on the objective of the analysis. A sequence of throws of a pair of colored dice inwhich the red die always lands to the left of the green die may be surprising, but this surprise is irrelev-ant if the purpose of the dice throw is to play a game in which the number of dots facing up determinesthe pay off. We thus recognize that we must define risk in a context of the goal of the endeavor orstudy. If we are most concerned about the risk of insolvency, we may use one risk measure, while if we
CHAPTER 2 RISK MEASUREMENT AND METRICS 41
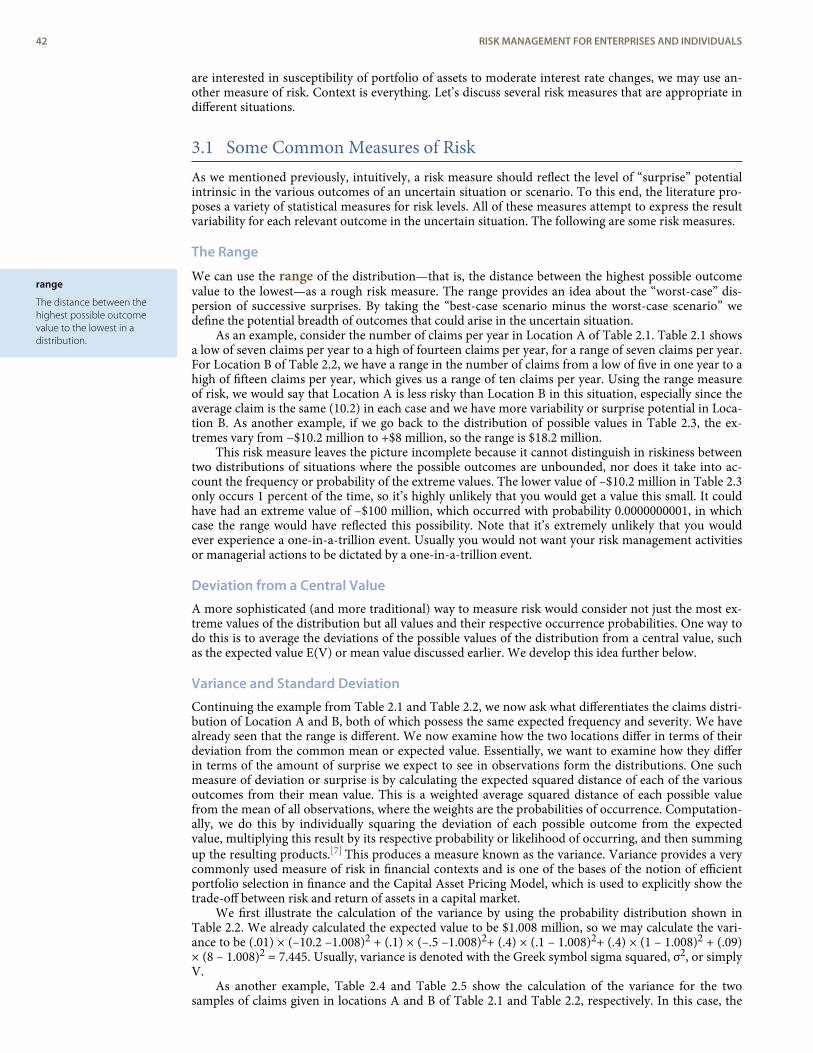
range
The distance between thehighest possible outcomevalue to the lowest in adistribution.
are interested in susceptibility of portfolio of assets to moderate interest rate changes, we may use an-other measure of risk. Context is everything. Let’s discuss several risk measures that are appropriate indifferent situations.
3.1 Some Common Measures of RiskAs we mentioned previously, intuitively, a risk measure should reflect the level of “surprise” potentialintrinsic in the various outcomes of an uncertain situation or scenario. To this end, the literature pro-poses a variety of statistical measures for risk levels. All of these measures attempt to express the resultvariability for each relevant outcome in the uncertain situation. The following are some risk measures.
The Range
We can use the range of the distribution—that is, the distance between the highest possible outcomevalue to the lowest—as a rough risk measure. The range provides an idea about the “worst-case” dis-persion of successive surprises. By taking the “best-case scenario minus the worst-case scenario” wedefine the potential breadth of outcomes that could arise in the uncertain situation.
As an example, consider the number of claims per year in Location A of Table 2.1. Table 2.1 showsa low of seven claims per year to a high of fourteen claims per year, for a range of seven claims per year.For Location B of Table 2.2, we have a range in the number of claims from a low of five in one year to ahigh of fifteen claims per year, which gives us a range of ten claims per year. Using the range measureof risk, we would say that Location A is less risky than Location B in this situation, especially since theaverage claim is the same (10.2) in each case and we have more variability or surprise potential in Loca-tion B. As another example, if we go back to the distribution of possible values in Table 2.3, the ex-tremes vary from −$10.2 million to +$8 million, so the range is $18.2 million.
This risk measure leaves the picture incomplete because it cannot distinguish in riskiness betweentwo distributions of situations where the possible outcomes are unbounded, nor does it take into ac-count the frequency or probability of the extreme values. The lower value of –$10.2 million in Table 2.3only occurs 1 percent of the time, so it’s highly unlikely that you would get a value this small. It couldhave had an extreme value of –$100 million, which occurred with probability 0.0000000001, in whichcase the range would have reflected this possibility. Note that it’s extremely unlikely that you wouldever experience a one-in-a-trillion event. Usually you would not want your risk management activitiesor managerial actions to be dictated by a one-in-a-trillion event.
Deviation from a Central Value
A more sophisticated (and more traditional) way to measure risk would consider not just the most ex-treme values of the distribution but all values and their respective occurrence probabilities. One way todo this is to average the deviations of the possible values of the distribution from a central value, suchas the expected value E(V) or mean value discussed earlier. We develop this idea further below.
Variance and Standard Deviation
Continuing the example from Table 2.1 and Table 2.2, we now ask what differentiates the claims distri-bution of Location A and B, both of which possess the same expected frequency and severity. We havealready seen that the range is different. We now examine how the two locations differ in terms of theirdeviation from the common mean or expected value. Essentially, we want to examine how they differin terms of the amount of surprise we expect to see in observations form the distributions. One suchmeasure of deviation or surprise is by calculating the expected squared distance of each of the variousoutcomes from their mean value. This is a weighted average squared distance of each possible valuefrom the mean of all observations, where the weights are the probabilities of occurrence. Computation-ally, we do this by individually squaring the deviation of each possible outcome from the expectedvalue, multiplying this result by its respective probability or likelihood of occurring, and then summingup the resulting products.[7] This produces a measure known as the variance. Variance provides a verycommonly used measure of risk in financial contexts and is one of the bases of the notion of efficientportfolio selection in finance and the Capital Asset Pricing Model, which is used to explicitly show thetrade-off between risk and return of assets in a capital market.
We first illustrate the calculation of the variance by using the probability distribution shown inTable 2.2. We already calculated the expected value to be $1.008 million, so we may calculate the vari-ance to be (.01) × (–10.2 –1.008)2 + (.1) × (–.5 –1.008)2+ (.4) × (.1 – 1.008)2+ (.4) × (1 – 1.008)2 + (.09)× (8 – 1.008)2 = 7.445. Usually, variance is denoted with the Greek symbol sigma squared, σ2, or simplyV.
As another example, Table 2.4 and Table 2.5 show the calculation of the variance for the twosamples of claims given in locations A and B of Table 2.1 and Table 2.2, respectively. In this case, the
42 RISK MANAGEMENT FOR ENTERPRISES AND INDIVIDUALS
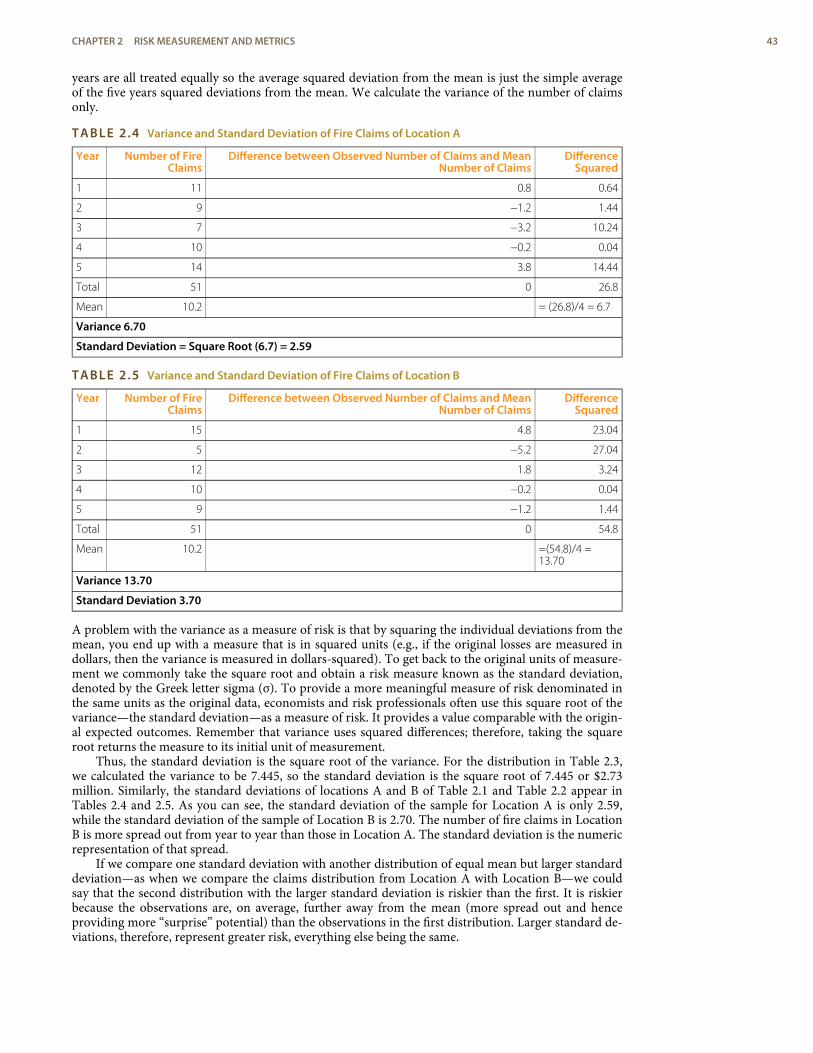
years are all treated equally so the average squared deviation from the mean is just the simple averageof the five years squared deviations from the mean. We calculate the variance of the number of claimsonly.
TABLE 2.4 Variance and Standard Deviation of Fire Claims of Location A
Year Number of FireClaims
Difference between Observed Number of Claims and MeanNumber of Claims
DifferenceSquared
1 11 0.8 0.64
2 9 −1.2 1.44
3 7 −3.2 10.24
4 10 −0.2 0.04
5 14 3.8 14.44
Total 51 0 26.8
Mean 10.2 = (26.8)/4 = 6.7
Variance 6.70
Standard Deviation = Square Root (6.7) = 2.59
TABLE 2.5 Variance and Standard Deviation of Fire Claims of Location B
Year Number of FireClaims
Difference between Observed Number of Claims and MeanNumber of Claims
DifferenceSquared
1 15 4.8 23.04
2 5 −5.2 27.04
3 12 1.8 3.24
4 10 −0.2 0.04
5 9 −1.2 1.44
Total 51 0 54.8
Mean 10.2 =(54.8)/4 =13.70
Variance 13.70
Standard Deviation 3.70
A problem with the variance as a measure of risk is that by squaring the individual deviations from themean, you end up with a measure that is in squared units (e.g., if the original losses are measured indollars, then the variance is measured in dollars-squared). To get back to the original units of measure-ment we commonly take the square root and obtain a risk measure known as the standard deviation,denoted by the Greek letter sigma (σ). To provide a more meaningful measure of risk denominated inthe same units as the original data, economists and risk professionals often use this square root of thevariance—the standard deviation—as a measure of risk. It provides a value comparable with the origin-al expected outcomes. Remember that variance uses squared differences; therefore, taking the squareroot returns the measure to its initial unit of measurement.
Thus, the standard deviation is the square root of the variance. For the distribution in Table 2.3,we calculated the variance to be 7.445, so the standard deviation is the square root of 7.445 or $2.73million. Similarly, the standard deviations of locations A and B of Table 2.1 and Table 2.2 appear inTables 2.4 and 2.5. As you can see, the standard deviation of the sample for Location A is only 2.59,while the standard deviation of the sample of Location B is 2.70. The number of fire claims in LocationB is more spread out from year to year than those in Location A. The standard deviation is the numericrepresentation of that spread.
If we compare one standard deviation with another distribution of equal mean but larger standarddeviation—as when we compare the claims distribution from Location A with Location B—we couldsay that the second distribution with the larger standard deviation is riskier than the first. It is riskierbecause the observations are, on average, further away from the mean (more spread out and henceproviding more “surprise” potential) than the observations in the first distribution. Larger standard de-viations, therefore, represent greater risk, everything else being the same.
CHAPTER 2 RISK MEASUREMENT AND METRICS 43
coefficient of variation
The standard deviation of adistribution divided by itsmean.
semivariance
The average square deviationof values in a distribution.
Value at Risk (VaR)
The worst-case scenariodollar value loss (up to aspecified probability level)that could occur for acompany exposed to aspecific set of risks.
Of course, distributions seldom have the same mean. What if we are comparing two distributionswith different means? In this case, one approach would be to consider the coefficient of variation,which is the standard deviation of a distribution divided by its mean. It essentially trades off risk (asmeasured by the standard deviation) with the return (as measured by the mean or expected value). Thecoefficient of variation can be used to give us a relative value of risk when the means of the distribu-tions are not equal.
The Semivariance
The above measures of risk gave the same attention or importance to both positive and negative devi-ations from the mean or expected value. Some people prefer to measure risk by the surprises in one dir-ection only. Usually only negative deviations below the expected value are considered risky and in needof control or management. For example, a decision maker might be especially troubled by deviationsbelow the expected level of profit and would welcome deviations above the expected value. For thispurpose a “semivariance” could serve as a more appropriate measure of risk than the variance, whichtreats deviations in both directions the same. The semivariance is the average square deviation. Nowyou sum only the deviations below the expected value. If the profit-loss distribution is symmetric, theuse of the semivariance turns out to result in the exact same ranking of uncertain outcomes with re-spect to risk as the use of the variance. If the distribution is not symmetric, however, then these meas-ures may differ and the decisions made as to which distribution of uncertain outcomes is riskier willdiffer, and the decisions made as to how to manage risk as measured by these two measures may bedifferent. As most financial and pure loss distributions are asymmetric, professionals often prefer thesemi-variance in financial analysis as a measure of risk, even though the variance (and standard devi-ation) are also commonly used.
3.2 Value at Risk (VaR) and Maximum Probable Annual Loss (MPAL)How do banks and other financial institutions manage the systemic or fundamental market risks theyface? VaR modeling has become the standard risk measurement tool in the banking industry to assessmarket risk exposure. After the banking industry adopted VaR, many other financial firms adopted itas well. This is in part because of the acceptance of this technique by regulators, such as conditionswritten in the Basel II agreements on bank regulation.[8] Further, financial institutions need to knowhow much money they need to reserve to be able to withstand a shock or loss of capital and still remainsolvent. To do so, they need a risk measure with a specified high probability. Intuitively, VaR is definedas the worst-case scenario dollar value loss (up to a specified probability level) that could occur for acompany exposed to a specific set of risks (interest rates, equity prices, exchange rates, and commodityprices). This is the amount needed to have in reserve in order to stave off insolvency with the specifiedlevel of probability.
In reality, for many risk exposures the absolute “worst-case” loss that could be experienced is con-ceivably unbounded. It’s conceivable that you could lose a very huge amount but it may be highly un-likely to lose this much. Thus, instead of picking the largest possible loss to prepare against, the firm se-lects a probability level they can live with (usually, they are interested in having their financial risk ex-posure covered something like 95 percent or 99 percent of the time), and they ask, “What is the worstcase that can happen up to being covered 95 percent or 99 percent of the time?” For a given level ofconfidence (in this case 95 percent or 99 percent) and over a specified time horizon, VaR can measurerisks in any single security (either a specific investment represented in their investment securities orloan from a specific customer) or an entire portfolio as long as we have sufficient historical data. VaRprovides an answer to the question “What is the worst loss that could occur and that I should preparefor?”
In practice, professionals examine a historical record of returns for the asset or portfolio underconsideration and construct a probability distribution of returns. If you select a 95 percent VaR, thenyou pick the lowest 5 percent of the distribution, and when multiplied by the asset or portfolio value,you obtain the 95 percent VaR. If a 99 percent VaR is desired, then the lowest 1 percent of the returndistribution is determined and this is multiplied by the asset or portfolio value to obtain the 99 percentVaR.
44 RISK MANAGEMENT FOR ENTERPRISES AND INDIVIDUALS
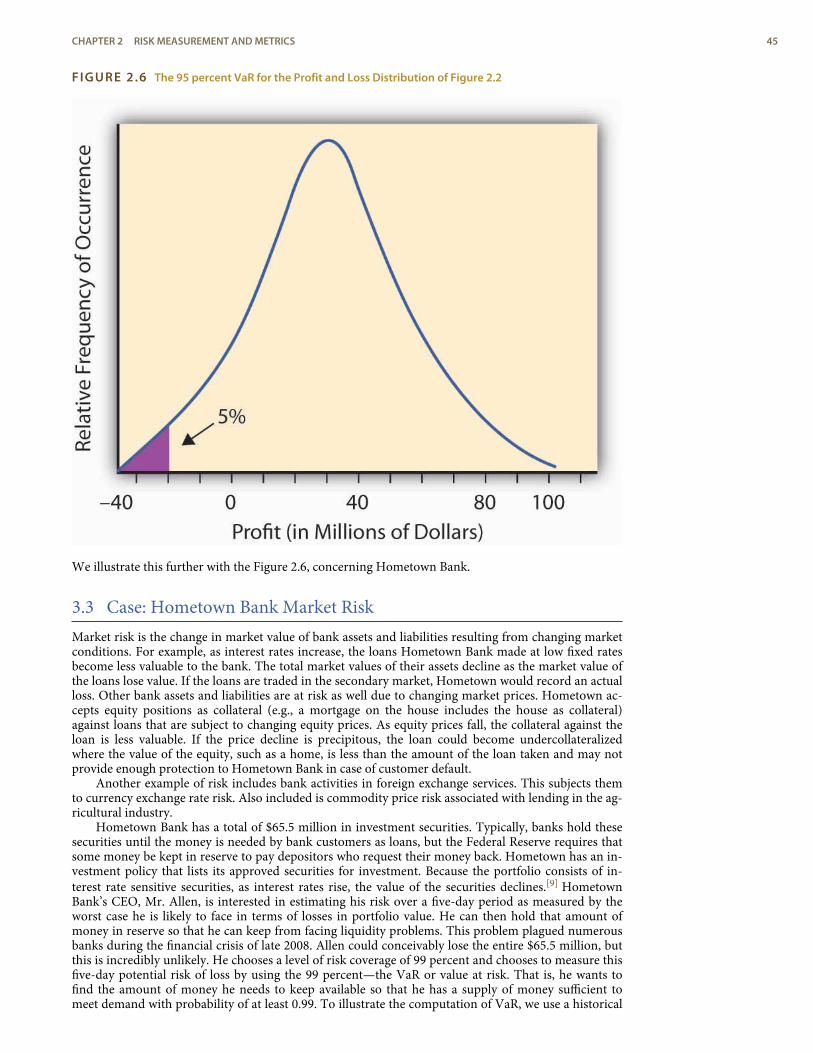
FIGURE 2.6 The 95 percent VaR for the Profit and Loss Distribution of Figure 2.2
We illustrate this further with the Figure 2.6, concerning Hometown Bank.
3.3 Case: Hometown Bank Market RiskMarket risk is the change in market value of bank assets and liabilities resulting from changing marketconditions. For example, as interest rates increase, the loans Hometown Bank made at low fixed ratesbecome less valuable to the bank. The total market values of their assets decline as the market value ofthe loans lose value. If the loans are traded in the secondary market, Hometown would record an actualloss. Other bank assets and liabilities are at risk as well due to changing market prices. Hometown ac-cepts equity positions as collateral (e.g., a mortgage on the house includes the house as collateral)against loans that are subject to changing equity prices. As equity prices fall, the collateral against theloan is less valuable. If the price decline is precipitous, the loan could become undercollateralizedwhere the value of the equity, such as a home, is less than the amount of the loan taken and may notprovide enough protection to Hometown Bank in case of customer default.
Another example of risk includes bank activities in foreign exchange services. This subjects themto currency exchange rate risk. Also included is commodity price risk associated with lending in the ag-ricultural industry.
Hometown Bank has a total of $65.5 million in investment securities. Typically, banks hold thesesecurities until the money is needed by bank customers as loans, but the Federal Reserve requires thatsome money be kept in reserve to pay depositors who request their money back. Hometown has an in-vestment policy that lists its approved securities for investment. Because the portfolio consists of in-terest rate sensitive securities, as interest rates rise, the value of the securities declines.[9] HometownBank’s CEO, Mr. Allen, is interested in estimating his risk over a five-day period as measured by theworst case he is likely to face in terms of losses in portfolio value. He can then hold that amount ofmoney in reserve so that he can keep from facing liquidity problems. This problem plagued numerousbanks during the financial crisis of late 2008. Allen could conceivably lose the entire $65.5 million, butthis is incredibly unlikely. He chooses a level of risk coverage of 99 percent and chooses to measure thisfive-day potential risk of loss by using the 99 percent—the VaR or value at risk. That is, he wants tofind the amount of money he needs to keep available so that he has a supply of money sufficient tomeet demand with probability of at least 0.99. To illustrate the computation of VaR, we use a historical
CHAPTER 2 RISK MEASUREMENT AND METRICS 45
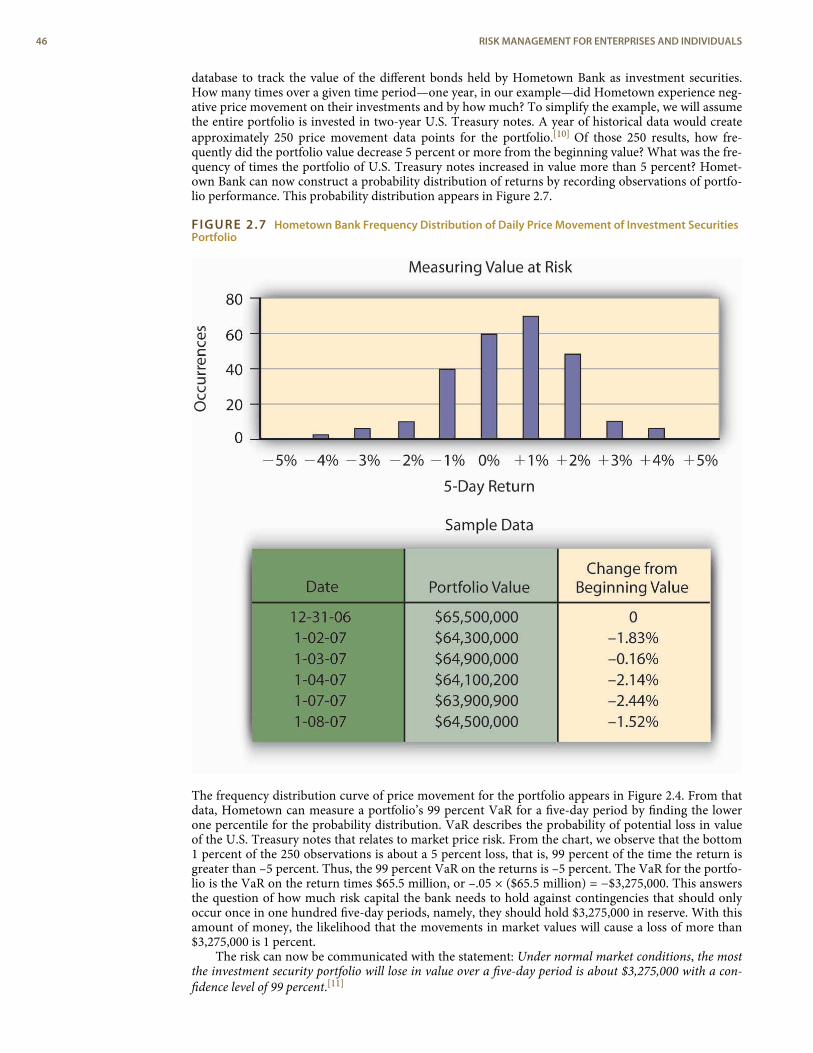
database to track the value of the different bonds held by Hometown Bank as investment securities.How many times over a given time period—one year, in our example—did Hometown experience neg-ative price movement on their investments and by how much? To simplify the example, we will assumethe entire portfolio is invested in two-year U.S. Treasury notes. A year of historical data would createapproximately 250 price movement data points for the portfolio.[10] Of those 250 results, how fre-quently did the portfolio value decrease 5 percent or more from the beginning value? What was the fre-quency of times the portfolio of U.S. Treasury notes increased in value more than 5 percent? Homet-own Bank can now construct a probability distribution of returns by recording observations of portfo-lio performance. This probability distribution appears in Figure 2.7.
FIGURE 2.7 Hometown Bank Frequency Distribution of Daily Price Movement of Investment SecuritiesPortfolio
The frequency distribution curve of price movement for the portfolio appears in Figure 2.4. From thatdata, Hometown can measure a portfolio’s 99 percent VaR for a five-day period by finding the lowerone percentile for the probability distribution. VaR describes the probability of potential loss in valueof the U.S. Treasury notes that relates to market price risk. From the chart, we observe that the bottom1 percent of the 250 observations is about a 5 percent loss, that is, 99 percent of the time the return isgreater than –5 percent. Thus, the 99 percent VaR on the returns is –5 percent. The VaR for the portfo-lio is the VaR on the return times $65.5 million, or –.05 × ($65.5 million) = −$3,275,000. This answersthe question of how much risk capital the bank needs to hold against contingencies that should onlyoccur once in one hundred five-day periods, namely, they should hold $3,275,000 in reserve. With thisamount of money, the likelihood that the movements in market values will cause a loss of more than$3,275,000 is 1 percent.
The risk can now be communicated with the statement: Under normal market conditions, the mostthe investment security portfolio will lose in value over a five-day period is about $3,275,000 with a con-fidence level of 99 percent.[11]
46 RISK MANAGEMENT FOR ENTERPRISES AND INDIVIDUALS
risk premium
The premium over and abovethe actuarially fair premiumthat a risk-averse person iswilling to pay to get rid ofrisk.
In the context of pure risk exposures, the equivalent notion to VaR is the Maximal Probable Annu-al Loss (MPAL). As with the VaR measure, it looks at a probability distribution, in this case of lossesover a year period and then picks the selected lower percentile value as the MPAL. For example, if theloss distribution is given by Figure 2.3, and the 95 percent level of confidence is selected, then theMPAL is the same as the 95 percent VaR value. In insurance contexts one often encounters the termMPAL, whereas in finance one often encounters the term VaR. Their calculation is the same and theirinterpretation as a measure of risk is the same.
We also note that debate rages about perceived weaknesses in using VaR as a risk measure in fin-ance. “In short, VaR models do not provide an accurate measure of the losses that occur in extremeevents. You simply cannot depict the full texture and range of your market risks with VaR alone.”[12] Inaddition, the VaR examines the size of loss that would occur only 1 percent of the time, but it does notspecify the size of the shortfall that the company would be expected to have to make up by a distress li-quidation of assets should such a large loss occur. Another measure called the expected shortfall is usedfor this. The interested reader is referred to Brockett and Ai[13] for this calculation.
3.4 CAPM’s Beta Measure of Nondiversifiable Portfolio RiskSome risk exposures affect many assets of a firm at the same time. In finance, for example, movementsin the market as a whole or in the entire economy can affect the value of many individual stocks (andfirms) simultaneously. We saw this very dramatically illustrated in the financial crisis in 2008–2009where the entire stock market went down and dragged many stocks (and firms) down with it, somemore than others. In Chapter 1 we referred to this type of risk as systematic, fundamental, or nondiver-sifiable risk. For a firm (or individual) having a large, well-diversified portfolio of assets, the total negat-ive financial impact of any single idiosyncratic risk on the value of the portfolio is minimal since it con-stitutes only a small fraction of their wealth.
Therefore, the asset-specific idiosyncratic risk is generally ignored when making decisions con-cerning the additional amount of risk involved when acquiring an additional asset to be added to analready well-diversified portfolio of assets. The question is how to disentangle the systematic from thenonsystematic risk embedded in any asset. Finance professors Jack Treynor, William Sharpe, JohnLintner, and Jan Mossin worked independently and developed a model called the Capital Asset PricingModel (CAPM). From this model we can get a measure of how the return on an asset systematicallyvaries with the variations in the market, and consequently we can get a measure of systematic risk. Theidea is similar to the old adage that a rising tide lifts all ships. In this case a rising (or falling) market oreconomy rises (or lowers) all assets to a greater or lesser degree depending on their covariation with themarket. This covariation with the market is fundamental to obtaining a measure of systematic risk. Wedevelop it now.
Essentially, the CAPM model assumes that investors in assets expect to be compensated for boththe time value of money and the systematic or nondiversifiable risk they bear. In this regard, the returnon an asset A, RA, is assumed to be equal to the return on an absolutely safe or risk-free investment, rf(the time value of money part) and a risk premium, which measures the compensation for the sys-tematic risk they are bearing. To measure the amount of this systematic risk, we first look at the correl-ation between the returns on the asset and the returns on a market portfolio of all assets. The assump-tion is that the market portfolio changes with changes in the economy as a whole, and so systematicchanges in the economy are reflected by changes in the level of the market portfolio. The variation ofthe asset returns with respect to the market returns is assumed to be linear and so the general frame-work is expressed as
RA= rf + βA*(Rm - rf ) + ε,
where ε denotes a random term that is unrelated to the market return. Thus the term βA × (Rm − rf )represents a systematic return and ε represents a firm-specific or idiosyncratic nonsystematic compon-ent of return.
Notice that upon taking variances, we have σ2A = .β2A × β2m, + σ2ε, so the first term is called thesystematic variance and the second term is the idiosyncratic or firm-specific variance.
The idea behind the CAPM is that investors would be compensated for the systematic risk and notthe idiosyncratic risk, since the idiosyncratic risk should be diversifiable by the investors who hold alarge diversified portfolio of assets, while the systematic or market risk affects them all. In terms of ex-pected values, we often write the equation as
E[RA]= rf+βA*(E[Rm]-rf),
CHAPTER 2 RISK MEASUREMENT AND METRICS 47
which is the so-called CAPM model. In this regard the expected rate of return on an asset E[RA], is therisk-free investment, rf, plus a market risk premium equal to βA × (E[Rm] − Rf). The coefficient βA iscalled the market risk or systematic risk of asset A.
By running a linear regression of the returns experienced on asset A with those returns experi-enced on a market portfolio (such as the Dow Jones Industrial stock portfolio) and the risk-free assetreturn (such as the U.S. T-Bill rate of return), one can find the risk measure βA. A regression is a statist-ical technique that creates a trend based on the data. An actual linear regression to compute future fre-quency and severity based on a trend is used in Chapter 3 for risk management analysis. Statisticalbooks show[14] that βA. = COV(RA, Rm)/β2m where COV(RA,Rm) is the covariance of the return on theasset with the return on the market and is defined by
COV(RA, Rm) = E[{RA,−E(RA)} × { Rm,-E(Rm)}],
that is, the average value of the product of the deviation of the asset return from its expected value andthe market returns from its expected value. In terms of the correlation coefficient ρAm between the re-turn on the asset and the market, we have βA = ρAm × (βA/βm), so we can also think of beta as scalingthe asset volatility by the market volatility and the correlation of the asset with the market.
The β (beta) term in the above equations attempts to quantify the risk associated with market fluc-tuations or swings in the market. A beta of 1 means that the asset return is expected to move in con-junction with the market, that is, a 5 percent move (measured in terms of standard deviation units ofthe market) in the market will result in a 5 percent move in the asset (measured in terms of standarddeviation units of the asset). A beta less than one indicates that the asset is less volatile than the marketin that when the market goes up (or down) by 5 percent the asset will go up (or down) by less than 5percent. A beta greater than one means that the asset price is expected to move more rapidly than themarket so if the market goes up (or down) by 5 percent then the asset will go up (or down) by morethan 5 percent. A beta of zero indicates that the return on the asset does not correlate with the returnson the market.
K E Y T A K E A W A Y S
< Risk measures quantify the amount of surprise potential contained in a probability distribution.
< Measures such as the range and Value at Risk (VaR) and Maximal Probable Annual Loss (MPAL) focus onthe extremes of the distributions and are appropriate measures of risk when interest is focused onsolvency or making sure that enough capital is set aside to handle any realized extreme losses.
< Measures such as the variance, standard deviation, and semivariance are useful when looking at averagedeviations from what is expected for the purpose of planning for expected deviations from expectedresults.
< The market risk measure from the Capital Asset Pricing Model is useful when assessing systematic financialrisk or the additional risk involved in adding an asset to an already existing diversified portfolio.
48 RISK MANAGEMENT FOR ENTERPRISES AND INDIVIDUALS
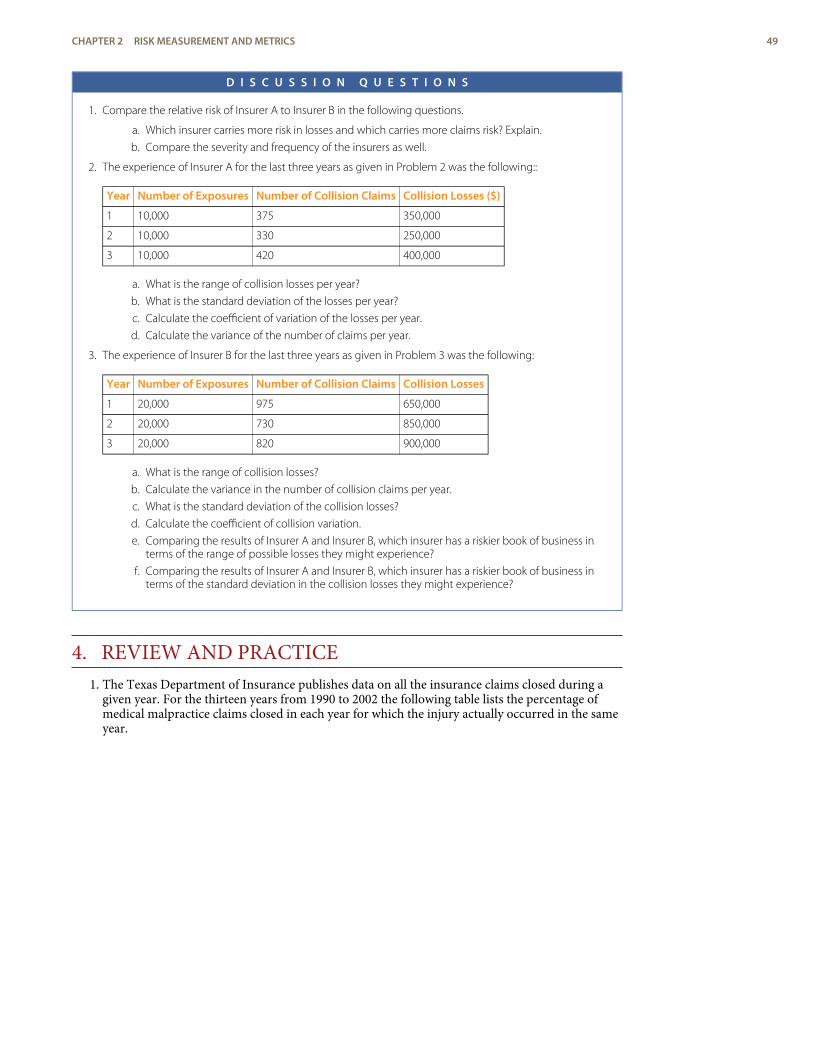
D I S C U S S I O N Q U E S T I O N S
1. Compare the relative risk of Insurer A to Insurer B in the following questions.
a. Which insurer carries more risk in losses and which carries more claims risk? Explain.
b. Compare the severity and frequency of the insurers as well.
2. The experience of Insurer A for the last three years as given in Problem 2 was the following::
Year Number of Exposures Number of Collision Claims Collision Losses ($)
1 10,000 375 350,000
2 10,000 330 250,000
3 10,000 420 400,000
a. What is the range of collision losses per year?
b. What is the standard deviation of the losses per year?
c. Calculate the coefficient of variation of the losses per year.
d. Calculate the variance of the number of claims per year.
3. The experience of Insurer B for the last three years as given in Problem 3 was the following:
Year Number of Exposures Number of Collision Claims Collision Losses
1 20,000 975 650,000
2 20,000 730 850,000
3 20,000 820 900,000
a. What is the range of collision losses?
b. Calculate the variance in the number of collision claims per year.
c. What is the standard deviation of the collision losses?
d. Calculate the coefficient of collision variation.
e. Comparing the results of Insurer A and Insurer B, which insurer has a riskier book of business interms of the range of possible losses they might experience?
f. Comparing the results of Insurer A and Insurer B, which insurer has a riskier book of business interms of the standard deviation in the collision losses they might experience?
4. REVIEW AND PRACTICE1. The Texas Department of Insurance publishes data on all the insurance claims closed during a
given year. For the thirteen years from 1990 to 2002 the following table lists the percentage ofmedical malpractice claims closed in each year for which the injury actually occurred in the sameyear.
CHAPTER 2 RISK MEASUREMENT AND METRICS 49
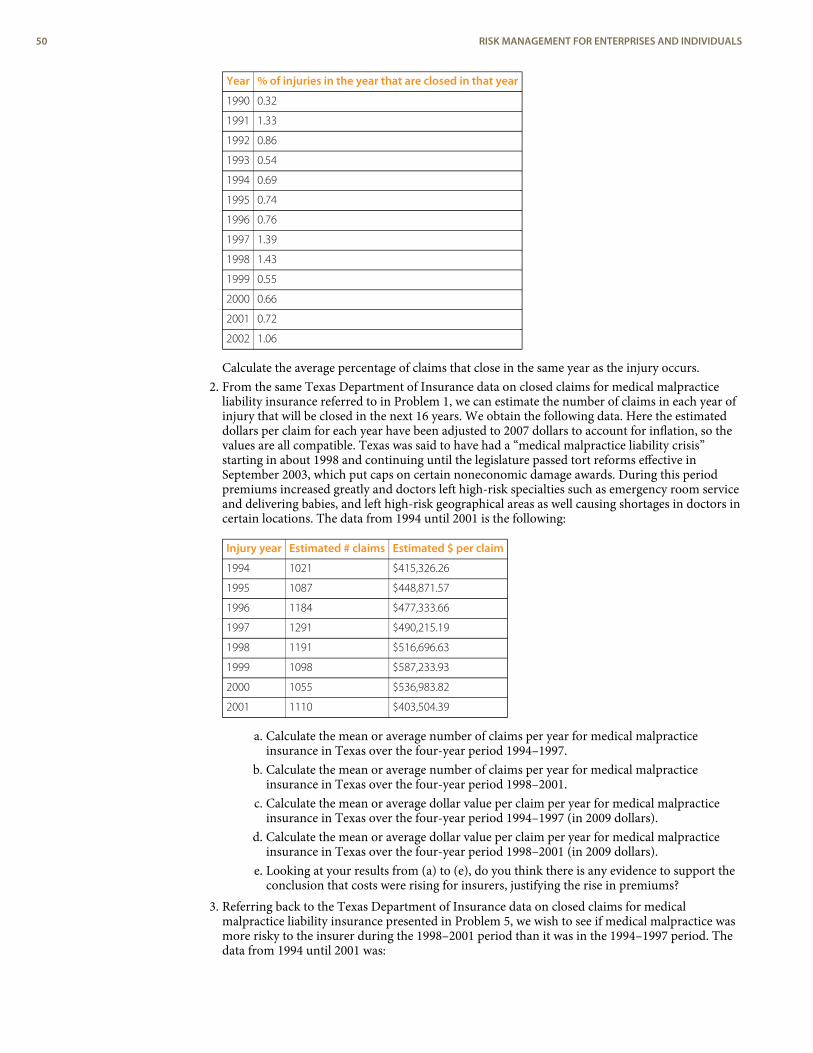
Year % of injuries in the year that are closed in that year
1990 0.32
1991 1.33
1992 0.86
1993 0.54
1994 0.69
1995 0.74
1996 0.76
1997 1.39
1998 1.43
1999 0.55
2000 0.66
2001 0.72
2002 1.06
Calculate the average percentage of claims that close in the same year as the injury occurs.2. From the same Texas Department of Insurance data on closed claims for medical malpractice
liability insurance referred to in Problem 1, we can estimate the number of claims in each year ofinjury that will be closed in the next 16 years. We obtain the following data. Here the estimateddollars per claim for each year have been adjusted to 2007 dollars to account for inflation, so thevalues are all compatible. Texas was said to have had a “medical malpractice liability crisis”starting in about 1998 and continuing until the legislature passed tort reforms effective inSeptember 2003, which put caps on certain noneconomic damage awards. During this periodpremiums increased greatly and doctors left high-risk specialties such as emergency room serviceand delivering babies, and left high-risk geographical areas as well causing shortages in doctors incertain locations. The data from 1994 until 2001 is the following:
Injury year Estimated # claims Estimated $ per claim
1994 1021 $415,326.26
1995 1087 $448,871.57
1996 1184 $477,333.66
1997 1291 $490,215.19
1998 1191 $516,696.63
1999 1098 $587,233.93
2000 1055 $536,983.82
2001 1110 $403,504.39
a. Calculate the mean or average number of claims per year for medical malpracticeinsurance in Texas over the four-year period 1994–1997.
b. Calculate the mean or average number of claims per year for medical malpracticeinsurance in Texas over the four-year period 1998–2001.
c. Calculate the mean or average dollar value per claim per year for medical malpracticeinsurance in Texas over the four-year period 1994–1997 (in 2009 dollars).
d. Calculate the mean or average dollar value per claim per year for medical malpracticeinsurance in Texas over the four-year period 1998–2001 (in 2009 dollars).
e. Looking at your results from (a) to (e), do you think there is any evidence to support theconclusion that costs were rising for insurers, justifying the rise in premiums?
3. Referring back to the Texas Department of Insurance data on closed claims for medicalmalpractice liability insurance presented in Problem 5, we wish to see if medical malpractice wasmore risky to the insurer during the 1998–2001 period than it was in the 1994–1997 period. Thedata from 1994 until 2001 was:
50 RISK MANAGEMENT FOR ENTERPRISES AND INDIVIDUALS
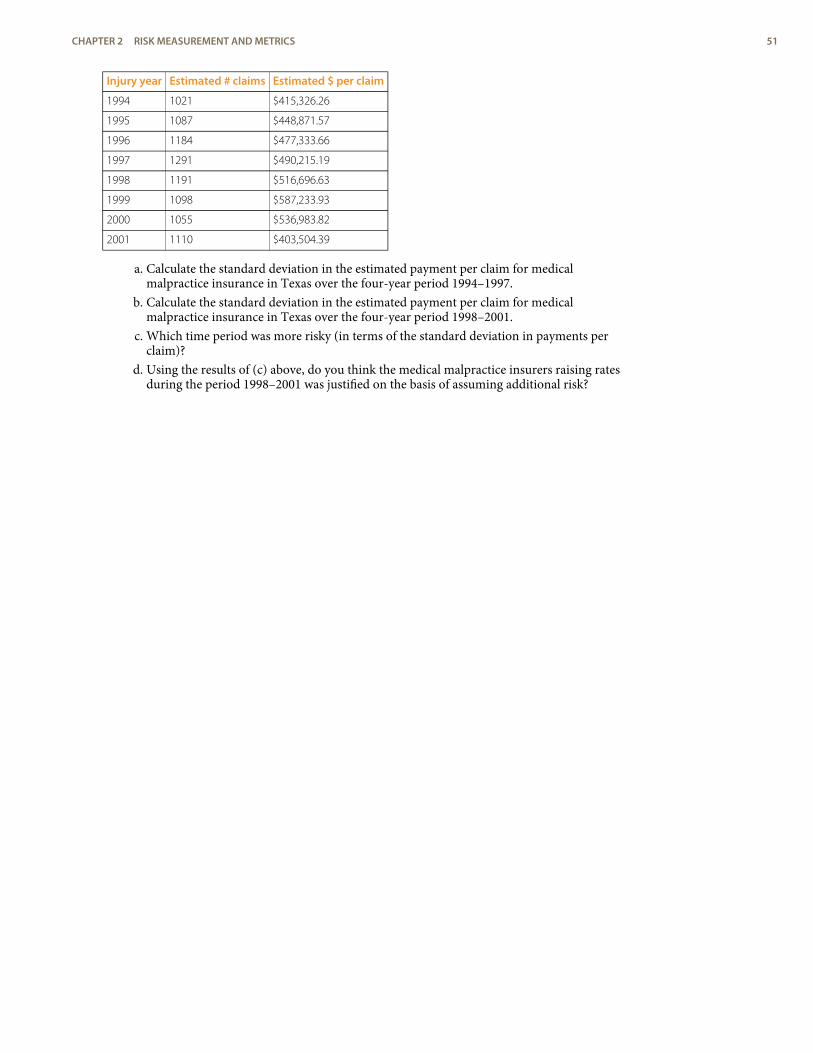
Injury year Estimated # claims Estimated $ per claim
1994 1021 $415,326.26
1995 1087 $448,871.57
1996 1184 $477,333.66
1997 1291 $490,215.19
1998 1191 $516,696.63
1999 1098 $587,233.93
2000 1055 $536,983.82
2001 1110 $403,504.39
a. Calculate the standard deviation in the estimated payment per claim for medicalmalpractice insurance in Texas over the four-year period 1994–1997.
b. Calculate the standard deviation in the estimated payment per claim for medicalmalpractice insurance in Texas over the four-year period 1998–2001.
c. Which time period was more risky (in terms of the standard deviation in payments perclaim)?
d. Using the results of (c) above, do you think the medical malpractice insurers raising ratesduring the period 1998–2001 was justified on the basis of assuming additional risk?
CHAPTER 2 RISK MEASUREMENT AND METRICS 51
1.
2.
3.
4.
5.
6.
7.
8.
9.
10.
11.
12.13.
14.
ENDNOTES
This is particularly true in firms like insurance companies and banks where the busi-ness opportunity they pursue is mainly based on taking calculated and judgment-based risks.
The government of William III of England, for example, offered annuities of 14 per-cent regardless of whether the annuitant was 30 or 70 percent; (Karl Pearson, The His-tory of Statistics In the 17th and 18th Centuries against the Changing Background of Intel-lectual, Scientific and Religious Thought (London: Charles Griffin & Co., 1978), 134.
See Patrick Brockett and Arnold Levine Brockett, Statistics, Probability and Their Applic-ations (W. B. Saunders Publishing Co., 1984), 62.
Nor was the logic of the notion of equally likely outcomes readily understood at thetime. For example, the famous mathematician D’Alembert made the following mis-take when calculating the probability of a head appearing in two flips of a coin (KarlPearson, The History of Statistics in the 17th and 18th Centuries against the ChangingBackground of Intellectual, Scientific and Religious Thought [London: Charles Griffin &Co., 1978], 552). D’Alembert said the head could come up on the first flip, whichwould settle that matter, or a tail could come up on the first flip followed by either ahead or a tail on the second flip. There are three outcomes, two of which have ahead, and so he claimed the likelihood of getting a head in two flips is 2/3. Evidently,he did not take the time to actually flip coins to see that the probability was 3/4,since the possible equally likely outcomes are actually (H,T), (H,H), (T,H), (T,T) withthree pairs of flips resulting in a head. The error is that the outcomes stated inD’Alembert’s solution are not equally likely using his outcomes H, (T,H), (T,T), so hisdenominator is wrong. The moral of this story is that postulated theoretical modelsshould always be tested against empirical data whenever possible to uncover anypossible errors.
In some ways it is a shame that the term “expected value” has been used to describethis concept. A better term is “long run average value” or “mean value” since this par-ticular value is really not to be expected in any real sense and may not even be apossibility to occur (e.g., the value calculated from Table 2.3 is 1.008, which is noteven a possibility). Nevertheless, we are stuck with this terminology, and it does con-vey some conception of what we mean as long as we interpreted it as being the
number expected as an average value in a long series of repetitions of the scenariobeing evaluated.
Other commonly used measures of profitability in an uncertain opportunity, otherthan the mean or expected value, are the mode (the most likely value) and the medi-an (the number with half the numbers above it and half the numbers below it—the50 percent mark).
Calculating the average signed deviation from the mean or expected value since is auseless exercise since the result will always be zero. Taking the square of each devi-ation for the mean or expected value gets rid of the algebraic sign and makes thesum positive and meaningful. One might alternatively take the absolute value of thedeviations from the mean to obtain another measure called the absolute deviation,but this is usually not done because it results in a mathematically inconvenient for-mulation. We shall stick to the squared deviation and its variants here.
Basel Committee on Banking Supervision (BCBS), International Convergence of Cap-ital Measurement and Capital Standards: A Revised Framework (Basel, Switzerland,2004).
Valuation of bonds is covered in general finance text. Bond value = present value ofcoupons + present value of face value of bond.
The number 250 comes from a rough estimate of the number of days securities canbe traded in the open market during any given year. Fifty-two weeks at five days perweek yields 260 weekdays, and there are roughly ten holidays throughout the yearfor which the market is closed.
Philippe Jorion, Value at Risk: The New Benchmark for Managing Financial Risk, 2nd ed.(McGraw Hill, 2001), ch. 1. Chapter 1.
Gleason, chapter 12.
Patrick L. Brockett and Jing Ai, “Enterprise Risk Management (ERM),” in Encyclopedia ofQuantitative Risk Assessment and Analysis, ed. E. Melnick and B. Everitt (Chichester, UK:John Wiley & Sons Ltd., 2008), 559–66.
See Patrick Brockett and Arnold Levine Brockett, Statistics, Probability and Their Applic-ations (W. B. Saunders Publishing Co., 1984).
52 RISK MANAGEMENT FOR ENTERPRISES AND INDIVIDUALS
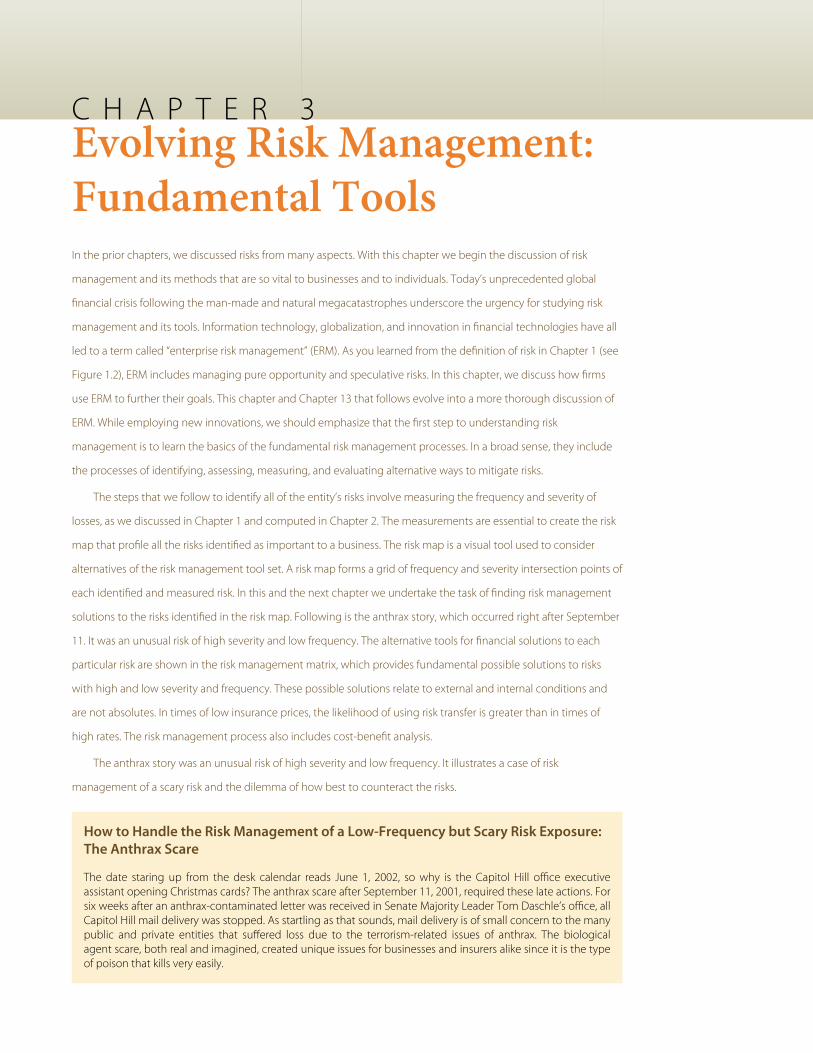
C H A P T E R 3Evolving Risk Management:Fundamental ToolsIn the prior chapters, we discussed risks from many aspects. With this chapter we begin the discussion of risk
management and its methods that are so vital to businesses and to individuals. Today’s unprecedented global
financial crisis following the man-made and natural megacatastrophes underscore the urgency for studying risk
management and its tools. Information technology, globalization, and innovation in financial technologies have all
led to a term called “enterprise risk management” (ERM). As you learned from the definition of risk in Chapter 1 (see
Figure 1.2), ERM includes managing pure opportunity and speculative risks. In this chapter, we discuss how firms
use ERM to further their goals. This chapter and Chapter 13 that follows evolve into a more thorough discussion of
ERM. While employing new innovations, we should emphasize that the first step to understanding risk
management is to learn the basics of the fundamental risk management processes. In a broad sense, they include
the processes of identifying, assessing, measuring, and evaluating alternative ways to mitigate risks.
The steps that we follow to identify all of the entity’s risks involve measuring the frequency and severity of
losses, as we discussed in Chapter 1 and computed in Chapter 2. The measurements are essential to create the risk
map that profile all the risks identified as important to a business. The risk map is a visual tool used to consider
alternatives of the risk management tool set. A risk map forms a grid of frequency and severity intersection points of
each identified and measured risk. In this and the next chapter we undertake the task of finding risk management
solutions to the risks identified in the risk map. Following is the anthrax story, which occurred right after September
11. It was an unusual risk of high severity and low frequency. The alternative tools for financial solutions to each
particular risk are shown in the risk management matrix, which provides fundamental possible solutions to risks
with high and low severity and frequency. These possible solutions relate to external and internal conditions and
are not absolutes. In times of low insurance prices, the likelihood of using risk transfer is greater than in times of
high rates. The risk management process also includes cost-benefit analysis.
The anthrax story was an unusual risk of high severity and low frequency. It illustrates a case of risk
management of a scary risk and the dilemma of how best to counteract the risks.
How to Handle the Risk Management of a Low-Frequency but Scary Risk Exposure:The Anthrax Scare
The date staring up from the desk calendar reads June 1, 2002, so why is the Capitol Hill office executiveassistant opening Christmas cards? The anthrax scare after September 11, 2001, required these late actions. Forsix weeks after an anthrax-contaminated letter was received in Senate Majority Leader Tom Daschle’s office, allCapitol Hill mail delivery was stopped. As startling as that sounds, mail delivery is of small concern to the manypublic and private entities that suffered loss due to the terrorism-related issues of anthrax. The biologicalagent scare, both real and imagined, created unique issues for businesses and insurers alike since it is the typeof poison that kills very easily.
Who is responsible for the clean-up costs related to bioterrorism? Who is liable for the exposure tohumans within the contaminated facility? Who covers the cost of a shutdown of a business fordecontamination? What is a risk manager to do?
Senator Charles Grassley (R-Iowa), member of the Senate Finance Committee at the time, estimated thatthe clean-up project cost for the Hart Senate Office Building would exceed $23 million. Manhattan Eye, Ear,and Throat Hospital closed its doors in late October 2001 after a supply-room worker contracted and later diedfrom pulmonary anthrax. The hospital—a small, thirty-bed facility—reopened November 6, 2001, announcingthat the anthrax scare closure had cost the facility an estimated $700,000 in revenue.
These examples illustrate the necessity of holistic risk management and the effective use of risk mappingto identify any possible risk, even those that may remotely affect the firm. Even if their companies aren’t beingdirectly targeted, risk managers must incorporate disaster management plans to deal with indirect atrocitiesthat slow or abort the firms’ operations. For example, an import/export business must protect againstextended halts in overseas commercial air traffic. A mail-order-catalog retailer must protect against long-termmail delays. Evacuation of a workplace for employees due to mold infestation or biochemical exposure mustnow be added to disaster recovery plans that are part of loss-control programs. Risk managers takeresponsibility for such programs.
After a temporary closure, reopened facilities still give cause for concern. Staffers at the Hart Senate OfficeBuilding got the green light to return to work on January 22, 2002, after the anthrax remediation process wascompleted. Immediately, staffers began reporting illnesses. By March, 255 of the building’s employees hadcomplained of symptoms that included headaches, rashes, and eye or throat irritation, possibly from thechemicals used to kill the anthrax. Was the decision to reopen the facility too hasty?
Sources: “U.S. Lawmakers Complain About Old Mail After Anthrax Scare.” Dow Jones Newswires, 8 May 2002; David Pilla, “Anthrax Scare Raises NewLiability Issues for Insurers,” A.M. Best Newswire, October 16, 2001; Sheila R. Cherry, “Health Questions Linger at Hart,” Insight on the News, April 15, 2002,p.16; Cinda Becker, “N.Y. Hospital Reopens; Anthrax Scare Costs Facility $700,000,” Modern Healthcare, 12 November 2001, p. 8; Sheila R. Cherry, “HealthQuestions Linger at Hart,” Insight on the News, April 15, 2002, p. 16(2).
Today’s risk managers explore all risks together and consider correlations between risks and their management.
Some risks interact positively with other risks, and the occurrence of one can trigger the other—flood can cause
fires or an earthquake that destroys a supplier can interrupt business in another side of the country. As we
discussed in Chapter 1, economic systemic risks can impact many facets of the corporations, as is the current state
of the world during the financial crisis of 2008.
In our technological and information age, every person involved in finding solutions to lower the adverse
impact of risks uses risk management information systems (RMIS), which are data bases that provide information
with which to compute the frequency and severity, explore difficult-to-identify risks, and provide forecasts and
cost-benefits analyses.
This chapter therefore includes the following:
1. Links
2. The risk management function
3. Projected frequency and severity, cost-benefit analysis, and capital budgeting
4. Risk management alternatives: the risk management matrix
5. Comparing to current risk-handling methods
1. LINKSNow that we understand the notion and measurement of risks from Chapter 1 and Chapter 2, and theattitudes toward risk in Chapter 4, we are ready to begin learning about the actual process of risk man-agement. Within the goals of the firm discussed in Chapter 1, we now delve into how risk managersconduct their jobs and what they need to know about the marketplace to succeed in reducing and
54 RISK MANAGEMENT FOR ENTERPRISES AND INDIVIDUALS
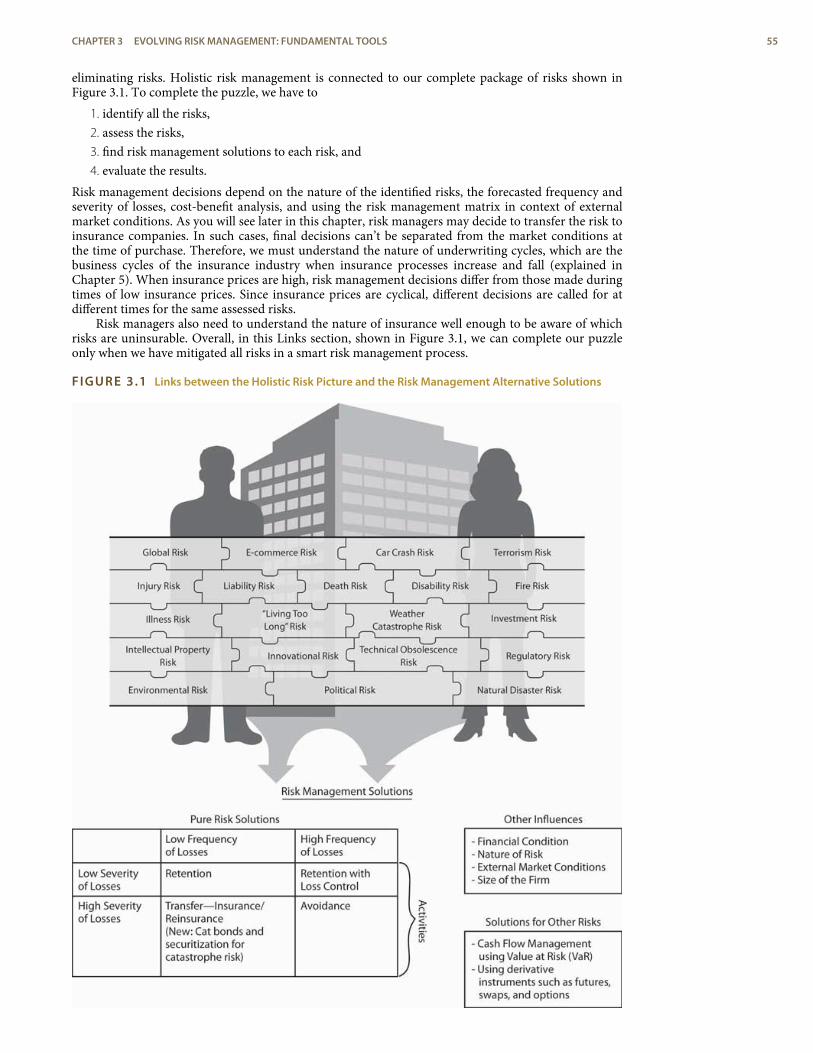
eliminating risks. Holistic risk management is connected to our complete package of risks shown inFigure 3.1. To complete the puzzle, we have to
1. identify all the risks,2. assess the risks,3. find risk management solutions to each risk, and4. evaluate the results.
Risk management decisions depend on the nature of the identified risks, the forecasted frequency andseverity of losses, cost-benefit analysis, and using the risk management matrix in context of externalmarket conditions. As you will see later in this chapter, risk managers may decide to transfer the risk toinsurance companies. In such cases, final decisions can’t be separated from the market conditions atthe time of purchase. Therefore, we must understand the nature of underwriting cycles, which are thebusiness cycles of the insurance industry when insurance processes increase and fall (explained inChapter 5). When insurance prices are high, risk management decisions differ from those made duringtimes of low insurance prices. Since insurance prices are cyclical, different decisions are called for atdifferent times for the same assessed risks.
Risk managers also need to understand the nature of insurance well enough to be aware of whichrisks are uninsurable. Overall, in this Links section, shown in Figure 3.1, we can complete our puzzleonly when we have mitigated all risks in a smart risk management process.
FIGURE 3.1 Links between the Holistic Risk Picture and the Risk Management Alternative Solutions
CHAPTER 3 EVOLVING RISK MANAGEMENT: FUNDAMENTAL TOOLS 55
self-insuring
Retaining the risk within thefirm.
risk map
A visual tool used to consideralternatives of the riskmanagement tool set.
2. THE RISK MANAGEMENT FUNCTION
L E A R N I N G O B J E C T I V E
< In this section you will learn about the big picture of all risk management steps.
Traditionally, a firm’s risk management function ensured that the pure risks of losses were managedappropriately. The risk manager was charged with the responsibility for specific risks only. Most activ-ities involved providing adequate insurance and implementing loss-control techniques so that thefirm’s employees and property remained safe. Thus, risk managers sought to reduce the firm’s costs ofpure risks and to initiate safety and disaster management.
Typically, the traditional risk management position has reported to the corporate treasurer. Hand-ling risks by self-insuring (retaining risks within the firm) and paying claims in-house requires addi-tional personnel within the risk management function. In a small company or sole proprietorship, theowner usually performs the risk management function, establishing policy and making decisions. Infact, each of us manage our own risks, whether we have studied risk management or not. Every time welock our house or car, check the wiring system for problems, or pay an insurance premium, we are per-forming the same functions as a risk manager. Risk managers use agents or brokers to make smart in-surance and risk management decisions (agents and brokers are discussed in Chapter 6).
The traditional risk manager’s role has evolved, and corporations have begun to embrace enter-prise risk management in which all risks are part of the process: pure, opportunity, and speculativerisks. With this evolution, firms created the new post of chief risk officer (CRO). The role of CROs ex-panded the traditional role by integrating the firm’s silos, or separate risks, into a holistic framework.Risks cannot be segregated—they interact and affect one another.
In addition to insurance and loss control, risk managers or CROs use specialized tools to keep cashflow in-house, which we will discuss in Chapter 5 and Chapter 6. Captives are separate insurance entit-ies under the corporate structure—mostly for the exclusive use of the firm itself. CROs oversee the in-creasing reliance on capital market instruments to hedge risk. They also address the entire riskmap—a visual tool used to consider alternatives of the risk management tool set—in the realm of non-pure risks. For example, a cereal manufacturer, dependent upon a steady supply of grain used in pro-duction, may decide to enter into fixed-price long-term contractual arrangements with its suppliers toavoid the risk of price fluctuations. The CRO or the financial risk managers take responsibility for thesetrades. They also create the risk management guideline for the firm that usually includes the following:
< Writing a mission statement for risk management in the organization< Communicating with every section of the business to promote safe behavior< Identifying risk management policy and processes< Pinpointing all risk exposures (what “keeps employees awake at night”)< Assessing risk management and financing alternatives as well as external conditions in the
insurance markets< Allocating costs< Negotiating insurance terms< Adjusting claims adjustment in self-insuring firms< Keeping accurate records
Writing risk management manuals set up the process of identification, monitoring, assessment, evalu-ation, and adjustments.
In larger organizations, the risk manager or CRO has differing authority depending upon thepolicy that top management has adopted. Policy statements generally outline the dimensions of suchauthority. Risk managers may be authorized to make decisions in routine matters but restricted tomaking only recommendations in others. For example, the risk manager may recommend that thecosts of employee injuries be retained rather than insured, but a final decision of such magnitudewould be made by top management.
2.1 The Risk Management ProcessA typical risk management function includes the steps listed above: identifying risks, assessing them,forecasting future frequency and severity of losses, mitigating risks, finding risk mitigation solutions,
56 RISK MANAGEMENT FOR ENTERPRISES AND INDIVIDUALS
creating plans, conducting cost-benefits analyses, and implementing programs for loss control and in-surance. For each property risk exposure, for example, the risk manager would adopt the following orsimilar processes:
< Finding all properties that are exposed to losses (such as real property like land, buildings, andother structures; tangible property like furniture and computers; and intangible personalproperty like trademarks)
< Evaluating the potential causes of loss that can affect the firms’ property, including naturaldisasters (such as windstorms, floods, and earthquakes); accidental causes (such as fires,explosions, and the collapse of roofs under snow); and many other causes noted in Chapter 1;
< Evaluating property value by different methods, such as book value, market value, reproductioncost, and replacement cost
< Evaluating the firm’s legal interest in each of the properties—whether each property is owned orleased
< Identifying the actual loss exposure in each property using loss histories (frequency and severity),accounting records, personal inspections, flow charts, and questionnaires
< Computing the frequency and severity of losses for each of the property risk exposures based onloss data
< Forecasting future losses for each property risk exposure< Creating a specific risk map for all property risk exposures based on forecasted frequency and
severity< Developing risk management alternative tools (such as loss-control techniques) based upon cost-
benefit analysis or insurance< Comparing the existing solutions to potential solutions (traditional and nontraditional)—uses of
risk maps< Communicating the solutions with the whole organization by creating reporting techniques,
feedback, and a path for ongoing execution of the whole process< The process is very similar to any other business process.
K E Y T A K E A W A Y S
< The modern firm ensures that the risk management function is embedded throughout the wholeorganization.
< The risk management process follows logical sequence just as any business process will.
< The main steps in the risk management process are identifying risks, measuring risks, creating a map,finding alternative solutions to managing the risk, and evaluating programs once they are put into place.
D I S C U S S I O N Q U E S T I O N S
1. What are the steps in the pure risk management process?
2. Imagine that the step of evaluation of the risks did not account for related risks. What would be the resultfor the risk manager?
3. In the allocation of costs, does the CRO need to understand the holistic risk map of the whole company?Explain your answer with an example.
CHAPTER 3 EVOLVING RISK MANAGEMENT: FUNDAMENTAL TOOLS 57
risk management policystatement
The primary tool tocommunicate riskmanagement objectives.
risk profiling
A process that evaluates allthe risks of the organizationsand measures the frequencyand severity of each risk.
3. BEGINNING STEPS: COMMUNICATION ANDIDENTIFICATION
L E A R N I N G O B J E C T I V E
< In this section you will learn how to identify risks and create a risk map to communicate the im-portance of each risk on a severity and frequency grid.
Risk management policy statements are the primary tools to communicate risk managementobjectives. Forward-thinking firms have made a place for risk management policy statements for manyyears as leaders discuss the risk management process. Other tools used to relay objectives may includecompany mission statements, risk management manuals (which provide specific guidelines for detailedrisk management problems, such as how to deal with the death or disability of a key executive), andeven describe the risk manager’s job description. Effective risk management objectives coincide withthose of the organization generally, and both must be communicated consistently. Advertisements, em-ployee training programs, and other public activities also can communicate an organization’s philo-sophies and objectives.
3.1 Identifying RisksThe process of identifying all of a firm’s risks and their values is a very detailed process. It is of extremeimportance to ensure that the business is not ignoring anything that can destroy it. To illustrate howthe process takes shape, imagine a business such as Thompson’s department store that has a fleet of de-livery trucks, a restaurant, a coffee shop, a restaurant, and a babysitting service for parents who areshopping. The risk manager who talks to each employee in the store usually would ask for a list of allthe perils and hazards (discussed in Chapter 1) that can expose the operation to losses.
A simple analysis of this department store risk exposure nicely illustrates risk identification, whichis a critical element of risk management. For the coffee shop and restaurant, the risks include foodpoisoning, kitchen fire, and injuries to customers who slip. Spilled coffee can damage store merchand-ise. For the babysitting service, the store may be liable for any injury to infants as they are fed or play orpossibly suffer injuries from other kids. In addition to worry about employees’ possible injuries while atwork or damage to merchandise from mistreatment, the store risk manager would usually worry aboutthe condition of the floors as a potential hazard, especially when wet. Most risk managers work withthe architectural schematics of the building and learn about evacuation routes in case of fires. The loca-tion of the building is also critical to identification of risks. If the department store is in a flood-pronearea, the risks are different than if the store were located in the mountains. The process involves everycompany stakeholder. Understanding the supply chain of movement of merchandise is part of the planas well. If suppliers have losses, risk managers need to know about the risk associated with such delays.This example is a short illustration of the enormous task of risk identification.
Today’s CRO also reviews the financial statement of the firm to ensure the financial viability with-in the financial risks, the asset risks and product risks the firm undertakes. We elaborate more on thisaspect with examples in Chapter 13.
Risk Profiling
Discovering all risks, their assessments and their relationships to one another becomes critical to learn-ing and understanding an organization’s tolerance for risk. This step comes after a separate and thor-ough review of each risk. Holistic risk mapping is the outcome of risk profiling, a process that evalu-ates all the risks of the organizations and measures the frequency and severity of each risk. Differentkinds of organizations pose very different types of risk exposures, and risk evaluations can differ vastlyamong industries. Boeing, for example, has a tremendous wrongful death exposure resulting fromplane crashes. Intellectual property piracy and property rights issues could have a big impact upon theoperations of an organization like Microsoft.
58 RISK MANAGEMENT FOR ENTERPRISES AND INDIVIDUALS
risk mapping
Charting entire spectrums ofrisk, not individual risk “silos”from each separate businessunit.
Risk Mapping: Creating the Model
The results of risk profiling can be graphically displayed and developed into a model. One such modelis risk mapping.[1] Risk mapping involves charting entire spectrums of risk, not individual risk “silos”from each separate business unit. Risk mapping becomes useful both in identifying risks and in choos-ing approaches to mitigate them. Such a map presents a cumulative picture of all the risks in one riskmanagement solution chart. Different facets of risk could include
< workers’ compensation claims,< earthquake or tornado exposure,< credit risk,< mold,< terrorism,< theft,< environmental effects,< intellectual property piracy, and< a host of other concerns.
A risk map puts the risks a company faces into a visual medium to see how risks are clustered and tounderstand the relationships among risks. The risks are displayed on a severity and frequency grid aftereach risk is assessed. Risk maps can be useful tools for explaining and communicating various risks tomanagement and employees. One map might be created to chart what risks are most significant to aparticular company. This chart would be used to prioritize risk across the enterprise. Another mapmight show the risk reduction after risk management action is adopted, as we will show later in thischapter.[2]
Figure 3.2 presents an example of a holistic risk map for an organization examining the dynamicsof frequency and severity as they relate to each risk. By assigning the probability of occurrence againstthe estimate of future magnitude of possible loss, risk managers can form foundations upon which acorporation can focus on risk areas in need of actions. The possible actions—including risk avoidance,loss control, and insurance (loss transfer)—provide alternative solutions during the discussion of therisk management matrix in this chapter.
Note that risk maps include plotting intersection points between measures of frequency (on an x-axis) and severity (on a y-axis) and visually plotting intersection points. Each point represents the rela-tionship between the frequency of the exposure and the severity of the exposure for each riskmeasured.
Risk Identification and Estimates of Frequency and Severity
Strategies for risk mapping will vary from organization to organization. Company objectives arise outof the firm’s risk appetite and culture. These objectives help determine the organization’s risk tolerancelevel (see Chapter 4). As in the separate risk management process for each risk exposure, the first stepin mapping risk is to identify the firm’s loss exposures and estimate and forecast the frequency andseverity of each potential risk. Figure 3.2 displays (for illustration purposes only) quantified trended es-timates of loss frequency and severity that risk managers use as inputs into the risk map for a hypothet-ical small import/export business, Notable Notions. The risk map graph is divided into the four quad-rants of the classical risk management matrix (which we discuss in detail later in this chapter). As wewill see, such matrices provide a critical part of the way to provide risk management solutions to eachrisk.
CHAPTER 3 EVOLVING RISK MANAGEMENT: FUNDAMENTAL TOOLS 59
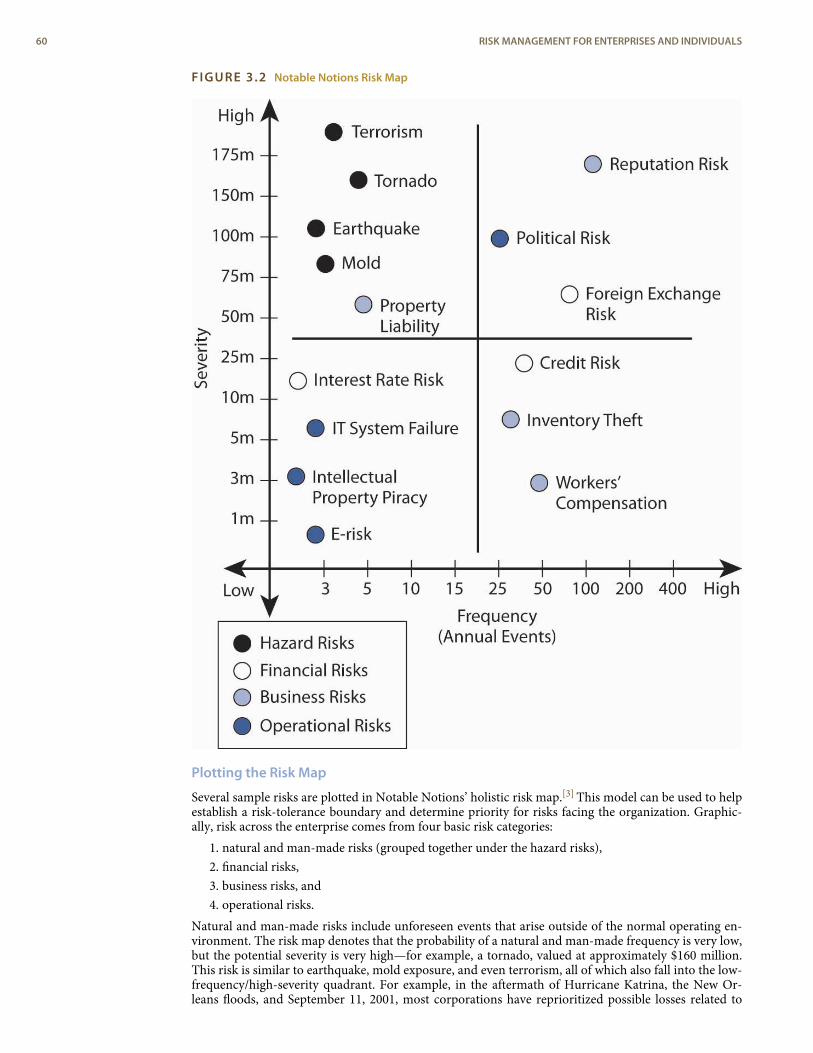
FIGURE 3.2 Notable Notions Risk Map
Plotting the Risk Map
Several sample risks are plotted in Notable Notions’ holistic risk map.[3] This model can be used to helpestablish a risk-tolerance boundary and determine priority for risks facing the organization. Graphic-ally, risk across the enterprise comes from four basic risk categories:
1. natural and man-made risks (grouped together under the hazard risks),2. financial risks,3. business risks, and4. operational risks.
Natural and man-made risks include unforeseen events that arise outside of the normal operating en-vironment. The risk map denotes that the probability of a natural and man-made frequency is very low,but the potential severity is very high—for example, a tornado, valued at approximately $160 million.This risk is similar to earthquake, mold exposure, and even terrorism, all of which also fall into the low-frequency/high-severity quadrant. For example, in the aftermath of Hurricane Katrina, the New Or-leans floods, and September 11, 2001, most corporations have reprioritized possible losses related to
60 RISK MANAGEMENT FOR ENTERPRISES AND INDIVIDUALS
financial risks
Uncertainty regarding theoutcome of financialdecisions, as influenced byfactors such as prices,volatility, liquidity, creditmarkets, currency exchange,and general marketconditions.
huge man-made and natural catastrophes. For example, more than 1,200 World Bank employees weresent home and barred from corporate headquarters for several days following an anthrax scare in themailroom.[4] This possibility exposes firms to large potential losses associated with an unexpected in-terruption to normal business operations. See the box in the introduction to this chapter "How toHandle the Risk Management of a Low-Frequency but Scary Risk Exposure: The Anthrax Scare".
Financial risks arise from changing market conditions involving
< prices,< volatility,< liquidity,< credit risk,< foreign exchange risk, and< general market recession (as in the third and fourth quarter of 2008).
The credit crisis that arose in the third and fourth quarters of 2008 affected most businesses as econom-ies around the world slowed down and consumers retrench and lower their spending. Thus, risk factorsthat may provide opportunities as well as potential loss as interest rates, foreign exchange rates are em-bedded in the risk map. We can display the opportunities—along with possible losses (as we show inChapter 13 in Figure 13.1).
In our example, we can say that because of its global customer base, Notable Notions has a tre-mendous amount of exposure to exchange rate risk, which may provide opportunities as well as risks.In such cases, there is no frequency of loss and the opportunity risk is not part of the risk map shown inFigure 3.2. If Notable Notions was a highly leveraged company (meaning that the firm has taken manyloans to finance its operations), the company would be at risk of inability to operate and pay salaries ifcredit lines dried out. However, if it is a conservative company with cash reserves for its operations,Notable Notions’ risk map denotes the high number (frequency) of transactions in addition to the highdollar exposure (severity) associated with adverse foreign exchange rate movement. The credit risk forloans did not even make the map, since there is no frequency of loss in the data base for the company.Methods used to control the risks and lower the frequency and severity of financial risks are discussedin Chapter 13.
One example of business risks is reputation risk, which is plotted in the high-frequency/high-severity quadrant. Only recently have we identified reputation risk in map models. Not only do manu-facturers such as Coca-Cola rely on their high brand-name identification, so do smaller companies(like Notable Notions) whose customers rely on stellar business practices. One hiccup in the distribu-tion chain causing nondelivery or inconsistent quality in an order can damage a company’s reputationand lead to canceled contracts. The downside of reputation damage is potentially significant and has along recovery period. Companies and their risk managers currently rate loss of good reputation as oneof the greatest corporate threats to the success or failure of their organization.[5] A case in point is theimpact on Martha Stewart’s reputation after she was linked to an insider trading scandal involving thebiotech firm ImClone.[6] The day after the story was reported in the Wall Street Journal, the stock priceof Martha Stewart Living Omnimedia declined almost 20 percent, costing Stewart herself nearly $200million.
Operational risks are those that relate to the ongoing day-to-day business activities of the organiz-ation. Here we reflect IT system failure exposure (which we will discuss in detail later in this chapter).On the figure above, this risk appears in the lower-left quadrant, low severity/low frequency. Hard datashows low down time related to IT system failure. (It is likely that this risk was originally more severeand has been reduced by backup systems and disaster recovery plans.) In the case of a nontechnologyfirm such as Notable Notions, electronic risk exposure and intellectual property risk are also plotted inthe low-frequency/low-severity quadrant.
A pure risk (like workers’ compensation) falls in the lower-right quadrant for Notable Notions.The organization experiences a high-frequency but low-severity outcome for workers’ compensationclaims. Good internal record-keeping helps to track the experience data for Notable Notions and allowsfor an appropriate mitigation strategy.
The location of each of the remaining data points on Figure 3.2 reflects an additional risk exposurefor Notable Notions.
Once a company or CRO has reviewed all these risks together, Notable Notions can create a cohes-ive and consistent holistic risk management strategy. Risk managers can also review a variety of effectsthat may not be apparent when exposures are isolated. Small problems in one department may causebig ones in another, and small risks that have high frequency in each department can become exponen-tially more severe in the aggregate. We will explore property and liability risks more in Chapter 8 andChapter 9.
CHAPTER 3 EVOLVING RISK MANAGEMENT: FUNDAMENTAL TOOLS 61
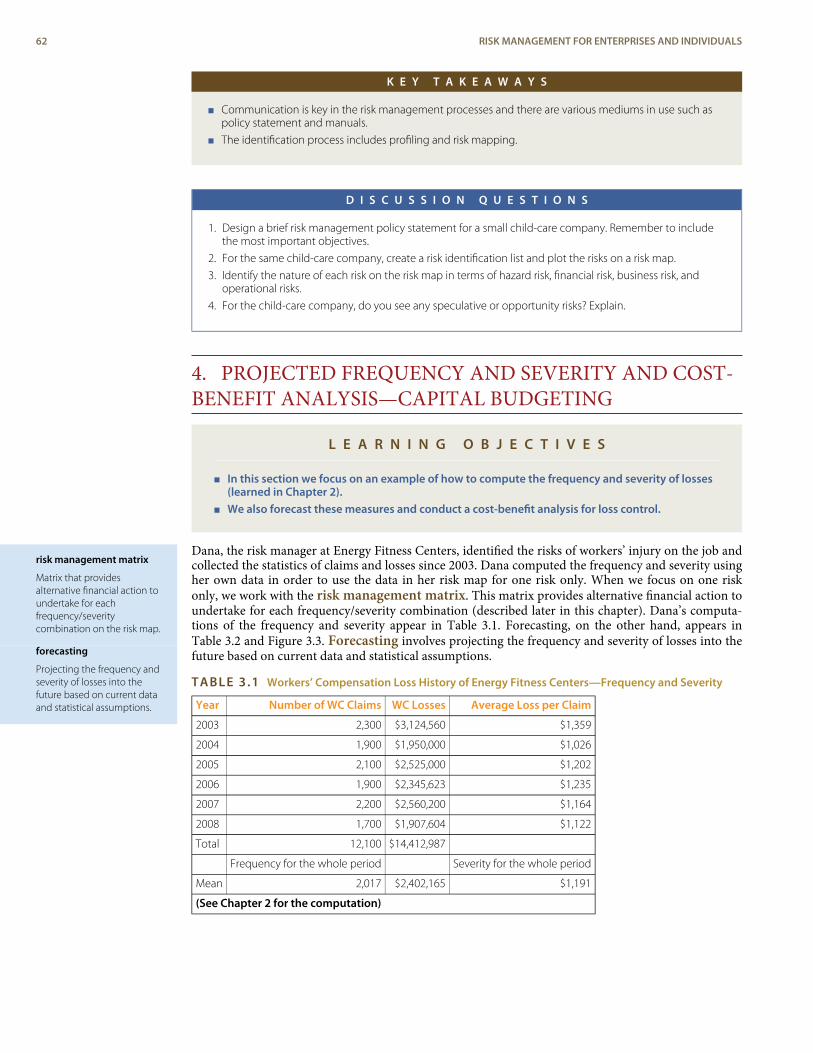
risk management matrix
Matrix that providesalternative financial action toundertake for eachfrequency/severitycombination on the risk map.
forecasting
Projecting the frequency andseverity of losses into thefuture based on current dataand statistical assumptions.
K E Y T A K E A W A Y S
< Communication is key in the risk management processes and there are various mediums in use such aspolicy statement and manuals.
< The identification process includes profiling and risk mapping.
D I S C U S S I O N Q U E S T I O N S
1. Design a brief risk management policy statement for a small child-care company. Remember to includethe most important objectives.
2. For the same child-care company, create a risk identification list and plot the risks on a risk map.
3. Identify the nature of each risk on the risk map in terms of hazard risk, financial risk, business risk, andoperational risks.
4. For the child-care company, do you see any speculative or opportunity risks? Explain.
4. PROJECTED FREQUENCY AND SEVERITY AND COST-BENEFIT ANALYSIS—CAPITAL BUDGETING
L E A R N I N G O B J E C T I V E S
< In this section we focus on an example of how to compute the frequency and severity of losses(learned in Chapter 2).
< We also forecast these measures and conduct a cost-benefit analysis for loss control.
Dana, the risk manager at Energy Fitness Centers, identified the risks of workers’ injury on the job andcollected the statistics of claims and losses since 2003. Dana computed the frequency and severity usingher own data in order to use the data in her risk map for one risk only. When we focus on one riskonly, we work with the risk management matrix. This matrix provides alternative financial action toundertake for each frequency/severity combination (described later in this chapter). Dana’s computa-tions of the frequency and severity appear in Table 3.1. Forecasting, on the other hand, appears inTable 3.2 and Figure 3.3. Forecasting involves projecting the frequency and severity of losses into thefuture based on current data and statistical assumptions.
TABLE 3.1 Workers’ Compensation Loss History of Energy Fitness Centers—Frequency and Severity
Year Number of WC Claims WC Losses Average Loss per Claim
2003 2,300 $3,124,560 $1,359
2004 1,900 $1,950,000 $1,026
2005 2,100 $2,525,000 $1,202
2006 1,900 $2,345,623 $1,235
2007 2,200 $2,560,200 $1,164
2008 1,700 $1,907,604 $1,122
Total 12,100 $14,412,987
Frequency for the whole period Severity for the whole period
Mean 2,017 $2,402,165 $1,191
(See Chapter 2 for the computation)
62 RISK MANAGEMENT FOR ENTERPRISES AND INDIVIDUALS
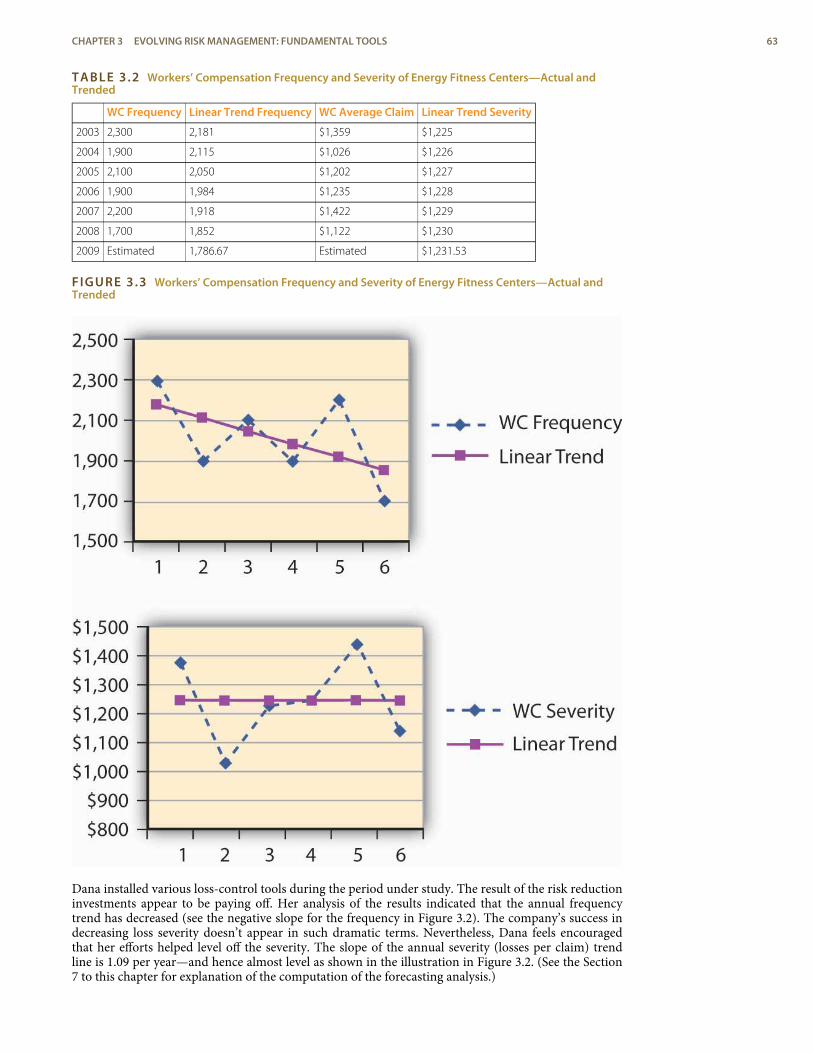
TABLE 3.2 Workers’ Compensation Frequency and Severity of Energy Fitness Centers—Actual andTrended
WC Frequency Linear Trend Frequency WC Average Claim Linear Trend Severity
2003 2,300 2,181 $1,359 $1,225
2004 1,900 2,115 $1,026 $1,226
2005 2,100 2,050 $1,202 $1,227
2006 1,900 1,984 $1,235 $1,228
2007 2,200 1,918 $1,422 $1,229
2008 1,700 1,852 $1,122 $1,230
2009 Estimated 1,786.67 Estimated $1,231.53
FIGURE 3.3 Workers’ Compensation Frequency and Severity of Energy Fitness Centers—Actual andTrended
Dana installed various loss-control tools during the period under study. The result of the risk reductioninvestments appear to be paying off. Her analysis of the results indicated that the annual frequencytrend has decreased (see the negative slope for the frequency in Figure 3.2). The company’s success indecreasing loss severity doesn’t appear in such dramatic terms. Nevertheless, Dana feels encouragedthat her efforts helped level off the severity. The slope of the annual severity (losses per claim) trendline is 1.09 per year—and hence almost level as shown in the illustration in Figure 3.2. (See the Section7 to this chapter for explanation of the computation of the forecasting analysis.)
CHAPTER 3 EVOLVING RISK MANAGEMENT: FUNDAMENTAL TOOLS 63
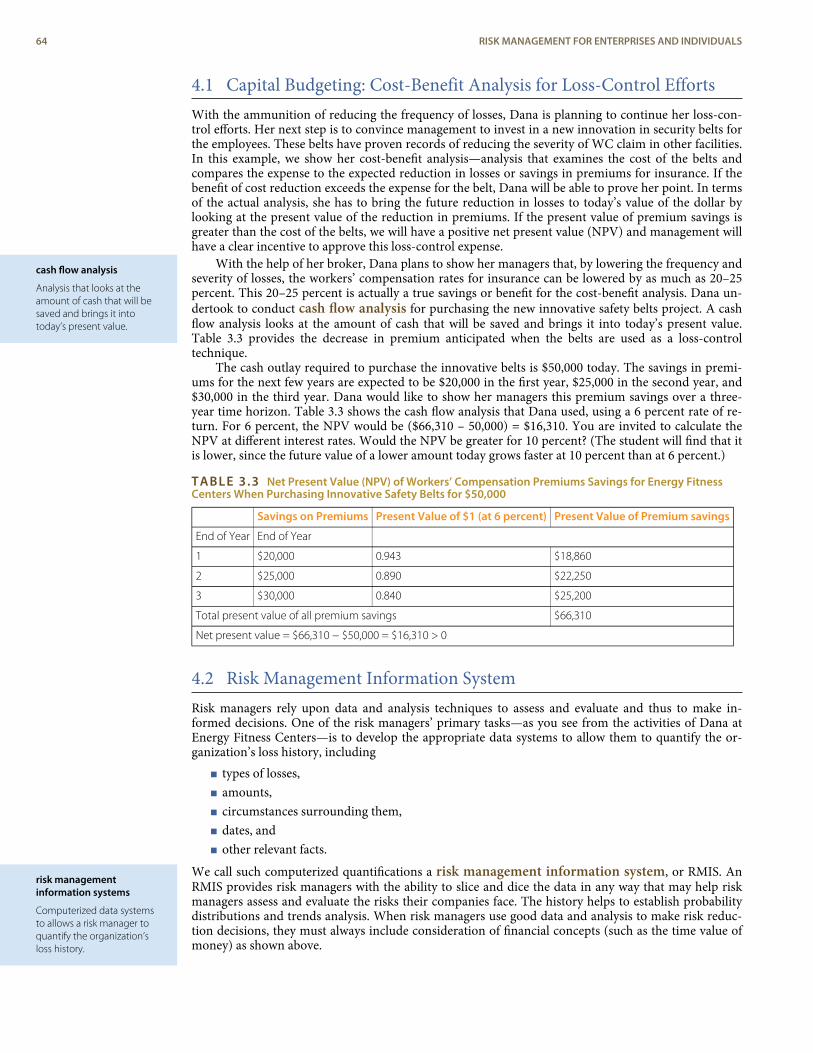
cash flow analysis
Analysis that looks at theamount of cash that will besaved and brings it intotoday’s present value.
risk managementinformation systems
Computerized data systemsto allows a risk manager toquantify the organization’sloss history.
4.1 Capital Budgeting: Cost-Benefit Analysis for Loss-Control EffortsWith the ammunition of reducing the frequency of losses, Dana is planning to continue her loss-con-trol efforts. Her next step is to convince management to invest in a new innovation in security belts forthe employees. These belts have proven records of reducing the severity of WC claim in other facilities.In this example, we show her cost-benefit analysis—analysis that examines the cost of the belts andcompares the expense to the expected reduction in losses or savings in premiums for insurance. If thebenefit of cost reduction exceeds the expense for the belt, Dana will be able to prove her point. In termsof the actual analysis, she has to bring the future reduction in losses to today’s value of the dollar bylooking at the present value of the reduction in premiums. If the present value of premium savings isgreater than the cost of the belts, we will have a positive net present value (NPV) and management willhave a clear incentive to approve this loss-control expense.
With the help of her broker, Dana plans to show her managers that, by lowering the frequency andseverity of losses, the workers’ compensation rates for insurance can be lowered by as much as 20–25percent. This 20–25 percent is actually a true savings or benefit for the cost-benefit analysis. Dana un-dertook to conduct cash flow analysis for purchasing the new innovative safety belts project. A cashflow analysis looks at the amount of cash that will be saved and brings it into today’s present value.Table 3.3 provides the decrease in premium anticipated when the belts are used as a loss-controltechnique.
The cash outlay required to purchase the innovative belts is $50,000 today. The savings in premi-ums for the next few years are expected to be $20,000 in the first year, $25,000 in the second year, and$30,000 in the third year. Dana would like to show her managers this premium savings over a three-year time horizon. Table 3.3 shows the cash flow analysis that Dana used, using a 6 percent rate of re-turn. For 6 percent, the NPV would be ($66,310 – 50,000) = $16,310. You are invited to calculate theNPV at different interest rates. Would the NPV be greater for 10 percent? (The student will find that itis lower, since the future value of a lower amount today grows faster at 10 percent than at 6 percent.)
TABLE 3.3 Net Present Value (NPV) of Workers’ Compensation Premiums Savings for Energy FitnessCenters When Purchasing Innovative Safety Belts for $50,000
Savings on Premiums Present Value of $1 (at 6 percent) Present Value of Premium savings
End of Year End of Year
1 $20,000 0.943 $18,860
2 $25,000 0.890 $22,250
3 $30,000 0.840 $25,200
Total present value of all premium savings $66,310
Net present value = $66,310 − $50,000 = $16,310 > 0
4.2 Risk Management Information SystemRisk managers rely upon data and analysis techniques to assess and evaluate and thus to make in-formed decisions. One of the risk managers’ primary tasks—as you see from the activities of Dana atEnergy Fitness Centers—is to develop the appropriate data systems to allow them to quantify the or-ganization’s loss history, including
< types of losses,< amounts,< circumstances surrounding them,< dates, and< other relevant facts.
We call such computerized quantifications a risk management information system, or RMIS. AnRMIS provides risk managers with the ability to slice and dice the data in any way that may help riskmanagers assess and evaluate the risks their companies face. The history helps to establish probabilitydistributions and trends analysis. When risk managers use good data and analysis to make risk reduc-tion decisions, they must always include consideration of financial concepts (such as the time value ofmoney) as shown above.
64 RISK MANAGEMENT FOR ENTERPRISES AND INDIVIDUALS
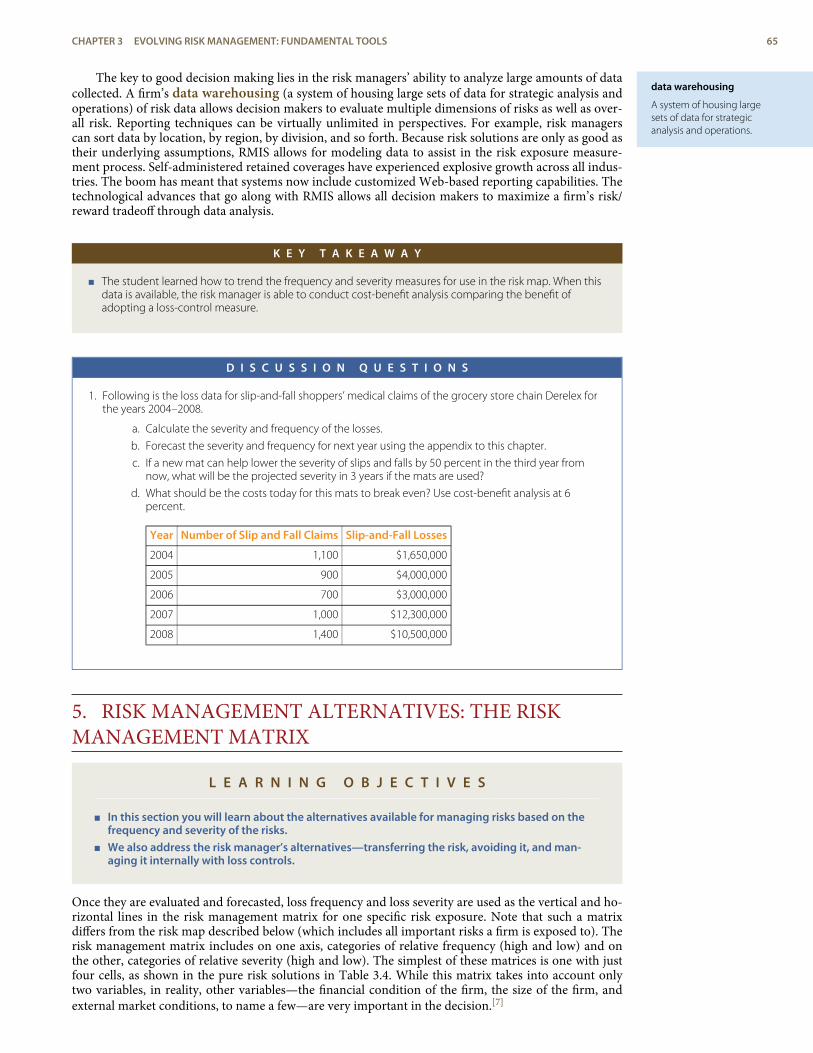
data warehousing
A system of housing largesets of data for strategicanalysis and operations.
The key to good decision making lies in the risk managers’ ability to analyze large amounts of datacollected. A firm’s data warehousing (a system of housing large sets of data for strategic analysis andoperations) of risk data allows decision makers to evaluate multiple dimensions of risks as well as over-all risk. Reporting techniques can be virtually unlimited in perspectives. For example, risk managerscan sort data by location, by region, by division, and so forth. Because risk solutions are only as good astheir underlying assumptions, RMIS allows for modeling data to assist in the risk exposure measure-ment process. Self-administered retained coverages have experienced explosive growth across all indus-tries. The boom has meant that systems now include customized Web-based reporting capabilities. Thetechnological advances that go along with RMIS allows all decision makers to maximize a firm’s risk/reward tradeoff through data analysis.
K E Y T A K E A W A Y
< The student learned how to trend the frequency and severity measures for use in the risk map. When thisdata is available, the risk manager is able to conduct cost-benefit analysis comparing the benefit ofadopting a loss-control measure.
D I S C U S S I O N Q U E S T I O N S
1. Following is the loss data for slip-and-fall shoppers’ medical claims of the grocery store chain Derelex forthe years 2004–2008.
a. Calculate the severity and frequency of the losses.
b. Forecast the severity and frequency for next year using the appendix to this chapter.
c. If a new mat can help lower the severity of slips and falls by 50 percent in the third year fromnow, what will be the projected severity in 3 years if the mats are used?
d. What should be the costs today for this mats to break even? Use cost-benefit analysis at 6percent.
Year Number of Slip and Fall Claims Slip-and-Fall Losses
2004 1,100 $1,650,000
2005 900 $4,000,000
2006 700 $3,000,000
2007 1,000 $12,300,000
2008 1,400 $10,500,000
5. RISK MANAGEMENT ALTERNATIVES: THE RISKMANAGEMENT MATRIX
L E A R N I N G O B J E C T I V E S
< In this section you will learn about the alternatives available for managing risks based on thefrequency and severity of the risks.
< We also address the risk manager’s alternatives—transferring the risk, avoiding it, and man-aging it internally with loss controls.
Once they are evaluated and forecasted, loss frequency and loss severity are used as the vertical and ho-rizontal lines in the risk management matrix for one specific risk exposure. Note that such a matrixdiffers from the risk map described below (which includes all important risks a firm is exposed to). Therisk management matrix includes on one axis, categories of relative frequency (high and low) and onthe other, categories of relative severity (high and low). The simplest of these matrices is one with justfour cells, as shown in the pure risk solutions in Table 3.4. While this matrix takes into account onlytwo variables, in reality, other variables—the financial condition of the firm, the size of the firm, andexternal market conditions, to name a few—are very important in the decision.[7]
CHAPTER 3 EVOLVING RISK MANAGEMENT: FUNDAMENTAL TOOLS 65
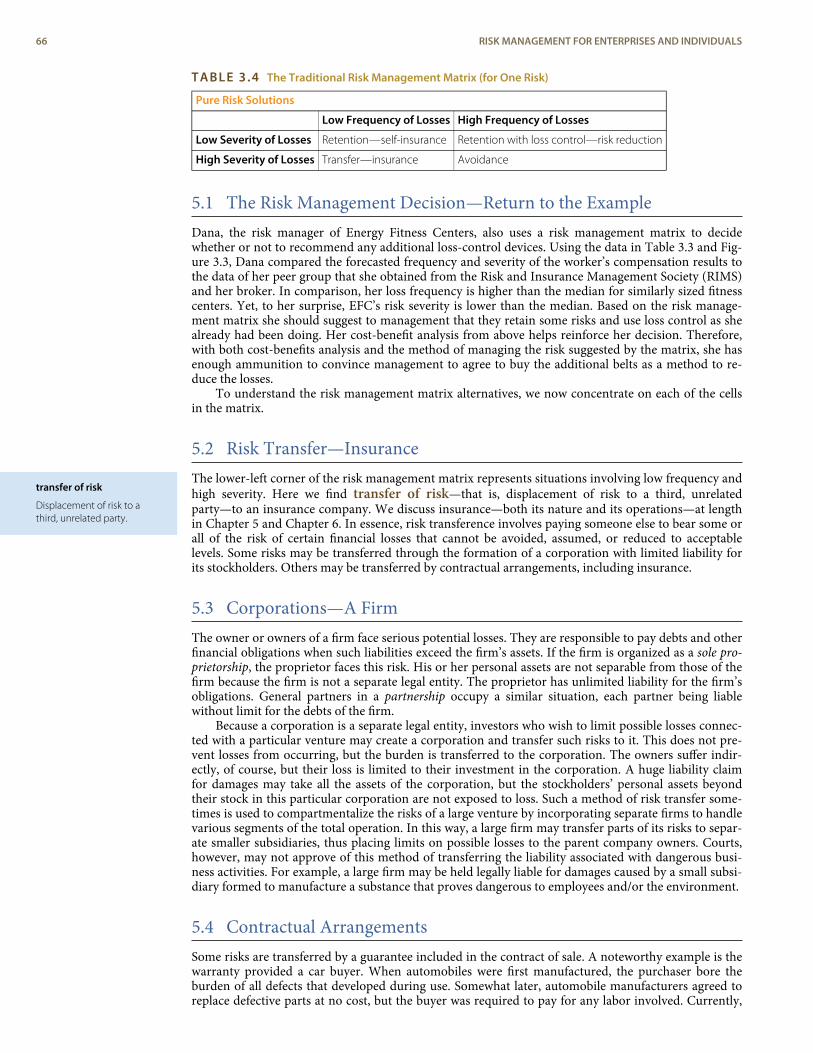
transfer of risk
Displacement of risk to athird, unrelated party.
TABLE 3.4 The Traditional Risk Management Matrix (for One Risk)
Pure Risk Solutions
Low Frequency of Losses High Frequency of Losses
Low Severity of Losses Retention—self-insurance Retention with loss control—risk reduction
High Severity of Losses Transfer—insurance Avoidance
5.1 The Risk Management Decision—Return to the ExampleDana, the risk manager of Energy Fitness Centers, also uses a risk management matrix to decidewhether or not to recommend any additional loss-control devices. Using the data in Table 3.3 and Fig-ure 3.3, Dana compared the forecasted frequency and severity of the worker’s compensation results tothe data of her peer group that she obtained from the Risk and Insurance Management Society (RIMS)and her broker. In comparison, her loss frequency is higher than the median for similarly sized fitnesscenters. Yet, to her surprise, EFC’s risk severity is lower than the median. Based on the risk manage-ment matrix she should suggest to management that they retain some risks and use loss control as shealready had been doing. Her cost-benefit analysis from above helps reinforce her decision. Therefore,with both cost-benefits analysis and the method of managing the risk suggested by the matrix, she hasenough ammunition to convince management to agree to buy the additional belts as a method to re-duce the losses.
To understand the risk management matrix alternatives, we now concentrate on each of the cellsin the matrix.
5.2 Risk Transfer—InsuranceThe lower-left corner of the risk management matrix represents situations involving low frequency andhigh severity. Here we find transfer of risk—that is, displacement of risk to a third, unrelatedparty—to an insurance company. We discuss insurance—both its nature and its operations—at lengthin Chapter 5 and Chapter 6. In essence, risk transference involves paying someone else to bear some orall of the risk of certain financial losses that cannot be avoided, assumed, or reduced to acceptablelevels. Some risks may be transferred through the formation of a corporation with limited liability forits stockholders. Others may be transferred by contractual arrangements, including insurance.
5.3 Corporations—A FirmThe owner or owners of a firm face serious potential losses. They are responsible to pay debts and otherfinancial obligations when such liabilities exceed the firm’s assets. If the firm is organized as a sole pro-prietorship, the proprietor faces this risk. His or her personal assets are not separable from those of thefirm because the firm is not a separate legal entity. The proprietor has unlimited liability for the firm’sobligations. General partners in a partnership occupy a similar situation, each partner being liablewithout limit for the debts of the firm.
Because a corporation is a separate legal entity, investors who wish to limit possible losses connec-ted with a particular venture may create a corporation and transfer such risks to it. This does not pre-vent losses from occurring, but the burden is transferred to the corporation. The owners suffer indir-ectly, of course, but their loss is limited to their investment in the corporation. A huge liability claimfor damages may take all the assets of the corporation, but the stockholders’ personal assets beyondtheir stock in this particular corporation are not exposed to loss. Such a method of risk transfer some-times is used to compartmentalize the risks of a large venture by incorporating separate firms to handlevarious segments of the total operation. In this way, a large firm may transfer parts of its risks to separ-ate smaller subsidiaries, thus placing limits on possible losses to the parent company owners. Courts,however, may not approve of this method of transferring the liability associated with dangerous busi-ness activities. For example, a large firm may be held legally liable for damages caused by a small subsi-diary formed to manufacture a substance that proves dangerous to employees and/or the environment.
5.4 Contractual ArrangementsSome risks are transferred by a guarantee included in the contract of sale. A noteworthy example is thewarranty provided a car buyer. When automobiles were first manufactured, the purchaser bore theburden of all defects that developed during use. Somewhat later, automobile manufacturers agreed toreplace defective parts at no cost, but the buyer was required to pay for any labor involved. Currently,
66 RISK MANAGEMENT FOR ENTERPRISES AND INDIVIDUALS
risk retention group
A group that provides riskmanagement and retentionto a few players in the sameindustry who are too small toact on their own.
loss prevention
Efforts that seek to reducethe probability of a lossoccurring.
loss reduction
Efforts to lessen loss severity.
manufacturers typically not only replace defective parts but also pay for labor, within certain con-straints. The owner has, in effect, transferred a large part of the risk of purchasing a new automobileback to the manufacturer. The buyer, of course, is still subject to the inconvenience of having repairsmade, but he or she does not have to pay for them.
Other types of contractual arrangements that transfer risk include leases and rental agreements,hold-harmless clauses[8] and surety bonds.[9] Perhaps the most important arrangement for the transferof risk important to our study is insurance.
Insurance is a common form of planned risk transfer as a financing technique for individuals andmost organizations. The insurance industry has grown tremendously in industrialized countries, devel-oping sophisticated products, employing millions of people, and investing billions of dollars. Becauseof its core importance in risk management, insurance is the centerpiece in most risk managementactivities.
5.5 Risk AssumptionThe upper-left corner of the matrix in Table 3.4, representing both low frequency and low severity,shows retention of risk. When an organization uses a highly formalized method of retention of a risk, itis said the organization has self-insured the risk. The company bears the risk and is willing to withstandthe financial losses from claims, if any. It is important to note that the extent to which risk retention isfeasible depends upon the accuracy of loss predictions and the arrangements made for loss payment.Retention is especially attractive to large organizations. Many large corporations use captives, whichare a form of self-insurance. When a business creates a subsidiary to handle the risk exposures, thebusiness creates a captive. As noted above, broadly defined, a captive insurance company is one thatprovides risk management protection to its parent company and other affiliated organizations. Thecaptive is controlled by its parent company. We will provide a more detailed explanation of captives inChapter 5. If the parent can use funds more productively (that is, can earn a higher after-tax return oninvestment), the formation of a captive may be wise. The risk manager must assess the importance ofthe insurer’s claims adjusting and other services (including underwriting) when evaluating whether tocreate or rent a captive.
Risk managers of smaller businesses can become part of a risk retention group.[10] A risk reten-tion group provides risk management and retention to a few players in the same industry who are toosmall to act on their own. In this way, risk retention groups are similar to group self-insurance. We dis-cuss them further in Chapter 5.
5.6 Risk ReductionMoving over to the upper-right corner of the risk management matrix in Table 3.4, the quadrant char-acterized by high frequency and low severity, we find retention with loss control. If frequency is sig-nificant, risk managers may find efforts to prevent losses useful. If losses are of low value, they may beeasily paid out of the organization’s or individual’s own funds. Risk retention usually finances highlyfrequent, predictable losses more cost effectively. An example might be losses due to wear and tear onequipment. Such losses are predictable and of a manageable, low-annual value. We described loss con-trol in the case of the fitness center above.
Loss prevention efforts seek to reduce the probability of a loss occurring. Managers use loss re-duction efforts to lessen loss severity. If you want to ski in spite of the hazards involved, you may takeinstruction to improve your skills and reduce the likelihood of you falling down a hill or crashing into atree. At the same time, you may engage in a physical fitness program to toughen your body to with-stand spills without serious injury. Using both loss prevention and reduction techniques, you attemptto lower both the probability and severity of loss.
Loss prevention’s goal seeks to reduce losses to the minimum compatible with a reasonable level ofhuman activity and expense. At any given time, economic constraints place limits on what may bedone, although what is considered too costly at one time may be readily accepted at a later date. Thus,during one era, little effort may have been made to prevent injury to employees, because employeeswere regarded as expendable. The general notion today, however, is that such injuries are prevented be-cause they have become too expensive. Change was made to adapt to the prevailing ideals concerningthe value of human life and the social responsibility of business.
5.7 Risk AvoidanceIn the lower-right corner of the matrix in Table 3.4, at the intersection of high frequency and highseverity, we find avoidance. Managers seek to avoid any situation falling in this category if possible. An
CHAPTER 3 EVOLVING RISK MANAGEMENT: FUNDAMENTAL TOOLS 67
example might be a firm that is considering construction of a building on the east coast of Florida inKey West. Flooding and hurricane risk would be high, with significant damage possibilities.
Of course, we cannot always avoid risks. When Texas school districts were faced with high severityand frequency of losses in workers’ compensation, schools could not close their doors to avoid theproblem. Instead, the school districts opted to self-insure, that is, retain the risk up to a certain loss lim-it.[11]
Not all avoidance necessarily results in “no loss.” While seeking to avoid one loss potential, manyefforts may create another. Some people choose to travel by car instead of plane because of their fear offlying. While they have successfully avoided the possibility of being a passenger in an airplane accident,they have increased their probability of being in an automobile accident. Per mile traveled, automobiledeaths are far more frequent than aircraft fatalities. By choosing cars over planes, these people actuallyraise their probability of injury.
K E Y T A K E A W A Y S
< One of the most important tools in risk management is a road map using projected frequency and severityof losses of one risk only.
< Within a framework of similar companies, the risk manager can tell when it is most appropriate to use risktransfer, risk reduction, retain or transfer the risk.
D I S C U S S I O N Q U E S T I O N S
1. Using the basic risk management matrix, explain the following:
a. When would you buy insurance?
b. When would you avoid the risk?
c. When would you retain the risk?
d. When would you use loss control?
2. Give examples for the following risk exposures:
a. High-frequency and high-severity loss exposures
b. Low-frequency and high-severity loss exposures
c. Low-frequency and low-severity loss exposures
d. High-frequency and low-severity loss exposure
6. COMPARISONS TO CURRENT RISK-HANDLINGMETHODS
L E A R N I N G O B J E C T I V E S
< In this section we return to the risk map and compare the risk map created for the identifica-tion purpose to that created for the risk management tools already used by the business.
< If the solution the firm uses does not fit within the solutions suggested by the risk manage-ment matrix, the business has to reevaluate its methods of managing the risks.
At this point, the risk manager of Notable Notions can see the potential impact of its risks and its bestrisk management strategies. The next step in the risk mapping technique is to create separate graphsthat show how the firm is currently handling each risk. Each of the risks in Figure 3.4 is now graphedaccording to whether the risk is uninsured, retained, partially insured or hedged (a financial techniqueto lower the risk by using the financial instrument discussed in Chapter 5), or insured. Figure 3.4 is thenew risk map reflecting the current risk management handling.
68 RISK MANAGEMENT FOR ENTERPRISES AND INDIVIDUALS
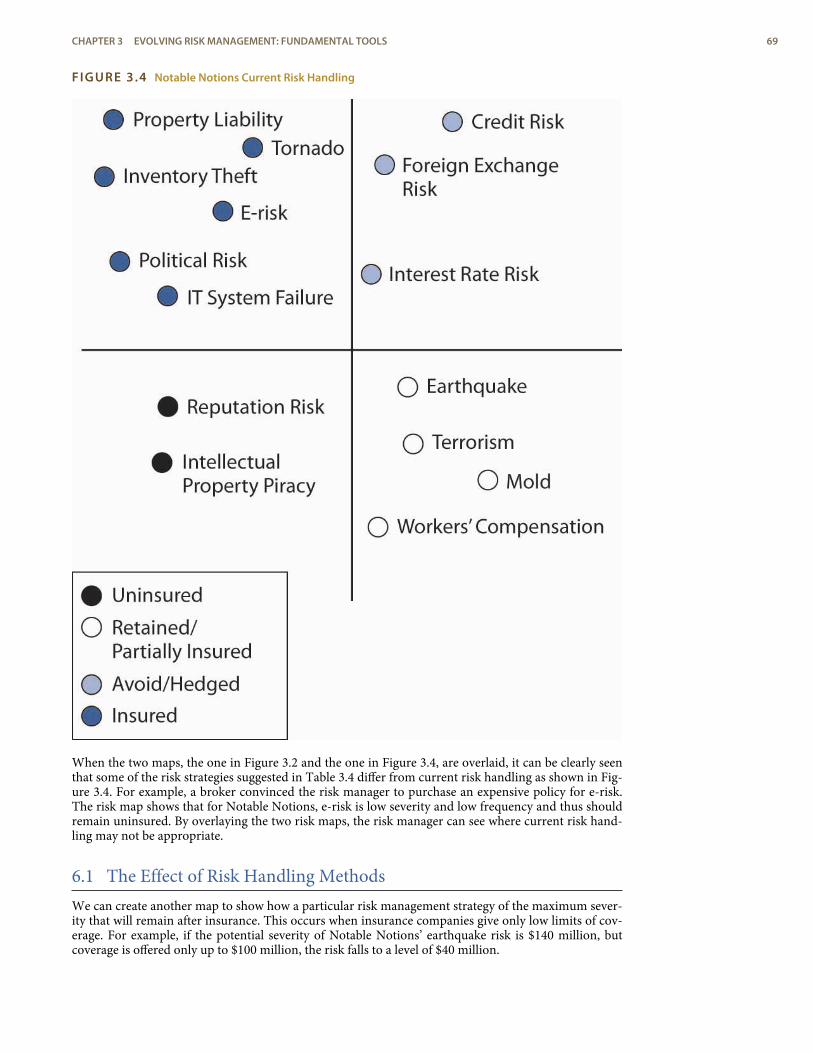
FIGURE 3.4 Notable Notions Current Risk Handling
When the two maps, the one in Figure 3.2 and the one in Figure 3.4, are overlaid, it can be clearly seenthat some of the risk strategies suggested in Table 3.4 differ from current risk handling as shown in Fig-ure 3.4. For example, a broker convinced the risk manager to purchase an expensive policy for e-risk.The risk map shows that for Notable Notions, e-risk is low severity and low frequency and thus shouldremain uninsured. By overlaying the two risk maps, the risk manager can see where current risk hand-ling may not be appropriate.
6.1 The Effect of Risk Handling MethodsWe can create another map to show how a particular risk management strategy of the maximum sever-ity that will remain after insurance. This occurs when insurance companies give only low limits of cov-erage. For example, if the potential severity of Notable Notions’ earthquake risk is $140 million, butcoverage is offered only up to $100 million, the risk falls to a level of $40 million.
CHAPTER 3 EVOLVING RISK MANAGEMENT: FUNDAMENTAL TOOLS 69
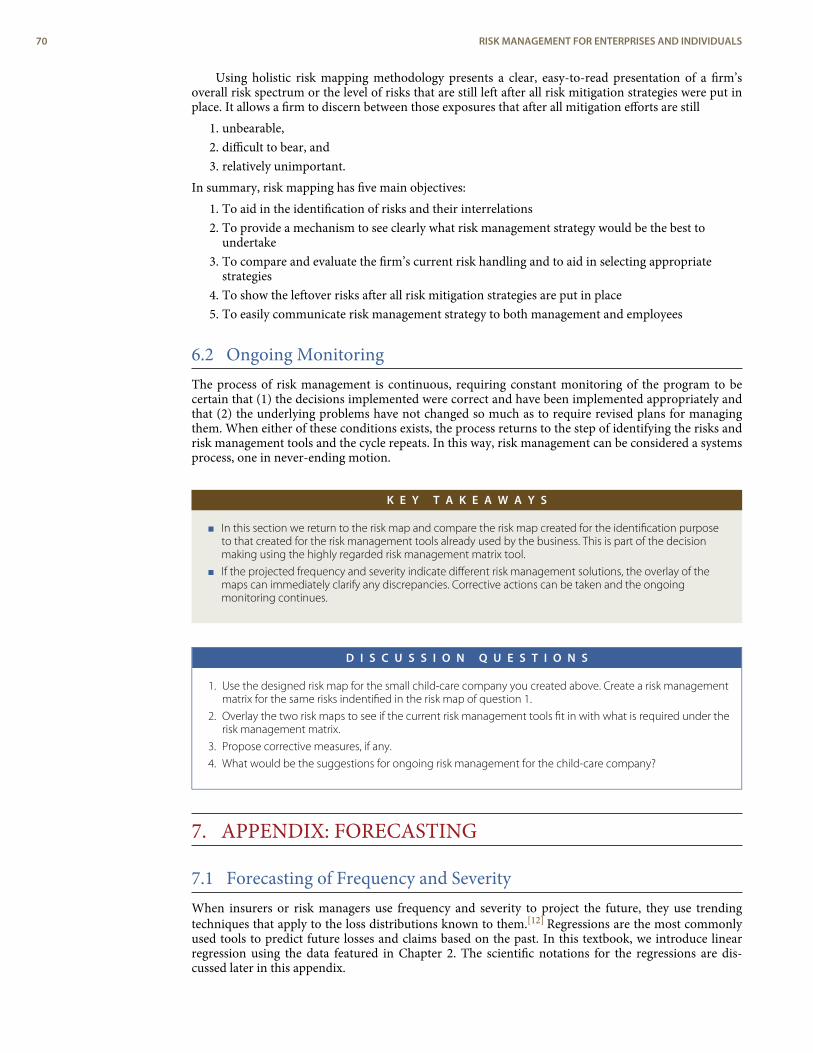
Using holistic risk mapping methodology presents a clear, easy-to-read presentation of a firm’soverall risk spectrum or the level of risks that are still left after all risk mitigation strategies were put inplace. It allows a firm to discern between those exposures that after all mitigation efforts are still
1. unbearable,2. difficult to bear, and3. relatively unimportant.
In summary, risk mapping has five main objectives:1. To aid in the identification of risks and their interrelations2. To provide a mechanism to see clearly what risk management strategy would be the best to
undertake3. To compare and evaluate the firm’s current risk handling and to aid in selecting appropriate
strategies4. To show the leftover risks after all risk mitigation strategies are put in place5. To easily communicate risk management strategy to both management and employees
6.2 Ongoing MonitoringThe process of risk management is continuous, requiring constant monitoring of the program to becertain that (1) the decisions implemented were correct and have been implemented appropriately andthat (2) the underlying problems have not changed so much as to require revised plans for managingthem. When either of these conditions exists, the process returns to the step of identifying the risks andrisk management tools and the cycle repeats. In this way, risk management can be considered a systemsprocess, one in never-ending motion.
K E Y T A K E A W A Y S
< In this section we return to the risk map and compare the risk map created for the identification purposeto that created for the risk management tools already used by the business. This is part of the decisionmaking using the highly regarded risk management matrix tool.
< If the projected frequency and severity indicate different risk management solutions, the overlay of themaps can immediately clarify any discrepancies. Corrective actions can be taken and the ongoingmonitoring continues.
D I S C U S S I O N Q U E S T I O N S
1. Use the designed risk map for the small child-care company you created above. Create a risk managementmatrix for the same risks indentified in the risk map of question 1.
2. Overlay the two risk maps to see if the current risk management tools fit in with what is required under therisk management matrix.
3. Propose corrective measures, if any.
4. What would be the suggestions for ongoing risk management for the child-care company?
7. APPENDIX: FORECASTING
7.1 Forecasting of Frequency and SeverityWhen insurers or risk managers use frequency and severity to project the future, they use trendingtechniques that apply to the loss distributions known to them.[12] Regressions are the most commonlyused tools to predict future losses and claims based on the past. In this textbook, we introduce linearregression using the data featured in Chapter 2. The scientific notations for the regressions are dis-cussed later in this appendix.
70 RISK MANAGEMENT FOR ENTERPRISES AND INDIVIDUALS
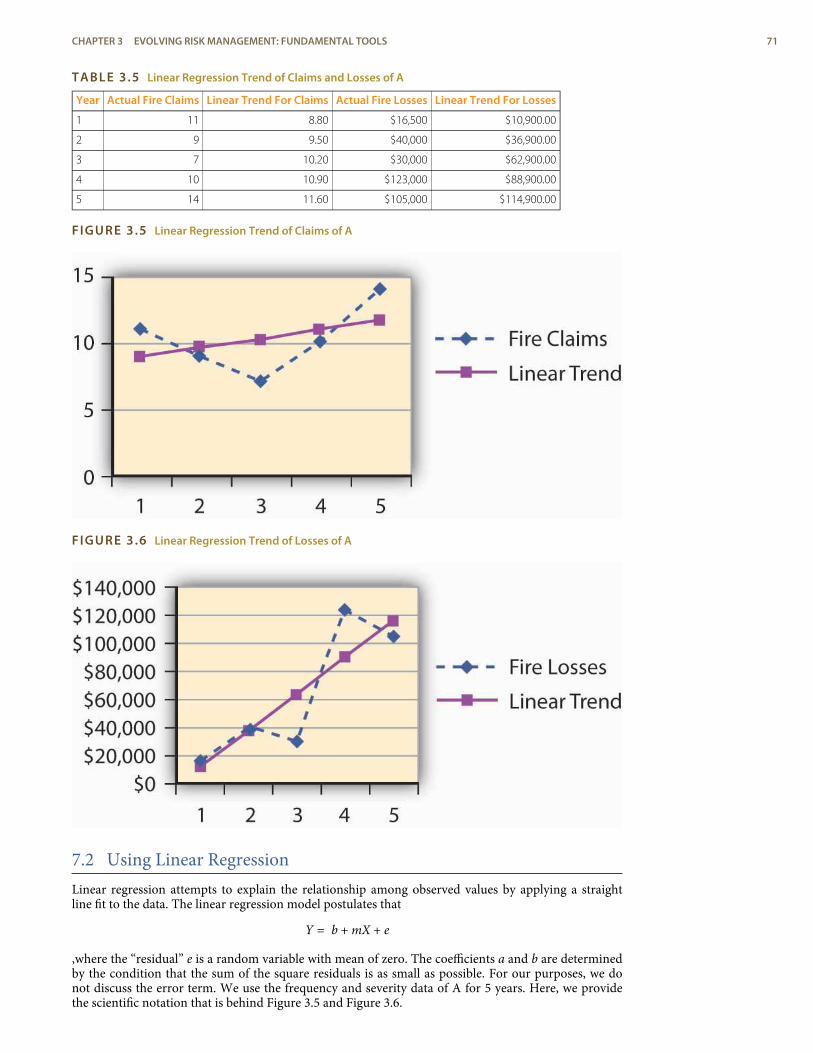
TABLE 3.5 Linear Regression Trend of Claims and Losses of A
Year Actual Fire Claims Linear Trend For Claims Actual Fire Losses Linear Trend For Losses
1 11 8.80 $16,500 $10,900.00
2 9 9.50 $40,000 $36,900.00
3 7 10.20 $30,000 $62,900.00
4 10 10.90 $123,000 $88,900.00
5 14 11.60 $105,000 $114,900.00
FIGURE 3.5 Linear Regression Trend of Claims of A
FIGURE 3.6 Linear Regression Trend of Losses of A
7.2 Using Linear RegressionLinear regression attempts to explain the relationship among observed values by applying a straightline fit to the data. The linear regression model postulates that
Y = b + mX + e
,where the “residual” e is a random variable with mean of zero. The coefficients a and b are determinedby the condition that the sum of the square residuals is as small as possible. For our purposes, we donot discuss the error term. We use the frequency and severity data of A for 5 years. Here, we providethe scientific notation that is behind Figure 3.5 and Figure 3.6.
CHAPTER 3 EVOLVING RISK MANAGEMENT: FUNDAMENTAL TOOLS 71
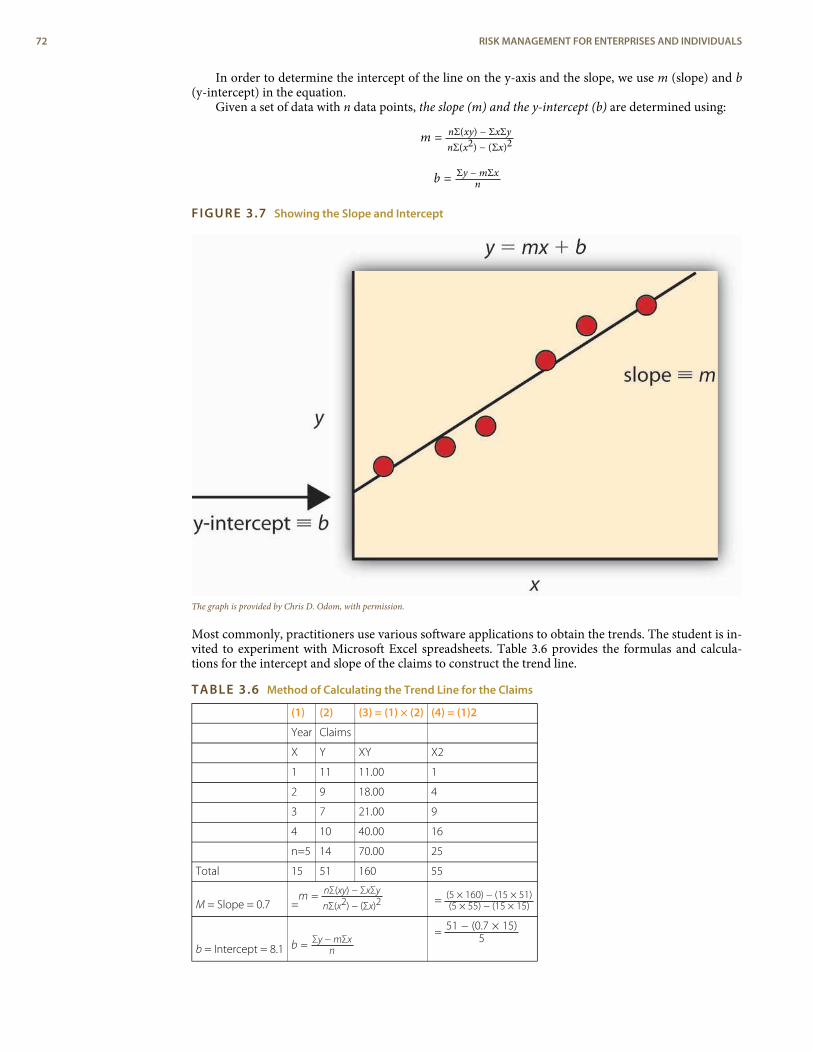
In order to determine the intercept of the line on the y-axis and the slope, we use m (slope) and b(y-intercept) in the equation.
Given a set of data with n data points, the slope (m) and the y-intercept (b) are determined using:
m = nΣ(xy) − ΣxΣynΣ(x2) − (Σx)2
b = Σy − mΣxn
FIGURE 3.7 Showing the Slope and Intercept
The graph is provided by Chris D. Odom, with permission.
Most commonly, practitioners use various software applications to obtain the trends. The student is in-vited to experiment with Microsoft Excel spreadsheets. Table 3.6 provides the formulas and calcula-tions for the intercept and slope of the claims to construct the trend line.
TABLE 3.6 Method of Calculating the Trend Line for the Claims
(1) (2) (3) = (1) × (2) (4) = (1)2
Year Claims
X Y XY X2
1 11 11.00 1
2 9 18.00 4
3 7 21.00 9
4 10 40.00 16
n=5 14 70.00 25
Total 15 51 160 55
M = Slope = 0.7 =m = nΣ(xy) − ΣxΣy
nΣ(x2) − (Σx)2 = (5 × 160) − (15 × 51)(5 × 55) − (15 × 15)
b = Intercept = 8.1 b = Σy − mΣxn
= 51 − (0.7 × 15)5
72 RISK MANAGEMENT FOR ENTERPRISES AND INDIVIDUALS
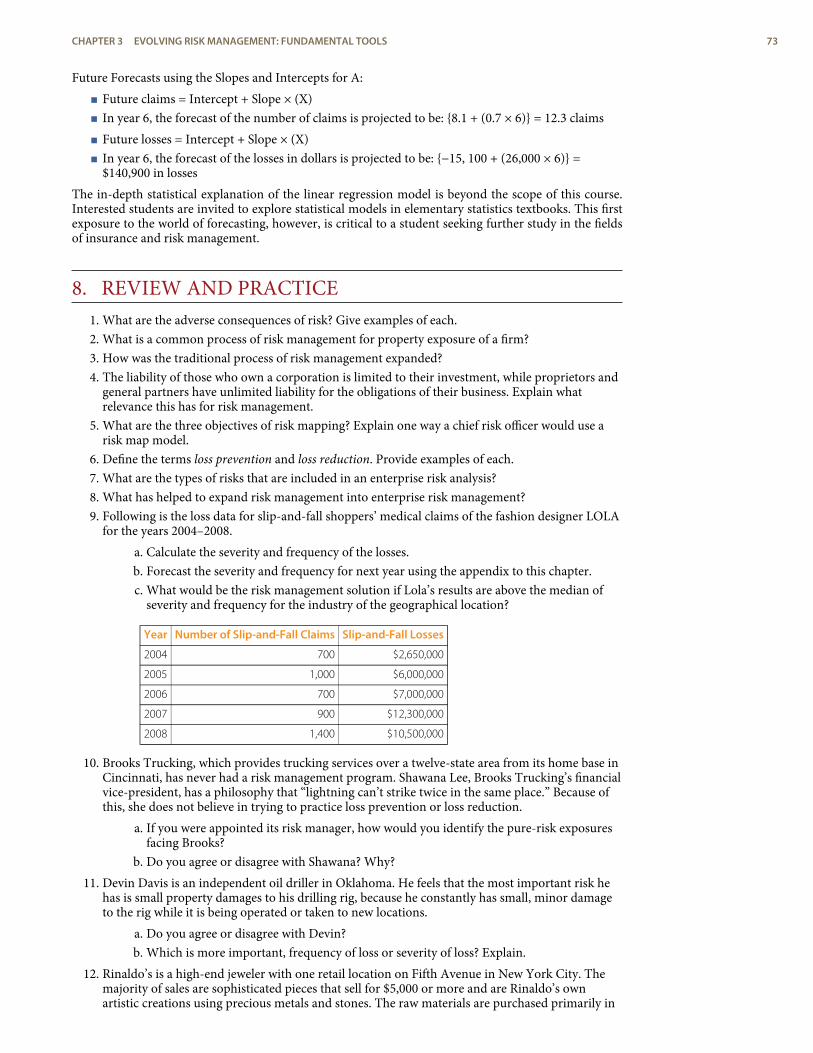
Future Forecasts using the Slopes and Intercepts for A:< Future claims = Intercept + Slope × (X)< In year 6, the forecast of the number of claims is projected to be: {8.1 + (0.7 × 6)} = 12.3 claims< Future losses = Intercept + Slope × (X)< In year 6, the forecast of the losses in dollars is projected to be: {−15, 100 + (26,000 × 6)} =
$140,900 in lossesThe in-depth statistical explanation of the linear regression model is beyond the scope of this course.Interested students are invited to explore statistical models in elementary statistics textbooks. This firstexposure to the world of forecasting, however, is critical to a student seeking further study in the fieldsof insurance and risk management.
8. REVIEW AND PRACTICE1. What are the adverse consequences of risk? Give examples of each.2. What is a common process of risk management for property exposure of a firm?3. How was the traditional process of risk management expanded?4. The liability of those who own a corporation is limited to their investment, while proprietors and
general partners have unlimited liability for the obligations of their business. Explain whatrelevance this has for risk management.
5. What are the three objectives of risk mapping? Explain one way a chief risk officer would use arisk map model.
6. Define the terms loss prevention and loss reduction. Provide examples of each.7. What are the types of risks that are included in an enterprise risk analysis?8. What has helped to expand risk management into enterprise risk management?9. Following is the loss data for slip-and-fall shoppers’ medical claims of the fashion designer LOLA
for the years 2004–2008.a. Calculate the severity and frequency of the losses.b. Forecast the severity and frequency for next year using the appendix to this chapter.c. What would be the risk management solution if Lola’s results are above the median of
severity and frequency for the industry of the geographical location?
Year Number of Slip-and-Fall Claims Slip-and-Fall Losses
2004 700 $2,650,000
2005 1,000 $6,000,000
2006 700 $7,000,000
2007 900 $12,300,000
2008 1,400 $10,500,000
10. Brooks Trucking, which provides trucking services over a twelve-state area from its home base inCincinnati, has never had a risk management program. Shawana Lee, Brooks Trucking’s financialvice-president, has a philosophy that “lightning can’t strike twice in the same place.” Because ofthis, she does not believe in trying to practice loss prevention or loss reduction.
a. If you were appointed its risk manager, how would you identify the pure-risk exposuresfacing Brooks?
b. Do you agree or disagree with Shawana? Why?11. Devin Davis is an independent oil driller in Oklahoma. He feels that the most important risk he
has is small property damages to his drilling rig, because he constantly has small, minor damageto the rig while it is being operated or taken to new locations.
a. Do you agree or disagree with Devin?b. Which is more important, frequency of loss or severity of loss? Explain.
12. Rinaldo’s is a high-end jeweler with one retail location on Fifth Avenue in New York City. Themajority of sales are sophisticated pieces that sell for $5,000 or more and are Rinaldo’s ownartistic creations using precious metals and stones. The raw materials are purchased primarily in
CHAPTER 3 EVOLVING RISK MANAGEMENT: FUNDAMENTAL TOOLS 73

Africa (gold, platinum, and diamonds) and South America (silver). Owing to a large amount ofinternational marketing efforts, Internet and catalog sales represent over 45 percent of the total$300 million in annual sales revenue. To accommodate his customers, Rinaldo will accept boththe U.S. dollar and other foreign currencies as a form of payment. Acting as an enterprise riskmanager consultant, create a risk map model to identify Rinaldo’s risks across the four basiccategories of business/strategic risk, operational risk, financial risk, and hazard risk.
74 RISK MANAGEMENT FOR ENTERPRISES AND INDIVIDUALS
1.
2.
3.
4.5.6.
7.
8.
9.
10.
11.
12.
ENDNOTES
Etti G. Baranoff, “Mapping the Evolution of Risk Management,” Contingencies (July/August 2004): 22–27.
Lee Ann Gjertsen, “‘Risk Mapping’ Helps RM’s Chart Solutions,” National Underwriter,Property & Casualty/Risk & Benefits Management Edition, June 7, 1999.
The exercise is abridged for demonstrative purposes. An actual holistic risk mappingmodel would include many more risk intersection points plotted along the fre-quency/severity X and Y axes.
Associated Press Newswire, May 22, 2002.
“Risk Whistle: Reputation Risk,” Swiss Re publication, http://www.swissre.com.
Geeta Anand, Jerry Arkon, and Chris Adams, “ImClone’s Ex-CEO Arrested, Chargedwith Insider Trading,” Wall Street Journal, June 13, 2002, 1.
Etti G. Baranoff, “Determinants in Risk-Financing Choices: The Case of Workers’ Com-pensation for Public School Districts,” Journal of Risk and Insurance, June 2000.
“A Hold Harmless Agreement is usually used where the Promisor’s actions could leadto a claim or liability to the Promisee. For example, the buyer of land wants to in-spect the property prior to close of escrow, and needs to conduct tests and studieson the property. In this case, the buyer would promise to indemnify the currentproperty owner from any claims resulting from the buyer’s inspection (i.e., injury to athird party because the buyer is drilling a hole; to pay for a mechanic’s lien because
the buyer hired a termite inspector, etc.). Another example is where a property own-er allows a caterer to use its property to cater an event. In this example, the CateringCompany (the “Promisor”) agrees to indemnify the property owner for any claimsarising from the Catering Company’s use of the property.” From Legaldocs, a divisionof U.S.A. Law Publications, Inc., http://www.legaldocs.com/docs/holdha_1.mv.
A surety bond is a three-party instrument between a surety, the contractor, and theproject owner. The agreement binds the contractor to comply with the terms andconditions of a contract. If the contractor is unable to successfully perform the con-tract, the surety assumes the contractor’s responsibilities and ensures that the pro-ject is completed.
President Reagan signed into law the Liability Risk Retention Act in October 1986 (anamendment to the Product Liability Risk Retention Act of 1981). The act permitsformation of retention groups (a special form of captive) with fewer restrictions thanexisted before. The retention groups are similar to association captives. The act per-mits formation of such groups in the U.S. under more favorable conditions than haveexisted generally for association captives. The act may be particularly helpful to smallbusinesses that could not feasibly self-insure on their own but can do so within adesignated group. How extensive will be the use of risk retention groups is yet to beseen. As of the writing of this text there are efforts to amend the act.
Etti G. Baranoff, “Determinants in Risk-Financing Choices: The Case of Workers’ Com-pensation for Public School Districts,” Journal of Risk and Insurance, June 2000.
Forecasting is part of the Associate Risk Manager designation under the Risk Assess-ment course using the book: Baranoff Etti, Scott Harrington, and Greg Niehaus, RiskAssessment (Malvern, PA: American Institute for Chartered Property Casualty Under-writers/Insurance Institute of America, 2005).
CHAPTER 3 EVOLVING RISK MANAGEMENT: FUNDAMENTAL TOOLS 75

76 RISK MANAGEMENT FOR ENTERPRISES AND INDIVIDUALS
C H A P T E R 4Risk Attitudes: ExpectedUtility Theory and Demandfor HedgingAuthored by Puneet Prakash, Virginia Commonwealth University
Whenever we look into risks, risk measures, and risk management, we must always view these in a greater
context. In this chapter, we focus on the risk within the “satisfaction” value maximization for individual and firms.
The value here is measured economically. So, how do economists measure the value of satisfaction or happiness?
Can we even measure satisfaction or happiness? Whatever the philosophical debate might be on the topic,
economists have tried to measure the level of satisfaction.[1] What economists succeeded in doing is to compare
levels of satisfaction an individual achieves when confronted with two or more choices. For example, we suppose
that everyone likes to eat gourmet food at five-star hotels, drink French wine, vacation in exotic places, and drive
luxury cars. For an economist, all these goods are assumed to provide satisfaction, some more than others. So while
eating a meal at home gives us pleasure, eating exotic food at an upscale restaurant gives us an even higher level
of satisfaction.
The problem with the quantity and quality of goods consumed is that we can find no common unit of
measurement. That prevents economists from comparing levels of satisfaction from consumption of commodities
that are different as apples are different from oranges. So does drinking tea give us the same type of satisfaction as
eating cake? Or snorkeling as much as surfing?
To get around the problem of comparing values of satisfaction from noncomparable items, we express the
value levels of satisfaction as a function of wealth. And indeed, we can understand intuitively that the level of
wealth is linked directly to the quantity and quality of consumption a person can achieve. Notice the quality and
level of consumption a person achieves is linked to the amount of wealth or to the individual’s budget. Economists
consider that greater wealth can generate greater satisfaction. Therefore, a person with greater levels of wealth is
deemed to be happier under the condition of everything else being equal between two individuals.[2] We can link
each person’s satisfaction level indirectly to that person’s wealth. The higher the person’s wealth, the greater his or
her satisfaction level is likely to be.
Economists use the term “utils” to gauge a person’s satisfaction level. As a unit of measure, utils are similar to
“ohms” as a measure of resistance in electrical engineering, except that utils cannot be measured with wires
attached to a person’s head!
utility theory
A theory postulated ineconomics to explainbehavior of individuals basedon the premise people canconsistently rank order theirchoices depending upontheir preferences.
This notion that an individual derives satisfaction from wealth seems to work more often than not in economic
situations. The economic theory that links the level of satisfaction to a person’s wealth level, and thus to
consumption levels, is called utility theory. Its basis revolves around individuals’ preferences, but we must use
caution as we apply utility theory.[3]
In this chapter, we will study the utility theory. If utility theory is designed to measure satisfaction, and since
every individual always tries to maximize satisfaction, it’s reasonable to expect (under utility theory) that each
person tries to maximize his or her own utility.
Then we will extend utility to one of its logical extensions as applied to uncertain situations: expected utility
(EU henceforth). So while utility theory deals with situations in which there is no uncertainty, the EU theory deals
with choices individuals make when the outcomes they face are uncertain. As we shall see, if individuals maximize
utility under certainty, they will also attempt to maximize EU under uncertainty.
However, individuals’ unabashed EU maximization is not always the case. Other models of human behavior
describe behavior in which the observed choices of an individual vary with the decision rule to maximize EU. So
why would a mother jump into a river to save her child, even if she does not know how to swim? Economists still
confront these and other such questions. They have provided only limited answers to such questions thus far.
Hence, we will touch upon some uncertainty-laden situations wherein individuals’ observed behavior departs
from the EU maximization principle. Systematic departures in behavior from the EU principle stem from “biases”
that people exhibit, and we shall discuss some of these biases. Such rationales of observed behavior under
uncertainty are termed “behavioral” explanations, rather than “rational” explanations—explanations that explore EU
behavior of which economists are so fond.
In this chapter, we will apply the EU theory to individuals’ hedging decisions/purchase of insurance. Let’s start
by asking, Why would anyone buy insurance? When most people face that question, they respond in one of three
ways. One set says that insurance provides peace of mind (which we can equate to a level of satisfaction). Others
respond more bluntly and argue that if it were not for regulation they’d never buy insurance. The second reply is
one received mostly from younger adults. Still others posit that insurance is a “waste of money,” since they pay
premiums up front and insurance never pays up in the absence of losses. To all those who argue based upon the
third response, one might say, would they rather have a loss for the sake of recovering their premiums? We look to
EU theory for some answers, and we will find that even if governments did not make purchase of insurance
mandatory, the product would still have existed. Risk-averse individuals would always demand insurance for the
peace of mind it confers.
Thus we will briefly touch upon the ways that insurance is useful, followed by a discussion of how some
information problems affect the insurance industry more than any other industry. “Information asymmetry”
problems arise, wherein one economic agent in a contract is better informed than the other party to the same
contract. The study of information asymmetries has become a full-time occupation for some economics
researchers. Notably, professors George A. Akerlof, A. Michael Spence, and Joseph E. Stiglitz were awarded the
Nobel Prize in Economics in 2001 for their analyses of information asymmetry problems.
78 RISK MANAGEMENT FOR ENTERPRISES AND INDIVIDUALS
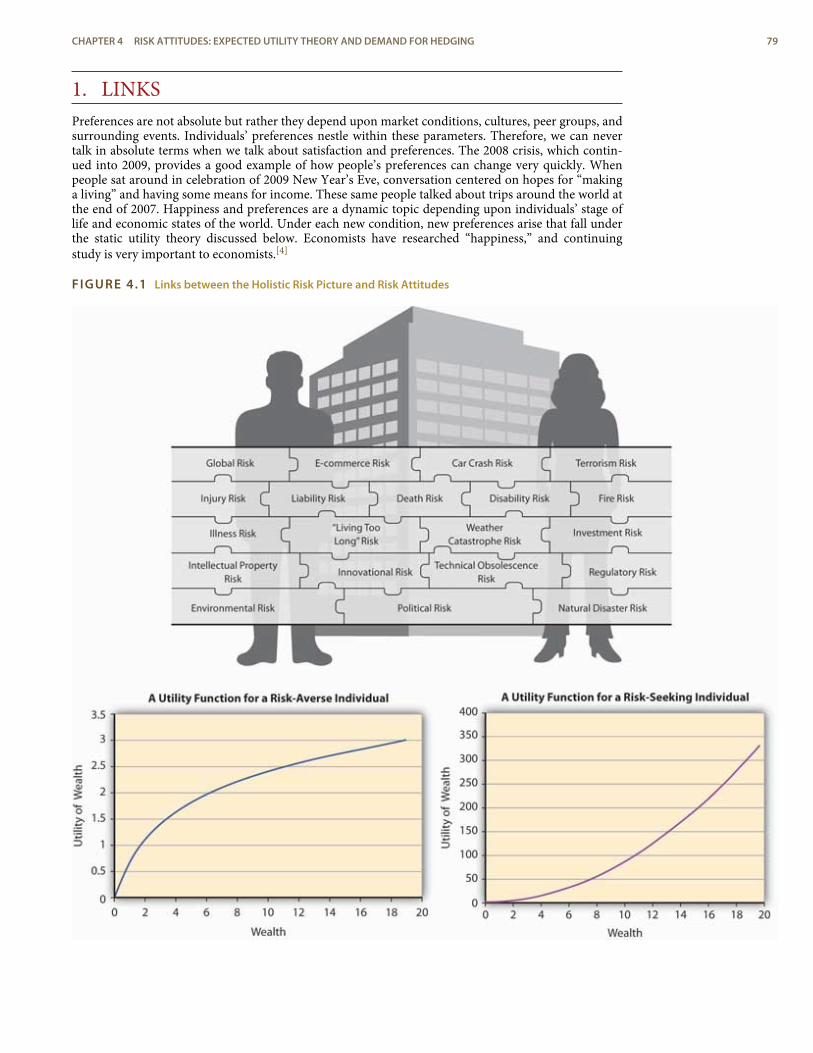
1. LINKSPreferences are not absolute but rather they depend upon market conditions, cultures, peer groups, andsurrounding events. Individuals’ preferences nestle within these parameters. Therefore, we can nevertalk in absolute terms when we talk about satisfaction and preferences. The 2008 crisis, which contin-ued into 2009, provides a good example of how people’s preferences can change very quickly. Whenpeople sat around in celebration of 2009 New Year’s Eve, conversation centered on hopes for “makinga living” and having some means for income. These same people talked about trips around the world atthe end of 2007. Happiness and preferences are a dynamic topic depending upon individuals’ stage oflife and economic states of the world. Under each new condition, new preferences arise that fall underthe static utility theory discussed below. Economists have researched “happiness,” and continuingstudy is very important to economists.[4]
FIGURE 4.1 Links between the Holistic Risk Picture and Risk Attitudes
CHAPTER 4 RISK ATTITUDES: EXPECTED UTILITY THEORY AND DEMAND FOR HEDGING 79
utility theory
A theory postulated ineconomics to explainbehavior of individuals basedon the premise people canconsistently order rank theirchoices depending upontheir preferences.
positive theory
Theory that seeks to explainan individual’s observedbehavior and choices.
normative theory
Theory that dictates thatpeople should behave in themanner prescribed by it.
utility function
A mathematical formulationthat ranks the preferences ofthe individual in terms ofsatisfaction differentconsumption bundlesprovide.
ordinal utility
Utility that can only representrelative levels of satisfactionbetween two or morealternatives, that is, rankorders them.
cardinal utility
Utility that can represent theabsolute level of satisfaction.
2. UTILITY THEORY
L E A R N I N G O B J E C T I V E S
< In this section we discuss economists’ utility theory.< You will learn about assumptions that underlie individual preferences, which can then be
mapped onto a utility “function,” reflecting the satisfaction level associated with individuals’preferences.
< Further, we will explore how individuals maximize utility (or satisfaction).
Utility theory bases its beliefs upon individuals’ preferences. It is a theory postulated in economics toexplain behavior of individuals based on the premise people can consistently rank order their choicesdepending upon their preferences. Each individual will show different preferences, which appear to behard-wired within each individual. We can thus state that individuals’ preferences are intrinsic. Anytheory, which proposes to capture preferences, is, by necessity, abstraction based on certain assump-tions. Utility theory is a positive theory that seeks to explain the individuals’ observed behavior andchoices.[5] This contrasts with a normative theory, one that dictates that people should behave in themanner prescribed by it. Instead, it is only since the theory itself is positive, after observing the choicesthat individuals make, we can draw inferences about their preferences. When we place certain restric-tions on those preferences, we can represent them analytically using a utility function—a mathemat-ical formulation that ranks the preferences of the individual in terms of satisfaction different consump-tion bundles provide. Thus, under the assumptions of utility theory, we can assume that people be-haved as if they had a utility function and acted according to it. Therefore, the fact that a person doesnot know his/her utility function, or even denies its existence, does not contradict the theory. Econom-ists have used experiments to decipher individuals’ utility functions and the behavior that underlies in-dividuals’ utility.
To begin, assume that an individual faces a set of consumption “bundles.” We assume that indi-viduals have clear preferences that enable them to “rank order” all bundles based on desirability, that is,the level of satisfaction each bundle shall provide to each individual. This rank ordering based on pref-erences tells us the theory itself has ordinal utility—it is designed to study relative satisfaction levels.As we noted earlier, absolute satisfaction depends upon conditions; thus, the theory by default cannothave cardinal utility, or utility that can represent the absolute level of satisfaction. To make this the-ory concrete, imagine that consumption bundles comprise food and clothing for a week in all differentcombinations, that is, food for half a week, clothing for half a week, and all other possiblecombinations.
The utility theory then makes the following assumptions:
80 RISK MANAGEMENT FOR ENTERPRISES AND INDIVIDUALS
completeness
Property in which anindividual’s preferencesenable him/her to compareany given consumptionbundle with any otherbundle.
monotonicity assumption
The assumption that moreconsumption is always better.
mix-is-better assumption
The assumption that a mix ofconsumption bundles isalways better thanstand-alone choices.
rationality
The assumption thatindividuals’ preferences avoidany kind of circularity.
well-behaved utilityfunction
A representation of thepreferences of the individualthat satisfies the assumptionsof completeness,monotonicity, mix-is-better,and rationality.
1. Completeness: Individuals can rank order all possible bundles. Rank ordering implies that thetheory assumes that, no matter how many combinations of consumption bundles are placed infront of the individual, each individual can always rank them in some order based on preferences.This, in turn, means that individuals can somehow compare any bundle with any other bundleand rank them in order of the satisfaction each bundle provides. So in our example, half a week offood and clothing can be compared to one week of food alone, one week of clothing alone, or anysuch combination. Mathematically, this property wherein an individual’s preferences enable himor her to compare any given bundle with any other bundle is called the completeness propertyof preferences.
2. More-is-better: Assume an individual prefers consumption of bundle A of goods to bundle B.Then he is offered another bundle, which contains more of everything in bundle A, that is, thenew bundle is represented by αA where α = 1. The more-is-better assumption says thatindividuals prefer αA to A, which in turn is preferred to B, but also A itself. For our example, ifone week of food is preferred to one week of clothing, then two weeks of food is a preferredpackage to one week of food. Mathematically, the more-is-better assumption is called themonotonicity assumption on preferences. One can always argue that this assumption breaksdown frequently. It is not difficult to imagine that a person whose stomach is full would turndown additional food. However, this situation is easily resolved. Suppose the individual is giventhe option of disposing of the additional food to another person or charity of his or her choice. Inthis case, the person will still prefer more food even if he or she has eaten enough. Thus under themonotonicity assumption, a hidden property allows costless disposal of excess quantities of anybundle.
3. Mix-is-better: Suppose an individual is indifferent to the choice between one week of clothingalone and one week of food. Thus, either choice by itself is not preferred over the other. The“mix-is-better” assumption about preferences says that a mix of the two, say half-week of foodmixed with half-week of clothing, will be preferred to both stand-alone choices. Thus, a glass ofmilk mixed with Milo (Nestlè’s drink mix), will be preferred to milk or Milo alone. The mix-is-better assumption is called the “convexity” assumption on preferences, that is, preferences areconvex.
4. Rationality: This is the most important and controversial assumption that underlies all of utilitytheory. Under the assumption of rationality, individuals’ preferences avoid any kind ofcircularity; that is, if bundle A is preferred to B, and bundle B is preferred to C, then A is alsopreferred to C. Under no circumstances will the individual prefer C to A. You can likely see whythis assumption is controversial. It assumes that the innate preferences (rank orderings ofbundles of goods) are fixed, regardless of the context and time.
If one thinks of preference orderings as comparative relationships, then it becomes simpler to constructexamples where this assumption is violated. So, in “beats”—as in A beat B in college football. These arerelationships that are easy to see. For example, if University of Florida beats Ohio State, and Ohio Statebeats Georgia Tech, it does not mean that Florida beats Georgia Tech. Despite the restrictive nature ofthe assumption, it is a critical one. In mathematics, it is called the assumption of transitivity ofpreferences.
Whenever these four assumptions are satisfied, then the preferences of the individual can be rep-resented by a well-behaved utility function.[6] Note that the assumptions lead to “a” function, not“the” function. Therefore, the way that individuals represent preferences under a particular utilityfunction may not be unique. Well-behaved utility functions explain why any comparison of individualpeople’s utility functions may be a futile exercise (and the notion of cardinal utility misleading). Non-etheless, utility functions are valuable tools for representing the preferences of an individual, providedthe four assumptions stated above are satisfied. For the remainder of the chapter we will assume thatpreferences of any individual can always be represented by a well-behaved utility function. As we men-tioned earlier, well-behaved utility depends upon the amount of wealth the person owns.
Utility theory rests upon the idea that people behave as if they make decisions by assigning imagin-ary utility values to the original monetary values. The decision maker sees different levels of monetaryvalues, translates these values into different, hypothetical terms (“utils”), processes the decision in util-ity terms (not in wealth terms), and translates the result back to monetary terms. So while we observeinputs to and results of the decision in monetary terms, the decision itself is made in utility terms. Andgiven that utility denotes levels of satisfaction, individuals behave as if they maximize the utility, notthe level of observed dollar amounts.
While this may seem counterintuitive, let’s look at an example that will enable us to appreciate thisdistinction better. More importantly, it demonstrates why utility maximization, rather than wealthmaximization, is a viable objective. The example is called the “St. Petersburg paradox.” But before weturn to that example, we need to review some preliminaries of uncertainty: probability and statistics.
CHAPTER 4 RISK ATTITUDES: EXPECTED UTILITY THEORY AND DEMAND FOR HEDGING 81
K E Y T A K E A W A Y S
< In economics, utility theory governs individual decision making. The student must understand an intuitiveexplanation for the assumptions: completeness, monotonicity, mix-is-better, and rationality (also calledtransitivity).
< Finally, students should be able to discuss and distinguish between the various assumptions underlyingthe utility function.
D I S C U S S I O N Q U E S T I O N S
1. Utility theory is a preference-based approach that provides a rank ordering of choices. Explain thisstatement.
2. List and describe in your own words the four axioms/assumptions that lead to the existence of a utilityfunction.
3. What is a “util” and what does it measure?
3. UNCERTAINTY, EXPECTED VALUE, AND FAIR GAMES
L E A R N I N G O B J E C T I V E S
< In this section we discuss the notion of uncertainty. Mathematical preliminaries discussed inthis section form the basis for analysis of individual decision making in uncertain situations.
< The student should pick up the tools of this section, as we will apply them later.
As we learned in the chapters Chapter 1 and Chapter 2, risk and uncertainty depend upon one another.The origins of the distinction go back to the Mr. Knight,[7] who distinguished between risk and uncer-tainty, arguing that measurable uncertainty is risk. In this section, since we focus only on measurableuncertainty, we will not distinguish between risk and uncertainty and use the two termsinterchangeably.
As we described in Chapter 2, the study of uncertainty originated in games of chance. So when weplay games of dice, we are dealing with outcomes that are inherently uncertain. The branch of scienceof uncertain outcomes is probability and statistics. Notice that the analysis of probability and statisticsapplies only if outcomes are uncertain. When a student registers for a class but does not attend any lec-tures nor does any assigned work or test, only one outcome is possible: a failing grade. On the otherhand, if the student attends all classes and scores 100 percent on all tests and assignments, then tooonly one outcome is possible, an “A” grade. In these extreme situations, no uncertainty arises with theoutcomes. But between these two extremes lies the world of uncertainty. Students often do research onthe instructor and try to get a “feel” for the chance that they will make a particular grade if they registerfor an instructor’s course.
Even though we covered some of this discussion of probability and uncertainty in Chapter 2, werepeat it here for reinforcement. Figuring out the chance, in mathematical terms, is the same as calcu-lating the probability of an event. To compute a probability empirically, we repeat an experiment withuncertain outcomes (called a random experiment) and count the number of times the event of interesthappens, say n, in the N trials of the experiment. The empirical probability of the event then equalsn/N. So, if one keeps a log of the number of times a computer crashes in a day and records it for 365days, the probability of the computer crashing on a day will be the sum of all of computer crashes on adaily basis (including zeroes for days it does not crash at all) divided by 365.
For some problems, the probability can be calculated using mathematical deduction. In thesecases, we can figure out the probability of getting a head on a coin toss, two aces when two cards arerandomly chosen from a deck of 52 cards, and so on (see the example of the dice in Chapter 2). Wedon’t have to conduct a random experiment to actually compute the mathematical probability, as is thecase with empirical probability.
Finally, as strongly suggested before, subjective probability is based on a person’s beliefs and ex-periences, as opposed to empirical or mathematical probability. It may also depend upon a person’sstate of mind. Since beliefs may not always be rational, studying behavior using subjective probabilitiesbelongs to the realm of behavioral economics rather than traditional rationality-based economics.
82 RISK MANAGEMENT FOR ENTERPRISES AND INDIVIDUALS
expected value
The sum of the products oftwo numbers, the outcomesand their associatedprobabilities.
fair game
Game in which the cost ofplaying equals the expectedwinnings of the game, so thatnet value of the game equalszero.
So consider a lottery (a game of chance) wherein several outcomes are possible with defined prob-abilities. Typically, outcomes in a lottery consist of monetary prizes. Returning to our dice example ofChapter 2, let’s say that when a six-faced die is rolled, the payoffs associated with the outcomes are $1 ifa 1 turns up, $2 for a 2, …, and $6 for a 6. Now if this game is played once, one and only one amountcan be won—$1, $2, and so on. However, if the same game is played many times, what is the amountthat one can expect to win?
Mathematically, the answer to any such question is very straightforward and is given by the expec-ted value of the game.
In a game of chance, if W1, W2, … , WN are the N outcomes possible with probabilitiesπ1, π2, … , πN , then the expected value of the game (G) is
E(U) =
∞
∑i = 1
πiU(Wi) = 12 × ln(2) + 1
4 × ln(4) + … =
∞
∑i = 1
12iln(2i).
The computation can be extended to expected values of any uncertain situation, say losses, provided weknow the outcome numbers and their associated probabilities. The probabilities sum to 1, that is,
N
∑i = 1
πi = π1 + … + πN = 1.
While the computation of expected value is important, equally important is notion behind expectedvalues. Note that we said that when it comes to the outcome of a single game, only one amount can bewon, either $1, $2, …, $6. But if the game is played over and over again, then one can expect to winE(G) = 1
61 + 162 … + 1
66 = $3.50 per game. Often—like in this case—the expected value is not one ofthe possible outcomes of the distribution. In other words, the probability of getting $3.50 in the abovelottery is zero. Therefore, the concept of expected value is a long-run concept, and the hidden assump-tion is that the lottery is played many times. Secondly, the expected value is a sum of the products oftwo numbers, the outcomes and their associated probabilities. If the probability of a large outcome isvery high then the expected value will also be high, and vice versa.
Expected value of the game is employed when one designs a fair game. A fair game, actuariallyspeaking, is one in which the cost of playing the game equals the expected winnings of the game, sothat net value of the game equals zero. We would expect that people are willing to play all fair valuegames. But in practice, this is not the case. I will not pay $500 for a lucky outcome based on a coin toss,even if the expected gains equal $500. No game illustrates this point better than the St. Petersburgparadox.
The paradox lies in a proposed game wherein a coin is tossed until “head” comes up. That is whenthe game ends. The payoff from the game is the following: if head appears on the first toss, then $2 ispaid to the player, if it appears on the second toss then $4 is paid, if it appears on the third toss, then $8,and so on, so that if head appears on the nth toss then the payout is $2n. The question is how muchwould an individual pay to play this game?
Let us try and apply the fair value principle to this game, so that the cost an individual is willing tobear should equal the fair value of the game. The expected value of the game E(G) is calculated below.
The game can go on indefinitely, since the head may never come up in the first million or billiontrials. However, let us look at the expected payoff from the game. If head appears on the first try, the
probability of that happening is12 , and the payout is $2. If it happens on the second try, it means the
first toss yielded a tail (T) and the second a head (H). The probability of TH combination = 12 × 1
2 = 14 ,
and the payoff is $4. Then if H turns up on the third attempt, it implies the sequence of outcomes is
TTH, and the probability of that occurring is12 × 1
2 × 12 = 1
8 with a payoff of $8. We can continue withthis inductive analysis ad infinitum. Since expected is the sum of all products of outcomes and their
corresponding probabilities, E(G) = 12 × 2 + 1
4 × 4 + 18 × 8 + … = ∞.
It is evident that while the expected value of the game is infinite, not even the Bill Gateses andWarren Buffets of the world will give even a thousand dollars to play this game, let alone billions.
Daniel Bernoulli was the first one to provide a solution to this paradox in the eighteenth century.His solution was that individuals do not look at the expected wealth when they bid a lottery price, butthe expected utility of the lottery is the key. Thus, while the expected wealth from the lottery may be in-finite, the expected utility it provides may be finite. Bernoulli termed this as the “moral value” of the
CHAPTER 4 RISK ATTITUDES: EXPECTED UTILITY THEORY AND DEMAND FOR HEDGING 83
expected utility
A construct to explain thelevel of satisfaction a persongets when faced withuncertain choices.
game. Mathematically, Bernoulli’s idea can be expressed with a utility function, which provides a rep-resentation of the satisfaction level the lottery provides.
Bernoulli used U(W) = ln(W) to represent the utility that this lottery provides to an individualwhere W is the payoff associated with each event H, TH, TTH, and so on, then the expected utilityfrom the game is given by
E(U) =
∞
∑i = 1
πiU(Wi) = 12 × ln(2) + 1
4 × ln(4) + … =
∞
∑i = 1
12iln(2i,)
which can be shown to equal 1.39 after some algebraic manipulation. Since the expected utility that thislottery provides is finite (even if the expected wealth is infinite), individuals will be willing to pay only afinite cost for playing this lottery.
The next logical question to ask is, What if the utility was not given as natural log of wealth byBernoulli but something else? What is that about the natural log function that leads to a finite expectedutility? This brings us to the issue of expected utility and its central place in decision making under un-certainty in economics.
K E Y T A K E A W A Y S
< Students should be able to explain probability as a measure of uncertainty in their own words.
< Moreover, the student should also be able to explain that any expected value is the sum of product ofprobabilities and outcomes and be able to compute expected values.
D I S C U S S I O N Q U E S T I O N S
1. Define probability. In how many ways can one come up with a probability estimate of an event? Describe.
2. Explain the need for utility functions using St. Petersburg paradox as an example.
3. Suppose a six-faced fair die with numbers 1–6 is rolled. What is the number you expect to obtain?
4. What is an actuarially fair game?
4. CHOICE UNDER UNCERTAINTY: EXPECTED UTILITYTHEORY
L E A R N I N G O B J E C T I V E S
< In this section the student learns that an individual’s objective is to maximize expected utilitywhen making decisions under uncertainty.
< We also learn that people are risk averse, risk neutral, or risk seeking (loving).
We saw earlier that in a certain world, people like to maximize utility. In a world of uncertainty, itseems intuitive that individuals would maximize expected utility. This refers to a construct used toexplain the level of satisfaction a person gets when faced with uncertain choices. The intuition isstraightforward, proving it axiomatically was a very challenging task. John von Neumann and OskarMorgenstern (1944) advocated an approach that leads us to a formal mathematical representation ofmaximization of expected utility.
We have also seen that a utility function representation exists if the four assumptions discussedabove hold. Messrs. von Neumann and Morgenstern added two more assumptions and came up withan expected utility function that exists if these axioms hold. While the discussions about these assump-tions[8] is beyond the scope of the text, it suffices to say that the expected utility function has the form
84 RISK MANAGEMENT FOR ENTERPRISES AND INDIVIDUALS
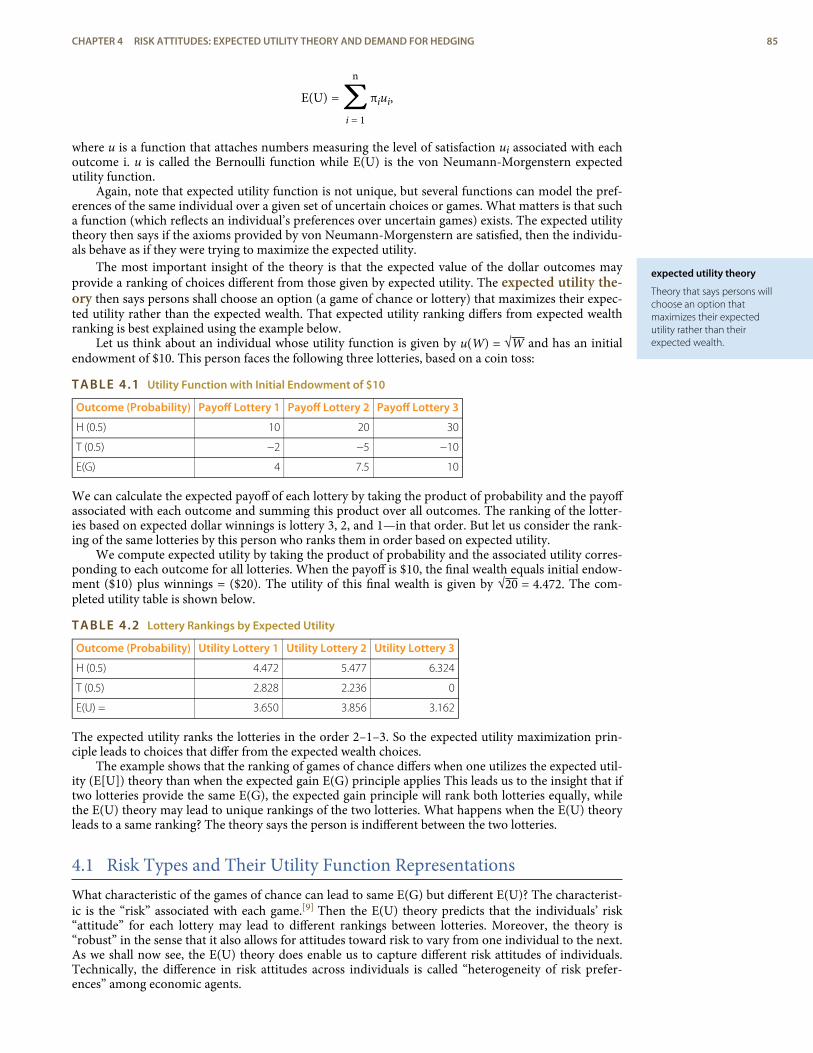
expected utility theory
Theory that says persons willchoose an option thatmaximizes their expectedutility rather than theirexpected wealth.
E(U) =
n
∑i = 1
πiui,
where u is a function that attaches numbers measuring the level of satisfaction ui associated with eachoutcome i. u is called the Bernoulli function while E(U) is the von Neumann-Morgenstern expectedutility function.
Again, note that expected utility function is not unique, but several functions can model the pref-erences of the same individual over a given set of uncertain choices or games. What matters is that sucha function (which reflects an individual’s preferences over uncertain games) exists. The expected utilitytheory then says if the axioms provided by von Neumann-Morgenstern are satisfied, then the individu-als behave as if they were trying to maximize the expected utility.
The most important insight of the theory is that the expected value of the dollar outcomes mayprovide a ranking of choices different from those given by expected utility. The expected utility the-ory then says persons shall choose an option (a game of chance or lottery) that maximizes their expec-ted utility rather than the expected wealth. That expected utility ranking differs from expected wealthranking is best explained using the example below.
Let us think about an individual whose utility function is given by u(W) = √W and has an initialendowment of $10. This person faces the following three lotteries, based on a coin toss:
TABLE 4.1 Utility Function with Initial Endowment of $10
Outcome (Probability) Payoff Lottery 1 Payoff Lottery 2 Payoff Lottery 3
H (0.5) 10 20 30
T (0.5) −2 −5 −10
E(G) 4 7.5 10
We can calculate the expected payoff of each lottery by taking the product of probability and the payoffassociated with each outcome and summing this product over all outcomes. The ranking of the lotter-ies based on expected dollar winnings is lottery 3, 2, and 1—in that order. But let us consider the rank-ing of the same lotteries by this person who ranks them in order based on expected utility.
We compute expected utility by taking the product of probability and the associated utility corres-ponding to each outcome for all lotteries. When the payoff is $10, the final wealth equals initial endow-ment ($10) plus winnings = ($20). The utility of this final wealth is given by √20 = 4.472. The com-pleted utility table is shown below.
TABLE 4.2 Lottery Rankings by Expected Utility
Outcome (Probability) Utility Lottery 1 Utility Lottery 2 Utility Lottery 3
H (0.5) 4.472 5.477 6.324
T (0.5) 2.828 2.236 0
E(U) = 3.650 3.856 3.162
The expected utility ranks the lotteries in the order 2–1–3. So the expected utility maximization prin-ciple leads to choices that differ from the expected wealth choices.
The example shows that the ranking of games of chance differs when one utilizes the expected util-ity (E[U]) theory than when the expected gain E(G) principle applies This leads us to the insight that iftwo lotteries provide the same E(G), the expected gain principle will rank both lotteries equally, whilethe E(U) theory may lead to unique rankings of the two lotteries. What happens when the E(U) theoryleads to a same ranking? The theory says the person is indifferent between the two lotteries.
4.1 Risk Types and Their Utility Function RepresentationsWhat characteristic of the games of chance can lead to same E(G) but different E(U)? The characterist-ic is the “risk” associated with each game.[9] Then the E(U) theory predicts that the individuals’ risk“attitude” for each lottery may lead to different rankings between lotteries. Moreover, the theory is“robust” in the sense that it also allows for attitudes toward risk to vary from one individual to the next.As we shall now see, the E(U) theory does enable us to capture different risk attitudes of individuals.Technically, the difference in risk attitudes across individuals is called “heterogeneity of risk prefer-ences” among economic agents.
CHAPTER 4 RISK ATTITUDES: EXPECTED UTILITY THEORY AND DEMAND FOR HEDGING 85
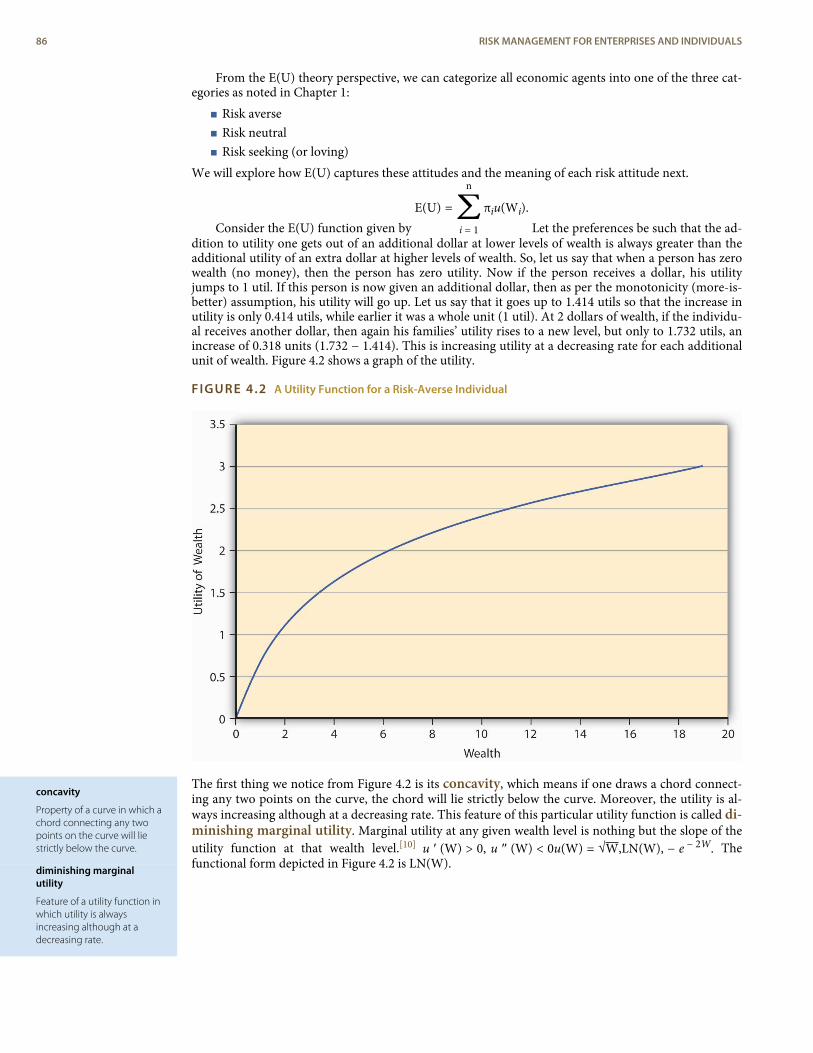
concavity
Property of a curve in which achord connecting any twopoints on the curve will liestrictly below the curve.
diminishing marginalutility
Feature of a utility function inwhich utility is alwaysincreasing although at adecreasing rate.
From the E(U) theory perspective, we can categorize all economic agents into one of the three cat-egories as noted in Chapter 1:
< Risk averse< Risk neutral< Risk seeking (or loving)
We will explore how E(U) captures these attitudes and the meaning of each risk attitude next.
Consider the E(U) function given byE(U) =
n
∑i = 1
πiu(Wi).Let the preferences be such that the ad-
dition to utility one gets out of an additional dollar at lower levels of wealth is always greater than theadditional utility of an extra dollar at higher levels of wealth. So, let us say that when a person has zerowealth (no money), then the person has zero utility. Now if the person receives a dollar, his utilityjumps to 1 util. If this person is now given an additional dollar, then as per the monotonicity (more-is-better) assumption, his utility will go up. Let us say that it goes up to 1.414 utils so that the increase inutility is only 0.414 utils, while earlier it was a whole unit (1 util). At 2 dollars of wealth, if the individu-al receives another dollar, then again his families’ utility rises to a new level, but only to 1.732 utils, anincrease of 0.318 units (1.732 − 1.414). This is increasing utility at a decreasing rate for each additionalunit of wealth. Figure 4.2 shows a graph of the utility.
FIGURE 4.2 A Utility Function for a Risk-Averse Individual
The first thing we notice from Figure 4.2 is its concavity, which means if one draws a chord connect-ing any two points on the curve, the chord will lie strictly below the curve. Moreover, the utility is al-ways increasing although at a decreasing rate. This feature of this particular utility function is called di-minishing marginal utility. Marginal utility at any given wealth level is nothing but the slope of theutility function at that wealth level.[10] u ′ (W) > 0, u ″ (W) < 0u(W) = √W,LN(W), − e − 2W. Thefunctional form depicted in Figure 4.2 is LN(W).
86 RISK MANAGEMENT FOR ENTERPRISES AND INDIVIDUALS
actuarially fair premium(AFP)
The expected loss in wealthto the individual.
increasing marginal utility
Feature of a utility function inwhich utility is alwaysincreasing at an increasingrate.
convex utility function
Utility function in which thecurve lies strictly below thechord joining any two pointson the curve.
The question we ask ourselves now is whether such an individual, whose utility function has theshape in Figure 4.2, will be willing to pay the actuarially fair price (AFP), which equals expectedwinnings, to play a game of chance? Let the game that offers him payoffs be offered to him. In Game 1,tables have playoff games by Game 1 in Table 4.1 based on the toss of a coin. The AFP for the game is$4. Suppose that a person named Terry bears this cost upfront and wins; then his final wealth is $10 −$4 + $10 = $16 (original wealth minus the cost of the game, plus the winning of $10), or else it equals$10 − $4 − $2 = $4 (original wealth minus the cost of the game, minus the loss of $2) in case he loses.Let the utility function of this individual be given by √W. Then expected utility when the game costsAFP equals 0.5√16 + 0.5√4 = 3 utils. On the other hand, suppose Terry doesn’t play the game; his util-ity remains at √10 = 3.162. Since the utility is higher when Terry doesn’t play the game, we concludethat any individual whose preferences are depicted by Figure 4.2 will forgo a game of chance if its costequals AFP. This is an important result for a concave utility function as shown in Figure 4.2.
Such a person will need incentives to be willing to play the game. It could come as a price reduc-tion for playing the lottery, or as a premium that compensates the individual for risk. If Terry alreadyfaces a risk, he will pay an amount greater than the actuarially fair value to reduce or eliminate the risk.Thus, it works both ways—consumers demand a premium above AFP to take on risk. Just so, insur-ance companies charge individuals premiums for risk transfer via insurances.
An individual—let’s name him Johann—has preferences that are characterized by those shown inFigure 4.2 (i.e., by a concave or diminishing marginal utility function). Johann is a risk-averse person.We have seen that a risk-averse person refuses to play an actuarially fair game. Such risk aversions alsoprovide a natural incentive for Johann to demand (or, equivalently, pay) a risk premium above AFP totake on (or, equivalently, get rid of) risk. Perhaps you will recall from Chapter 1 that introduced a moremathematical measure to the description of risk aversion. In an experimental study, Holt and Laury(2002) find that a majority of their subjects under study made “safe choices,” that is, displayed riskaversion. Since real-life situations can be riskier than laboratory settings, we can safely assume that amajority of people are risk averse most of the time. What about the remainder of the population?
We know that most of us do not behave as risk-averse people all the time. In the later 1990s, thestock market was considered to be a “bubble,” and many people invested in the stock market despitethe preferences they exhibited before this time. At the time, Federal Reserve Board Chairman AlanGreenspan introduced the term “irrational exuberance” in a speech given at the American EnterpriseInstitute. The phrase has become a regular way to describe people’s deviations from normal prefer-ences. Such behavior was also repeated in the early to mid-2000s with a real estate bubble. Peoplewithout the rational means to buy homes bought them and took “nonconventional risks,” which led tothe 2008–2009 financial and credit crisis and major recessions (perhaps even depression) as PresidentObama took office in January 2009. We can regard external market conditions and the “herd mental-ity” to be significant contributors to changing rational risk aversion traits.
An individual may go skydiving, hang gliding, and participate in high-risk-taking behavior. Ourquestion is, can the expected utility theory capture that behavior as well? Indeed it can, and that bringsus to risk-seeking behavior and its characterization in E(U) theory. Since risk-seeking behavior exhibitspreferences that seem to be the opposite of risk aversion, the mathematical functional representationmay likewise show opposite behavior. For a risk-loving person, the utility function will show the shapegiven in Figure 4.3. It shows that the greater the level of wealth of the individual, the higher is the in-crease in utility when an additional dollar is given to the person. We call this feature of the function, inwhich utility is always increasing at an increasing rate, increasing marginal utility. It turns out thatall convex utility functions look like Figure 4.3. The curve lies strictly below the chord joining anytwo points on the curve.[11] u(W) = W2, eW .
CHAPTER 4 RISK ATTITUDES: EXPECTED UTILITY THEORY AND DEMAND FOR HEDGING 87
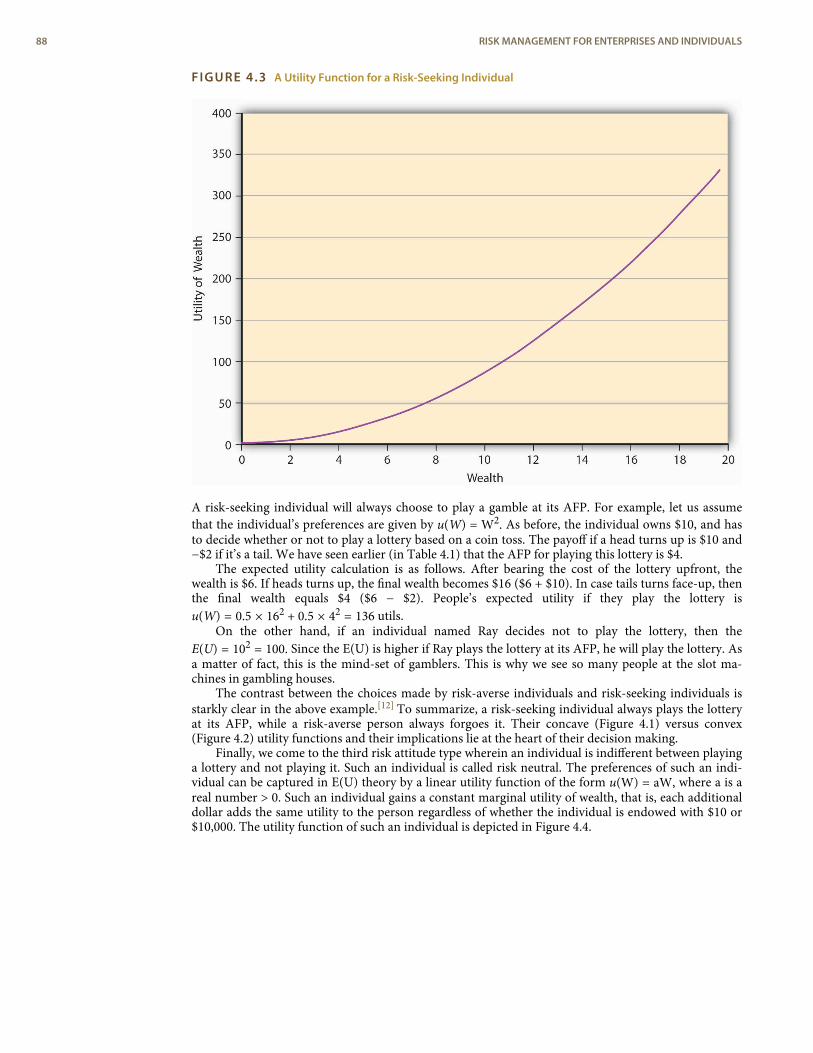
FIGURE 4.3 A Utility Function for a Risk-Seeking Individual
A risk-seeking individual will always choose to play a gamble at its AFP. For example, let us assumethat the individual’s preferences are given by u(W) = W2. As before, the individual owns $10, and hasto decide whether or not to play a lottery based on a coin toss. The payoff if a head turns up is $10 and−$2 if it’s a tail. We have seen earlier (in Table 4.1) that the AFP for playing this lottery is $4.
The expected utility calculation is as follows. After bearing the cost of the lottery upfront, thewealth is $6. If heads turns up, the final wealth becomes $16 ($6 + $10). In case tails turns face-up, thenthe final wealth equals $4 ($6 − $2). People’s expected utility if they play the lottery isu(W) = 0.5 × 162 + 0.5 × 42 = 136 utils.
On the other hand, if an individual named Ray decides not to play the lottery, then theE(U) = 102 = 100. Since the E(U) is higher if Ray plays the lottery at its AFP, he will play the lottery. Asa matter of fact, this is the mind-set of gamblers. This is why we see so many people at the slot ma-chines in gambling houses.
The contrast between the choices made by risk-averse individuals and risk-seeking individuals isstarkly clear in the above example.[12] To summarize, a risk-seeking individual always plays the lotteryat its AFP, while a risk-averse person always forgoes it. Their concave (Figure 4.1) versus convex(Figure 4.2) utility functions and their implications lie at the heart of their decision making.
Finally, we come to the third risk attitude type wherein an individual is indifferent between playinga lottery and not playing it. Such an individual is called risk neutral. The preferences of such an indi-vidual can be captured in E(U) theory by a linear utility function of the form u(W) = aW, where a is areal number > 0. Such an individual gains a constant marginal utility of wealth, that is, each additionaldollar adds the same utility to the person regardless of whether the individual is endowed with $10 or$10,000. The utility function of such an individual is depicted in Figure 4.4.
88 RISK MANAGEMENT FOR ENTERPRISES AND INDIVIDUALS
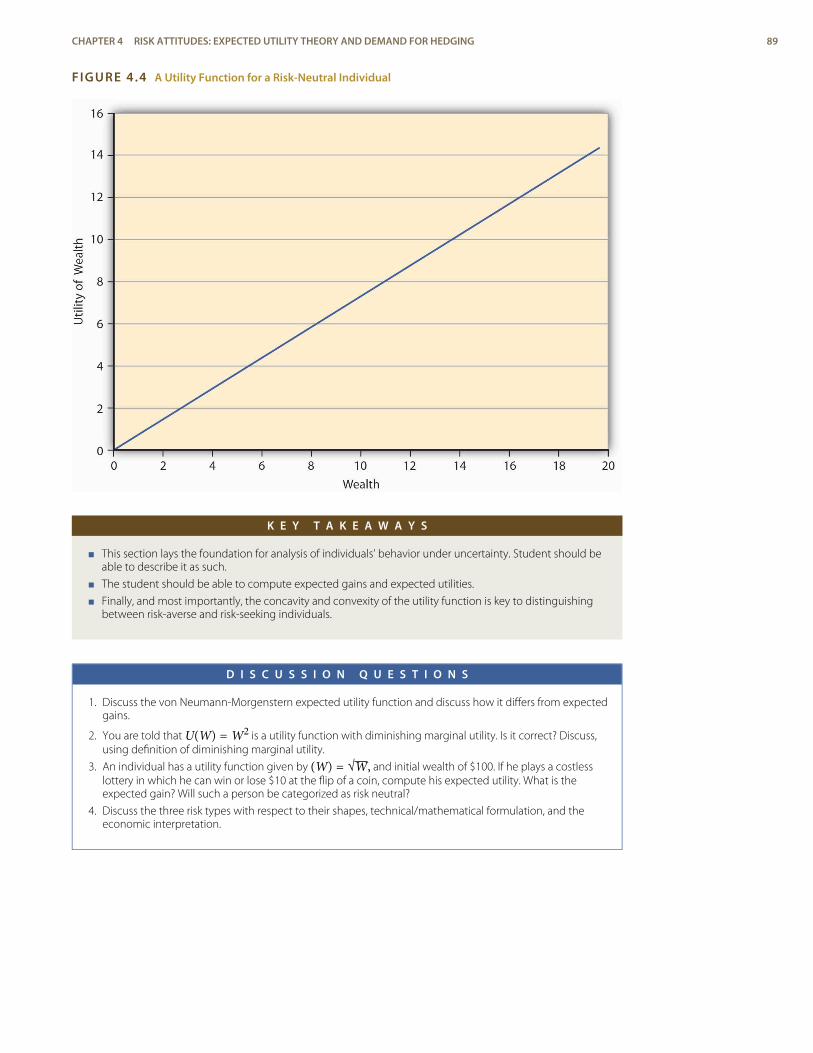
FIGURE 4.4 A Utility Function for a Risk-Neutral Individual
K E Y T A K E A W A Y S
< This section lays the foundation for analysis of individuals’ behavior under uncertainty. Student should beable to describe it as such.
< The student should be able to compute expected gains and expected utilities.
< Finally, and most importantly, the concavity and convexity of the utility function is key to distinguishingbetween risk-averse and risk-seeking individuals.
D I S C U S S I O N Q U E S T I O N S
1. Discuss the von Neumann-Morgenstern expected utility function and discuss how it differs from expectedgains.
2. You are told that U(W) = W2 is a utility function with diminishing marginal utility. Is it correct? Discuss,using definition of diminishing marginal utility.
3. An individual has a utility function given by (W) = √W, and initial wealth of $100. If he plays a costlesslottery in which he can win or lose $10 at the flip of a coin, compute his expected utility. What is theexpected gain? Will such a person be categorized as risk neutral?
4. Discuss the three risk types with respect to their shapes, technical/mathematical formulation, and theeconomic interpretation.
CHAPTER 4 RISK ATTITUDES: EXPECTED UTILITY THEORY AND DEMAND FOR HEDGING 89
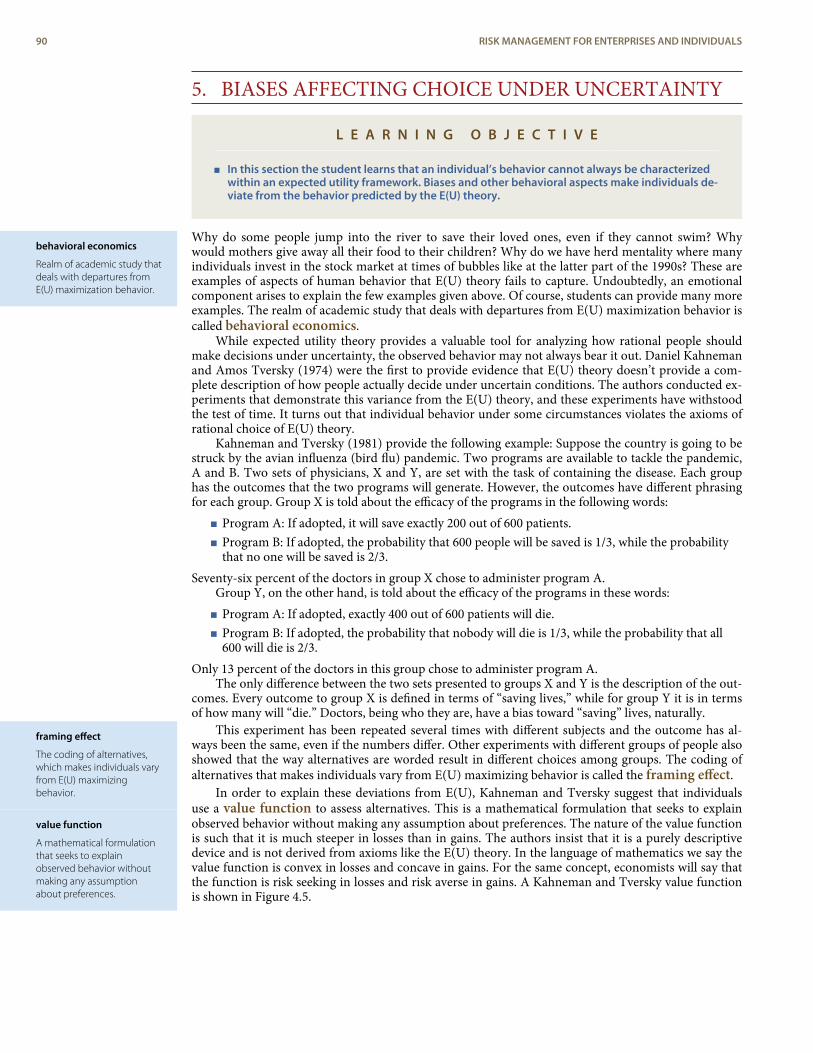
behavioral economics
Realm of academic study thatdeals with departures fromE(U) maximization behavior.
framing effect
The coding of alternatives,which makes individuals varyfrom E(U) maximizingbehavior.
value function
A mathematical formulationthat seeks to explainobserved behavior withoutmaking any assumptionabout preferences.
5. BIASES AFFECTING CHOICE UNDER UNCERTAINTY
L E A R N I N G O B J E C T I V E
< In this section the student learns that an individual’s behavior cannot always be characterizedwithin an expected utility framework. Biases and other behavioral aspects make individuals de-viate from the behavior predicted by the E(U) theory.
Why do some people jump into the river to save their loved ones, even if they cannot swim? Whywould mothers give away all their food to their children? Why do we have herd mentality where manyindividuals invest in the stock market at times of bubbles like at the latter part of the 1990s? These areexamples of aspects of human behavior that E(U) theory fails to capture. Undoubtedly, an emotionalcomponent arises to explain the few examples given above. Of course, students can provide many moreexamples. The realm of academic study that deals with departures from E(U) maximization behavior iscalled behavioral economics.
While expected utility theory provides a valuable tool for analyzing how rational people shouldmake decisions under uncertainty, the observed behavior may not always bear it out. Daniel Kahnemanand Amos Tversky (1974) were the first to provide evidence that E(U) theory doesn’t provide a com-plete description of how people actually decide under uncertain conditions. The authors conducted ex-periments that demonstrate this variance from the E(U) theory, and these experiments have withstoodthe test of time. It turns out that individual behavior under some circumstances violates the axioms ofrational choice of E(U) theory.
Kahneman and Tversky (1981) provide the following example: Suppose the country is going to bestruck by the avian influenza (bird flu) pandemic. Two programs are available to tackle the pandemic,A and B. Two sets of physicians, X and Y, are set with the task of containing the disease. Each grouphas the outcomes that the two programs will generate. However, the outcomes have different phrasingfor each group. Group X is told about the efficacy of the programs in the following words:
< Program A: If adopted, it will save exactly 200 out of 600 patients.< Program B: If adopted, the probability that 600 people will be saved is 1/3, while the probability
that no one will be saved is 2/3.Seventy-six percent of the doctors in group X chose to administer program A.
Group Y, on the other hand, is told about the efficacy of the programs in these words:< Program A: If adopted, exactly 400 out of 600 patients will die.< Program B: If adopted, the probability that nobody will die is 1/3, while the probability that all
600 will die is 2/3.Only 13 percent of the doctors in this group chose to administer program A.
The only difference between the two sets presented to groups X and Y is the description of the out-comes. Every outcome to group X is defined in terms of “saving lives,” while for group Y it is in termsof how many will “die.” Doctors, being who they are, have a bias toward “saving” lives, naturally.
This experiment has been repeated several times with different subjects and the outcome has al-ways been the same, even if the numbers differ. Other experiments with different groups of people alsoshowed that the way alternatives are worded result in different choices among groups. The coding ofalternatives that makes individuals vary from E(U) maximizing behavior is called the framing effect.
In order to explain these deviations from E(U), Kahneman and Tversky suggest that individualsuse a value function to assess alternatives. This is a mathematical formulation that seeks to explainobserved behavior without making any assumption about preferences. The nature of the value functionis such that it is much steeper in losses than in gains. The authors insist that it is a purely descriptivedevice and is not derived from axioms like the E(U) theory. In the language of mathematics we say thevalue function is convex in losses and concave in gains. For the same concept, economists will say thatthe function is risk seeking in losses and risk averse in gains. A Kahneman and Tversky value functionis shown in Figure 4.5.
90 RISK MANAGEMENT FOR ENTERPRISES AND INDIVIDUALS
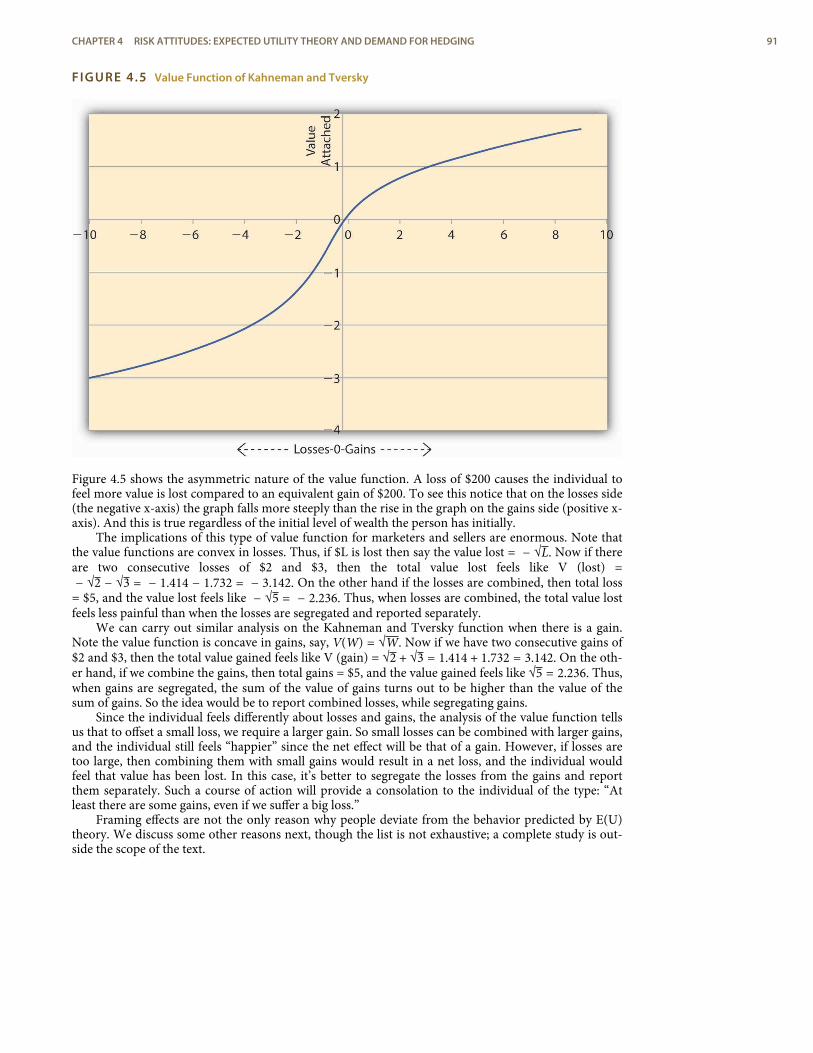
FIGURE 4.5 Value Function of Kahneman and Tversky
Figure 4.5 shows the asymmetric nature of the value function. A loss of $200 causes the individual tofeel more value is lost compared to an equivalent gain of $200. To see this notice that on the losses side(the negative x-axis) the graph falls more steeply than the rise in the graph on the gains side (positive x-axis). And this is true regardless of the initial level of wealth the person has initially.
The implications of this type of value function for marketers and sellers are enormous. Note thatthe value functions are convex in losses. Thus, if $L is lost then say the value lost = − √L. Now if thereare two consecutive losses of $2 and $3, then the total value lost feels like V (lost) =− √2 − √3 = − 1.414 − 1.732 = − 3.142. On the other hand if the losses are combined, then total loss
= $5, and the value lost feels like − √5 = − 2.236. Thus, when losses are combined, the total value lostfeels less painful than when the losses are segregated and reported separately.
We can carry out similar analysis on the Kahneman and Tversky function when there is a gain.Note the value function is concave in gains, say, V(W) = √W. Now if we have two consecutive gains of$2 and $3, then the total value gained feels like V (gain) = √2 + √3 = 1.414 + 1.732 = 3.142. On the oth-er hand, if we combine the gains, then total gains = $5, and the value gained feels like √5 = 2.236. Thus,when gains are segregated, the sum of the value of gains turns out to be higher than the value of thesum of gains. So the idea would be to report combined losses, while segregating gains.
Since the individual feels differently about losses and gains, the analysis of the value function tellsus that to offset a small loss, we require a larger gain. So small losses can be combined with larger gains,and the individual still feels “happier” since the net effect will be that of a gain. However, if losses aretoo large, then combining them with small gains would result in a net loss, and the individual wouldfeel that value has been lost. In this case, it’s better to segregate the losses from the gains and reportthem separately. Such a course of action will provide a consolation to the individual of the type: “Atleast there are some gains, even if we suffer a big loss.”
Framing effects are not the only reason why people deviate from the behavior predicted by E(U)theory. We discuss some other reasons next, though the list is not exhaustive; a complete study is out-side the scope of the text.
CHAPTER 4 RISK ATTITUDES: EXPECTED UTILITY THEORY AND DEMAND FOR HEDGING 91
availability bias
Tendency to work withwhatever information is easilyavailability.
experience bias
Tendency to assign moreweight to the state of theworld that we haveexperienced and less toothers.
anchoring bias
Tendency to base subjectiveassessments of outcomes onan initial estimate.
sunk cost
Money spent that cannot berecovered.
a. Overweighting and underweighting of probabilities. Recall that E(U) is the sum of products oftwo sets of numbers: first, the utility one receives in each state of the world and second, theprobabilities with which each state could occur. However, most of the time probabilities are notassigned objectively, but subjectively. For example, before Hurricane Katrina in 2005, individualsin New Orleans would assign a very small probability to flooding of the type experienced in theaftermath of Katrina. However, after the event, the subjective probability estimates of floodinghave risen considerably among the same set of individuals.
Humans tend to give more weight to events of the recent past than to look at the entirehistory. We could attribute such a bias to limited memory, individuals’ myopic view, or just easyavailability of more recent information. We call this bias to work with whatever information iseasily availability an availability bias. But people deviate from E(U) theory for more reasonsthan simply weighting recent past more versus ignoring overall history.
Individuals also react to experience bias. Since all of us are shaped somewhat by our ownexperiences, we tend to assign more weight to the state of the world that we have experienced andless to others. Similarly, we might assign a very low weight to a bad event occurring in our lives,even to the extent of convincing ourselves that such a thing could never happen to us. That iswhy we see women avoiding mammograms and men colonoscopies. On the other hand, wemight attach a higher-than-objective probability to good things happening to us. No matter whatthe underlying cause is, availability or experience, we know empirically that the probabilityweights are adjusted subjectively by individuals. Consequently, their observed behavior deviatesfrom E(U) theory.
b. Anchoring bias. Often individuals base their subjective assessments of outcomes based on aninitial “guesstimate.” Such a guess may not have any reasonable relationship to the outcomesbeing studied. In an experimental study reported by Kahneman and Tversky in Science (1974),the authors point this out. The authors call this anchoring bias; it has the effect of biasing theprobability estimates of individuals. The experiment they conducted ran as follows:
First, each individual under study had to spin a wheel of fortune with numbers ranging fromzero to one hundred. Then, the authors asked the individual if the percent of African nations inthe United Nations (UN) was lower or higher than the number on the wheel. Finally, theindividuals had to provide an estimate of the percent of African nations in the UN. The authorsobserved that those who spun a 10 or lower had a median estimate of 25 percent, while those whospun 65 or higher provided a median estimate of 45 percent.
Notice that the number obtained on the wheel had no correlation with the question beingasked. It was a randomly generated number. However, it had the effect of making people anchortheir answers around the initial number that they had obtained. Kahneman and Tversky alsofound that even if the payoffs to the subjects were raised to encourage people to provide a correctestimate, the anchoring effect was still evident.
c. Failure to ignore sunk costs. This is the most common reason why we observe departures fromE(U) theory. Suppose a person goes to the theater to watch a movie and discovers that he lost $10on the way. Another person who had bought an online ticket for $10 finds he lost the ticket onthe way. The decision problem is: “Should these people spend another $10 to watch the movie?”In experiments conducted suggesting exactly the same choices, respondents’ results show that thesecond group is more likely to go home without watching the movie, while the first one willoverwhelmingly (88 percent) go ahead and watch the movie.
Why do we observe this behavior? The two situations are exactly alike. Each group lost $10.But in a world of mental accounting, the second group has already spent the money on themovie. So this group mentally assumes a cost of $20 for the movie. However, the first group hadlost $10 that was not marked toward a specific expense. The second group does not have the“feel” of a lost ticket worth $10 as a sunk cost, which refers to money spent that cannot berecovered. What should matter under E(U) theory is only the value of the movie, which is $10.Whether the ticket or cash was lost is immaterial. Systematic accounting for sunk costs (whicheconomists tell us that we should ignore) causes departures from rational behavior under E(U)theory.
The failure to ignore sunk costs can cause individuals to continue to invest in ventures thatare already losing money. Thus, somebody who bought shares at $1,000 that now trade at $500will continue to hold on to them. They realized that the $1,000 is sunk and thus ignore it. Noticethat under rational expectations, what matters is the value of the shares now. Mental accountingtells the shareholders that the value of the shares is still $1,000; the individual does not sell theshares at $500. Eventually, in the economists’ long run, the shareholder may have to sell them for$200 and lose a lot more. People regard such a loss in value as a paper loss versus real loss, andindividuals may regard real loss as a greater pain than a paper loss.
92 RISK MANAGEMENT FOR ENTERPRISES AND INDIVIDUALS
By no mean is the list above complete. Other kinds of cognitive biases intervene that can lead to deviat-ing behavior from E(U) theory. But we must notice one thing about E(U) theory versus the value func-tion approach. The E(U) theory is an axiomatic approach to the study of human behavior. If those ax-ioms hold, it can actually predict behavior. On the other hand the value function approach is designedonly to describe what actually happens, rather than what should happen.
K E Y T A K E A W A Y S
< Students should be able to describe the reasons why observed behavior is different from the predictedbehavior under E(U) theory.
< They should also be able to discuss the nature of the value function and how it differs from the utilityfunction.
D I S C U S S I O N Q U E S T I O N S
1. Describe the Kahneman and Tversky value function. What evidence do they offer to back it up?
2. Are shapes other than the ones given by utility functions and value function possible? Provide examplesand discuss the implications of the shapes.
3. Discuss similarities and dissimilarities between availability bias, experience bias, and failure to ignore sunkcosts.?
6. RISK AVERSION AND PRICE OF HEDGING RISK
L E A R N I N G O B J E C T I V E S
< In this section we focus on risk aversion and the price of hedging risk. We discuss the actuar-ially fair premium (AFP) and the risk premium.
< Students will learn how these principles are applied to pricing of insurance (one mechanism tohedge individual risks) and the decision to purchase insurance.
From now on, we will restrict ourselves to the E(U) theory since we can predict behavior with it. Weare interested in the predictions about human behavior, rather than just a description of it.
The risk averter’s utility function (as we had seen earlier in Figure 4.2) is concave to the origin.Such a person will never play a lottery at its actuarially fair premium, that is, the expected loss in wealthto the individual. Conversely, such a person will always pay at least an actuarially fair premium to getrid of the entire risk.
Suppose Ty is a student who gets a monthly allowance of $200 (initial wealth W0) from his par-ents. He might lose $100 on any given day with a probability 0.5 or not lose any amount with 50 per-cent chance. Consequently, the expected loss (E[L]) to Ty equals 0.5($0) + 0.5($100) = $50. In otherwords, Ty’s expected final wealth E (FW) = 0.5($200 − $0) + 0.5($200 − $100) = W0 − E(L) = $150. Thequestion is how much Ty would be willing to pay to hedge his expected loss of $50. We will assumethat Ty’s utility function is given by U(W) = √W —a risk averter’s utility function.
To apply the expected utility theory to answer the question above, we solve the problem in stages.In the first step, we find out Ty’s expected utility when he does not purchase insurance and show it onFigure 4.6 (a). In the second step, we figure out if he will buy insurance at actuarially fair prices and useFigure 4.6 (b) to show it. Finally, we compute Ty’s utility when he pays a premium P to get rid of therisk of a loss. P represents the maximum premium Ty is willing to pay. This is featured in Figure 4.6(c). At this premium, Ty is exactly indifferent between buying insurance or remaining uninsured. Whatis P?
CHAPTER 4 RISK ATTITUDES: EXPECTED UTILITY THEORY AND DEMAND FOR HEDGING 93
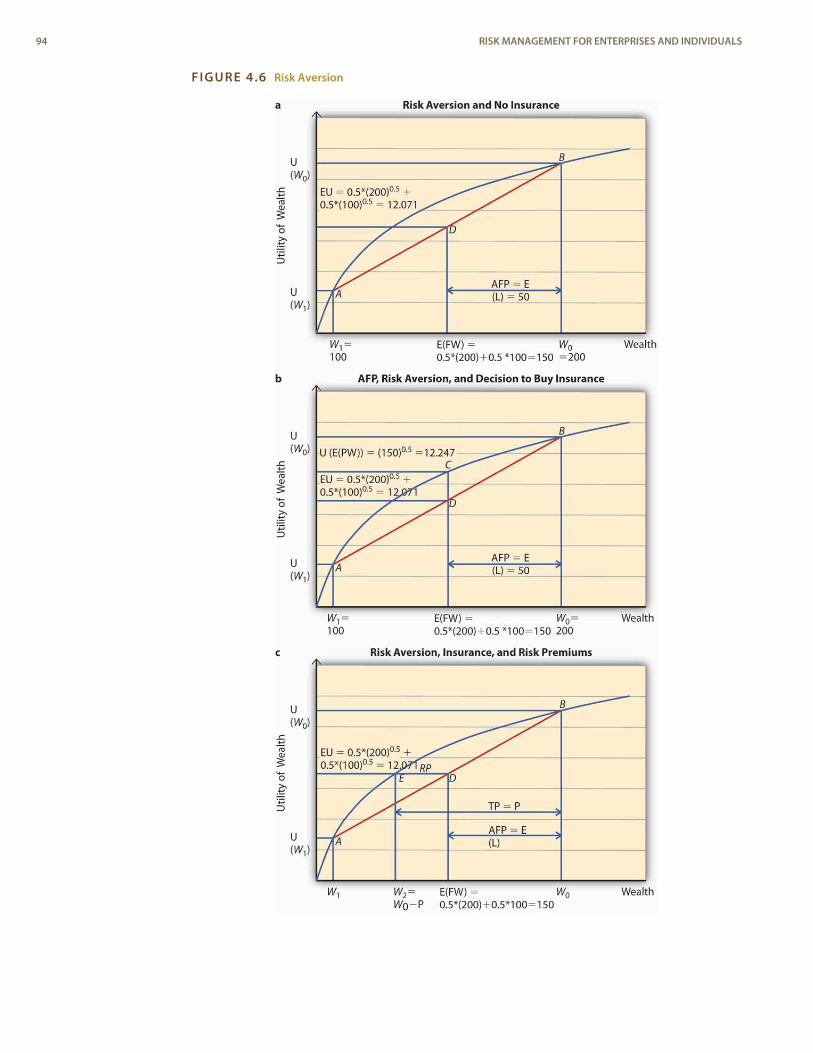
FIGURE 4.6 Risk Aversion
94 RISK MANAGEMENT FOR ENTERPRISES AND INDIVIDUALS
total premium
The sum of the actuarially fairpremium and the riskpremium.
risk premium
The premium over and abovethe actuarially fair premiumthat a risk-averse person iswilling to pay to get rid ofrisk.
< Step 1: Expected utility, no insurance.In case Ty does not buy insurance, he retains all the uncertainty. Thus, he will have an
expected final wealth of $150 as calculated above. What is his expected utility?The expected utility is calculated as a weighted sum of the utilities in the two states, loss and
no loss. Therefore, EU = 0.5√($200 − $0) + 0.5√($200 − $100) = 12.071. Figure 4.6 (a) showsthe point of E(U) for Ty when he does not buy insurance. His expected wealth is given by $150 onthe x-axis and expected utility by 12.071 on the y-axis. When we plot this point on the chart, itlies at D, on the chord joining the two points A and B. A and B on the utility curve correspond tothe utility levels when a loss is possible (W1 = 100) and no loss (W0 = 200), respectively. In caseTy does not hedge, then his expected utility equals 12.071.
What is the actuarially fair premium for Ty? Note actuarially fair premium (AFP) equals theexpected loss = $50. Thus the AFP is the distance between W0 and the E (FW) in Figure 4.6 (a).
< Step 2: Utility with insurance at AFP.Now, suppose an insurance company offers insurance to Ty at a $50 premium (AFP). Will
Ty buy it? Note that when Ty buys insurance at AFP, and he does not have a loss, his final wealthis $150 (Initial Wealth [$200] − AFP [$50]). In case he does suffer a loss, his final wealth = InitialWealth ($200) − AFP ($50) − Loss ($100) + Indemnity ($100) = $150. Thus, after the purchase ofinsurance at AFP, Ty’s final wealth stays at $150 regardless of a loss. That is why Ty haspurchased a certain wealth of $150, by paying an AFP of $50. His utility is now given by√150 = 12.247 . This point is represented by C in Figure 4.6 (b). Since C lies strictly above D, Tywill always purchase full insurance at AFP. The noteworthy feature for risk-averse individuals cannow be succinctly stated. A risk-averse person will always hedge the risk completely at a cost thatequals the expected loss. This cost is the actuarially fair premium (AFP). Alternatively, we can saythat a risk-averse person always prefers certainty to uncertainty if uncertainty can be hedgedaway at its actuarially fair price.
However, the most interesting part is that a risk-averse individual like Ty will pay more thanthe AFP to get rid of the risk.
< Step 3: Utility with insurance at a price greater than AFP.In case the actual premium equals AFP (or expected loss for Ty), it implies the insurance
company does not have its own costs/profits. This is an unrealistic scenario. In practice, thepremiums must be higher than AFP. The question is how much higher can they be for Ty to stillbe interested?
To answer this question, we need to answer the question, what is the maximum premium Tywould be willing to pay? The maximum premium P is determined by the point of indifferencebetween no insurance and insurance at price P.
If Ty bears a cost of P, his wealth stands at $200 − P. And this wealth is certain for the samereasons as in step 2. If Ty does not incur a loss, his wealth remains $200 − P. In case he does incura loss then he gets indemnified by the insurance company. Thus, regardless of outcome hiscertain wealth is $200 − P.
To compute the point of indifference, we should equate the utility when Ty purchasesinsurance at P to the expected utility in the no-insurance case. Note E(U) in the no-insurancecase in step 1 equals 12.071. After buying insurance at P, Ty’s certain utility is √200 − P. So wesolve the equation √200 − P = 12.071 and get P = $54.29.
Let us see the above calculation on a graph, Figure 4.6 (c). Ty tells himself, “As long as thepremium P is such that I am above the E(U) line when I do not purchase insurance, I would bewilling to pay it.” So starting from the initial wealth W0, we deduct P, up to the point that theutility of final wealth equals the expected utility given by the point E(U) on the y-axis. This pointis given by W2 = W0 − P.
The Total Premium (TP) = P comprises two parts. The AFP = the distance between initialwealth W0 and E (FW) (= E [L]), and the distance between E (FW) and W2. This distance iscalled the risk premium (RP, shown as the length ED in Figure 4.6 [c]) and in Ty’s case above, itequals $54.29 − $50 = $4.29.
The premium over and above the AFP that a risk-averse person is willing to pay to get rid ofthe risk is called the risk premium. Insurance companies are aware of this behavior of risk-averse individuals. However, in the example above, any insurance company that charges apremium greater than $54.29 will not be able to sell insurance to Ty.
Thus, we see that individuals’ risk aversion is a key component in insurance pricing. Thegreater the degree of risk aversion, the higher the risk premium an individual will be willing topay. But the insurance price has to be such that the premium charged turns out to be less than orequal to the maximum premium the person is willing to pay. Otherwise, the individual will neverbuy full insurance.
CHAPTER 4 RISK ATTITUDES: EXPECTED UTILITY THEORY AND DEMAND FOR HEDGING 95
information asymmetry
A problem encounteredwhen one party knows morethan the other party in thecontract.
adverse selection
Situation in which a personwith higher risk chooses tohedge the risk, preferablywithout paying more for thegreater risk.
Thus, risk aversion is a necessary condition for transfer of risks. Since insurance is onemechanism through which a risk-averse person transfers risk, risk aversion is of paramountimportance to insurance demand.
The degree of risk aversion is only one aspect that affects insurance prices. Insurance pricesalso reflect other important components. To study them, we now turn to the role thatinformation plays in the markets: in particular, how information and information asymmetriesaffect the insurance market.
K E Y T A K E A W A Y S
< In this section, students learned that risk aversion is the key to understanding why insurance and other riskhedges exist.
< The student should be able to express the demand for hedging and the conditions under which a risk-averse individual might refuse to transfer risk.
D I S C U S S I O N Q U E S T I O N S
1. What shape does a risk-averse person’s utility curve take? What role does risk aversion play in marketdemand for insurance products?
2. Distinguish between risk premium and AFP. Show the two on a graph.
3. Under what conditions will a risk-averse person refuse an insurance offer?
7. INFORMATION ASYMMETRY PROBLEM INECONOMICS
L E A R N I N G O B J E C T I V E
< Students learn the critical role that information plays in markets. In particular, we discuss twomajor information economics problems: moral hazard and adverse selection. Students will un-derstand how these two problems affect insurance availability and affordability (prices).
We all know about the used-car market and the market for “lemons.” Akerlof (1970) was the first toanalyze how information asymmetry can cause problems in any market. This is a problem en-countered when one party knows more than the other party in the contract. In particular, it addresseshow information differences between buyers and the sellers (information asymmetry) can cause marketfailure. These differences are the underlying causes of adverse selection, a situation under which aperson with higher risk chooses to hedge the risk, preferably without paying more for the greater risk.Adverse selection refers to a particular kind of information asymmetry problem, namely, hiddeninformation.
A second kind of information asymmetry lies in the hidden action, wherein one party’s actions arenot observable by the counterparty to the contract. Economists study this issue as one of moral hazard.
7.1 Adverse SelectionConsider the used-car market. While the sellers of used cars know the quality of their cars, the buyersdo not know the exact quality (imagine a world with no blue book information available). From thebuyer’s point of view, the car may be a lemon. Under such circumstances, the buyer’s offer pricereflects the average quality of the cars in the market.
When sellers approach a market in which average prices are offered, sellers who know that theircars are of better quality do not sell their cars. (This example can be applied to the mortgage and hous-ing crisis in 2008. Sellers who knew that their houses are worth more prefer to hold on to them, insteadof lowering the price in order to just make a sale). When they withdraw their cars from market, the av-erage quality of the cars for sale goes down. Buyers’ offer prices get revised downward in response. As aresult, the new level of better-quality car sellers withdraws from the market. As this cycle continues,
96 RISK MANAGEMENT FOR ENTERPRISES AND INDIVIDUALS
monopolistic market
A market with only onesupplier.
deductibles
Initial part of the lossabsorbed by the person whoincurs the loss.
coinsurance
Situation where individualsshare in the losses with theinsurance companies.
principal-agent problem
The inability of the principal(owner) to observe actions ofthe agent (manager).
only lemons remain in the market, and the market for used cars fails. As a result of an informationasymmetry, the bad-quality product drives away the good-quality ones from the market. This phe-nomenon is called adverse selection.
It’s easy to demonstrate adverse selection in health insurance. Imagine two individuals, one who ishealthy and the other who is not. Both approach an insurance company to buy health insurancepolicies. Assume for a moment that the two individuals are alike in all respects but their health condi-tion. Insurers can’t observe applicants’ health status; this is private information. If insurers could findno way to figure out the health status, what would it do?
Suppose the insurer’s price schedule reads, “Charge $10 monthly premium to the healthy one, and$25 to the unhealthy one.” If the insurer is asymmetrically informed of the health status of each applic-
ant, it would charge an average premium (10 + 252 = $17.50) to each. If insurers charge an average
premium, the healthy individual would decide to retain the health risk and remain uninsured. In such acase, the insurance company would be left with only unhealthy policyholders. Note that these less-healthy people would happily purchase insurance, since while their actual cost should be $25 they aregetting it for $17.50. In the long run, however, what happens is that the claims from these individualsexceed the amount of premium collected from them. Eventually, the insurance company may becomeinsolvent and go bankrupt. Adverse selection thus causes bankruptcy and market failure. What is thesolution to this problem? The easiest is to charge $25 to all individuals regardless of their health status.In a monopolistic market of only one supplier without competition this might work but not in acompetitive market. Even in a close-to-competitive market the effect of adverse selection is to increaseprices.
How can one mitigate the extent of adverse selection and its effects? The solution lies in reducingthe level of information asymmetry. Thus we find that insurers ask a lot of questions to determine therisk types of individuals. In the used-car market, the buyers do the same. Specialized agencies provideused-car information. Some auto companies certify their cars. And buyers receive warranty offers whenthey buy used cars.
Insurance agents ask questions and undertake individuals’ risk classification according to risktypes. In addition, leaders in the insurance market also developed solutions to adverse selection prob-lems. This comes in the form of risk sharing, which also means partial insurance. Under partial insur-ance, companies offer products with deductibles (the initial part of the loss absorbed by the personwho incurs the loss) and coinsurance, where individuals share in the losses with the insurance com-panies. It has been shown that high-risk individuals prefer full insurance, while low-risk individualschoose partial insurance (high deductibles and coinsurance levels). Insurance companies also offerpolicies where the premium is adjusted at a later date based on the claim experience of the policyholderduring the period.
7.2 Moral HazardAdverse selection refers to a particular kind of information asymmetry problem, namely, hidden in-formation. A second kind of information asymmetry lies in the hidden action, if actions of one party ofthe contract are not clear to the other. Economists study these problems under a category called themoral hazard problem.
The simplest way to understand the problem of “observability” (or clarity of action) is to imaginean owner of a store who hires a manager. The store owner may not be available to actually monitor themanager’ actions continuously and at all times, for example, how they behave with customers. This in-ability to observe actions of the agent (manager) by the principal (owner) falls under the class of prob-lems called the principal-agent problem.[13] Extension of this problem to the two parties of the in-surance contract is straightforward.
Let us say that the insurance company has to decide whether to sell an auto insurance policy toWonku, who is a risk-averse person with a utility function given by U(W) = √W. Wonku’s driving re-cord is excellent, so he can claim to be a good risk for the insurance company. However, Wonku canalso choose to be either a careful driver or a not-so-careful driver. If he drives with care, he incurs acost.
To exemplify, let us assume that Wonku drives a car carrying a market value of $10,000. The onlyother asset he owns is the $3,000 in his checking account. Thus, he has a total initial wealth of $13,000.If he drives carefully, he incurs a cost of $3,000. Assume he faces the following loss distributions whenhe drives with or without care.
CHAPTER 4 RISK ATTITUDES: EXPECTED UTILITY THEORY AND DEMAND FOR HEDGING 97
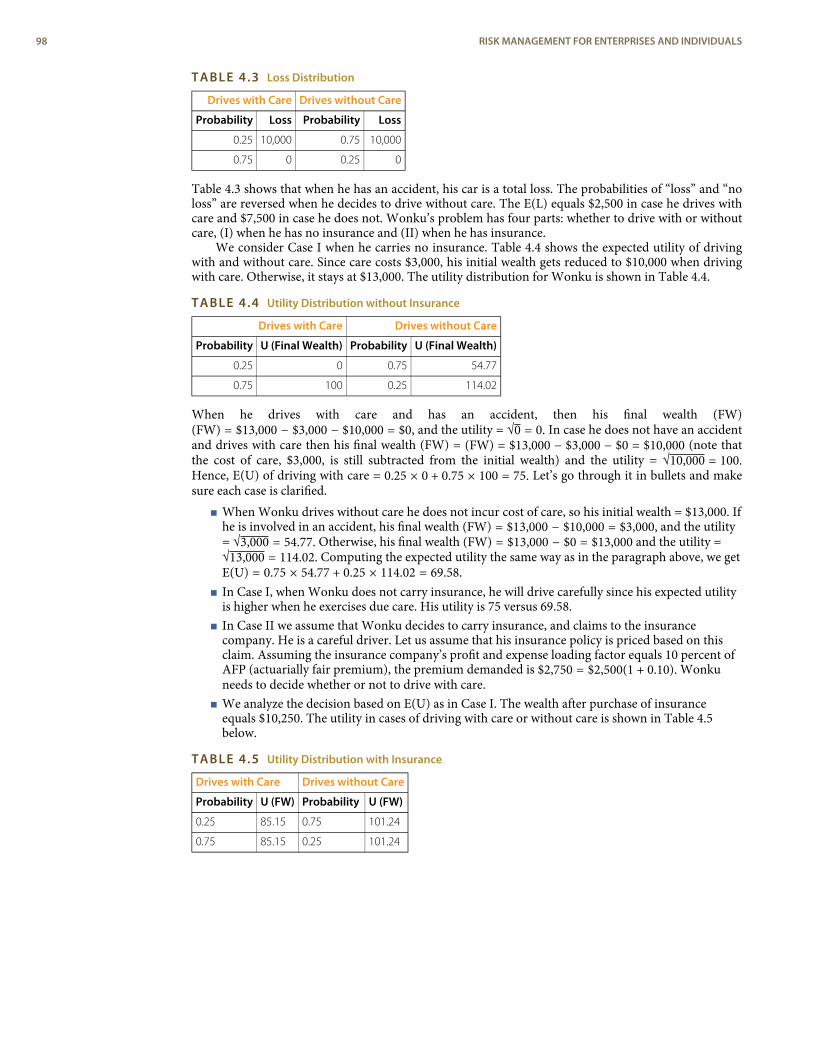
TABLE 4.3 Loss Distribution
Drives with Care Drives without Care
Probability Loss Probability Loss
0.25 10,000 0.75 10,000
0.75 0 0.25 0
Table 4.3 shows that when he has an accident, his car is a total loss. The probabilities of “loss” and “noloss” are reversed when he decides to drive without care. The E(L) equals $2,500 in case he drives withcare and $7,500 in case he does not. Wonku’s problem has four parts: whether to drive with or withoutcare, (I) when he has no insurance and (II) when he has insurance.
We consider Case I when he carries no insurance. Table 4.4 shows the expected utility of drivingwith and without care. Since care costs $3,000, his initial wealth gets reduced to $10,000 when drivingwith care. Otherwise, it stays at $13,000. The utility distribution for Wonku is shown in Table 4.4.
TABLE 4.4 Utility Distribution without Insurance
Drives with Care Drives without Care
Probability U (Final Wealth) Probability U (Final Wealth)
0.25 0 0.75 54.77
0.75 100 0.25 114.02
When he drives with care and has an accident, then his final wealth (FW)(FW) = $13,000 − $3,000 − $10,000 = $0, and the utility = √0 = 0. In case he does not have an accidentand drives with care then his final wealth (FW) = (FW) = $13,000 − $3,000 − $0 = $10,000 (note thatthe cost of care, $3,000, is still subtracted from the initial wealth) and the utility = √10,000 = 100.Hence, E(U) of driving with care = 0.25 × 0 + 0.75 × 100 = 75. Let’s go through it in bullets and makesure each case is clarified.
< When Wonku drives without care he does not incur cost of care, so his initial wealth = $13,000. Ifhe is involved in an accident, his final wealth (FW) = $13,000 − $10,000 = $3,000, and the utility= √3,000 = 54.77. Otherwise, his final wealth (FW) = $13,000 − $0 = $13,000 and the utility =√13,000 = 114.02. Computing the expected utility the same way as in the paragraph above, we getE(U) = 0.75 × 54.77 + 0.25 × 114.02 = 69.58.
< In Case I, when Wonku does not carry insurance, he will drive carefully since his expected utilityis higher when he exercises due care. His utility is 75 versus 69.58.
< In Case II we assume that Wonku decides to carry insurance, and claims to the insurancecompany. He is a careful driver. Let us assume that his insurance policy is priced based on thisclaim. Assuming the insurance company’s profit and expense loading factor equals 10 percent ofAFP (actuarially fair premium), the premium demanded is $2,750 = $2,500(1 + 0.10). Wonkuneeds to decide whether or not to drive with care.
< We analyze the decision based on E(U) as in Case I. The wealth after purchase of insuranceequals $10,250. The utility in cases of driving with care or without care is shown in Table 4.5below.
TABLE 4.5 Utility Distribution with Insurance
Drives with Care Drives without Care
Probability U (FW) Probability U (FW)
0.25 85.15 0.75 101.24
0.75 85.15 0.25 101.24
98 RISK MANAGEMENT FOR ENTERPRISES AND INDIVIDUALS
Notice that after purchase of insurance, Wonku has eliminated the uncertainty. So if he has an acci-dent, the insurance company indemnifies him with $10,000. Thus, when Wonku has insurance, the fol-lowing are the possibilities:
< He is driving with care< And his car gets totaled, his final wealth =
$10,250 − $3,000 − $10,000 + $10,000 = $7,250, and associated utility = √7250 = 85.15.< And no loss occurs, his final wealth = $10,250 − $3,000 = $7,250.
So the expected utility for Wonku = 85.15 when he drives with care.< He does not drive with care
< And his car gets totaled, his final wealth = $10,250 − $10,000 + $10,000 = $10,250, andassociated utility = √10250 = 101.24.
< And no loss occurs, his final wealth = $10,250 and utility = 101.24.So the expected utility for Wonku = 101.24 when he drives without care after purchasinginsurance.
The net result is he switches to driving with no care.Wonku’s behavior thus changes from driving with care to driving without care after purchasing
insurance. Why do we get this result? In this example, the cost of insurance is cheaper than the cost ofcare. Insurance companies can charge a price greater than the cost of care up to a maximum of whatWonku is willing to pay. However, in the event of asymmetric information, the insurance company willnot know the cost of care. Thus, inexpensive insurance distorts the incentives and individuals switch toriskier behavior ex post.
In this moral hazard example, the probabilities of having a loss are affected, not the loss amounts.In practice, both will be affected. At its limit, when moral hazard reaches a point where the intention isto cheat the insurance company, it manifests itself in fraudulent behavior.
How can we solve this problem? An ideal solution would be continuous monitoring, which is pro-hibitively expensive and may not even be legal for privacy issues. Alternatively, insurance companiestry and gather as much information as possible to arrive at an estimate of the cost of care or lack of it.Also, more information leads to an estimate of the likelihood that individuals will switch to riskier be-havior afterwards. So questions like marital status/college degree and other personal information mightbe asked. Insurance companies will undertake a process called risk classification. We discuss this im-portant process later in the text.
So far we have learned how individuals’ risk aversion and information asymmetry explain behavi-or associated with hedging. But do these reasons also hold when we study why corporations hedge theirrisks? We provide the answer to this question next.
K E Y T A K E A W A Y S
< Students should be able to define information asymmetry problems, in particular moral hazard andadverse selection.
< They must also be able to discuss in detail the effects these phenomena have on insurance prices and risktransfer markets in general.
< Students should spend some effort to understand computations, which are so important if they wish tofully understand the effects that these computations have on actuarial science. Insurance companies maketheir decisions primarily on the basis of such calculations.
D I S C U S S I O N Q U E S T I O N S
1. What information asymmetry problems arise in economics? Distinguish between moral hazard andadverse selection. Give an original example of each.
2. What effects can information asymmetry have in markets?
3. Is risk aversion a necessary condition for moral hazard or adverse selection to exist? Provide reasons.
4. What can be done to mitigate the effect of moral hazard and adverse selection in markets/insurancemarkets?
CHAPTER 4 RISK ATTITUDES: EXPECTED UTILITY THEORY AND DEMAND FOR HEDGING 99
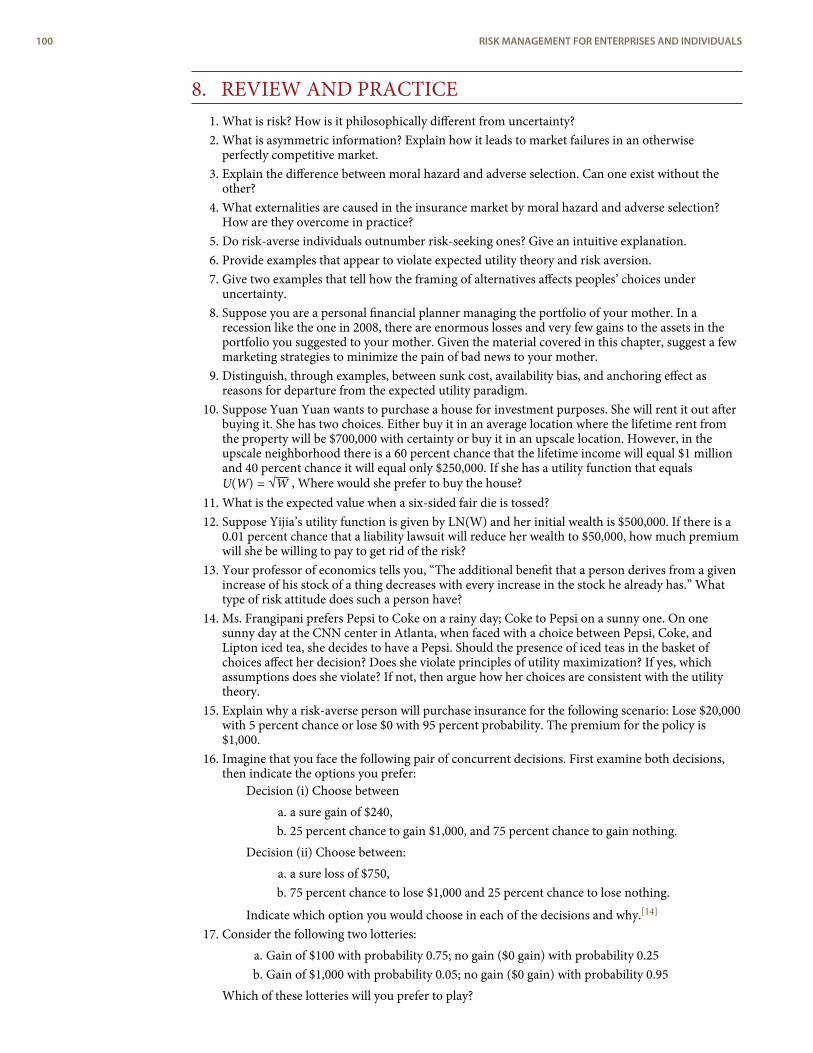
8. REVIEW AND PRACTICE1. What is risk? How is it philosophically different from uncertainty?2. What is asymmetric information? Explain how it leads to market failures in an otherwise
perfectly competitive market.3. Explain the difference between moral hazard and adverse selection. Can one exist without the
other?4. What externalities are caused in the insurance market by moral hazard and adverse selection?
How are they overcome in practice?5. Do risk-averse individuals outnumber risk-seeking ones? Give an intuitive explanation.6. Provide examples that appear to violate expected utility theory and risk aversion.7. Give two examples that tell how the framing of alternatives affects peoples’ choices under
uncertainty.8. Suppose you are a personal financial planner managing the portfolio of your mother. In a
recession like the one in 2008, there are enormous losses and very few gains to the assets in theportfolio you suggested to your mother. Given the material covered in this chapter, suggest a fewmarketing strategies to minimize the pain of bad news to your mother.
9. Distinguish, through examples, between sunk cost, availability bias, and anchoring effect asreasons for departure from the expected utility paradigm.
10. Suppose Yuan Yuan wants to purchase a house for investment purposes. She will rent it out afterbuying it. She has two choices. Either buy it in an average location where the lifetime rent fromthe property will be $700,000 with certainty or buy it in an upscale location. However, in theupscale neighborhood there is a 60 percent chance that the lifetime income will equal $1 millionand 40 percent chance it will equal only $250,000. If she has a utility function that equalsU(W) = √W , Where would she prefer to buy the house?
11. What is the expected value when a six-sided fair die is tossed?12. Suppose Yijia’s utility function is given by LN(W) and her initial wealth is $500,000. If there is a
0.01 percent chance that a liability lawsuit will reduce her wealth to $50,000, how much premiumwill she be willing to pay to get rid of the risk?
13. Your professor of economics tells you, “The additional benefit that a person derives from a givenincrease of his stock of a thing decreases with every increase in the stock he already has.” Whattype of risk attitude does such a person have?
14. Ms. Frangipani prefers Pepsi to Coke on a rainy day; Coke to Pepsi on a sunny one. On onesunny day at the CNN center in Atlanta, when faced with a choice between Pepsi, Coke, andLipton iced tea, she decides to have a Pepsi. Should the presence of iced teas in the basket ofchoices affect her decision? Does she violate principles of utility maximization? If yes, whichassumptions does she violate? If not, then argue how her choices are consistent with the utilitytheory.
15. Explain why a risk-averse person will purchase insurance for the following scenario: Lose $20,000with 5 percent chance or lose $0 with 95 percent probability. The premium for the policy is$1,000.
16. Imagine that you face the following pair of concurrent decisions. First examine both decisions,then indicate the options you prefer:
Decision (i) Choose betweena. a sure gain of $240,b. 25 percent chance to gain $1,000, and 75 percent chance to gain nothing.
Decision (ii) Choose between:a. a sure loss of $750,b. 75 percent chance to lose $1,000 and 25 percent chance to lose nothing.
Indicate which option you would choose in each of the decisions and why.[14]
17. Consider the following two lotteries:a. Gain of $100 with probability 0.75; no gain ($0 gain) with probability 0.25b. Gain of $1,000 with probability 0.05; no gain ($0 gain) with probability 0.95
Which of these lotteries will you prefer to play?
100 RISK MANAGEMENT FOR ENTERPRISES AND INDIVIDUALS
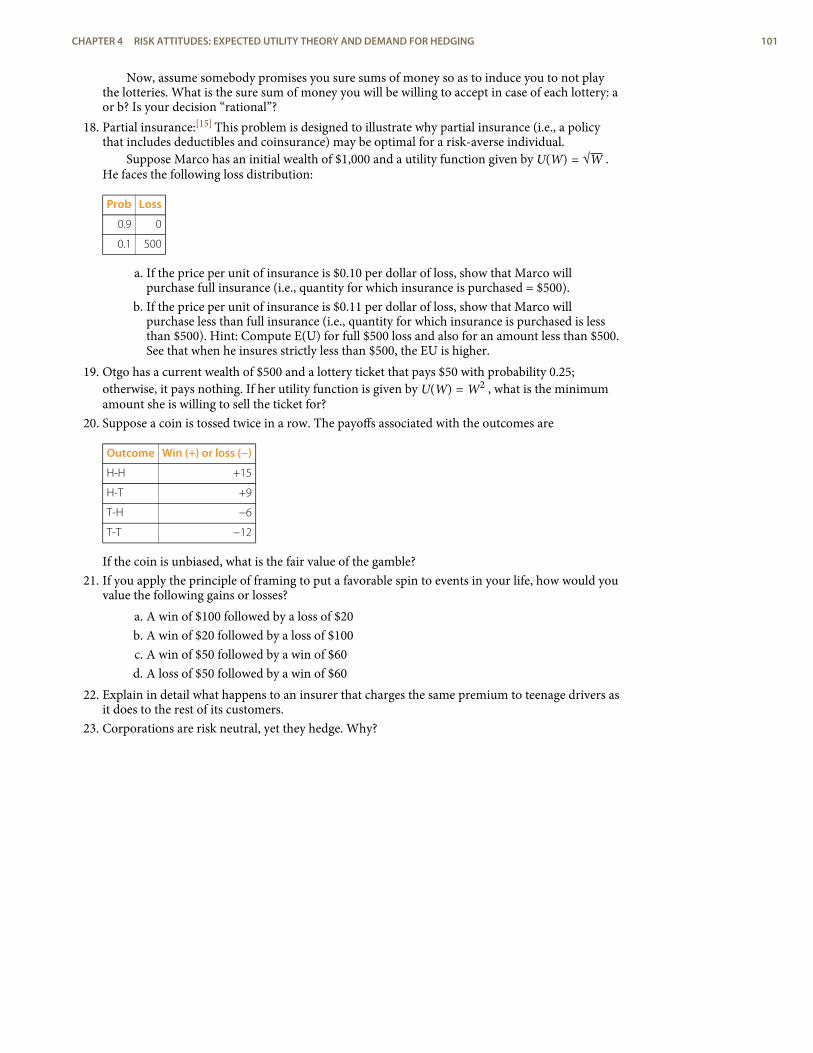
Now, assume somebody promises you sure sums of money so as to induce you to not playthe lotteries. What is the sure sum of money you will be willing to accept in case of each lottery: aor b? Is your decision “rational”?
18. Partial insurance:[15] This problem is designed to illustrate why partial insurance (i.e., a policythat includes deductibles and coinsurance) may be optimal for a risk-averse individual.
Suppose Marco has an initial wealth of $1,000 and a utility function given by U(W) = √W .He faces the following loss distribution:
Prob Loss
0.9 0
0.1 500
a. If the price per unit of insurance is $0.10 per dollar of loss, show that Marco willpurchase full insurance (i.e., quantity for which insurance is purchased = $500).
b. If the price per unit of insurance is $0.11 per dollar of loss, show that Marco willpurchase less than full insurance (i.e., quantity for which insurance is purchased is lessthan $500). Hint: Compute E(U) for full $500 loss and also for an amount less than $500.See that when he insures strictly less than $500, the EU is higher.
19. Otgo has a current wealth of $500 and a lottery ticket that pays $50 with probability 0.25;otherwise, it pays nothing. If her utility function is given by U(W) = W2 , what is the minimumamount she is willing to sell the ticket for?
20. Suppose a coin is tossed twice in a row. The payoffs associated with the outcomes are
Outcome Win (+) or loss (−)
H-H +15
H-T +9
T-H −6
T-T −12
If the coin is unbiased, what is the fair value of the gamble?21. If you apply the principle of framing to put a favorable spin to events in your life, how would you
value the following gains or losses?a. A win of $100 followed by a loss of $20b. A win of $20 followed by a loss of $100c. A win of $50 followed by a win of $60d. A loss of $50 followed by a win of $60
22. Explain in detail what happens to an insurer that charges the same premium to teenage drivers asit does to the rest of its customers.
23. Corporations are risk neutral, yet they hedge. Why?
CHAPTER 4 RISK ATTITUDES: EXPECTED UTILITY THEORY AND DEMAND FOR HEDGING 101
1.
2.
3.
4.
5.
6.
7.
8.9.
10.
11.
12.
13.
14.
15.
ENDNOTES
At one time, economists measured satisfaction in a unit called “utils” and discussedthe highest number of utils as “bliss points”!
Economists are fond of the phrase “ceteris paribus,” which means all else the same.We can only vary one component of human behavior at a time.
The utility theory is utilized to compare two or more options. Thus, by its very nature,we refer to the utility theory as an “ordinal” theory, which rank orders choices, ratherthan “cardinal” utility, which has the ability to attach a number to even a single out-come where there are no choices involved.
An academic example is the following study: Yew-Kwang Ng, “A Case for Happiness,Cardinalism, and Interpersonal Comparability,” Economic Journal 107 (1997):1848–58. She contends that “modern economists are strongly biased in favour ofpreference (in contrast to happiness), ordinalism, and against interpersonal compar-ison. I wish to argue for the opposite.” A more popular research is at Forbes on happi-ness research.
Forbes magazine published several short pieces on happiness research. Nothingespecially rigorous, but a pleasant enough read:
< “Money Doesn’t Make People Happy,” by TimHarford.
But marriage, sex, socializing and even middleage do.
http://www.forbes.com/2006/02/11/tim-harford-money_cz_th_money06_0214harford.html
< “Shall I Compare Thee To A Summer’s Sausage?”by Daniel Gilbert.
Money can’t make you happy, but making theright comparisons can.
http://www.forbes.com/2006/02/11/daniel-gilbert-happiness_cx_dg_money06_0214gilbert.html
< “Money, Happiness and the Pursuit of Both,” by El-izabeth MacDonald.
When it comes [to] money and happiness, eco-nomists and psychologists have got it all wrong.
http://www.forbes.com/2006/02/11/money-happiness-consumption_cz_em_money06_0214pursuit.html
< “The Happiness Business,” by Paul Maidment.
There is more academic research than you canshake a Havana cigar at saying there is no correla-tion between wealth and happiness.
http://www.forbes.com/2006/02/11/happiness-economists-money_cx_pm_money06_0214maidment.html
The distinction between normative and positive aspects of a theory is very importantin the discipline of economics. Some people argue that economic theories shouldbe normative, which means they should be prescriptive and tell people what to do.Others argue, often successfully, that economic theories are designed to be explana-tions of observed behavior of agents in the market, hence positive in that sense.
The assumption of convexity of preferences is not required for a utility function rep-resentation of an individual’s preferences to exist. But it is necessary if we want thatfunction to be well behaved.
See Jochen Runde, “Clarifying Frank Knight’s Discussion of the Meaning of Risk andUncertainty,” Cambridge Journal of Economics 22, no. 5 (1998): 539–46.
These are called the continuity and independence assumptions.
At this juncture, we only care about that notion of risk, which captures the inherentvariability in the outcomes (uncertainty) associated with each lottery.
Mathematically, the property that the utility is increasing at a decreasing rate can bewritten as a combination of restrictions on the first and second derivatives (rate ofchange of slope) of the utility function, u ′ (W) > 0, u ″ (W) < 0. Some functions
that satisfy this property are u(W) = √W, LN(W), − e −aW .
The convex curve in Figure 4.2 has some examples that include the mathematical
function u(W) = W2, eW.
Mathematically speaking, for a risk-averse person, we have E(U[W]) ≤ U[E(W)]. Sim-ilarly, for a risk-seeking person we have E(U[W)] ≥ U[E(W)]. This result is calledJensen’s inequality.
The complete set of principal-agent problems comprises all situations in which theagent maximizes his own utility at the expense of the principal. Such behavior is con-trary to the principal-agent relationship that assumes that the agent is acting on be-half of the principal (in principal’s interest).
This problem has been adopted from D. Kahneman and D. Lovallo, “Timid Choicesand Bold Forecasts: A Cognitive Perspective on Risk Taking,” Management Science 39,no. 1 (1993): 17–31.
Challenging problem.
102 RISK MANAGEMENT FOR ENTERPRISES AND INDIVIDUALS
C H A P T E R 5The Insurance Solution andInstitutionsIn Part I of this book, we discussed the nature of risk and risk management. We defined risk, measured it, attempted
to feel its impact, and learned about risk management tools. We statistically measured risk using the standard
deviation and coefficient of variance, for example. We are going to emphasize the fact that risk decreases as the
number of exposures increases as the most important foundation of insurance. This is called the law of large
numbers. This law is critical to understanding the nature of risk and how it is managed. Once there are large
numbers of accidental exposures, the next questions are (1) How does insurance work? and (2) What is insurable
risk? This chapter responds to these questions and elaborates on insuring institutions.
The transfer of risk to insurers reduces the level of risk to society as a whole. In the transfer of risk to insurers, the
risk of loss or no loss that we face changes. As we learned in Chapter 4, we pay premiums to get the security of no
loss. When we transfer the risk, insurers take on some risk. To them, however, the risk is much lower; it is the risk of
missing the loss prediction. The insurer’s risk is the standard deviation we calculated in Chapter 2. The larger the
number of exposures, the lower the risk of missing the prediction of future losses. Thus, the transfer of risk to
insurers also lowers the risk to society as a whole through the law of large numbers. Even further, insurance is one
of the tools that maintains our wealth and keeps the value of firms intact. As we elaborated in Chapter 13, people
and firms work to maximize value. One essential element in maximizing the value of our assets is preservation and
sustainability. If purchased from a credible and well-rated insurance company, insurance guarantees the
preservation of assets and economic value. In this chapter, we will cover the following:
1. Links
2. Ideal requisites for insurability
3. Types of insurance and insurers
1. LINKSThe adverse, or negative, effects of most of the risks can be mitigated by transferring them to insurancecompanies. The new traveler through the journey of risk mitigation is challenged to ensure that theseparate risks receive the appropriate treatment. In Figure 5.1, each puzzle piece represents a fragmentof risk, each with its associated insurance solution or an indication of a noninsurance solution. Despitehaving all of the risks in one completed puzzle to emulate a notion of holistic risk, the insurance solu-tions are not holistic. Insurers sell separate policies that cover the separate risks. Each policy specificallyexcludes the coverage that another policy provides. For example, the auto policy excludes the coverageprovided by the homeowners’ policy. These exclusions are designed to prevent double dipping, ordouble coverage. Every risk has its unique policy or a few layers of coverages from various sources. Forthe risk of dying prematurely, we can purchase life insurance policies as well as receive coverage fromSocial Security. For the risk of becoming ill and not being able to pay for medical care, we have healthinsurance. For the risk of losing our income because of injury, we have disability insurance (or workers’compensation if the injury occurred on the job). Throughout this text, you will learn about all the
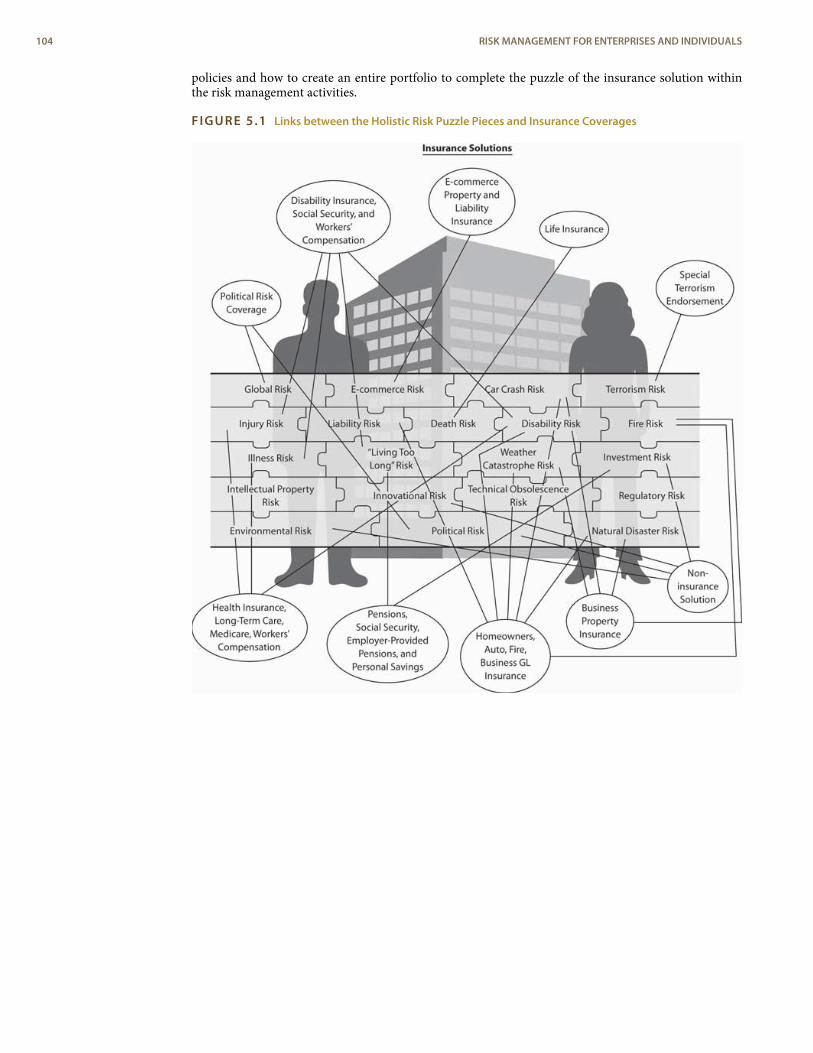
policies and how to create an entire portfolio to complete the puzzle of the insurance solution withinthe risk management activities.
FIGURE 5.1 Links between the Holistic Risk Puzzle Pieces and Insurance Coverages
104 RISK MANAGEMENT FOR ENTERPRISES AND INDIVIDUALS
insurance
A social device in which agroup of individuals transferrisk to another party in such away that the third partycombines or pools all the riskexposures together.
insureds
Individuals who transfer riskto a third-party.
insurer
The third party that acceptsthe risks transferred byinsureds.
law of large numbers
As a sample of observations isincreased in size, the relativevariation about the meandeclines.
2. NATURE OF INSURANCE
L E A R N I N G O B J E C T I V E S
In this section you will learn the following:
< The law of large numbers as the essence of insurance< How insurance is defined
A brief survey of insurance literature reveals differences of opinion among authors concerning how theterm insurance should be defined. Regardless, however, the literature agrees that insurance has to con-tain both of the following elements: (1) risk pooling and (2) risk transfer. The risk pooling creates alarge sample of risk exposures and, as the sample gets larger, the possibility of missing future loss pre-dictions gets lower. This is the law of large numbers, discussed further in the box below, “Law of LargeNumbers.” The combination of risk pooling and risk transfer (from the owner of the risk to a third, un-related party) physically reduces the risk, both in number and in the anxiety it causes. As such, we re-gard insurance as a social device in which a group of individuals transfer risk to another party in sucha way that the third party combines or pools all the risk exposures together. Pooling the exposures to-gether permits more accurate statistical prediction of future losses. Individuals who transfer risk to athird-party are known as insureds. The third party that accepts the risks transferred by insureds isknown as the insurer.
The Law of Large Numbers
Availability of only small data sources (or sometimes none at all) is troublesome because most estimationtechniques rely on numerous observations for accuracy. The benefit of many observations is well stated by thelaw of large numbers, an important statistical doctrine for the successful management of risk and the basicfoundation for the existence of insurance in society.
The law of large numbers holds that, as a sample of observations increases in size, the relative variationabout the mean declines. An example is given in Section 5. The important point is that, with larger samples,we feel more confident in our estimates.
If it were not for the law of large numbers, insurance would not exist. A risk manager (or insurance executive)uses the law of large numbers to estimate future outcomes for planning purposes. The larger the sample size,the lower the relative risk, everything else being equal. The pooling of many exposures gives the insurer a bet-ter prediction of future losses. The insurer still has some risk or variability around the average. Nevertheless, therisk of an insurer with more exposures is relatively lower than that of an insurer with fewer exposures underthe same expected distribution of losses, as presented in Section 5.
The importance of the large number of exposures often prompts the question, What can smaller insurers doto reduce the uncertainty in predicting losses? Smaller insurers use the sharing of data that exists in the insur-ance industry. One such data collection and statistical analysis organization is the Insurance Services Office(ISO). In addition to being a statistical agent, this organization provides the uniform policy forms for the prop-erty/casualty industry (a small sample of these policies are in the appendixes at the end of the text). The ISO isboth a data collection agent and an advisory organization to the industry on matters of rates and policy forms.
2.1 How Insurance WorksInsurance works through the following steps:
< Risk is transferred from an individual or entity (insured) to a third party (insurer).< The third party (insurer) pools all the risk exposures together to compute potential future losses
with some level of accuracy. The insurer uses various forecasting techniques, depending on thedistribution of losses. One of the forecasting techniques was demonstrated in Chapter 3.
< The pooling of the risk leads to an overall reduction of risk in society because insurers’ accuracyof prediction improves as the number of exposures increases.
CHAPTER 5 THE INSURANCE SOLUTION AND INSTITUTIONS 105
insurer assumes risk
The insurer promises to paywhatever loss may occur aslong as it fits the descriptiongiven in the policy and is notlarger than the amount ofinsurance sold.
finite risk programs
Financial methods that canbe construed as financing riskassumptions.
< Insurers pool similar risk exposures together to compute their own risk of missing the prediction.< Insurers discriminate via underwriting—the process of evaluating a risk and classifying it with
similar risks (see the box below, "Fitting into a Lower Risk-Exposure Pooling Group"). Both thetransfer of risk to a third party and the pooling lead to reduced risk in society as a whole and asense of reduced anxiety.
Risk Transfer
Insurance is created by an insurer that, as a professional risk-bearer, assumes the financial aspect ofrisks transferred to it by insureds. The insurer assumes risk by promising to pay whatever loss mayoccur as long as it fits the description given in the policy and is not larger than the amount of insurancesold. The loss may be zero, or it may be many thousands of dollars. In return for accepting this variab-ility in outcomes (our definition of risk), the insurer receives a premium. Through the premium, thepolicyholder has paid a certain expense in order to transfer the risk of a possible large loss. The insur-ance contract stipulates what types of losses will be paid by the insurer.
Most insurance contracts are expressed in terms of money, although some compensate insureds byproviding a service. A life insurance contract obligates the insurer to pay a specified sum of moneyupon the death of the person whose life is insured. A liability insurance policy requires the insurer notonly to pay money on behalf of the insured to a third party but also to provide legal and investigativeservices needed when the event insured against occurs. The terms of some health insurance policies arefulfilled by providing medical and hospital services (e.g., a semiprivate room and board, plus other hos-pital services) if the insured is ill or injured. Whether the insurer fulfills its obligations with money orwith services, the burden it assumes is financial. The insurer does not guarantee that the event insuredagainst will not happen. Moreover, it cannot replace sentimental value or bear the psychological cost ofa loss. A home may be worth only $80,000 for insurance purposes, but it may have many times thatvalue to the owner in terms of sentiment. The death of a loved one can cause almost unbearable mentalsuffering that is in no way relieved by receiving a sum of money from the insurer. Neither of these as-pects of loss can be measured in terms of money; therefore, such risks cannot be transferred to an in-surer. Because these noneconomic risks create uncertainty, it is apparent that insurance cannot com-pletely eliminate uncertainty. Yet insurance performs a great service by reducing the financial uncer-tainty created by risk.
2.2 Insurance or Not?In the real world, a clear definition of what is considered an insurance product does not always exist.The amount of risk that is transferred is usually the key to determining whether a certain accountingtransaction is considered insurance or not. A case in point is the product called finite risk. It was usedby insurers and reinsurers and became the center of a controversy that led to the resignation of HankGreenberg, the former chairperson and chief executive officer (CEO) of American International Group(AIG) in 2006. Finite risk programs are financial methods that can be construed as financing risk as-sumptions. They began as arrangements between insurers and reinsurers, but they can also be arrange-ments between any business and an insurer. Premiums paid by the corporation to finance potentiallosses (losses as opposed to risks) are placed in an experience fund, which is held by the insurer. Overtime, the insured pays for his or her own losses through a systematic payment plan, and the funds areinvested for the client. This arrangement raises the question, Is risk transferred, or is it only an ac-counting transaction taking place? The issue is whether finite risk should be called insurance withoutthe elements of insurance. The rule is that, if there is no transfer of at least 10 percent of the risk, regu-lators regard the transaction as a noninsurance transaction that has less favorable accounting treatmentfor losses and taxes.[1]
Risk Pooling (Loss Sharing)
In general, the bulk of the premium required by the insurer to assume risk is used to compensate thosewho incur covered losses. Loss sharing is accomplished through premiums collected by the insurerfrom all insureds—from those who may not suffer any loss to those who have large losses. In this re-gard, the losses are shared by all the risk exposures who are part of the pool. This is the essence ofpooling.
Pooling can be done by any group who wishes to share in each other’s losses. The pooling allows amore accurate prediction of future losses because there are more risk exposures. Being part of poolingis not necessarily an insurance arrangement by itself. As such, it is not part of the transfer of risk to athird party. In a pooling arrangement, members of the group pay each other a share of the loss. Eventhose with no losses at all pay premiums to be part of the pooling arrangement and enjoy the benefitsof such an arrangement. For this purpose, actuaries, charged with determining appropriate rates
106 RISK MANAGEMENT FOR ENTERPRISES AND INDIVIDUALS
discriminate
Classify exposures accordingto expected loss.
(prices) for coverage, estimate the frequency and severity of losses and the loss distribution discussed inChapter 2. These estimates are made for a series of categories of insureds, with each category intendedto group insureds who are similar with regard to their likelihood. An underwriter then has the job ofdetermining which category is appropriate for each insured (see the discussion in Chapter 6). Actuariescombine the information to derive expected losses. Estimates generally are based on empirical (in thiscase, observed) data or theoretical relationships, making them objective estimates. When the actuarymust rely on judgment rather than facts, the estimates are termed subjective. In most cases, both object-ive and subjective estimates are used in setting rates. For example, the actuary may begin with in-dustry—determined rates based on past experience and adjust them to reflect the actuary’s instinctsabout the insurer’s own expected experience. A life insurer may estimate that 250 of the 100,000 riskexposures of forty-year-old insureds it covers will die in the next year. If each insured carries a $1,000policy, the insurer will pay out $250,000 in claims (250 × $1,000). To cover these claims, the insurer re-quires a premium of $2.50 from each insured ($250,000/100,000), which is the average or expected costper policyholder. (An additional charge to cover expenses, profit, and the risk of actual losses exceedingexpected losses would be included in the actual premium. A reduction of the premium would resultfrom the insurer sharing its investment earnings with insureds.) In Chapter 6, we provide the loss de-velopment calculations that are performed by the actuary to determine the rates and calculate howmuch the insurer should keep on reserve to pay future expected claims. Chapter 6 also explains the re-lationship between rates and investment income of insurers.
2.3 Discrimination: The Essence of PoolingIn order for the law of large numbers to work, the pooled exposures must have approximately the sameprobability of loss (that is, it must follow the same probability distribution, as demonstrated in Chapter2). In other words, the exposures need to be homogeneous (similar). Insurers, therefore, need to dis-criminate, or classify exposures according to expected loss. For this reason, twenty-year-old insuredswith relatively low rates of mortality are charged lower rates for life insurance than are sixty-year-oldinsureds, holding factors other than age constant. The rates reflect each insured’s expected loss, whichis described in the box “Fitting into a Lower Risk-Exposure Pooling Group.”
If the two groups of dissimilar risk exposures were charged the same rate, problems would arise.As previously stated, rates reflect average loss costs. Thus, a company charging the same rate to bothtwenty-year-old insureds and sixty-year-old insureds would charge the average of their expected losses.The pooling will be across ages, not by ages. Having a choice between a policy from this company andone from a company that charged different rates based on age, the sixty-year-old insureds wouldchoose this lower-cost, single-rate company, while the young insureds would not. As a result, sixty-year-old policyholders would be overrepresented in the group of insureds, making the average rate in-sufficient. The sixty-year-old insureds know they represent higher risk, but they want to enjoy lowerrates.
Fitting into a Lower Risk-Exposure Pooling Group
Your insurance company relies on the information you provide. Your obligation to the insurance company isnot only to provide correct information, but also to provide complete information in order to be placed withyour appropriate risk pooling group. The similar exposure in the pooling group is essential for the risk to be in-surable, as you saw in this chapter.
Because automobile insurance is an issue of great concern to most students, it is important to know how tohandle the process of being placed in the appropriate risk pool group by an insurer. What do you need to tellthe insurance agent when you purchase automobile insurance? The agent, usually the first person you talk to,will have routine questions: the make and model of the automobile, the year of manufacture, the location(where the car is parked overnight or garaged), and its usage (e.g., commuting to work). The agent will also askif you have had any accidents or traffic violations in the past three to five years.
You might be tempted to tell the agent that you keep the automobile at your parents’ home, if rates there arecheaper. You may also be tempted to tell the agent that you have not had any traffic violations, when actuallyyou have had three in the past year. Certainly, your insurance premium will be lower if the agent thinks youhave a clean record, but that premium savings will mean very little to you when the insurer notifies you ofdenial of coverage because of dishonesty. This occurs because you gave information that placed you in thewrong risk pool and you paid the wrong premiums for your characteristics.
CHAPTER 5 THE INSURANCE SOLUTION AND INSTITUTIONS 107
Safe driving is the key to maintaining reasonable auto insurance premiums because you will be placed in theless risky pool of drivers. The possibility of being placed in a high-risk pool and paying more premiums can bereduced in other ways, too:
< Avoiding traffic violations and accidents helps reduce the probability of loss to a level that promotesthe economic feasibility of premiums.
< Steering clear of sports cars and lavish cars, which place you in a group of similar (homogeneous)insureds. Furthermore, a car that is easily damaged or expensive to repair will increase your physicaldamage premiums.
< Costs can be reduced further if you use your car for pleasure only instead of driving to and from work.Riding the bus or in a friend’s car will lower the probability of an accident, making you a moredesirable policyholder. Living outside the city limits has a similar effect.
< Passing driving courses, maintaining a grade point average of at least B, and not drinking earndiscounts on premiums.
This phenomenon of selecting an insurer that charges lower rates for a specific risk exposure is knownas adverse selection because the insureds know they represent higher risk, but they want to enjoy lowerrates. Adverse selection occurs when insurance is purchased more often by people and/or organiza-tions with higher-than-average expected losses than by people and/or organizations with average orlower-than-average expected losses. That is, insurance is of greater use to insureds whose losses are ex-pected to be high (insureds “select” in a way that is “adverse” to the insurer). On this basis alone, noproblem exists because insurers could simply charge higher premiums to insureds with higher expectedlosses. Often, however, the insurer simply does not have enough information to be able to distinguishcompletely among insureds, except in cases of life insurance for younger versus older insureds. Fur-thermore, the insurer wants to aggregate in order to use the law of large numbers. Thus, some tensionexists between limiting adverse selection and employing the law of large numbers.
Adverse selection, then, can result in greater losses than expected. Insurers try to prevent thisproblem by learning enough about applicants for insurance to identify such people so they can eitherbe rejected or put in the appropriate rating class of similar insureds with similar loss probability. Manyinsurers, for example, require medical examinations for applicants for life insurance.
Some insurance policy provisions are designed to reduce adverse selection. The suicide clause inlife insurance contracts, for example, excludes coverage if a policyholder takes his or her own life with-in a specified period, generally one or two years. The preexisting conditions provision in health insur-ance policies is designed to avoid paying benefits to people who buy insurance because they are aware,or should be aware, of an ailment that will require medical attention or that will disable them in thenear future.[2]
K E Y T A K E A W A Y S
In this section you studied the following:
< The essence of insurance, which is risk transfer and risk pooling
< The necessity of discrimination in order to create pools of insureds
< The fact that insurance provides risk reduction
D I S C U S S I O N Q U E S T I O N S
1. What is the definition of insurance?
2. What is the law of large numbers? Why do insurers rely on the law of large numbers?
3. Why is it necessary to discriminate in order to pool?
4. Why are finite risk programs not considered insurance?
108 RISK MANAGEMENT FOR ENTERPRISES AND INDIVIDUALS
3. IDEAL REQUISITES FOR INSURABILITY
L E A R N I N G O B J E C T I V E S
In this section you will learn the following:
< Why so many risks cannot be insured by private insurance companies< The definition of insurable risks by private insurers< Why catastrophes such as floods are not insurable risks by private insurers
Soon after the devastation of Hurricane Katrina became known, the Mississippi attorney general filed alawsuit against insurers claiming that the flood should be covered by homeowner’s insurance policies.The controversy over coverage was explored in the September 8, 2005, New York Times article,“Liability Issue: Wind or Water?” Is this question so open-ended?
Are all pure risks insurable by private (nongovernmental) insurers? No. The private insurancedevice is not suitable for all risks. Many risks are uninsurable. This section is devoted to a discussion ofthe requirements that must generally be met if a risk is to be insurable in the private market. As a prac-tical matter, many risks that are insured privately meet these requirements only partially or, with refer-ence to a particular requirement, not at all. Thus, in a sense, the requirements listed describe those thatwould be met by the ideal risk. Nevertheless, the bulk of the risks insured fulfill—at least approxim-ately—most of the requirements. No private insurer can safely disregard them completely.[3] A risk thatwas perfectly suited for insurance would meet the following requirements:
1. The number of similar exposure units is large.2. The losses that occur are accidental.3. A catastrophe cannot occur.4. Losses are definite.5. The probability distribution of losses can be determined.6. The cost of coverage is economically feasible.
The sixth requirement in the list above influences the consumer demand for insurance and looks atwhat is economically feasible from the perspective of potential insureds. The other requirements in-fluence the willingness of insurers to supply insurance.
3.1 Many Similar Exposure UnitsAs noted, an insurance organization prefers to have a large number of similar units when insuring apossible loss exposure. The concepts of mass and similarity are thus considered before an insurer ac-cepts a loss exposure. Some insurance is sold on exposures that do not possess the requirements ofmass and similarity, but such coverage is the exception, not the rule. An example is insurance on thefingers of a concert pianist or on prize-winning racehorses. When there are no masses of exposures, thecoverage is usually provided by specialty insurers. Lloyd’s of London, for example, is known for insur-ing nonmass exposures such as Bruce Springsteen’s voice. The types of insurers will be discussed inChapter 6.
Mass
A major requirement for insurability is mass; that is, there must be large numbers of exposure units in-volved. For automobile insurance, there must be a large number of automobiles to insure. For life in-surance, there must be a large number of persons. An automobile insurance company cannot insure adozen automobiles, and a life insurance company cannot insure the lives of a dozen persons. How largeis a “large group”? For insurance purposes, the number of exposure units needed in a group dependson the extent to which the insurer is willing to bear the risk of deviation from its expectations. Supposethe probability of damage to houses is 1/1,000. An insurer might assume this risk for 1,000 houses, withthe expectation that one claim would be made during the year. If no houses were damaged, there wouldbe a 100 percent deviation from expectations, but such a deviation would create no burden for the in-surer. On the other hand, if two houses were damaged, the claims to be paid would be twice the expec-ted number. This could be a severe burden for the insurer, assuming average or higher loss severities.By increasing the number of similar houses insured to 10,000, the expected number of losses increasesto ten, but the stability of experience is increased. That is, there is a proportionately smaller deviation
CHAPTER 5 THE INSURANCE SOLUTION AND INSTITUTIONS 109
fortuitous
A matter of chance.
catastrophic loss
Loss that could imperil theinsurer’s solvency.
dependent loss
When loss to one exposureunit affects the probability ofloss to another.
from expected losses than would exist with a group of 1,000 houses. Similarly, if the group is increasedto 100,000 houses, the variation between actual and expected losses would be likely to increase in abso-lute terms, but it would decline proportionately. One additional loss from 100,000 houses is propor-tionally less than one additional loss from 10,000 houses and even less than one additional loss from1,000 houses.
Similarity
The loss exposures to be insured and those observed for calculating the probability distributions musthave similarities. The exposures assumed by insurers are not identical, no matter how carefully theymay be selected. No two houses are identical, even though physically they may appear to be. They can-not have an identical location and, perhaps more important, they are occupied by different families.Nevertheless, the units in a group must be reasonably similar in characteristics if predictions concern-ing them are to be accurate. For example, homes with brick sidings are similar for insurance purposes.
Moreover, probability distributions calculated on the basis of observed experience must also in-volve units similar to one another. Observing the occupational injuries and illnesses of a group ofpeople whose ages, health conditions, and occupations were all different would not provide a basis forcalculating workers’ compensation insurance rates. For example, clerical work typically involves muchlower probabilities of work-related loss than do occupations such as logging timber or climbing utilitypoles. Estimates based on experience require that the exposure units observed be similar to one anoth-er. Moreover, such estimates are useful only in predicting losses for comparable exposures.
3.2 Accidental LossesThe risks assumed by an insurer must involve only the possibility, not the certainty, of loss to the in-sured. Insurable losses must be accidental or fortuitous; that is, they must be a matter of chance.Ideally, the insured should have no control or influence over the event to be insured. In fact, this situ-ation prevails only with respect to limited situations. As mentioned in Chapter 1, intangible and phys-ical hazards influence the probability of loss. Prediction of potential losses is based on a probability dis-tribution that has been estimated by observing past experience. Presumably, the events observed were,for the most part, fortuitous occurrences. The use of such estimates for predicting future losses is basedon the assumption that future losses will also be a matter of chance. If this is not the case, predictionscannot be accurate.
3.3 Small Possibility of CatastropheThe possibility of catastrophic loss may make a loss exposure uninsurable. A catastrophic loss to aninsurer is one that could imperil the insurer’s solvency. When an insurer assumes a group of risks, itexpects the group as a whole to experience some losses—but only a small percentage of the groupmembers to suffer loss at any one time. Given this assumption, a relatively small contribution by eachmember of the group will be sufficient to pay for all losses. It is possible for a large percentage of all in-sureds to suffer a loss simultaneously; however, the relatively small contributions would not providesufficient funds. Similarly, a single very large loss would also require large contributions. Thus, a re-quisite for insurability is that there must be no excessive possibility of catastrophe for the group as awhole. Insurers must be reasonably sure that their losses will not exceed certain limits. Insurers buildup surpluses (net worth) and contingency reserves (funds for future claims) to take care of deviationsof experience from the average, but such deviations must have practical limits. If losses cannot be pre-dicted with reasonable accuracy and confidence, it is impossible to determine insurance premium rates,the size of surpluses, or the net worth required.
Catastrophic losses may occur in two circumstances. In the first, all or many units of the group areexposed to the same loss-causing event, such as war, flood, tornado, mudslide, forest fire, hurricane,earthquake, tsunami, terrorist attack, or unemployment. For example, if one insurer had assumed therisk of damage by wind (hurricane) for all houses in the Miami, Florida, area, it would have suffered acatastrophic loss in 1992 when many structures were damaged simultaneously by Hurricane Andrew(and in fact several insurers were unable to withstand the losses). The 2005 hurricanes, which causedthe largest-ever insured losses, are an example of a megacatastrophe that affected many units. These areexamples of exposure units that suffer from the same cause of loss because of geographic proximity.Exposure units are susceptible to dependent loss when loss to one exposure unit affects the probabil-ity of loss to another. Thus, fire at one location increases the probability of fire at other homes in thearea: their experience is dependent. In the early days of insurance in the United States, many fire insur-ance companies concentrated their business in small areas near their headquarters. This worked inNew York City, for example, until a major fire devastated large sections of the city in 1835. Because of
110 RISK MANAGEMENT FOR ENTERPRISES AND INDIVIDUALS
their concentrated exposures, several insurers suffered losses to a large percentage of their business.The insurers were unable to pay all claims, and several went bankrupt.
A recent example of catastrophe exposure is the case of the risk of mold. Mold created a majoravailability and affordability issue in the homeowner’s and commercial property insurance markets inthe early 2000s. The Wall Street Journal article, “Hit With Big Losses, Insurers Put Squeeze onHomeowner Policies,” reported massive exclusions of mold coverage because of the “avalanche ofclaims.”[4]
A second type of catastrophe exposure arises when a single large value may be exposed to loss.September 11, 2001, represents such catastrophic loss. Tremendous value was concentrated in thetowers of the World Trade Center. The possibility of a human-made catastrophe of such magnitudewas not anticipated. Private insurers stopped short of calling the terrorist attacks “acts of war”—whichwould have been excluded from coverage—and honored the policies covering the World Trade Centerand the lives of the victims. However, one consequence was the industry’s action to immediately ex-clude terrorism coverage from new policies until the Terrorism Risk Insurance Act (TRIA) of 2002provided stop-gap coverage from the federal government. When insurers and reinsurers (the insurersof the insurance companies) see the peril as having a far higher probability than previously perceived,they know that they can no longer accurately predict future losses, and their immediate reaction is toexclude the peril. Because of regulation and oversight (see Chapter 7), however, the industry cannotmake policy changes instantaneously.[5] When private insurers can no longer provide coverage, a solu-tion may be to create pools such as those described in the box below, “Who Should Insure AgainstMegacatastrophes?” More on this topic and on reinsurance will be explained in Chapter 6.
3.4 Definite LossesLosses must be definite in time, place, and amount because, in many cases, insurers promise to pay indollar amounts for losses if they occur during a particular time and in a particular geographical area.For example, the contract may cover loss by fire at a specified location. For this contract to be effective,it must be possible to determine when, where, and how much loss occurred. If this cannot be estab-lished, it is impossible to determine whether the loss is covered under the terms of the contract. Thefact that pain and suffering is hard to measure in dollar terms increases the insurer’s risk when calculat-ing rates for liability insurance. One other reason the requirement of definiteness is essential is that it isnecessary to accumulate data for future predictions. Unless such data can be accurate, they cannotprovide the basis for useful predictions.
3.5 Determinable Probability DistributionFor an exposure to loss to be insurable, the expected loss must be calculable. Ideally, this means thatthere is a determinable probability distribution for losses within a reasonable degree of accuracy. Insur-ance premium rates are based on predictions of the future, which are expressed quantitatively as expec-ted losses. Calculation of expected losses requires the use of estimated probability distributions(discussed in detail in Chapter 2).
Probability distributions based on experience are useful for prediction; however, only when it issafe to assume that factors shaping events in the future will be similar to those of the past. For this reas-on, mortality (death) rates during times of peace are inappropriate for estimating the number of in-sured deaths during times of war. Similarly, the introduction of new technologies such as foamblanketing makes past experience of fire damage a poor indicator of future experience. Yet, because thetechnology is new and no theory exists as to what the losses ought to be, actuaries have little informa-tion on which to base lower rates. The actuary must use subjective estimates as well as engineering in-formation to develop proper rates.
When the probability distribution of losses for the exposure to be insured against cannot be calcu-lated with reasonable accuracy, the risk is uninsurable. An example of purported uninsurability due toinability to predict losses is the nuclear power industry. Insurance experts convinced government offi-cials in 1957 that the risk of loss caused by an incident at a nuclear power site was too uncertain(because of lack of experience and unknown maximum severity) for commercial insurers to acceptwithout some government intervention. As a result, the government limited the liability of owners ofnuclear power plants for losses that could arise from such incidents.
CHAPTER 5 THE INSURANCE SOLUTION AND INSTITUTIONS 111
economically feasible
When the size of the possibleloss must be significant to theinsured and the cost ofinsurance must be smallcompared with the potentialloss.
Who Should Insure against Megacatastrophes?
The incredible losses from hurricanes Wilma, Rita, and Katrina, including the breached levees in low-lying NewOrleans and the subsequent bungled inaction by local, state, and federal authorities, opened a major publicdebate in the United States. On one level (which is not the focus of this text), the dialogue focused on whoshould have been first responder and what processes can be put in place to ensure that history does not re-peat itself. The second topic of the debate (which we will focus on) was who should pay for such disasters inthe future. The economic loss of Katrina and its aftermath was estimated to surpass $100 to $150 billion, largeportions of which were not insured. As you will learn in Chapter 1, flood is insured only by the federal govern-ment through the National Federal Insurance Program, and the coverage limits are low, at $250,000. Manyflooded homes and businesses in Louisiana and Mississippi did not carry this insurance. Even if they carried thecoverage, the limits prevented recovery of their true property values. Residents had to resort to other assist-ance programs, some from the Federal Emergency Management Agency (FEMA).
The unprecedented economic loss is at the heart of the debate. Who should insure against such megacata-strophes in the future? The Insurance Information Institute (III) provided a summary of the proposals that wereput forward during the public dialogue about how large-scale natural catastrophes should be managed in thepost-9/11 era. The following are two main viewpoints:
1. Because the private industry cannot insure mega losses that are fundamentally uninsurable, thefederal government should be the ultimate insurer. The federal government is already the nationalflood insurer and has been providing the terrorism stopgap coverage under the Terrorism RiskInsurance Act (TRIA). It makes sense that uninsurable risks be mitigated by the government. Theinsurance commissioners of Florida, California, and New York proposed a national catastrophe fund.Others suggested amendment to the federal tax code for insurers’ reserves. The idea is that coveragewould still be provided by insurers, but states would create pools, and above them, a third layerwould be provided for national megacatastrophes by the federal government. Involvement by thefederal government in case of large-scale losses has elements of the Terrorism Risk Insurance Act thatwas extended until the end of 2014.
2. Because we are living in a free market economy, the private sector is best suited to handle anydisaster, large or small. The idea is to have less government, with relaxed regulation and taxation. Thecreativity of the private sector should prevail. The government should not compete with privateinsurance and reinsurance markets. In this scenario, insurers have more capacity and thus moreactuarially sound predictions to set appropriate rates. To prove the point, the industry was able tosustain both 9/11 and Katrina (except that the industry has not been responsible for the flooddamages). If the private industry takes over all potential mega losses, there does need to be greatimprovement, however, in catastrophe modeling. The industry will have to diversify and utilize thecapital markets (see Chapter 4 about CAT bonds). It is predicted that the industry will ensure high-quality loss control in areas with potential disasters through building codes, strengthening of levees,and utilization of all possible disaster management techniques.
Questions for Discussion
1. Because large-scale human-made and natural disasters are not controllable by insurers, should thegovernment pay for damages?
2. Because insurance is the business of insurers, should they handle their problems without beingsubsidized by taxpayers? What would be the outcome in terms of safety and loss controls?
Sources: This box relied on information from articles from the National Underwriter, Business Insurance, and the Insurance Information Institute (III) athttp://www.iii.org.
3.6 Economic FeasibilityFor insurance to be economically feasible for an insured, the size of the possible loss must be sig-nificant to the insured, and the cost of insurance must be small compared to the potential loss. Other-wise, the purchase of insurance is not practical. If the possible loss is not significant to those exposed,insurance is inappropriate. Cost-benefit analysis is needed for the insurers to determine if the rates canbe feasible to insureds. Also, the analysis in Chapter 4 regarding the actuarially fair premiums a risk-averse individual would be willing to pay is important here. For catastrophic coverage, the insurer maydetermine through capital budgeting methods and cash flow analysis that it cannot provide low enoughcosts to make the coverage feasible for insureds.
Retention (bearing the financial loss by oneself) of many risks is almost automatic because the losswould not be a burden. If all the people who own automobiles were wealthy, it is doubtful that muchautomobile collision insurance would be written because such losses would not be significant to thewealthy owners. Insurance is feasible only when the possible loss is large enough to be of concern to theperson who may bear the burden.
112 RISK MANAGEMENT FOR ENTERPRISES AND INDIVIDUALS
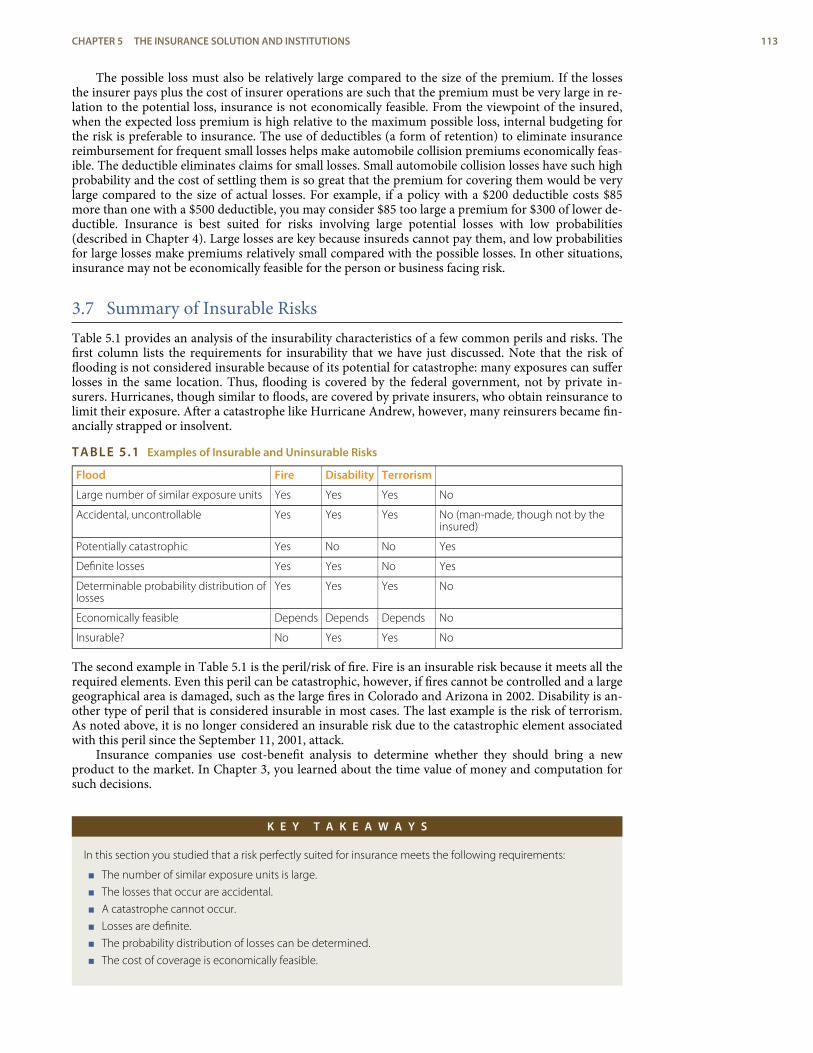
The possible loss must also be relatively large compared to the size of the premium. If the lossesthe insurer pays plus the cost of insurer operations are such that the premium must be very large in re-lation to the potential loss, insurance is not economically feasible. From the viewpoint of the insured,when the expected loss premium is high relative to the maximum possible loss, internal budgeting forthe risk is preferable to insurance. The use of deductibles (a form of retention) to eliminate insurancereimbursement for frequent small losses helps make automobile collision premiums economically feas-ible. The deductible eliminates claims for small losses. Small automobile collision losses have such highprobability and the cost of settling them is so great that the premium for covering them would be verylarge compared to the size of actual losses. For example, if a policy with a $200 deductible costs $85more than one with a $500 deductible, you may consider $85 too large a premium for $300 of lower de-ductible. Insurance is best suited for risks involving large potential losses with low probabilities(described in Chapter 4). Large losses are key because insureds cannot pay them, and low probabilitiesfor large losses make premiums relatively small compared with the possible losses. In other situations,insurance may not be economically feasible for the person or business facing risk.
3.7 Summary of Insurable RisksTable 5.1 provides an analysis of the insurability characteristics of a few common perils and risks. Thefirst column lists the requirements for insurability that we have just discussed. Note that the risk offlooding is not considered insurable because of its potential for catastrophe: many exposures can sufferlosses in the same location. Thus, flooding is covered by the federal government, not by private in-surers. Hurricanes, though similar to floods, are covered by private insurers, who obtain reinsurance tolimit their exposure. After a catastrophe like Hurricane Andrew, however, many reinsurers became fin-ancially strapped or insolvent.
TABLE 5.1 Examples of Insurable and Uninsurable Risks
Flood Fire Disability Terrorism
Large number of similar exposure units Yes Yes Yes No
Accidental, uncontrollable Yes Yes Yes No (man-made, though not by theinsured)
Potentially catastrophic Yes No No Yes
Definite losses Yes Yes No Yes
Determinable probability distribution oflosses
Yes Yes Yes No
Economically feasible Depends Depends Depends No
Insurable? No Yes Yes No
The second example in Table 5.1 is the peril/risk of fire. Fire is an insurable risk because it meets all therequired elements. Even this peril can be catastrophic, however, if fires cannot be controlled and a largegeographical area is damaged, such as the large fires in Colorado and Arizona in 2002. Disability is an-other type of peril that is considered insurable in most cases. The last example is the risk of terrorism.As noted above, it is no longer considered an insurable risk due to the catastrophic element associatedwith this peril since the September 11, 2001, attack.
Insurance companies use cost-benefit analysis to determine whether they should bring a newproduct to the market. In Chapter 3, you learned about the time value of money and computation forsuch decisions.
K E Y T A K E A W A Y S
In this section you studied that a risk perfectly suited for insurance meets the following requirements:
< The number of similar exposure units is large.
< The losses that occur are accidental.
< A catastrophe cannot occur.
< Losses are definite.
< The probability distribution of losses can be determined.
< The cost of coverage is economically feasible.
CHAPTER 5 THE INSURANCE SOLUTION AND INSTITUTIONS 113
personal insurance
Insurance that is purchasedby individuals and families fortheir risk needs. Suchinsurance includes life, health,disability, auto, homeowner,and long-term care.
group insurance
Insurance provided by theemployer for the benefit ofemployees.
commercial insurance
Property/casualty insurancefor businesses and otherorganizations.
life/health insurance
Insurance that coversexposures to the perils ofdeath, medical expenses,disability, and old age.
D I S C U S S I O N Q U E S T I O N
Explain whether the following risks and perils are insurable by private insurers:
a. A hailstorm that destroys your roof
b. The life of an eighty-year-old man
c. A flood
d. Mold
e. Biological warfare
f. Dirty bombs
4. TYPES OF INSURANCE AND INSURERS
L E A R N I N G O B J E C T I V E S
In this section you will learn the following:
< The types of insurance< The types of insurance company corporate structures< Governmental insurance organizations
Many types of insurance policies are available to families and organizations that do not wish to retaintheir own risks. The following questions may be raised about an insurance policy:
1. Is it personal, group, or commercial?2. Is it life/health or property/casualty?3. Is it issued by a private insurer or a government agency?4. Is it purchased voluntarily or involuntarily?
4.1 Personal, Group, or Commercial InsurancePersonal insurance is insurance that is purchased by individuals and families for their risk needs.Such insurance includes life, health, disability, auto, homeowner, and long-term care. Group insur-ance is insurance provided by the employer for the benefit of employees. Group insurance coverage in-cludes life, disability, health, and pension plans. Commercial insurance is property/casualty insur-ance for businesses and other organizations.
An insurance company is likely to have separate divisions within its underwriting department forpersonal lines, group lines, and commercial business. The criterion to assign insureds into their appro-priate risk pool for rating purposes is different for each type of insurance. Staff in the personal lines di-vision are trained to look for risk factors (e.g., driving records and types of home construction) that in-fluence the frequency and severity of claims among individuals and families. Group underwriting looksat the characteristics and demographics, including prior experience, of the employee group. The com-mercial division has underwriting experts on risks faced by organizations. Personnel in other function-al areas such as claims adjustment may also specialize in personal, group, or commercial lines.
4.2 Life/Health or Property/Casualty InsuranceLife/health insurance covers exposures to the perils of death, medical expenses, disability, and oldage. Private life insurance companies provide insurance for these perils, and individuals voluntarily de-cide whether or not to buy their products. Health insurance is provided primarily by life/health in-surers but is also sold by some property/casualty insurers. All of these are available on an individualand a group basis. The Social Security program provides substantial amounts of life/health insuranceon an involuntary basis.
114 RISK MANAGEMENT FOR ENTERPRISES AND INDIVIDUALS
property/casualtyinsurance
Insurance that coversproperty exposures such asdirect and indirect losses ofproperty caused by perilssuch as fire, windstorm, andtheft.
stock insurers
Insurers created for thepurpose of making a profitand maximizing the value ofthe organization for thebenefit of the owners.
mutual insurers
Insurers owned andcontrolled, in theory if not inpractice, by theirpolicyowners.
policyowners’ dividends
Profits shared by insurancepolicyholders.
Property/casualty insurance covers property exposures such as direct and indirect losses ofproperty caused by perils like fire, windstorm, and theft. It also includes insurance to cover the possib-ility of being held legally liable to pay damages to another person. Before the passage of multiple-lineunderwriting laws in the late 1940s and early 1950s, property/casualty insurance had to be written bydifferent insurers. Now they frequently are written in the same contract (e.g., homeowner’s and com-mercial package policies, which will be discussed in later chapters).
A private insurer can be classified as either a life/health or a property/casualty insurer. Health in-surance may be sold by either. Some insurers specialize in a particular type of insurance, such as prop-erty insurance. Others are affiliated insurers, in which several insurers (and sometimes noninsurancebusinesses) are controlled by a holding company; all or almost all types of insurance are offered bysome company in the group.
4.3 Private or Government InsuranceInsurance is provided both by privately owned organizations and by state and federal agencies. Meas-ured by premium income, the bulk of property/casualty insurance is provided by private insurers.Largely because of the magnitude of the Social Security program, however, government provides aboutone-third more personal insurance than the private sector. Our society has elected to provide certainlevels of death, health, retirement, and unemployment insurance on an involuntary basis through gov-ernmental (federal and state) agencies. If we desire to supplement the benefit levels of social insuranceor to buy property/casualty insurance, some of which is required, private insurers provide theprotection.
4.4 Voluntary or Involuntary InsuranceMost private insurance is purchased voluntarily, although some types, such as automobile insurance orinsurance on mortgages and car loans, are required by law or contracts. In many states, the purchase ofautomobile liability insurance is mandatory, and if the car is financed, the lender requires propertydamage coverage.
Government insurance is involuntary under certain conditions for certain people. Most people arerequired by law to participate in the Social Security program, which provides life, health, disability, andretirement coverage. Unemployment and workers’ compensation insurance are also forms of involun-tary social insurance provided by the government. Some government insurance, such as flood insur-ance, is available to those who want it, but no one is required to buy it.
4.5 Insurers’ Corporate Structure
Stock Insurers
Stock insurers are organized in the same way as other privately owned corporations created for thepurpose of making a profit and maximizing the value of the organization for the benefit of the owners.Individuals provide the operating capital for the company. Stock companies can be publicly traded inthe stock markets or privately held. Stockholders receive dividends when the company is profitable.
Mutual Insurers
Mutual insurers are owned and controlled, in theory if not in practice, by their policyowners. Theyhave no stockholders and issue no capital stock. People become owners by purchasing an insurancepolicy from the mutual insurer. Profits are shared with owners as policyowners’ dividends. Com-pany officers are appointed by a board of directors that is, at least theoretically, elected by policyown-ers. The stated purpose of the organization is to provide low-cost insurance rather than to make aprofit for stockholders.
Research shows that mutual and stock insurers are highly competitive in the sense that neitherseems to outperform the other. There are high-quality, low-cost insurers of both types. A wise con-sumer should analyze both before buying insurance.
Many mutual insurers in both the life/health and property/casualty fields are large and operateover large areas of the country. These large mutuals do a general business in the life/health and prop-erty/casualty insurance fields, rather than confining their efforts to a small geographic area or a particu-lar type of insured. The largest property/casualty mutual insurer in the United States is State Farm,which was established in 1922 by George J. Mecherle, an Illinois farmer who turned to insurance sales.State Farm grew to be the leading auto and homeowner’s insurer in the United States, with twenty-fiveregional offices, more than 79,000 employees, and nearly 70 million policies in force. Because of its
CHAPTER 5 THE INSURANCE SOLUTION AND INSTITUTIONS 115
Lloyd’s of London
The oldest insuranceorganization in existence.
mutual status, State Farm is overcapitalized (holding relatively more surplus than its peer group orstock companies).
Demutualization
When top managers of a mutual company decide they need to raise capital, they may go through a processcalled demutualization. In the last decade, there was an increase in the number of companies that decided todemutualize and become stock companies. Policyholders, who were owners of the mutual company, receivedshares in the stock company. Part of the motive was to provide top management with an additional avenue ofincome in the form of stock options in the company. The demutualization wave in the life insurance industryreached its peak in December 2001, when the large mutual insurer, Prudential, converted to a stock company.The decade between the mid-1990s and mid-2000s saw the demutualization of twenty-two life insurancecompanies: Unum, Equitable Life, Guarantee Mutual, State Mutual (First American Financial Life), Farm Family,Mutual of New York, Standard Insurance, Manulife, Mutual Life of Canada (Clarica), Canada Life, Industrial Al-liance, John Hancock, Metropolitan Life, Sun Life of Canada, Central Life Assurance (AmerUs), Indianapolis Life,Phoenix Home Life, Principal Mutual, Anthem Life, Provident Mutual, Prudential, and General American MutualHolding Company (which was sold to MetLife through its liquidation by the Missouri Department of Insur-ance).[6]
4.6 Lloyd’s of London: A Global Insurance ExchangeLloyd’s of London is the oldest insurance organization in existence; it started in a coffeehouse inLondon in 1688. Lloyds conducts a worldwide business primarily from England, though it is also li-censed in Illinois and Kentucky. It maintains a trust fund in the United States for the protection of in-sureds in this country. In states where Lloyd’s is not licensed, it is considered a nonadmitted insurer.States primarily allow such nonadmitted insurers to sell only coverage that is unavailable from their li-censed (admitted) insurers. This generally unavailable coverage is known as excess and surplus lines in-surance, and it is Lloyd’s primary U.S. business.
Lloyd’s does not assume risks in the manner of other insurers. Instead, individual members ofLloyd’s, called Names, accept insurance risks by providing capital to an underwriting syndicate. Eachsyndicate is made up of many Names and accepts risks through one or more brokers. Surplus linesagents—those who sell for excess and surplus lines insurers—direct business to brokers at one or moresyndicates. Syndicates, rather than Names, make the underwriting decisions of which risks to accept.Various activities of Lloyd’s are supervised by two governing committees—one for market manage-ment and another for regulation of financial matters. The syndicates are known to accept exotic risksand reinsure much of the asbestos and catastrophic risk in the United States. They also insure aviation.
The arrangement of Lloyd’s of London is similar to that of an organized stock exchange in whichphysical facilities are owned by the exchange, but business is transacted by the members. The personalliability of individual Names has been unlimited; they have been legally liable for their underwritinglosses under Lloyd’s policies to the full extent of their personal and business assets. This point is some-times emphasized by telling new male members that they are liable “down to their cufflinks” and for fe-male members “down to their earrings.” In addition to Names being required to make deposits of cap-ital with the governing committee for financial matters, each Name is required to put premiums into atrust fund that makes them exclusively encumbered to the Name’s underwriting liabilities until the ob-ligations under the policies for which the premiums were paid have been fulfilled. Underwriting ac-counts are audited annually to ensure that assets and liabilities are correctly valued and that assets aresufficient to meet underwriting liabilities. Normally, profits are distributed annually. Following losses,Names may be asked to make additional contributions. A trust fund covers the losses of bankruptNames. A supervisory committee has authority to suspend or expel members.
Seldom does one syndicate assume all of one large exposure; it assumes part. Thus, an individualName typically becomes liable for a small fraction of 1 percent of the total liability assumed in onepolicy. Historically, syndicates also reinsured with each other to provide more risk sharing. The prac-tice of sharing risk through reinsurance within the Lloyd’s organization magnified the impact of heavylosses incurred by Lloyd’s members for 1988 through 1992. Losses for these five years reached the un-precedented level of $14.2 billion. Reinsurance losses on U.S. business were a major contributor tolosses due to asbestos and pollution, hurricanes Hugo and Andrew, the 1989 San Francisco earthquake,the Exxon Valdez oil spill, and other product liabilities.
The massive losses wiped out the fortunes of many Names. In 1953, Lloyd’s consisted of 3,400Names, most of whom were wealthy citizens of the British Commonwealth. By 1989, many lesswealthy, upper-middle-class people had been enticed to become Names with unlimited liability, push-ing the total number of Names to an all-time high of 34,000 in 400 syndicates. By mid-1994, only about17,500 Names and 178 underwriting syndicates (with just ninety-six accepting new business)
116 RISK MANAGEMENT FOR ENTERPRISES AND INDIVIDUALS
captive insurance company
A company that providesinsurance coverage to itsparent company and otheraffiliated organizations.
remained. As a result of the mammoth total losses (and bankruptcy or rehabilitation for many indi-vidual members), Lloyd’s had reduced underwriting capacity and was experiencing difficulty in attract-ing new capital. What started in a coffeehouse was getting close to the inside of the percolator.
Among Lloyd’s reforms was the acceptance of corporate capital. By mid-1994, 15 percent of itscapital was from twenty-five corporations that, unlike individual Names, have their liability limited tothe amount of invested capital. Another reform consisted of a new system of compulsory stop-loss in-surance designed to help members reduce exposure to large losses. Reinsurance among syndicates hasceased.
Other forms of insurance entities that are used infrequently are not featured in this textbook.
4.7 Banks and InsuranceFor decades, savings banks in Massachusetts, New York, and Connecticut have sold life insurance inone of two ways: by establishing life insurance departments or by acting as agents for other savingsbanks with insurance departments. Savings banks sell the usual types of individual life insurancepolicies and annuities, as well as group life insurance. Business is transacted on an over-the-counterbasis or by mail. No agents are employed to sell the insurance; however, advertising is used extensivelyfor marketing. Insurance is provided at a relatively low cost.
Many savings and loan associations have been selling personal property/casualty insurance (andsome life insurance) through nonbanking subsidiaries. Commercial banks have lobbied hard for per-mission to both underwrite (issue contracts and accept risks as an insurer) and sell all types of insur-ance. Approximately two-thirds of the states have granted state-chartered banks this permission. Atthis time, national banks have not been granted such power.[7]
In November 1999, State Farm Mutual Automobile Insurance Company opened State Farm Bank.At the time of this writing, State Farm has banking services in eleven states—Alabama, Arizona, Color-ado, Illinois, Indiana, Mississippi, Missouri, New Mexico, Nevada, Utah, and Wyoming—and plans toexpand to all fifty states. The banking division benefits from State Farm’s 16,000 agents, who can mar-ket a full range of banking products.[8]
The U.S. Supreme Court approved (with a 9–0 vote) the sale of fixed-dollar and variable annuitiesby national banks, reasoning that annuities are investments rather than insurance. Banks are strong inannuities sales.
4.8 Captives, Risk Retention Groups, and Alternative MarketsRisk retention groups and captives are forms of self-insurance. Broadly defined, a captive insurancecompany is a company that provides insurance coverage to its parent company and other affiliated or-ganizations. The captive is controlled by its policyholder-parent. Some captives sell coverage to non-affiliated organizations. Others are comprised of members of industry associations, resulting in cap-tives that closely resemble the early mutual insurers.
Forming a captive insurer is an expensive undertaking. Capital must be contributed in order to de-velop a net worth sufficient to meet regulatory (and financial stability) requirements. Start-up costs forlicensing, chartering, and managing the captive are also incurred. And, of course, the captive needsconstant managing, requiring that effort be expended by the firm’s risk management department and/or that a management company be hired.
To justify these costs, the parent company considers various factors. One is the availability of in-surance in the commercial insurance market. During the liability insurance crisis of the 1980s, for ex-ample, pollution liability coverage became almost nonexistent. Chemical and other firms formed cap-tives to fill the void. Today, there is a big push for captives after the losses of September 11. Anotherfactor considered in deciding on a captive is the opportunity cost of money. If the parent can use fundsmore productively (that is, can earn a higher after-tax return on investment) than the insurer can, theformation of a captive may be wise. The risk manager must assess the importance of the insurer’sclaims adjusting and other services (including underwriting) when evaluating whether to create a cap-tive. Insurers’ services are very important considerations. One reason to create a captive is to have ac-cess to the reinsurance market for stop-loss catastrophic coverage for the captive. One currently popu-lar use of captives is to coordinate the insurance programs of a firm’s foreign operations. An added ad-vantage of captives in this setting is the ability to manage exchange rate risks as well as the pure risksmore common to traditional risk managers. Perhaps of primary significance is that captives give theirparents access to the reinsurance market.
Captive managers in Bermuda received many inquiries after September 11, 2001, as U.S. insurancebuyers searched for lower rates. The level of reinsurance capacity is always a concern for captive own-ers because reinsurers provide the catastrophic layer of protection. In the past, reinsurance was ratherinexpensive for captives.[9]
CHAPTER 5 THE INSURANCE SOLUTION AND INSTITUTIONS 117
risk retention group
A group that provides riskmanagement and retentionto a few players in the sameindustry who are too small toact on their own.
governmental risk pools
Pools formed forgovernmental entities toprovide group self-insurancecoverage.
A special form of self-insurance is known as a risk retention group.[10] An interesting exampleof the risk retention group in practice is the one formed recently by the airline industry, which suffereddisproportional losses as a result of September 11, 2001. A risk retention group designed to cover pas-senger and third-party war risk liability for airlines gained regulatory approval in Vermont.[11] The riskretention group for airlines is named Equitime, and it was formed by the Air Transport Association(ATA), a Washington, D.C.-based trade group, and Marsh, Inc. (one of the largest brokerage firmsworldwide). Equitime offers as much as $1.5 billion in combined limits for passenger and third-partywar risk liability. Equitime’s plan is to retain $300 million of the limit and reinsure the balance with thefederal government. The capitalization of this risk retention group is through a private placement ofstock from twenty-four airlines belonging to the ATA and about fifty members of the Regional AirlineAssociation.[12]
Alternative markets are the markets of all self-insurance programs. Captives and group captiveswill see steady growth in membership. In addition, governmental risk pools have been formed forgovernmental entities to provide group self-insurance coverage such as the Texas Association of SchoolBoards (TASB), municipals risk pools, and other taxing-authorities pools. TASB, for example, offers tothe Texas school districts a pooling arrangement for workers’ compensation and property, liability, andhealth insurance. Public risk pools have a large association, the Public Risk Management Association(PRIMA), which provides support and education to public risk pools.[13]
4.9 Government Insuring OrganizationsFederal and state government agencies account for nearly half of the insurance activity in the UnitedStates. Primarily, they fill a gap where private insurers have not provided coverage, in most cases, be-cause the exposure does not adequately meet the ideal requisites for private insurance. However, somegovernmental programs (examples include the Maryland automobile fund, state workers’ compensa-tion, insurance plans, crop insurance, and a Wisconsin life plan) exist for political reasons. Govern-ment insurers created for political goals usually compete with private firms. This section briefly sum-marizes state and federal government insurance activities.
State Insuring Organizations
< All states administer unemployment compensation insurance programs. All states also haveguaranty funds that provide partial or complete coverage in cases of insurance company failurefrom all insurers in the market. This ensures that the results of insolvencies are not borne solelyby certain policyowners. Covered lines of insurance and maximum liability per policyowner varyby state. Financing is provided on a postloss assessment basis (except for preloss assessments inNew York) by involuntary contributions from all insurance companies licensed in the state. Aninsurer’s contributions to a particular state are proportionate to its volume of business in thestate. No benefits are paid to stockholders of defunct insurers. The funds are responsible for theobligations of insolvent companies owed to their policyowners.
< Eighteen states have funds to insure worker’s compensation benefits. Some funds aremonopolistic, while others compete with private insurers.
< Several states provide temporary nonoccupational disability insurance, title insurance, or medicalmalpractice insurance. Many states provide medical malpractice insurance (discussed inupcoming chapters) through joint underwriting associations (JUAs), which provide coverage tothose who cannot obtain insurance in the regular markets. The JUAs are created by statelegislation. If a JUA experiences losses in excess of its expectations, it has the power to assess allinsurers that write liability insurance in the state. However, rates are supposed to be set at a leveladequate to avoid such assessments. Some states have also created JUAs for lawyers and othergroups that have had difficulty finding insurance in the private market.
< Seven states along the Atlantic and Gulf coasts assure the availability of property insurance, andindirect loss insurance in some states, to property owners of coastal areas exposed to hurricanesand other windstorms. Insurance is written through beach and windstorm insurance plans thatprovide coverage to those who cannot obtain insurance in the regular markets, especially in areasprone to natural catastrophes and hurricanes. Compliance with building codes is encouraged forloss reduction.
< The state of Maryland operates a fund to provide automobile liability insurance to Marylandmotorists unable to buy it in the private market. The Wisconsin State Life Fund sells lifeinsurance to residents of Wisconsin on an individual basis similar to that of private life insurers.In recent years, several states have created health insurance pools to give uninsurable individualsaccess to health insurance. Coverage may be limited and expensive.
118 RISK MANAGEMENT FOR ENTERPRISES AND INDIVIDUALS
Federal Insuring Organizations
< The Social Security Administration, which operates the Social Security program, collects morepremiums (in the form of payroll taxes) and pays more claims than any other insuranceorganization in the United States. The Federal Deposit Insurance Corporation insures depositorsagainst loss caused by the failure of a bank. Credit union accounts are protected by the NationalCredit Union Administration. The Securities Investor Protection Corporation covers securitiesheld by investment brokers and dealers.
< The Federal Crop Insurance Corporation provides open-perils insurance for farm crops. Policiesare sold and serviced by the private market. The federal government provides subsidies andreinsurance.
< The Federal Crime Insurance Program covers losses due to burglary and robbery in bothpersonal and commercial markets.
< Fair Access to Insurance Requirements (FAIR) plans have been established in a number of statesunder federal legislation. They are operated by private insurers as a pool to make propertyinsurance available to applicants who cannot buy it in the regular market. Federal governmentreinsurance pays for excessive losses caused by riots and civil disorder.
< The National Flood Insurance Program provides flood insurance through private agents incommunities that have met federal requirements designed to reduce flood losses. (See Chapter 1for a description of the federal flood insurance.)
< The Veterans Administration provides several programs for veterans. Several federal agenciesinsure mortgage loans made by private lenders against losses due to borrowers failing to makepayments. The Pension Benefit Guaranty Corporation protects certain retirement plan benefits inthe event the plan sponsor fails to fulfill its promises to participants. The Overseas PrivateInvestment Corporation (OPIC) protects against losses suffered by U.S. citizens through politicalrisks in underdeveloped countries.
K E Y T A K E A W A Y S
In this section you studied the different types of insurance:
< Personal, group, or commercial
< Life/health or property/casualty
< Private insurer or a government agency?
< Purchased voluntarily or involuntarily?
< Insurers’ Corporate structure: stock insurers; mutual insurers; Lloyd’s of London; Banks and Insurance;Captives, Risk Retention Groups; Alternative Markets
< Government insuring organizations
D I S C U S S I O N Q U E S T I O N S
1. What types of insurance are available?
2. What are the main organizational structures adopted by insurance companies?
3. Why is the government involved in insurance, and what are the governmental insuring organizationslisted in this section?
4. What is demutualization?
CHAPTER 5 THE INSURANCE SOLUTION AND INSTITUTIONS 119
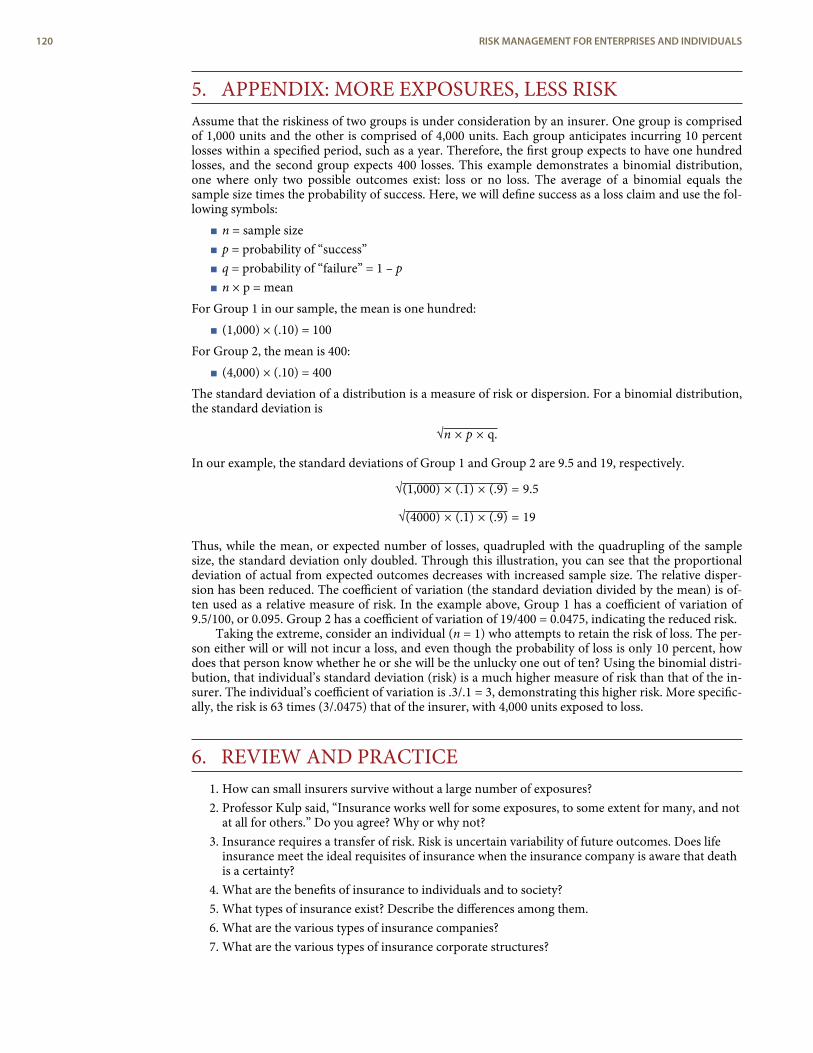
5. APPENDIX: MORE EXPOSURES, LESS RISKAssume that the riskiness of two groups is under consideration by an insurer. One group is comprisedof 1,000 units and the other is comprised of 4,000 units. Each group anticipates incurring 10 percentlosses within a specified period, such as a year. Therefore, the first group expects to have one hundredlosses, and the second group expects 400 losses. This example demonstrates a binomial distribution,one where only two possible outcomes exist: loss or no loss. The average of a binomial equals thesample size times the probability of success. Here, we will define success as a loss claim and use the fol-lowing symbols:
< n = sample size< p = probability of “success”< q = probability of “failure” = 1 – p< n × p = mean
For Group 1 in our sample, the mean is one hundred:< (1,000) × (.10) = 100
For Group 2, the mean is 400:< (4,000) × (.10) = 400
The standard deviation of a distribution is a measure of risk or dispersion. For a binomial distribution,the standard deviation is
√n × p × q.
In our example, the standard deviations of Group 1 and Group 2 are 9.5 and 19, respectively.
√(1,000) × (.1) × (.9) = 9.5
√(4000) × (.1) × (.9) = 19
Thus, while the mean, or expected number of losses, quadrupled with the quadrupling of the samplesize, the standard deviation only doubled. Through this illustration, you can see that the proportionaldeviation of actual from expected outcomes decreases with increased sample size. The relative disper-sion has been reduced. The coefficient of variation (the standard deviation divided by the mean) is of-ten used as a relative measure of risk. In the example above, Group 1 has a coefficient of variation of9.5/100, or 0.095. Group 2 has a coefficient of variation of 19/400 = 0.0475, indicating the reduced risk.
Taking the extreme, consider an individual (n = 1) who attempts to retain the risk of loss. The per-son either will or will not incur a loss, and even though the probability of loss is only 10 percent, howdoes that person know whether he or she will be the unlucky one out of ten? Using the binomial distri-bution, that individual’s standard deviation (risk) is a much higher measure of risk than that of the in-surer. The individual’s coefficient of variation is .3/.1 = 3, demonstrating this higher risk. More specific-ally, the risk is 63 times (3/.0475) that of the insurer, with 4,000 units exposed to loss.
6. REVIEW AND PRACTICE1. How can small insurers survive without a large number of exposures?2. Professor Kulp said, “Insurance works well for some exposures, to some extent for many, and not
at all for others.” Do you agree? Why or why not?3. Insurance requires a transfer of risk. Risk is uncertain variability of future outcomes. Does life
insurance meet the ideal requisites of insurance when the insurance company is aware that deathis a certainty?
4. What are the benefits of insurance to individuals and to society?5. What types of insurance exist? Describe the differences among them.6. What are the various types of insurance companies?7. What are the various types of insurance corporate structures?
120 RISK MANAGEMENT FOR ENTERPRISES AND INDIVIDUALS
8. Hatch’s furniture store has many perils that threaten its operation each day. Explain why each ofthe following perils may or may not be insurable. In each case, discuss possible exceptions to thegeneral answer you have given.
a. The loss of merchandise because of theft when the thief is not caught and Hatch’s cannotestablish exactly when the loss occurred.
b. Injury to a customer when the store’s delivery person backs the delivery truck into thatcustomer while delivering a chair.
c. Injury to a customer when a sofa catches fire and burns the customer’s living room.Discuss the fire damage to the customer’s home as well as the customer’s bodily injury.
d. Injury to a customer’s child who runs down an aisle in the store and falls.e. Mental suffering of a customer whose merchandise is not delivered on schedule.
9. Jack and Jill decide they cannot afford to buy auto insurance. They are in a class with 160students, and they come up with the idea of sharing the automobile risk with the rest of thestudents. Their professor loves the idea and asks them to explain in detail how it will work.Pretend you are Jack and Jill. Explain to the class the following:
a. If you expect to have only three losses per year on average (frequency) for a total of$10,000 each loss (severity), what will be the cost of sharing these losses per student inthe class?
b. Do you think you have enough exposures to predict only three losses a year? Explain.
CHAPTER 5 THE INSURANCE SOLUTION AND INSTITUTIONS 121
1.
2.
3.
4.
5.
6.
7.
8.
9.
10.
11.12.
13.
ENDNOTES
The interested student should also explore it further. In the case of AIG, the finite riskarrangements were regarded as noninsurance transactions. In early 2006, AIG agreedto pay $1.64 billion to settle investigations by the Securities and Exchange Commis-sion and New York State Attorney General Eliot Spitzer, who brought charges againstAIG. This recent real-life example exemplifies how the careful treatment of the defini-tion of insurance is so important to the business and its presentation of its financialcondition. For more information on finite risk programs, see “Finite Risk Reinsurance,”Insurance Information Institute (III), May 2005, at http://www.iii.org/media/hottopics/insurance/finite/; Ian McDonald, Theo Francis, and Deborah Solomon, “Rewriting theBooks—AIG Admits ‘Improper’ Accounting Broad Range of Problems Could Cut$1.77 Billion Of Insurer’s Net Worth A Widening Criminal Probe,” Wall Street Journal,March 31, 2005, A1; Kara Scannell and Ian McDonald, “AIG Close to Deal to SettleCharges, Pay $1.5 Billion,” Wall Street Journal, February 6, 2006, C1; Steve Tuckey, “AIGSettlement Leaves Out Life Issues,” National Underwriter Online News Service, February10, 2006. These articles are representative regarding these topics.
Recent health care reforms (HIPAA 1996) have limited the ability of insurers to re-duce adverse selection through the use of preexisting-condition limitations.
Governmental insurance programs make greater deviations from the ideal requisitesfor insurability. They are able to accept greater risks because they often make theirinsurance compulsory and have it subsidized from tax revenues, while private in-surers operate only when a profit potential exists. The nature of government insur-ance programs will be outlined later in this chapter.
Jeff D. Opdyke and Christopher Oster, “Hit With Big Losses, Insurers Put Squeeze onHomeowner Policies,” Wall Street Journal, May 14, 2002.
Insurance is regulated by the states, a topic that will be covered in more detail inChapter 6.
Arthur D. Postal, “Decision On Demutualization Cost Basis Sought,” National Under-writer, Life and Health Edition, March 25, 2005. Accessed March 5, 2009.http://www.nationalunderwriter.com/lifeandhealth/nuonline/032805/L12decision.asp.
An exception: national commercial banks in communities of less than 5,000 have, formany years, had the right to sell insurance.
Mark E. Ruquet, “Insurer-Bank Integration Stampede Unlikely,” National Underwriter,Property & Casualty/Risk & Benefits Management Edition, April 23, 2001.
Lisa S. Howard, “Tight Re Market Puts Heat On Fronts,” National Underwriter, Property& Casualty/Risk & Benefits Management Edition, March 4, 2002.
President Reagan signed into law the Liability Risk Retention Act in October 1986 (anamendment to the Product Liability Risk Retention Act of 1981). The act permitsformation of retention groups (a special form of captive) with fewer restrictions thanexisted before. The retention groups are similar to association captives. The act per-mits formation of such groups in the United States under more favorable conditionsthan have existed generally for association captives. The act may be particularly help-ful to small businesses that could not feasibly self-insure but can do so within a des-ignated group.
“Vermont Licenses Industry-Backed Airline Insurer,” BestWire, June 11, 2002.
Sue Johnson, “Airline Captive May Be Formed in Second Quarter,” Best’s Review,March 2002. See also the document created by Marsh to explain the program alongwith other aviation protection programs (as of August 14, 2002) athttp://www.marsh.se/files/Third%20Party%20War%20Liability%20Comparison.pdf.
For detailed information about PRIMA, search its Web site athttp://www.primacentral.org/default.php.
122 RISK MANAGEMENT FOR ENTERPRISES AND INDIVIDUALS
C H A P T E R 6Insurance OperationsThe decision to seek coverage is only the first of many important choices you will have to make about insurance.
Whether you are acting as your own personal risk manager or on behalf of your business, it will help you to know
how insurance companies work. This chapter will explain the internal operations of an insurance company and will
dispel the notion that insurance jobs are all sales positions. The marketing aspect of insurance is important, as it is
for any business, but it is not the only aspect. An interesting and distinctive characteristic of insurance is that it is
really a business with two separate parts, each equally important to the success of the operation. One part is the
insurance underwriting business; the other is the investment of the funds paid by insureds.
In this chapter we cover the following:
1. Links
2. Insurance operations: marketing, underwriting, and administration
3. Insurance operations: actuarial analysis and investments
4. Insurance operations: reinsurance, legal and regulatory issues, claims adjusting, and management
1. LINKSAs we have done in each chapter, we first link the chapter to the complete picture of our holistic riskmanagement. As consumers, it is our responsibility to know where our premium money is going andhow it is being used. When we transfer risk to the insurance company and pay the premium, we get anintangible product in return and a contract. However, this contract is for future payments in case oflosses. Only when or if we have a loss will we actually see a return on our purchase of insurance. There-fore, it is imperative that the insurance company be there when we need it. To complete the puzzle ofensuring that our holistic risk management process is appropriate, we also need to understand how ourinsurance company operates. Because the risks are not transferred to just one insurer, we must learnabout the operations of a series of insurers—the reinsurers that insure the primary insurers. The de-scriptions provided in this chapter are typical of most insurers. However, variations should be expec-ted. To grasp how we relate to the operations of a typical insurer, look at Figure 6.1. The figure de-scribes the fluid process of the operations within an insurer. Each function is closely linked to all theother functions, and none is performed in a vacuum. It is like a circular chain in which each link is asstrong as the next one. Because insurers operate in markets with major influences, especially cata-strophes (both natural and human-made), the external conditions affecting the insurers form an im-portant part of this chapter. The regulatory structure of insurers is shown in the second part of the linkin Figure 6.1, which separates the industry’s institutions into those that are government-regulated andthose that are non- or semiregulated. Regardless of regulation, however, insurers are subject to marketconditions.
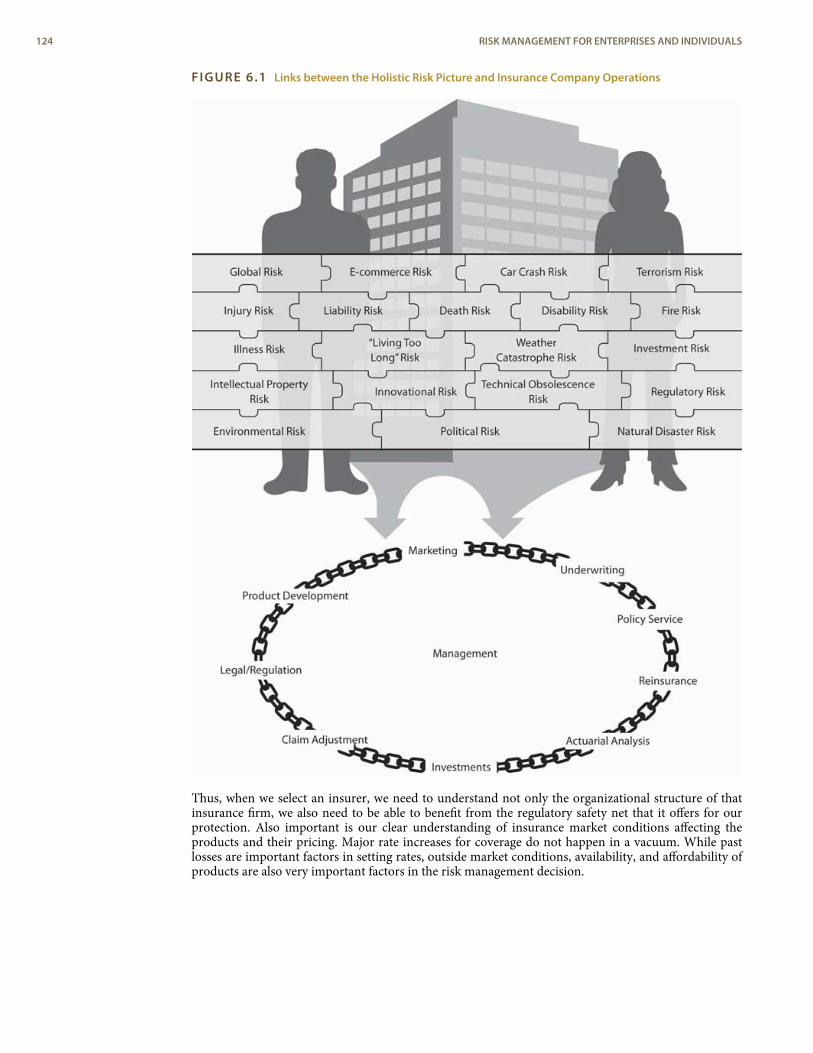
FIGURE 6.1 Links between the Holistic Risk Picture and Insurance Company Operations
Thus, when we select an insurer, we need to understand not only the organizational structure of thatinsurance firm, we also need to be able to benefit from the regulatory safety net that it offers for ourprotection. Also important is our clear understanding of insurance market conditions affecting theproducts and their pricing. Major rate increases for coverage do not happen in a vacuum. While pastlosses are important factors in setting rates, outside market conditions, availability, and affordability ofproducts are also very important factors in the risk management decision.
124 RISK MANAGEMENT FOR ENTERPRISES AND INDIVIDUALS
producer
Another name for bothagents and brokers.
general agent
An independentbusinessperson rather thanan employee of the insurancecompany who is authorizedby contract with the insurerto sell insurance in a specifiedterritory.
2. INSURANCE OPERATIONS: MARKETING,UNDERWRITING, AND ADMINISTRATION
L E A R N I N G O B J E C T I V E S
In this section we elaborate on the following:
< Marketing activities within different segments of the insurance industry< The various types of agency relationships< How agents and brokers differ< The major features of underwriting
2.1 MarketingWe begin with marketing despite the fact that it is not the first step in starting a business. From a con-sumer’s point of view, it is the first glimpse into the operations of an insurer. Insurance may be boughtthrough agents, brokers, or (in some cases) directly from the insurer (via personal contact or on the In-ternet). An agent legally represents the company, whereas a broker represents the buyer and, in half ofthe states, also represents the insurer because of state regulations.[1] Both agents and brokers are com-pensated by the insurer. The compensation issue was brought to the limelight in 2004 when New YorkState Attorney General Eliot Spitzer opened an investigation of contingent commissions that brokersreceived from insurers; these contingent commissions were regarded as bid rigging. Contingent com-missions are paid to brokers for bringing in better business and can be regarded as profit sharing. As aresult of this investigation, regulators look for more transparency in the compensation disclosure ofagents and brokers, and major brokerage houses stopped the practice of accepting contingency com-mission in the belief that clients view the practice negatively.[2]
In many states, producer is another name for both agents and brokers. This new name has beengiven to create some uniformity among the types of distribution systems. Because life/health insuranceand property/casualty insurance developed separately in the United States, somewhat different market-ing systems evolved. Therefore, we will discuss these systems separately.
Life/Health Insurance Marketing
Most life/health insurance is sold through agents, brokers, or (the newest term) producers, who arecompensated by commissions. These commissions are added to the price of the policy. Some insuranceis sold directly to the public without sales commissions. Fee-only financial planners often recommendsuch no-load insurance to their clients. Instead of paying an agent’s commission, the client pays theplanner a fee for advice and counseling and then buys directly from the no-load insurer. Unlike theagent, the planner has no incentive to recommend a high-commission product. Whether your totalcost is lower depends on whether the savings on commissions offsets the planner’s fee.
Some companies insist that their agents represent them exclusively, or at least that agents not sub-mit applications to another insurer unless they themselves have refused to issue insurance at standardpremium rates. Others permit their agents to sell for other companies, though these agents usually havea primary affiliation with one company and devote most of their efforts to selling its policies.
The two dominant types of life/health marketing systems are the general agency and the manageri-al (branch office) system.
General Agency System
A general agent is an independent businessperson rather than an employee of the insurance companyand is authorized by contract with the insurer to sell insurance in a specified territory. Another majorresponsibility is the recruitment and training of subagents. Subagents usually are given the title of agentor special agent. Typically, subagents are agents of the insurer rather than of the general agent. The in-surer pays commissions (a percentage of premiums) to the agents on both new and renewal business.The general agent receives an override commission (a percentage of agents’ commissions) on all busi-ness generated or serviced by the agency, pays most of it to the subagents, and keeps the balance for ex-penses and profit. Agent compensation agreements are normally determined by the insurer.
In most cases, the general agent has an exclusive franchise for his or her territory. The primary re-sponsibilities of the general agent are to select, train, and supervise subagents. In addition, general
CHAPTER 6 INSURANCE OPERATIONS 125
personal producinggeneral agent
Agent who sells for one ormore insurers, often with ahigher-than-normal agent’scommission and seldom hiresother agents.
branch manager
A company employee who iscompensated by acombination of salary, bonus,and commissions related tothe productivity of the officeto which he or she isassigned.
independent agent
Agent who usually representsseveral companies, pays allagency expenses, iscompensated on acommission plus bonus basis,and makes all decisionsconcerning how the agencyoperates.
owns the x-date
Has the right to contact thecustomer when a policy isdue for renewal.
agents provide office space and have administrative responsibilities for some customer serviceactivities.
A large number of life/health insurers use personal producing general agents. A personal produ-cing general agent sells for one or more insurers, often with a higher-than-normal agent’s commis-sion and seldom hires other agents. The extra commission helps cover office expenses. The trend is to-ward an agent representing several different insurers. This is desirable for consumers because a singleinsurer cannot have the best products for all needs. To meet a client’s insurance needs more com-pletely, the agent needs to have the flexibility to serve as a broker or a personal producing general agentfor the insurer with the most desirable policy.
Managerial (Branch Office) System
A branch office is an extension of the home office headed by a branch manager. The branch manageris a company employee who is compensated by a combination of salary, bonus, and commissions re-lated to the productivity of the office to which he or she is assigned. The manager also employs andtrains agents for the company but cannot employ an agent without the consent of the company. Com-pensation plans for agents are determined by the company. All expenses of maintaining the office arepaid by the company, which has complete control over the details of its operation.
Group and Supplemental Insurance Marketing
Group life, health, and retirement plans are sold to employers by agents in one of the systems describedabove or by brokers. An agent may be assisted in this specialized field by a group sales representative.Large volumes of group business are also placed through direct negotiations between employers andinsurers. A brokerage firm or an employee benefits consulting firm may be hired on a fee-only basis bythe employer who wishes to negotiate directly with insurers, thus avoiding commissions to the agent/broker. In these direct negotiations, the insurer typically is represented by a salaried group salesrepresentative.
Supplemental insurance plans that provide life, health, and other benefits to employees throughemployer sponsorship and payroll deduction have become common. These plans are marketed byagents, brokers, and exclusive agents. The latter usually work on commissions; some receive salariesplus bonuses.
Property/Casualty Insurance Marketing
Like life/health insurance, most property/casualty insurance is sold through agents or brokers who arecompensated on a commission basis, but some is sold by salaried representatives or by direct methods.The independent (American) agency system and the exclusive agency system account for the bulk ofinsurance sales.
Independent (American) Agency SystemThe distinguishing characteristics of the independent (American) agency system are the independenceof the agent, the agent’s bargaining position with the insurers he or she represents, and the fact thatthose who purchase insurance through the agent are considered by both insurers and agents to be theagent’s customers rather than the insurer’s. The independent agent usually represents several com-panies, pays all agency expenses, is compensated on a commission plus bonus basis, and makes all de-cisions concerning how the agency operates. Using insurer forms, the agent binds an insurer, sends un-derwriting information to the insurer, and later delivers a policy to the insured. The agent may or maynot have the responsibility of collecting premiums. Legally, these agents represent the insurer, but as apractical matter they also represent the customer.
An independent agent owns the x-date; that is, he or she has the right to contact the customerwhen a policy is due for renewal. This means that the insured goes with the agent if the agent no longersells for the insurance company. This ownership right can be sold to another agent, and when the inde-pendent agent decides to retire or leave the agency, the right to contact large numbers of customerscreates a substantial market value for the agency. This marketing system is also known as the Americanagency system. It is best recognized for the Big I advertisements sponsored by the Independent Insur-ance Agents & Brokers of America. These advertisements usually emphasize the independent agent’sability to choose the best policy and insurer for you. (Formerly known as the Independent InsuranceAgents of America, the 106-year-old association recently added the “& Brokers” to more accurately de-scribe its membership.[3] )
126 RISK MANAGEMENT FOR ENTERPRISES AND INDIVIDUALS
direct writers
Companies that marketinsurance through exclusiveagents.
exclusive agents
Agents permitted torepresent only their companyor a company in an affiliatedgroup of insurancecompanies.
salaried representatives
Employees of the company.
broker
Individual who solicitsbusiness from the insuredand also acts as the insured’slegal agent when thebusiness is placed with aninsurer.
Internet marketing
Selecting an insuranceproduct and comparing priceand coverage on the Internet.
mass merchandising
The selling of insurance bymail, telephone, television, ore-mail.
Direct Writers and Exclusive Agents
Several companies, called direct writers,[4] market insurance through exclusive agents. Exclusiveagents are permitted to represent only their company or a company in an affiliated group of insurancecompanies. A group is a number of separate companies operating under common ownership and man-agement. This system is used by companies such as Allstate, Nationwide, and State Farm. These in-surers compensate the agent through commissions that are lower than those paid to independentagents, partly because the insurer absorbs some expenses that are borne directly by independent agents.The insurer owns the x-date. The customer is considered to be the insurer’s rather than the agent’s, andthe agent does not have as much independence as do those who operate under the independent agencysystem. Average operating expenses and premiums for personal lines of insurance tend to be lowerthan those in the independent agency system.
Some direct writers place business through salaried representatives, who are employees of thecompany. Compensation for such employees may be a salary and/or a commission plus bonus relatedto the amount and quality of business they secure. Regardless of the compensation arrangement, theyare employees rather than agents.
Brokers
A considerable amount of insurance and reinsurance is placed through brokers. A broker solicits busi-ness from the insured, as does an agent, but the broker acts as the insured’s legal agent when the busi-ness is placed with an insurer. In about half the states, brokers are required to be agents of the insurer.In the other states, brokers do not have ongoing contracts with insurers—their sole obligation is to theclient. When it appears desirable, a broker may draft a specially worded policy for a client and thenplace the policy with an insurer. Some property/casualty brokers merely place insurance with an in-surer and then rely on this company to provide whatever engineering and loss-prevention services areneeded. Others have a staff of engineers to perform such services for clients. Modern brokerage firmsprovide a variety of related services, such as risk management surveys, information systems services re-lated to risk management, complete administrative and claim services to self-insurers, and captive in-surer management.
Brokers are a more significant part of the marketing mechanism in commercial property, liability,employee benefits, and marine insurance than in personal lines of insurance. Brokers are most active inmetropolitan areas and among large insureds, where a broker’s knowledge of specialized coverages andthe market for them is important. Some brokerage firms operate on a local or regional basis, whereasothers are national or international in their operations.
With today’s proliferation of lines and services, it is extremely difficult for brokers to understandall the products completely. Brokers are always looking for unique product designs, but gaining accessto innovative products and actually putting them into use are two different things. Generally, eachbroker selects about three favorite insurers. The broker’s concern is the underwriting standards of theirinsurers. For example, a broker would like to be able to place a client who takes Prozac with an insurerthat covers such clients.
Internet Marketing
With today’s proliferation of Internet marketing, one can select an insurance product and compareprice and coverage on the Internet. For example, someone interested in purchasing a life insurancepolicy can click on Insweb.com. If she or he is looking for health insurance, ehealthinsurance or othersuch Web sites present information and a questionnaire to fill out. The site will respond with quotesfrom insurers and details about the plans. The customer can then send contact information to selectedinsurers, who will begin the underwriting process to determine insurability and appropriate rates. Thesale is not finalized through the Internet, but the connection with the agent and underwriters is made.Any Internet search engine will lead to many such Web sites.
Most insurance companies, like other businesses, set up their own Web sites to promote theirproducts’ features. They set up the sites to provide consumers with the tools to compare products andfind the unique characteristics of the insurer. See the box, "Shopping for Insurance on the Internet" fora description of Internet sites.
Mass Merchandising
Mass merchandising is the selling of insurance by mail, telephone, television, or e-mail. Mass mer-chandising often involves a sponsoring organization such as an employer, trade association, university,or creditor; however, you are likely to be asked to respond directly to the insurer. Some mass mer-chandising mixes agents and direct response (mass mailing of information, for example, that includes acard the interested person can fill out and return); an agent handles the initial mailing and sub-sequently contacts the responding members of the sponsoring organization.
CHAPTER 6 INSURANCE OPERATIONS 127
financial planner
Individual who facilitatessome insurance sales byserving as a consultant onfinancial matters, primarily tohigh-income clients.
In some cases, you can save money buying insurance by mass merchandising methods. Direct re-sponse insurers, however, cannot provide the counseling you may receive from a good agent or finan-cial planner.
Financial Planners
A financial planner facilitates some insurance sales by serving as a consultant on financial matters,primarily to high-income clients. An analysis of risk exposures and recommendations on appropriaterisk management techniques, including insurance, are major parts of the financial planning process. Afee-only financial planner, knowledgeable in insurance, may direct you to good-quality, no-load insur-ance products when they are priced lower than comparable products sold through agents. You arealready paying a fee for advice from the financial planner. Why also pay a commission to an insuranceagent or broker?
In many instances, it is appropriate for the financial planner to send you to an insurance agent.Products available through agents may have a better value than the still limited supply of no-loadproducts. Also, your financial planner is likely to be a generalist with respect to insurance, and you mayneed advice from a knowledgeable agent. In any event, financial planners are now part of the insurancedistribution system.
Shopping for Insurance on the Internet
True to its name, Progressive was the first large insurer to begin selling insurance coverage via the Internet inthe late 1990s. Other well-known names like Allstate and Hartford quickly followed suit. So-called aggregatorsites like Insure.com, Quotesmith.com, Ehealthinsurance.com, and InsWeb.com joined in, offering one-stopshopping for a variety of products. To tap the potential of e-commerce, insurers have had to overcome onebig challenge: how to sell complex products without confusing and driving away the customer. Therefore, thesale is not finalized on the Internet. The glimpse into the product is only the first step for comparativeshopping.
An insurance application can be frustrating even when an agent is sitting across the desk explainingeverything, but most people don’t walk out in the middle of filling out a form. On the Internet, however, abouthalf of those filling out a quote request quit because it is too complicated or time-consuming. Most of thosewho do finish are “just looking,” comparing prices and services. Twenty-seven million shoppers priced insur-ance online in 2001, according to a recent study by the Independent Insurance Agents of America andtwenty-six insurers, but less than 5 percent closed the deal electronically.
As shopping on the Internet becomes a boom business, each state department of insurance providesguidelines to consumers. For example, the Texas Department of Insurance issued tips for shopping smart onthe Internet, as follows:
Insurance on the Internet—Shopping Tips and Dangers
< Be more cautious if the type of insurance you need recently became more expensive or harder to getand the policy costs far less than what other insurers charge.
< Don’t succumb to high-pressure sales, last-chance deals of a lifetime, or suggestions that you dropone coverage for another without the chance to check it out thoroughly.
< Check with an accountant, attorney, financial adviser, a trusted friend, or relative before puttingsavings or large sums of money into any annuity, other investment, or trust.
< Get rate quotes and key information in writing and keep records.
< If you buy coverage, keep a file of all paperwork you completed online or received in the mail andsigned, as well as any other documents related to your insurance, including the policy,correspondence, copies of advertisements, premium payment receipts, notes of conversations, andany claims submitted.
< Make sure you receive your policy—not a photocopy—within thirty days.
Sources: Lynna Goch, “What Works Online: Some Insurers Have Found the Key to Unlocking Online Sales,” Best’s Review, May 2002; Ron Panko,“IdentityWeb: Linking Agents and Customers,” Best’s Review, May 2002; Google search for “shopping for insurance on the Internet”; andhttp://www.tdi.state.tx.us/consumer/cpinsnet.html.
Professionalism in Marketing
Ideally, an agent has several years of experience before giving advice on complicated insurance matters.You will be interested in the agent’s experience and educational qualifications, which should cover anextensive study of insurance, finance, and related subjects. A major route for life/health agents to gainthis background is by meeting all requirements for the Chartered Life Underwriter (CLU) designation.The Chartered Financial Consultant (ChFC) designation from the American College (for information,
128 RISK MANAGEMENT FOR ENTERPRISES AND INDIVIDUALS
underwriting
The process of evaluatingrisks, selecting which risks toaccept, and identifyingpotential adverse selection.
underwriter
Individual who decideswhether or not to insureexposures on whichapplications for insurance aresubmitted.
redlining
When an insurer designates ageographical area in which itchooses not to provideinsurance, or to provide itonly at substantially higherprices.
see http://www.amercoll.edu/) is an alternative professional designation of interest to life/health agents.Property/casualty agents gain a good background by earning the Chartered Property and CasualtyUnderwriter (CPCU) designation granted by the American Institute for Property and Liability Under-writers (see http://www.aicpcu.org/). Another, broader designation with applications to insurance isCertified Financial Planner (CFP), awarded by the Certified Financial Planner Board of Standards (seehttp://www.cfp-board.org/).
2.2 UnderwritingUnderwriting is the process of classifying the potential insureds into the appropriate risk classifica-tion in order to charge the appropriate rate. An underwriter decides whether or not to insure expos-ures on which applications for insurance are submitted. There are separate procedures for group un-derwriting and individual underwriting. For group underwriting, the group characteristics, demo-graphics, and past losses are judged. Because individual insurability is not examined, even very sickpeople such as AIDS patients can obtain life insurance through a group policy. For individual under-writing, the insured has to provide evidence of insurability in areas of life and health insurance or spe-cific details about the property and automobiles for property/casualty lines of business. An individualapplicant for life insurance must be approved by the life insurance company underwriter, a process thatis sometimes very lengthy. It is not uncommon for the application to include a questionnaire aboutlifestyle, smoking habits, medical status, and the medical status of close family members. For largeamounts of life insurance, the applicant is usually required to undergo a medical examination.
Once the underwriter determines that insurance can be issued, the next decision is to apply theproper premium rate. Premium rates are determined for classes of insureds by the actuarial depart-ment. An underwriter’s role is to decide which class is appropriate for each insured. The business of in-surance inherently involves discrimination; otherwise, adverse selection would make insuranceunavailable.
Some people believe that any characteristic over which we have no control, such as gender, race,and age, should be excluded from insurance underwriting and rating practices (although in life and an-nuity contracts, consideration of age seems to be acceptable). Their argument is that if insurance is in-tended in part to encourage safety, then its operation ought to be based on behavior, not on qualitieswith which we are born. Others argue that some of these factors are the best predictors of losses and ex-penses, and without them, insurance can function only extremely inefficiently. Additionally, some ar-gument could be made that almost no factor is truly voluntary or controllable. Is a poor resident of Ch-icago, for instance, able to move out of the inner city? A National Underwriter article provided an in-teresting suggestion for mitigating negative characteristics: enclosing a personalized letter with an ap-plication to explain special circumstances.[5] For example, according to the article, “If your client isoverweight, and his family is overweight, but living a long and healthy life, note both details on the re-cord. This will give the underwriters more to go on.” The article continues, “Sending letters with ap-plications is long overdue. They will often shorten the underwriting cycle and get special risks—manyof whom have been given a clean bill of health by their doctor or are well on their way to recovery—thecoverage they need and deserve.”
Over the years, insurers have used a variety of factors in their underwriting decisions. A number ofthese have become taboo from a public policy standpoint. Their use may be considered unfair discrim-ination. In automobile insurance, for instance, factors such as marital status and living arrangementshave played a significant underwriting role, with divorced applicants considered less stable than never-married applicants. In property insurance, concern over redlining receives public attention periodic-ally. Redlining occurs when an insurer designates a geographical area in which it chooses not toprovide insurance, or to provide it only at substantially higher prices. These decisions are madewithout considering individual insurance applicants. Most often, the redlining is in poor urban areas,placing low-income inner-city dwellers at great disadvantage. A new controversy in the underwritingfield is the use of genetic testing. In Great Britain, insurers use genetic testing to screen for Hunting-ton’s disease,[6] but U.S. companies are not yet using such tests. As genetic testing continues to im-prove, look for U.S. insurance companies to request access to that information as part of an applicant’smedical history.
Two major areas of underwriting controversies are discussed in the box below, "Keeping Score—IsIt Fair to Use Credit Rating in Underwriting?" and in "Insurance and Your Privacy—Who Knows?" inChapter 7. The need for information is a balancing act between underwriting requirements and pre-serving the privacy of insureds. The tug-of-war between more and less information is a regulatory mat-ter. The use of credit ratings in setting premiums illustrates a company’s need to place insureds in theappropriate risk classification—a process that preserves the fundamental rules of insurance operations(discussed in Chapter 5). We will explore underwriting further in other chapters as we look at types ofpolicies.
CHAPTER 6 INSURANCE OPERATIONS 129
Equal Credit OpportunityAct (ECOA)
Law requiring that thecreditor give you a noticethat tells you the specificreasons your application wasrejected or the fact that youhave the right to learn thereasons if you ask within sixtydays.
Keeping Score—Is It Fair to Use Credit Rating in Underwriting?
Body-mass index, cholesterol level, SAT score, IQ: Americans are accustomed to being judged by the numbers.One important number that you may not be as familiar with is your credit score. Determined by the financialfirm Fair, Isaac, and Co., a credit score (also known as a FICO score) is calculated from an individual’s credit his-tory, taking into account payment history, number of creditors, amounts currently owed, and similar factors.
Like your grade point average (GPA), your credit score is one simple number that sums up years of hard work(or years of goofing off). But while your GPA is unlikely to be important five years from now, your credit scorewill affect your major financial decisions for the rest of your life. This number determines whether you’re eli-gible for incentive (low-rate) financing on new cars, how many credit card offers get stuffed in your mailboxeach month, and what your mortgage rate will be. The U.S. Federal Trade Commission (FTC) issued a directiveto consumers about the handling of credit scores. If you are denied credit, the FTC offers the following:
< If you are denied credit, the Equal Credit Opportunity Act (ECOA) requires that the creditorgive you a notice that tells you the specific reasons your application was rejected or the fact that youhave the right to learn the reasons if you ask within sixty days. If a creditor says that you were deniedcredit because you are too near your credit limits on your charge cards or you have too many creditcard accounts, you may want to reapply after paying down your balances or closing some accounts.Credit scoring systems consider updated information and change over time.
< Sometimes, you can be denied credit because of information from a credit report. If so, the Fair CreditReporting Act (FCRA) requires the creditor to give you the name, address, and phone number of theconsumer reporting company that supplied the information. This information is free if you request itwithin sixty days of being turned down for credit. The consumer reporting company can tell youwhat’s in your report, but only the creditor can tell you why your application was denied.
< If you’ve been denied credit, or didn’t get the rate or credit terms you want, ask the creditor if a creditscoring system was used. If so, ask what characteristics or factors were used in that system, and thebest ways to improve your application. If you get credit, ask the creditor whether you are getting thebest rate and terms available and if you are not, ask why. If you are not offered the best rate availablebecause of inaccuracies in your credit report, be sure to dispute the inaccurate information in yourcredit report.
Your credit score may also affect how much you’ll pay for insurance. About half of the companies that writepersonal auto or homeowner’s insurance now use credit data in underwriting or in setting premiums, and thebad credit penalty can be 20 percent or more. But it’s not because they’re worried that poor credit risks won’tpay their insurance premiums. Rather, it’s the strong relationship between credit scores and the likelihood offiling a claim, as study after study has borne out. Someone who spends money recklessly is also likely to driverecklessly, insurers point out; someone who is lazy about making credit card payments is apt to be lazy abouttrimming a tree before it causes roof damage. Often, a credit record is the best available predictor of futurelosses. Insurers vary on how much they rely on credit scoring—most consider it as one factor of many in set-ting premiums, while a few flat out refuse to insure anyone whose credit score is below a certain num-ber—but almost all see it as a valuable underwriting tool. It’s only fair, insurers say, for low-risk customers topay lower premiums rather than subsidizing those more likely to file claims.
Consumer advocates disagree. Using credit scores in this manner is discriminatory and inflexible, they say, andsome state insurance commissioners agree. Consumer advocate and former Texas insurance commissionerRobert Hunter finds credit scoring ludicrous. “If I have a poor credit score because I was laid off as a result ofterrorism, what does that have to do with my ability to drive?” he asked at a meeting of the National Associ-ation of Insurance Commissioners in December 2001. Therefore, in 2004, twenty-four states have adoptedcredit scoring legislation and/or regulation that is based on a National Conference of Insurance Legislators(NCOIL) model law.
The debate over the use of credit scoring has spread across the country. More states are considering regula-tions or legislation to curb its use by insurers.
Questions for Discussion
1. Mr. Smith and Mr. Jones, both twenty-eight years old, have the same educational and income levels.Mr. Smith has one speeding ticket and a credit score of 600. Mr. Jones has a clean driving record anda credit score of 750. Who should pay more for automobile insurance?
2. After some investigation, you discover that Mr. Smith’s credit score is low because his wife recentlydied after a long illness and he has fallen behind in paying her medical bills. Mr. Jones’s driving recordis clean because he hired a lawyer to have his many speeding tickets reduced to nonmovingviolations. Who should pay more for auto insurance?
3. Considering the clear correlation between credit scores and losses, is credit scoring discriminatory?
4. Should credit scores count?
130 RISK MANAGEMENT FOR ENTERPRISES AND INDIVIDUALS
service
The ultimate indicator uponwhich the quality of theproduct provided byinsurance depends.
engineering and losscontrol
Methods of prevention andreduction of loss wheneverthe efforts required areeconomically feasible.
Sources: Barbara Bowers, “Giving Credit Its Due: Insurers, Agents, Legislators, Regulators and Consumers Battle to Define the Role of Insurance Scoring”and “Insurers Address Flurry of Insurance-Scoring Legislative Initiatives,” Best’s Review, May 2002; U.S. Federal Trade Commission at http://www.ftc.gov/bcp/conline/pubs/credit/scoring.htm. See http://www.ncoil.org/ and all media outlets for coverage of this issue, which occurs very frequently.
2.3 AdministrationAfter insurance is sold and approved by the underwriter, records must be established, premiums col-lected, customer inquiries answered, and many other administrative jobs performed. Administration isdefined broadly here to include accounting, information systems, office administration, customer ser-vice, and personnel management.
Service
Service is the ultimate indicator on which the quality of the product provided by insurance depends.An agent’s or broker’s advice and an insurer’s claim practices are the primary services that the typicalindividual or business needs. In addition, prompt, courteous responses to inquiries concerning changesin the policy, the availability of other types of insurance, changes of address, and other routine mattersare necessary.
Another service of major significance that some insurers offer, primarily to commercial clients, isengineering and loss control. Engineering and loss control is concerned with methods of preven-tion and reduction of loss whenever the efforts required are economically feasible. Much of the engin-eering and loss-control activity may be carried on by the insurer or under its direction. The facilitiesthe insurer has to devote to such efforts and the degree to which such efforts are successful is an im-portant element to consider in selecting an insurer. Part of the risk manager’s success depends on thiselement. Engineering and loss-control services are particularly applicable to workers’ compensationand boiler and machinery exposures. With respect to the health insurance part of an employee benefitsprogram, loss control is called cost containment and may be achieved primarily through managed careand wellness techniques.
K E Y T A K E A W A Y S
In this section you studied the following:
< The marketing function of insurance companies differs for life/health and property/casualty segments.
< Agents represent insurers and may work under a general agency or managerial arrangement and asindependent agents or direct writers.
< Brokers represent insureds and place policies with appropriate insurers.
< Internet marketing, mass merchandising campaigns, and financial planning are other methods ofacquiring customers.
< Underwriting classifies insureds into risk categories to determine the appropriate rate.
D I S C U S S I O N Q U E S T I O N S
1. Would you rather shop for insurance on the Internet or call an agent?
2. Advertising by the Independent Insurance Agents & Brokers of America extols the unique features of theAmerican agency system and the independent agent. Its logo is the Big I. Does this advertising influenceyour choice of an agent? Do you prefer one type of agent to others? If so, why?
3. What does an underwriter do? Why is the underwriting function in an insurance company so important?
4. Why are insurers using credit scoring in their underwriting? In what areas is it possible to misjudge apotential insured when using credit scoring? What other underwriting criteria would you suggest toreplace the credit scoring criterion?
CHAPTER 6 INSURANCE OPERATIONS 131
actuarial analysis
A highly specializedmathematic analysis thatdeals with the financial andrisk aspects of insurance.
actuary
Individual who determinesproper rates and reserves,certifies financial statements,participates in productdevelopment, and assists inoverall managementplanning.
loss development
The calculation of howamounts paid for lossesincrease (mature) over timefor the purpose of futureprojection.
3. INSURANCE OPERATIONS: ACTUARIAL ANDINVESTMENT
L E A R N I N G O B J E C T I V E S
In this section we elaborate on the following:
< The role of actuarial analysis in insurance operations< The tools actuaries utilize to perform their work< The investments of insurers, or investment income—the other side of insurance operation< The fact that insurers are holders of large asset portfolios
3.1 Actuarial AnalysisActuarial analysis is a highly specialized mathematic analysis that deals with the financial and risk as-pects of insurance. Actuarial analysis takes past losses and projects them into the future to determinethe reserves an insurer needs to keep and the rates to charge. An actuary determines proper rates andreserves, certifies financial statements, participates in product development, and assists in overall man-agement planning.
Actuaries are expected to demonstrate technical expertise by passing the examinations required foradmission into either the Society of Actuaries (for life/health actuaries) or the Casualty Actuarial Soci-ety (for property/casualty actuaries). Passing the examinations requires a high level of mathematicalknowledge and skill.
Prices and Reserves
Property/Casualty Lines—Loss DevelopmentThe rates or premiums for insurance are based first and foremost on the past experience of losses. Ac-tuaries calculate the rates using various procedures and techniques. The most modern techniques in-clude sophisticated regression analysis and data mining tools. In essence, the actuary first has to estim-ate the expected claim payments (equaling the net premium) then “loads” the figure by factors meantto accommodate the underwriting, management, and claims handling expenses. In addition, other ele-ments may be considered, such as a loading to cover the uncertainty element.
In some insurance lines (called long tail lines), claims are settled over a long period; therefore, thecompany must estimate its future payments before it can determine losses. The payments still pendingand will be paid in the future are held as a liability for the insurance company and are called loss re-serves or pending (or outstanding) losses. Typically, the claims department personnel give their estim-ates of the amounts that are expected to be paid for each open claim file, and the sum of these case bycase estimates makes up the case estimates reserve. The actuaries offer their estimates based on sophist-icated statistical analysis of aggregated data. Actuaries sometimes have to estimate, as a part of the lossreserves, the payments for claims that have not yet been reported as well. These incurred but not yet re-ported claims are referred to by the initials IBNR in industry parlance.
The loss reserves estimation is based on data of past claim payments. Such data is typically presen-ted in the form of a triangle. Actuaries use many techniques to turn the triangle into a forecast. Some ofthe traditional, but still popular, methods are quite intuitive. For pedagogical reasons, we shall demon-strate one of those methods below. A more sophisticated and modern concept is presented in the ap-pendix to this chapter (Section 5) and reveals deficiencies of the traditional methods.
A hypothetical example of one loss-reserving technique is featured here in Table 6.1 through Table6.5. The technique used in these tables is known as a triangular method of loss development to the ulti-mate. The example is for illustration only. Loss development is the calculation of how amounts paidfor losses increase (or mature) over time for the purpose of future projection. Because the claims arepaid progressively over time, like medical bills for an injury, the actuarial analysis has to project howlosses will be developed into the future based on their past development.
With property/casualty lines such as product liability, the insurer’s losses can continue for manyyears after the initial occurrence of the accident. For example, someone who took certain weight-lossmedications in 1994 (the “accident year”) might develop heart trouble six years later. Health problemsfrom asbestos contact or tobacco use can occur decades after the accident actually occurred.
132 RISK MANAGEMENT FOR ENTERPRISES AND INDIVIDUALS
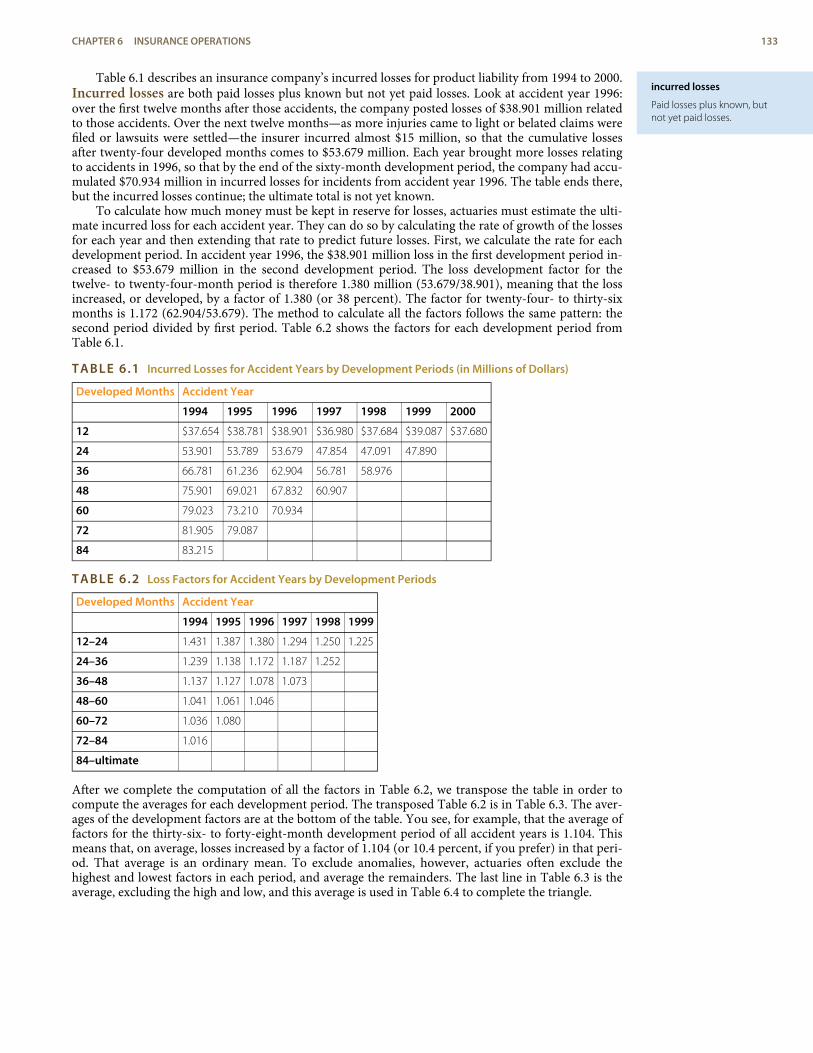
incurred losses
Paid losses plus known, butnot yet paid losses.
Table 6.1 describes an insurance company’s incurred losses for product liability from 1994 to 2000.Incurred losses are both paid losses plus known but not yet paid losses. Look at accident year 1996:over the first twelve months after those accidents, the company posted losses of $38.901 million relatedto those accidents. Over the next twelve months—as more injuries came to light or belated claims werefiled or lawsuits were settled—the insurer incurred almost $15 million, so that the cumulative lossesafter twenty-four developed months comes to $53.679 million. Each year brought more losses relatingto accidents in 1996, so that by the end of the sixty-month development period, the company had accu-mulated $70.934 million in incurred losses for incidents from accident year 1996. The table ends there,but the incurred losses continue; the ultimate total is not yet known.
To calculate how much money must be kept in reserve for losses, actuaries must estimate the ulti-mate incurred loss for each accident year. They can do so by calculating the rate of growth of the lossesfor each year and then extending that rate to predict future losses. First, we calculate the rate for eachdevelopment period. In accident year 1996, the $38.901 million loss in the first development period in-creased to $53.679 million in the second development period. The loss development factor for thetwelve- to twenty-four-month period is therefore 1.380 million (53.679/38.901), meaning that the lossincreased, or developed, by a factor of 1.380 (or 38 percent). The factor for twenty-four- to thirty-sixmonths is 1.172 (62.904/53.679). The method to calculate all the factors follows the same pattern: thesecond period divided by first period. Table 6.2 shows the factors for each development period fromTable 6.1.
TABLE 6.1 Incurred Losses for Accident Years by Development Periods (in Millions of Dollars)
Developed Months Accident Year
1994 1995 1996 1997 1998 1999 2000
12 $37.654 $38.781 $38.901 $36.980 $37.684 $39.087 $37.680
24 53.901 53.789 53.679 47.854 47.091 47.890
36 66.781 61.236 62.904 56.781 58.976
48 75.901 69.021 67.832 60.907
60 79.023 73.210 70.934
72 81.905 79.087
84 83.215
TABLE 6.2 Loss Factors for Accident Years by Development Periods
Developed Months Accident Year
1994 1995 1996 1997 1998 1999
12–24 1.431 1.387 1.380 1.294 1.250 1.225
24–36 1.239 1.138 1.172 1.187 1.252
36–48 1.137 1.127 1.078 1.073
48–60 1.041 1.061 1.046
60–72 1.036 1.080
72–84 1.016
84–ultimate
After we complete the computation of all the factors in Table 6.2, we transpose the table in order tocompute the averages for each development period. The transposed Table 6.2 is in Table 6.3. The aver-ages of the development factors are at the bottom of the table. You see, for example, that the average offactors for the thirty-six- to forty-eight-month development period of all accident years is 1.104. Thismeans that, on average, losses increased by a factor of 1.104 (or 10.4 percent, if you prefer) in that peri-od. That average is an ordinary mean. To exclude anomalies, however, actuaries often exclude thehighest and lowest factors in each period, and average the remainders. The last line in Table 6.3 is theaverage, excluding the high and low, and this average is used in Table 6.4 to complete the triangle.
CHAPTER 6 INSURANCE OPERATIONS 133
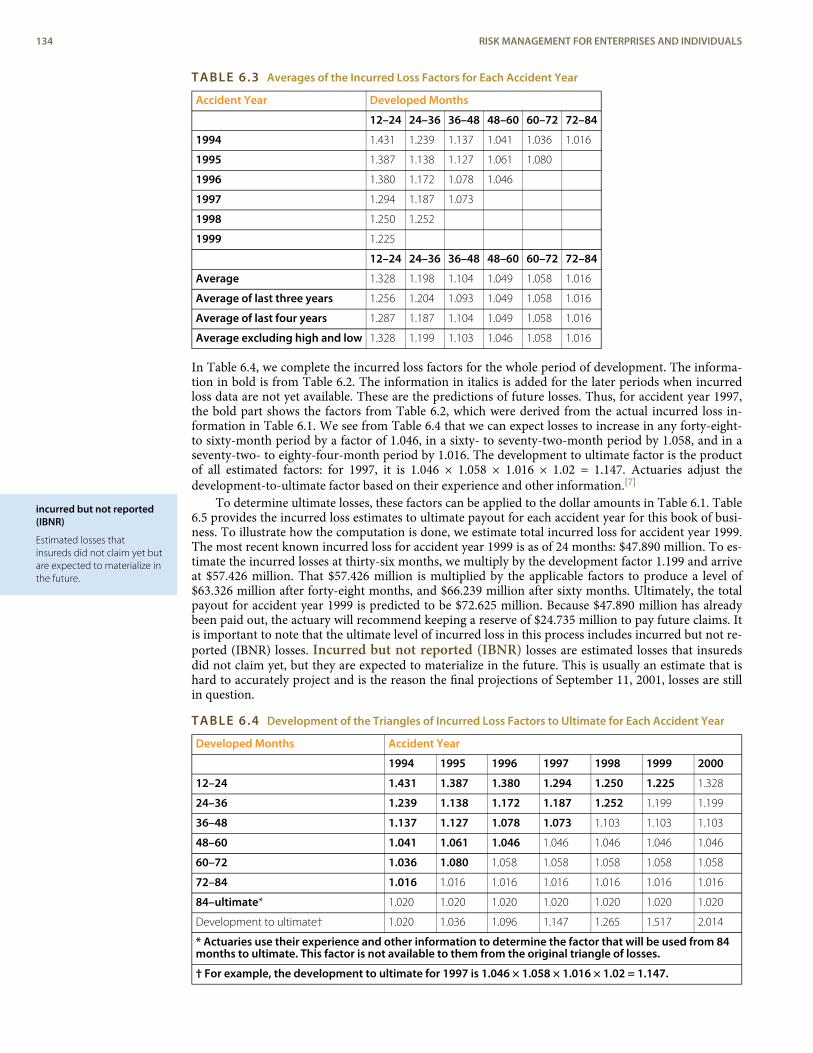
incurred but not reported(IBNR)
Estimated losses thatinsureds did not claim yet butare expected to materialize inthe future.
TABLE 6.3 Averages of the Incurred Loss Factors for Each Accident Year
Accident Year Developed Months
12–24 24–36 36–48 48–60 60–72 72–84
1994 1.431 1.239 1.137 1.041 1.036 1.016
1995 1.387 1.138 1.127 1.061 1.080
1996 1.380 1.172 1.078 1.046
1997 1.294 1.187 1.073
1998 1.250 1.252
1999 1.225
12–24 24–36 36–48 48–60 60–72 72–84
Average 1.328 1.198 1.104 1.049 1.058 1.016
Average of last three years 1.256 1.204 1.093 1.049 1.058 1.016
Average of last four years 1.287 1.187 1.104 1.049 1.058 1.016
Average excluding high and low 1.328 1.199 1.103 1.046 1.058 1.016
In Table 6.4, we complete the incurred loss factors for the whole period of development. The informa-tion in bold is from Table 6.2. The information in italics is added for the later periods when incurredloss data are not yet available. These are the predictions of future losses. Thus, for accident year 1997,the bold part shows the factors from Table 6.2, which were derived from the actual incurred loss in-formation in Table 6.1. We see from Table 6.4 that we can expect losses to increase in any forty-eight-to sixty-month period by a factor of 1.046, in a sixty- to seventy-two-month period by 1.058, and in aseventy-two- to eighty-four-month period by 1.016. The development to ultimate factor is the productof all estimated factors: for 1997, it is 1.046 × 1.058 × 1.016 × 1.02 = 1.147. Actuaries adjust thedevelopment-to-ultimate factor based on their experience and other information.[7]
To determine ultimate losses, these factors can be applied to the dollar amounts in Table 6.1. Table6.5 provides the incurred loss estimates to ultimate payout for each accident year for this book of busi-ness. To illustrate how the computation is done, we estimate total incurred loss for accident year 1999.The most recent known incurred loss for accident year 1999 is as of 24 months: $47.890 million. To es-timate the incurred losses at thirty-six months, we multiply by the development factor 1.199 and arriveat $57.426 million. That $57.426 million is multiplied by the applicable factors to produce a level of$63.326 million after forty-eight months, and $66.239 million after sixty months. Ultimately, the totalpayout for accident year 1999 is predicted to be $72.625 million. Because $47.890 million has alreadybeen paid out, the actuary will recommend keeping a reserve of $24.735 million to pay future claims. Itis important to note that the ultimate level of incurred loss in this process includes incurred but not re-ported (IBNR) losses. Incurred but not reported (IBNR) losses are estimated losses that insuredsdid not claim yet, but they are expected to materialize in the future. This is usually an estimate that ishard to accurately project and is the reason the final projections of September 11, 2001, losses are stillin question.
TABLE 6.4 Development of the Triangles of Incurred Loss Factors to Ultimate for Each Accident Year
Developed Months Accident Year
1994 1995 1996 1997 1998 1999 2000
12–24 1.431 1.387 1.380 1.294 1.250 1.225 1.328
24–36 1.239 1.138 1.172 1.187 1.252 1.199 1.199
36–48 1.137 1.127 1.078 1.073 1.103 1.103 1.103
48–60 1.041 1.061 1.046 1.046 1.046 1.046 1.046
60–72 1.036 1.080 1.058 1.058 1.058 1.058 1.058
72–84 1.016 1.016 1.016 1.016 1.016 1.016 1.016
84–ultimate* 1.020 1.020 1.020 1.020 1.020 1.020 1.020
Development to ultimate† 1.020 1.036 1.096 1.147 1.265 1.517 2.014
* Actuaries use their experience and other information to determine the factor that will be used from 84months to ultimate. This factor is not available to them from the original triangle of losses.
† For example, the development to ultimate for 1997 is 1.046 × 1.058 × 1.016 × 1.02 = 1.147.
134 RISK MANAGEMENT FOR ENTERPRISES AND INDIVIDUALS
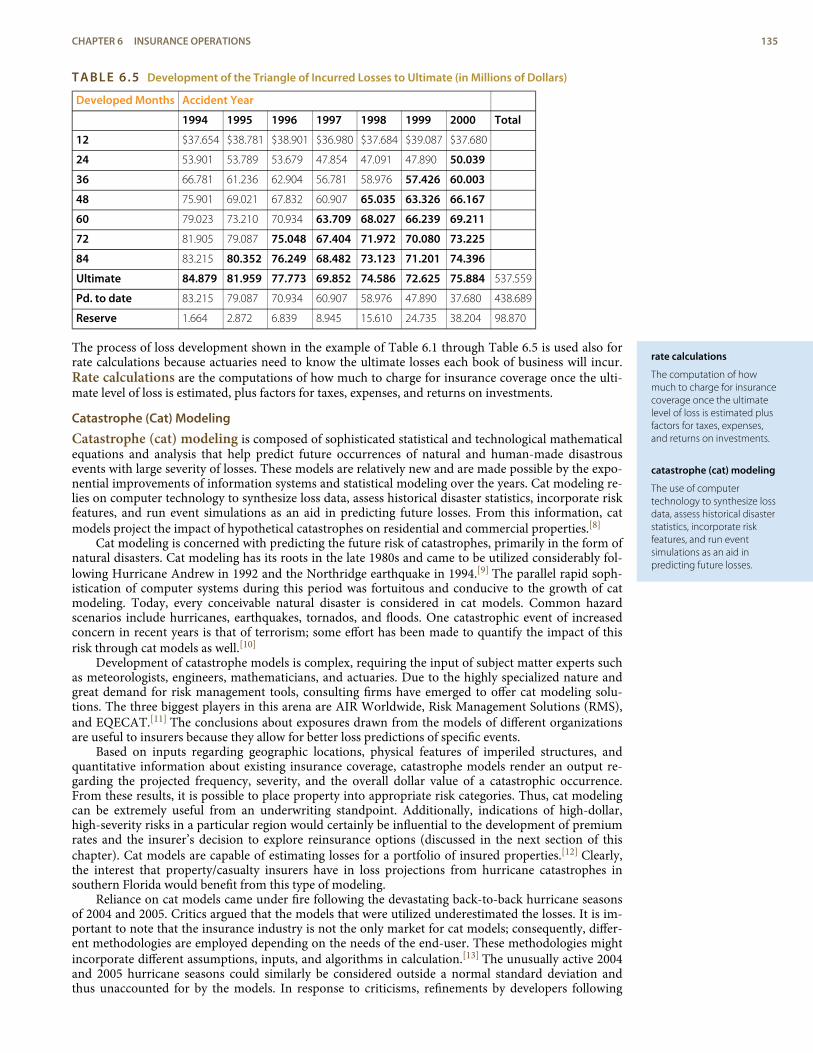
rate calculations
The computation of howmuch to charge for insurancecoverage once the ultimatelevel of loss is estimated plusfactors for taxes, expenses,and returns on investments.
catastrophe (cat) modeling
The use of computertechnology to synthesize lossdata, assess historical disasterstatistics, incorporate riskfeatures, and run eventsimulations as an aid inpredicting future losses.
TABLE 6.5 Development of the Triangle of Incurred Losses to Ultimate (in Millions of Dollars)
Developed Months Accident Year
1994 1995 1996 1997 1998 1999 2000 Total
12 $37.654 $38.781 $38.901 $36.980 $37.684 $39.087 $37.680
24 53.901 53.789 53.679 47.854 47.091 47.890 50.039
36 66.781 61.236 62.904 56.781 58.976 57.426 60.003
48 75.901 69.021 67.832 60.907 65.035 63.326 66.167
60 79.023 73.210 70.934 63.709 68.027 66.239 69.211
72 81.905 79.087 75.048 67.404 71.972 70.080 73.225
84 83.215 80.352 76.249 68.482 73.123 71.201 74.396
Ultimate 84.879 81.959 77.773 69.852 74.586 72.625 75.884 537.559
Pd. to date 83.215 79.087 70.934 60.907 58.976 47.890 37.680 438.689
Reserve 1.664 2.872 6.839 8.945 15.610 24.735 38.204 98.870
The process of loss development shown in the example of Table 6.1 through Table 6.5 is used also forrate calculations because actuaries need to know the ultimate losses each book of business will incur.Rate calculations are the computations of how much to charge for insurance coverage once the ulti-mate level of loss is estimated, plus factors for taxes, expenses, and returns on investments.
Catastrophe (Cat) Modeling
Catastrophe (cat) modeling is composed of sophisticated statistical and technological mathematicalequations and analysis that help predict future occurrences of natural and human-made disastrousevents with large severity of losses. These models are relatively new and are made possible by the expo-nential improvements of information systems and statistical modeling over the years. Cat modeling re-lies on computer technology to synthesize loss data, assess historical disaster statistics, incorporate riskfeatures, and run event simulations as an aid in predicting future losses. From this information, catmodels project the impact of hypothetical catastrophes on residential and commercial properties.[8]
Cat modeling is concerned with predicting the future risk of catastrophes, primarily in the form ofnatural disasters. Cat modeling has its roots in the late 1980s and came to be utilized considerably fol-lowing Hurricane Andrew in 1992 and the Northridge earthquake in 1994.[9] The parallel rapid soph-istication of computer systems during this period was fortuitous and conducive to the growth of catmodeling. Today, every conceivable natural disaster is considered in cat models. Common hazardscenarios include hurricanes, earthquakes, tornados, and floods. One catastrophic event of increasedconcern in recent years is that of terrorism; some effort has been made to quantify the impact of thisrisk through cat models as well.[10]
Development of catastrophe models is complex, requiring the input of subject matter experts suchas meteorologists, engineers, mathematicians, and actuaries. Due to the highly specialized nature andgreat demand for risk management tools, consulting firms have emerged to offer cat modeling solu-tions. The three biggest players in this arena are AIR Worldwide, Risk Management Solutions (RMS),and EQECAT.[11] The conclusions about exposures drawn from the models of different organizationsare useful to insurers because they allow for better loss predictions of specific events.
Based on inputs regarding geographic locations, physical features of imperiled structures, andquantitative information about existing insurance coverage, catastrophe models render an output re-garding the projected frequency, severity, and the overall dollar value of a catastrophic occurrence.From these results, it is possible to place property into appropriate risk categories. Thus, cat modelingcan be extremely useful from an underwriting standpoint. Additionally, indications of high-dollar,high-severity risks in a particular region would certainly be influential to the development of premiumrates and the insurer’s decision to explore reinsurance options (discussed in the next section of thischapter). Cat models are capable of estimating losses for a portfolio of insured properties.[12] Clearly,the interest that property/casualty insurers have in loss projections from hurricane catastrophes insouthern Florida would benefit from this type of modeling.
Reliance on cat models came under fire following the devastating back-to-back hurricane seasonsof 2004 and 2005. Critics argued that the models that were utilized underestimated the losses. It is im-portant to note that the insurance industry is not the only market for cat models; consequently, differ-ent methodologies are employed depending on the needs of the end-user. These methodologies mightincorporate different assumptions, inputs, and algorithms in calculation.[13] The unusually active 2004and 2005 hurricane seasons could similarly be considered outside a normal standard deviation andthus unaccounted for by the models. In response to criticisms, refinements by developers following
CHAPTER 6 INSURANCE OPERATIONS 135
mortality tables
Tables that indicate thepercent of expected deathsfor each age group.
premium elements
The adjustments for variousfactors in life insurancepremiums.
investment income
Returns from all the assetsheld by the insurers fromboth capital investment andfrom premiums.
mortality curve
Curve that illustrates therelationship between ageand the probability of death.
Hurricane Katrina included near-term projections providing probable maximum loss estimates usingshort-term expectations of hurricane activity.
Life and Annuity Lines
For life insurance, actuaries use mortality tables, which predict the percentage of people in each agegroup who are expected to die each year. This percentage is used to estimate the required reserves andto compute life insurance rates. Life insurance, like other forms of insurance, is based on three con-cepts: pooling many exposures into a group, accumulating a fund paid for by contributions(premiums) from the members of the group, and paying from this fund for the losses of those who dieeach year. That is, life insurance involves the group sharing of individual losses. To set premium rates,the insurer must be able to calculate the probability of death at various ages among its insureds, basedon pooling. Life insurers must collect enough premiums to cover mortality costs (the cost of claims). Inaddition to covering mortality costs, a life insurance premium, like a property/casualty premium, mustreflect several adjustments, as noted in Table 6.6. The adjustments for various factors in life insurancepremiums are known as premium elements. First, the premium is reduced because the insurer ex-pects to earn investment income, or returns from all the assets held by the insurers from both capitalinvestment and from premiums. Investment is a very important aspect of the other side of the insur-ance business, as discussed below. Insurers invest the premiums they receive from insureds until lossesneed to be paid. Income from the investments is an offset in the premium calculations. By reducing therates, most of an insurer’s investment income benefits consumers. Second, the premium is increased tocover the insurer’s marketing and administrative expenses, as described above. Taxes are the thirdcomponent; those that are levied on the insurer also must be recovered. Fourth, in calculating premi-ums, an actuary usually increases the premium to cover the insurer’s risk of not predicting future lossesaccurately. The fifth element is the profits that the insurer should obtain because insurers are not “notfor profit” organizations. All life insurance premium elements are depicted in Table 6.6 below. The ac-tual prediction of deaths and the estimation of other premium elements are complicated actuarialprocesses.
TABLE 6.6 Term Premium Elements
Mortality Cost
− Investment income
+ Expense charge
+ Taxes
+ Risk change
+ Profit
= Gross premium charge
The mortality rate has two important characteristics that greatly influence insurer practices and thenature of life insurance contracts. First, yearly probabilities of death rise with age. Second, for practicalreasons, actuaries set at 1.0 the probability of death at an advanced age, such as ninety-nine. That is,death during that year is considered a certainty, even though some people survive. The characteristicsare illustrated with the mortality curve.
Mortality CurveIf we plot the probability of death for males by age, as in Figure 6.2, we have a mortality curve. Themortality curve illustrates the relationship between age and the probability of death. It shows that themortality rate for males is relatively high at birth but declines until age ten. It then rises until agetwenty-one and declines between ages twenty-two and twenty-nine. This decline apparently reflectsmany accidental deaths among males in their teens and early twenties, followed by a subsequent de-crease. The rise is continuous for females older than age ten and for males after age twenty-nine. Therise is rather slow until middle age, at which point it begins to accelerate. At the more advanced ages, itrises very rapidly.
136 RISK MANAGEMENT FOR ENTERPRISES AND INDIVIDUALS
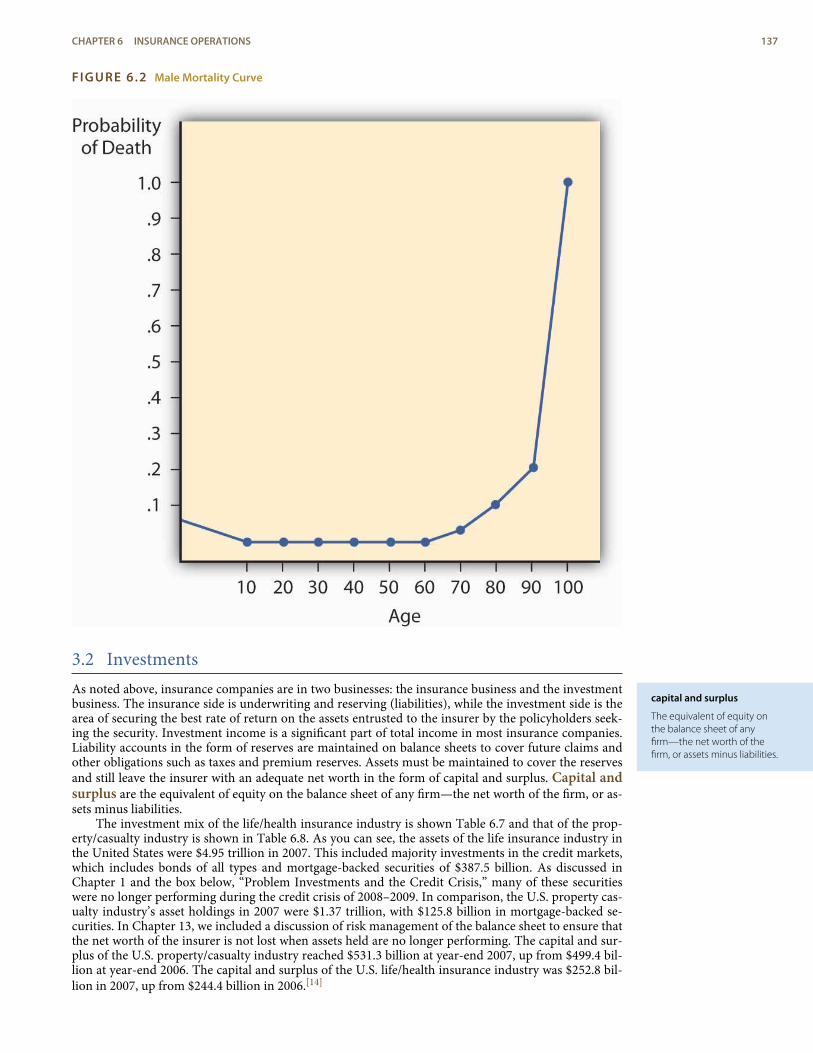
capital and surplus
The equivalent of equity onthe balance sheet of anyfirm—the net worth of thefirm, or assets minus liabilities.
FIGURE 6.2 Male Mortality Curve
3.2 InvestmentsAs noted above, insurance companies are in two businesses: the insurance business and the investmentbusiness. The insurance side is underwriting and reserving (liabilities), while the investment side is thearea of securing the best rate of return on the assets entrusted to the insurer by the policyholders seek-ing the security. Investment income is a significant part of total income in most insurance companies.Liability accounts in the form of reserves are maintained on balance sheets to cover future claims andother obligations such as taxes and premium reserves. Assets must be maintained to cover the reservesand still leave the insurer with an adequate net worth in the form of capital and surplus. Capital andsurplus are the equivalent of equity on the balance sheet of any firm—the net worth of the firm, or as-sets minus liabilities.
The investment mix of the life/health insurance industry is shown Table 6.7 and that of the prop-erty/casualty industry is shown in Table 6.8. As you can see, the assets of the life insurance industry inthe United States were $4.95 trillion in 2007. This included majority investments in the credit markets,which includes bonds of all types and mortgage-backed securities of $387.5 billion. As discussed inChapter 1 and the box below, “Problem Investments and the Credit Crisis,” many of these securitieswere no longer performing during the credit crisis of 2008–2009. In comparison, the U.S. property cas-ualty industry’s asset holdings in 2007 were $1.37 trillion, with $125.8 billion in mortgage-backed se-curities. In Chapter 13, we included a discussion of risk management of the balance sheet to ensure thatthe net worth of the insurer is not lost when assets held are no longer performing. The capital and sur-plus of the U.S. property/casualty industry reached $531.3 billion at year-end 2007, up from $499.4 bil-lion at year-end 2006. The capital and surplus of the U.S. life/health insurance industry was $252.8 bil-lion in 2007, up from $244.4 billion in 2006.[14]
CHAPTER 6 INSURANCE OPERATIONS 137
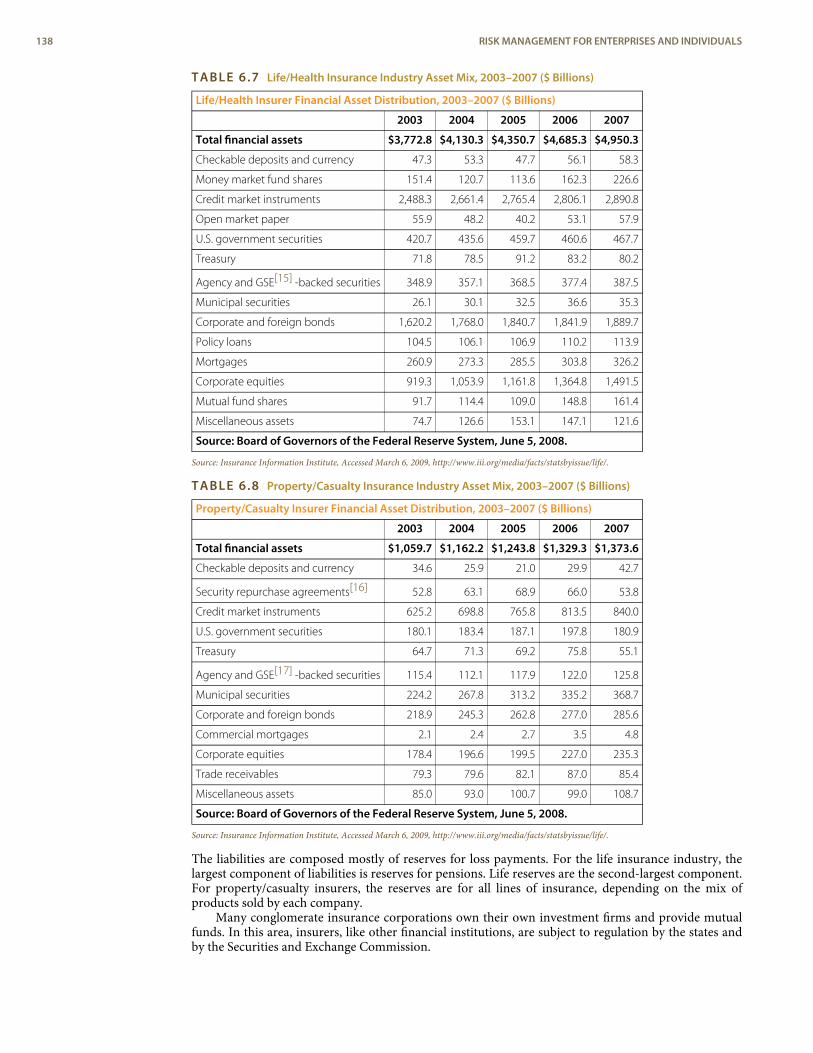
TABLE 6.7 Life/Health Insurance Industry Asset Mix, 2003–2007 ($ Billions)
Life/Health Insurer Financial Asset Distribution, 2003–2007 ($ Billions)
2003 2004 2005 2006 2007
Total financial assets $3,772.8 $4,130.3 $4,350.7 $4,685.3 $4,950.3
Checkable deposits and currency 47.3 53.3 47.7 56.1 58.3
Money market fund shares 151.4 120.7 113.6 162.3 226.6
Credit market instruments 2,488.3 2,661.4 2,765.4 2,806.1 2,890.8
Open market paper 55.9 48.2 40.2 53.1 57.9
U.S. government securities 420.7 435.6 459.7 460.6 467.7
Treasury 71.8 78.5 91.2 83.2 80.2
Agency and GSE[15] -backed securities 348.9 357.1 368.5 377.4 387.5
Municipal securities 26.1 30.1 32.5 36.6 35.3
Corporate and foreign bonds 1,620.2 1,768.0 1,840.7 1,841.9 1,889.7
Policy loans 104.5 106.1 106.9 110.2 113.9
Mortgages 260.9 273.3 285.5 303.8 326.2
Corporate equities 919.3 1,053.9 1,161.8 1,364.8 1,491.5
Mutual fund shares 91.7 114.4 109.0 148.8 161.4
Miscellaneous assets 74.7 126.6 153.1 147.1 121.6
Source: Board of Governors of the Federal Reserve System, June 5, 2008.
Source: Insurance Information Institute, Accessed March 6, 2009, http://www.iii.org/media/facts/statsbyissue/life/.
TABLE 6.8 Property/Casualty Insurance Industry Asset Mix, 2003–2007 ($ Billions)
Property/Casualty Insurer Financial Asset Distribution, 2003–2007 ($ Billions)
2003 2004 2005 2006 2007
Total financial assets $1,059.7 $1,162.2 $1,243.8 $1,329.3 $1,373.6
Checkable deposits and currency 34.6 25.9 21.0 29.9 42.7
Security repurchase agreements[16] 52.8 63.1 68.9 66.0 53.8
Credit market instruments 625.2 698.8 765.8 813.5 840.0
U.S. government securities 180.1 183.4 187.1 197.8 180.9
Treasury 64.7 71.3 69.2 75.8 55.1
Agency and GSE[17] -backed securities 115.4 112.1 117.9 122.0 125.8
Municipal securities 224.2 267.8 313.2 335.2 368.7
Corporate and foreign bonds 218.9 245.3 262.8 277.0 285.6
Commercial mortgages 2.1 2.4 2.7 3.5 4.8
Corporate equities 178.4 196.6 199.5 227.0 235.3
Trade receivables 79.3 79.6 82.1 87.0 85.4
Miscellaneous assets 85.0 93.0 100.7 99.0 108.7
Source: Board of Governors of the Federal Reserve System, June 5, 2008.
Source: Insurance Information Institute, Accessed March 6, 2009, http://www.iii.org/media/facts/statsbyissue/life/.
The liabilities are composed mostly of reserves for loss payments. For the life insurance industry, thelargest component of liabilities is reserves for pensions. Life reserves are the second-largest component.For property/casualty insurers, the reserves are for all lines of insurance, depending on the mix ofproducts sold by each company.
Many conglomerate insurance corporations own their own investment firms and provide mutualfunds. In this area, insurers, like other financial institutions, are subject to regulation by the states andby the Securities and Exchange Commission.
138 RISK MANAGEMENT FOR ENTERPRISES AND INDIVIDUALS
Problem Investments and the Credit Crisis
The greater risk faced by insurance companies is not the threat of going out of business due to insufficientsales volume, but the possibility that losses will be greater than anticipated and that they won’t be coveredthrough reserves and investment income. This further reinforces the importance of comprehending thenature of insureds’ business and properly categorizing their risks on the underwriting side, while accuratelycapturing loss expectations on the actuarial side. Insuring common risks in high volume leads to more accur-acy in predicting losses, but these risks do not vanish simply because they have been aggregated by the in-surer. Unfortunately, this concept was not taken into consideration by several large investment banks andsome insurance companies during the credit crisis beginning in 2007.
The credit crisis began when the U.S, housing bubble burst, setting off a protracted period characterized by in-creased valuation in real property, low interest rates, speculative investing, and massive demand for homes.During the housing bubble, low interest rates coupled with high liquidity were viewed as sufficiently favorableconditions to permit the extension of credit to high-risk (or subprime) borrowers. Many people who wouldotherwise not qualify for loans found themselves with mortgages and the homes of their dreams. Lenders pro-tected themselves through the issuance of variable interest rate mortgages, whereby increased risk could betransferred to borrowers in the form of interest rate hikes. While this had the potential to put already high-risk(subprime) borrowers in an even worse position to meet their monthly obligations, borrowers counted on thevery liquid nature of real estate during this period as a crutch to salvage their investments. Because home valu-ations and turnover were rising at such rapid rates, it was reasoned that financially strapped borrowers couldsimply sell and pay off their mortgages rather than face foreclosure.
The cycle of high turnover feeding into the housing bubble was halted when excess inventory of new homesand interest rate increases led to a downward correction of housing prices in 2005.[18] When lenders tried topass these rate increases on to their buyers—many of whom had put little money down and had lived in theirhomes for less than a year—mortgage payments skyrocketed, even to the point of leaving buyers owing morethan their homes were worth (negative equity). Home buying activity thus halted, leaving real estate a highlyilliquid investment. The worst-case scenario was materializing, with foreclosures leaping to a staggering 79percent in 2007, comprised of about 1.3 million homes.[19]
During the housing bubble, the concept of risk transfer was carried out to an egregious extent. Lenders recog-nized the inherent riskiness of their activities, but they compounded the problem by attempting to transferthis risk to the very source of it. In other cases, subprime loans were sold to investment banks, who bundledthem into exotic investment vehicles known as mortgage-backed securities (MBSs). These securities, derivedmainly from subprime mortgages, ordinarily would be comparable to junk bonds in their risk assessment.Nevertheless, by dividing them into different investment classifications and purchasing credit-default swap(CDS) insurance (discussed below), investment banks were able to acquire acceptable grades on MBSs fromthe major rating agencies.[20] Investment-grade MBSs were in turn marketed as collateralized debt obligations(CDOs) and other options and sold to institutional investors. Ultimately, this group was left holding the bagwhen foreclosures rippled through the system, rendering the derivative investments worthless. Thus, the lend-ing pendulum swung in the opposite direction, making it difficult for normally creditworthy borrowers to se-cure even rudimentary business loans. The pass-the-buck mentality with respect to risk transfer precipitatedthis credit crunch, which came to be known as the credit crisis. Everyone wanted the risky mortgage-backedsecurities off their balance sheets without acknowledging the potential folly of investing in them in the firstplace.
As it relates to the insurance industry, recall that insurers must hold assets that are sufficient to cover their liab-ilities (as discussed in the previous section) at any given time. In much the same way that a mortgage holder isrequired to purchase mortgage insurance to protect the lender when equity accounts for less than 25 percentof the total value of his or her home, issuers of MBSs engage in what are called credit default swaps (CDSs) toreassure investors.[21] Insuring CDSs means that an insurer, rather than the MBS issuer, will deliver the promisedpayment to MBS investors in the event of default (in this case, foreclosure of the underlying mortgages).
AIG was one of the largest issuers of CDS insurance at the time of the credit crisis. The tightening of standardswith respect to risk forced CDS insurers like AIG to hold liquid assets such that payouts could be made in theevent that all of their CDS writings made claims. To illustrate, this burden would be the equivalent of all of acompany’s insured homeowners suffering total losses simultaneously. While this scenario was improbable, thecapital had to be set aside as if it would occur. AIG found it impossible to shore up enough assets to matchagainst its now enormous liabilities, plunging the company into dire financial straits. In September 2008, AIGwas extended an $85 billion line of credit from the Federal Reserve,[22] adding to the list of companies bailedout by the U.S. government in the wake of the economic recession brought about by the credit crisis.
At the Senate Budget Committee hearing on March 2, 2009, Federal Reserve Board Chairman Ben Bernanketestified as to the role of failures in the regulatory environment that allowed AIG to accumulate so much baddebt on its books. Bernanke accused the company of exploiting the fact that there was no oversight of the fin-ancial products division and went on to say, “If there’s a single episode in this entire 18 months that has made
CHAPTER 6 INSURANCE OPERATIONS 139
me more angry [than AIG], I can’t think of one.” He likened AIG to a “hedge fund … attached to a large andstable insurance company” that made “irresponsible bets” in explaining the firm’s actions leading up to its fin-ancial meltdown. Bernanke called for the Obama administration to expand the powers of the Federal DepositInsurance Corporation (FDIC) to address the problems of large financial institutions rather than focusing onbanks alone.[23]
K E Y T A K E A W A Y S
In this section you studied the following:
< Actuarial analysis is used to project past losses into the future to predict reserve needs and appropriaterates to charge.
< Actuaries utilize loss development and mortality tables to aid in setting premium rates and establishingadequate reserves.
< Several adjustments are reflected in insurance premiums: anticipated investment earnings, marketing/administrative costs, taxes, risk premium, and profit.
< Insurers use catastrophe modeling to predict future losses.
< A major component of insurance industry profits is investment income from the payment of premiums.
< Investments are needed so that assets can cover insurers’ significant liabilities (primarily loss reserves)while providing adequate capital and surplus.
140 RISK MANAGEMENT FOR ENTERPRISES AND INDIVIDUALS
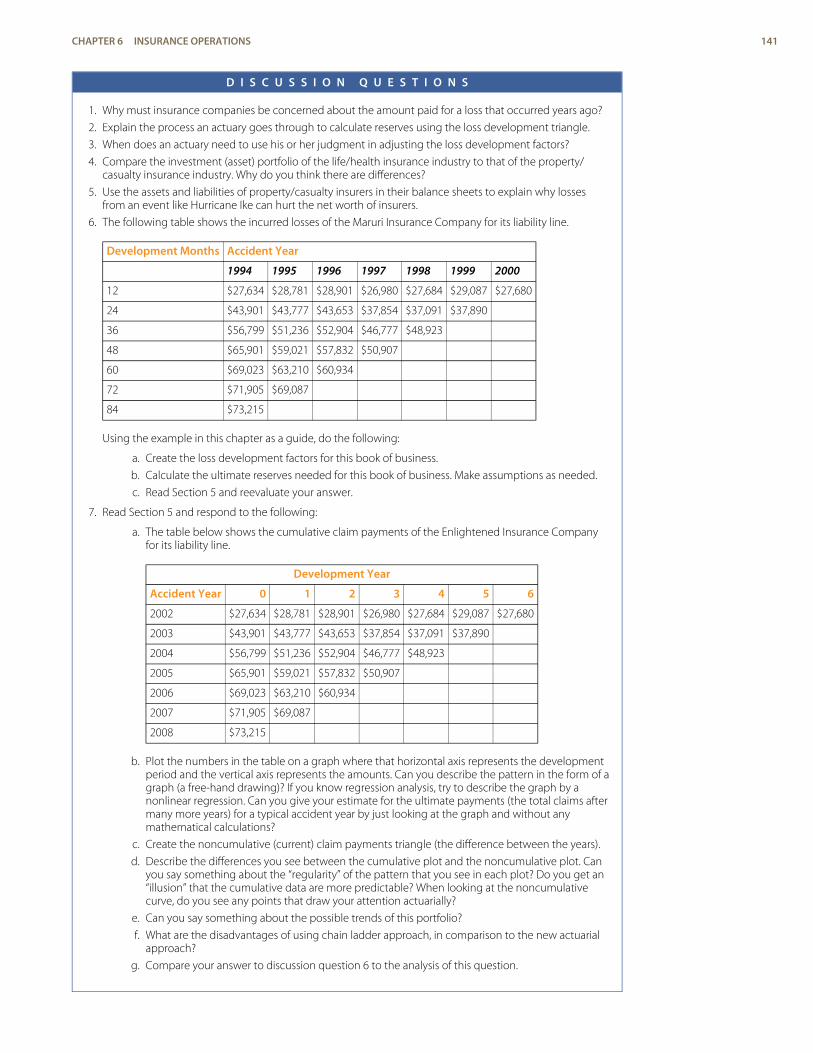
D I S C U S S I O N Q U E S T I O N S
1. Why must insurance companies be concerned about the amount paid for a loss that occurred years ago?
2. Explain the process an actuary goes through to calculate reserves using the loss development triangle.
3. When does an actuary need to use his or her judgment in adjusting the loss development factors?
4. Compare the investment (asset) portfolio of the life/health insurance industry to that of the property/casualty insurance industry. Why do you think there are differences?
5. Use the assets and liabilities of property/casualty insurers in their balance sheets to explain why lossesfrom an event like Hurricane Ike can hurt the net worth of insurers.
6. The following table shows the incurred losses of the Maruri Insurance Company for its liability line.
Development Months Accident Year
1994 1995 1996 1997 1998 1999 2000
12 $27,634 $28,781 $28,901 $26,980 $27,684 $29,087 $27,680
24 $43,901 $43,777 $43,653 $37,854 $37,091 $37,890
36 $56,799 $51,236 $52,904 $46,777 $48,923
48 $65,901 $59,021 $57,832 $50,907
60 $69,023 $63,210 $60,934
72 $71,905 $69,087
84 $73,215
Using the example in this chapter as a guide, do the following:
a. Create the loss development factors for this book of business.
b. Calculate the ultimate reserves needed for this book of business. Make assumptions as needed.
c. Read Section 5 and reevaluate your answer.
7. Read Section 5 and respond to the following:
a. The table below shows the cumulative claim payments of the Enlightened Insurance Companyfor its liability line.
Development Year
Accident Year 0 1 2 3 4 5 6
2002 $27,634 $28,781 $28,901 $26,980 $27,684 $29,087 $27,680
2003 $43,901 $43,777 $43,653 $37,854 $37,091 $37,890
2004 $56,799 $51,236 $52,904 $46,777 $48,923
2005 $65,901 $59,021 $57,832 $50,907
2006 $69,023 $63,210 $60,934
2007 $71,905 $69,087
2008 $73,215
b. Plot the numbers in the table on a graph where that horizontal axis represents the developmentperiod and the vertical axis represents the amounts. Can you describe the pattern in the form of agraph (a free-hand drawing)? If you know regression analysis, try to describe the graph by anonlinear regression. Can you give your estimate for the ultimate payments (the total claims aftermany more years) for a typical accident year by just looking at the graph and without anymathematical calculations?
c. Create the noncumulative (current) claim payments triangle (the difference between the years).
d. Describe the differences you see between the cumulative plot and the noncumulative plot. Canyou say something about the “regularity” of the pattern that you see in each plot? Do you get an“illusion” that the cumulative data are more predictable? When looking at the noncumulativecurve, do you see any points that draw your attention actuarially?
e. Can you say something about the possible trends of this portfolio?
f. What are the disadvantages of using chain ladder approach, in comparison to the new actuarialapproach?
g. Compare your answer to discussion question 6 to the analysis of this question.
CHAPTER 6 INSURANCE OPERATIONS 141
reinsurance
An arrangement by which aninsurance company transfersall or a portion of its riskunder a contract (orcontracts) of insurance toanother company.
ceding insurer
The company transferring riskin a reinsurance arrangement.
assuming reinsurer
The company taking over therisk in a reinsurancearrangement.
treaty arrangement
Arrangement in which theoriginal insurer is obligated toautomatically reinsure anynew underlying insurancecontract that meets the termsof a prearranged treaty, andthe reinsurer is obligated toaccept certain responsibilitiesfor the specified insurance.
facultative arrangement
Arrangement in which boththe primary insurer and thereinsurer retain fulldecision-making powers withrespect to each insurancecontract.
4. INSURANCE OPERATIONS: REINSURANCE, LEGALAND REGULATORY ISSUES, CLAIMS, ANDMANAGEMENT
L E A R N I N G O B J E C T I V E S
In this section we elaborate on the following:
< How reinsurance works and the protection it provides< Contract arrangements in reinsurance transactions and methods of coverage< The benefits of reinsurance< The general legal aspects of insurance< The claims adjustment process and the role of the claims adjuster< The management function
4.1 ReinsuranceReinsurance is an arrangement by which an insurance company transfers all or a portion of its riskunder a contract (or contracts) of insurance to another company. The company transferring risk in areinsurance arrangement is called the ceding insurer. The company taking over the risk in a reinsur-ance arrangement is the assuming reinsurer. In effect, the insurance company that issued the policiesis seeking protection from another insurer, the assuming reinsurer. Typically, the reinsurer assumes re-sponsibility for part of the losses under an insurance contract; however, in some instances, the rein-surer assumes full responsibility for the original insurance contract. As with insurance, reinsurance in-volves risk transfer, risk distribution, risk diversification across more insurance companies, and cover-age against insurance risk. Risk diversification is the spreading of the risk to other insurers to reducethe exposure of the primary insurer, the one that deals with the final consumer.
How Reinsurance Works
Reinsurance may be divided into three types: (1) treaty, (2) facultative, and (3) a combination of thesetwo. Each of these types may be further classified as proportional or nonproportional. The original orprimary insurer (the ceding company) may have a treaty with a reinsurer. Under a treaty arrange-ment, the original insurer is obligated to automatically reinsure any new underlying insurance con-tract that meets the terms of a prearranged treaty, and the reinsurer is obligated to accept certain re-sponsibilities for the specified insurance. Thus, the reinsurance coverage is provided automatically formany policies. In a facultative arrangement, both the primary insurer and the reinsurer retain fulldecision-making powers with respect to each insurance contract. As each insurance contract is issued,the primary insurer decides whether or not to seek reinsurance, and the reinsurer retains the flexibilityto accept or reject each application for reinsurance on a case-by-case basis. The combination approachmay require the primary insurer to offer to reinsure specified contracts (like the treaty approach) whileleaving the reinsurer free to decide whether to accept or reject reinsurance on each contract (like thefacultative approach). Alternatively, the combination approach can give the option to the primary in-surer and automatically require acceptance by the reinsurer on all contracts offered for reinsurance. Inany event, a contract between the ceding company and the reinsurer spells out the agreement betweenthe two parties.
142 RISK MANAGEMENT FOR ENTERPRISES AND INDIVIDUALS
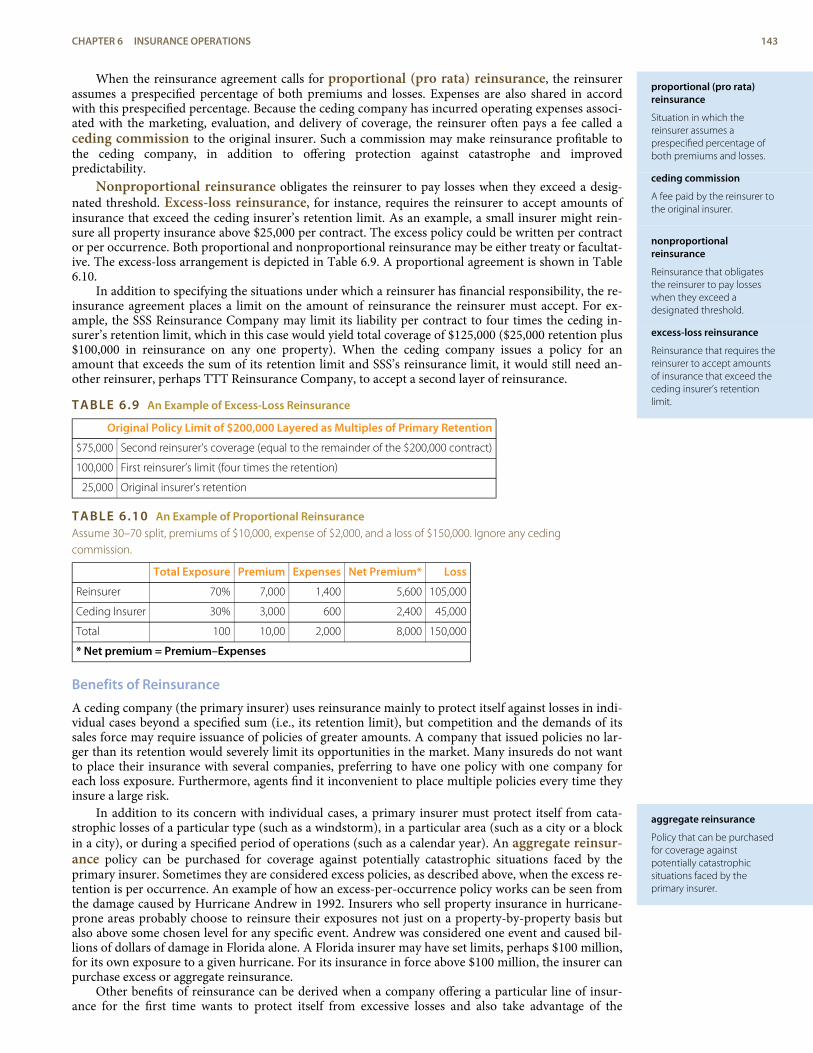
proportional (pro rata)reinsurance
Situation in which thereinsurer assumes aprespecified percentage ofboth premiums and losses.
ceding commission
A fee paid by the reinsurer tothe original insurer.
nonproportionalreinsurance
Reinsurance that obligatesthe reinsurer to pay losseswhen they exceed adesignated threshold.
excess-loss reinsurance
Reinsurance that requires thereinsurer to accept amountsof insurance that exceed theceding insurer’s retentionlimit.
aggregate reinsurance
Policy that can be purchasedfor coverage againstpotentially catastrophicsituations faced by theprimary insurer.
When the reinsurance agreement calls for proportional (pro rata) reinsurance, the reinsurerassumes a prespecified percentage of both premiums and losses. Expenses are also shared in accordwith this prespecified percentage. Because the ceding company has incurred operating expenses associ-ated with the marketing, evaluation, and delivery of coverage, the reinsurer often pays a fee called aceding commission to the original insurer. Such a commission may make reinsurance profitable tothe ceding company, in addition to offering protection against catastrophe and improvedpredictability.
Nonproportional reinsurance obligates the reinsurer to pay losses when they exceed a desig-nated threshold. Excess-loss reinsurance, for instance, requires the reinsurer to accept amounts ofinsurance that exceed the ceding insurer’s retention limit. As an example, a small insurer might rein-sure all property insurance above $25,000 per contract. The excess policy could be written per contractor per occurrence. Both proportional and nonproportional reinsurance may be either treaty or facultat-ive. The excess-loss arrangement is depicted in Table 6.9. A proportional agreement is shown in Table6.10.
In addition to specifying the situations under which a reinsurer has financial responsibility, the re-insurance agreement places a limit on the amount of reinsurance the reinsurer must accept. For ex-ample, the SSS Reinsurance Company may limit its liability per contract to four times the ceding in-surer’s retention limit, which in this case would yield total coverage of $125,000 ($25,000 retention plus$100,000 in reinsurance on any one property). When the ceding company issues a policy for anamount that exceeds the sum of its retention limit and SSS’s reinsurance limit, it would still need an-other reinsurer, perhaps TTT Reinsurance Company, to accept a second layer of reinsurance.
TABLE 6.9 An Example of Excess-Loss Reinsurance
Original Policy Limit of $200,000 Layered as Multiples of Primary Retention
$75,000 Second reinsurer’s coverage (equal to the remainder of the $200,000 contract)
100,000 First reinsurer’s limit (four times the retention)
25,000 Original insurer’s retention
TABLE 6.10 An Example of Proportional ReinsuranceAssume 30–70 split, premiums of $10,000, expense of $2,000, and a loss of $150,000. Ignore any cedingcommission.
Total Exposure Premium Expenses Net Premium* Loss
Reinsurer 70% 7,000 1,400 5,600 105,000
Ceding Insurer 30% 3,000 600 2,400 45,000
Total 100 10,00 2,000 8,000 150,000
* Net premium = Premium–Expenses
Benefits of Reinsurance
A ceding company (the primary insurer) uses reinsurance mainly to protect itself against losses in indi-vidual cases beyond a specified sum (i.e., its retention limit), but competition and the demands of itssales force may require issuance of policies of greater amounts. A company that issued policies no lar-ger than its retention would severely limit its opportunities in the market. Many insureds do not wantto place their insurance with several companies, preferring to have one policy with one company foreach loss exposure. Furthermore, agents find it inconvenient to place multiple policies every time theyinsure a large risk.
In addition to its concern with individual cases, a primary insurer must protect itself from cata-strophic losses of a particular type (such as a windstorm), in a particular area (such as a city or a blockin a city), or during a specified period of operations (such as a calendar year). An aggregate reinsur-ance policy can be purchased for coverage against potentially catastrophic situations faced by theprimary insurer. Sometimes they are considered excess policies, as described above, when the excess re-tention is per occurrence. An example of how an excess-per-occurrence policy works can be seen fromthe damage caused by Hurricane Andrew in 1992. Insurers who sell property insurance in hurricane-prone areas probably choose to reinsure their exposures not just on a property-by-property basis butalso above some chosen level for any specific event. Andrew was considered one event and caused bil-lions of dollars of damage in Florida alone. A Florida insurer may have set limits, perhaps $100 million,for its own exposure to a given hurricane. For its insurance in force above $100 million, the insurer canpurchase excess or aggregate reinsurance.
Other benefits of reinsurance can be derived when a company offering a particular line of insur-ance for the first time wants to protect itself from excessive losses and also take advantage of the
CHAPTER 6 INSURANCE OPERATIONS 143
claims adjusting
The process of payinginsureds after they sustainlosses.
claims adjuster
The person who representsthe insurer when thepolicyholder presents a claimfor payment.
company adjuster
An employee of the insurerwho handles claims.
independent adjuster
An employee of an adjustingfirm that works for severaldifferent insurers and receivesa fee for each claim handled.
reinsurer’s knowledge concerning the proper rates to be charged and underwriting practices to be fol-lowed. In other cases, a rapidly expanding company may have to shift some of its liabilities to a rein-surer to avoid impairing its capital. Reinsurance often also increases the amount of insurance the un-derlying insurer can sell. This is referred to as increasing capacity.
Reinsurance is significant to the buyer of insurance for a number of reasons. First, reinsurance in-creases the financial stability of insurers by spreading risk. This increases the likelihood that the origin-al insurer will be able to pay its claims. Second, reinsurance facilitates placing large or unusual expos-ures with one company, thus reducing the time spent seeking insurance and eliminating the need fornumerous policies to cover one exposure. This reduces transaction costs for both buyer and seller.Third, reinsurance helps small insurance companies stay in business, thus increasing competition inthe industry. Without reinsurance, small companies would find it much more difficult to compete withlarger ones.
Individual policyholders, however, rarely know about any reinsurance that may apply to their cov-erage. Even for those who are aware of the reinsurance, whether it is on a business or an individualcontract, most insurance policies prohibit direct access from the original insured to the reinsurer. Theprohibition exists because the reinsurance agreement is a separate contract from the primary (original)insurance contract, and thus the original insured is not a party to the reinsurance. Because reinsuranceis part of the global insurance industry, globalization is also at center stage.
4.2 Legal and Regulatory IssuesIn reality, the only tangible product we receive from the insurance company when we transfer the riskand pay the premium is a legal contract in the form of a policy. Thus, the nature of insurance is verylegal. The wordings of the contracts are regularly challenged. Consequently, law pervades insurance in-dustry operations. Lawyers help draft insurance contracts, interpret contract provisions when claimsare presented, defend the insurer in lawsuits, communicate with legislators and regulators, and helpwith various other aspects of operating an insurance business.
4.3 Claims AdjustingClaims adjusting is the process of paying insureds after they sustain losses. The claims adjuster isthe person who represents the insurer when the policyholder presents a claim for payment. Relativelysmall property losses, up to $500 or so, may be adjusted by the sales agent. Larger claims will behandled by either a company adjuster, an employee of the insurer who handles claims, or an inde-pendent adjuster. The independent adjuster is an employee of an adjusting firm that works for sev-eral different insurers and receives a fee for each claim handled.
A claims adjuster’s job includes (1) investigating the circumstances surrounding a loss, (2) determ-ining whether the loss is covered or excluded under the terms of the contract, (3) deciding how muchshould be paid if the loss is covered, (4) paying valid claims promptly, and (5) resisting invalid claims.The varying situations give the claims adjuster opportunities to use her or his knowledge of insurancecontracts, investigative abilities, knowledge of the law, negotiation skills, and tactful communication.Most of the adjuster’s work is done outside the office or at a drive-in automobile claims facility. Satis-factory settlement of claims is the ultimate test of an insurance company’s value to its insureds and tosociety. Like underwriting, claims adjusting requires substantial knowledge of insurance.
Claim Practices
It is unreasonable to expect an insurer to be overly generous in paying claims or to honor claims thatshould not be paid at all, but it is advisable to avoid a company that makes a practice of resisting reas-onable claims. This may signal financial trouble. Information is available about insurers’ claims prac-tices. Each state’s insurance department compiles complaints data. An insurer that has more than anaverage level of complaints is best avoided.
4.4 ManagementAs in other organizations, an insurer needs competent managers to plan, organize, direct, control, andlead. The insurance management team functions best when it knows the nature of insurance and theenvironment in which insurers conduct business. Although some top management people are hiredwithout backgrounds in the insurance business, the typical top management team for an insurer con-sists of people who learned about the business by working in one or more functional areas of insurance.If you choose an insurance career, you will probably begin in one of the functional areas discussedabove.
144 RISK MANAGEMENT FOR ENTERPRISES AND INDIVIDUALS
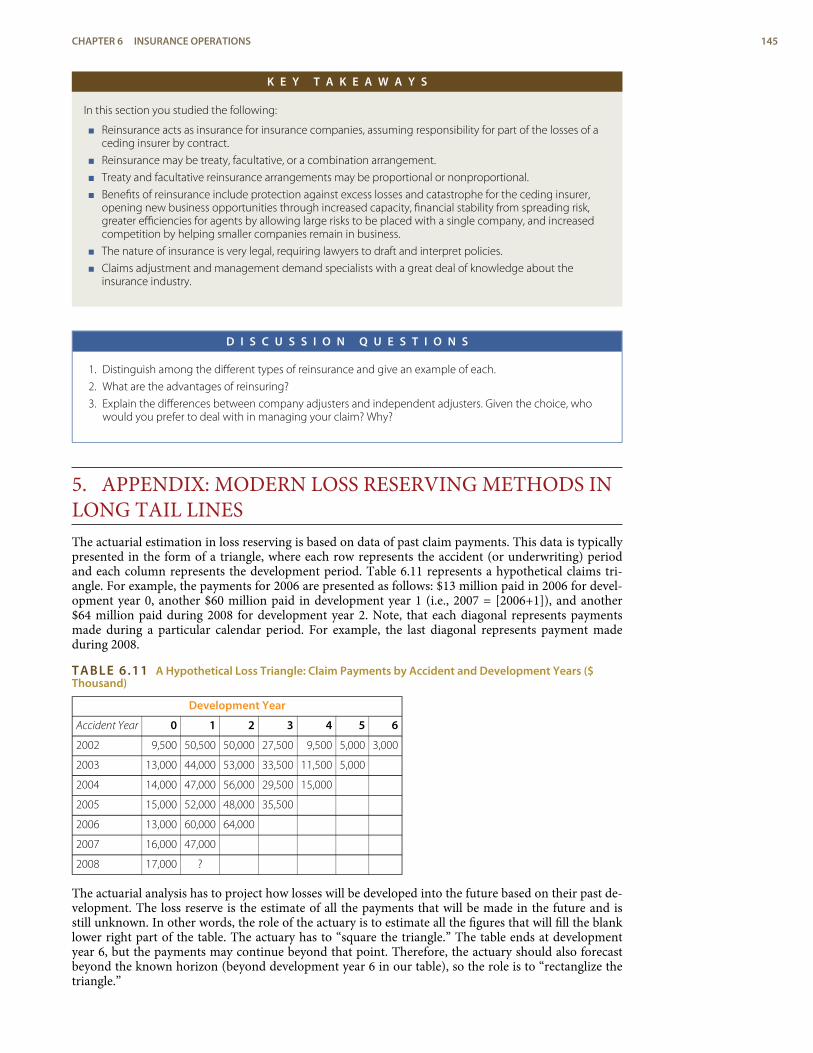
K E Y T A K E A W A Y S
In this section you studied the following:
< Reinsurance acts as insurance for insurance companies, assuming responsibility for part of the losses of aceding insurer by contract.
< Reinsurance may be treaty, facultative, or a combination arrangement.
< Treaty and facultative reinsurance arrangements may be proportional or nonproportional.
< Benefits of reinsurance include protection against excess losses and catastrophe for the ceding insurer,opening new business opportunities through increased capacity, financial stability from spreading risk,greater efficiencies for agents by allowing large risks to be placed with a single company, and increasedcompetition by helping smaller companies remain in business.
< The nature of insurance is very legal, requiring lawyers to draft and interpret policies.
< Claims adjustment and management demand specialists with a great deal of knowledge about theinsurance industry.
D I S C U S S I O N Q U E S T I O N S
1. Distinguish among the different types of reinsurance and give an example of each.
2. What are the advantages of reinsuring?
3. Explain the differences between company adjusters and independent adjusters. Given the choice, whowould you prefer to deal with in managing your claim? Why?
5. APPENDIX: MODERN LOSS RESERVING METHODS INLONG TAIL LINESThe actuarial estimation in loss reserving is based on data of past claim payments. This data is typicallypresented in the form of a triangle, where each row represents the accident (or underwriting) periodand each column represents the development period. Table 6.11 represents a hypothetical claims tri-angle. For example, the payments for 2006 are presented as follows: $13 million paid in 2006 for devel-opment year 0, another $60 million paid in development year 1 (i.e., 2007 = [2006+1]), and another$64 million paid during 2008 for development year 2. Note, that each diagonal represents paymentsmade during a particular calendar period. For example, the last diagonal represents payment madeduring 2008.
TABLE 6.11 A Hypothetical Loss Triangle: Claim Payments by Accident and Development Years ($Thousand)
Development Year
Accident Year 0 1 2 3 4 5 6
2002 9,500 50,500 50,000 27,500 9,500 5,000 3,000
2003 13,000 44,000 53,000 33,500 11,500 5,000
2004 14,000 47,000 56,000 29,500 15,000
2005 15,000 52,000 48,000 35,500
2006 13,000 60,000 64,000
2007 16,000 47,000
2008 17,000 ?
The actuarial analysis has to project how losses will be developed into the future based on their past de-velopment. The loss reserve is the estimate of all the payments that will be made in the future and isstill unknown. In other words, the role of the actuary is to estimate all the figures that will fill the blanklower right part of the table. The actuary has to “square the triangle.” The table ends at developmentyear 6, but the payments may continue beyond that point. Therefore, the actuary should also forecastbeyond the known horizon (beyond development year 6 in our table), so the role is to “rectanglize thetriangle.”
CHAPTER 6 INSURANCE OPERATIONS 145
The actuary may use a great variety of triangles in preparing the forecast: the data could be ar-ranged by months, quarters, or years. The data could be in current figure or in cumulative figures. Thedata could represent numbers: the number of reported claims, the number of settled claims, the num-ber of still pending claims, the number of closed claims, and so forth The figures could represent claimpayments such as current payments, payments for claims that were closed, incurred claim figures (i.e.,the actual payments plus the case estimate), indexed figures, average claim figures, and so forth.
All actuarial techniques seek to identify a hidden pattern in the triangle, and to use it to performthe forecast. Some common techniques are quite intuitive and are concerned with identifying relation-ships between the payments made across consecutive developing years. Let us demonstrate it on Table6.11 by trying to estimate the expected payments for accident year 2008 during 2009 (the cell with thequestion mark). We can try doing so by finding a ratio of the payments in development year 1 to thepayments in development year 0. We have information for accident years 2002 through 2007. The sumof payments made for these years during development year 1 is $300,500 and the sum of paymentsmade during development year 0 is $80,500. The ratio between these sums is 3.73. We multiply this ra-tio by the $17,000 figure for year 2008, which gives an estimate of $63,410 in payments that will bemade for accident year 2008 during development year 1 (i.e., during 2009). Note that there are otherways to calculate the ratios: instead of using the ratio between sums, we could have calculated for eachaccident year the ratio between development year 1 and development year 0, then calculated the aver-age ratio for all years. This would give a different multiplying factor, resulting in a different forecast.
In a similar way, we can calculate factors for moving from any other development period to thenext one (a set of factors to be used for moving from each column to the following one). Using thesefactors, we can fill all other blank cells in Table 6.11. Note that the figure of $63,410 that we inserted asthe estimate for accident year 2008 during development year 1 is included in estimating the next figurein the table. In other words, we created a recursive model, where the outcome of one step is used in es-timating the outcome of the next step. We have created a sort of “chain ladder,” as these forecastingmethods are often referred to.
In the above example, we used ratios to move from one cell to the next one. But this forecastingmethod is only one of many we could have utilized. For example, we could easily create an additivemodel rather than a multiplicative model (based on ratios). We can calculate the average differencebetween columns and use it to climb from one cell to the missing cell on its right. For example, the av-erage difference between the payments for development year 1 and development year 0 is $36,667(calculated only for the figures for which we have data on both development years 0 and 1, or 2002through 2007). Therefore, our alternative estimate for the missing figure in Table 6.11, the paymentsthat are expected for accident year 2008 during 2009, is $53,667 ($17,000 plus $36,667). Quite a differ-ent estimate than the one we obtained earlier!
We can create more complicated models, and the traditional actuarial literature is full of them.The common feature of the above examples is that they are estimating the set of development periodfactors. However, there could also be a set of “accident period factors” to account for the possibilitythat the portfolio does not always stay constant between years. In one year, there could have been manypolicies or accidents, whereas in the other year, there could have been fewer. So, there could be anotherset of factors to be used when moving between rows (accident periods) in the triangle. Additionally,there could also be a set of calendar year factors to describe the changes made while moving from onediagonal to the other. Such effects may result from a multitude of reasons—for example, a legal judg-ment forcing a policy change or inflation that increases average payments. A forecasting model oftenincorporates a combination of such factors. In our simple example with a triangle having seven rows,we may calculate six factors in each direction: six for the development periods (column effects), six forthe accident periods (row effects), and six for the diagonals (calendar or payment year effects). Theanalysis of such a simple triangle may include eighteen factors (or parameters). A larger triangle (whichis the common case in practice) where many periods (months, quarters, and years) are used involvesthe estimation of too many parameters, but simpler models with a much smaller number of factors canbe used (see below).
Although the above methods are very appealing intuitively and are still commonly used for loss re-serving, they all suffer from major drawbacks and are not ideal for use. Let us summarize some of themajor deficiencies:
< The use of factors in all three directions (accident year, development year, and payment year)may lead to contradictions. We have the freedom to determine any two directions, but the thirdis determined automatically by the first two.
< There is often a need to forecast “beyond the horizon”—that is, to estimate what will be paid inthe development years beyond year six in our example. The various chain ladder models cannotdo this.
< We can always find a mathematical formula that will describe all the data points, but it will lackgood predictive power. At the next period, we get new data and a larger triangle. The additionalnew pieces of information will often cause us to use a completely different set of
146 RISK MANAGEMENT FOR ENTERPRISES AND INDIVIDUALS
factors—including those relating to previous periods. The need to change all the factors isproblematic, as it indicates instability of the model and lack of predictive power. This happensdue to overparameterization (a very crucial point that deserves a more detailed explanation, asprovided below).
< There are no statistical tests for the validity of the factors. Thus, it is impossible to understandwhich parameters (factors) are statistically significant. To illustrate, it is clear that a factor(parameter) based on a ratio between only two data points (e.g., a development factor for thesixth year, which will be based on the two figures in the extreme right corner of the Table 6.11triangle) is naturally less reliable, although it may drastically affect the entire forecast.
< The use of simple ratios to create the factors may be unjustified because the relationships betweentwo cells could be more complicated. For example, it could be that a neighboring cell is obtainedby examining the first cell, adding a constant, and then multiplying by a ratio. Studies haveshown that most loss reserves calculated with chain ladder models are suffering from thisproblem.
< Chain ladder methods create a deterministic figure for the loss reserves. We have no idea as tohow reliable it is. It is clear that there is zero probability that the forecast will exactly foretell theexact future figure. But management would appreciate having an idea about the range of possibledeviations between the actual figures and the forecast.
< The most common techniques are based on triangles with cumulative figures. The advantage ofcumulative figures is that they suppress the variability of the claims pattern and create an illusionof stability. However, by taking cumulative rather than noncumulative figures, we often losemuch information, and we may miss important turning points. It is similar to what a gold minermay do by throwing away, rather than keeping, the little gold nuggets that may be found in hugepiles of worthless rocks.
< Many actuaries are still using triangles of incurred claim figures. The incurred figures are the sumof the actually paid numbers plus the estimates of future payments supplied by claimsdepartment personnel. The resulting actuarial factors from such triangles are strongly influencedby the changes made by the claims department from one period to the other. Such changesshould not be included in forecasting future trends.
There are modern actuarial techniques based on sophisticated statistical tools that could be used forgiving better forecasts while using the same loss triangles.[24] Let us see how this works without enga-ging in a complicated statistical discussion. The purpose of the discussion is to increase the under-standing of the principles, but we do not expect the typical student to be able to immediately performthe analysis. We shall largely leave the analysis to actuaries that are better equipped with the neededmathematical and statistical tools.
A good model is evaluated by its simplicity and generality. Having a complex model with manyparameters makes it complicated and less general. The chain ladder models that were discussed abovesuffer from this overparameterization problem, and the alternative models that are explained belowovercome this difficulty.
Let us start by simply displaying the data of Table 6.11 in a graphical form in Figure 6.3. The greendots describe the original data points (the paid claims on the vertical axis and the development years onthe horizontal axis). To show the general pattern, we added a line that represents the averages for eachdevelopment year. We see that claim payments in this line of business tend to increase, reach a peakafter a few years, then decline slowly over time and have a narrow “tail” (that is, small amounts are tobe paid in the far future).
CHAPTER 6 INSURANCE OPERATIONS 147
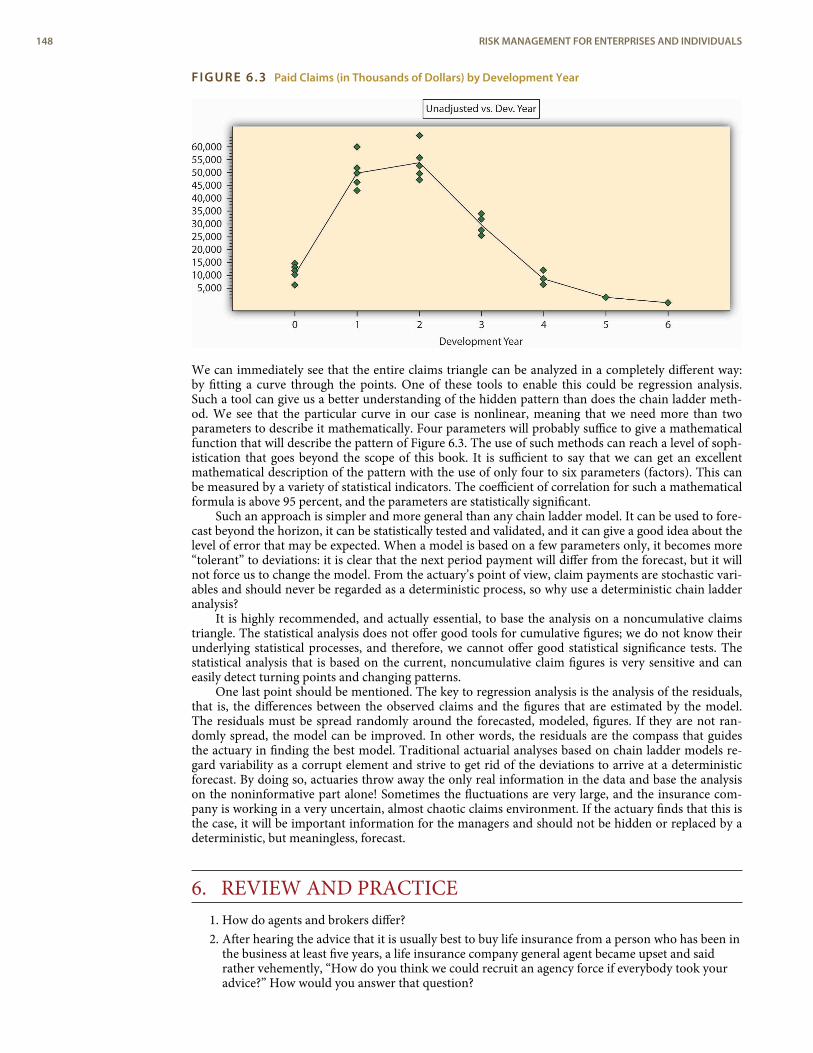
FIGURE 6.3 Paid Claims (in Thousands of Dollars) by Development Year
We can immediately see that the entire claims triangle can be analyzed in a completely different way:by fitting a curve through the points. One of these tools to enable this could be regression analysis.Such a tool can give us a better understanding of the hidden pattern than does the chain ladder meth-od. We see that the particular curve in our case is nonlinear, meaning that we need more than twoparameters to describe it mathematically. Four parameters will probably suffice to give a mathematicalfunction that will describe the pattern of Figure 6.3. The use of such methods can reach a level of soph-istication that goes beyond the scope of this book. It is sufficient to say that we can get an excellentmathematical description of the pattern with the use of only four to six parameters (factors). This canbe measured by a variety of statistical indicators. The coefficient of correlation for such a mathematicalformula is above 95 percent, and the parameters are statistically significant.
Such an approach is simpler and more general than any chain ladder model. It can be used to fore-cast beyond the horizon, it can be statistically tested and validated, and it can give a good idea about thelevel of error that may be expected. When a model is based on a few parameters only, it becomes more“tolerant” to deviations: it is clear that the next period payment will differ from the forecast, but it willnot force us to change the model. From the actuary’s point of view, claim payments are stochastic vari-ables and should never be regarded as a deterministic process, so why use a deterministic chain ladderanalysis?
It is highly recommended, and actually essential, to base the analysis on a noncumulative claimstriangle. The statistical analysis does not offer good tools for cumulative figures; we do not know theirunderlying statistical processes, and therefore, we cannot offer good statistical significance tests. Thestatistical analysis that is based on the current, noncumulative claim figures is very sensitive and caneasily detect turning points and changing patterns.
One last point should be mentioned. The key to regression analysis is the analysis of the residuals,that is, the differences between the observed claims and the figures that are estimated by the model.The residuals must be spread randomly around the forecasted, modeled, figures. If they are not ran-domly spread, the model can be improved. In other words, the residuals are the compass that guidesthe actuary in finding the best model. Traditional actuarial analyses based on chain ladder models re-gard variability as a corrupt element and strive to get rid of the deviations to arrive at a deterministicforecast. By doing so, actuaries throw away the only real information in the data and base the analysison the noninformative part alone! Sometimes the fluctuations are very large, and the insurance com-pany is working in a very uncertain, almost chaotic claims environment. If the actuary finds that this isthe case, it will be important information for the managers and should not be hidden or replaced by adeterministic, but meaningless, forecast.
6. REVIEW AND PRACTICE1. How do agents and brokers differ?2. After hearing the advice that it is usually best to buy life insurance from a person who has been in
the business at least five years, a life insurance company general agent became upset and saidrather vehemently, “How do you think we could recruit an agency force if everybody took youradvice?” How would you answer that question?
148 RISK MANAGEMENT FOR ENTERPRISES AND INDIVIDUALS
3. Is the inherently discriminatory nature of underwriting acceptable from a public policystandpoint? Would shifting to a primarily behavior-based approach to risk assessment befeasible?
4. What actuarial adjustments are built into the pricing of life insurance premiums?5. Occasionally, Insurer X will reinsure part of Insurer Y’s risks, and Insurer Y will reinsure part of
Insurer X’s risks. Doesn’t this seem like merely trading dollars? Explain.6. What is the relationship between the following functions within an insurance company?
a. Marketing and underwritingb. Underwriting and actuarialc. Actuarial and investmentd. Legal and underwritinge. Claims and marketingf. Claims adjusting and actuarial
7. Your acquaintance, Nancy Barns, recently commented to you that she and her husband want toreevaluate their homeowner’s insurance. Nancy said that it seemed the only time they ever hadany contact with their present insurance agency was when a premium was due. Nancy asked ifyou knew of a good agency.
a. Help Nancy set up standards to evaluate and choose a good agent.b. Review with her the standards of education and experience required of an agent,
including the CPCU designation.8. Read the box, "Problem Investments and the Credit Crisis", in this chapter and respond to the
following questions:a. Use the asset and liabilities of life insurers in their balance sheets to explain why losses in
mortgage-backed securities can hurt the net worth of insurers.b. Insurance brokers have been very busy since the troubles of AIG became public
knowledge. Why are these brokers busier? What is the connection between AIG’stroubles and the work of these brokers?
c. What is the cause of AIG’s problems? Explain in the context of assets and liabilities.9. Respond to the following:
a. If you have an auto policy with insurer XYZ that is deeply hurt by both mortgage-backedsecurities and Hurricane Ike, do you have any protection in case of losses to your ownauto (not caused by another driver)? Explain in detail.
b. If you have an auto policy with insurer XYZ that is deeply hurt by both mortgage-backedsecurities and Hurricane Ike, do you have any protection in case of losses to your ownauto and to your body from an accident that was caused by another driver (you are not atfault)? Explain in detail.
10. You are reading the Sunday newspaper when you notice a health insurance advertisement thatoffers the purchase of insurance through the mail and the first month’s coverage for one dollar.The insurance seems to be a real bargain.
a. Are there any problems you should be aware of when buying insurance through themail?
b. Explain how you could cope with the problems you listed above if you did purchasecoverage through the mail.
CHAPTER 6 INSURANCE OPERATIONS 149
1.
2.
3.
4.
5.
6.
7.
8.
9.
10.
11.
12.
13.
14.15.16.
17.18.19.
20.
21.
22.
23.
24.
ENDNOTES
Etti G. Baranoff, Dalit Baranoff, and Tom Sager, “Nonuniform Regulatory Treatment ofBroker Distribution Systems: An Impact Analysis for Life Insurers,” Journal of InsuranceRegulations, Regulations 19, no. 1 (Fall 2000): 94.
“2006: The Year When Changes Take Hold,” Insurance Journal, January 2, 2006, ac-cessed March 6, 2009, http://www.insurancejournal.com/magazines/west/2006/01/02/features/64730.htm; Steve Tuckey, “NAIC Broker Disclosure Amendment ChangesUnlikely,” National Underwriter Online News Service, April 15, 2005, accessed March 6,2009, http://www.nationalunderwriter.com/pandc/hotnews/viewPC.asp?article=4_15_05_15_17035.xml; “NAIC Adopts Model Legislation Calling For Broker Disclos-ures Defers One Section for Further Consideration” at http://www.naic.org/spotlight.htm; Mark E. Ruquet, “MMC Says Contingent Fees No Longer A Plus” Na-tional Underwriter Online News Service, February 15, 2006.
Sally Roberts, “Big I Changes Name to Reflect Membership Changes,” Business Insur-ance, May 6, 2002.
The term direct writer is frequently used to refer to all property insurers that do notuse the Independent Agency System of distribution, but some observers think thereare differences among such companies.
Paul P. Aniskovich, “Letters With Apps Can Make The Difference,” National Under-writer, Life & Health/Financial Services Edition, November 12, 2001.
Catherine Arnold, “Britain Backs Insurers Use of Genetic Testing,” National Underwriter,Life & Health/Financial Services Edition, November 27, 2000.
In this example, we do not introduce actuarial adjustments to the factors. Such ad-justments are usually based on management, technology, marketing, and otherknown functional changes within the company. The book of business is assumed tobe stable without any extreme changes that may require adjustments.
Claire Wilkinson, “Catastrophe Modeling: A Vital Tool in the Risk Management Box,”Insurance Information Institute, February 2008, Accessed March 6, 2009,http://www.iii.org/media/research/catmodeling/.
Michael Lewis, “In Nature’s Casino,” New York Times Magazine, August 26, 2007, Ac-cessed March 6, 2009; http://www.nytimes.com/2007/08/26/magazine/26neworleans-t.html.
AIR Worldwide, Accessed March 6, 2009, http://www.air-worldwide.com/ContentPage.aspx?id=16202.
Claire Wilkinson, “Catastrophe Modeling: A Vital Tool in the Risk Management Box,”Insurance Information Institute, February 2008, Accessed March 6, 2009,http://www.iii.org/media/research/catmodeling/.
American Insurance Association, Testimony for the National Association of InsuranceCommissioners (NAIC) 9/28/2007 Public Hearing on Catastrophe Modeling.
Claire Wilkinson, “Catastrophe Modeling: A Vital Tool in the Risk Management Box,”Insurance Information Institute, February 2008, Accessed March 6, 2009,http://www.iii.org/media/research/catmodeling/.
Insurance Information Institute. The Insurance Fact Book, 2009, p 31, 36.
Government-sponsored enterprise.
Short-term agreements to sell and repurchase government securities by a specifieddate at a set price.
Government-sponsored enterprise.
“Getting worried downtown.” The Economist November 15, 2007.
“U.S Foreclosure Activity Increases 75 Percent in 2007,” RealtyTrac, January 29, 2008,Accessed March 6, 2009, http://www.realtytrac.com/ContentManagement/pressrelease.aspx?ChannelID=9&ItemID=3988&accnt=64847.
“Let the Blame Begin; Everyone Played Some Role—The Street, Lenders, RatingsAgencies, Hedge Funds, Even Homeowners. Where Does Responsibility Lie? (TheSubprime Mess),” Business Week Online, July 30, 2007.
“The Financial Meltdown of AIG and Insurers Explained.” Smallcap Network, October27, 2008, http://www.smallcapnetwork.com/scb/the-financial-meltdown-of-aig-and-other-insurers-explained/2315/.
Edmund L. Andrews, Michael J. de la Merced, and Mary Williams Walsh, “Fed’s $85 Bil-lion Loan Rescues Insurer,” The New York Times, September 17, 2008, Accessed March6, 2009, http://www.nytimes.com/2008/09/17/business/17insure.html.
Arthur D. Postal, “Fed Chief Blasts AIG for Exploiting Reg System,” National Under-writer Online, Property/Casualty Edition, March 3, 2009, Accessed March 6, 2009.http://www.propertyandcasualtyinsurancenews.com/cms/nupc/Breaking+News/2009/03/03-AIG-HEARING-dp.
The interested reader should seek out publications by Professor B. Zehnwirth, a pion-eer of the approach described, in actuarial literature. One of the authors (Y. Kahane)has collaborated with him, and much actuarial work has been done with these tools.The approach is now well accepted around the world. The graph was derived usingresources developed by Insureware Pty. (www.insureware.com).
150 RISK MANAGEMENT FOR ENTERPRISES AND INDIVIDUALS
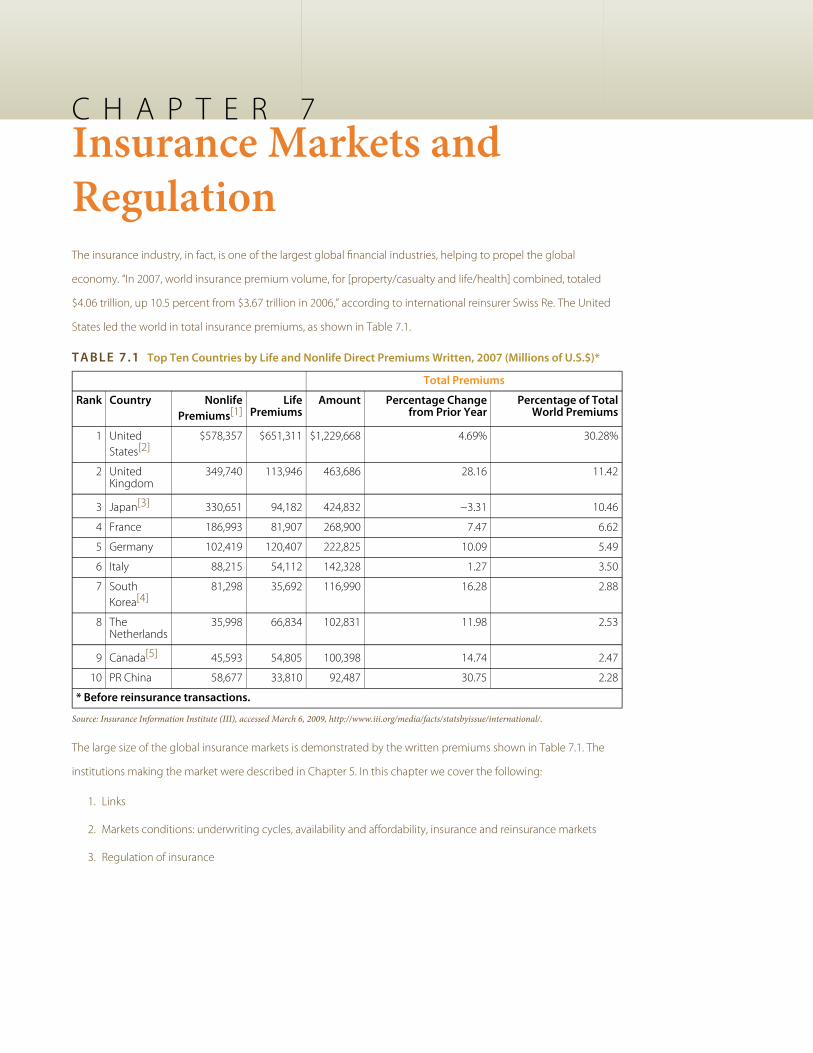
C H A P T E R 7Insurance Markets andRegulationThe insurance industry, in fact, is one of the largest global financial industries, helping to propel the global
economy. “In 2007, world insurance premium volume, for [property/casualty and life/health] combined, totaled
$4.06 trillion, up 10.5 percent from $3.67 trillion in 2006,” according to international reinsurer Swiss Re. The United
States led the world in total insurance premiums, as shown in Table 7.1.
TABLE 7.1 Top Ten Countries by Life and Nonlife Direct Premiums Written, 2007 (Millions of U.S.$)*
Total Premiums
Rank Country NonlifePremiums[1]
LifePremiums
Amount Percentage Changefrom Prior Year
Percentage of TotalWorld Premiums
1 UnitedStates[2]
$578,357 $651,311 $1,229,668 4.69% 30.28%
2 UnitedKingdom
349,740 113,946 463,686 28.16 11.42
3 Japan[3] 330,651 94,182 424,832 −3.31 10.46
4 France 186,993 81,907 268,900 7.47 6.62
5 Germany 102,419 120,407 222,825 10.09 5.49
6 Italy 88,215 54,112 142,328 1.27 3.50
7 SouthKorea[4]
81,298 35,692 116,990 16.28 2.88
8 TheNetherlands
35,998 66,834 102,831 11.98 2.53
9 Canada[5] 45,593 54,805 100,398 14.74 2.47
10 PR China 58,677 33,810 92,487 30.75 2.28
* Before reinsurance transactions.
Source: Insurance Information Institute (III), accessed March 6, 2009, http://www.iii.org/media/facts/statsbyissue/international/.
The large size of the global insurance markets is demonstrated by the written premiums shown in Table 7.1. The
institutions making the market were described in Chapter 5. In this chapter we cover the following:
1. Links
2. Markets conditions: underwriting cycles, availability and affordability, insurance and reinsurance markets
3. Regulation of insurance
underwriting cycles
The movement of insuranceprices through time.
insurance capacity
The quantity of coverage thatis available in terms of limitsof coverage.
1. LINKSAs we have done in the prior chapters, we begin with connecting the importance of this chapter to thecomplete picture of holistic risk management. We will become savvy consumers only when we under-stand the insurance marketplace and the conditions under which insurance institutions operate. Whenwe make the selection of an insurer, we need to understand not only the organizational structure ofthat insurance firm, but we also need to be able to benefit from the regulatory safety net available toprotect us. Also important is our clear understanding of insurance market conditions affecting theproducts and their pricing. Major rate increases for coverage do not happen in a vacuum. As you sawin Chapter 3, past losses are the most important factor in setting rates. Market conditions, availability,and affordability of products are very important factors in the risk management decision, as you saw inChapter 4. In Chapter 2, you learned that an insurable risk must have the characteristic of being afford-able. Because of underwriting cycles—the movement of insurance prices through time (explainednext in this chapter)—insurance rates are considered dynamic. In a hard market, when rates are highand insurance capacity, the quantity of coverage that is available in terms of limits of coverage, islow, we may choose to self-insure. Insurance capacity relates to the level of insurers’ capital (networth). If capital levels are low, insurers cannot provide a lot of coverage. In a soft market, when insur-ance capacity is high, we may select to insure for the same level of severity and frequency of losses. Soour decisions are truly related to external market conditions, as indicated in Chapter 4.
The regulatory oversight of insurers is another important issue in our strategy. If we care to have asafety net of guarantee funds, which act as deposit insurance in case of insolvency of an insurer, we willwork with a regulated insurer. In case of insolvency, a portion of the claims will be paid by the guaran-tee funds. We also need to understand the benefits of selecting a regulated entity as opposed to nonreg-ulated one for other consumer protection actions such as the resolution of complaints. If we are un-happy with our insurer’s claims settlement process and if the insurer is under the state’s regulatory jur-isdiction, the regulator in our state may help us resolve disputes.
152 RISK MANAGEMENT FOR ENTERPRISES AND INDIVIDUALS
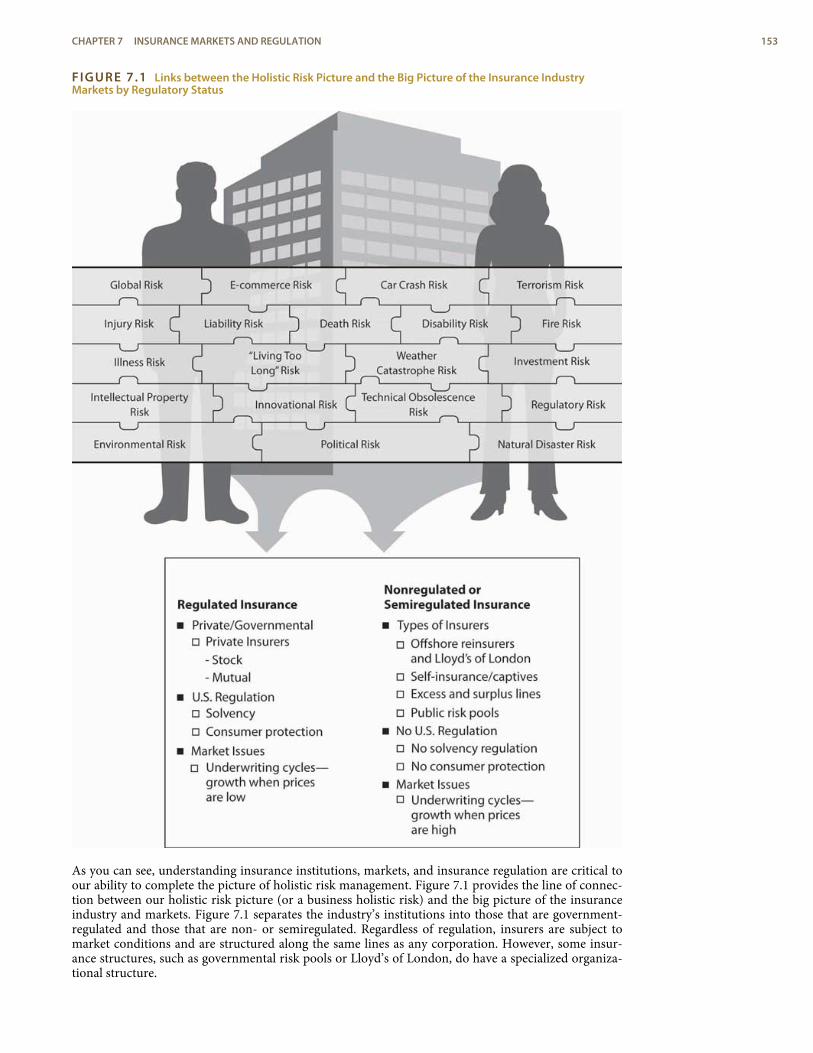
FIGURE 7.1 Links between the Holistic Risk Picture and the Big Picture of the Insurance IndustryMarkets by Regulatory Status
As you can see, understanding insurance institutions, markets, and insurance regulation are critical toour ability to complete the picture of holistic risk management. Figure 7.1 provides the line of connec-tion between our holistic risk picture (or a business holistic risk) and the big picture of the insuranceindustry and markets. Figure 7.1 separates the industry’s institutions into those that are government-regulated and those that are non- or semiregulated. Regardless of regulation, insurers are subject tomarket conditions and are structured along the same lines as any corporation. However, some insur-ance structures, such as governmental risk pools or Lloyd’s of London, do have a specialized organiza-tional structure.
CHAPTER 7 INSURANCE MARKETS AND REGULATION 153
soft market
Condition that occurs wheninsurance losses are low andprices are very competitive.
hard market
Condition that occurs wheninsurance losses are aboveexpectations and reserves nolonger are able to cover alllosses.
combined ratio
The loss ratio (losses dividedby premiums) plus theexpense ratio (expensesdivided by premiums).
2. INSURANCE MARKET CONDITIONS
L E A R N I N G O B J E C T I V E S
In this section we elaborate on the following:
< Hard and soft insurance market conditions< How underwriting standards are influenced by cyclical market conditions< The significance of the combined ratio as an indicator of profitability< Reinsurance organizations and the marketplace
2.1 Property/Casualty Market ConditionsAt any point in time, insurance markets (mostly in the property/casualty lines of insurance) may be inhard market or soft market conditions because of the underwriting cycle. Soft market conditions oc-cur when insurance losses are low and prices are very competitive. Hard market conditions occurwhen insurance losses are above expectations (see loss development in Chapter 6) and reserves are nolonger able to cover all losses. Consequently, insurers or reinsurers have to tap into their capital. Underthese conditions, capacity (measured by capital level relative to premiums) is lowered and prices escal-ate. A presentation of the underwriting cycle of the property/casualty insurance industry from 1956 to2008 is featured in Figure 7.2. The cycle is shown in terms of the industry’s combined ratio, which is ameasure of the relationship between premiums taken in and expenditures for claims and expenses. Inother words, the combined ratio is the loss ratio (losses divided by premiums) plus the expense ratio(expenses divided by premiums). A combined ratio above one hundred means that, for every premiumdollar taken in, more than a dollar was spent on losses and expenses. The ratio does not include incomefrom investments, so a high number does not necessarily mean that a company is unprofitable. Becauseof investment income, an insurer may be profitable even if the combined ratio is over 100 percent.Each line of business has its own break-even point because each line has a different loss payment timehorizon and length of time for the investment of the premiums. The break-even point is determined onthe basis of how much investment income is available in each line of insurance. If a line has a longertail of losses, there is a longer period of time for investment to accumulate.
154 RISK MANAGEMENT FOR ENTERPRISES AND INDIVIDUALS
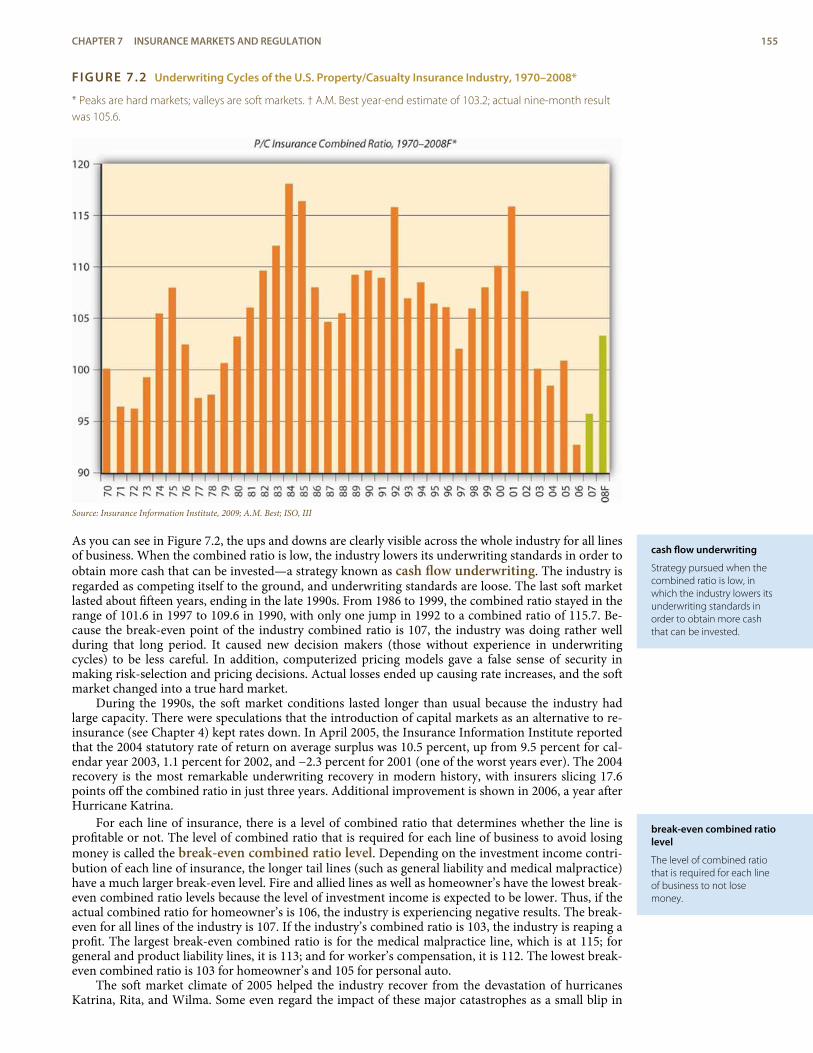
cash flow underwriting
Strategy pursued when thecombined ratio is low, inwhich the industry lowers itsunderwriting standards inorder to obtain more cashthat can be invested.
break-even combined ratiolevel
The level of combined ratiothat is required for each lineof business to not losemoney.
FIGURE 7.2 Underwriting Cycles of the U.S. Property/Casualty Insurance Industry, 1970–2008*
* Peaks are hard markets; valleys are soft markets. † A.M. Best year-end estimate of 103.2; actual nine-month resultwas 105.6.
Source: Insurance Information Institute, 2009; A.M. Best; ISO, III
As you can see in Figure 7.2, the ups and downs are clearly visible across the whole industry for all linesof business. When the combined ratio is low, the industry lowers its underwriting standards in order toobtain more cash that can be invested—a strategy known as cash flow underwriting. The industry isregarded as competing itself to the ground, and underwriting standards are loose. The last soft marketlasted about fifteen years, ending in the late 1990s. From 1986 to 1999, the combined ratio stayed in therange of 101.6 in 1997 to 109.6 in 1990, with only one jump in 1992 to a combined ratio of 115.7. Be-cause the break-even point of the industry combined ratio is 107, the industry was doing rather wellduring that long period. It caused new decision makers (those without experience in underwritingcycles) to be less careful. In addition, computerized pricing models gave a false sense of security inmaking risk-selection and pricing decisions. Actual losses ended up causing rate increases, and the softmarket changed into a true hard market.
During the 1990s, the soft market conditions lasted longer than usual because the industry hadlarge capacity. There were speculations that the introduction of capital markets as an alternative to re-insurance (see Chapter 4) kept rates down. In April 2005, the Insurance Information Institute reportedthat the 2004 statutory rate of return on average surplus was 10.5 percent, up from 9.5 percent for cal-endar year 2003, 1.1 percent for 2002, and −2.3 percent for 2001 (one of the worst years ever). The 2004recovery is the most remarkable underwriting recovery in modern history, with insurers slicing 17.6points off the combined ratio in just three years. Additional improvement is shown in 2006, a year afterHurricane Katrina.
For each line of insurance, there is a level of combined ratio that determines whether the line isprofitable or not. The level of combined ratio that is required for each line of business to avoid losingmoney is called the break-even combined ratio level. Depending on the investment income contri-bution of each line of insurance, the longer tail lines (such as general liability and medical malpractice)have a much larger break-even level. Fire and allied lines as well as homeowner’s have the lowest break-even combined ratio levels because the level of investment income is expected to be lower. Thus, if theactual combined ratio for homeowner’s is 106, the industry is experiencing negative results. The break-even for all lines of the industry is 107. If the industry’s combined ratio is 103, the industry is reaping aprofit. The largest break-even combined ratio is for the medical malpractice line, which is at 115; forgeneral and product liability lines, it is 113; and for worker’s compensation, it is 112. The lowest break-even combined ratio is 103 for homeowner’s and 105 for personal auto.
The soft market climate of 2005 helped the industry recover from the devastation of hurricanesKatrina, Rita, and Wilma. Some even regard the impact of these major catastrophes as a small blip in
CHAPTER 7 INSURANCE MARKETS AND REGULATION 155
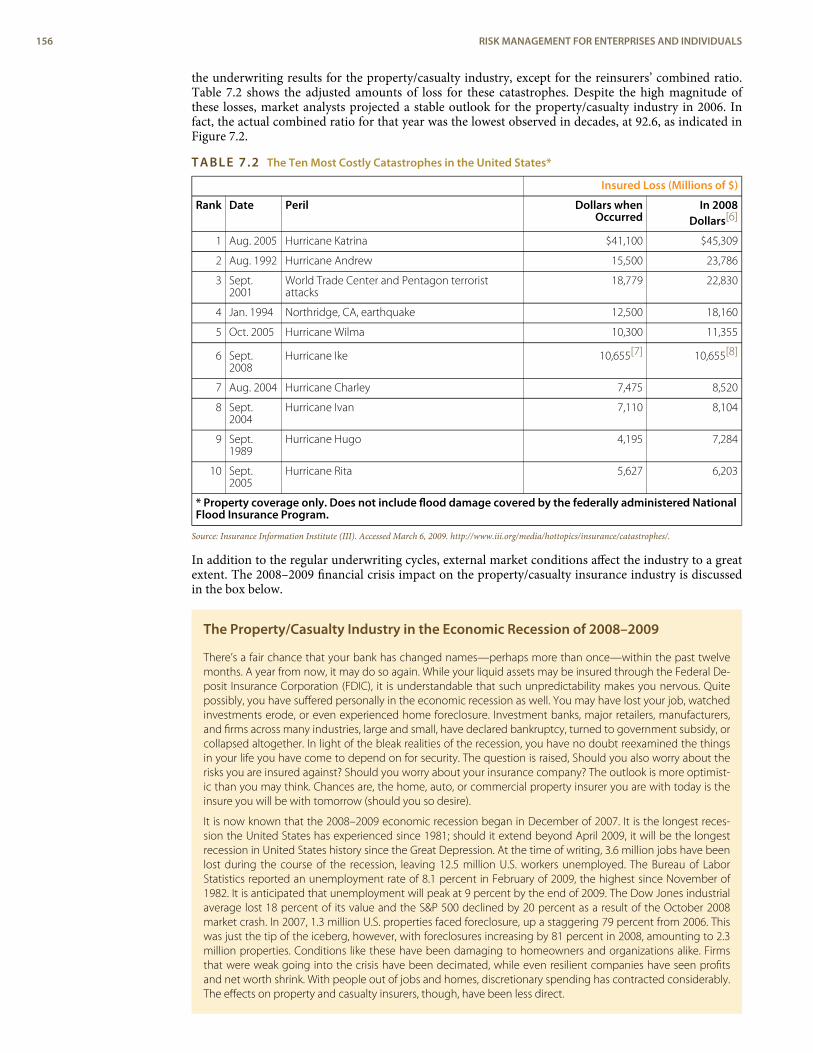
the underwriting results for the property/casualty industry, except for the reinsurers’ combined ratio.Table 7.2 shows the adjusted amounts of loss for these catastrophes. Despite the high magnitude ofthese losses, market analysts projected a stable outlook for the property/casualty industry in 2006. Infact, the actual combined ratio for that year was the lowest observed in decades, at 92.6, as indicated inFigure 7.2.
TABLE 7.2 The Ten Most Costly Catastrophes in the United States*
Insured Loss (Millions of $)
Rank Date Peril Dollars whenOccurred
In 2008Dollars[6]
1 Aug. 2005 Hurricane Katrina $41,100 $45,309
2 Aug. 1992 Hurricane Andrew 15,500 23,786
3 Sept.2001
World Trade Center and Pentagon terroristattacks
18,779 22,830
4 Jan. 1994 Northridge, CA, earthquake 12,500 18,160
5 Oct. 2005 Hurricane Wilma 10,300 11,355
6 Sept.2008
Hurricane Ike 10,655[7] 10,655[8]
7 Aug. 2004 Hurricane Charley 7,475 8,520
8 Sept.2004
Hurricane Ivan 7,110 8,104
9 Sept.1989
Hurricane Hugo 4,195 7,284
10 Sept.2005
Hurricane Rita 5,627 6,203
* Property coverage only. Does not include flood damage covered by the federally administered NationalFlood Insurance Program.
Source: Insurance Information Institute (III). Accessed March 6, 2009. http://www.iii.org/media/hottopics/insurance/catastrophes/.
In addition to the regular underwriting cycles, external market conditions affect the industry to a greatextent. The 2008–2009 financial crisis impact on the property/casualty insurance industry is discussedin the box below.
The Property/Casualty Industry in the Economic Recession of 2008–2009
There’s a fair chance that your bank has changed names—perhaps more than once—within the past twelvemonths. A year from now, it may do so again. While your liquid assets may be insured through the Federal De-posit Insurance Corporation (FDIC), it is understandable that such unpredictability makes you nervous. Quitepossibly, you have suffered personally in the economic recession as well. You may have lost your job, watchedinvestments erode, or even experienced home foreclosure. Investment banks, major retailers, manufacturers,and firms across many industries, large and small, have declared bankruptcy, turned to government subsidy, orcollapsed altogether. In light of the bleak realities of the recession, you have no doubt reexamined the thingsin your life you have come to depend on for security. The question is raised, Should you also worry about therisks you are insured against? Should you worry about your insurance company? The outlook is more optimist-ic than you may think. Chances are, the home, auto, or commercial property insurer you are with today is theinsure you will be with tomorrow (should you so desire).
It is now known that the 2008–2009 economic recession began in December of 2007. It is the longest reces-sion the United States has experienced since 1981; should it extend beyond April 2009, it will be the longestrecession in United States history since the Great Depression. At the time of writing, 3.6 million jobs have beenlost during the course of the recession, leaving 12.5 million U.S. workers unemployed. The Bureau of LaborStatistics reported an unemployment rate of 8.1 percent in February of 2009, the highest since November of1982. It is anticipated that unemployment will peak at 9 percent by the end of 2009. The Dow Jones industrialaverage lost 18 percent of its value and the S&P 500 declined by 20 percent as a result of the October 2008market crash. In 2007, 1.3 million U.S. properties faced foreclosure, up a staggering 79 percent from 2006. Thiswas just the tip of the iceberg, however, with foreclosures increasing by 81 percent in 2008, amounting to 2.3million properties. Conditions like these have been damaging to homeowners and organizations alike. Firmsthat were weak going into the crisis have been decimated, while even resilient companies have seen profitsand net worth shrink. With people out of jobs and homes, discretionary spending has contracted considerably.The effects on property and casualty insurers, though, have been less direct.
156 RISK MANAGEMENT FOR ENTERPRISES AND INDIVIDUALS
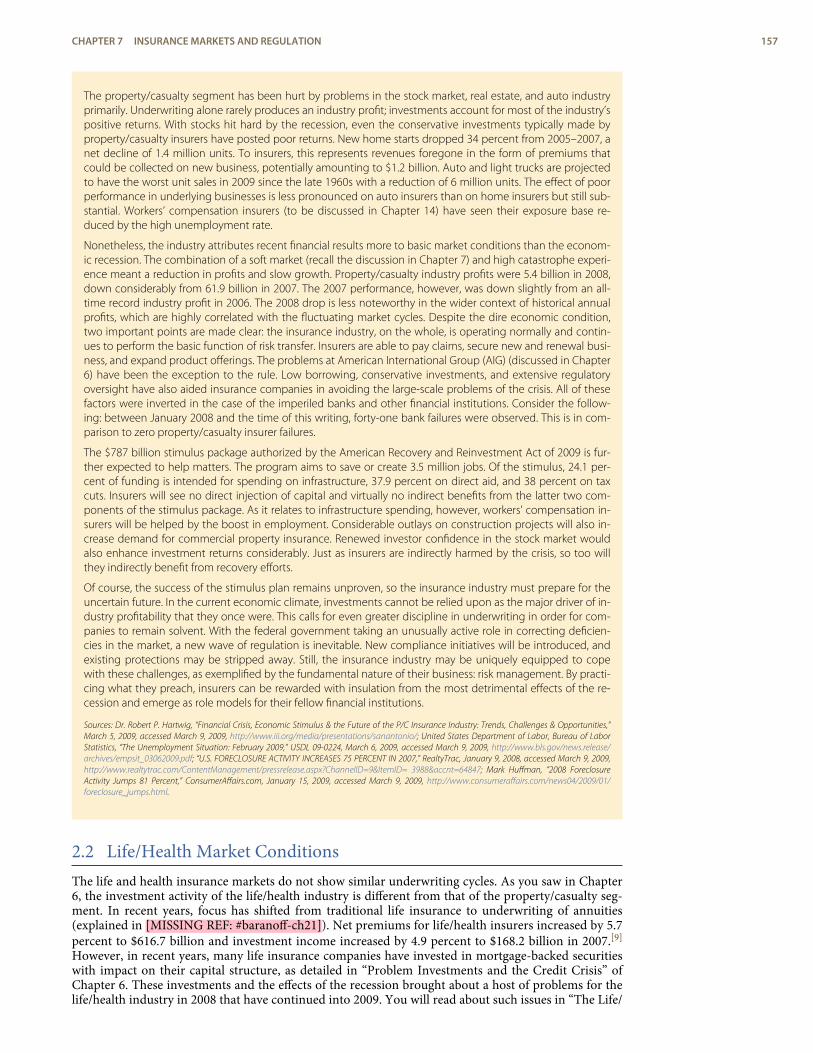
The property/casualty segment has been hurt by problems in the stock market, real estate, and auto industryprimarily. Underwriting alone rarely produces an industry profit; investments account for most of the industry’spositive returns. With stocks hit hard by the recession, even the conservative investments typically made byproperty/casualty insurers have posted poor returns. New home starts dropped 34 percent from 2005–2007, anet decline of 1.4 million units. To insurers, this represents revenues foregone in the form of premiums thatcould be collected on new business, potentially amounting to $1.2 billion. Auto and light trucks are projectedto have the worst unit sales in 2009 since the late 1960s with a reduction of 6 million units. The effect of poorperformance in underlying businesses is less pronounced on auto insurers than on home insurers but still sub-stantial. Workers’ compensation insurers (to be discussed in Chapter 14) have seen their exposure base re-duced by the high unemployment rate.
Nonetheless, the industry attributes recent financial results more to basic market conditions than the econom-ic recession. The combination of a soft market (recall the discussion in Chapter 7) and high catastrophe experi-ence meant a reduction in profits and slow growth. Property/casualty industry profits were 5.4 billion in 2008,down considerably from 61.9 billion in 2007. The 2007 performance, however, was down slightly from an all-time record industry profit in 2006. The 2008 drop is less noteworthy in the wider context of historical annualprofits, which are highly correlated with the fluctuating market cycles. Despite the dire economic condition,two important points are made clear: the insurance industry, on the whole, is operating normally and contin-ues to perform the basic function of risk transfer. Insurers are able to pay claims, secure new and renewal busi-ness, and expand product offerings. The problems at American International Group (AIG) (discussed in Chapter6) have been the exception to the rule. Low borrowing, conservative investments, and extensive regulatoryoversight have also aided insurance companies in avoiding the large-scale problems of the crisis. All of thesefactors were inverted in the case of the imperiled banks and other financial institutions. Consider the follow-ing: between January 2008 and the time of this writing, forty-one bank failures were observed. This is in com-parison to zero property/casualty insurer failures.
The $787 billion stimulus package authorized by the American Recovery and Reinvestment Act of 2009 is fur-ther expected to help matters. The program aims to save or create 3.5 million jobs. Of the stimulus, 24.1 per-cent of funding is intended for spending on infrastructure, 37.9 percent on direct aid, and 38 percent on taxcuts. Insurers will see no direct injection of capital and virtually no indirect benefits from the latter two com-ponents of the stimulus package. As it relates to infrastructure spending, however, workers’ compensation in-surers will be helped by the boost in employment. Considerable outlays on construction projects will also in-crease demand for commercial property insurance. Renewed investor confidence in the stock market wouldalso enhance investment returns considerably. Just as insurers are indirectly harmed by the crisis, so too willthey indirectly benefit from recovery efforts.
Of course, the success of the stimulus plan remains unproven, so the insurance industry must prepare for theuncertain future. In the current economic climate, investments cannot be relied upon as the major driver of in-dustry profitability that they once were. This calls for even greater discipline in underwriting in order for com-panies to remain solvent. With the federal government taking an unusually active role in correcting deficien-cies in the market, a new wave of regulation is inevitable. New compliance initiatives will be introduced, andexisting protections may be stripped away. Still, the insurance industry may be uniquely equipped to copewith these challenges, as exemplified by the fundamental nature of their business: risk management. By practi-cing what they preach, insurers can be rewarded with insulation from the most detrimental effects of the re-cession and emerge as role models for their fellow financial institutions.
Sources: Dr. Robert P. Hartwig, “Financial Crisis, Economic Stimulus & the Future of the P/C Insurance Industry: Trends, Challenges & Opportunities,”March 5, 2009, accessed March 9, 2009, http://www.iii.org/media/presentations/sanantonio/; United States Department of Labor, Bureau of LaborStatistics, “The Unemployment Situation: February 2009,” USDL 09-0224, March 6, 2009, accessed March 9, 2009, http://www.bls.gov/news.release/archives/empsit_03062009.pdf; “U.S. FORECLOSURE ACTIVITY INCREASES 75 PERCENT IN 2007,” RealtyTrac, January 9, 2008, accessed March 9, 2009,http://www.realtytrac.com/ContentManagement/pressrelease.aspx?ChannelID=9&ItemID= 3988&accnt=64847; Mark Huffman, “2008 ForeclosureActivity Jumps 81 Percent,” ConsumerAffairs.com, January 15, 2009, accessed March 9, 2009, http://www.consumeraffairs.com/news04/2009/01/foreclosure_jumps.html.
2.2 Life/Health Market ConditionsThe life and health insurance markets do not show similar underwriting cycles. As you saw in Chapter6, the investment activity of the life/health industry is different from that of the property/casualty seg-ment. In recent years, focus has shifted from traditional life insurance to underwriting of annuities(explained in [MISSING REF: #baranoff-ch21]). Net premiums for life/health insurers increased by 5.7percent to $616.7 billion and investment income increased by 4.9 percent to $168.2 billion in 2007.[9]
However, in recent years, many life insurance companies have invested in mortgage-backed securitieswith impact on their capital structure, as detailed in “Problem Investments and the Credit Crisis” ofChapter 6. These investments and the effects of the recession brought about a host of problems for thelife/health industry in 2008 that have continued into 2009. You will read about such issues in “The Life/
CHAPTER 7 INSURANCE MARKETS AND REGULATION 157
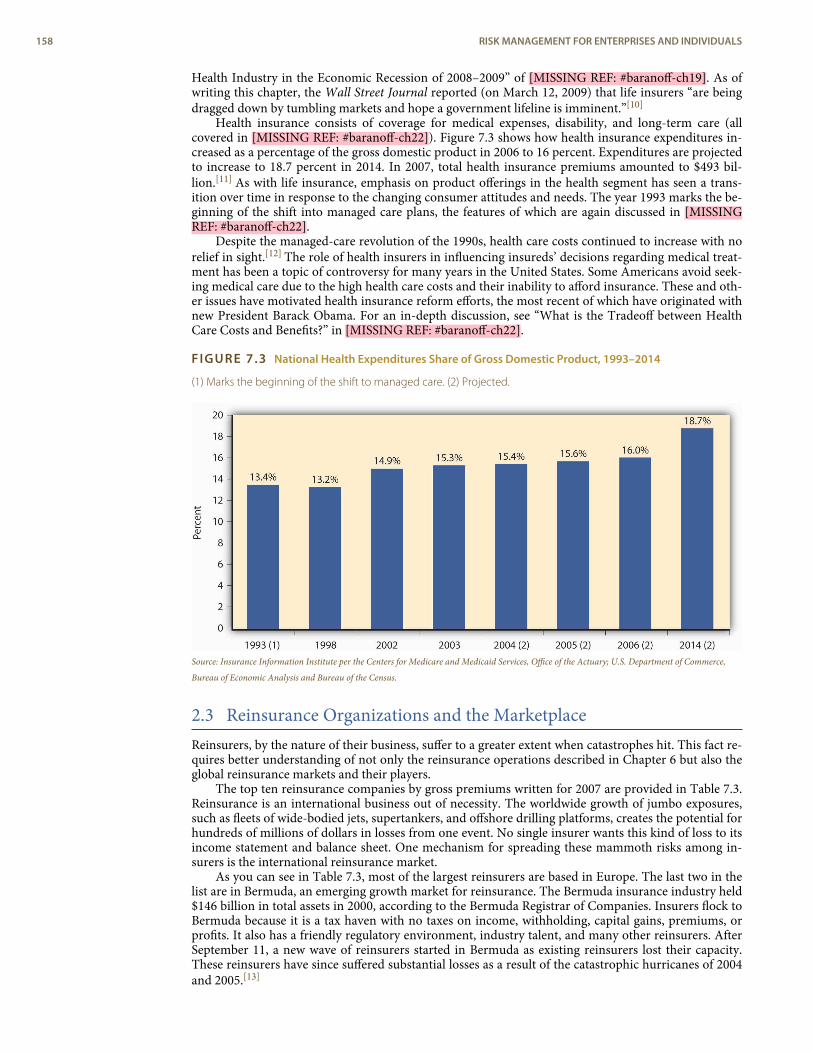
Health Industry in the Economic Recession of 2008–2009” of [MISSING REF: #baranoff-ch19]. As ofwriting this chapter, the Wall Street Journal reported (on March 12, 2009) that life insurers “are beingdragged down by tumbling markets and hope a government lifeline is imminent.”[10]
Health insurance consists of coverage for medical expenses, disability, and long-term care (allcovered in [MISSING REF: #baranoff-ch22]). Figure 7.3 shows how health insurance expenditures in-creased as a percentage of the gross domestic product in 2006 to 16 percent. Expenditures are projectedto increase to 18.7 percent in 2014. In 2007, total health insurance premiums amounted to $493 bil-lion.[11] As with life insurance, emphasis on product offerings in the health segment has seen a trans-ition over time in response to the changing consumer attitudes and needs. The year 1993 marks the be-ginning of the shift into managed care plans, the features of which are again discussed in [MISSINGREF: #baranoff-ch22].
Despite the managed-care revolution of the 1990s, health care costs continued to increase with norelief in sight.[12] The role of health insurers in influencing insureds’ decisions regarding medical treat-ment has been a topic of controversy for many years in the United States. Some Americans avoid seek-ing medical care due to the high health care costs and their inability to afford insurance. These and oth-er issues have motivated health insurance reform efforts, the most recent of which have originated withnew President Barack Obama. For an in-depth discussion, see “What is the Tradeoff between HealthCare Costs and Benefits?” in [MISSING REF: #baranoff-ch22].
FIGURE 7.3 National Health Expenditures Share of Gross Domestic Product, 1993–2014
(1) Marks the beginning of the shift to managed care. (2) Projected.
Source: Insurance Information Institute per the Centers for Medicare and Medicaid Services, Office of the Actuary; U.S. Department of Commerce,
Bureau of Economic Analysis and Bureau of the Census.
2.3 Reinsurance Organizations and the MarketplaceReinsurers, by the nature of their business, suffer to a greater extent when catastrophes hit. This fact re-quires better understanding of not only the reinsurance operations described in Chapter 6 but also theglobal reinsurance markets and their players.
The top ten reinsurance companies by gross premiums written for 2007 are provided in Table 7.3.Reinsurance is an international business out of necessity. The worldwide growth of jumbo exposures,such as fleets of wide-bodied jets, supertankers, and offshore drilling platforms, creates the potential forhundreds of millions of dollars in losses from one event. No single insurer wants this kind of loss to itsincome statement and balance sheet. One mechanism for spreading these mammoth risks among in-surers is the international reinsurance market.
As you can see in Table 7.3, most of the largest reinsurers are based in Europe. The last two in thelist are in Bermuda, an emerging growth market for reinsurance. The Bermuda insurance industry held$146 billion in total assets in 2000, according to the Bermuda Registrar of Companies. Insurers flock toBermuda because it is a tax haven with no taxes on income, withholding, capital gains, premiums, orprofits. It also has a friendly regulatory environment, industry talent, and many other reinsurers. AfterSeptember 11, a new wave of reinsurers started in Bermuda as existing reinsurers lost their capacity.These reinsurers have since suffered substantial losses as a result of the catastrophic hurricanes of 2004and 2005.[13]
158 RISK MANAGEMENT FOR ENTERPRISES AND INDIVIDUALS
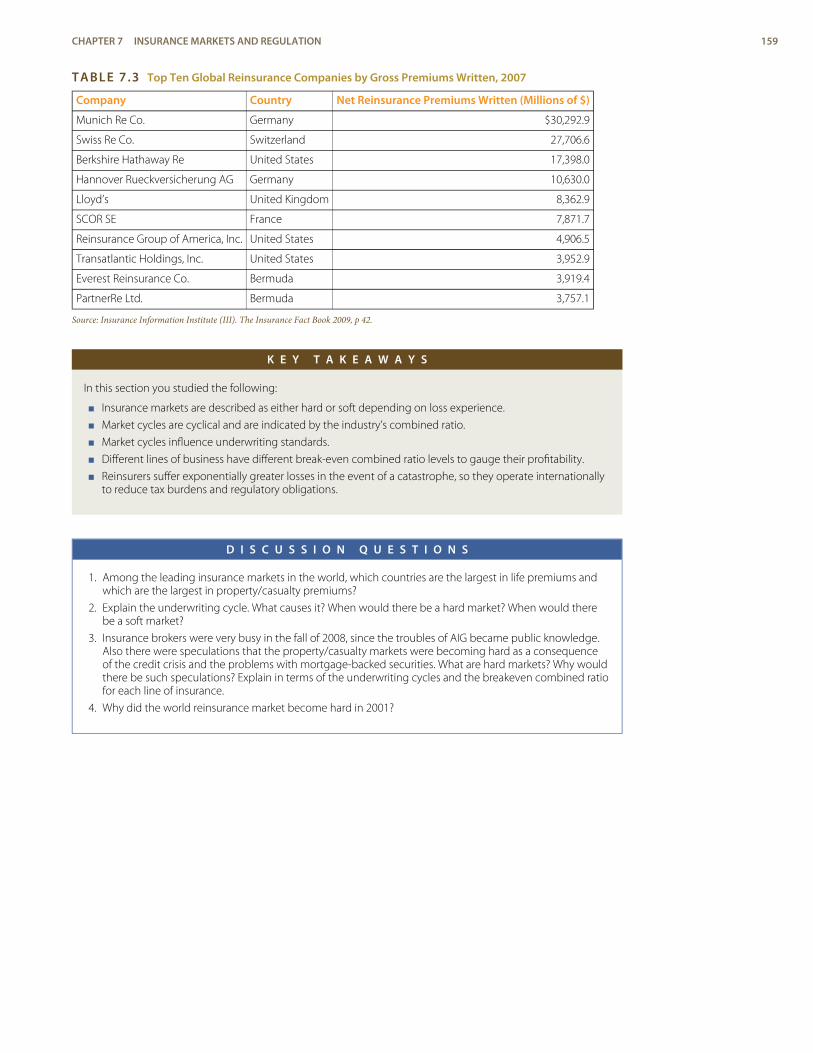
TABLE 7.3 Top Ten Global Reinsurance Companies by Gross Premiums Written, 2007
Company Country Net Reinsurance Premiums Written (Millions of $)
Munich Re Co. Germany $30,292.9
Swiss Re Co. Switzerland 27,706.6
Berkshire Hathaway Re United States 17,398.0
Hannover Rueckversicherung AG Germany 10,630.0
Lloyd’s United Kingdom 8,362.9
SCOR SE France 7,871.7
Reinsurance Group of America, Inc. United States 4,906.5
Transatlantic Holdings, Inc. United States 3,952.9
Everest Reinsurance Co. Bermuda 3,919.4
PartnerRe Ltd. Bermuda 3,757.1
Source: Insurance Information Institute (III). The Insurance Fact Book 2009, p 42.
K E Y T A K E A W A Y S
In this section you studied the following:
< Insurance markets are described as either hard or soft depending on loss experience.
< Market cycles are cyclical and are indicated by the industry’s combined ratio.
< Market cycles influence underwriting standards.
< Different lines of business have different break-even combined ratio levels to gauge their profitability.
< Reinsurers suffer exponentially greater losses in the event of a catastrophe, so they operate internationallyto reduce tax burdens and regulatory obligations.
D I S C U S S I O N Q U E S T I O N S
1. Among the leading insurance markets in the world, which countries are the largest in life premiums andwhich are the largest in property/casualty premiums?
2. Explain the underwriting cycle. What causes it? When would there be a hard market? When would therebe a soft market?
3. Insurance brokers were very busy in the fall of 2008, since the troubles of AIG became public knowledge.Also there were speculations that the property/casualty markets were becoming hard as a consequenceof the credit crisis and the problems with mortgage-backed securities. What are hard markets? Why wouldthere be such speculations? Explain in terms of the underwriting cycles and the breakeven combined ratiofor each line of insurance.
4. Why did the world reinsurance market become hard in 2001?
CHAPTER 7 INSURANCE MARKETS AND REGULATION 159
3. INSURANCE REGULATION
L E A R N I N G O B J E C T I V E S
In this section we elaborate on the following:
< Why insurance is regulated and the objective of regulation< How regulatory authority is structured< The licensing requirements of insurers< Specific solvency regulations< The features of rate regulation, control of agents’ activities, claims adjusting, and underwriting
practices< Arguments in the debate regarding state versus federal regulation
Insurance delivers only future payment in case of a loss. Therefore, it has long been actively regulated.The nature of the product requires strong regulation to ensure the solvency of insurers when claims arefiled. This is the big picture of the regulation of insurance in a nutshell. However, within this importantoverall objective are many areas and issues that are regulated as interim steps to achieve the main ob-jective of the availability of funds to pay claims. Most of the regulation has been at the state level formany years. The possibility of federal involvement has also been raised, especially since the passage ofthe Gramm-Leach-Bliley Financial Services Modernization Act (GLBA) in 1999 and subsequent activ-ities like the optional federal charter of insurers (discussed in the box "The State of State InsuranceRegulation—A Continued Debate"). In August 2004, Representative Michael Oxley, chairperson of theHouse Financial Services Committee, and Representative Richard Baker, chairperson of the Subcom-mittee on Capital Markets, Insurance, and Government Sponsored Enterprises, released a draft of theState Modernization and Regulatory Transparency (SMART) Act. This proposal is also regarded as theinsurance regulatory reform road map draft, and it has added fuel to the debate of state versus federalinsurance regulation. The debate has taken many shapes, including a dual (federal/state) charteringsystem, similar to the banking industry’s dual regulatory system that would allow companies to choosebetween the state system and a national regulatory structure.
Under the current state insurance regulation scheme, state legislatures pass insurance laws thatform the basis for insurance regulation. Common forms of insurance regulatory laws are listed in Table7.4. To ensure the smooth operation of insurance markets and the solvency of insurers, insurance lawsare concerned not only with the operations and investments of insurers but also with licensing require-ments for insurers, agents, brokers, and claims adjusters and with rates and policy forms and consumerprotection. The laws provide standards of financial solvency, including methods of establishing re-serves and the types of investments permitted. Provisions are made in the states’ laws for the liquida-tion or rehabilitation of any insurance company in severe financial difficulty. Because solvency is con-sidered to be affected by product pricing (setting rates), rate regulation is an important part of insur-ance regulation. Trade practices, including marketing and claims adjustment, are also part of the law.Legislation also creates methods to make certain types of insurance readily available at affordable (thatis, subsidized) prices. In addition, the taxation of insurers at the state level is spelled out in the insur-ance code for each state.
TABLE 7.4 Common Types of Insurance Regulatory Laws
< Licensing requirements
< Solvency standards
< Liquidation/rehabilitiation provisions
< Rating (pricing) restrictions
< Trade practice requirements
< Subsidy programs
< Taxation
160 RISK MANAGEMENT FOR ENTERPRISES AND INDIVIDUALS
commissioner (orsuperintendent) ofinsurance
State insurance departmentthat administers insurancelaws.
National Association ofInsurance Commissioners(NAIC)
A group that deals with thecreation of model laws foradoption by the states toencourage uniformity.
domestic insurers
A group that deals with thecreation of model laws foradoption by the states toencourage uniformity.
alien insurers
Insurance companiesorganized in another country.
excess and surplus linesinsurers
Companies that providecoverages that are notavailable from licensedinsurers.
surplus lines agents orbrokers
Persons who hold speciallicenses to provide access tononadmitted insurers.
Every state has an insurance department to administer insurance laws; it is known as the commis-sioner (or superintendent) of insurance. In some states, the commissioner of insurance also acts asanother official of the state government, such as state treasurer, state auditor, or director of banking. Inmost states, however, acting as commissioner of insurance is the person’s sole responsibility. In somestates, the commissioner is appointed; in others, he or she is elected. Most insurance departments haverelatively few staff employees, but several are large, such as those in Texas, California, Illinois, Florida,and New York. The small departments are generally not equipped to provide effective regulation ofsuch a powerful industry.
As indicated above, the most important part of regulation is to ensure solvency of insurers. Assist-ing in this objective are the regulatory efforts in the area of consumer protection in terms of rates andpolicy forms. Of course, regulators protect insureds from fraud, unscrupulous agents, and white-collarcrime. Regulators also make efforts to make coverage available at affordable prices while safeguardingthe solvency of insurers. Regulation is a balancing act and it is not an easy one. Because insurance isregulated by the states, lack of uniformity in the laws and regulation is of great concern. Therefore, theNational Association of Insurance Commissioners (NAIC) deals with the creation of modellaws for adoption by the states to encourage uniformity. Despite the major effort to create uniformity,interest groups in each state are able to modify the NAIC model laws, so those that are finally adoptedmay not be uniform across the states. The resulting maze of regulations is considered a barrier to theentry of new insurers. This is an introductory text, so insurance regulation will be discussed only brieflyhere. For the interested student, the NAIC Web site (http://www.naic.org) is a great place to explorethe current status of insurance regulation. Each state’s insurance department has its own Web site aswell.
The state insurance commissioner is empowered to do the following:< Grant, deny, or suspend licenses of both insurers and insurance agents< Require an annual report from insurers (financial statements)< Examine insurers’ business operations< Act as a liquidator or rehabilitator of insolvent insurers< Investigate complaints< Originate investigations< Decide whether to grant all, part, or none of an insurer’s request for higher rates< Propose new legislation to the legislature< Approve or reject an insurer’s proposed new or amended insurance contract< Promulgate regulations that interpret insurance laws
3.1 Licensing RequirementsAn insurer must have a license from each state in which it conducts business. This requirement is forthe purpose of exercising control. Companies chartered in a state are known as domestic insurers.Foreign insurers are those formed in another state; alien insurers are those organized in anothercountry. The commissioner has more control over domestic companies than over foreign and alienones (he or she has generally less control over insurers not licensed in the state).
An insurer obtains licenses in its state of domicile and each additional state where it plans to con-duct insurance business. Holding a license implies that the insurer meets specified regulatory require-ments designed to protect the consumer. It also implies that the insurer has greater business opportun-ities than nonlicensed insurers. A foreign insurer can conduct business by direct mail in a state withouta license from that state. The insurer is considered nonadmitted and is not subject to regulation. Non-admitted or nonlicensed insurers are also called excess and surplus lines insurers. They providecoverage that is not available from licensed insurers. That is, nonlicensed insurers are permitted to sellinsurance only if no licensed company is willing to provide the coverage. Persons who hold special“licenses” as surplus lines agents or brokers provide access to nonadmitted insurers.
A license may be denied under certain circumstances. If the management is incompetent or uneth-ical, or lacking in managerial skill, the insurance commissioner is prohibited from issuing a license. Be-cause unscrupulous financiers have found insurers fruitful prospects for stock manipulation and themilking of assets, some state laws prohibit the licensing of any company that has been in any way asso-ciated with a person whose business activities the insurance commissioner believes are characterized bybad faith. For example, the Equity Funding case, in which millions of dollars in fictitious life insurancewere created and sold to reinsurers, shows how an insurer can be a vehicle for fraud on a giganticscale.[14] A more recent example is the story of Martin Frankel, who embezzled more than $200 million
CHAPTER 7 INSURANCE MARKETS AND REGULATION 161
generally acceptedaccounting (GAP)
The acceptable system ofaccounting for publiclytraded firms.
statutory accounting (SAP)
System of reporting ofinsurance that allowscompanies to accountdifferently for accrued losses.
unearned premiums
Premiums collected inadvance of the policy period.
in the 1990s from small insurance companies in Arkansas, Mississippi, Missouri, Oklahoma, and Ten-nessee. Three insurance executives in Arkansas were charged in connection with the case.[15]
3.2 Financial RequirementsTo qualify for a license, an insurer must fulfill certain financial requirements. Stock insurers must havea specified amount of capital and surplus (that is, net worth), and mutual insurers must have a minim-um amount of surplus (mutual companies, in which the policyholders are the owners, have no stockand therefore do not show “capital” on their balance sheets). The amounts depend on the line of insur-ance and the state law. Typically, a multiple-line insurer must have more capital (and/or surplus) thana company offering only one line of insurance.[16] Insurers must also maintain certain levels of capitaland surplus to hold their license. Historically, these requirements have been set in simple dollar values.During the 1990s, requirements for risk-based capital were implemented by the states.
3.3 Accounting ComplianceInsurance companies are required to submit uniform financial statements to the regulators. Thesestatements are based on statutory accounting as opposed to the generally accepted accounting(GAP) system, which is the acceptable system of accounting for publicly traded firms. Statutory ac-counting (SAP) is the system of reporting of insurance that allows companies to account differentlyfor accrued losses. The NAIC working groups modify the financial reporting requirements often. In2002, in the wake of a series of corporate financial scandals, including those affecting Enron, ArthurAndersen, and WorldCom, the Sarbanes-Oxley (SOX) Act of 2002 was adopted. It is considered to bethe most significant change to federal securities law in the United States in recent history. It mandatesthat companies implement improved internal controls and adds criminal and civil penalties for securit-ies violations. SOX calls for auditor independence and increased disclosure regarding executive com-pensation, insider trading, and financial statements. This act has been successful at improving corpor-ate governance.[17] Publicly traded stock insurance companies (as explained in Chapter 5) are requiredto comply with SOX. As a fallout of accounting problems at AIG in 2005, there have been proposals toamend the NAIC’s model audit rule to require large mutual insurers and other insurers not currentlyunder the act to comply as well. In addition, the issues uncovered in the investigation of AIG’s finite re-insurance transactions led to consideration of new rules for such nontraditional insurance products.[18]
The rules will require inclusion of some level of risk transfer in such transactions to counter accountinggimmicks that served only to improve the bottom line of a firm. As the student can see, new laws andregulations emerge in the wake of improper actions by businesses. Better transparency benefits allstakeholders in the market, including policyholders.
3.4 Solvency RegulationsRegulating insurers is most important in the area of safeguarding future payment of losses. Solvencyregulation may help but, in spite of the best efforts of insurance executives and regulators, some in-surers fail. When an insurer becomes insolvent, it may be placed either in rehabilitation or liquidation.In either case, policyholders who have claims against the company for losses covered by their policiesor for a refund of unearned premiums—premiums collected in advance of the policy period—mayhave to wait a long time while the wheels of legal processes turn. Even after a long wait, insurer assetsmay cover only a fraction of the amount owed to policyowners. In the aggregate, this problem is notlarge; only about 1 percent of insurers become insolvent each year.
Investment Requirements
The solvency of an insurer depends partly on the amount and quality of its assets, and how the assets’liquidity matches the needs of liquidity to pay losses. Because poor investment policy caused the failureof many companies in the past, investments are carefully regulated. The states’ insurance codes spellout in considerable detail which investments are permitted and which are prohibited. Life insurershave more stringent investment regulations than property/casualty insurers because some of the con-tracts made by life insurers cover a longer period of time, even a lifetime or more.
162 RISK MANAGEMENT FOR ENTERPRISES AND INDIVIDUALS
risk-based capital
Assets, such as equities heldas investments, with valuesthat may vary widely overtime.
state guaranty fundassociations
Security deposit pools madeup of involuntarycontributions fromstate-regulated insurancecompanies to assure thatinsureds do not bear theentire burden of losses whenan insurer becomes insolvent.
Risk-Based Capital
For solvency regulation, the states’ insurance departments and the NAIC are looking into the invest-ment and reserving of insurers. During the 1990s, requirements for risk-based capital were implemen-ted by the states. Remember that capital reflects the excess value a firm holds in assets over liabilities. Itrepresents a financial cushion against hard times. Risk-based capital describes assets, such as equitiesheld as investments, with values that may vary widely over time; that is, they involve more risk than docertain other assets. To account for variations in risks among different assets, commissioners of insur-ance, through their state legislators, have begun requiring firms to hold capital sufficient to produce alevel that is acceptable relative to the risk profile of the asset mix of the insurer.[19] The requirementsare a very important part of solvency regulation. The NAIC and many states also established an earlywarning system to detect potential insolvencies. Detection of potential insolvencies is a fruitful area ofresearch. The interested student is invited to read the Journal of Insurance Regulation and The Journalof Risk and Insurance for articles in this area.[20]
Reserve Requirements
The investment requirements discussed above concern the nature and quality of insurer assets. Thevalue of assets an insurer must hold is influenced by capital and surplus requirements and the regula-tion of reserves. Reserves are insurer liabilities that represent future financial obligations to policyhold-ers. Reserves constitute the bulk of insurance company liabilities. See more about how to calculate re-serves in Chapter 6.
Guaranty Funds Associations
All states have state guaranty fund associations for both property/casualty and life/health insurance.State guaranty fund associations are security deposit pools made up of involuntary contributionsfrom solvent, state-regulated insurance companies doing business in their respective states to ensurethat insureds do not bear the entire burden of losses when an insurer becomes insolvent. The guarantyassociation assesses each company on the basis of the percentage of its premium volume to cover theobligations to policyholders, as discussed later in this chapter.[21] Most guaranty associations limit themaximum they will reimburse any single insured, and most also provide coverage only to residents ofthe state.
3.5 Policy and Rate RegulationThe state insurance commissioners have extensive power in approving policy forms and controlling therates for insurance. Policy form and rate regulation is part of the regulatory activity, and it is a topic foropen debate. Most states consider property/casualty rates not adequately regulated by market forces.Therefore, rates are regulated for auto, property, and liability coverages and workers’ compensation.Minimum rates for individual life insurance and annuity contracts are regulated indirectly throughlimits imposed on assumptions used in establishing reserves. Competitive forces are the only determin-ants of maximum rates for individual life, individual annuity, and group life/health insurance. Rates forindividual health insurance are regulated in some states. Individual disability and accident rates arecontrolled in some states by their refusal to approve policy forms in which at least a target level ofpremiums is not expected to be returned to the policyholder as benefits.
CHAPTER 7 INSURANCE MARKETS AND REGULATION 163
prior approval
Method of regulation inwhich an insurer or its ratingbureau must file its new ratesand have them approved bythe commissioner beforeusing them.
file-and-use
Method of regulation thatallows an insurer to beginusing a new rate as soon as itis filed with thecommissioner.
open competition
Method of regulation thatrequires no rate filings by aninsurer, as the underlyingassumption is that marketcompetition is a sufficientregulator of rates.
twisting
Inducing a policyholder tocancel one contract and buyanother by misrepresentingthe facts or providingincomplete policycomparisons.
rebating
Providing substantial value asan inducement to purchaseinsurance.
One type of property/casualty rate regulation is the prior approval approach. In states that use theprior approval method, an insurer or its rating bureau (such as the Insurance Services Office [ISO]discussed earlier) must file its new rates and have them approved by the commissioner before usingthem. Another approach called file-and-use allows an insurer to begin using a new rate as soon as it isfiled with the commissioner. The commissioner can disapprove the new rate if it is determined to beundesirable within a specified period, generally thirty days. A few states have adopted open competi-tion rating laws. Open competition requires no rate filings by an insurer because the underlying as-sumption is that market competition is a sufficient regulator of rates. Although results are mixed, stud-ies of the effects of different types of rate regulation generally find no significant differences in theprices paid by consumers under different systems for the same service.
3.6 Control of Agent’s ActivitiesInsurance laws also prohibit certain activities on the part of agents and brokers, such as twisting, rebat-ing, unfair practices, and misappropriation of funds belonging to insurers or insureds. Twisting (alsocalled churning) is inducing a policyholder to cancel one contract and buy another by misrepresentingthe facts or providing incomplete policy comparisons. An unfair or misleading comparison of two con-tracts can be a disservice if it causes the insured to drop a policy he or she had for some time in order tobuy another that is no better, or perhaps not as good. On the other hand, sometimes changing policiesis in the best interest of the policyholder, and justified replacements are legal. Twisting regulations,therefore, may include the requirement that the resulting policy change be beneficial to thepolicyholder.
Rebating is providing (substantial) value as an inducement to purchase insurance; for example,the agent or broker shares his or her commission with the insured. Rebating is prohibited because:
< It is considered unfair competition among agents.< Some knowledgeable consumers would buy a new policy each year when first-year commissions
are larger than renewal commissions (higher lapse rates increase long-run cost).< More sophisticated consumers could negotiate larger rebates than the less informed, and this
would be unfair.[22]
< Agents may be encouraged to engage in unethical behavior by selling new policies over renewalpolicies because of the larger first-year commissions.
Some insurers adjust to rebating laws by offering their agents and brokers two or more series of con-tracts with the same provisions but with rates that reflect different levels of commissions. A particularinsurer’s “personal series,” for example, may include a normal level of commissions. Its “executiveseries,” however, may pay the agent or broker a lower commission and offer a lower rate to potentialinsureds. In competitive situations, the agent or broker is likely to propose the “executive series” in or-der to gain a price advantage. The Florida Supreme Court decided in 1986 that the antirebate law wasunconstitutional. This decision had the potential to increase pressure on other states to reconsider thepractice, but very little activity on the subject has occurred since then. California’s Proposition 103(passed in 1988), however, includes a provision to abandon the state’s antirebate laws. In the settlementto resolve their Proposition 103 rollback obligations with the California state insurance department, in-surers paid rebates to their 1989 customers.[23]
At the end of 2004, the NAIC adopted a fee disclosure amendment to the producer licensing mod-el act in order to enhance the transparency of producer-fee arrangements. These changes were in re-sponse to the probe of broker activities by the New York State Attorney General’s Office (mentioned inChapter 6), which resulted in civil action against Marsh & McLennan. The firm was accused of riggingbids and taking incentive payments to steer business to insurers who were part of the conspiracy. Sincethe passage of the amendment, the top three insurance brokers have settled with their state regulatorsand agreed to stop the practice of collecting contingency fees. Most insurance and business newspapersreported extensively about the creation of an $850 million restitution fund for policyholders by Marsh& McLennan as part of the settlement. Many brokers changed their business models as well.[24] For ex-ample, Willis Group Holdings Ltd. abolished profit-based contingency fees and offered complete dis-closure of all compensation earned from underwriters for all activities relating to placing the business.It also introduced a client bill of rights laying out its responsibilities as a client advocate and establishedinternal controls.
164 RISK MANAGEMENT FOR ENTERPRISES AND INDIVIDUALS
unfair practice
A catch-all term that can beapplied to many undesirableactivities of agents, claimadjusters, and insurers.
misappropriation of funds
Situations in which the agentkeeps funds belonging to thecompany, the policyholder,or a beneficiary.
Gramm-Leach-BlileyFinancial ServicesModernization Act (GLBA)
1999 law that allowedfinancial institutions toconsolidate their services.
Unfair Practices
Unfair practice is a catch-all term that can be applied to many undesirable activities of agents, claimsadjusters, and insurers (including misleading advertisements). Unfair practices may lead to fines, re-moval of licenses, and—in extreme cases—to punitive damage awards by the courts. Misappropri-ation of funds refers to situations in which the agent keeps funds (primarily premiums) belonging tothe company, the policyholder, or a beneficiary. For example, suppose an insured was killed by acci-dent; his $1,000 life insurance policy had a double indemnity rider. In order to impress the beneficiarywith the value of this rider, the insurer mailed two checks in the amount of $1,000 each to the agent fordelivery. The agent gave one check to the beneficiary and then induced the beneficiary to endorse thesecond check to the agent, claiming that its issuance was in error, so it had to be cashed and the moneyreturned to the insurer. The insurance department recovered the $1,000, paid it to the beneficiary, andrevoked the agent’s license.
3.7 Control of Claims AdjustingEvery insured has contact with an insurer’s marketing system, most often through an agent. Regulationof agents, therefore, has a significant impact on most insureds. Only those who make claims on theirpolicies, however, have contact with claims adjusters. This is the time when an insured may be vulner-able and in need of regulatory attention.
Insurance commissioners control claims adjusting practices primarily through policyholder com-plaints. Any insured who believes that the insurer improperly handled or denied a claim can contactthe insurance commissioner’s office with details of the transaction. The commissioner’s office will in-vestigate the complaint. Unfortunately for the insured, the commissioner’s office cannot require an in-surer to pay a claim, although a letter from the commissioner’s office that the insured is “in the right”may be persuasive. The most common form of punishment for wrongdoing is either a reprimand orfine against the insurer. Some commissioners’ offices keep track of the number of complaints lodgedagainst insurers operating in the state and publish this information on a standardized basis (e.g., per$100,000 of premium volume).
3.8 Control of Underwriting PracticesWe have discussed the ways in which insurer pricing practices are regulated. Closely tied to rate mak-ing is an insurer’s underwriting function. Over the years, insurers have used a variety of factors in theirunderwriting decisions. A number of these have become taboo from a public policy standpoint. Theiruse may be considered unfair discrimination. The insurance commissioner’s office has some authorityto regulate against inappropriate underwriting practices. See the box "Insurance and Your Pri-vacy—Who Knows?" for a discussion of the conflict between the underwriting needs and privacy. Also,the issue of the use of credit scoring in underwriting was discussed in the box "Keeping Score—Is ItFair to Use Credit Rating in Underwriting?" in Chapter 6. The discussions in the boxes are only ex-amples of the vast array of underwriting issues under regulatory oversight. For more issues, visit theNAIC Web site at http://www.NAIC.org.
3.9 Impact of the Gramm-Leach-Bliley Act on Insurance RegulationThe Gramm-Leach-Bliley Financial Services Modernization Act (GLBA) of 1999 allowed fin-ancial institutions to consolidate their services, bringing sweeping changes for insurance as part of itsprovisions. Since the passage of the GLBA on November 12, 1999, insurance regulators have beenworking to maintain state regulation while complying with the new requirements under the act. One ofthe outcomes is the current debate regarding optional federal insurers’ chartering debate (see the box"The State of State Insurance Regulation—A Continued Debate"). Insurers on both sides—the life andthe property/casualty—have lobbied for different ways to create federally chartered insurance compan-ies.[25] Many insurers today are global players. The regional mind-set of state regulation appears not tofit the needs of international players. Therefore, these insurers are pushing for federal charters.
CHAPTER 7 INSURANCE MARKETS AND REGULATION 165
speed-to-market
Expediting the introductionof new insurance productsinto the marketplace.
regulatory reengineering
A movement that promoteslegislative uniformity.
market conduct reform
A movement that creates aprocess to respond tochanging market conditions,especially relating toe-commerce.
After the enactment of the GLBA, the NAIC issued a statement of intent to ensure the preservationof state regulation within the GLBA prerequisites. In this statement, the commissioners pointed out,“Fueled by enhanced technology and globalization, the world financial markets are undergoing rapidchanges. In order to protect and serve more sophisticated but also more exposed insurance consumersof the future, insurance regulators are committed to modernize insurance regulation to meet the realit-ies of an increasingly dynamic, and internationally competitive financial services marketplace” (seehttp://www.naic.org). Among the NAIC’s commitments to change are the following:
< Amending state laws to include antiaffiliation statutes, licensure laws, demutualization statutes(discussed later in this chapter), and various essential consumer protections, including sales andprivacy provisions.
< Streamlining and standardizing the licensing procedure for producers. One of the provisions ofGramm-Leach-Bliley requires U.S. jurisdictions to adopt uniform or reciprocal agent- andbroker-licensing laws by November 2002 (three years after the enactment of the law). If thisrequirement is not met, a National Association of Registered Agents and Brokers will becreated.[26] By leveraging work already done on the Producer Database and the ProducerInformation Network and by using the Insurance Regulatory Information Network (IRIN), theNAIC has already succeeded in meeting the requirements by having enough state legislaturespass bills permitting reciprocity among the states.
< Building on initiatives already underway concerning national companies, such as review offinancial reporting, financial analysis and examination, and refining the risk-based approach toexamining the insurance operations of financial holding companies.
< Implementing functional regulation and sharing regulatory information to encourage theexecution of information-sharing agreements between the individual states and each of the keyfederal functional regulators.
As a result of GLBA, forty-one states enacted reciprocal producer licensing laws, eight states enacteduniform insurance product approval laws, and twenty-four states have enacted property casualty insur-ance rate deregulation as reported by the National Conference of Insurance Legislators (NCOIL).[27] Inaddition, the NAIC started to work on the speed-to-market concept of expediting the introduction ofnew insurance products into the marketplace (a process that had been too time-consuming). The ideais to develop state-based uniform standards for policy form and rate filings without loss of flexibility.Other areas of improvements are regulatory reengineering, a movement that promotes legislativeuniformity, and market conduct reform, which creates a process to respond to changing marketconditions, especially relating to e-commerce.
The debate regarding federal versus state insurance regulation has been heightened as a result ofthe 2008–2009 economic recession. As noted in the box “The State of Insurance Regulation—AContinued Debate,” the National Insurance Consumer Protection and Regulatory Modernization Actis the most current proposal as of March 2009. It is anticipated that the work on regulatory changes willtake years, but insurance companies are in national and global markets, and they are at a disadvantagecompared with federally regulated industries such as banking and securities. The need to obtain ap-proval for products from fifty states costs the insurance industry too much time. By contrast, securitiesfirms bring new products to the market within ninety days, and banks do so almost immediately.
Insurance and Your Privacy—Who Knows?
Your insurer knows things about you that your best friend probably doesn’t. If you have homeowner’s, health,and auto coverage, your insurance provider knows how much money you make, whether you pay your billson time, how much your assets are worth, what medications you’re taking, and which embarrassing diseasesyou’ve contracted. Your personal identification numbers, such as your Social Security number and driver’s li-cense number, are in those files as well. If you pay your premiums online, your insurance company has a re-cord of your bank account number, too.
Insurance companies can’t function without this personal information. Underwriters must know your historyto determine your level of coverage, risk pooling group, and rate classification. Adjusters, particularly in theworkers’ compensation and auto lines, need your identification numbers to gather information from outsideproviders so they can settle your claims promptly. And to stay competitive, insurers must be able to developnew products and market them to the people who might be interested—special “embarrassing diseases” cov-erage, perhaps?
But is this information safe? Many consumers who trust their insurance agents with personal informationworry about it getting in the hands of the government, an identity thief, or—worst of all—a telemarketer. In-surance companies worry about how to balance protecting their customers’ privacy with maintaining enoughopenness to perform their day-to-day business operations for those same customers.
166 RISK MANAGEMENT FOR ENTERPRISES AND INDIVIDUALS
Two pieces of federal legislation address the issue. The Health Insurance Portability and Accountability Act(HIPAA) of 1996 authorized the Department of Health and Human Services to set minimum standards for pro-tection of health information and gave states the right to impose tougher standards. The Financial ServicesModernization Act of 1999, better known as the Gramm-Leach-Bliley Act (GLBA), gave consumers more con-trol over the distribution of their personal financial information.
Insurance is a state-regulated business, so insurance-specific regulations fall within the authority of state insur-ance commissioners. Thus far, thirty-six states plus the District of Columbia are following a model developedby the National Association of Insurance Commissioners (see the model law and updates on state activity athttp://www.naic.org/1privacy). An important component of the NAIC’s model is the opt-in provision for healthinformation, which regulators consider to be more sensitive than financial information. As opposed to GLBA’sopt-out provision, which gives insurers the right to share your financial information with outsiders unless youspecifically tell them not to, NAIC’s opt-in provision means insurers can’t share your health history unless youspecifically permit them to do so.
But the system is far from airtight. Under GLBA provisions, insurers do not need your permission to share yourdata with its affiliates—and in these days of mega conglomerations, an insurance company can have lots ofaffiliates. Insurers are even permitted to disclose, without your permission, protected (nonidentifying) financialinformation to third parties with whom they have a marketing agreement.
For their part, insurers fear that further restrictions on sharing information would affect their ability to providetimely quotes and claims settlements. Another major concern is a broker’s ability to shop a policy around tofind the best rate and coverage for his or her client. And while consumers might complain about the paper-work involved in opting-out, insurance companies have had to develop and implement privacy policies, trainall staff who handle personal information, and set up new departments to handle the opt-out wishes of tensof millions of customers. It’s estimated that GBLA compliance could cost the insurance industry as much as $2billion.
Any federal or state privacy legislation must protect consumers’ right to control what happens to their person-al data, but it also must preserve insurers’ ability to operate their businesses. Where should the line be drawn?
Questions for Discussion
1. How concerned are you about privacy? Are you more protective about your health or your financialinformation?
2. When companies have to spend money to comply with the law, it’s generally the consumer whoends up paying. Would you accept slightly higher premiums to cover the costs of keeping yourpersonal information private?
3. Why would increased privacy provisions make it difficult for brokers to give their customers the bestservice?
Sources: National Association of Insurance Commissioners, “NAIC Privacy of Consumer Financial and Health Information,” http://www.naic.org/1privacy; American Civil Liberties Union, “Defending Financial Privacy,” http://www.aclu.org /Privacy/PrivacyMain.cfm; American InsuranceAssociation, “Industry Issues: Privacy,” http://www.aiadc.org/IndustryIssues/Privacy.asp; Steven Brostoff, “Stakes Are High in Battle over Health DataPrivacy,” National Underwriter Property & Casualty/Risk & Benefits Management Edition, May 27, 2002; Mark E. Ruquet, “Privacy Is Still a Hot Topic forAgents,” National Underwriter Property & Casualty/Risk & Benefits Management Edition, May 27, 2002; Lori Chordas, “Secret Identity,” Best’s Review,June 2002; Arthur D. Postal “Privacy Rules: A Success?” National Underwriter Property & Casualty/Risk & Benefits Management Edition, March 10, 2005,accessed March 6, 2009, http://www.propertyandcasualtyinsurancenews.com/cms/NUPC/Weekly%20Issues/Issues/2005/10/p10bank_privacy?searchfor=Privacy%20Rules:%20A%20Success.
The State of State Insurance Regulation—A Continued Debate
Did it surprise you to learn that insurance companies—many of them billion-dollar firms that conduct busi-ness across the nation and even around the globe—are regulated by states rather than by the federal govern-ment? The state-based regulatory system was established by Congress more than fifty years ago, when mostinsurers were local or regional—your “good neighbors.” Each state’s regulations grew more or less independ-ently, based on its own mix of population, weather conditions, and industry, until they were finally quite differ-ent from one another. For a long time, though, it didn’t matter: Florida agents rarely sold hurricane insuranceto Nebraska farmers, so what difference did it make if the rules were different?
These days, however, a Florida-based insurance company might sell insurance policies and annuities to Neb-raska farmers, Louisiana shrimpers, and California surfers. But it would have to file the policies for approval fromeach state involved, a complicated course that can take more than a year. Meanwhile, Huge National Bankgoes through a single federal-approval process to sell its investment products, and voilà: permission to marketin all fifty states. The consumer, who doesn’t have the opportunity to compare prices and benefits, is the ulti-mate loser.
CHAPTER 7 INSURANCE MARKETS AND REGULATION 167
For life insurers in particular, many of the products sold are investment vehicles. That puts life insurers in directcompetition with banks and securities firms, which are federally chartered and can bring their products tomarket more quickly—and often at a competitive price, too, because they don’t have to reformat to meetdifferent requirements in different states.
Equitable market entry, faster review processes, and uniform rate regulation are the top goals for the many in-surance groups who are calling for federal chartering as an option for insurance companies, as it has been forthe banking industry for 140 years. In December 2001, Senator Charles E. Schumer introduced a bill, the Na-tional Insurance Chartering and Supervision Act, that uses the banking industry’s dual state-federal regulatorysystem as a model. Under this bill, insurance companies could choose between state and federal regulation.The following February, Representative John J. LaFalce introduced the Insurance Industry Modernization andConsumer Protection Act, which also would create an optional federal charter for the companies but wouldkeep the states in charge of overseeing insurance rates. (As of March 2009, neither bill had been scheduled fora vote.) In 2004, the State Modernization and Regulatory Transparency (SMART) Act was introduced as the na-tional federal insurance standards conceptual framework (known also as the Oxley-Baker Roadmap) and alsoinvoked major debate.
The 2008–2009 economic recession has renewed interest in optional federal chartering and federal involve-ment in insurance regulation among members of Congress. The National Insurance Consumer Protection andRegulatory Modernization Act, proposed by Representatives Mellisa Bean and Ed Royce, calls for a nationalregulatory system and supervision of nationally registered insurers, agencies, and producers; states would re-tain responsibility over state-licensed entities. The bill would also establish separate guaranty funds for the fed-erally regulated insurers and create federal insurance offices in every state. A vocal critic of the proposal is theNational Association of Professional Insurance Agents, who claims that the bill promotes deregulation similarin nature to the type of failed regulation of other financial institutions that brought about the economic reces-sion. Agents for Change, a trade organization representing both life/health and property/casualty agents, ap-plauds the bill as a progressive step that would help insurers to address the present-day needs of consumers.
The bailout of AIG by the federal government in the fall of 2008 escalated the talk about regulatory reform ofthe insurance industry. Further, there are talks about an active role nationally versus globally. Regardless of theform of the change, all observers talk about some reform with the new administration of President Obama andthe makeup of Congress. There are serious talks about an office of insurance information within the Treasuryand a greater federal role in insurance regulation and in solutions to systemic risk issues.
Some groups doubt the wisdom of federal involvement at all and urge a reform of the state system, arguingthat state regulation is more attuned to the needs of the local consumer. Federal regulation, they contend,would merely add another layer of bureaucracy and cost that not only would hurt the consumer, but alsomight drive small, specialty insurers out of business while the larger global insurers opt for more uniformityafforded by federal regulation.
Members of Congress say that the issue will not be easily decided, and any reform will take years to accom-plish. Nevertheless, all agree that some kind of change is needed. “No matter what side one takes in this long-standing debate, it has become clear to me that this is no longer a question of whether we should reform in-surance regulation in the United States,” said Representative Paul Kanjorski, a member of the House Commit-tee on Financial Services. “Instead, it has become a question of how we should reform insurance regulation.”
Sources: Steven Brostoff, “Optional Federal Chartering: Federal Chartering Hearings to Begin in June,” National Underwriter Online News Service, May16, 2002; Mark A. Hofmann, “Supporters of Federal Chartering Speak Out,” Crain’s, June 17, 2002; Steven Brostoff, “Battle Lines Being Drawn OverFederal Chartering Bill,” National Underwriter Property & Casualty/Risk & Benefits Management Edition, February 25, 2002; Steven Brostoff , “CharteringPlans Have Much in Common,” National Underwriter Property & Casualty/Risk & Benefits Management Edition, January 28, 2002; Lori Chordas, “Stateversus Federal: Insurers and Regulators Continue to Debate the Pros and Cons of Insurance Regulation,” Best’s Review, April 2002; Arthur D. Postal,“NAIC Calls SMART Act Totally Flawed,” National Underwriter Online News Service, March 24, 2005, accessed March 6, 2009,http://www.propertyandcasualtyinsurancenews.com/cms/NUPC/Breaking%20News/2005/03/24-NAIC%20Calls%20SMART%20Act%20Totally%20Flawed?searchfor=totally%20flawed; Arthur D. Postal, “Agent Groups Split Over New OFC Bill,” National UnderwriterOnline News Service, February 17, 2008, accessed March 6, 2009, http://www.propertyandcasualtyinsurancenews.com/cms/nupc/Breaking %20News/2009/02/17-AGENTS-dp; Business Insurance Insights, “Howard Mills Speaks about Federal Insurance Regulation,” published February 2009, accessedMarch 6, 2009, http://www.businessinsurance.com/cgi-bin/page.pl?pageId=987; and many more articles in the insurance media from the periodbetween 2004 and 2005 regarding reaction to the proposed SMART Act.
168 RISK MANAGEMENT FOR ENTERPRISES AND INDIVIDUALS
K E Y T A K E A W A Y S
In this section you studied the following:
< Insurance is actively regulated to ensure solvency.
< Insurance is regulated at the state level by insurance commissioners; the National Association of InsuranceCommissioners (NAIC) encourages uniformity of legislation across different states.
< An insurer must have a license from each state in which it conducts business, or conduct business throughdirect mail as a nonadmitted insurer.
< Features of solvency regulations include investment rules, risk-based minimum capital, reserverequirements, and guaranty fund association contributions.
< Rates are controlled for auto, property, liability, and workers’ compensation insurance.
< Regulation of agents’ activities is enforced to protect the consumer.
< Claims adjusting practices are influenced through policyholder complaints to the state insurancecommission.
< Underwriting practices are scrutinized because they are inherently discriminatory.
< There is much debate over the merits of the existing state regulatory system versus that of federalregulation.
D I S C U S S I O N Q U E S T I O N S
1. Describe the main activities of insurance regulators.
2. What methods are used to create uniformity in insurance regulation across the states?
3. What is the function of the states’ guarantee funds?
4. Describe the efforts put forth by the National Association of Insurance Commissioners to preserve stateinsurance regulation after the passage of the Gramm-Leach-Bliley Financial Services Modernization Act(GLBA).
4. REVIEW AND PRACTICE1. What are the reasons for the high combined ratios of the commercial lines of property/casualty
business in 2001?2. Describe the emerging reinsurance markets. Why are they developing in Bermuda?3. What is the difference between each of the following?
a. Admitted and nonadmitted insurersb. Regulated and nonregulated insurersc. Surplus lines writers and regulated insurersd. “File and use” and “prior approval” rate regulatione. “Twisting” and “rebating”
4. The Happy Life Insurance Company is a stock insurer licensed in a large western state. Its lossreserves are estimated at $9.5 million and its unearned premium reserves at $1.7 million. Otherliabilities are valued at $1.3 million. It is a mono-line insurer that has been operating in the statefor over twenty years.
a. What concern might the commissioner have if most of Happy Life Insurance Company’sassets are stocks? How might regulation address this concern?
b. If Happy Life Insurance Company fails to meet minimum capital and surplusrequirements, what options are available to the commissioner of insurance? How wouldHappy Life Insurance Company’s policyholders be affected? How would thepolicyholders of other life insurers in the state be affected?
5. Harry is a risk manager of a global chain of clothing stores. The chain is very successful, withannual revenue of $1 billion in 2001. After the record hurricane seasons of 2004 and 2005, hisrenewal of insurance coverages became a nightmare. Why was renewal so difficult for him?
CHAPTER 7 INSURANCE MARKETS AND REGULATION 169
6. Read the box "Insurance and Your Privacy—Who Knows?" in this chapter and respond to thefollowing questions in addition to the questions that are in the box.
a. What are privacy regulations?b. Why do you think state regulators have been working on adopting such regulation?c. What is your opinion about privacy regulation? What are the pros and cons of such
regulation?7. What are risk-based capital requirements, and what is their purpose?8. How do stock insurers differ from mutuals with respect to their financial requirements?
170 RISK MANAGEMENT FOR ENTERPRISES AND INDIVIDUALS
1.2.
3.4.5.6.7.8.
9.10.
11.12.
13.
14.
15.16.
17.
18.
19.
20.
21.
22.
23.
24.
25.26.27.
ENDNOTES
Includes accident and health insurance.
Nonlife premiums include state funds; life premiums include an estimate of grouppension business.
April 1, 2007–March 31, 2008.
April 1, 2007–March 31, 2008.
Life business expressed in net premiums.
Adjusted to 2008 dollars by the Insurance Information Institute.
Estimated.
“Weiss: Life Profits Jump 42 Percent,” National Underwriter, Life & Health/Financial Ser-vices Edition, March 15, 2005.
Insurance Information Institute (III), Insurance Fact Book 2009, 19.
Scott Patterson and Leslie Scism, “The Next Big Bailout Decision: Insurers,” Wall StreetJournal, March 12, 2009, A1.
Insurance Information Institute (III), Insurance Fact Book 2009, 23.
Ron Panko, “Healthy Selection: Less Than a Decade After the Managed-Care Revolu-tion Began in Earnest, New Styles of Health Plans Are on the Market. Proponents SeeThem As the Next Major Trend in Health Insurance,” Best’s Review, June 2002.
David Hilgen, “Bermuda Bound—Bermuda: Insurance Oasis in the Atlantic,” and“Bermuda Bound—The New Bermudians,” Best’s Review, March 2002.
Raymond Dirks and Leonard Gross, The Great Wall Street Scandal (New York: McGraw-Hill Book Company, 1974).
“Three Executives Charged in Frankel Case,” Best’s Review, February 2002.
The theory behind this requirement is that a company offering all lines of insurancemay have greater variations of experience than a company engaged in only one or afew lines and therefore should have a greater cushion of protection for policyhold-ers. It seems reasonable to believe, however, that the opposite may be the case; badexperience in one line may be offset by good experience in another line.
Andrew Balls, “Greenspan Praises Corporate Governance Law,” Financial Times, May16, 2005, http://www.ft.com/cms/s/0/e7dc1c70-c568-11d9-87fd-00000e2511c8.html?nclick_check=1 (accessed March 6,2009).
Jim Connolly, “AIG Mess Spurring Move to Tighten Insurer Rules,” National Under-writer Online News Service, May 17, 2005,http://www.propertyandcasualtyinsurancenews.com/cms/NUPC/Breaking%20News/2005/05/16-CONNOLLY-jc?searchfor=AIG%20Mess%20Spurring%20Move%20to%20Tighten%20Insurer%20Rules (accessed March 6, 2009).
See the discussion of risk-based capital laws at http://www.naic.org. The requirementand formulas are continuously changing as the NAIC continues to study the chan-ging environment. The basic formula prior to 1996, the Life RBC formula, comprisedfour components related to different categories of risk: asset risk (C-1), insurance risk(C-2), interest rate risk (C-3), and business risk (C-4). Each of the four categories of riskis a dollar figure representing a minimum amount of capital required to cover thecorresponding risk. The final formula is the following:
RBC Authorized Capital = (C − 4) + Square Root of [(C − 1 + C − 3)2 + (C − 2)2].
For some examples, see Etti G. Baranoff, Tom Sager, and Tom Shively,“Semiparametric Modeling as a Managerial Tool for Solvency,” Journal of Risk and In-surance, September 2000; and Etti G. Baranoff, Tom Sager, and Bob Witt, “IndustrySegmentation and Predictor Motifs for Solvency Analysis of the Life/Health InsuranceIndustry,” Journal of Risk and Insurance, March 1999.
New York is the only state that funds the guaranty fund prior to losses from insolventinsurers.
John S. Moyse, “Legalized Rebating—A Marketing View,” Journal of the American Soci-ety of CLU 40, no. 5 (1986): 57.
“Four More California Insurers Settle on Prop. 103 Rebates,” National Underwriter,Property & Casualty/Risk & Benefits Management Edition, March 18, 1996. The articleexplains, “Prop. 103 rebates are determined by applying a formula contained in ad-ministrative regulation RH-291 into which a company’s verifiable financial data is in-serted. The purpose of the regulations is to determine rebate amounts so as not toconflict with the California Supreme Court’s ruling in Calfarm v. Deukmejian that re-bates may not deprive an insurer of a fair rate of return. After the California SupremeCourt upheld the regulations in 1994, insurance companies appealed to the U.S. Su-preme Court, which in February 1995 refused to review the case. CommissionerQuackenbush re-adopted the regulations in March, 1995.”
Steven Brostoff, “Hearing Bares Insurers’ Charter Split,” National Underwriter OnlineNews Service, June 12, 2002.
Irene Weber, “No Sale Despite Gramm-Leach-Bliley,” Best’s Review, May 2002.
“NCOIL to Congress: Smart Act Unwarranted,” Albany, New York, September 11, 2004.
E. E. Mazier, “Chartering Plans: They all Have Much in Common,” National Underwriter,Property & Casualty/Risk & Benefits Management Edition, January 28, 2002.
CHAPTER 7 INSURANCE MARKETS AND REGULATION 171

172 RISK MANAGEMENT FOR ENTERPRISES AND INDIVIDUALS
contract (or policy)
Document received whenone transfer risks to theinsurance company; is theonly physical productreceived at the time of thetransaction.
relational contracts
Contracts whose provisionsare dynamic with respect tothe environment in whichthey are executed.
incomplete contracts
Contracts that contain termsthat are implicit rather thanexplicit.
C H A P T E R 8Fundamental DoctrinesAffecting InsuranceContractsThe insurance contract (or policy) we receive when we transfer risk to the insurance company is the only
physical product we receive at the time of the transaction. As described in the Risk Ball Game in Chapter 1, the
contract makes the exchange tangible. Now that we have some understanding of the nature of risk and insurance,
insurance company operations, markets, and regulation, it is time to move into understanding the contracts and
the legal doctrines that influence insurance policies. Because contracts are subject to disputes, understanding their
nature and complexities will make our risk management activities more efficient. Some contracts explicitly spell out
every detail, while other contracts are considered incomplete and their interpretations are subject to arguments.[1]
For example, in a health contract, the insurer promises to pay for medicines. However, as new drugs come to
market every day, insurers can refuse to pay for an expensive new medication that was not on the market when the
contract was signed. An example is Celebrex, exalted for being easier on the stomach than other anti-inflammatory
drugs and a major favorite of the “young at heart” fifty-plus generation. Many insurers require preauthorization to
verify that the patient has no other choices of other, less expensive drugs.[2] The evolution of medical technology
and court decisions makes the health policy highly relational to the changes and dynamics in the marketplace.
Relational contracts, we can say, are contracts whose provisions are dynamic with respect to the environment
in which they are executed. Some contracts are known as incomplete contracts because they contain terms
that are implicit, rather than explicit. In the previous example, the dynamic nature of the product that is covered by
the health insurance policy makes the policy “incomplete” and open to disputes. Fallen Celebrex rival, Vioxx, is a
noted example. New Jersey–based Merck & Co., Inc., faces more than 7,000 lawsuits claiming that its blockbuster
drug knowingly increased risk of heart attack and stroke. This chapter also delves into the structure of insurance
contracts in general and insurance regulations as they all tie together. We will explore the following:
1. Links
2. Agency law, especially as applied to insurance
3. Basic contractual requirements
4. Important distinguishing characteristics of insurance contracts
1. LINKSAt this point in the text, we are still focused on broad subject matters that connect us to our holisticrisk and risk management puzzle. We are not yet drilling down into specific topics such as homeown-er’s insurance or automobile insurance. We are still in the big picture of understanding the importance
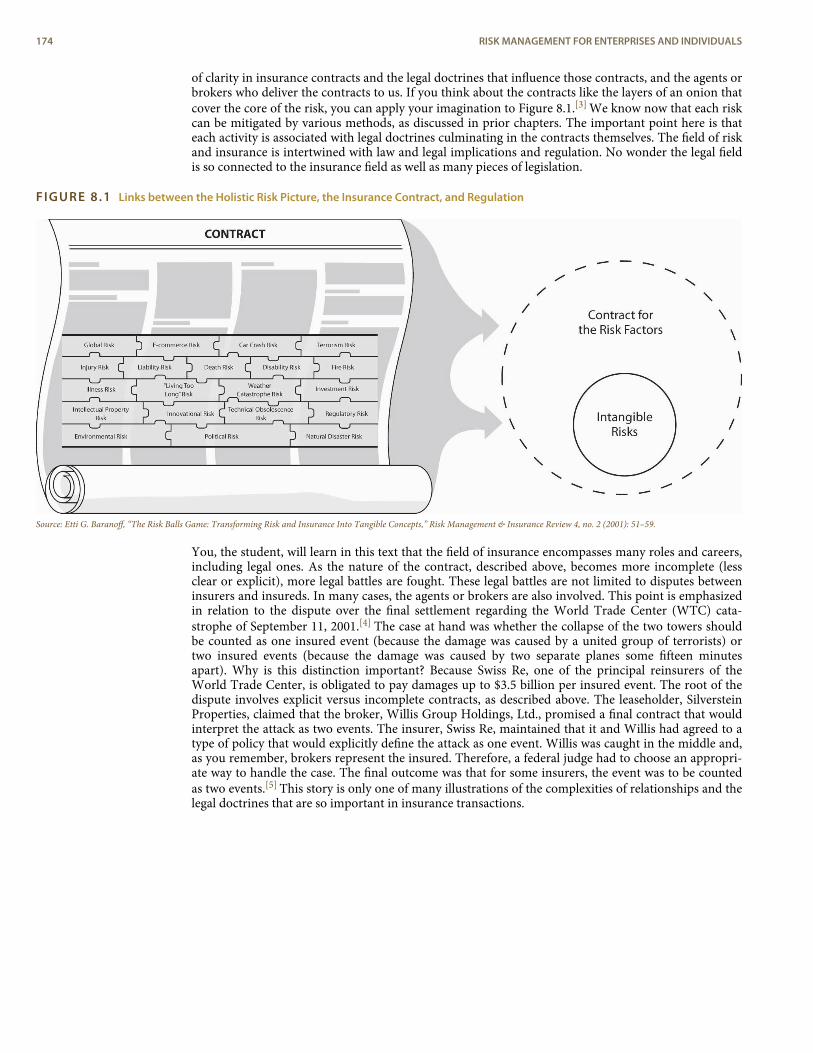
of clarity in insurance contracts and the legal doctrines that influence those contracts, and the agents orbrokers who deliver the contracts to us. If you think about the contracts like the layers of an onion thatcover the core of the risk, you can apply your imagination to Figure 8.1.[3] We know now that each riskcan be mitigated by various methods, as discussed in prior chapters. The important point here is thateach activity is associated with legal doctrines culminating in the contracts themselves. The field of riskand insurance is intertwined with law and legal implications and regulation. No wonder the legal fieldis so connected to the insurance field as well as many pieces of legislation.
FIGURE 8.1 Links between the Holistic Risk Picture, the Insurance Contract, and Regulation
Source: Etti G. Baranoff, “The Risk Balls Game: Transforming Risk and Insurance Into Tangible Concepts,” Risk Management & Insurance Review 4, no. 2 (2001): 51–59.
You, the student, will learn in this text that the field of insurance encompasses many roles and careers,including legal ones. As the nature of the contract, described above, becomes more incomplete (lessclear or explicit), more legal battles are fought. These legal battles are not limited to disputes betweeninsurers and insureds. In many cases, the agents or brokers are also involved. This point is emphasizedin relation to the dispute over the final settlement regarding the World Trade Center (WTC) cata-strophe of September 11, 2001.[4] The case at hand was whether the collapse of the two towers shouldbe counted as one insured event (because the damage was caused by a united group of terrorists) ortwo insured events (because the damage was caused by two separate planes some fifteen minutesapart). Why is this distinction important? Because Swiss Re, one of the principal reinsurers of theWorld Trade Center, is obligated to pay damages up to $3.5 billion per insured event. The root of thedispute involves explicit versus incomplete contracts, as described above. The leaseholder, SilversteinProperties, claimed that the broker, Willis Group Holdings, Ltd., promised a final contract that wouldinterpret the attack as two events. The insurer, Swiss Re, maintained that it and Willis had agreed to atype of policy that would explicitly define the attack as one event. Willis was caught in the middle and,as you remember, brokers represent the insured. Therefore, a federal judge had to choose an appropri-ate way to handle the case. The final outcome was that for some insurers, the event was to be countedas two events.[5] This story is only one of many illustrations of the complexities of relationships and thelegal doctrines that are so important in insurance transactions.
174 RISK MANAGEMENT FOR ENTERPRISES AND INDIVIDUALS
law of agency
Law that deals basically withthe legal consequences ofpeople acting on behalf ofother people ororganizations.
principal
Individual who creates anagency relationship with asecond party by authorizinghim or her to make contractswith third parties(policyholders) on theprincipal’s behalf.
agent
Individual who is authorizedto make contracts with athird party.
apparent authority
The implied authority of theagent to fulfill the principal’sresponsibilities.
producer
Another name for bothagents and brokers.
binding authority
Authority that secures (binds)coverage for an insuredwithout any additional inputfrom the insurer.
binder
The agreement that existsbefore a contract is issued.
conditional binder
Agreement that implies thatcoverage exists only if theunderwriter ultimatelyaccepts (or would haveaccepted) the application forinsurance.
2. AGENCY LAW: APPLICATION TO INSURANCE
L E A R N I N G O B J E C T I V E S
In this section we elaborate on the following:
< The law of agency relative to principals and agents and its role in insurance< The implications of binding authority for agents, their principals, and the insured< How the agency relationship is influenced by the concepts of waiver and estoppel
2.1 AgentsInsurance is sold primarily by agents. The underlying contract, therefore, is affected significantly by thelegal authority of the agent, which in turn is determined by well-established general legal rules regard-ing agency.
The law of agency, as stated in the standard work on the subject, “deals basically with the legalconsequences of people acting on behalf of other people or organizations.”[6] Agency involves threeparties: the principal, the agent, and a third party. The principal (insurer) creates an agency relation-ship with a second party by authorizing him or her to make contracts with third parties (policyholders)on the principal’s behalf. The second party to this relationship is known as the agent, who is author-ized to make contracts with a third party.[7] The source of the agent’s authority is the principal. Suchauthority may be either expressed or implied. When an agent is appointed, the principal expressly in-dicates the extent of the agent’s authority. The agent also has, by implication, whatever authority isneeded to fulfill the purposes of the agency. By entering into the relationship, the principal implies thatthe agent has the authority to fulfill the principal’s responsibilities, implying apparent authority.From the public’s point of view, the agent’s authority is whatever it appears to be. If the principal treatsa second party as if the person were an agent, then an agency is created. Agency law and the doctrinesof waiver and estoppel have serious implications in the insurance business.
Binding Authority
The law of agency is significant to insurance in large part because the only direct interaction most buy-ers of insurance have with the insurance company is through an agent or a broker, also called a produ-cer (see the National Association of Insurance Commissioners’ Web site at http://www.naic.org and li-censing reforms as part of the Gramm-Leach-Bliley Act prerequisites discussed in Chapter 7).[8] Lawsregarding the authority and responsibility of an agent, therefore, affect the contractual relationship.
One of the most important agency characteristics is binding authority. In many situations, anagent is able to exercise binding authority, which secures (binds) coverage for an insured withoutany additional input from the insurer. The agreement that exists before a contract is issued is called abinder. This arrangement, described in the offer and acceptance section presented later, is common inthe property/casualty insurance areas. If you call a GEICO agent in the middle of the night to obtain in-surance for your new automobile, you are covered as of the time of your conversation with the agent.In life and health insurance, an agent’s ability to secure coverage is generally more limited. Rather thanissuing a general binder of coverage, some life insurance agents may be permitted to issue only a condi-tional binder. A conditional binder implies that coverage exists only if the underwriter ultimately ac-cepts (or would have accepted) the application for insurance. Thus, if the applicant dies prior to the fin-al policy issuance, payment is made if the applicant would have been acceptable to the insurer as an in-sured. The general binder, in contrast, provides coverage immediately, even if the applicant is laterfound to be an unacceptable policyholder and coverage is canceled at that point.
Waiver and Estoppel
The agent’s relationship between the insured and the insurer is greatly affected by doctrines of waiverand estoppel.
CHAPTER 8 FUNDAMENTAL DOCTRINES AFFECTING INSURANCE CONTRACTS 175
waiver
The intentionalrelinquishment of a knownright.
private pension
When the investment portionor cash accumulation of apermanent life insurancepolicy is elevated to aposition of a retirementaccount.
vanishing premiumspolicies
Policies that policyholderswere led to believe would bepaid in full after a certainperiod of time, and theywould no longer have tomake premium payments.
compliance officer
Individual charged withoverseeing all sales materialsand ensuring compliancewith regulations and ethics.
respondeat superior
A Latin phrase referring to thedoctrine that the master isresponsible for the actionstaken by his or her servantduring the course of duty.
estoppel
Situation that occurs whenthe insurer or its agent hasled the insured into believingthat coverage exists, and as aconsequence, it means thatthe insurer cannot later claimthat no coverage existed.
Waiver is the intentional relinquishment of a known right. To waive a right, a person must knowhe or she has the right and must give it up intentionally. If an insurer considers a risk to be undesirableat the time the agent assumes it on behalf of the company, and the agent knows it, the principal (the in-surer) will have waived the right to refuse coverage at a later date. This situation arises when an agentinsures a risk that the company has specifically prohibited.
Suppose, for example, that the agent knew an applicant’s seventeen-year-old son was allowed todrive the covered automobile and also knew the company did not accept such risks. If the agent issuesthe policy, the company’s right to refuse coverage on this basis later in the policy period has beenwaived.
In some policies, the insurer attempts to limit an agent’s power to waive its provisions. A businessproperty policy, for example, may provide that the terms of the policy shall not be waived, changed, ormodified except by endorsement issued as part of the policy.
Unfortunately for the insurer, however, such stipulations may not prevent a waiver by its agent.For example, the business property policy provides that coverage on a building ceases after it has beenvacant for over sixty days. Let’s suppose that the insured mentions to the agent that one of the build-ings covered by the policy has been vacant sixty days, but also adds that the situation is only temporary.If the agent says, “Don’t worry, you’re covered,” the right of the insurer to deny coverage in the event ofa loss while the building is vacant is waived. The policy may provide that it cannot be orally waived, butthat generally will not affect the validity of the agent’s waiver. From the insured’s point of view, theagent is the company and the insurer is responsible for the agent’s actions.
This point came to a head in the mid-1990s when many life insurance companies were confrontedby class-action lawsuits that accused their agents of selling life insurance as a private pension[9] —thatis, when the investment portion or cash accumulation of a permanent life insurance policy is elevatedto a position of a retirement account. There were also large numbers of complaints about misrepresent-ation of the interest rate accumulation in certain life insurance policies called universal life, which wasdiscussed at length in Chapter 1.[10] The allegations were that insurers and their agents “furnished falseand misleading illustrations to whole life insurance policyholders, failing to show that policies wouldneed to be active over twenty years to achieve a ‘comparable interest rate’ on their premium dollars andused a ‘software on-line computer program’ and other misleading sales materials to do so.”[11] Thesewere dubbed vanishing premiums policies because the policyholders were led to believe that after acertain period of time, the policy would be paid in full, and they would no longer have to make premi-um payments.[12] Though no vanishing-premium case has been tried on the merits, litigation costs andsettlement proceedings have cost companies hundreds of millions of dollars. Many large insurers suchas Prudential, Met Life,[13] Money, Northwestern Life, Life of Virginia, and more were subject to largefines by many states’ insurance regulators and settled with their policyholders. Prudential’s settlementwith 8 million policyholders will cost the company more than $3.5 billion.[14]
Many of these companies created the new position of compliance officer, who is charged withoverseeing all sales materials and ensuring compliance with regulations and ethics.[15] Meanwhile,states focused on modifying and strengthening market conduct regulations. See the box "Enforcing theCode—Ethics Officers" for a review of insurers’ efforts regarding ethics and for ethical discussion ques-tions. Ultimately, the insurer may hold the agent liable for such actions, but with respect to the insured,the insurer cannot deny its responsibilities. “The vexing problem of vanishing premiums has proven tobe an expensive lesson for insurance companies on the doctrine of respondeat superior—a Latinphrase referring to the doctrine that the master is responsible for the actions taken by his or her servantduring the course of duty.”[16] Neither insurers nor regulators consider an agency relationship as an in-dependent contractor relationship.
Estoppel occurs when the insurer or its agent has led the insured into believing that coverage ex-ists and, as a consequence, the insurer cannot later claim that no coverage existed. For example, whenan insured specifically requests a certain kind of coverage when applying for insurance and is not told itis not available, that coverage likely exists, even if the policy wording states otherwise, because theagent implied such coverage at the time of sale, and the insurer is estopped from denying it.
Agency by Estoppel
An agency relationship may be created by estoppel when the conduct of the principal implies that anagency exists. In such a case, the principal will be estopped from denying the existence of the agency(recall the binding authority of some agents). This situation may arise when the company suspends anagent, but the agent retains possession of blank policies. People who are not agents of a company donot have blank policies in their possession. By leaving them with the former agent, the company is act-ing as if he or she is a current agent. If the former agent issues those policies, the company is estoppedfrom denying the existence of an agency relationship and will be bound by the policy.
If an agent who has been suspended sends business to the company that is accepted, the agency re-lationship will be ratified by such action and the company will be estopped from denying the contract’s
176 RISK MANAGEMENT FOR ENTERPRISES AND INDIVIDUALS
existence. The company has the right to refuse such business when it is presented, but once the busi-ness is accepted, the company waives the right to deny coverage on the basis of denial of acceptance.
Enforcing the Code—Ethics Officers
In the minds of much of the public, insurance agents are up there with used-car dealers and politicians whenit comes to ethical conduct. A May 2002 survey by Golin/Harris International, a public relations firm based inChicago, ranked insurance second only to oil and gas companies as the least trustworthy industry in America.The factors that make an industry untrustworthy, Golin/Harris Marketing Director Ellen Ryan Mardiks told In-sure.com, include perceptions that “these industries are distant or detached from their customers, are plaguedby questionable ethics in their business practices, are difficult or confusing to deal with, or act primarily in self-interest.” Rob Anderson, Director for Change at Golin/Harris, provided the following list of corporate citizen-ship drivers:
1. Ethical, honest, responsible, and accountable business practices/executives
2. Company treats employees well and fairly
3. Company’s products/services positively enhance people’s lives
4. Company’s values/business practices are consistent with an individual’s own beliefs
5. Company listens to and acts on customer and community input before making business decisions
6. Company gets involved with and invests in the community other than in a crisis
7. Company demonstrates a long-term commitment to a cause or issue
8. Company’s support for a cause or issue has led to positive improvement and change
9. Company donates a fair share of its profits, goods, or services to benefit others
10. Company’s employees are active in the community
He notes that the two most critical things a company must do are to be seen as an “ethical and honest” com-pany and as “treating employees well and fairly.”
How people might describe insurance companies is evidenced by the horror stories told on Web sites likescrewedbyinsurance.com and badfaithinsurance.com. Of course, every industry has its detractors (and its de-tractors have Web sites), but insurance can be a particularly difficult sell. Think about it: in life, homeowner’s,property/casualty, and auto, the best-case scenario is the one in which you pay premiums for years and neverget anything back.
Trust is important in a business of intangibles. The insurance industry’s image of trustworthiness took a big hitin the mid-1990s, when some of the biggest companies in the industry, including Prudential, Met Life, andNew York Life, were charged with unethical sales practices. The class-action lawsuits were highly publicized,and consumer mistrust soared. The American Council of Life Insurers responded by creating the InsuranceMarketplace Standards Association (IMSA)—not to placate the public, which remains mostly unaware of theprogram—but to set and enforce ethical standards and procedures for its members. IMSA’s ethics are basedon six principles:
< To conduct business according to high standards of honesty and fairness and to render that serviceto its customers that, in the same circumstances, it would apply to or demand for itself
< To provide competent and customer-focused sales and service
< To engage in active and fair competition
< To provide advertising and sales materials that are clear as to purpose and honest and fair as tocontent
< To provide for fair and expeditious handling of customer complaints and disputes
< To maintain a system of supervision and review that is reasonably designed to achieve compliancewith these principles of ethical market conduct
IMSA members don’t simply pledge allegiance to these words; they are audited by an independent assessor tomake sure they are adhering to IMSA’s principles and code. The members, who also must monitor themselvescontinually, found it more efficient to have one person or one division of the company in charge of overseeingthese standards. Thus was born the ethics officer, sometimes called the compliance officer.
Actually, ethics officers have been around for some time, but their visibility, as well as the scope of their duties,has expanded greatly in recent years. Today, insurance companies have an ethics officer on staff. In large com-panies, this person might hold the title of vice president and oversee a staff that formulates policy for ethicsand codes of conduct and is charged with educating employees. The ethics officer may also be responsible forcreating and implementing privacy policies in accordance with the Gramm-Leach-Bliley Act. Ethics officers’mandate is to make sure that each employee in the company knows and follows the company’s ethicalguidelines.
CHAPTER 8 FUNDAMENTAL DOCTRINES AFFECTING INSURANCE CONTRACTS 177
offer and acceptance
The process of two partiesentering into a contract.
Sources: Vicki Lankarge, “Insurance Companies Are Not to Be Trusted, Say Consumers,” Insure.com, May 30, 2002; http://www.insure.com/gen/trust502.html; Insurance Marketplace Standards Association, http://www.imsaethics.org; Barbara Bowers, “Higher Profile: Compliance Officers HaveExperienced Elevated Status within Their Companies Since the Emergence of the Insurance Marketplace Standards Association,” Best’s Review, October2001; Lori Chordas, “Code of Ethics: More Insurers Are Hiring Ethics Officers to Set and Implement Corporate Mores,” Best’s Review, March 2001.
K E Y T A K E A W A Y S
In this section you studied the following:
< Agents work on behalf of a principal (insurer) in establishing a contract with a third party (the insured)
< Principals fulfill their responsibilities by imparting binding authority to their agents to secure coverage withinsureds
< Agents may provide coverage for risks that the insurer prohibits, waiving the principal’s right of refusal later
D I S C U S S I O N Q U E S T I O N S
1. Describe how agents can bring major liability suits from consumers against their insurers. Do you thinkinsurers should really be liable for the actions of their agents?
2. Explain the concepts of waiver and estoppel, and provide an example of each.
3. Henrietta Hefner lives in northern Minnesota. She uses a wood-burning stove to heat her home. AlthoughMs. Hefner has taken several steps to ensure the safety of her stove, she does not tell her insurance agentabout it because she knows that most wood-burning stoves represent uninsurable hazards. Explain to Ms.Hefner why she should tell her insurance agent about the stove.
3. REQUIREMENTS OF A CONTRACT
L E A R N I N G O B J E C T I V E S
In this section we elaborate on general requirements of contracts:
< Offer, acceptance, and consideration< Competent parties< Legal purpose< Legal form
When an agent sells an insurance policy, he or she is selling a contract. A contract is an agreement en-forceable by law. For any such agreement to be legally enforceable, it must meet the following minim-um requirements:
< There must be an offer and an acceptance< There must be consideration< The parties to the contract must be competent< Its purpose must be legal< The contract must be in legal form
3.1 Offer and AcceptanceOffer and acceptance is the process of two parties entering into a contract; an agreement is reachedonly after offer and acceptance between the contracting parties. If the party to whom the offer wasmade requests a change in terms, a counteroffer is made, which releases the first offerer from the termsof the original offer. In the making of insurance contracts, the buyer usually offers to buy and the in-surer accepts or rejects the offer. When you call an insurance agent for insurance on your new auto-mobile and the agent provides coverage, there is an offer to buy and the agent has accepted the offer onbehalf of his or her company. As stated previously, this acceptance is called a binder. The offer may be
178 RISK MANAGEMENT FOR ENTERPRISES AND INDIVIDUALS
consideration
The price each partydemands for agreeing tocarry out his or her part of thecontract.
competent parties
Individuals of undiminishedmental capacity.
legal purpose
Not be for the performanceof an activity prohibited bylaw.
legal form
Appropriate language.
verbal, as in this case, or it may be in the form of a written application. This process differs for life andhealth insurance.
3.2 ConsiderationA contract also requires the exchange of consideration. Consideration is the price each party de-mands for agreeing to carry out his or her part of the contract. The value of the consideration is usuallyunimportant, but lack of consideration will cause the contract to be regarded as a gift and therefore un-enforceable. In many cases, insurance contracts stipulate that the consideration is both in the form ofpremium and certain conditions specified in the policy. Such conditions may include maintenance of acertain level of risk, timely notice of loss, and periodic reports to insurers of exposure values. Condi-tions will be explained in detail in parts III and IV of the text in the descriptions of insurance contracts.Consideration, therefore, does not necessarily imply dollars.
3.3 Competent PartiesAnother essential element for a contract is that the parties to the contract must be competent parties,or of undiminished mental capacity. Most people are competent to contract, but there are exceptions.Mentally ill or intoxicated persons are not recognized as competent. Minors may enter into contracts,but such contracts may be voided (or terminated). Upon reaching majority (age eighteen in somestates, age twenty-one in others), the young person may ratify or reject the contract. If ratified, the con-tract would then have the same status as one originally entered into by competent parties.
A minor who enters into an insurance contract, therefore, may void it during infancy or when heor she reaches majority. Ratification of a policy at the age of majority can be accomplished (by oral orwritten communication) either explicitly or implicitly (by continuing the policy). Some states have lawsgiving minors the power to enter into binding life insurance contracts on their own lives as young asage fourteen.
3.4 Legal PurposeA contract must have a legal purpose—that is, it must not be for the performance of an activity pro-hibited by law. If it does not, enforcing the contract would be contrary to public policy. A contract by agovernment employee to sell secret information to an agent of an enemy country, for example, wouldnot have a legal purpose and would be unenforceable. For the same reason, a contract of insurance tocover losses caused by the insured’s own arson would be illegal and contrary to public policy, and thusunenforceable.
3.5 Legal FormContracts may be either oral or written; they must, however, follow a specific legal form, or appropri-ate language. Legal form may vary from state to state. As noted, some insurance contracts are—at leastinitially—oral. Most states do not have laws directly prohibiting oral contracts of insurance. They do,however, require that some contract forms (the written version of standardized insurance policy provi-sions and attachments) be approved by the state before being offered for sale.
Moreover, the nature and general content of some policies are specified by law. Most states requirethat certain provisions be included in life and health insurance contracts. Thus, although some con-tracts may be oral, insurance contracts must—for the most part—be in writing, and they must conformto the requirements of the states in which they are sold.
CHAPTER 8 FUNDAMENTAL DOCTRINES AFFECTING INSURANCE CONTRACTS 179
uberrimae fidei
Utmost good faith.
K E Y T A K E A W A Y S
In this section, you studied the following:
< Contracts feature an offer, acceptance, and consideration; an insured must offer to buy and consider thepremiums/policy conditions, and the agent must accept the offer (provide coverage) in order for aninsurance contract to be enacted
< Parties to a contract must be competent; mentally ill and intoxicated persons are not competent tocontract
< A contract must be for a legal purpose only
< Contracts may be oral or written, but they must follow legal form
D I S C U S S I O N Q U E S T I O N S
1. What are the requirements of a contract? Provide an example.
2. A talented high school senior is entered into the National Basketball Association Draft, selected by a team,and ultimately signs a play contract. Why might this contract be disputed as unenforceable?
3. Following construction of a storage shed on his property, a homeowner refuses to pay the builder the fullamount agreed upon orally for performance of this service. Can the builder sue the homeowner andcollect damages for breach of contract? Why or why not?
4. DISTINGUISHING CHARACTERISTICS OF INSURANCECONTRACTS
L E A R N I N G O B J E C T I V E S
In this section we elaborate on the following:
< The concept and importance of utmost good faith in insurance contracts< The feature of adhesion and why it plays a significant role in the event of contract disputes< The importance of indemnity and how it is enforced< The personal nature of insurance contracts
In addition to the elements just discussed, insurance contracts have several characteristics that differen-tiate them from most other contracts. Risk managers must be familiar with these characteristics in or-der to understand the creation, execution, and interpretation of insurance policies. Insurance contractsare the following:
< Based on utmost good faith< Contracts of adhesion< Contracts of indemnity< Personal
4.1 Based on Utmost Good FaithWhen an insurer considers accepting a risk, it must have accurate and complete information to make areasonable decision. Should the insurer assume the risk and, if so, under what terms and conditions?Because insurance involves a contract of uberrimae fidei, or utmost good faith, potential insureds areheld to the highest standards of truthfulness and honesty in providing information for the underwriter.In the case of contracts other than for insurance, it is generally assumed that each party has equalknowledge and access to the facts, and thus each is subject to requirements of “good faith,” not “utmostgood faith.” In contrast, eighteenth-century ocean marine insurance contracts were negotiated undercircumstances that forced underwriters to rely on information provided by the insured because theycould not get it firsthand. For example, a ship being insured might be unavailable for inspection be-cause it was on the other side of the world. Was the ship seaworthy? The underwriter could not inspectit, so he (they were all men in those days) required the insured to warrant that it was. If the warranty
180 RISK MANAGEMENT FOR ENTERPRISES AND INDIVIDUALS
representations
Statements concerning aninsured’s exposures.
material facts
Information that influences aparty’s decision to accept acontract.
concealment
Intentionally withholding amaterial fact.
adhesion
Situation in which insuredshave no input in the designof a policy’s terms.
was not strictly true, the contract was voidable. The penalty for departing from utmost good faith washaving no coverage when a loss occurred. Today, the concept of utmost good faith is implemented bythe doctrines of (1) representations and (2) concealment.[17]
Representations
When people are negotiating with insurers for coverage, they make statements concerning their expos-ures, and these statements are called representations. They are made for the purpose of inducing in-surers to enter into contracts; that is, provide insurance. If people misrepresent materialfacts—information that influences a party’s decision to accept the contract—insurers can void theircontracts and they will have no coverage, even though they do have insurance policies. In essence, thecontracts never existed.
Note that “material” has been specified. If an insurer wants to void a contract it has issued to a per-son in reliance upon the information she provided, it must prove that what she misrepresented wasmaterial. That is, the insurer must prove that the information was so important that if the truth hadbeen known, the underwriter would not have made the contract or would have done so only on differ-ent terms.
If, for example, you stated in an application for life insurance that you were born on March 2 whenin fact you were born on March 12, such a misrepresentation would not be material. A correct state-ment would not alter the underwriter’s decision made on the incorrect information. The policy is notvoidable under these circumstances. On the other hand, suppose you apply for life insurance and statethat you are in good health, even though you’ve just been diagnosed with a severe heart ailment. Thisfact likely would cause the insurer to charge a higher premium or not to sell the coverage at all. The sig-nificance of this fact is that the insurer may contend that the policy never existed (it was void), so lossby any cause (whether related to the misrepresentation or not) is not covered. Several exceptions to thisrule apply, as presented in chapters discussing specific policies. In the case of life insurance, the insurercan void the policy on grounds of material misrepresentation only for two years, as was discussed inChapter 1.
It is not uncommon for students to misrepresent to their auto insurers where their cars aregaraged, particularly if premium rates at home are lower than they are where students attend college.Because location is a factor in determining premium rates, where a car is garaged is a material fact. Stu-dents who misrepresent this or other material facts take the chance of having no coverage at the time ofa loss. The insurer may elect to void the contract.
Concealment
Telling the truth in response to explicit application questions may seem to be enough, but it is not. Onemust also reveal those material facts about the exposure that only he or she knows and that he or sheshould realize are relevant. Suppose, for example, that you have no insurance on your home becauseyou “don’t believe in insurance.” Upon your arrival home one afternoon, you discover that the neigh-bor’s house—only thirty feet from yours—is on fire. You promptly telephone the agency where you buyyour auto insurance and apply for a homeowner’s policy, asking that it be put into effect immediately.You answer all the questions the agent asks but fail to mention the fire next door. You have intention-ally concealed a material fact you obviously realize is relevant. You are guilty of concealment(intentionally withholding a material fact), and the insurer has the right to void the contract.
If the insurance company requires the completion of a long, detailed application, an insured whofails to provide information the insurer neglected to ask about cannot be proven guilty of concealmentunless it is obvious that certain information should have been volunteered. Clearly, no insurance agentis going to ask you when you apply for insurance if the neighbor’s house is on fire. The fact that theagent does not ask does not relieve you of the responsibility.
In both life and health insurance, most state insurance laws limit the period (usually one or twoyears) during which the insurer may void coverage for a concealment or misrepresentation. Othertypes of insurance contracts do not involve such time limits.
4.2 Contracts of AdhesionInsurance policies are contracts of adhesion, meaning insureds have no input in the design of apolicy’s terms. Unlike contracts formulated by a process of bargaining, most insurance contracts areprepared by the insurer and then accepted or rejected by the buyer. The insured does not specify theterms of coverage but rather accepts the terms as stipulated. Thus, he or she adheres to the insurer’scontract. That is the case for personal lines. In most business lines, insurers use policies prepared by theInsurance Services Office (ISO), but in some cases contracts are negotiated. These contracts are written
CHAPTER 8 FUNDAMENTAL DOCTRINES AFFECTING INSURANCE CONTRACTS 181
expectations principle
The event of a dispute, courtswill read insurance policies asthey would expect theinsured to do.
indemnity
The insurer agrees to pay nomore (and no less) than theactual loss suffered by theinsured.
insurable interest
Financial interest in life orproperty that is subject toloss.
by risk managers or brokers who then seek underwriters to accept them, whereas most individuals goto an agent to request coverage as is.
The fact that buyers usually have no influence over the content or form of insurance policies hashad a significant impact on the way courts interpret policies when there is a dispute.[18] When theterms of a policy are ambiguous, the courts favor the insured because it is assumed that the insurer thatwrites the contract should know what it wants to say and how to state it clearly. Further, the policy lan-guage generally is interpreted according to the insured’s own level of expertise and situation, not that ofan underwriter who is knowledgeable about insurance. When the terms are not ambiguous, however,the courts have been reluctant to change the contract in favor of the insured.
A violation of this general rule occurs, however, when the courts believe that reasonable insuredswould expect coverage of a certain type. Under these conditions, regardless of the ambiguity of policylanguage (or lack thereof), the court may rule in favor of the insured. Courts are guided by the expecta-tions principle (or reasonable expectations principle), which may be stated as follows:
The objectively reasonable expectations of applicants and intended beneficiaries regarding theterms of insurance contracts will be honored even though painstaking study of the policyprovisions would have negated those expectations.[19]
In other words, the expectations principle holds that, in the event of a dispute, courts will readinsurance policies as they would expect the insured to do. Thus, the current approach to the interpreta-tion of contracts of adhesion is threefold: first, to favor the insured when terms of the contract draftedby the insurer are ambiguous; second, to read the contract as an insured would; third, to determine thecoverage on the basis of the reasonable expectations of the insured.
4.3 Indemnity ConceptMany insurance contracts are contracts of indemnity. Indemnity means the insurer agrees to pay nomore (and no less) than the actual loss suffered by the insured. For example, suppose your house is in-sured for $200,000 at the time it is totally destroyed by fire. If its value at that time is only $180,000, thatis the amount the insurance company will pay.[20] You cannot collect $200,000 because to do so wouldexceed the actual loss suffered. You would be better off after the loss than you were before. The purposeof the insurance contract is—or should be—to restore the insured to the same economic position as be-fore the loss.
The indemnity principle has practical significance both for the insurer and for society. If insuredscould gain by having an insured loss, some would deliberately cause losses. This would result in a de-crease of resources for society, an economic burden for the insurance industry, and (ultimately) higherinsurance premiums for all insureds. Moreover, if losses were caused intentionally rather than as a res-ult of chance occurrence, the insurer likely would be unable to predict costs satisfactorily. An insurancecontract that makes it possible for the insured to profit by an event insured against violates the prin-ciple of indemnity and may prove poor business to the insurer.
The doctrine of indemnity is implemented and supported by several legal principles and policyprovisions, including the following:
< Insurable interest< Subrogation< Actual cash value provision< Other insurance provisions
Insurable Interest
If a fire or auto collision causes loss to a person or firm, that person or firm has an insurable interest. Aperson not subject to loss does not have an insurable interest. Stated another way, insurable interestis financial interest in life or property that is subject to loss. The law concerning insurable interest isimportant to the buyer of insurance because it determines whether the benefits from an insurancepolicy will be collectible. Thus, all insureds should be familiar with what constitutes an insurable in-terest, when it must exist, and the extent to which it may limit payment under an insurance policy.
182 RISK MANAGEMENT FOR ENTERPRISES AND INDIVIDUALS
life-settlement companies
Firms that buy life insurancepolicies from senior citizensfor a percent of the value ofthe death benefits.
viatical-settlementcompanies
Firms that buy life insurancepolicies from persons withshort life expectancies.
Basis for Insurable Interest
Many situations constitute an insurable interest. The most common is ownership of property. An own-er of a building will suffer financial loss if it is damaged or destroyed by fire or other peril. Thus, theowner has an insurable interest in the building.
A mortgage lender on a building has an insurable interest in the building. For the lender, loss tothe security, such as the building being damaged or destroyed by fire, may reduce the value of the loan.On the other hand, an unsecured creditor generally does not have an insurable interest in the generalassets of the debtor because loss to such assets does not directly affect the value of the creditor’s claimagainst the debtor.
If part or all of a building is leased to a tenant who makes improvements in the leased space, suchimprovements become the property of the building owner on termination of the lease. Nevertheless,the tenant has an insurable interest in the improvements because he or she will suffer a loss if they aredamaged or destroyed during the term of the lease. This commonly occurs when building space is ren-ted on a “bare walls” basis. To make such space usable, the tenant must make improvements.
If a tenant has a long-term lease with terms more favorable than would be available in the currentmarket but that may be canceled in the event that the building is damaged, the tenant has an insurableinterest in the lease. A bailee—someone who is responsible for the safekeeping of property belonging toothers and who must return it in good condition or pay for it—has an insurable interest. When youtake your clothes to the local dry-cleaning establishment, for example, it acts as a bailee, responsible forreturning your clothes in good condition.
A person has an insurable interest in his or her own life and may have such an interest in the life ofanother.[21] An insurable interest in the life of another person may be based on a close relationship byblood or marriage, such as a wife’s insurable interest in her husband. It may also be based on love andaffection, such as that of a parent for a child, or on financial considerations. A creditor, for example,may have an insurable interest in the life of a debtor, and an employer may have an insurable interestin the life of a key employee.
When Insurable Interest Must Exist
The time at which insurable interest must exist depends on the type of insurance. In property insur-ance, the interest must exist at the time of the loss. As the owner of a house, one has an insurable in-terest in it. If the owner insures himself against loss to the house caused by fire or other peril, that per-son can collect on such insurance only if he still has an insurable interest in the house at the time thedamage occurs. Thus, if one transfers unencumbered title to the house to another person before thehouse is damaged, he cannot collect from the insurer, even though the policy may still be in force. Heno longer has an insurable interest. On the other hand, if the owner has a mortgage on the house thatwas sold, he will continue to have an insurable interest in the amount of the outstanding mortgage un-til the loan is paid.
As a result of the historical development of insurance practices, life insurance requires an insurableinterest only at the inception of the contract. When the question of insurable interest in life insurancewas being adjudicated in England, such policies provided no cash surrender values; the insurer madepayment only if the person who was the subject[22] of insurance died while the policy was in force. Aninsured who was also the policyowner and unable to continue making premium payments simply sac-rificed all interest in the policy.
This led to the practice of some policyowners/insureds selling their policies to speculators who, asthe new owners, named themselves the beneficiaries and continued premium payments until the deathof the insured. This practice is not new but appears to have grown, as reported in the Wall Street Journ-al.[23] Life-settlement companies emerged recently for seniors. Life-settlement companies buy lifeinsurance policies from senior citizens for a percentage of the value of the death benefits. These com-panies pay the premiums and become the beneficiary when the insured passes away. This is similar toviatical-settlement companies, which buy life insurance policies from persons with short life ex-pectancies, such as AIDS patients in the 1990s. An example of a life-settlement company is Stone StreetFinancial, Inc., in Bethesda, Maryland, which bought the value of $500,000 of life insurance for $75,775from an older person. The person felt he was making money on the deal because the policy surrendervalue was only $5,000. Viatical settlement companies ran into trouble after new drug regimens exten-ded the lives of AIDS patients, and investors found themselves waiting years or decades, instead ofweeks or months, for a return on their investments. In contrast, life-settlement companies contendthat, because there is no cure for old age, investors cannot lose in buying the policies from people oversixty-five years old with terminal illnesses such as cancer, amyotrophic lateral sclerosis (Lou Gehrig’sdisease), and liver disease.[24] These companies don’t sell to individual investors, but rather package thepolicies they buy into portfolios for institutional investors. According to Scope Advisory GmbH(Berlin), which rates life-settlement companies, “Institutional investments helped increase the face
CHAPTER 8 FUNDAMENTAL DOCTRINES AFFECTING INSURANCE CONTRACTS 183
janitor’s insurance
Inexpensive life insurancecoverage.
corporate-owned lifeinsurance (COLI)
Policies in which employersown life insurance policies onemployees.
valued policies
Contracts to pay a stated sumupon the occurrence of theevent insured against, ratherthan to indemnify for losssustained.
value of life insurance policies traded through the life settlement market to about $10 billion in 2004,from $3 billion in 2003.”[25] There is a regulatory maze regarding these arrangements.[26]
Because the legal concept of requiring an insurable interest only at the inception of the life insur-ance contract has continued, it is possible to collect on a policy in which such interest has ceased. Forexample, if the life of a key person in a firm is insured, and the firm has an insurable interest in that keyperson’s life because his or her death would cause a loss to the firm, the policy may be continued inforce by the firm even after the person leaves the firm. The proceeds may be collected when he or shedies. This point was brought to light with the publication of the Wall Street Journal story “Big BanksQuietly Pile Up ‘Janitors’ Insurance.”[27] The article reports that banks and other large employersbought inexpensive life coverage—or janitor’s insurance—on the lives of their employees. This prac-tice did not require informing the employees or their families. Coverage was continued even after theemployees left the company. Upon the death of the employees, the employer collected the proceeds andpadded their bottom-line profits with tax-free death benefits. Many newspapers reported the story as abreach of ethical behavior. The Charlotte Observer (North Carolina) reported that employers were notrequired to notify workers of corporate-owned life insurance (COLI) policies in which employersown life insurance policies on employees. However, the newspaper continued, “some of the Charlottearea’s biggest companies said they have notified all employees covered by the policies, but declined tosay how they informed the workers. Use of COLI policies has raised outcries from human rights activ-ists and prompted federal legislation calling for disclosure.”[28] The National Association of InsuranceCommissioners (NAIC) formed a special working group to study these issues. Dissatisfaction with thejanitor insurance scandal led the state of Washington to instate a law requiring employers to obtainwritten permission from an employee before buying life insurance on the employee’s life. Key employ-ees can still be exempt from the law. In 2005, members of the U.S. House of Representative also pro-posed legislation to limit such practices.[29]
Extent to which Insurable Interest Limits Payment
In the case of property insurance, not only must an insurable interest exist at the time of the loss, butthe amount the insured is able to collect is limited by the extent of such interest. For example, if youhave a one-half interest in a building that is worth $1,000,000 at the time it is destroyed by fire, youcannot collect more than $500,000 from the insurance company, no matter how much insurance youpurchased. If you could collect more than the amount of your insurable interest, you would make aprofit on the fire. This would violate the principle of indemnity. An exception exists in some stateswhere valued policy laws are in effect. These laws require insurers to pay the full amount of insurancesold if property is totally destroyed. The intent of the law is to discourage insurers from selling toomuch coverage.
In contrast to property insurance, life insurance payments are usually not limited by insurable in-terest. Most life insurance contracts are considered to be valued policies,[30] or contracts that agree topay a stated sum upon the occurrence of the event insured against, rather than to indemnify for losssustained. For example, a life insurance contract provides that the insurer will pay a specified sum tothe beneficiary upon receipt of proof of death of the person whose life is the subject of the insurance.The beneficiary does not have to prove that any loss has been suffered because he or she is not requiredto have an insurable interest.
Some health insurance policies provide that the insurance company will pay a specified number ofdollars per day while the insured is hospitalized. Such policies are not contracts of indemnity; theysimply promise to make cash payments under specified circumstances. This makes such a contract“incomplete,” as discussed in the introduction to this chapter. This also leads to more litigation becausethere are no explicit payout amounts written into the contract while improvements in medical techno-logy change the possible treatments daily.
Although an insurable interest must exist at the inception of a life insurance contract to make itenforceable, the amount of payment is usually not limited by the extent of such insurable interest. Theamount of life insurance collectible at the death of an insured is limited only by the amount insurersare willing to issue and by the insured’s premium-paying ability.[31] The life insurance payout amountis expressed explicitly in the contract. Thus, in most cases, it is not subject to litigation and argumentsover the coverage. The amount of the proceeds of a life insurance policy that may be collected by acreditor-beneficiary, however, is generally limited to the amount of the debt and the premiums paid bythe creditor, plus interest.[32]
184 RISK MANAGEMENT FOR ENTERPRISES AND INDIVIDUALS
subrogation
Situation that gives theinsurer whatever claimagainst third parties theinsured may have as a resultof the loss for which theinsurer paid.
actual cash value
The replacement cost at thetime of the loss, less physicaldepreciation includingobsolescence.
fair market value
The amount a willing buyerwould pay a willing seller.
replacement cost
Indemnification for aproperty loss with nodeduction for depreciation.
Subrogation
The principle of indemnity is also supported by the right of subrogation. Subrogation gives the in-surer whatever claim against third parties the insured may have as a result of the loss for which the in-surer paid. For example, if your house is damaged because a neighbor burned leaves and negligentlypermitted the fire to get out of control, you have a right to collect damages from the neighbor because anegligent wrongdoer is responsible to others for the damage or injury he or she causes. (Negligence li-ability will be discussed in later chapters.) If your house is insured against loss by fire, however, youcannot collect from both the insurance company and the negligent party who caused the damage. Yourinsurance company will pay for the damage and is then subrogated (that is, given) your right to collectdamages. The insurer may then sue the negligent party and collect from him or her. This prevents youfrom making a profit by collecting twice for the same loss.
The right of subrogation is a common law right the insurer has without a contractual agreement. Itis specifically stated in the policy, however, so that the insured will be aware of it and refrain from re-leasing the party responsible for the loss. The standard personal auto policy, for example, provides that
if we make a payment under this policy and the person to or for whom payment was made has aright to recover damages from another, that person shall subrogate that right to us. That personshall do whatever is necessary to enable us to exercise our rights and shall do nothing after loss toprejudice them.
If we make a payment under this policy and the person to or for whom payment is maderecovers damages from another, that person shall hold in trust for us the proceeds of the recoveryand shall reimburse us to the extent of our payment.
Actual Cash Value
This clause is included in many property insurance policies. An insured generally does not receive anamount greater than the actual loss suffered because the policy limits payment to actual cash value. Atypical property insurance policy says, for example, that the company insures “to the extent of actualcash value…but not exceeding the amount which it would cost to repair or replace…and not in anyevent for more than the interest of the insured.”
Actual cash value is not defined in the policy, but a generally accepted notion of it is the replace-ment cost at the time of the loss, less physical depreciation, including obsolescence. For example, if theroof on your house has an expected life of twenty years, roughly half its value is gone at the end of tenyears. If it is damaged by an insured peril at that time, the insurer will pay the cost of replacing thedamaged portion, less depreciation. You must bear the burden of the balance. If the replacement costof the damaged portion is $2,000 at the time of a loss, but the depreciation is $800, the insurer will pay$1,200 and you will bear an $800 expense.
Another definition of actual cash value is fair market value, which is the amount a willing buyerwould pay a willing seller. For auto insurance, where thousands of units of nearly identical property ex-ist, fair market value may be readily available. Retail value, as listed in the National Automobile DealersAssociation (NADA) guide or the Kelley Blue Book, may be used. For other types of property, however,the definition may be deceptively simple. How do you determine what a willing buyer would be willingto pay a willing seller? The usual approach is to compare sales prices of similar property and adjust fordifferences. For example, if three houses similar to yours in your neighborhood have recently sold for$190,000, then that is probably the fair market value of your home. You may, of course, believe yourhouse is worth far more because you think it has been better maintained than the other houses. Such aprocess for determining fair market value may be time-consuming and unsatisfactory, so it is seldomused for determining actual cash value. However, it may be used when obsolescence or neighborhooddeterioration causes fair market value to be much less than replacement cost minus depreciation.
Property insurance is often written on a replacement cost basis, which means that there is no de-duction for depreciation of the property. With such coverage, the insurer would pay $2,000 for the roofloss mentioned above and you would not pay anything. This coverage may or may not conflict with theprinciple of indemnity, depending on whether you are better off after payment than you were beforethe loss. If $2,000 provided your house with an entirely new roof, you have gained. You now have aroof that will last twenty years, rather than ten years. On the other hand, if the damaged portion thatwas repaired accounted for only 10 percent of the roof area, having it repaired would not increase theexpected life of the entire roof. You are not really any better off after the loss and its repair than youwere before the loss.
When an insured may gain, as in the case of having a loss paid for on a replacement cost basis,there is a potential moral hazard. The insured may be motivated to be either dishonest or careless. For
CHAPTER 8 FUNDAMENTAL DOCTRINES AFFECTING INSURANCE CONTRACTS 185
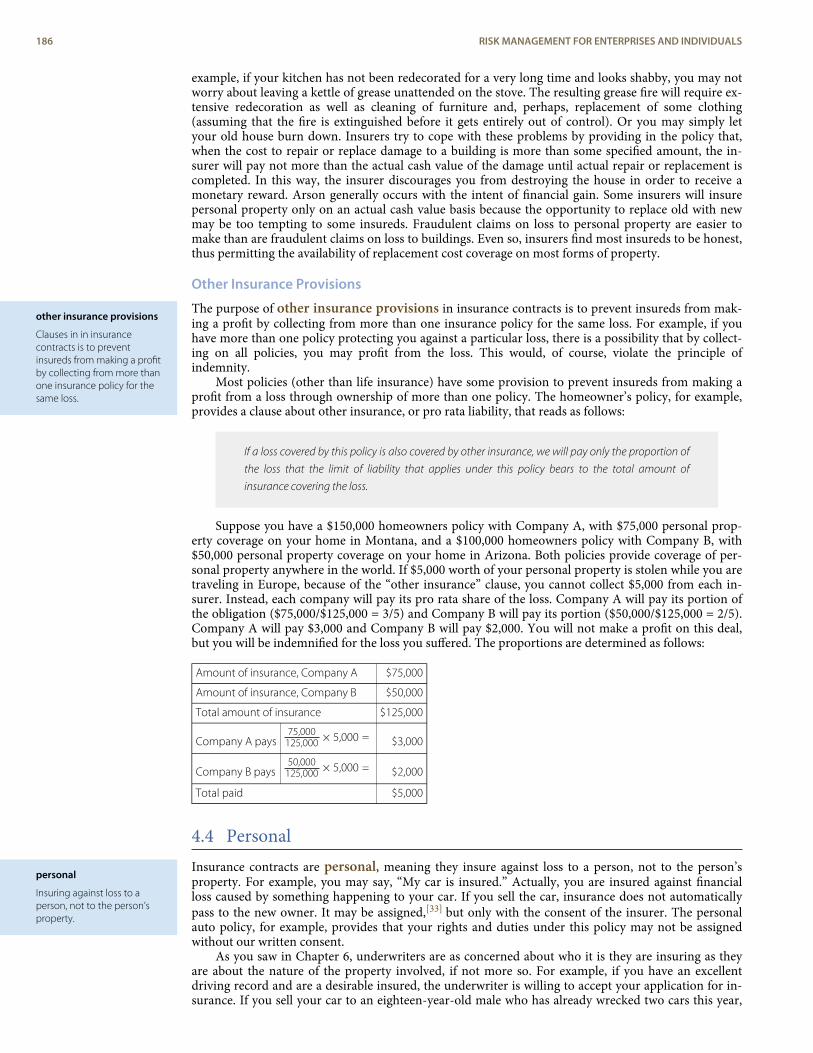
other insurance provisions
Clauses in in insurancecontracts is to preventinsureds from making a profitby collecting from more thanone insurance policy for thesame loss.
personal
Insuring against loss to aperson, not to the person’sproperty.
example, if your kitchen has not been redecorated for a very long time and looks shabby, you may notworry about leaving a kettle of grease unattended on the stove. The resulting grease fire will require ex-tensive redecoration as well as cleaning of furniture and, perhaps, replacement of some clothing(assuming that the fire is extinguished before it gets entirely out of control). Or you may simply letyour old house burn down. Insurers try to cope with these problems by providing in the policy that,when the cost to repair or replace damage to a building is more than some specified amount, the in-surer will pay not more than the actual cash value of the damage until actual repair or replacement iscompleted. In this way, the insurer discourages you from destroying the house in order to receive amonetary reward. Arson generally occurs with the intent of financial gain. Some insurers will insurepersonal property only on an actual cash value basis because the opportunity to replace old with newmay be too tempting to some insureds. Fraudulent claims on loss to personal property are easier tomake than are fraudulent claims on loss to buildings. Even so, insurers find most insureds to be honest,thus permitting the availability of replacement cost coverage on most forms of property.
Other Insurance Provisions
The purpose of other insurance provisions in insurance contracts is to prevent insureds from mak-ing a profit by collecting from more than one insurance policy for the same loss. For example, if youhave more than one policy protecting you against a particular loss, there is a possibility that by collect-ing on all policies, you may profit from the loss. This would, of course, violate the principle ofindemnity.
Most policies (other than life insurance) have some provision to prevent insureds from making aprofit from a loss through ownership of more than one policy. The homeowner’s policy, for example,provides a clause about other insurance, or pro rata liability, that reads as follows:
If a loss covered by this policy is also covered by other insurance, we will pay only the proportion ofthe loss that the limit of liability that applies under this policy bears to the total amount ofinsurance covering the loss.
Suppose you have a $150,000 homeowners policy with Company A, with $75,000 personal prop-erty coverage on your home in Montana, and a $100,000 homeowners policy with Company B, with$50,000 personal property coverage on your home in Arizona. Both policies provide coverage of per-sonal property anywhere in the world. If $5,000 worth of your personal property is stolen while you aretraveling in Europe, because of the “other insurance” clause, you cannot collect $5,000 from each in-surer. Instead, each company will pay its pro rata share of the loss. Company A will pay its portion ofthe obligation ($75,000/$125,000 = 3/5) and Company B will pay its portion ($50,000/$125,000 = 2/5).Company A will pay $3,000 and Company B will pay $2,000. You will not make a profit on this deal,but you will be indemnified for the loss you suffered. The proportions are determined as follows:
Amount of insurance, Company A $75,000
Amount of insurance, Company B $50,000
Total amount of insurance $125,000
Company A pays75,000
125,000 × 5,000 = $3,000
Company B pays50,000
125,000 × 5,000 = $2,000
Total paid $5,000
4.4 PersonalInsurance contracts are personal, meaning they insure against loss to a person, not to the person’sproperty. For example, you may say, “My car is insured.” Actually, you are insured against financialloss caused by something happening to your car. If you sell the car, insurance does not automaticallypass to the new owner. It may be assigned,[33] but only with the consent of the insurer. The personalauto policy, for example, provides that your rights and duties under this policy may not be assignedwithout our written consent.
As you saw in Chapter 6, underwriters are as concerned about who it is they are insuring as theyare about the nature of the property involved, if not more so. For example, if you have an excellentdriving record and are a desirable insured, the underwriter is willing to accept your application for in-surance. If you sell your car to an eighteen-year-old male who has already wrecked two cars this year,
186 RISK MANAGEMENT FOR ENTERPRISES AND INDIVIDUALS
however, the probability of loss increases markedly. Clearly, the insurer does not want to assume thatkind of risk without proper compensation, so it protects itself by requiring written consent forassignment.
Unlike property insurance, life insurance policies are freely assignable. This is a result of the waylife insurance practice developed before policies accumulated cash values. Whether or not change ofownership affects the probability of the insured’s death is a matter for conjecture. In life insurance, thepolicyowner is not necessarily the recipient of the policy proceeds. As with an auto policy, the subjectof the insurance (the life insured) is the same regardless of who owns the policy. Suppose you assignyour life insurance policy (including the right to name a beneficiary) to your spouse while you are ongood terms. Such an assignment may not affect the probability of your death. On the other hand, twoyears and two spouses later, the one to whom you assigned the policy may become impatient about thelong prospective wait for death benefits. Changing life insurance policyowners may not change the riskas much as, say, changing auto owners, but it could (murder is quite different from stealing). Neverthe-less, life insurance policies can be assigned without the insurer’s consent.
Suppose you assign the rights to your life insurance policy to another person and then surrender itfor the cash value before the insurance company knows of the assignment. Will the person to whomyou assigned the policy rights also be able to collect the cash value? To avoid litigation and to eliminatethe possibility of having to make double payment, life insurance policies provide that the company isnot bound by an assignment until it has received written notice. The answer to this question, therefore,generally is no. The notice requirements, however, may be rather low. A prudent insurer may hesitateto pay off life insurance proceeds when even a slight indication of an assignment (or change in benefi-ciary) exists.
K E Y T A K E A W A Y S
In this section you studied the following:
< Insurance contracts are contracts of utmost good faith, so potential insureds are held to the higheststandards of truthfulness and honesty in providing information (making representations) to theunderwriter
< Insurance contracts are contracts of adhesion because the insured must accept the terms as stipulated; indisputes between insureds and insurers, this feature has led courts generally to side with insureds wherepolicy ambiguity is concerned
< Insurance contracts are contracts of indemnity (the insurer will pay no more or no less than the actual lossincurred); indemnity is supported by the concepts of the following:
< Insurable interest
< Subrogation
< Actual cash value provisions
< Other insurance provisions
< Insurance contracts are personal, meaning that people are insured against losses rather than property;insurers often require written consent of assignment when insureds wish to assign coverage with thetransfer of property
CHAPTER 8 FUNDAMENTAL DOCTRINES AFFECTING INSURANCE CONTRACTS 187
D I S C U S S I O N Q U E S T I O N S
1. Assume that you are a key employee and that your employer can buy an insurance policy on your life andcollect the proceeds, even if you are no longer with the firm at the time of your death. Clearly, if you leavethe firm, your employer no longer has an insurable interest in your life and would gain by your death.Would this situation make you uncomfortable? What if you learned that your former employer was infinancial difficulty? Do you think the law should permit a situation of this kind? How is this potentialproblem typically solved? Relate your situation to the janitor’s insurance stories described in this chapter.
2. Does the fact that an insurance policy is a contract of adhesion make it difficult for insurers to write it insimple, easy-to-understand terms? Explain.
3. If your house is destroyed by fire because of your neighbor’s negligence, your insurer may recover fromyour neighbor what it previously paid you under its right of subrogation. This prevents you from collectingtwice for the same loss. But the insurer collects premiums to pay losses and then recovers from negligentpersons who cause them. Isn’t that double recovery? Explain.
4. If you have a $100,000 insurance policy on your house but it is worth only $80,000 at the time it isdestroyed by fire, your insurer will pay you only $80,000. You paid for $100,000 of insurance but you getonly $80,000. Are you being cheated? Explain.
5. Who makes the offer in insurance transactions? Why is the answer to this question important?
5. REVIEW AND PRACTICE1. Walter Brown owns a warehouse in Chicago. The building would cost $400,000 to replace at
today’s prices, and Walter wants to be sure he’s properly insured. He feels that he would be betteroff if he had two $250,000 replacement cost property insurance policies on the warehouse because“then I’ll know if one of the insurers is giving me the runaround. Anyhow, you have to get a fewextra dollars to cover expenses if there’s a fire—and I can’t get that from one company.”
a. If the building is totally destroyed by fire, how much may Walter collect withoutviolating the concept of indemnity?
b. What is Walter’s insurable interest? Does it exceed the value of the building?2. During the application process for life insurance, Bill Boggs indicated that he had never had
pneumonia, when the truth is that he did have the disease as a baby. He fully recovered, however,with no permanent ill effects. Bill was unaware of having had pneumonia as a baby until, a fewweeks after he completed the application, his mother told him about it. Bill was aware, however,that he regularly smoked three or four cigarettes a day when he answered a question on theapplication about smoking. He checked a block indicating that he was not a smoker, realizingthat nonsmokers qualified for lower rates per $1,000 of life insurance. The insurer could havedetected his smoking habit through blood and urine tests. Such tests were not conducted becauseBill’s application was for a relatively small amount of insurance compared to the insurer’s averagesize policy. Instead, the insurer relied on Bill’s answers being truthful.
Twenty months after the issuance of the policy on Bill Bogg’s life, he died in an automobileaccident. The applicable state insurance law makes life insurance policies contestable for twoyears. The insurer has a practice of investigating all claims that occur during the contestableperiod. In the investigation of the death claim on Bill Boggs, the facts about Bill’s case ofpneumonia and his smoking are uncovered.
a. Will Bill’s statements on the application be considered misrepresentations? Discuss whatyou know about misrepresentations as they could apply in this case.
b. Because the cause of Bill’s death was unrelated to his smoking habit, his beneficiary willnot accept the insurer’s offer to return Bill’s premiums plus interest. The beneficiary isinsisting on pursuing this matter in court. What advice do you have for the beneficiary?
3. A smart college senior accepted a job. After the celebration in a bar, he caused an accident. Theemployer wanted to change the contract and not hire him. Do you think the senior has groundsto dispute the decision?
4. An insurance company denied a claim. Three years earlier, the insurer paid for a similar claim.What concept of the law can help the insured? Explain.
188 RISK MANAGEMENT FOR ENTERPRISES AND INDIVIDUALS

5. Michelle Rawson recently moved to Chicago from a rural town. She does not tell her new autoinsurance agent about the two speeding tickets she got in the past year. What problem mightMichelle encounter? Explain.
6. You cannot assign your auto policy to a purchaser without the insurer’s consent, but you canassign your life insurance policy without the insurer’s approval. Is this difference really necessary?Why or why not?
CHAPTER 8 FUNDAMENTAL DOCTRINES AFFECTING INSURANCE CONTRACTS 189
1.
2.3.
4.
5.
6.
7.
8.
9.
10.
11.
12.
13.
14.
15.
16.
17.
18.
19.
20.
21.
22.
23.
24.25.
26.
27.
28.
29.
30.
31.
32.
33.
ENDNOTES
The origin of the analysis of the type of contracts is founded in transaction cost eco-nomics (TCE) theory. TCE was first introduced by R. H. Coase in “The Nature of theFirm,” Economica, November 1937, 386–405, reprinted in Oliver E. Williamson, ed., In-dustrial Organization (Northampton, MA: Edward Elgar Publishing, 1996); Oliver E.Williamson, The Economic Institution of Capitalism (New York: Free Press, 1985); applic-ation to insurance contracts developed by Etti G. Baranoff and Thomas W. Sager,“The Relationship Among Asset Risk, Product Risk, and Capital in the Life InsuranceIndustry,” Journal of Banking and Finance 26, no. 6 (2002): 1181–97.
Testimonials and author’s personal experience.
The idea of using Risk Balls occurred to me while searching for ways to apply transac-tion costs economic theory to insurance products. I began thinking about the riskembedded in insurance products as an intangible item separate from the contractthat completes the exchange of that risk. The abstract notion of risk became the in-tangible core and the contract became the tangible part that wraps itself around thecore or risk.
This issue was discussed at length in all financial magazines and newspapers sinceSeptember 11, 2001.
The December 9, 2004, BestWire article, “Tale of Two Trials: Contract Language Under-lies Contradictory World Trade Center Verdicts,” explains that “the seemingly contra-dictory jury verdicts from two trials as to whether the Sept. 11, 2001, destruction ofthe World Trade Center was one event or two for insurance purposes is not so sur-prising when the central question in both trials is considered: Did the language inthe insurance agreements adequately define what an occurrence is?”http://www3.ambest.com/Frames/FrameServer.asp?AltSrc=23&Tab=1&Site=news&refnum=70605 (accessed March 7, 2009).
J. Dennis Hynes, Agency and Partnership: Cases, Materials and Problems, 2nd ed.(Charlottesville, VA: The Michie Company, 1983), 4.
It is important to note the difference between an agent who represents the insurerand a broker who represents the insured. However, because of state insurance laws,in many states brokers are not allowed to operate unless they also obtain an agencyappointment with an insurer. For details, see Etti G. Baranoff, Dalit Baranoff, and TomSager, “Nonuniform Regulatory Treatment of Broker Distribution Systems: An ImpactAnalysis for Life Insurers,” Journal of Insurance Regulations19, no. 1 (2000): 94.
Steven Brostoff, “Agent Groups Clash On License Reform,” National Underwriter On-line News Service, June 20, 2002.
Donald F. Cady, “‘Private Pension’ Term Should Be Retired,” National Underwriter, Life& Health/Financial Services Edition, March 1, 1999.
Allison Bell, “Met Settles Sales Practices Class Lawsuits,” National Underwriter, Life &Health/Financial Services Edition, August 23, 1999.
Diane West, “Churning Suit Filed Against NW Mutual,” National Underwriter, Life &Health/Financial Services Edition, October 14, 1996.
James Carroll, “Holding Down the Fort: Recent Court Rulings Have Shown Life In-surers That They Can Win So-called ‘Vanishing-Premium’ Cases,” Best’s Review,September 2001.
Amy S. Friedman, “Met Life Under Investigation in Connecticut,” National Underwriter,Life & Health/Financial Services Edition, January 26, 1998.
Lance A. Harke and Jeffrey A. Sudduth, “Declaration of Independents: Proper Struc-turing of Contracts with Independent Agents Can Reduce Insurers’ Potential Liabil-ity,” Best’s Review, February 2001.
Barbara Bowers, “Higher Profile: Compliance Officers Have Experienced ElevatedStatus Within Their Companies Since the Emergence of the Insurance MarketplaceStandards Association,” Best’s Review, October 2001, http://www3.ambest.com/Frames/FrameServer.asp?AltSrc=23&Tab=1&Site=bestreview&refnum=13888(accessed March 7, 2009); and “Insurance Exec Points to Need For Strong EthicalStandards,” National Underwriter Online News Service, May 19, 2005.
Lance A. Harke and Jeffrey A. Sudduth, “Declaration of Independents: Proper Struc-turing of Contracts with Independent Agents Can Reduce Insurers’ Potential Liabil-ity,” Best’s Review, February 2001.
Warranties are no longer as prevalent. However, they are stringent requirements thatinsureds must follow for coverage to exist. They were considered necessary in theearly days of marine insurance because insurers were forced to rely on the truthful-ness of policyholders in assessing risk (often, the vessel was already at sea when cov-erage was procured, and thus inspection was not possible). Under modern condi-tions, however, insurers generally do not find themselves at such a disadvantage. As
a result, courts rarely enforce insurance warranties, treating them instead as repres-entations. Our discussion here, therefore, will omit presentation of warranties. SeeKenneth S. Abraham, Insurance Law and Regulation: Cases and Materials (Westbury,NY: Foundation Press, 1990) for a discussion.
Some policies are designed through the mutual effort of insurer and insured. These“manuscript policies” might not place the same burden on the insurer regardingambiguities.
See Robert E. Keeton, Basic Text on Insurance Law (St. Paul, MI: West Publishing Com-pany, 1971), 351. While this reference is now almost forty years old, it remains per-haps the most popular insurance text available.
In some states, a valued policy law requires payment of the face amount of propertyinsurance in the event of total loss, regardless of the value of the dwelling. Otherpolicy provisions, such as deductibles and coinsurance, may also affect the insurer’seffort to indemnify you.
Although a person who dies suffers a loss, he or she cannot be indemnified. Becausethe purpose of the principle of insurable interest is to implement the doctrine of in-demnity, it has no application in the case of a person insuring his or her own life.Such a contract cannot be one of indemnity.
The person whose death requires the insurer to pay the proceeds of a life insurancepolicy is usually listed in the policy as the insured. He or she is also known as the ces-tuique vie or the subject. The beneficiary is the person (or other entity) entitled tothe proceeds of the policy upon the death of the subject. The owner of the policy isthe person (or other entity) who has the authority to exercise all the prematurityrights of the policy, such as designating the beneficiary, taking a policy loan, and soon. Often, the insured is also the owner.
Lynn Asinof, “Is Selling Your Life Insurance Good Policy in the Long-Term?” Wall StreetJournal, May 15, 2002.
Ron Panko, “Is There Still Room for Viaticals?” Best’s Review, April 2002.
“Life Settlement Group Sets Premium Finance Guidelines,” National Underwriter On-line News Service, April 5, 2005; “Firm to Offer Regular Life Settlement Rating Reports,”National Underwriter Online News Service, April 21, 2005; and Jim Connolly,“Institutions Reshape Life Settlement Market,” National Underwriter, Life/Health Edi-tion, September 16, 2004.
Allison Bell, “Life Settlement Firms Face Jumbled Regulatory Picture,” National Under-writer, Life/Health Edition, September 16, 2004.
Theo Francis and Ellen E. Schultz, “Big Banks Quietly Pile Up ‘Janitors’ Insurance,’” WallStreet Journal, May 2, 2002.
Sarah Lunday, “Business Giants Could Profit from Life Insurance on Workers,” TheCharlotte (North Carolina) Observer, May 12, 2002: “Some of Charlotte’s biggest com-panies—Bank of America Corp., Wachovia Corp. and Duke Energy Corp. in-cluded—stand to reap profits from life insurance policies purchased on current andformer workers. In some cases, the policies may have been purchased without theworkers or their families ever knowing.”
Arthur D. Postal, “House Revives COLI Bill,” National Underwriter Online News Service,May 12, 2005.
Some property insurance policies are written on a valued basis, but precautions aretaken to ensure that values agreed upon are realistic, thus adhering to the principleof indemnity.
Life and health insurance companies have learned, however, that overinsurance maylead to poor underwriting experience. Because the loss caused by death or illnesscannot be measured precisely, defining overinsurance is difficult. It may be said toexist when the amount of insurance is clearly in excess of the economic loss thatmay be suffered. Extreme cases, such as the individual whose earned income is $300per week but who may receive $500 per week in disability insurance benefits froman insurance company while he or she is ill, are easy to identify. Life and health in-surers engage in financial underwriting to detect overinsurance. The requestedamount of insurance is related to the proposed insured’s (beneficiary’s) financialneed for insurance and premium-paying ability.
This is an area in which it is difficult to generalize; the statement made in the text isapproximately correct. The point is that the creditor-debtor relationship is an excep-tion to the statement that an insurable interest need not exist at the time of thedeath of the insured and that the amount of payment is not limited to the insurableinterest that existed at the inception of the contract. For further discussion, see Ken-neth Black, Jr., and Harold Skipper, Jr., Life Insurance, 12th ed. (Englewood Cliffs, NJ:Prentice-Hall, 1994), 187–88.
A complete assignment is the transfer of ownership or benefits of a policy.
190 RISK MANAGEMENT FOR ENTERPRISES AND INDIVIDUALS
C H A P T E R 9Structure and Analysis ofInsurance ContractsAs discussed in Chapter 8, an insurance policy is a contractual agreement subject to rules governing contracts.
Understanding those rules is necessary for comprehending an insurance policy. It is not enough, however. We will
be spending quite a bit of time in the following chapters discussing the specific provisions of various insurance
contracts. These provisions add substance to the general rules of contracts already presented and should give you
the skills needed to comprehend any policy.
In Chapter 9, we offer a general framework of insurance contracts, called policies. Because most policies are
somewhat standardized, it is possible to present a framework applicable to almost all insurance contracts. As an
analogy, think about grammar. In most cases, you can follow the rules almost implicitly, except when you have
exceptions to the rules. Similarly, insurance policies follow comparable rules in most cases. Knowing the format and
general content of insurance policies will help later in understanding the specific details of each type of coverage
for each distinct risk. This chapter covers the following:
1. Links
2. Entering into the contract: applications, binders, and conditional and binding receipts
3. The contract: declarations, insuring clauses, exclusions and exceptions, conditions, and endorsements and
riders
1. LINKSBy now, we assume you are accustomed to connecting the specific topics of each chapter to the big pic-ture of your holistic risk. This chapter is wider in scope. We are not yet delving into the specifics ofeach risk and its insurance programs. However, compared with Chapter 8, we are drilling down a stepfurther into the world of insurance legal documents. We focus on the open-peril type of policy, whichcovers all risks. This means that everything is covered unless specifically excluded, as shown in Figure9.1. Nevertheless, the open-peril policy has many exclusions and more are added as new risks appearon the horizon. For the student who is first introduced to this field, this unique element is an importantone to understand. Most insurance contracts in use today do not list the risks that are covered; rather,the policy lets you know that everything is covered, even new, unanticipated risks such as anthrax(described in the box “How to Handle the Risk Management of a Low-Frequency but Scary Risk Ex-posure: The Anthrax Scare?” in Chapter 3). When the industry realizes that a new peril is too cata-strophic, it then exerts efforts to exclude such risks from the standardized, regulated policies. Suchefforts are not easy and are met with resistance in many cases. As you learned in Chapter 5, catastroph-ic risks are not insurable by private insurers; therefore, they are excluded from the policies. In 2005, thetopic of wind versus water was of concern as a result of hurricanes Katrina and Rita. Despite the dev-astation, all damages caused by flood water were excluded from the policies because floods are con-sidered catastrophic. Another case in point is the terrorism exclusion that became moot after PresidentBush signed the Terrorism Risk Insurance Act (TRIA) in 2002.
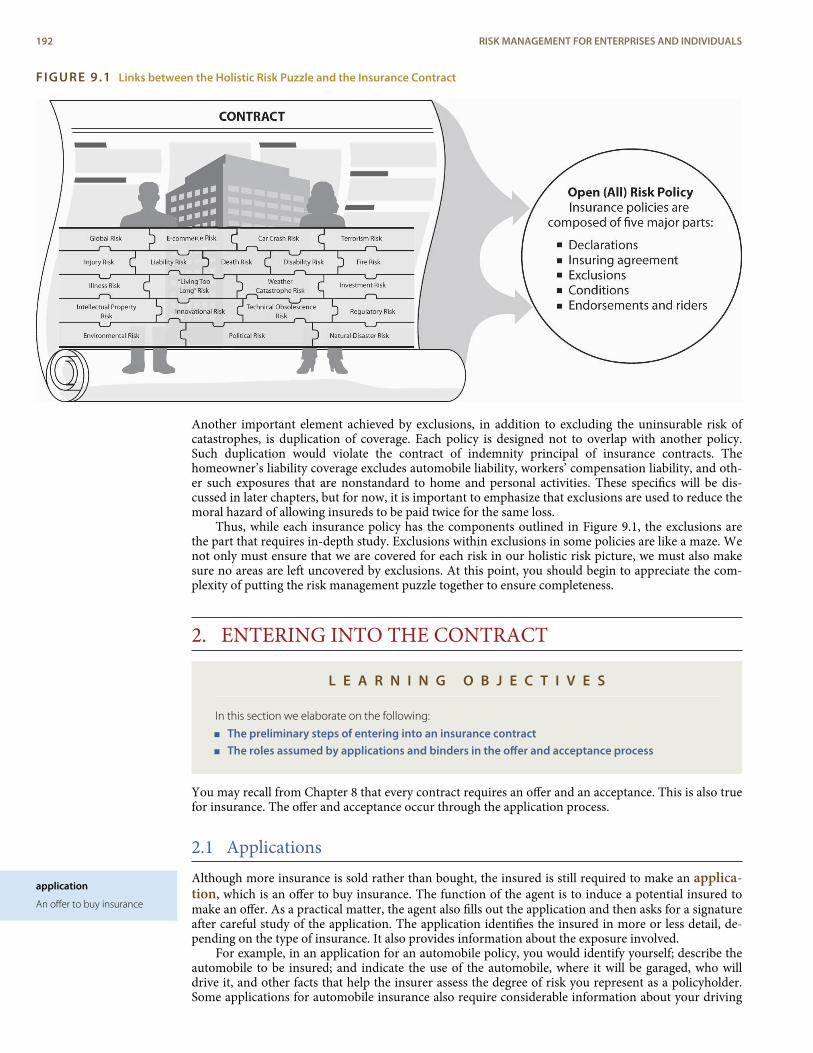
application
An offer to buy insurance
FIGURE 9.1 Links between the Holistic Risk Puzzle and the Insurance Contract
Another important element achieved by exclusions, in addition to excluding the uninsurable risk ofcatastrophes, is duplication of coverage. Each policy is designed not to overlap with another policy.Such duplication would violate the contract of indemnity principal of insurance contracts. Thehomeowner’s liability coverage excludes automobile liability, workers’ compensation liability, and oth-er such exposures that are nonstandard to home and personal activities. These specifics will be dis-cussed in later chapters, but for now, it is important to emphasize that exclusions are used to reduce themoral hazard of allowing insureds to be paid twice for the same loss.
Thus, while each insurance policy has the components outlined in Figure 9.1, the exclusions arethe part that requires in-depth study. Exclusions within exclusions in some policies are like a maze. Wenot only must ensure that we are covered for each risk in our holistic risk picture, we must also makesure no areas are left uncovered by exclusions. At this point, you should begin to appreciate the com-plexity of putting the risk management puzzle together to ensure completeness.
2. ENTERING INTO THE CONTRACT
L E A R N I N G O B J E C T I V E S
In this section we elaborate on the following:
< The preliminary steps of entering into an insurance contract< The roles assumed by applications and binders in the offer and acceptance process
You may recall from Chapter 8 that every contract requires an offer and an acceptance. This is also truefor insurance. The offer and acceptance occur through the application process.
2.1 ApplicationsAlthough more insurance is sold rather than bought, the insured is still required to make an applica-tion, which is an offer to buy insurance. The function of the agent is to induce a potential insured tomake an offer. As a practical matter, the agent also fills out the application and then asks for a signatureafter careful study of the application. The application identifies the insured in more or less detail, de-pending on the type of insurance. It also provides information about the exposure involved.
For example, in an application for an automobile policy, you would identify yourself; describe theautomobile to be insured; and indicate the use of the automobile, where it will be garaged, who willdrive it, and other facts that help the insurer assess the degree of risk you represent as a policyholder.Some applications for automobile insurance also require considerable information about your driving
192 RISK MANAGEMENT FOR ENTERPRISES AND INDIVIDUALS
conditional receipt
Policy that does not bind thecoverage of life insurance atthe time it is issued, but itdoes put the coverage intoeffect retroactive to the timeof application if one meets allthe requirements forinsurability as of the date ofthe application.
binding receipt
Policy that will be paid ifdeath occurs while one’sapplication for life insuranceis being processed, even ifthe deceased is found not tobe insurable.
and claim experience, as well as information about others who may use the car. In many cases, such aslife insurance, the written application becomes part of the policy. Occasionally, before an oral or writ-ten property/casualty application is processed into a policy, a temporary contract, or binder, may beissued.
2.2 BindersAs discussed in Chapter 8, property/casualty insurance coverage may be provided while the applicationis being processed. This is done through the use of a binder, which is a temporary contract to providecoverage until the policy is issued by the agent or the company.
In property/casualty insurance, an agent who has binding authority can create a contract betweenthe insurance company and the insured. Two factors influence the granting of such authority. First,some companies prefer to have underwriting decisions made by specialists in the underwriting depart-ment, so they do not grant binding authority to the agent. Second, some policies are cancelable; othersare not. The underwriting errors of an agent with binding authority may be corrected by cancellation ifthe policy is cancelable. Even with cancelable policies, the insurer is responsible under a binder forlosses that occur prior to cancellation. If it is not cancelable, the insurer is obligated for the term of thecontract.
The binder may be written or oral. For example, if you telephone an agent and ask to have yourhouse insured, the agent will ask for the necessary information, give a brief statement about the con-tract—the coverage and the premium cost—and then probably say, “You are covered.” At this point,you have made an oral application and the agent has accepted your offer by creating an oral binder.The agent may mail or e-mail a written binder to you to serve as evidence of the contract until thepolicy is received. The written binder shows who is insured, for what perils, the amount of the insur-ance, and the company with which coverage is placed.
In most states, an oral binder is as legal as a written one, but in case of a dispute it may be difficultto prove its terms. Suppose your house burns after the oral binder has been made but before the policyhas been issued, and the agent denies the existence of the contract. How can you prove there was a con-tract? Or suppose the agent orally binds the coverage, a fire occurs, and the agent dies before the policyis issued. Unless there is evidence in writing, how can you prove the existence of a contract? Supposethe agent does not die and does not deny the existence of the contract, but has no evidence in writing.If the agent represents only one company, he or she may assert that the company was bound and theinsured can collect for the loss. But what if the agent represents more than one company? Which one isbound? Typically, the courts will seek a method to allocate liability according to the agent’s commonmethod of distributing business. Or if that is not determinable, relevant losses might be apportionedamong the companies equally. Most agents, however, keep records of their communication with in-sureds, including who is to provide coverage.
2.3 Conditional and Binding ReceiptsConditional and binding receipts in life insurance are somewhat similar to the binders in property/cas-ualty insurance but contain important differences. If you pay the first premium for a life insurancepolicy at the time you sign the application, the agent typically will give you either a conditional receiptor a binding receipt. The conditional receipt does not bind the coverage of life insurance at the timeit is issued, but it does put the coverage into effect retroactive to the time of application if one meets allthe requirements for insurability as of the date of the application. A claim for benefits because of deathprior to issuance of the policy generally will be honored, but only if you were insurable when you ap-plied. Some conditional receipts, however, require the insured to be in good health when the policy isdelivered.
In contrast, a claim for the death benefit under a binding receipt will be paid if death occurswhile one’s application for life insurance is being processed even if the deceased is found not to be in-surable. Thus, the binding receipt provides interim coverage while your application is being processed,whether or not you are insurable. This circumstance parallels the protection provided by a binder inproperty/casualty insurance.[1]
CHAPTER 9 STRUCTURE AND ANALYSIS OF INSURANCE CONTRACTS 193
K E Y T A K E A W A Y S
In this section you studied that the act of entering into an insurance contract, like all contracts, requires offerand acceptance between two parties:
< The insurance application serves as the insured’s offer to buy insurance.
< An agent may accept an application through oral or written binder in property/casualty insurance andthrough conditional receipt or a binding receipt in life/health insurance
D I S C U S S I O N Q U E S T I O N S
1. What is the difference between a conditional receipt and a binding receipt?
2. You apply for homeowners insurance and are issued a written binder. Before your application has beenfinalized, your house burns down in an accidental fire. Are you covered for this loss? What about in thecase of an oral binder?
3. Dave was just at his insurance agent’s office applying for health insurance. On his way home from theagent’s office, Dave had a serious accident that kept him hospitalized for two weeks. Would the healthinsurance policy Dave just applied for provide coverage for this hospital expense?
3. THE CONTRACT
L E A R N I N G O B J E C T I V E S
In this section we elaborate on the following major elements of insurance contracts:
< Declarations< Insuring agreement< Exclusions< Conditions< Endorsements and riders
Having completed the offer and the acceptance and met the other requirements for a contract, a con-tract now exists. What does it look like? Insurance policies are composed of five major parts:
< Declarations< Insuring agreement< Exclusions< Conditions< Endorsements and riders
These parts typically are identified in the policy by headings. (A section titled “definition” is also be-coming common.) Sometimes, however, they are not so prominently displayed, and it is much morecommon to have explicit section designations in property/casualty contracts than it is in life/healthcontracts. Their general intent and nature, however, has the same effect.
3.1 DeclarationsGenerally, the declarations section is the first part of the insurance policy. Some policies, however, havea cover (or jacket) ahead of the declarations. The cover identifies the insurer and the type of policy.
194 RISK MANAGEMENT FOR ENTERPRISES AND INDIVIDUALS
declarations
Statements that identify theperson(s) or organization(s)covered by a contract, giveinformation about the lossexposure, and provide thebasis upon which thecontract is issued and thepremium determined.
period of coverage
The time duration for whichcoverage applies.
limitations of liability
The maximum amountpayable by an insurancepolicy.
insuring clause
A general statement of thepromises the insurer makesto the insured.
Declarations are statements that identify the person(s) or organization(s) covered by the con-tract, give information about the loss exposure, and provide the basis upon which the contract is issuedand the premium determined. This information may be obtained orally or in a written application. Thedeclarations section may also include the period of coverage and limitations of liability. (The latter mayalso appear in other parts of the contract.)
Period of Coverage
All insurance policies specify the period of coverage, or the time duration for which coverage applies.Life and health policies may provide coverage for the entire life of the insured, a specified period ofyears, or up until a specified age. Health policies and term life policies often cover a year at a time. Mostproperty insurance policies are for one year or less (although longer policies are available). Perpetualpolicies remain in force until canceled by you or the insurer. Liability policies may be for a three-month or six-month period, but most are for a year. Some forms of automobile insurance may be writ-ten on a continuous basis, with premiums payable at specified intervals, such as every six months. Suchpolicies remain in force as long as premiums are paid or until they are canceled. Whatever the termduring which any policy is to be in force, it will be carefully spelled out in the contract. During periodswhen insureds may expect a turn to hard markets in the underwriting cycles, they may want to fix thelevel of premiums for a longer period and will sign contracts for longer than one year, such as threeyears.
Limitations of Liability
All insurance policies have clauses that place limitations of liability (maximum amount payable bythe insurance policy) on the insurer. Life policies promise to pay the face amount of the policy. Healthpolicies typically limit payment to a specified amount for total medical expenses during one’s lifetimeand have internal limits on the payment of specific services, such as a surgical procedure. Property in-surance policies specify as limits actual cash value or replacement value, insurable interest, cost to re-pair or replace, and the face amount of insurance. Limits exist in liability policies for the amount pay-able per claim, sometimes per injured claimant, sometimes per year, and sometimes per event. Remem-ber the example in Chapter 8 of the dispute between the leaseholder and the insurer over the number ofevents in the collapse of the World Trade Center (WTC) on September 11, 2001. The dispute waswhether the attack on the WTC constituted two events or one. Defense services, provided in most liab-ility policies, are limited only to the extent that litigation falls within coverage terms and the policy pro-ceeds have not been exhausted in paying judgments or settlements. Because of the high cost of provid-ing legal defense in recent years, however, attempts to limit insurer responsibility to some dollaramount have been made.
Retained Losses
In many situations, it is appropriate not to transfer all of an insured’s financial interest in a potentialloss. Loss retention benefits the insured when losses are predictable and manageable. For the insurer,some losses are better left with the insured because of moral hazard concerns. Thus, an insured mightretain a portion of covered losses through a variety of policy provisions. Some such provisions are de-ductibles, coinsurance in property insurance, copayments in health insurance, and waiting periods indisability insurance. Each is discussed at some length in later chapters. For now, realize that the exist-ence of such provisions typically is noted in the declarations section of the policy.
3.2 Insuring ClausesThe second major element of an insurance contract, the insuring clause or agreement, is a generalstatement of the promises the insurer makes to the insured. Insuring clauses may vary greatly frompolicy to policy. Most, however, specify the perils and exposures covered, or at least some indication ofwhat they might be.
Variation in Insuring Clauses
Some policies have relatively simple insuring clauses, such as a life insurance policy, which couldsimply say, “The company agrees, subject to the terms and conditions of this policy, to pay the amountshown on page 2 to the beneficiary upon receipt at its Home Office of proof of the death of the in-sured.” Package policies are likely to have several insuring clauses, one for each major type of coverageand each accompanied by definitions, exclusions, and conditions. An example of this type is the per-sonal automobile policy, described in Chapter 1.
CHAPTER 9 STRUCTURE AND ANALYSIS OF INSURANCE CONTRACTS 195
perils
The causes of loss.
named-perils policy
Policy that covers only lossescaused by the perils listed inthe policy.
open-perils policy
Policy that covers lossescaused by all perils exceptthose excluded.
Some insuring clauses are designated as the “insuring agreement,” while others are hidden amongpolicy provisions. Somewhere in the policy, however, it states that the “insurer promises to pay….”This general description of the insurer’s promises is the essence of an insuring clause.
Open-Perils versus Named-Perils
The insuring agreement provides a general description of the circumstances under which the policy be-comes applicable. The circumstances include the covered loss-causing events, called perils. They maybe specified in one of two ways.
A named-perils policy covers only losses caused by the perils listed in the policy. If a peril is notlisted, loss resulting from it is not covered. For example, one form of the homeowner’s policy, HO-2,insures for direct loss to the dwelling, other structures, and personal property caused by eighteendifferent perils. Only losses caused by these perils are covered. Riot or civil commotion is listed, so aloss caused by either is covered. On the other hand, earthquake is not listed, so a loss caused by earth-quake is not covered.
An open-perils policy (formerly called “all risk”) covers losses caused by all perils except thoseexcluded. This type of policy is most popular in property policies. It is important to understand thenature of such a policy because the insured has to look for what is not covered rather than what iscovered. The exclusions in an open-perils policy are more definitive of coverage than in a named-perilspolicy. Generally, an open-perils policy provides broader coverage than a named-perils policy, al-though it is conceivable, if unlikely, that an open-perils policy would have such a long list of exclusionsthat the coverage would be narrower.
As noted in the Links section, many exclusions in property policies have been in the limelight.After September 11, 2001, the terrorism exclusion was the first added exclusion to all commercialpolicies but was rescinded after the enactment of TRIA in 2002 and its extensions. The mold exclusionwas another new exclusion of our age. The one old exclusion that received major attention in 2005 inthe wake of hurricanes Katrina and Rita is the flood exclusion in property policies. Flood coverage isprovided by the federal government and is limited in its scope (see Chapter 1). Additional exclusionswill be discussed further in Chapter 10 and Chapter 11. In the 1980s, pollution liability was excludedafter major losses. As noted in Chapter 5, most catastrophes would be excluded because they are notconsidered insurable by private insurers. A most common exclusion, as noted above, is the war exclu-sion. The insurance industry decided not to trigger this exclusion in the aftermath of September 11. Fora closer look, see the box below, "The Risk of War".
Policies written on a named-perils basis cannot cover all possible causes of loss because of“unknown peril.” There is always the possibility of loss caused by a peril that was not known to existand so was not listed in the policy. For this reason, open-perils policies cover many perils not coveredby named-perils policies. This broader coverage usually requires a higher premium than a named-per-ils policy, but it is often preferable because it is less likely to leave gaps in coverage. The anthrax scaredescribed in Chapter 3 is an example of an unknown peril that was covered by the insurance industry’spolicies.
Very few, if any, policies are “all risk” in the sense of covering every conceivable peril. Probably theclosest approach to such a policy in the property insurance field is the comprehensive glass policy,which insures against all glass breakage except those caused by fire, war, or nuclear peril. Most life in-surance policies cover all perils except for suicide during the first year or the first two years. Health in-surance policies often are written on an open-perils basis, covering medical expenses from any causenot intentional. Some policies, however, are designed to cover specific perils such as cancer (discussedin Chapter 2). Limited-perils policies are popular because many people fear the consequences of certainillnesses. Of course, the insured is well-advised to be concerned with (protect against) the loss, regard-less of the cause.
The Risk of War
“This means war!” was a frequent refrain among angry Americans in the days after September 11, 2001. EvenPresident George W. Bush repeatedly referred to the terrorist attacks on the World Trade Center and thePentagon as an “act of war.” One politician who disagreed with that choice of words was Representative Mi-chael Oxley.
By definition and by U.S. law, war is an act of violent conflict between two nations. The hijackers, it was soondetermined, were working not on behalf of any government but for the al Qaeda network of terrorists. Thus, aweek after the attacks, Oxley, chairperson of the Financial Services Committee of the U.S. House of Represent-atives, sent a letter to the National Association of Insurance Commissioners urging the insurance industry notto invoke war risk exclusions to deny September 11 claims.
196 RISK MANAGEMENT FOR ENTERPRISES AND INDIVIDUALS
Most insurers had already come to the same conclusion. Generally, auto, homeowner’s, commercial property,business interruption, and (in some states) worker’s compensation policies contain act-of-war exclusions,meaning that insurance companies can refuse to pay claims arising from a war or a warlike act. To illustrate,the standard commercial property policy form provided by the Insurance Services Office contains the follow-ing exclusions:
1. War, including undeclared or civil war
2. Warlike action by a military force, including action in hindering or defending against an actual orexpected attack, by any government, sovereign or other authority using military personnel or otheragents
3. Insurrection, rebellion, revolution, usurped power, or action taken by governmental authority inhindering or defending against any of these
Wars are not considered insurable events: they are unpredictable, intentional, and potentially catastrophic.(Recall the discussion in Chapter 5 on insurable and uninsurable risks.) The risks of war are simply too great foran insurance company to accept.
The war exclusion clause has given rise to few lawsuits, but in each case the courts have supported its applica-tion “only in situations involving damage arising from a genuine warlike act between sovereign entities.” PanAmerican World Airways v. Aetna Casualty and Surety Co., 505 F2d 989 (1974), involved coverage for the hijack-ing and destruction of a commercial aircraft. The Second Circuit Court of Appeals held that the hijackers,members of the Popular Front for the Liberation of Palestine, were not “representatives of a government,” andthus the war exclusion did not apply. The insurers were liable for the loss. A war exclusion claim denial was up-held in TRT/FTC Communications, Inc. v. Insurance Company of the State of Pennsylvania, 847 F. Supp. 28 (Del.Dist. 1993), because the loss occurred in the context of a declared war between the United States andPanama—two sovereign nations.
With some $50 billion at stake from the September 11 attacks, it wouldn’t have been surprising if some in-surers considered taking a chance at invoking the war exclusion clause. Instead, companies large and smallwere quick to announce that they planned to pay claims fairly and promptly. “We have decided that we willconsider the events of September 11 to be ‘acts of terrorism,’ not ‘acts of war,’” said Peter Bruce, Senior Execut-ive Vice President of Northwestern Mutual Life Insurance. The industry agreed.
Sources: “Insurers: WTC Attack Not Act of War,” Insurance-Letter, September 17, 2001, http://www.cybersure.com/godoc/1872.htm; Jack P. Gibson etal., “Attack on America: The Insurance Coverage Issues,” International Risk Management Institute, Inc., September 2001, http://www.imri.com; TimReason, “Acts of God and Monsters No Longer Covered: Insurers Say Future Policies Will Definitely Exclude Terrorist Attacks,” CFO.com, November 19,2001, http://www.cfo.com/article/1,5309,5802%7C%7CA%7C736%7C8,00.html; Susan Massmann, “Legal Background Outlined for War RiskExclusion,” National Underwriter Online News Service, September 18, 2001; “Northwestern Mutual Won’t Invoke War Exclusion on Claims,” The(Milwaukee) Business Journal, September 14, 2001.
Exposures to Loss
Generally, the exposures to be covered are also defined (broadly speaking) in the insuring agreement.For example, the liability policy states that the insurer will pay “those sums the insured is legally oblig-ated to pay for damages….” In addition, “the Company shall have the right and duty to defend….” Theexposures in this situation are legal defense costs and liability judgments or settlements against theinsured.
In defining the exposures, important information, such as the basis of valuation and types of lossescovered, is needed. Various valuation methods have already been discussed. Actual cash value and re-placement cost are the most common means of valuing property loss. Payments required of defend-ants, either through mutually acceptable settlements or court judgments, define the value of liabilitylosses. The face value (amount of coverage) of a life insurance policy represents the value paid upon theinsured’s death. Health insurance policies employ a number of valuation methods, including anamount per day in the hospital or per service provided, or—more likely—the lesser of the actual cost ofthe service or the customary and prevailing fee for this service. Health maintenance organizationspromise the provision of services, as such, rather than a reimbursement of their cost.
CHAPTER 9 STRUCTURE AND ANALYSIS OF INSURANCE CONTRACTS 197
direct loss
The value of property that isphysically destroyed ordamaged, not including theloss caused by inability to usethe property.
consequential or indirectlosses
A nonphysical loss such asloss of business.
business interruption
Losses that occur when anorganization is unable to sellits goods or services and/orunable to produce goods forsale because of direct orindirect loss.
contingent businessinterruption
Loss caused by propertydamage not owned by thebusiness.
extra expense losses
Additional costs incurred byorganizations that choose tocontinue operating followingproperty damage.
property damage
Liability that includesresponsibility both for thephysical damage to propertyand the loss of use ofproperty.
bodily injury
Physical injury to a person,including the pain andsuffering that may result.
personal injury
Nonphysical injury to aperson, including damagecaused by libel, slander, falseimprisonment, and the like.
punitive damages
Awards intended to punishan offender for exceptionallyundesirable behavior.
The types of covered losses are also generally stated in the insuring agreement. Many property in-surance policies, for example, cover only direct loss. Direct loss to property is the value that is physic-ally destroyed or damaged, not the loss caused by inability to use the property. Other policies that coverloss of use of property without physical damage to the property are called consequential or indirectloss. In the aftermath of Hurricane Rita, many Texas coastal residents who evacuated encountered in-direct loss without damage to their homes. This included the evacuation of Galveston and Houston.Coverage for these losses was disputed by insurers, such as Allstate, that tried to exclude these indirectlosses. In addition, in the introduction to this chapter, it was explained how important the consequen-tial loss coverage was to the businesses that suffered indirectly from the September 11 attacks. A reportreleased by PricewaterhouseCoopers in New York City noted that business interruption claims camefrom a wide scope of industries, including financial services, communications, media, and travel indus-tries, that were not in the attack zone.[2] Many remote businesses were disrupted when the world trans-portation networks were paralyzed. It was estimated that losses up to $10 billion were caused by theseindirect effects.[3]
Business interruption losses occur when an organization is unable to sell its goods or services,and/or unable to produce goods for sale because of direct or indirect loss. Generally, these losses aredue to some property damage considered direct loss. Such lost revenues typically translate into lostprofits. The 1992 Chicago flood, for example, required that Marshall Fields downtown store close itsdoors for several days while crews worked to clean up damage caused by the flood waters.[4] When lossis caused by property damage not owned by the business, it is considered a contingent business in-terruption. If Marshall Fields reduced its orders to suppliers of its goods, for instance, those suppliersmay experience contingent business interruption loss caused by the water damage, even though theirown property was not damaged.
Alternatively, some organizations choose to continue operating following property damage, butthey are able to do so only by incurring additional costs known as extra expense losses. These costsalso reduce profits. Continuing with the 1992 Chicago flood example, consider the various accountingfirms who could not use their offices the second week in April. With the upcoming tax filing deadline,these firms chose to rent additional space in other locations so they could meet their clients’ needs. Theadditional rental expense (and other costs) resulted in reduced profits to the accounting firms. Yet avariety of service organizations, including accountants, insurance agents, and bankers, prefer to incursuch expenses in order to maintain their reputation of reliability, upon which their long-term successand profits depend. Closing down, even temporarily, could badly hurt the organization.
Individuals and families too may experience costs associated with loss of use. For example, if yourhome is damaged, you may need to locate (and pay for) temporary housing. You may also incur abnor-mal expenses associated with the general privileges of home use, such as meals, entertainment, tele-phones, and similar conveniences. Likewise, if your car is unavailable following an accident, you mustrent a car or spend time and money using other forms of transportation. Thus, while a family’s loss ofuse tends to focus on extra expense, its effect may be as severe as that of an organization.
Liability policies, on the other hand, may cover liability for property damage, bodily injury, per-sonal injury, and/or punitive damages. Property damage liability includes responsibility both for thephysical damage to property and the loss of use of property. Bodily injury is the physical injury to aperson, including the pain and suffering that may result. Personal injury is the nonphysical injury toa person, including damage caused by libel, slander, false imprisonment, and the like. Punitive dam-ages are damages assessed against defendants for gross negligence, supposedly for the purpose of pun-ishment and to deter others from acting in a similar fashion. Examples of punitive damages in recentcases and their ethical implications are featured in the box “Are Punitive Damages out of Control?”
Are Punitive Damages out of Control?
In December 2005, a California jury delivered a guilty verdict and awarded $172 million in damages againstWal-Mart Stores, Inc., for not giving the appropriate lunch breaks to its thousands of employees. The verdict in-cluded $57.3 million in general damages and $115 million in punitive damages. Wal-Mart planned to appeal.In 2002, a California state court judge awarded $30 million against grocery chain Kroger, where six employeeshad been verbally harassed by a store manager. The verdict was reduced to a mere $8.25 million when the up-per court decided it was “grossly excessive.” A jury in Laredo, Texas, awarded $108 million to Mexican heiressCristina Brittingham Sada de Ayala in a lawsuit against her stepmother for failing to repay a $34 million loan. AUtah jury ordered State Farm to pay a policyholder $145 million in punitive damages for handling a claim inbad faith and inflicting emotional distress. A Los Angeles jury ordered tobacco giant Philip Morris to pay BettyBullock $28 billion in punitive damages.
198 RISK MANAGEMENT FOR ENTERPRISES AND INDIVIDUALS
exclusions
Perils, risks, losses, andproperties that are notcovered in an all-risk policy.
The Bullock award of $28 billion (which was lowered to $28 million and is still being appealed by Philip Morris)is by itself almost five times the combined amount of the top ten largest jury awards to individuals and famil-ies in 2001. Though a Department of Justice study showed that only a small percentage of cases are awardedpunitive damages, and that the majority of awards are under $40,000, the number and amounts of punitiveawards have been geometrically increasing since the high of $10,000 in 1959.
Some people argue that a fine is the best way to punish a corporation for acting wrongly. For example, the1994 case against McDonald’s that won an elderly woman $2.7 million for spilling hot coffee in her lap is com-monly seen as the beginning of our frivolous lawsuit period. What the jury heard, but most people did not,was that McDonald’s purposely kept its coffee at least forty degrees hotter than most restaurants did, as acost-saving measure to extract more coffee from the beans; that more than 700 people had filed complaintsof scalding coffee burns over the previous decade; and that McDonald’s knew their coffee was dangerouslyhot, yet had no plans to turn the heat down or postwarning signs. The woman in the case suffered third-de-gree burns to her groin, thighs, and buttocks that required skin grafts and a lengthy hospital stay. She filed suitagainst McDonald’s only after the company refused to pay her medical bills. Even the famous multimillion-dol-lar award was reduced on appeal to $480,000.
The true problem, many say, is not the size of such awards but the method by which we determine them.Punitive damages are not truly “damages” in the sense of compensation for a loss or injury but rather a fine,levied as punishment. In determining the amount of a punitive award, a jury is instructed to consider whetherthe defendant displayed reckless conduct, gross negligence, malice, or fraud—but in practice, a jury award of-ten depends on how heart-tugging the plaintiff seems to be versus how heartless the big bad corporationappears.
Questions for Discussion
1. Were the facts behind the McDonald’s lawsuit news to you? Do they change your opinion about thislandmark case? What would you have done if you had been on the jury?
2. Betty Bullock, who has lung cancer, had been a regular smoker for forty years and blamed PhilipMorris for failing to warn her about smoking risks. Do you think Philip Morris is responsible? Do youthink learning more about the case might change your opinion?
3. Exxon was ordered to pay $125 million in criminal fines for the Exxon Valdez oil spill. In a separate trial,a civil jury hit Exxon with a $5 billion punitive award. Is it fair for a company to pay twice for the samecrime?
4. Are juries—composed of people who have no legal training, who know only about the case they aresitting on, who may be easily swayed by theatrical attorneys, and who are given only vagueinstructions—equipped to set punitive damage awards? Should punitive awards be regulated?
Sources: Kris Hudson, “Wal-Mart Workers Awarded $172 Million,” Wall Street Journal, December 23, 2005, B3; Olson, speech at the Manhattan Instituteconference, “Crime and Punishment in Business Law,” May 8, 2002, reprinted at http://www.manhattan-institute.org/html/cjm_15.htm; “Surprise:Judges Hand Out Most Punitive Awards,” Wall Street Journal, June 12, 2000, 2b; Steven Brostoff, “Top Court to Review Punitive Damages,” NationalUnderwriter Online News Service, June 27, 2002; “McFacts about the McDonalds Coffee Lawsuit,” Legal News and Views, Ohio Academy of TrialLawyers, http://lawandhelp.com/q298–2.htm, Michael Bradford, “Phillip Morris to Continue Appeal of Punitives Award,” Business Insurance, December19, 2002; http://www.altria.com/media/03_06_04_03_00_Bullock.asp for update on the Bullock case.
3.3 Exclusions and ExceptionsWhether the policy is open-perils or named-perils, the coverage it provides cannot be ascertainedwithout considering the exclusions, which are those perils, risks, losses, and properties that are notcovered in an all-risk policy. Exclusions represent the third major part of an insurance policy and expli-citly identify losses not covered by the policy. Usually, an insured may not know what the policy coversuntil he or she finds out what it does not cover. Unfortunately, this is not always an easy task. In manypolicies, exclusions appear not only under the heading “Exclusions” in one or more places but alsothroughout the policy and in various forms. When we delve into homeowners policies in Chapter 1,you will be amazed at the many exclusions, and exclusions to exclusions, that you will encounter. Thehomeowners policy section I (which provides property coverage) has two lists of exclusions identifiedas such, plus others scattered throughout the policy. The last sentence in the description of loss of usecoverage, for example, says, “We do not cover loss or expense due to cancellation of a lease or agree-ment.” In other words, such loss is excluded. In “Perils Insured Against,” the policy at one point says,“We insure for risks of physical loss to the property…. Except,” followed by a list of losses or losscauses. Under the heading “Additional Coverages,” several types of coverage are listed and then the fol-lowing sentence appears: “We do not cover loss arising out of business pursuits….” Thus, such loss isexcluded.
A policy may exclude specified locations, perils, property, or losses. Perhaps a discussion of the ex-clusions in some policies and the reasons for them will be helpful.
CHAPTER 9 STRUCTURE AND ANALYSIS OF INSURANCE CONTRACTS 199
other insurance clause
Provision in a policy thatapportions the insurer’sfinancial responsibility so thatpayment in excess of theinsured’s loss is avoided.
Reasons for Exclusions
Let us review the reasons for the existence of exclusions. As noted in Chapter 5, one reason exclusionsexist is to avoid financial catastrophe for the insurer, which may result if many dependent exposuresare insured or if a single, large-value exposure is insured. Because war would affect many exposuressimultaneously, losses caused by war are excluded in most policies in order to avoid insuring cata-strophic events. Exclusions also exist to limit coverage of nonfortuitous (that is, not accidental) events.Losses that are not accidental make prediction difficult, cause coverage to be expensive, and representcircumstances in which coverage would be contrary to public policy. As a result, losses caused inten-tionally (by the insured) are excluded. So, too, are naturally occurring losses that are expected. Wearand tear, for instance, is excluded from coverage. Adverse selection and moral hazard are limited bythese exclusions.
Adverse selection is limited further by use of specialized policies and endorsements that standard-ize the risk. That is, limitations (exclusions) are placed in standard policies for exposures that are non-standard. Those insureds who need coverage for such nonstandard exposures purchase it specifically.For example, homeowner’s policies limit theft coverage on jewelry and furs to a maximum amount($2,500). Exposures in excess of the maximum are atypical, representing a higher probability (andseverity) of loss than exists for the average homeowner. Insureds who own jewelry and furs with valuesin excess of the maximum must buy special coverage (if desired).
An important element is the point emphasized in the Links section at the beginning of the chapter.Some exclusions exist to avoid duplication of coverage by policies specifically intended to insure the ex-posure. As noted above, homeowners liability coverage excludes automobile liability, workers’ com-pensation liability, and other such exposures that are nonstandard to home and personal activities.Other policies specifically designed to cover such exposures are available and commonly used. To du-plicate coverage would diminish insurers’ ability to discriminate among insureds and could result inmoral hazard if insureds were paid twice for the same loss. A policy clause, termed other insuranceclause (discussed in Chapter 8), addresses the potential problem of duplicating coverage when two ormore similar policies cover the same exposure. Through this type of provision, the insurer’s financialresponsibility is apportioned so that payment in excess of the insured’s loss is avoided.
These reasons for exclusions are manifested in limitations on the following:< Locations< Perils< Property< Losses
The following is a discussion of the purposes of limiting locations, perils, property, and losses.
Excluded Locations
Some types of coverage are location-specific, such as to buildings. Other policies define the location ofcoverage. Automobile policies, for example, cover the United States and Canada. Mexico is not coveredbecause of the very high auto risk there. In addition, some governmental entities in Mexico will not ac-cept foreign insurance. Some property policies were written to cover movable property anywhere in theworld except the Eastern bloc countries, likely because of difficulty in adjusting claims. With the break-up of the Communist bloc, these limitations are also being abandoned. Yet coverage may still be ex-cluded where adjusting is difficult and/or the government of the location has rules against such foreigninsurance. For a discussion of political risk—unanticipated political events that disrupt the earning orprofit-making ability of an enterprise—see Chapter 10.
Excluded Perils
Some perils are excluded because they can be covered by other policies or because they are unusual orcatastrophic. The earthquake peril, for example, requires separate rating and is excluded fromhomeowners policies. This peril can be insured under a separate policy or added by endorsement for anextra premium. Many insureds do not want to pay the premium required, either because they thinktheir property is not exposed to the risk of loss caused by an earthquake or because they expect thatfederal disaster relief would cover losses. Given the choice of a homeowners policy that excluded theearthquake peril and one that included earthquake coverage but cost $50 more per year, they wouldchoose the former. Thus, to keep the price of their homeowners policies competitive, insurers excludethe earthquake peril. It is excluded also because it is an extraordinary peril that cannot easily be in-cluded with the other perils covered by the policy. It must be rated separately.
As noted above, perils, such as those associated with war, are excluded because commercial in-surers consider them uninsurable. Nuclear energy perils, such as radiation, are excluded from mostpolicies because of the catastrophic exposure. Losses to homeowners caused by the nuclear meltdown
200 RISK MANAGEMENT FOR ENTERPRISES AND INDIVIDUALS
conditions
Clauses in a policy thatenumerate the duties of theparties to the contract and, insome cases, define the termsused.
at Three Mile Island in 1979, which forced homeowners to evacuate the damaged property in the area,were not covered by their homeowners insurance. Losses due to floods are excluded and were a topic ofmuch discussion after hurricanes Katrina and Rita. Losses due to wear and tear are excluded becausethey are inevitable rather than accidental and thus not insurable. Similarly, inherent vice, which refersto losses caused by characteristics of the insured property, is excluded. For example, certain products,such as tires and various kinds of raw materials, deteriorate with time. Such losses are not accidentaland are, therefore, uninsurable.
Excluded Property
Some property is excluded because it is insurable under other policies. Homeowners policies, as previ-ously stated, exclude automobiles because they are better insured under automobile policies. Otherproperty is excluded because the coverage is not needed by the average insured, who would, therefore,not want to pay for it.
Liability policies usually exclude damage to or loss of others’ property in the care, custody, or con-trol of the insured because property insurance can provide protection for the owner against lossescaused by fire or other perils. Other possible losses, such as damage to clothing being dry cleaned, areviewed as a business risk involving the skill of the dry cleaner. Insurers do not want to assume the riskof losses caused by poor workmanship or poor management.
Excluded Losses
Losses resulting from ordinance or law—such as those regulating construction or repair—are excludedfrom most property insurance contracts. Policies that cover only direct physical damage exclude loss ofuse or income resulting from such damage. Likewise, policies covering only loss of use exclude directlosses. Health insurance policies often exclude losses (expenses) considered by the insurer to be unne-cessary, such as the added cost of a private room or the cost of elective surgery.
3.4 ConditionsThe fourth major part of an insurance contract is the conditions section. Conditions enumerate theduties of the parties to the contract and, in some cases, define the terms used. Some policies list themunder the heading “Conditions,” while others do not identify them as such. Wherever the conditionsare stated, you must be aware of them. You cannot expect the insurer to fulfill its part of the contractunless you fulfill the conditions. Remember that acceptance of these conditions is part of the considera-tion given by the insured at the inception of an insurance contract. Failure to accept conditions may re-lease the insurer from its obligations. Many conditions found in insurance contracts are common to all.Others are characteristic of only certain types of contracts. Some examples follow.
Notice and Proof of Loss
All policies require that the insurer be notified when the event, accident, or loss insured against occurs.The time within which notice must be filed and the manner of making it vary. The homeowners policy,for example, lists as one of the insured’s duties after loss to “give immediate notice to us or our agent”and to file proof of loss within sixty days. A typical life insurance policy says that payment will be made“upon receipt…of proof of death of the insured.” A health policy requires that “written proof of lossmust be furnished to the Company within twelve months of the date the expense was incurred.” Thepersonal auto policy says, “We must be notified promptly of how, when, and where the accident or losshappened.”
In some cases, if notice is not made within a reasonable time after the loss or accident, the insureris relieved of all liability under the contract. A beneficiary who filed for benefits under an accidentaldeath policy more than two years after the insured’s death was held in one case to have violated the no-tice requirement of the policy.[5] The insurer is entitled to such timely notice so it can investigate thefacts of the case. Insureds who fail to fulfill this condition may find themselves without protectionwhen they need it most—after a loss.
CHAPTER 9 STRUCTURE AND ANALYSIS OF INSURANCE CONTRACTS 201
suspension of coverage
Release of the insurer fromliability.
voidance of coverage
Termination of coverageunder an insurance policy.
Suspension of Coverage
Because there are some risks or hazardous situations insurers want to avoid, many policies specify acts,conditions, or circumstances that will cause the suspension of coverage or, in other words, that willrelease the insurer from liability. The effect is the same as if the policy were canceled or voided, butwhen a policy is suspended, the effect is only temporary. When a voidance of coverage is incurred inan insurance contract, coverage is terminated. Protection resumes only by agreement of the insuredand insurer. Suspension, in contrast, negates coverage as long as some condition exists. Once the con-dition is eliminated, protection immediately reverts without the need for a new agreement between theparties.
Some life and health policies have special clauses that suspend coverage for those in military ser-vice during wartime. When the war is over or the insured is no longer in military service, the suspen-sion is terminated and coverage is restored. The personal auto policy has an exclusion that is essentiallya suspension of coverage for damage to your auto. It provides that the insurer will not pay for loss toyour covered auto “while it is used to carry persons or property for a fee,” except for use in a share-the-expense car pool. The homeowners policy (form 3) suspends coverage for vandalism and maliciousmischief losses if the house has been vacant for more than thirty consecutive days. A property insur-ance policy may suspend coverage while there is “a substantial increase in hazard.”
You can easily overlook or misunderstand suspensions of coverage or releases from liability whenyou try to determine coverage provided by a policy. They may appear as either conditions or exclu-sions. Because their effect is much broader and less apparent than the exclusion of specified locations,perils, property, or losses, it is easy to underestimate their significance.
Cooperation of the Insured
All policies require your cooperation, in the sense that you must fulfill certain conditions before the in-surer will pay for losses. Because the investigation of an accident and defense of a suit against the in-sured are very difficult unless he or she will cooperate, liability policies have a specific provision requir-ing cooperation after a loss. The businessowners policy, for example, says, “The insured shall cooperatewith the Company, and upon the Company’s request, assist in…making of settlements; conducting ofsuits….”
It is not unusual for the insured to be somewhat sympathetic toward the claimant in a liabilitycase, especially if the claimant is a friend. There have been situations in which the insured was soanxious for the claimant to get a large settlement from the insurer that the duty to cooperate was for-gotten. If you do not meet this condition and the insurer can prove it, you may end up paying for theloss yourself. This is illustrated by the case of a mother who was a passenger in her son’s automobilewhen it was involved in an accident in which she was injured. He encouraged and aided her in bringingsuit against him. The insurer was released from its obligations under the liability policy, on the groundsthat the cooperation clause was breached.[6] The purpose of the cooperation clause is to force insuredsto perform the way they would if they did not have insurance.
Protection of Property after Loss
Most property insurance policies contain provisions requiring the insured to protect the property aftera loss in order to reduce the loss as much as possible. An insured who wrecks his or her automobile, forexample, has the responsibility for having it towed to a garage for safekeeping. In the case of a fire loss,the insured is expected to protect undamaged property from the weather and other perils in order toreduce the loss. You cannot be careless and irresponsible just because you have insurance. Yet the re-quirement is only that the insured be reasonable. You are not required to put yourself in danger or totake extraordinary steps. Of course, views of what is extraordinary may differ.
Examination
A provision peculiar to some disability income policies gives the insurer the right to have its physicianexamine the insured periodically during the time he or she receives benefits under the policy. This rightcannot be used to harass the claimant, but the insurer is entitled to check occasionally to see if he or sheshould continue to receive benefits. Property insurance policies have a provision that requires theclaimant to submit to examination under oath, as well as make records and property available for ex-amination by representatives of the insurance company.
202 RISK MANAGEMENT FOR ENTERPRISES AND INDIVIDUALS
rider
Attachment to a life/healthinsurance policy that changesthe terms of the policy.
endorsement
Attachment to a theproperty/casualty insurancepolicy that changes the termsof the policy.
3.5 Endorsements and RidersSometimes (maybe often), but not always, an insurance policy will include a fifth major part: the at-tachment of endorsements or riders. Riders and endorsements are two terms with the same meaning.Riders are used with life/health policies, whereas endorsements are used with property/casualtypolicies. A rider makes a change in the life/health insurance policy to which it is attached; an en-dorsement makes a change in the property/casualty insurance policy to which it is attached. It mayincrease or decrease the coverage, change the premium, correct a statement, or make any number ofother changes.
The endorsement guaranteeing home replacement cost, for example, provides replacement costcoverage for a dwelling insured by a homeowners policy, regardless of the limit of liability shown in thedeclarations. This keeps the amount of insurance on the dwelling up-to-date during the term of thepolicy. A waiver of premium rider increases the benefits of a life insurance policy by providing for con-tinued coverage without continued payment of premiums if the insured becomes totally disabled. En-dorsements and riders are not easier to read than the policies to which they are attached. Actually, theway some of them are glued or stapled to the policy may discourage you from looking at them. Never-theless, they are an integral part of the contract you have with the insurer and cannot be ignored. Whentheir wording conflicts with that in exclusions or other parts of the contract, the rider or endorsementtakes precedence, negating the conflict.
Insurers continually add and change endorsements and riders to the policies as market conditionschange and the needs are altered. For example, the commercial insurance units of Travelers Indemnityand Aetna Casualty and Surety provided an endorsement to protect contractors against third-partybodily injury and property damage claims arising out of accidental releases of pollutants they bring tojob sites.[7] Some features included were no time limits, full policy limits, and defense cost in additionto the basic full limits.
An example of a rider to life insurance policies is the estate tax repeal rider. This rider, which ex-emplifies the need to modify policies as tax laws change, was created in response to the EconomicGrowth and Tax Relief Reconciliation Act of 2001 (EGTRRA 2001). Under this act, the federal estatetax will be phased out completely by 2010 but would return in 2011 unless Congress votes to eliminateit. If Congress eliminates the tax, the rider would let holders of the affected policies surrender thepolicies without paying surrender charges.[8]
Another example of a rider relates to long-term care (LTC) insurance (discussed in Chapter 2).Most long-term care policies include a rider offering some sort of inflation protection, generally 5 per-cent annually.[9]
K E Y T A K E A W A Y S
In this section you studied the five basic parts of insurance contracts:
< Declarations—specify periods of coverage, place limitations on liability, and stipulate the insured’s lossretention provisions
< Insuring agreement—statement of general promise made to the insured; determines whether policycovers named-perils or open-perils; provides exposures to be covered and types of losses
< Exclusions—state what losses/causes of loss the policy does not cover because of limitations on locations,perils, property, and losses
< Conditions—define the duties of the parties to the contract; notice and proof of loss mandates,suspension of coverage triggers, cooperation of the insured requirement, protection of property after lossmeasures, and physical examination right
< Endorsements and riders—optional elements that change the terms of property/casualty and life/healthpolicies; take precedence when they conflict with other parts of the contract
CHAPTER 9 STRUCTURE AND ANALYSIS OF INSURANCE CONTRACTS 203
D I S C U S S I O N Q U E S T I O N S
1. What are the main reasons for exclusions and for endorsements and riders in insurance policies?
2. What is the significance of an open-perils policy? In deciding between a named-perils policy and an open-perils policy, what factors would you consider? Define both terms and explain your answer.
3. In Chapter 1 on automobile insurance, you will find that portable stereos and tape decks are excludedfrom coverage. What do you think the insurance company’s rationale is for such an exclusion? What areother reasons for insurance policy exclusions? Give examples of each.
4. Lightning struck a tree in the Gibsons’ yard, causing it to fall over and smash the bay window in their livingroom. The Gibsons were so distraught by the damage that they decided to go out for dinner to calmthemselves. After dinner, the Gibsons decided to take in a movie. When they returned home, theydiscovered that someone had walked through their broken bay window and stolen many of their valuablepossessions. The Gibsons have a homeowners policy that covers both physical damage and theft. As theGibsons’ insurer, do you cover all their incurred losses? Why or why not?
5. Your careless driving results in serious injury to Linda Helsing, a close personal friend. Because she knowsyou have liability insurance and the insurer will pay for damages on your behalf, she files suit against you.Would it be unreasonable for your insurer to expect you not to help Linda pursue maximum recovery inevery conceivable way? Explain.
4. REVIEW AND PRACTICE1. Describe a few exclusions and a few endorsements and riders.2. Joe Phelps is a chemistry aficionado. For his twenty-ninth birthday last month, Joe’s wife bought
him an elaborate chemistry set to use in their attached garage. The set includes dangerous(flammable) substances, yet Joe does not notify his homeowner’s insurer. What problem mightJoe encounter?
3. Joe has another insurance problem. He had an automobile accident last month in which henegligently hit another motorist while turning right on red. The damage was minor, so Joe justpaid the other motorist for the repairs. Fearing the increase in his auto insurance premiums, Joedid not notify his insurer of the accident. Now the other motorist is suing for whiplash. What isJoe’s problem, and why?
4. “A Federal Reserve Board survey showing that banks are still making commercial real estate loansfor ‘high profile’ properties does not tell the whole story of the impact of problems in theterrorism insurance market, insurance industry officials contend” (Steven Brostoff, “Loans StillComing Despite Terror Risks,” National Underwriter, Property & Casualty/Risk & BenefitsManagement Edition, June 3, 2002).
a. Relate this story to the terrorism exclusion information you found in this chapter.b. What is the actual problem?
5. “States approving terrorism exclusions for commercial property insurance are a help to theinsurance industry, but two critical exposures aren’t excluded from terrorism—workers’compensation and fire following a terrorist event” (“Even with Exclusions, Insurers Still Exposedto Workers’ Comp, Fire Losses,” Best’s Insurance News, January 10, 2002.) What can be theimpact on insurers’ bottom line when such exclusions are not adopted?
6. Kevin Kaiser just replaced his old car with a new one and is ready to drive the new car off the lot.He did not have collision insurance on the old car, but he wants some on the new one. He callshis friend Dana Goldman, who is an insurance agent. “Give me the works, Dana. I want the bestcollision coverage you have.” Soon after he drives the car away from the lot, he is struck by aneighteen-wheeler and the new car is totaled.
Kevin then discovers that he has collision insurance with a $500 deductible, which he mustpay. He is upset because to him “the works” meant full insurance for all losses he might have dueto collision. Dana had thought that he wanted more cost-efficient coverage and had used thedeductible to lower the premium. The applicable state law and insurer underwriting practicesallow deductibles as low as $250, although they can be much higher.
a. Kevin wants to take Dana to court to collect the full value of the auto. What would youadvise him?
b. What does this tell you about oral contracts?7. What are the shortcomings of limited-peril health insurance policies, such as coverage for loss
caused solely by cancer, from a personal risk management point of view?
204 RISK MANAGEMENT FOR ENTERPRISES AND INDIVIDUALS
8. A. J. Jackson was very pleased to hear the agent say that she was covered the moment she finishedcompleting the application and paid the agent the first month’s premium for health insurance. A.J. had had some health problems previously and really didn’t expect to be covered until after shehad taken her physical and received notice from the company. The agent said that the conditionalbinder was critical for immediate coverage. “Of course,” said the agent, “this coverage may belimited until the company either accepts or rejects your application.” The agent congratulated A.J. again for her decision. A. J. began to wonder the next morning exactly what kind of coverage, ifany, she had.
a. What kind of coverage did A. J. have?b. Did her submission to the agent of the first month’s premium have any impact on her
coverage? Why?c. If you were the agent, how would you have explained this coverage to A. J.?
9. LeRoy Leetch had a heck of a year. He suffered all the following losses. Based on what you knowabout insurance, which would you expect to be insurable and why?
a. LeRoy’s beloved puppy, Winchester, was killed when struck by a school bus. He haslosses of burial expenses, the price of another puppy, and his grief due to Winchester’sdeath.
b. LeRoy has an expensive collection of rare clocks. Most are kept in his spare bedroom andwere damaged when a fire ignited due to faulty wiring. The loss is valued at $15,000.
c. Heavy snowfall and a rapid thaw caused flooding in LeRoy’s town. Damage to hisbasement was valued at $2,200.
d. Weather was hard on the exterior of LeRoy’s house as well. Dry rot led to major damageto the first-story hardwood floors. Replacement will cost $6,500.
10. When you apply for a life insurance policy, agent Dawn Gale says, “If you will give me your checkfor the first month’s premium now, the policy will cover you now if you are insurable.” Is this acorrect statement, or is Dawn just in a hurry to get her commission for selling you the policy?Explain.
CHAPTER 9 STRUCTURE AND ANALYSIS OF INSURANCE CONTRACTS 205

1.
2.
3.
4.
5.6.7.
8.
9.
ENDNOTES
In a few states, the conditional receipt is construed to be the same as the binding re-ceipt. See William F. Meyer, Life and Health Insurance Law: A Summary, 2nd ed.(Cincinnati: International Claim Association, 1990), 196–217.
“9/11 Business Interruption Claims Analysis,” National Underwriter Online News Service,February 20, 2002.
Diana Reitz, “9/11 Spotlights Business Interruption Threat—What Is the Art andScience of Establishing the Accurate Limit of Coverage?” National Underwriter, Prop-erty/Casualty Edition, April 16, 2004,http://www.propertyandcasualtyinsurancenews.com/cms/NUPC/Weekly%20Issues/Issues/2004/15/p15911spotlights?searchfor= (accessed March 8, 2009).
In April 1992, part of Chicago’s underground tunnel system was flooded when theriver pushed back a wall far enough to cause a rapid flow of water into the tunnels.Water levels rose high enough to damage stored property, force electrical suppliesto be shut off, and cause concern about the stability of structures built above thetunnels.
Thomas v. Transamerica Occidental Life Ins. Co., 761 F. Supp. 709 (1991).
Beauregard v. Beauregard, 56 Ohio App. 158, 10 N.E.2d 227 (1937).
“Travelers Construction Offers New Pollution Endorsements,” National Underwriter,Property & Casualty/Risk & Benefits Management Edition, March 10, 1997.
“Hartford Introduces Estate-Tax Repeal Rider,” National Underwriter Online News Ser-vice, April 1, 2002; “Lincoln Life Expands Estate Tax Safety Net on Life Insurance” Na-tional Underwriter Online News Service, Oct. 12, 2001.
Jack Crawford, “Inflation Protection: Is the LTC Industry on the Right Path?” NationalUnderwriter, Life & Health/Financial Services Edition, January 21, 2002.
206 RISK MANAGEMENT FOR ENTERPRISES AND INDIVIDUALS
C H A P T E R 1 0Property Risk ManagementAt this point you should feel somewhat comfortable with most of the overall picture of risk, but despite the many
examples of risk management and types of coverage you have seen, the details of each coverage are not explicit
yet. In this chapter, we will elaborate on property risks, including electronic commerce, or e-commerce, risk and
global risk exposures. In Chapter 11, we will elaborate on liability risks overall and the particulars of e-commerce
liability. Home coverage that includes both property and liability coverage will be discussed in detail in Chapter 1.
Auto coverage will be discussed in Chapter 1. [MISSING REF: #baranoff-ch13] and [MISSING REF: #baranoff-ch14]
focus on personal lines coverage. Chapter 12 and Chapter 14 take us into the world of commercial lines coverage
and workers’ compensation. In this part of the text, you will be asked to relate sections of the actual policies
provided in the appendixes at the end of the textbook to loss events. Our work will clarify many areas of property
and liability of various risks, including the most recent e-commerce risk exposures and the fundamental global risk
exposure. In this chapter, we cover the following:
1. Links
2. Property risks
3. E-commerce property risks
4. Global risks
1. LINKSThe most important part of property coverage is that you, as the first party, are eligible to receive be-nefits in the event you or your business suffers a loss. In contrast, liability coverage, discussed inChapter 11, pays benefits to a third party if you cause a loss (or if someone causes you to have a loss, hisor her liability insurance would pay benefits to you). In this chapter we focus on the first type: coveragefor you when your property is damaged or lost.
In personal lines coverage such as homeowners and auto policies, the property coverage for lossesyou sustain, as the owner of the property, is only part of the policies. In commercial lines, you may usea packaged multilines policy that includes both commercial property and commercial general liabilitypolicies. In this chapter we focus only on the part of the policies relating to the property coverage forfirst-party damages to you. As part of your holistic risk and risk management, it is important to have anappreciation of this part of the coverage.
As we develop the holistic risk management program, you now realize that you need a myriad ofpolicies to cover all your property exposures, including that of e-commerce, and another myriad ofpolicies to protect your liability exposures. In some cases, property and liability coverages are packagedtogether, such as in homeowners and auto policies, but what is actually covered under each? Our ob-jective is to untangle it all and show how to achieve a complete risk management picture. To achievecomplete holistic risk management, we have to put together a hierarchy of coverages for various expos-ures, perils, and hazards—each may appear in one or another policy—as shown in Figure 10.1 (see theshaded risk pieces of the puzzle that indicate property or first-party-type risks applicable to thischapter). In addition to understanding this hierarchy, we need to have a vision of the future. E-com-merce risk, considered one of the emerging risks, is explored in this chapter. Hazards derived fromglobal exposure are other important risks that receive special attention in this chapter.
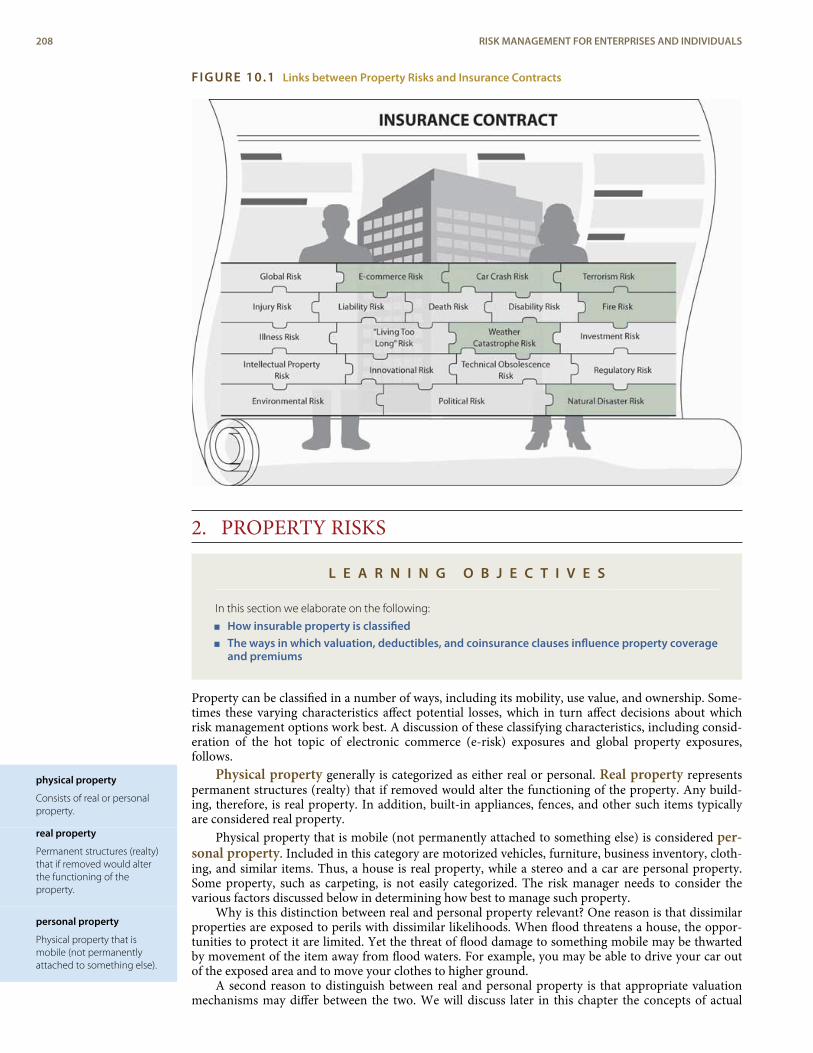
physical property
Consists of real or personalproperty.
real property
Permanent structures (realty)that if removed would alterthe functioning of theproperty.
personal property
Physical property that ismobile (not permanentlyattached to something else).
FIGURE 10.1 Links between Property Risks and Insurance Contracts
2. PROPERTY RISKS
L E A R N I N G O B J E C T I V E S
In this section we elaborate on the following:
< How insurable property is classified< The ways in which valuation, deductibles, and coinsurance clauses influence property coverage
and premiums
Property can be classified in a number of ways, including its mobility, use value, and ownership. Some-times these varying characteristics affect potential losses, which in turn affect decisions about whichrisk management options work best. A discussion of these classifying characteristics, including consid-eration of the hot topic of electronic commerce (e-risk) exposures and global property exposures,follows.
Physical property generally is categorized as either real or personal. Real property representspermanent structures (realty) that if removed would alter the functioning of the property. Any build-ing, therefore, is real property. In addition, built-in appliances, fences, and other such items typicallyare considered real property.
Physical property that is mobile (not permanently attached to something else) is considered per-sonal property. Included in this category are motorized vehicles, furniture, business inventory, cloth-ing, and similar items. Thus, a house is real property, while a stereo and a car are personal property.Some property, such as carpeting, is not easily categorized. The risk manager needs to consider thevarious factors discussed below in determining how best to manage such property.
Why is this distinction between real and personal property relevant? One reason is that dissimilarproperties are exposed to perils with dissimilar likelihoods. When flood threatens a house, the oppor-tunities to protect it are limited. Yet the threat of flood damage to something mobile may be thwartedby movement of the item away from flood waters. For example, you may be able to drive your car outof the exposed area and to move your clothes to higher ground.
A second reason to distinguish between real and personal property is that appropriate valuationmechanisms may differ between the two. We will discuss later in this chapter the concepts of actual
208 RISK MANAGEMENT FOR ENTERPRISES AND INDIVIDUALS
standard fire policy (SFP)
The generally acceptedmethod of insuring againstproperty loss due to fire untilbeing replaced byhomeowners policies andcommercial insuranceoptions.
cash value and replacement cost new. Because of moral hazard issues, an insurer may prefer to valuepersonal property at actual cash value (a depreciated amount). The amount of depreciation on realproperty, however, may outweigh concerns about moral hazard. Because of the distinction, valuationoften varies between personal and real property.
When property is physically damaged or lost, the cost associated with being unable to use thatproperty may go beyond the physical loss. Indirect loss and business interruption losses discussed inthe box “Business Interruption with and without Direct Physical Loss” provides a glimpse into the im-pact of this coverage on businesses and the importance of the appropriate wording in the policies. Inmany cases, only loss of use of property that is directly damaged leads to coverage; in other cases, theloss of property itself is not a prerequisite to trigger loss of use coverage. As a student in this field, youwill become aware of the importance of the exact meaning of the words in the insurance policy.
2.1 General Property CoverageThe first standard fire policy (SFP) came into effect during the late 1800s and came to be describedas the generally accepted manner of underwriting for property loss due to fire. Two revisions of the SFPwere made in 1918 and 1943. Most recently, the SFP has largely been removed from circulation, re-placed by homeowners policies for residential property owners, discussed in Chapter 1, and the com-mercial package policy (CPP), featured in Chapter 1. The SFP was simple and relatively clear. Most ofits original provisions are still found in current policies, updated for the needs of today’s insured. Inlight of the changes regarding terrorism exclusion that occurred after September 11, 2001 (discussed inChapter 1), the topic of standard fire policies came under review. The issue at hand is that, under cur-rent laws, standard fire policies cannot exclude fires resulting from terrorism or nuclear attacks withoutlegislative intervention.[1]
Business Interruption with and without Direct Physical Loss
When there is a direct physical loss, insurance coverage for business interruption is more likely to exist thanwhen the interruption is not from direct physical loss. The New Orleans hotels that suffered damage due toflooding and wind caused by Hurricane Katrina on August 30, 2005, are more likely to have had business inter-ruption coverage. The oil industry, including its refineries and rigs that were shut down as both hurricanes Kat-rina and Rita ripped through the Gulf Coast, also had insurance coverage for business interruption. The stop inoil production was associated with a physical loss. Not all business interruptions are covered by insurance. Theeconomic losses suffered by many New York businesses during the New York City transportation strike ofDecember 2005 were not a direct loss from physical damage. As such, these businesses did not have insur-ance to cover the losses. Nonrelated causes of loss that affect the continued viability of businesses usually donot have insurance remedies. The avian flu pandemic is expected to disrupt many businesses’ activities indir-ectly. Employees are expected to be afraid to show up for work, and some industries—such as shipping—willbe vulnerable. A key problem in these cases would be lack of insurance coverage.
In the past, some policyholders submitted business-interruption claims for nondirect economic loss. Theywere not successful in court. A case in point is the lawsuit filed in August 2002 by the luxury hotel chainWyndham International against half a dozen of its insurers and the brokerage firm Marsh & McLennan.Wyndham claimed that it had suffered $44 million in lost revenue following the terrorist acts of September 11,2001, and that the insurers had acted in bad faith in failing to pay the corporation’s business-interruptionclaims. The Wyndham properties that reported September 11-related losses included hotels in Chicago andPhiladelphia and three Puerto Rico beach resorts. Wyndham owns no properties in downtown New York City.
September 11 was the wake-up call. It’s estimated that some $10 billion in claims have been filed for business-interruption losses, much of them far away from Ground Zero. With the Federal Aviation Administra-tion—ordered closing of airports nationwide, the travel industry bore major losses. Resort hotels likeWyndham’s saw business fall dramatically.
Are losses recoverable if the business sustained no physical damage? It depends, of course, on the policy. Mostsmall and midsize businesses have commercial policies based on standard forms developed by the InsuranceServices Office (ISO). The ISO’s customary phrase is that the suspension of business to which the income lossrelates must be caused by “direct physical loss of or damage to property at the premises described in the De-clarations.” Larger companies often have custom-written manuscript policies that may not be so restrictive.Whatever the wording is, it is likely to be debated in court.
Sources: Michael Bradford, “Hotels Start Recovery Efforts in Wake of Katrina Losses” Business Insurance, October 10, 2005, accessed March 15, 2009,http://www.businessinsurance.com/cgi-bin/article.pl?articleId=17714&a=a&bt=Hotels+Start+Recovery+Efforts; Michael Bradford, “Storms SlapEnergy Sector with Losses as High as $8 Billion,” Business Insurance, October 3, 2005, accessed March 15, 2009, http://www.businessinsurance.com/cgi-bin/article.pl?articleId=17640&a=a&bt=storms+slap+energy; Daniel Hays, “No Coverage Likely for N.Y. Transit Strike,” National Underwriter OnlineNews Service, December 20, 2005, accessed March 15, 2009, http://www.propertyandcasualtyinsurancenews.com/cms/NUPC/Breaking%20News/
CHAPTER 10 PROPERTY RISK MANAGEMENT 209
2005/12/20-STRIKE-dh?searchfor=transit%20strike; Mark E. Ruquet, “Business Policies May Not Cover Pandemics,” National Underwriter Online NewsService, December 7, 2005, accessed March 15, 2009, http://www.propertyandcasualtyinsurancenews.com/cms/NUPC/Breaking%20News/2005/12/07-PANDEMIC-mr?searchfor= policies%20may%20not%20cover%20pandemics; Mark Ruquet, “Avian Flu Could Send Shipping Off Course,” NationalUnderwriter Online News Service, December 12,2005, accessed March 15, 2009, http://www.propertyandcasualtyinsurancenews.com/cms/NUPC/Breaking%20News/2005/12/12-AVIAN-AON-mr?searchfor=avian%20flu; Sam Friedman, “9/11 Boosts Focus on Interruption Risks,” NationalUnderwriter, Property & Casualty/Risk & Benefits Management Edition, April 29, 2002; Joseph B. Treaster, “Insurers Reluctant to Pay Claims Far Afieldfrom Ground Zero,” New York Times, September 12, 2002; John Foster, “The Legal Aftermath of September 11: Handling Attrition and Cancellation inUncertain Times,” Convene, the Journal of the Professional Convention Management Association, December 2001; Daniel Hays, “Zurich Loses Ruling ina 9/11 Case,” National Underwriter Online News Service, February 11, 2005, accessed March 15, 2009,http://www.propertyandcasualtyinsurancenews.com/cms/NUPC/Breaking%20News/2005/02/11-Zurich%20Loses%20Ruling%20In%20A%209-11%20Case?searchfor=.
From Coast to Coast: Who Is Responsible for Earthquake and Flood Losses?
No region of the United States is safe from environmental catastrophes. Floods and flash floods, the mostcommon of all natural disasters, occur in every state. The Midwest’s designated Tornado Alley ranges fromTexas to the Dakotas, though twisters feel free to land just about anywhere. The Pacific Rim states of Hawaii,Alaska, Washington, Oregon, and California are hosts to volcanic activity, most famously the May 1980 erup-tion of Mount St. Helens in southwestern Washington, which took the lives of more than fifty-eight people.California is also home to the San Andreas Fault, whose seismic movements have caused nine major earth-quakes in the past one hundred years; the January 1994 Northridge quake was the most costly in U.S. history,causing an estimated $20 billion in total property damage. (By comparison, the famous San Francisco earth-quake of 1906 caused direct losses of $24 million, which would be about $10 billion in today’s dollars.) Alongthe Gulf and Atlantic coasts, natural disaster means hurricanes. Insurers paid out more money for HurricaneKatrina in 2005 than they collected in premiums in twenty-five years from Louisiana insureds. California in-surers paid out more in Northridge claims than they had collected in earthquake premiums over the previousthirty years. The year 2005 saw an unprecedented number of losses because of hurricanes Katrina, Rita, andWilma. The record number of hurricanes included twenty-seven named storms. The insured losses from Hur-ricane Katrina alone were estimated between $40 and $60 billion, while the economic losses were estimatedto be more than $100 billion. Theses losses are the largest catastrophic losses in U.S. history, surpassing Hur-ricane Andrew’s record cost to the industry of $20.9 billion in 2004 dollars. This record also surpasses the worsthuman-made catastrophe of September 11, 2001, which stands at $34.7 billion in losses in 2004 dollars.
Fearing that the suffering housing, construction, and related industries would impair economic growth, stategovernment stepped in. The state-run California Earthquake Authority was established in 1996 to provide cov-erage to residential property owners in high-risk areas. Disaster insurance then went to the federal level. In theaftermath of Katrina, in December 2005, a proposal for a national catastrophe insurance program was pushedby four big state regulators during the National Insurance Commissioners meeting in Chicago. The idea was tochange the exclusion in the policies and allow for flood coverage, while calling for a private-state-federal part-nership to fund megacatastrophe losses and the creation of a new all-perils homeowners policy that wouldcover the cost of flood losses.
Questions for Discussion
1. Lee is in favor of government-supported disaster reinsurance because it encourages economicgrowth and development. Chris believes that it encourages overgrowth and overdevelopment inenvironmentally fragile areas. Whose argument do you support?
2. The Gulf Coast town you live in has passed a building code requiring that new beachfront propertybe built on stilts. If your house is destroyed by a hurricane, rebuilding it on stilts will cost an extra$25,000. The standard homeowners policy excludes costs caused by ordinance or laws regulating theconstruction of buildings. Is this fair? Who should pay the extra expense?
3. Jupiter Island, located off the coast of south Florida, is the wealthiest town in the country. Its 620year-round residents earn an average of just over $200,000 per year, per person. Thus, a typicalhousehold of two adults, two children, a housekeeper, a gardener/chauffeur, and a cook boasts anannual income of some $1.4 million. What is the reasoning for subsidizing hurricane insurance forresidents of Jupiter Island?
4. In light of your understanding of the uninsurable nature of catastrophes, who should bear thefinancial burden of natural disasters?
Sources: Insurance Information Institute at http://www.III.org; Steve Tuckey, “A National Cat Program? Insurers Have Doubts,” National UnderwriterOnline News Service, December 5, 2005, accessed March 15, 2009, http://www.propertyandcasualtyinsurancenews.com/cms/NUPC/Breaking%20News/2005/12/05-CAT-st?searchfor=national%20cat%20program; Mark E. Ruquet, “Towers Perrin: Katrina Loss $55 Billion,” NationalUnderwriter Online News Service, October 6, 2005, accessed March 15, 2009, http://www.propertyandcasualtyinsurancenews.com/cms/NUPC/Breaking%20News/2005/10/06-TOWERSP-mr?searchfor =towers%20perrin%20katrina; “Louisiana Hurricane Loss Cancels 25 Years of Premiums,”
210 RISK MANAGEMENT FOR ENTERPRISES AND INDIVIDUALS
replacement cost
Indemnification for aproperty loss with nodeduction for depreciation.
straight deductible
One that requires paymentfor all losses less than aspecified dollar amount.
franchise deductible
One that pays the entireamount in full once theamount of loss equals thedeductible.
National Underwriter, January 6, 2006, accessed March 15, 2009, http://www.propertyandcasualtyinsurancenews.com/cms/NUPC/Breaking%20News/2006/01/06-LAIII-ss?searchfor=louisiana%20hurricane; Insurance Information Institute, “Earthquakes: Risk and Insurance Issues,”May 2002, http://www.iii.org/media/hottopics/insurance/earthquake/; Jim Freer, “State to Help Those Seeking Property, Casualty Insurance,” TheSouth Florida Business Journal, March 15, 2002.
2.2 Types of Property Coverage and Determination of PaymentsOnce it is determined that a covered peril has caused a covered loss to covered property, several otherpolicy provisions are invoked to calculate the covered amount of compensation. As noted earlier, thetopic of covered perils is very important. Catastrophes such as earthquakes are not considered coveredperils for private insurance, but in many cases catastrophes such as hurricanes and other weather-re-lated catastrophes are covered. The box "From Coast to Coast: Who Is Responsible for Earthquake andFlood Losses?" is designed to stimulate discussions about the payment of losses caused by catastrophes.Important provisions in this calculation are the valuation clause, deductibles, and coinsurance.
Valuation Clause
The intent of insurance is to indemnify an insured. Payment on an actual cash value basis is most con-sistent with the indemnity principle, as discussed in Chapter 8. Yet the deduction of depreciation canbe both severe and misunderstood. In response, property insurers often offer coverage on a replace-ment cost new (RCN) basis, which does not deduct depreciation in valuing the loss. Rather, replace-ment cost new is the value of the lost or destroyed property if it were bought new or rebuilt on the dayof the loss.
Deductibles
The cost of insurance to cover frequent losses (as experienced by many property exposures) is high. Toalleviate the financial strain of frequent small losses, many insurance policies include a deductible. Adeductible requires the insured to bear some portion of a loss before the insurer is obligated to makeany payment. The purpose of deductibles is to reduce costs for the insurer, thus making lower premi-ums possible. The insurer saves in three ways. First, the insurer is not responsible for the entire loss. Se-cond, because most losses are small, the number of claims for loss payment is reduced, thereby redu-cing the claims processing costs. Third, the moral and morale hazards are lessened because there isgreater incentive to prevent loss when the insured bears part of the burden.[2]
The small, frequent losses associated with property exposures are good candidates for deductiblesbecause their frequency minimizes risk (the occurrence of a small loss is nearly certain) and their smallmagnitude makes retention affordable. The most common forms of deductibles in property insuranceare the following:
1. Straight deductible2. Franchise deductible3. Disappearing deductible
A straight deductible requires payment for all losses less than a specified dollar amount. For ex-ample, if you have a $200 deductible on the collision coverage part of your auto policy, you pay thetotal amount of any loss that does not exceed $200. In addition, you pay $200 of every loss in excess ofthat amount. If you have a loss of $800, therefore, you pay $200 and the insurer pays $600.
A franchise deductible is similar to a straight deductible, except that once the amount of lossequals the deductible, the entire loss is paid in full. This type of deductible is common in ocean marinecargo insurance, although it is stated as a percentage of the value insured rather than a dollar amount.The franchise deductible is also used in crop hail insurance, which provides that losses less than, for ex-ample, 5 percent of the crop are not paid, but when a loss exceeds that percentage, the entire loss ispaid.
The major disadvantage with the franchise deductible from the insurer’s point of view is that theinsured is encouraged to inflate a claim that falls just short of the amount of the deductible. If theclaims adjuster says that your crop loss is 4 percent, you may argue long and hard to get the estimateup to 5 percent. Because it invites moral hazard, a franchise deductible is appropriate only when the in-sured is unable to influence or control the amount of loss, such as in ocean marine cargo insurance.
CHAPTER 10 PROPERTY RISK MANAGEMENT 211
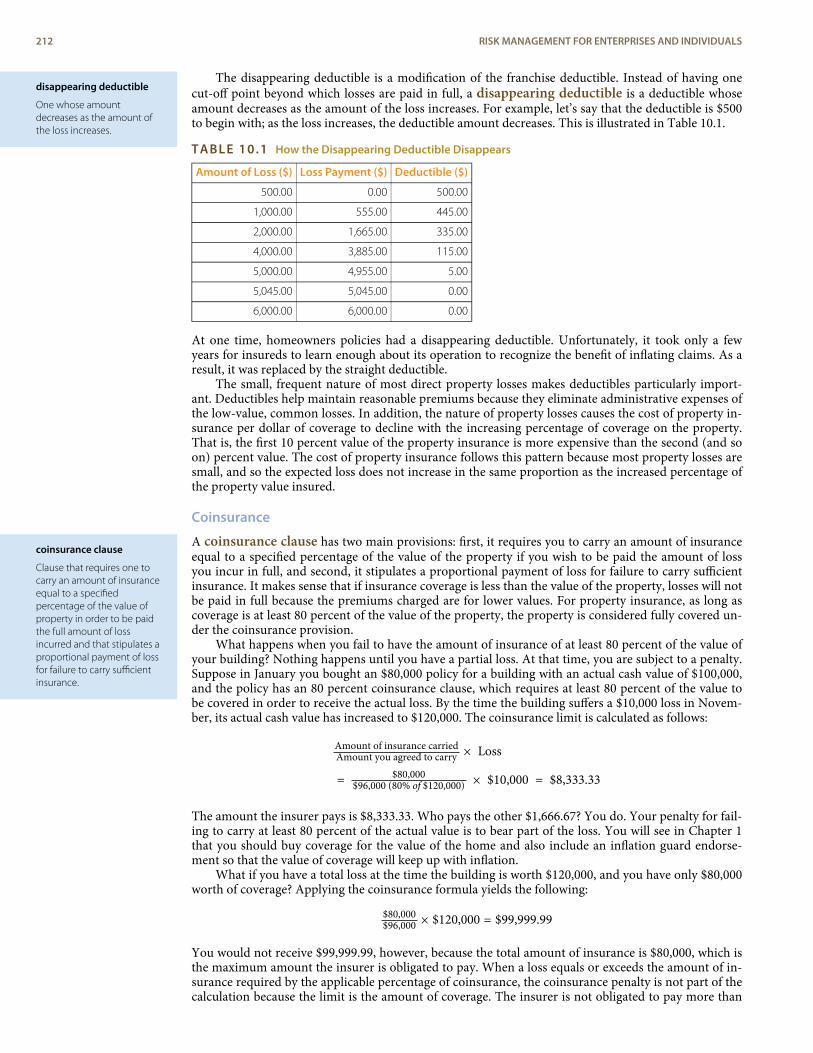
disappearing deductible
One whose amountdecreases as the amount ofthe loss increases.
coinsurance clause
Clause that requires one tocarry an amount of insuranceequal to a specifiedpercentage of the value ofproperty in order to be paidthe full amount of lossincurred and that stipulates aproportional payment of lossfor failure to carry sufficientinsurance.
The disappearing deductible is a modification of the franchise deductible. Instead of having onecut-off point beyond which losses are paid in full, a disappearing deductible is a deductible whoseamount decreases as the amount of the loss increases. For example, let’s say that the deductible is $500to begin with; as the loss increases, the deductible amount decreases. This is illustrated in Table 10.1.
TABLE 10.1 How the Disappearing Deductible Disappears
Amount of Loss ($) Loss Payment ($) Deductible ($)
500.00 0.00 500.00
1,000.00 555.00 445.00
2,000.00 1,665.00 335.00
4,000.00 3,885.00 115.00
5,000.00 4,955.00 5.00
5,045.00 5,045.00 0.00
6,000.00 6,000.00 0.00
At one time, homeowners policies had a disappearing deductible. Unfortunately, it took only a fewyears for insureds to learn enough about its operation to recognize the benefit of inflating claims. As aresult, it was replaced by the straight deductible.
The small, frequent nature of most direct property losses makes deductibles particularly import-ant. Deductibles help maintain reasonable premiums because they eliminate administrative expenses ofthe low-value, common losses. In addition, the nature of property losses causes the cost of property in-surance per dollar of coverage to decline with the increasing percentage of coverage on the property.That is, the first 10 percent value of the property insurance is more expensive than the second (and soon) percent value. The cost of property insurance follows this pattern because most property losses aresmall, and so the expected loss does not increase in the same proportion as the increased percentage ofthe property value insured.
Coinsurance
A coinsurance clause has two main provisions: first, it requires you to carry an amount of insuranceequal to a specified percentage of the value of the property if you wish to be paid the amount of lossyou incur in full, and second, it stipulates a proportional payment of loss for failure to carry sufficientinsurance. It makes sense that if insurance coverage is less than the value of the property, losses will notbe paid in full because the premiums charged are for lower values. For property insurance, as long ascoverage is at least 80 percent of the value of the property, the property is considered fully covered un-der the coinsurance provision.
What happens when you fail to have the amount of insurance of at least 80 percent of the value ofyour building? Nothing happens until you have a partial loss. At that time, you are subject to a penalty.Suppose in January you bought an $80,000 policy for a building with an actual cash value of $100,000,and the policy has an 80 percent coinsurance clause, which requires at least 80 percent of the value tobe covered in order to receive the actual loss. By the time the building suffers a $10,000 loss in Novem-ber, its actual cash value has increased to $120,000. The coinsurance limit is calculated as follows:
Amount of insurance carriedAmount you agreed to carry × Loss
= $80,000$96,000 (80% of $120,000) × $10,000 = $8,333.33
The amount the insurer pays is $8,333.33. Who pays the other $1,666.67? You do. Your penalty for fail-ing to carry at least 80 percent of the actual value is to bear part of the loss. You will see in Chapter 1that you should buy coverage for the value of the home and also include an inflation guard endorse-ment so that the value of coverage will keep up with inflation.
What if you have a total loss at the time the building is worth $120,000, and you have only $80,000worth of coverage? Applying the coinsurance formula yields the following:
$80,000$96,000 × $120,000 = $99,999.99
You would not receive $99,999.99, however, because the total amount of insurance is $80,000, which isthe maximum amount the insurer is obligated to pay. When a loss equals or exceeds the amount of in-surance required by the applicable percentage of coinsurance, the coinsurance penalty is not part of thecalculation because the limit is the amount of coverage. The insurer is not obligated to pay more than
212 RISK MANAGEMENT FOR ENTERPRISES AND INDIVIDUALS
e-commerce property risk
Business risk exposures dueto of the use of computers,the Internet, and the Web.
the face amount of insurance in any event because a typical policy specifies this amount as its maxim-um coverage responsibility.
You save money buying a policy with a coinsurance clause because the insurer charges a reducedpremium rate, but you assume a significant obligation. The requirement is applicable to values only atthe time of loss, and the insurer is not responsible for keeping you informed of value changes. That isyour responsibility.
K E Y T A K E A W A Y S
In this section you studied the general features of property coverage:
< Insurable property is classified as either real or personal property, and this classification affects theproperty’s exposure to risks and basis for valuation
< Coverage amounts depend on valuation as either actual cash value or replacement cost new
< The use of deductibles reduces the cost of claims, the frequency of claims, and moral hazard; commonforms of deductibles are straight, franchise, and disappearing
< A coinsurance clause requires insureds to carry an amount of insurance equal to a specified percentage ofthe value of the property in order to be paid the full amount of an incurred loss; otherwise insureds will besubject to penalty in the form of bearing a proportional amount of the loss
D I S C U S S I O N Q U E S T I O N S
1. What is the difference between real and personal property? Why do insurers make a distinction betweenthem?
2. What is a deductible? Provide illustrative examples of straight, franchise, and disappearing deductibles.
3. What is the purpose of coinsurance? How does the policyholder become a coinsurer? Under whatcircumstances does this occur?
3. E-COMMERCE PROPERTY RISKS
L E A R N I N G O B J E C T I V E S
In this section we elaborate on the following:
< The increased frequency and severity of e-commerce property risks< Five major categories of e-commerce property risks< Loss-control steps that can reduce e-commerce property risks< Availability of insurance as a means of transferring e-commerce property risks
This chapter, as noted above, introduces areas that are growing in importance in the world of insur-ance. Almost every home, family, and business has risk exposures because of the use of computers, theInternet, and the Web; we refer to this as e-commerce property risk. Think about your own coursesat the university. Each professor emphasizes his or her communication with you on the Web site forthe course. You use the Internet as a research tool. Every time you log on, you are exposed to risks fromcyberspace. Most familiar to you is the risk of viruses. But there are many additional risk exposuresfrom electronic business, both to you as an individual and to businesses. Businesses with a Web pres-ence are those that offer professional services online and/or online purchasing. Some businesses arebusiness to consumer (BTC); others are business to business (BTB).
Regardless of the nature of the use of the Internet, cyber attacks have become more frequent andhave resulted in large financial losses. According to the 2002 Computer Security Institute/Federal Bur-eau of Investigation (CSI/FBI) Computer Crime and Security Survey, Internet-related losses increasedfrom $100 million in 1997 to $456 million in 2002.[3] The 6th Annual CyberSource fraud survey indic-ated a $700 million increase (37 percent) in lost revenue in 2004, from an estimated $2.6 billion in2003. Small and medium businesses were hit the hardest. These losses are in line with fast revenuegrowth from e-commerce.[4]
Businesses today are becoming aware of their e-commerce risk exposures. In every forum of in-surers’ meetings and in every insurance media, e-risk exposure is discussed as one of the major “less
CHAPTER 10 PROPERTY RISK MANAGEMENT 213
e-commerce property risk
Business risk exposures dueto of the use of computers,the Internet, and the Web.
hackers
Virtual vandals who try topoke holes in a company’ssecurity network.
crackers
Vandals who want to break into a company’s securitynetwork and steal proprietaryinformation for personal gain.
insiders
Internal employees whovandalize a companybecause they are upset withit for some reason.
virus
Program or code thatreplicates itself inside apersonal computer or aworkstation with the intent todestroy an operating systemor control program.
understood” risk exposures.[5] In this chapter, we discuss the hazards and perils of e-commerce risk ex-posure to the business itself as the first party. In Chapter 11, we will discuss the liability side of the riskexposure of businesses due to the Internet and online connections. Next, we discuss the hazards andperils of electronic business in general.
3.1 Causes of Loss in E-CommerceThe 2004 CSI/FBI survey provided many categories of the causes of losses in the computer/electronicsystems area. By frequency, the 2004 order of causes of losses were: virus (78 percent); insider abuse ofnet access (59 percent); laptop/mobile thefts (49 percent); unauthorized access to information (39 per-cent); system penetration (37 percent); denial of service (17 percent); theft of proprietary information(10 percent); and sabotage, financial fraud, and telecom fraud (less than 10 percent). This list does notaccount for the severity of losses in 2004; however, the 269 respondents to this section of the survey re-ported losses reaching $141.5 million.
The 2004 CSI/FBI survey covered a wide spectrum of risk exposure in e-commerce, for both first-party (property and business interruption) and third-party (liability losses, covered in Chapter 11)losses. As you can see from this summary of the survey and other sources, the causes of e-commerceproperty risks are numerous. We can group these risks into five broad categories:
< Hardware and software thefts (information asset losses and corruption due to hackers,vandalism, and viruses)
< Technological changes< Regulatory and legal changes< Trademark infringements< Internet-based telephony crimes
Hardware and Software Thefts
Companies have rapidly become dependent on computers. When a company’s computer system isdown, regardless of the cause, the company risks losing weeks, months, or possibly years of data. Busi-nesses store the majority of their information on computers. Customer databases, contact information,supplier information, order forms, and almost all documents a company uses to conduct business arestored on the computer system. Losses from theft of proprietary information, sabotage of data net-works, or telecom eavesdropping can cause major losses to the infrastructure base of a business, wheth-er it is done by outside hackers or by insider disgruntled employees.
Hackers and crackers can cause expensive, if not fatal, damage to a company’s computer systems.Hackers are virtual vandals who try to poke holes in a company’s security network.[6] Hackers may besatisfied with defacing Web sites, while crackers are vandals who want to break in to a company’s se-curity network and steal proprietary information for personal gain. Potential terrorists are usuallyclassified as crackers. Their objective is to hit specific companies in order to bring systems down, stealdata, or modify data to destroy its integrity. Insiders are internal employees upset with the companyfor some reason, perhaps because of a layoff or a failure to get an expected promotion. Inside access tothe company computer network, and the knowledge of how to use it, gives this group the potential tocause the most damage to a business.
A virus is a program or code that replicates itself inside a personal computer or a workstation withthe intent to destroy an operating system or control program. When it replicates, it infects another pro-gram or document.[7]
Technological Changes
Another risk companies face in the cyber world is the rapid advancement of technology. When a com-pany updates its computer system, its software package, or the process for conducting business usingthe computer system, business is interrupted while employees learn how to conduct business using thenew system. The result of this downtime is lost revenue.
Regulatory and Legal Changes
Almost as quickly as the Internet is growing, the government is adding and changing applicable e-com-merce laws. In the past, there were few laws because the Internet was not fully explored nor fully un-derstood, but now, laws and regulations are mounting. Thus, companies engaged in e-commerce facelegal risks arising from governmental involvement. An example of a law that is likely to change is thetax-free Internet sale. There is no sales tax imposed on merchants (and hence the consumer) on
214 RISK MANAGEMENT FOR ENTERPRISES AND INDIVIDUALS
domain name hijacking
When an individual or abusiness reserves a domainname that uses thetrademark of a competitor.
cybersquatting
Seeking compensation forthe use of a registereddomain name from therightful trademark holder.
Web site hijacking
When a Web site operatorknowingly deceives the userby redirecting the user to asite the user did not intend toview.
Internet sales between states partly because the government has not yet determined how states shouldapportion the tax revenue. As the volume of online purchases increases, so do the consequences of lostsales tax revenue from e-commerce.
Lack of qualified lawyers to handle cases that arise out of e-commerce disputes is another new risk.There are many areas of e-law that lawyers are not yet specialized in. Not only are laws complex and te-dious, they are also changing rapidly. As a result, it is difficult for lawyers to stay abreast of each lawthat governs and regulates cyberspace.
Trademarks Infringements
Domain name disputes are a serious concern for many businesses. In most cases, disputes over therights to a domain name result from two specific events. Domain name hijacking occurs when anindividual or a business reserves a domain name that uses the trademark of a competitor. The otherevent arises when a business or an individual reserves the well-recognized name or trademark of an un-related company as a domain name with the intent of selling the domain name to the trademark hold-er. Seeking compensation for the use of a registered domain name from the rightful trademark holderis known as cybersquatting.[8]
A recent case involving cybersquatting is People for the Ethical Treatment of Animals v. Doughney.In August 2001, the Fourth Circuit Court of Appeals held that the defendant, Michael Doughney, wasguilty of service mark infringement and unfair competition, and had violated the Anti-CybersquattingConsumer Protection Act (ACPA). Doughney had created a Web site at http://www.peta.org, whichcontained the registered service mark PETA. People for the Ethical Treatment of Animals (PETA) is ananimal rights organization that opposes the exploitation of animals for food, clothing, entertainment,and vivisection. When users typed in http://www.peta.org, they expected to arrive at the site for Peoplefor the Ethical Treatment of Animals. Instead, they surprisingly arrived at People Eating Tasty Anim-als, a “resource for those who enjoy eating meat, wearing fur and leather, hunting, and the fruits of sci-entific research.” The site contained links to a number of organizations that held views generally op-posing those of PETA.[9] On two occasions, Doughney suggested that if PETA wanted one of his do-mains, or objected to his registration, it could “make me an offer” or “negotiate a settlement.”
Web site hijacking occurs when a Web site operator knowingly deceives the user by redirectingthe user to a site the user did not intend to view. A recent case, Ford Motor Company v. 2600 Enter-prises et al., caught attention in December 2001 when 2600 Enterprises automatically redirected usersfrom a Web site they operate at a domain name directing profanity at General Motors to the Web siteoperated by Ford at http://www.ford.com. The defendants redirected users by programming an embed-ded link, which utilized Ford’s mark, into the code of the defendants’ Web site.[10] Domain-namehijacking, cybersquatting, and Web site hijacking for the sake of parody or satire is protected by theFirst Amendment, but sometimes the pranksters’ only purpose is to harass or extract profit from thetrademark owner.[11]
Internet-Based Telephony Crimes
One of the fastest-growing communication technologies is Internet-based telephony—known as voice-over-Internet protocol (VoIP). The National Institute of Standards and Technology warned that thistechnology has “inherent vulnerabilities”[12] because firewalls are not designed to help in securing thisindustry, which is grew by $903 million in 2005, up from $686 million in 2004.
3.2 Risk Management of E-Commerce ExposuresBusinesses can take loss-control steps to reduce the e-commerce property and business interruptionrisks by using the following:
< Security products and processes< System audits< Antivirus protection< Backup systems and redundancies< Data protection and security< Passwords< Digital signatures< Encryption< Firewalls< Virtual private network (VPN)
CHAPTER 10 PROPERTY RISK MANAGEMENT 215
encryption
Allows the sender of ane-mail to scramble thecontents of the document.
firewall
Device that protects anetwork from intrusion bypreventing access unlesscertain criteria are met.
virtual private network(VPN)
Network that connectssatellite offices with a centrallocation and allows remoteusers to gain secure access toa corporate network.
Businesses today buy electronic security systems and develop many steps to reduce the risk of data andhardware losses. Firms conduct regular system audits to test for breaches in network security. Auditorsattempt to break into various components of the company computer system, including the operatingsystems, networks, databases, servers, Web servers, and business processes in general, to simulate at-tacks and discover weaknesses.[13] Managed security services provide an option for virus protection.They include both antivirus protection and firewall installation.
Regular system backup processes and off-site systems saved many businesses hurt by the Septem-ber 11 attacks. One advantage of keeping backup data files off-site is having clean data in case of dam-age in the original files from viruses, hackers, and crackers. Because security may be breached frompeople within the company, Internet access is generally available only to authorized internal and ex-ternal users via the use of passwords. E-mails are easy to intercept and read as they travel across the In-ternet. Attaching a digital signature allows the recipient to discern whether the document has beenaltered.[14] Another method to protect e-mails is encryption. Encryption allows the sender of an e-mail to scramble the contents of the document. Before the recipient can read the message, he or sheneeds to use a password for a private key. Encryption is used for confidential communications.
A firewall is another loss-control solution that protects the local area network (LAN) or corporatenetwork from unauthorized access. A firewall protects a network from intrusion by preventing accessunless certain criteria are met. Another loss-control technique is the virtual private network, whichconnects satellite offices with a central location. A virtual private network (VPN) allows remoteusers to gain secure access to a corporate network. VPNs provide endless opportunities for telecom-muters, business travelers, and multiple independent offices of a bigger company.
E-Commerce Property Insurance
According to the 2004 CSI/FBI Computer Crime and Security Survey described above, only 28 percentof 320 respondents had any external insurance policies to help manage cyber security risks. Traditionalproperty insurance covers physical damage to tangible property due to an insured peril. Electronic datacan be considered property in most instances, but standard commercial insurance policies, discussed inChapter 1, contain exclusions that “explicitly invalidate coverage for exposures in relation to the use oftechnology.”[15] Some insurers now offer customized e-commerce insurance policies that expand theareas of coverage available for e-commerce property risk. ISO has an e-commerce endorsement thatmodifies insurance provided under commercial property coverage. Under this endorsement,
insurers will pay for the cost to replace or restore electronic data which has suffered loss or damageby a Covered Cause of Loss…including the cost of data entry, re-programming and computerconsultation services.
The endorsement has four sections. Section I describes the electronic data coverage. Section IIdefines the period of coverage as well as the coverage of business income, extra expenses, and resump-tion of e-commerce activity. Section III classifies covered and excluded perils; exclusions include mech-anical breakdown; downtime due to viruses, unless the computer is equipped with antivirus software;errors or omissions in programming or data processing; errors in design, maintenance, or repair; dam-age to one computer on the network caused by repair or modification of any other computer on thenetwork; interruption as a result of insufficient capacity; and unexplained failure. Section IV of the en-dorsement is for other provisions, explained in Chapter 9.
In addition to this endorsement, a few insurers have created a variety of e-commerce policies.Some of the companies include ACE USA, Chubb, AIG, the Fidelity and Deposit Companies (membersof Zurich Financial Services Group), Gulf Insurance Group, Legion Indemnity Company, and Lloyd’sof London. This list is by no means inclusive.[16] These companies provide not only first-party e-com-merce property and business interruption coverage, but also liability coverage for third-party liabilityrisks. The liability coverage will be discussed in Chapter 11. Because e-commerce does not see geo-graphical boundaries, many policies provide worldwide e-commerce coverage.
216 RISK MANAGEMENT FOR ENTERPRISES AND INDIVIDUALS
global risk
The unique problems thatarise when companies crossnational borders.
political risk
Unanticipated political eventsthat disrupt the earning orprofit-making ability of anenterprise.
K E Y T A K E A W A Y S
In this section you studied the emerging exposure of e-commerce property risk:
< E-commerce property risks fall under five categories: hardware and software thefts, technological changes,regulatory and legal changes, trademark infringements, and Internet-based telephony crimes
< Cyber attacks have become more frequent and more costly in the financial losses they cause
< Hackers, crackers, insiders, and viruses are major causes of hardware and software theft and data losses
< Technological advancements cause downtime while employees learn how to use new systems andcomponents
< Frequent additions to and changes in existing e-commerce laws creates compliance risks and lack ofqualified lawyers to handle disputes.
< Domain name hijacking, cybersquatting, and Web site hijacking are all ways of infringing legitimatecompanies’ trademarks
< Voice-over-Internet protocol (VoIP) has inherent vulnerabilities due to the absence of effective securitymeasures
< Loss-control steps that can reduce e-commerce property risks include security products, system audits,backup systems, and data protection
< While electronic data is considered property, it is typically excluded from standard commercial insurancepolicies, thus leading to the rise of customized e-commerce policies and endorsements
D I S C U S S I O N Q U E S T I O N S
1. What are the risk exposures of e-commerce?
2. How should the property risk of e-commerce be managed?
3. Describe the parts of an e-commerce endorsement.
4. What are some of the potential e-commerce property losses that businesses face?
4. GLOBAL PROPERTY EXPOSURES
L E A R N I N G O B J E C T I V E S
In this section we elaborate on the following:
< Global risk exposures in the international competitive landscape< Risk control measures for reducing common global risks< Insurance options for global risk exposures
As with the Internet, global exposure is rapidly growing for many companies. This forces managementto think about the unique problems that arise when companies cross national borders, also known asglobal risk. Political Risk Services (http://www.prsonline.com/), an organization that ranks countriesfor their instability, attaches a major cost to each country. This highlights the importance of under-standing the countries that businesses decide to enter. In a survey conducted by the insurance brokerAon[17] of Fortune 1,000 companies in the United States, 26 percent of the respondents felt comfortablewith their political risk exposure and 29 percent felt comfortable with their global financial or econom-ic risk exposure. While most respondents felt comfortable with their property/casualty coverages, onlya small percentage felt comfortable with their political risk protection. The survey was conducted dur-ing May 2001, before the September 11 attack. In 2005, Aon provided a map of the political and eco-nomic risk around the world. The climate around the world has changed with the war in Iraq, a part ofthe world surrounded by major economic and political hot spots.
Political risk can be defined as unanticipated political events that disrupt the earning or profit-making ability of an enterprise. In “The Risk Report: Managing Political Risks,” insurance expert KevinM. Quinley describes some of the perils that can affect a global organization: nationalization, privatiza-tion, expropriation (property taken away by the host nation according to its laws), civil unrest, revolu-tion, foreign exchange restrictions, labor regulations, kidnapping, terrorism, seizure, and forfeiture.
CHAPTER 10 PROPERTY RISK MANAGEMENT 217
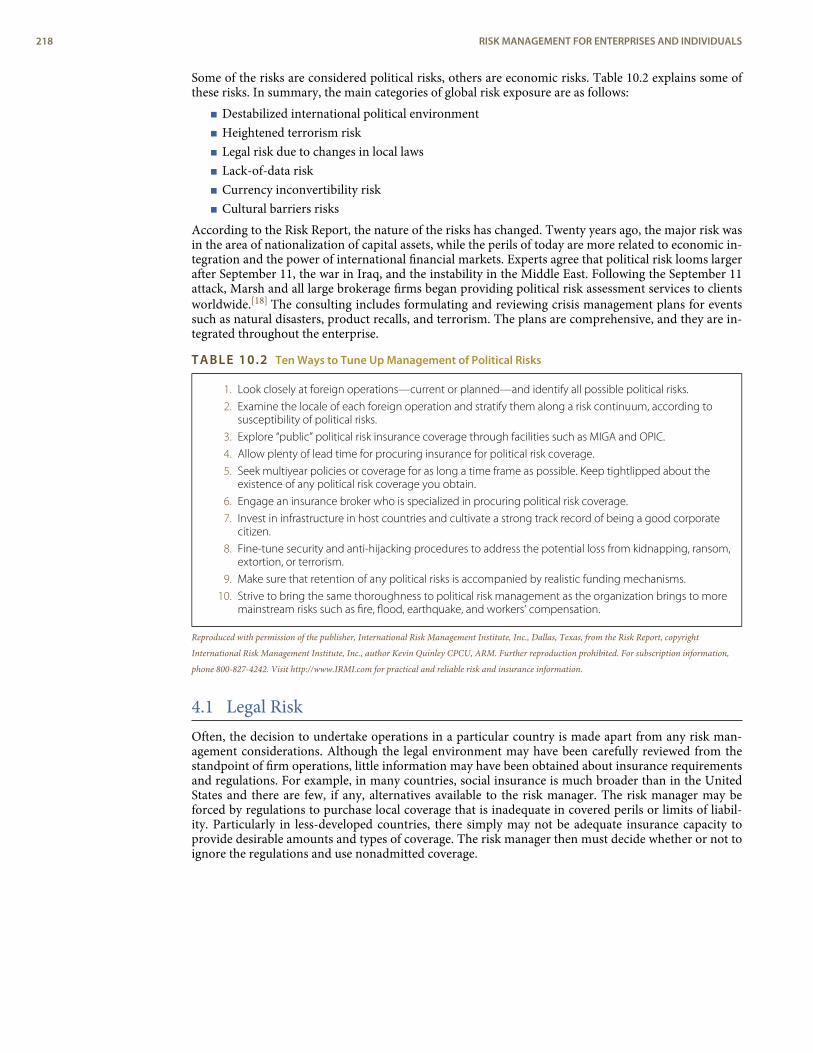
Some of the risks are considered political risks, others are economic risks. Table 10.2 explains some ofthese risks. In summary, the main categories of global risk exposure are as follows:
< Destabilized international political environment< Heightened terrorism risk< Legal risk due to changes in local laws< Lack-of-data risk< Currency inconvertibility risk< Cultural barriers risks
According to the Risk Report, the nature of the risks has changed. Twenty years ago, the major risk wasin the area of nationalization of capital assets, while the perils of today are more related to economic in-tegration and the power of international financial markets. Experts agree that political risk looms largerafter September 11, the war in Iraq, and the instability in the Middle East. Following the September 11attack, Marsh and all large brokerage firms began providing political risk assessment services to clientsworldwide.[18] The consulting includes formulating and reviewing crisis management plans for eventssuch as natural disasters, product recalls, and terrorism. The plans are comprehensive, and they are in-tegrated throughout the enterprise.
TABLE 10.2 Ten Ways to Tune Up Management of Political Risks
1. Look closely at foreign operations—current or planned—and identify all possible political risks.
2. Examine the locale of each foreign operation and stratify them along a risk continuum, according tosusceptibility of political risks.
3. Explore “public” political risk insurance coverage through facilities such as MIGA and OPIC.
4. Allow plenty of lead time for procuring insurance for political risk coverage.
5. Seek multiyear policies or coverage for as long a time frame as possible. Keep tightlipped about theexistence of any political risk coverage you obtain.
6. Engage an insurance broker who is specialized in procuring political risk coverage.
7. Invest in infrastructure in host countries and cultivate a strong track record of being a good corporatecitizen.
8. Fine-tune security and anti-hijacking procedures to address the potential loss from kidnapping, ransom,extortion, or terrorism.
9. Make sure that retention of any political risks is accompanied by realistic funding mechanisms.
10. Strive to bring the same thoroughness to political risk management as the organization brings to moremainstream risks such as fire, flood, earthquake, and workers’ compensation.
Reproduced with permission of the publisher, International Risk Management Institute, Inc., Dallas, Texas, from the Risk Report, copyright
International Risk Management Institute, Inc., author Kevin Quinley CPCU, ARM. Further reproduction prohibited. For subscription information,
phone 800-827-4242. Visit http://www.IRMI.com for practical and reliable risk and insurance information.
4.1 Legal RiskOften, the decision to undertake operations in a particular country is made apart from any risk man-agement considerations. Although the legal environment may have been carefully reviewed from thestandpoint of firm operations, little information may have been obtained about insurance requirementsand regulations. For example, in many countries, social insurance is much broader than in the UnitedStates and there are few, if any, alternatives available to the risk manager. The risk manager may beforced by regulations to purchase local coverage that is inadequate in covered perils or limits of liabil-ity. Particularly in less-developed countries, there simply may not be adequate insurance capacity toprovide desirable amounts and types of coverage. The risk manager then must decide whether or not toignore the regulations and use nonadmitted coverage.
218 RISK MANAGEMENT FOR ENTERPRISES AND INDIVIDUALS
nonadmitted coverage
Contracts issued by acompany not authorized towrite insurance in the countrywhere a risk exposure islocated.
admitted insurance
Contracts written bycompanies authorized towrite insurance in the countrywhere a risk exposure islocated.
Nonadmitted coverage involves contracts issued by a company not authorized to write insur-ance in the country where a risk exposure is located. Admitted insurance is written by companiesauthorized to write insurance in the country where a risk exposure is located. Nonadmitted contractshave advantages to some U.S. policyholders: they are written in English; use U.S. dollars for premiumsand claims, thus avoiding exchange rate risk; utilize terms and conditions familiar to U.S. risk man-agers; and provide flexibility in underwriting. However, such contracts may be illegal in some coun-tries, and the local subsidiary may be subject to penalties if the contracts’ existence becomes known.Further, premium payment may not be tax deductible, even in countries where nonadmitted coverageis permitted. If nonadmitted insurance is purchased where it is prohibited, claim payments must bemade to the parent corporation, which then has to find a way to transfer the funds to the localsubsidiary.
Coverage is also affected by the codification of the legal system in the other countries. The Napo-leonic code, for example, is used in France, Belgium, Egypt, Greece, Italy, Spain, and several othercountries. Under this legal system, liability for negligence is not treated in the same way as liability istreated under the United States system of common law; any negligence not specifically mentioned inthe code is dismissed. The common law system is based on legal precedence, and the judges play amuch more significant role.
4.2 Data RiskAnother problem facing the international risk manager is the collection of adequate statistical informa-tion. Economic and statistical data commonly available in the United States may simply be nonexistentin other parts of the world. For example, census data providing an accurate reflection of mortality ratesmay not be available. Even in industrialized countries, statistics may need careful scrutiny because themethod used to produce them may be vastly different from that typical to the risk manager’s experi-ence. This is particularly true of rate-making data. Data may also be grossly distorted for political reas-ons. Officially stated inflation rates, for instance, are notoriously suspect in many countries.
Faced with this lack of reliable information, the risk manager has little choice but to proceed withcaution until experience and internal data collection can supplement or confirm other data sources.Contacts with other firms in the same industry and with other foreign subsidiaries can provide invalu-able sources of information.
Data collection and analysis are a problem not only in this broad sense. Communication betweenthe corporate headquarters and foreign operations becomes difficult due to language barriers, culturaldifferences, and often a sense of antagonism about a noncitizen’s authority to make decisions. Particu-larly difficult under these circumstances are the identification and evaluation of exposures and the im-plementation of risk management tools. Loss control, for instance, is much more advanced and accep-ted in the United States than in most other countries. Encouraging foreign operations to install sprink-lers, implement safety programs, and undertake other loss-control steps is generally quite difficult. Fur-ther, risk managers of U.S.-based multinational firms may have difficulty persuading foreign operationsto accept retention levels as high as those used in the United States. Retention simply is not well accep-ted elsewhere.
4.3 Currency RiskAny multinational transaction, where payments are transferred from one currency to another, is sub-ject to exchange rate risk. Under the current system of floating exchange rates, the rate of currency ex-change between any two countries is not fixed and may vary substantially over time. Currency ex-change risk is in the area of liquidity and convertibility between currencies. The risk exposure is the in-ability of the global firm to exchange the currency and transfer out of hostile countries. How this kindof risk can be mitigated is explained in Chapter 13.
4.4 Cultural Differences RiskAs we are very acutely aware after the September 11, 2001, attacks, cultural differences are at the root ofmuch of the trouble around the world. But this is not only in hostile events. When a business expandsabroad, one of the first actions is the study of the local culture of doing business. If you ever were in themarket in old Jerusalem, you may have experienced the differences in shopping. You learn very quicklythat a merchant never expects you to buy the item for the quoted price. The haggling may take a longtime. You may leave and come back before you buy the item you liked for less than half the originallyquoted price. This is the culture. You are expected to bargain and negotiate. Another cultural differenceis the “connection” or “protection.” Many business moves will never happen without the right connec-tion with the right people in power.
CHAPTER 10 PROPERTY RISK MANAGEMENT 219
Labor laws reflect another interesting cultural difference. In some countries, it is common to em-ploy very young children—an act that is against the law in the United States. The families in thesecountries depend heavily on the income of their children. But an American business in such a countrymay be faced with an ethical dilemma: should it employ children or adhere to U.S. practices and laborlaws?[19] Islamic finance is very different from finance in the Western world; for example, in Islam, in-terest payments are not permitted. With the expanded involvement of many businesses in the MiddleEast and Islamic countries, many academics, as well as businesspeople, are learning about the specialways to conduct business there.
4.5 Global Risk ManagementThe steps in global risk management include processes to reduce risk and develop loss-control policies,along with obtaining the appropriate insurance. Table 10.2 lists ways to manage political risks. Thesteps include learning the culture of the country and becoming a good corporate citizen, learning aboutthe reality of the country, and finding ways to avoid political and legal traps. In the area of insurance,the global firm first looks for public insurance policies. The U.S. government established an insuranceprogram administered through the Overseas Private Investment Corporation (OPIC) in 1948. Thetypes of coverage available include expropriation, confiscation, war risks, civil strife, unfair calling ofguarantees, contract repudiation, and currency inconvertibility. These are shown in Table 10.2. OPICinsurance is available only in limited amounts and only in certain developing countries that havesigned bilateral trade agreements with the United States for projects intended to aid development.Some private insurers, however, also provide political risk insurance. Private insurers do not have thesame restrictions as OPIC, but country limits do exist to avoid catastrophe (dependent exposure units).Additional types of coverage, such as kidnap, ransom, and export license cancellation, are alsoprovided by private insurers. Poor experience in this line of insurance has made coverage more difficultand costly to obtain.
After September 11, some insurers pulled out of the political risk market, while others took the op-portunity to expand their global coverage offerings. A Canadian insurer reported that the demand forinsurance for employee political risk and kidnap and ransom for a dozen global companies increasedby 100 percent.[20] Zurich North America and Chubb expanded their political risk insurance offeringsto the Asian market.[21] The private insurance market’s ability to meet the demand has been strength-ening each year because customers require broader coverage with longer terms, up to ten years. Othercompanies expanding into the market are Bermuda’s Sovereign Risk, AIG, and Reliance, among others.
Until recently, long-term political risk insurance was available mostly from international govern-ment agencies such as the Washington-based Multilateral Investment Guarantee Corporation (MIGA),a member of the World Bank Group; OPIC; the United Kingdom’s Export Credit Guarantee Depart-ment; and the French government’s export credit agency, Coface. But now the private market has beencompeting in the longer-term coverages and has opened coverage to losses caused by war and currencyinconvertibility. Capacity and limits increased as reinsurance became more readily available in this areaof global risks. Lloyd’s of London, for example, offered about $100 million in limits in 2002, a huge in-crease from the $10 million it could provide in 1992, according to Investment Insurance International,the specialist political risk division of Aon Group. AIG has increased its limits to $30 million per risk,while the rest of the private market had about $55 million to work with.
Coverage is even available in Israel, where major concerns about security made investors and busi-nesspeople nervous. A political risk team at Lloyd’s (MAP Underwriting) developed a policy to addressthose concerns.[22] The policy gives peace of mind to businesses that believe in the economic future ofIsrael by protecting the effects of “war and other political violence on their investments, property andpersonnel.” This specific coverage includes acts of war.
As noted in Table 10.2, some global firms use captives for this exposure. Captives were discussedin Chapter 5.
220 RISK MANAGEMENT FOR ENTERPRISES AND INDIVIDUALS
K E Y T A K E A W A Y S
In this section you studied global risk exposures that arise from the increasingly international nature of busi-ness operations:
< Political risk results from unanticipated governmental destabilization that disrupts an enterprise’s profit-making ability
< Legal attitudes with respect to insurance can be very different in other parts of the world, leading manyinternational companies to turn to nonadmitted coverage
< International data-gathering may be limited, suspect, or inconsistent with domestic techniques, so internalcollection efforts and collaboration among businesses is often required
< Volatile currencies can create unfavorable exchange rates
< Cultural differences, especially as reflected in labor laws, pose ethical dilemmas for companies withopposing views in conducting business
< Public insurance policies available through groups like the Overseas Private Investment Corporation (OPIC)and the Multilateral Investment Guarantee Corporation (MIGA) provide options for mitigating global riskssuch as expropriation, confiscation, war risks, civil strife, and currency inconvertibility
< Private insurers have increased political risk insurance offerings such as coverage for kidnap, ransom, andexport license cancellation in response to greater demand
D I S C U S S I O N Q U E S T I O N S
1. What is different about international property exposures compared with U.S. property exposures?
2. Why might an American company operating in a foreign country choose to purchase nonadmittedcoverage?
3. Describe the steps of political risk management.
5. REVIEW AND PRACTICE1. Assume you live on the Texas Gulf Coast, where hurricane damage can be extensive. Also assume
that you own a two-story frame home valued at $120,000. You insured the house for $80,000,which was your purchase price four years ago. If you had a total loss, what reimbursement wouldyou receive from your insurer? What if you had a loss of $10,000? (Assume an 80 percentcoinsurance provision.)
2. Erin Lavinsky works for the Pharmacy On-Line company in Austin, Texas. She uses her businesscomputer for personal matters and has received a few infected documents. She was too lazy toupdate her Norton Utilities and did not realize that she was sending her infected material to hercoworkers. Before long, the whole system collapsed and business was interrupted for a day untilthe backup system was brought up. Respond to the following questions:
a. Describe the types of risk exposures that Pharmacy On-Line is facing as a result of e-commerce.
b. If Pharmacy On-Line purchased the ISO endorsement in [MISSING REF: #baranoff-chappC], would it be covered for the lost day?
c. Describe what other risk exposures could interrupt the business of Pharmacy On-Line.3. What is a standard policy? Why is a standard policy desirable (or undesirable)?4. Marina Del Ro Shipping Company expanded its operations to the Middle East just before
September 11, 2001. Respond to the following questions:a. What are the global risk exposures of Marina Del Ro?b. What should Marina Del Ro do to mitigate these risks in terms of noninsurance and
insurance solutions?5. Provide an example of a business interruption loss and of an extra expense loss in the e-
commerce endorsement.
CHAPTER 10 PROPERTY RISK MANAGEMENT 221
1.
2.
3.
4.
5.
6.
7.
8.
9.
10.
11.
12.
13.14.
15.
16.
17.
18.
19.
20.
21.
22.
ENDNOTES
For more information, read the article “Standard Fire Policy Dates Back to 19th Cen-tury,” featured in Best’s Review, April 2002.
For example, residents of a housing development had full coverage for windstormlosses (that is, no deductible). Their storm doors did not latch properly, so wind dam-age to such doors was common. The insurer paid an average of $100 for each loss.After doing so for about six months, it added a $50 deductible to the policies as theywere renewed. Storm door losses declined markedly when insureds were required topay for the first $50 of each loss.
Richard Power, “Computer Security Issues & Trends,” Vol. VIII, Mo I. The survey wasconducted by the Computer Security Institute (CSI) with the participation of the SanFrancisco Federal Bureau of Investigation’s Computer Intrusion Squad. Established in1974, CSI has thousands of members worldwide and provides a wide variety of in-formation and education programs to assist in protecting the information assets ofcorporations and governmental organizations. For more information, go tohttp://www.gocsi.com.
The 6th Annual CyberSource Fraud Survey was sponsored by CyberSource Corpora-tion and undertaken by Mindwave Research. The survey was fielded September 17through October 1, 2004, and yielded 348 qualified and complete responses (versus333 the year before). The sample was drawn from a database of companies involvedin electronic commerce activities. Copies of the survey are available by visitinghttp://www.cybersource.com/fraudreport/.
For example, see Lee McDonald,” Insurer Points out Risks of E-Commerce,” Best’sReview, February 2000; Ron Lent, “Electronic Risk Gives Insurers Pause,” NationalUnderwriter, Property & Casualty/Risk & Benefits Management Edition, May 7, 2001;Caroline Saucer, “Technological Advances: Web Site Design Provides Clues to Under-writing Online Risks,” Best’s Review, December 2000.
George S. Sutcliffe, Esq., E-Commerce and Insurance Risk Management (Boston: Stand-ard Publishing Corp., 2001), 13.
Adapted from the online glossary of Symantec, a worldwide provider of Internet se-curity solutions, at http://www.symantec.com/avcenter/refa.html.
George S. Sutcliffe, Esq., E-Commerce and Insurance Risk Management (Boston: Stand-ard Publishing Corp., 2001), 13.
People for the Ethical Treatment of Animals v. Doughney, No. 00-1918 (4th Cir2001);http://www.phillipsnizer.com/internetlib.htm.
Ford Motor Company v. 2600 Enterprises et al., 177 F. Supp. 2d 661, 2001, U.S. DistrictCourt Lexis 21302 (E.D. Michigan2001); http://www.phillipsnizer.com/int-trademark.htm.
Monte Enbysk, “Hackers and Vandals and Worms, Oh My!” Microsoft bCentral news-letter, http://www.bcentral.com.
Simon London, “Government Warns Users on Risks of Internet-Based Telephony:Voip Is Growing in Popularity as the Technology Proliferates, but Inherent in the Ser-vice, Warns the Government, Is Increased Security and Privacy Flaws,” Financial Times,February 6, 2005, http://www.ft.com/cms/s/0/5fca499c-7554-11d9-9608-00000e2511c8.html (accessed March 15, 2009).
Kevin Coleman, “How E-Tailers and Online Shoppers Can Protect Themselves,” KPMG.
George S. Sutcliffe, Esq., E-Commerce and Insurance Risk Management (Boston: Stand-ard Publishing Corp., 2001), 13.
“New Policy Offered to Cover Tech Risks,” National Underwriter Online News Service,July 2, 2002; Stand Alone E-Commerce Market Survey, by IRMI athttp://www.irmi.com/Expert/Articles/2001/Popups/Rossi02-1.aspx.
George S. Sutcliffe, Esq., E-Commerce and Insurance Risk Management (Boston: Stand-ard Publishing Corp., 2001), 13.
Mark E. Ruquet, “Big Firms Worry About Coverage for Political Risks Abroad,” NationalUnderwriter Online News Service, August 9, 2001. The Aon survey asked 122 risk man-agers, chief financial officers, and others in similar positions of responsibility to assessvarious aspects of their overseas risks. The surveys were done by telephone and insome cases over the Internet.
“Marsh to Begin Crisis Consulting Led by Anti-Terror Expert,” National Underwriter On-line News Service, October 12, 2001; see Aon services at http://www.aon.com/risk_management/political_risk.jsp; see Willis services at http://www.willis.com/Services/Political%20Risk.aspx.
Etti G. Baranoff and Phyllis S. Myers, “Ethics in Insurance,” Academy of Insurance Edu-cation, Washington, D.C., instructional video with supplemental study guide (videoproduced by the Center for Video Education, 1997.)
Daniel Hays, “Insurer Finds Good Market in Political Risk,” National Underwriter OnlineNews Service, November 28, 2001.
“Zurich North America Expands Political Risk Insurance to Asian Market,” NationalUnderwriter Online News Service, April 6, 2002; John Jennings, “Political Risk Cover De-mand Surges: Insurers,” National Underwriter, Property & Casualty/Risk & BenefitsManagement Edition, April 27, 1998.
“Armed-Conflict Risks Covered,” National Underwriter, Property & Casualty/Risk &Benefits Management Edition, June 11, 2001. Many Internet sites deal with global risk.For example, Global Risk International at http://www.globalrisk.uk.com/ offers coun-terterrorist training, kidnap and ransom management, close protection, andsurveillance.
222 RISK MANAGEMENT FOR ENTERPRISES AND INDIVIDUALS
C H A P T E R 1 1The Liability RiskManagementAs noted in Chapter 10, liability risk is the risk that we may hurt a third party and will be sued for bodily injury or
other damages. Most of us have heard about auto liability; pollution liability; product liability; medical malpractice;
and the professional liability of lawyers, accountants, company directors and officers, and more. In the early 2000s,
the United States was mired in the accounting scandals of Enron and WorldCom. In the mid-2000s, AIG added its
name to the list of lawsuits and criminal allegations with accounting improprieties that padded company results.
Shareholders and participants in the 401(k) plans of these companies filed lawsuits, some of which were class-
action suits. In February 2005, President Bush signed a bill to redirect class-action lawsuits in excess of $5 million
and with geographically dispersed plaintiffs from state courts to federal courts.[1] Cases of this type are expected to
continue to emerge. In 2008, the credit crisis began and the allegations of misconduct and negligence by directors
and officers are expected to bring about a large numbers of lawsuits.
While liability insurance is for unintentional actions, the fear of having to pay liability claims because of the
errors and omissions of accountants and the directors and officers of companies have caused insurance rates in
these types of coverage to jump dramatically. The relationships between behavior and coverage will be strongly
demonstrated in this chapter, which will cover the following:
1. Links
2. Nature of the liability exposure
3. Major sources of liability
4. Liability issues and possible solutions
1. LINKSAs discussed in the Links section in Chapter 10, liability coverage is coverage for a third party that maysuffer a loss because of your actions. It also covers you in case you are hurt or your property is damagedbecause of someone else’s actions, such as the actions of the accountants and executives of Enron,WorldCom, and AIG. The harmed parties are investors and the employees of these companies who lostall or part of their investments or pensions. In personal lines coverage, such as homeowners and autopolicies, the liability of property damage or bodily injury you may inflict on others is covered up to alimit. In commercial lines, you may use a packaged multilines policy that also includes liability cover-age. In this chapter, we focus only on the liability sections of these policies.
As part of your holistic risk management program, you now realize that you need a myriad ofpolicies to cover all your liability exposures. In many cases, both the property and liability are in thesame policies, but what liability coverage is actually included in each policy? As we delve further intoinsurance policies, we find many types of liability coverage. As you will see in this chapter, businesseshave a vast number of liabilities: product, errors and omissions, professional, directors and officers, e-commerce, medical, employment, employee benefits, and more. The aftermath of September 11, 2001,revealed additional liabilities from terrorism. Liability risk exposure is scary for any individual or busi-ness, especially in such a litigious society as the United States. Nonetheless, it is important to have the
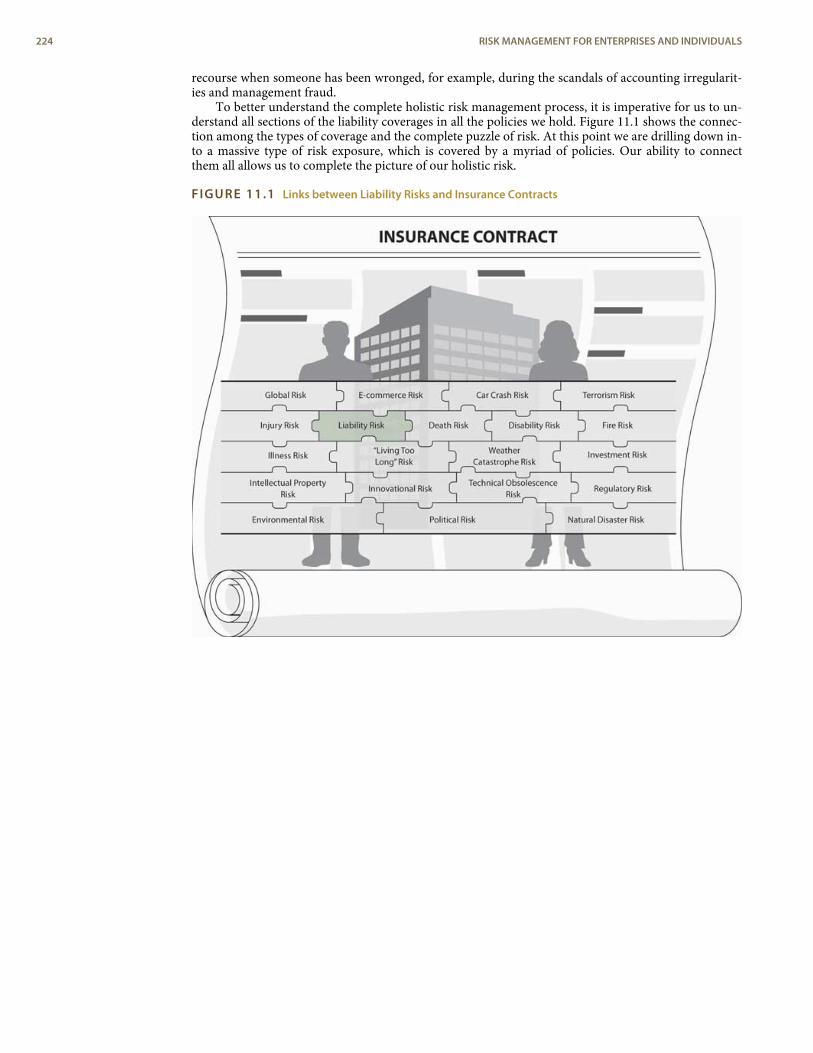
recourse when someone has been wronged, for example, during the scandals of accounting irregularit-ies and management fraud.
To better understand the complete holistic risk management process, it is imperative for us to un-derstand all sections of the liability coverages in all the policies we hold. Figure 11.1 shows the connec-tion among the types of coverage and the complete puzzle of risk. At this point we are drilling down in-to a massive type of risk exposure, which is covered by a myriad of policies. Our ability to connectthem all allows us to complete the picture of our holistic risk.
FIGURE 11.1 Links between Liability Risks and Insurance Contracts
224 RISK MANAGEMENT FOR ENTERPRISES AND INDIVIDUALS
legal liability
The responsibility, based inlaw, to right some wrongdone to another person ororganization.
remedy
Compensation for a personwho has been harmed insome way.
tortfeasor
A person who commits awrong.
special damages (economicdamages)
Compensation for harms thatgenerally are easilyquantifiable into dollarmeasures.
general damages
Compensation for harms thatare not specificallyquantifiable but that requirecompensation all the same.
noneconomic damages
Compensation for harms thatare not specificallyquantifiable but that requirecompensation all the same.
punitive damages
Awards intended to punishan offender for exceptionallyundesirable behavior.
plaintiff
The party harmed inlitigation.
defendant
The party being sued inlitigation.
2. NATURE OF THE LIABILITY EXPOSURE
L E A R N I N G O B J E C T I V E S
In this section we elaborate on the following:
< How legal liability is defined and determined< Types of monetary compensation for liability damages< The role of negligence in liability< Defenses against liability< Modifications to liability, as they are generally determined
Legal liability is the responsibility, based in law, to right some wrong done to another person or or-ganization. Several aspects of this definition deserve further discussion. One involves the remedy of li-ability. A remedy is compensation for a person who has been harmed in some way. A person who hasbeen wronged or harmed may ask the court to remedy or compensate him or her for the harm. Usually,this will involve monetary compensation, but it could also involve some behavior on the part of theperson who committed the wrong, or the tortfeasor. For example, someone whose water supply hasbeen contaminated by a polluting business may request an injunction against the business to force thecessation of pollution. A developer who is constructing a building in violation of code may be requiredto halt construction based on a liability lawsuit.
When monetary compensation is sought, it can take one of several forms. Special damages (oreconomic damages) compensate for those harms that generally are easily quantifiable into dollar meas-ures. These include medical expenses, lost income, and repair costs of damaged property. Those harmsthat are not specifically quantifiable but that require compensation all the same are called generaldamages (or noneconomic damages). Examples of noneconomic or general damages include painand suffering, mental anguish, and loss of consortium (companionship). The third type of monetary li-ability award is punitive damages, which was discussed in "Are Punitive Damages out of Control?" inChapter 9. In this chapter, we will continue to discuss the controversy surrounding the use of punitivedamages. Punitive damages are considered awards intended to punish an offender for exceptionallyundesirable behavior. Punitive damages are intended not to compensate for actual harm incurred butrather to punish.
A second important aspect of the definition of liability is that it is based in law. In this way, liabilitydiffers from other exposures because it is purely a creation of societal rules (laws), which reflect socialnorms. As a result, liability exposures differ across societies (nations) over time. In the United States, li-ability is determined by the courts and by laws enacted by legislatures.
The risk of liability is twofold. Not only may you become liable to someone else and suffer loss, butsomeone else may become liable to you and have to pay you. You need to know about both sides of thecoin, so to speak. Your financial well-being or that of your organization can be adversely affected byyour responsibility to others or by your failure to understand their responsibility to you. If you are theparty harmed, you would be the plaintiff in litigation. The party being sued in litigation is the defend-ant. In some circumstances the parties will be both plaintiffs and defendants.
CHAPTER 11 THE LIABILITY RISK MANAGEMENT 225
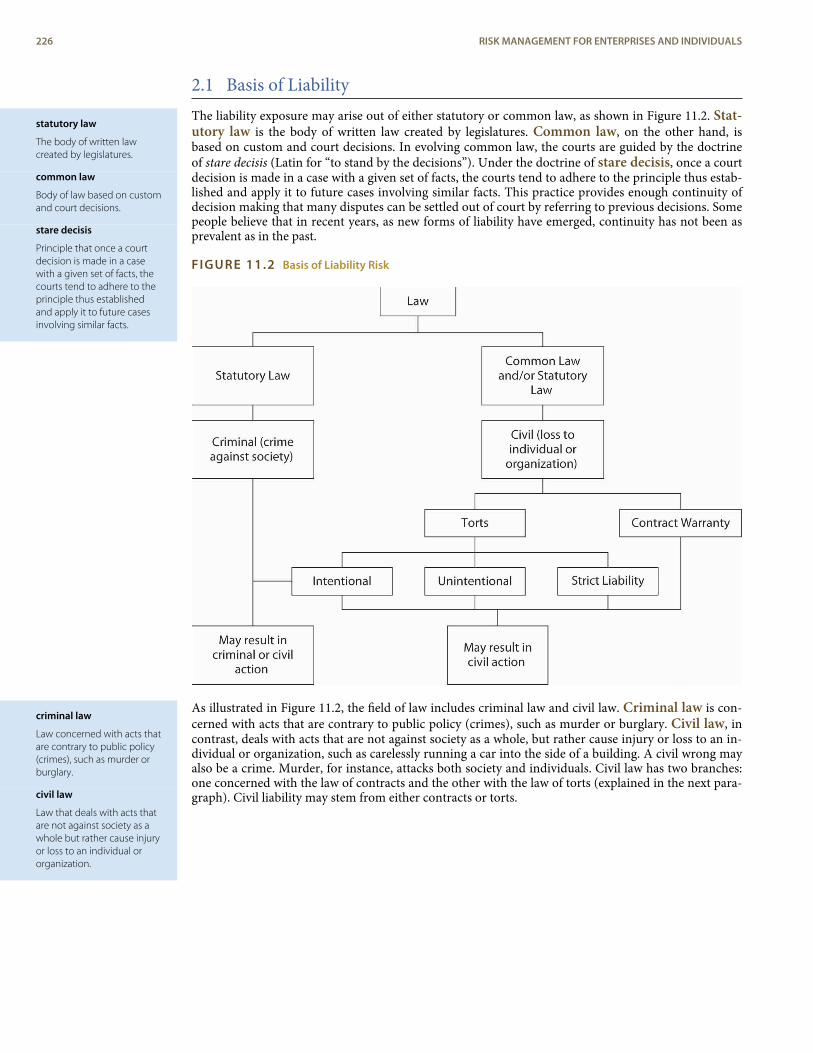
statutory law
The body of written lawcreated by legislatures.
common law
Body of law based on customand court decisions.
stare decisis
Principle that once a courtdecision is made in a casewith a given set of facts, thecourts tend to adhere to theprinciple thus establishedand apply it to future casesinvolving similar facts.
criminal law
Law concerned with acts thatare contrary to public policy(crimes), such as murder orburglary.
civil law
Law that deals with acts thatare not against society as awhole but rather cause injuryor loss to an individual ororganization.
2.1 Basis of LiabilityThe liability exposure may arise out of either statutory or common law, as shown in Figure 11.2. Stat-utory law is the body of written law created by legislatures. Common law, on the other hand, isbased on custom and court decisions. In evolving common law, the courts are guided by the doctrineof stare decisis (Latin for “to stand by the decisions”). Under the doctrine of stare decisis, once a courtdecision is made in a case with a given set of facts, the courts tend to adhere to the principle thus estab-lished and apply it to future cases involving similar facts. This practice provides enough continuity ofdecision making that many disputes can be settled out of court by referring to previous decisions. Somepeople believe that in recent years, as new forms of liability have emerged, continuity has not been asprevalent as in the past.
FIGURE 11.2 Basis of Liability Risk
As illustrated in Figure 11.2, the field of law includes criminal law and civil law. Criminal law is con-cerned with acts that are contrary to public policy (crimes), such as murder or burglary. Civil law, incontrast, deals with acts that are not against society as a whole, but rather cause injury or loss to an in-dividual or organization, such as carelessly running a car into the side of a building. A civil wrong mayalso be a crime. Murder, for instance, attacks both society and individuals. Civil law has two branches:one concerned with the law of contracts and the other with the law of torts (explained in the next para-graph). Civil liability may stem from either contracts or torts.
226 RISK MANAGEMENT FOR ENTERPRISES AND INDIVIDUALS
contractual liability
When the terms of a contractare not carried out aspromised by either party tothe contract.
warranty
A guarantee that property orservice sold is of thecondition represented by theseller.
tort
A private or civil wrong orinjury, other than breach ofcontract, for which the courtwill provide a remedy in theform of an action fordamages.
negligence
Failure to act reasonably,where such failure to actcauses harm to others.
proximate cause
A causal connection.
assumption of risk
Doctrine that holds that if theplaintiff knew of the dangersinvolved in the act thatresulted in harm, but choseto act in that fashionnonetheless, the defendantwill not be held liable.
Contractual liability occurs when the terms of a contract are not carried out as promised byeither party to the contract. When you sign a rental agreement for tools, for example, the agreementmay provide that the tools will be returned to the owner in good condition, ordinary wear and tear ex-cepted. If they are stolen or damaged, you are liable for the loss. As another example, if you offer yourcar for sale and assure the buyer that it is in perfect condition, you have made a warranty. A warrantyis a guarantee that property or service sold is of the condition represented by the seller. If the car is notin perfect condition, you may be liable for damages because of a breach of warranty. This is why somesellers offer goods for sale on an “as is” basis; they want to be sure there is no warranty.
A tort is “a private or civil wrong or injury, other than breach of contract, for which the court willprovide a remedy in the form of an action for damages.”[2] That is, all civil wrongs, except breach ofcontract, are torts. A tort may be intentional if it is committed for the purpose of injuring another per-son or the person’s property, or it may be unintentional. Examples of intentional torts include libel,slander, assault, and battery, as you will see in the contracts provided as appendixes at the end of thisbook. While a risk manager may have occasion to be concerned about liability arising from intentionaltorts, the more frequent source of liability is the unintentional tort. By definition, unintentional tortsinvolve negligence.
If someone suffers bodily injury or property damage as a result of your negligence, you may be li-able for damages. Negligence refers to conduct or behavior. It may be a matter of doing something youshould not do, or failing to do something you should do. Negligence can be defined as a failure to actreasonably, and that failure to act causes harm to others. It is determined by proving the existence offour elements (sometimes people use three, combining the last two into one). These four elements arethe following:
< A duty to act (or not to act) in some way< Breach of that duty< Damage or injury to the one owed the duty< A causal connection, called a proximate cause, between the breach of a duty and the injury
An example may be helpful. When a person operates an automobile, that person has a duty to obeytraffic rules and to drive appropriately for the given conditions. A person who drives while drunk,passes in a no passing zone, or drives too fast on an icy road (even if within set speed limits) hasbreached the duty to drive safely. If that person completes the journey without an incident, no negli-gence exists because no harm occurred. If, however, the driver causes an accident in which propertydamage or bodily injury results, all elements of negligence exist, and legal liability for the resultingharm likely will be placed on the driver.
A difficult aspect of proving negligence is showing that a breach of duty has occurred. Proof re-quires showing that a reasonable and prudent person would have acted otherwise. Courts use a varietyof methods to assess reasonableness. One is a cost-benefit approach, which holds behavior to be un-reasonable if the discounted value of the harm is more than the cost to avoid the harm[3] —that is, if thepresent value of the possible loss is greater than the expense required to avoid the loss. In this way,courts use an efficiency argument to determine the appropriateness of behavior.
A second difficult aspect of proving negligence is to show a proximate cause between the breach ofduty and resulting harm. Proximate cause has been referred to as an unbroken chain of events betweenthe behavior and harm. The intent is to find the relevant cause through assessing liability. The law iswritten to encourage behavior with consideration of its consequences.
Liability will not be found in all the circumstances just described. The defendant has available anumber of defenses, and the burden of proof may be modified under certain situations.
Defenses
A number of defenses against negligence exist, with varying degrees of acceptance. A list of defenses isshown in Table 11.1. One is assumption of risk. The doctrine of assumption of risk holds that if theplaintiff knew of the dangers involved in the act that resulted in harm but chose to act in that fashionnonetheless, the defendant will not be held liable. An example would be a bungee cord jumper who isinjured from the jump. One could argue that a reasonable person would know that such a jump is verydangerous. If applicable, the assumption of risk defense bars the plaintiff from a successful negligencesuit. The doctrine was particularly important in the nineteenth century for lawsuits involving work-place injuries, where employers would defend against liability by claiming that workers knew of jobdangers. With workers’ compensation statutes in place today, the use of assumption of risk in this wayis of little importance, as you will see in Chapter 1. Many states have also abolished the assumption ofrisk doctrine in automobile liability cases, disallowing the defense that a passenger assumed the risk ofloss if the driver was known to be dangerous or the car unsafe.
CHAPTER 11 THE LIABILITY RISK MANAGEMENT 227
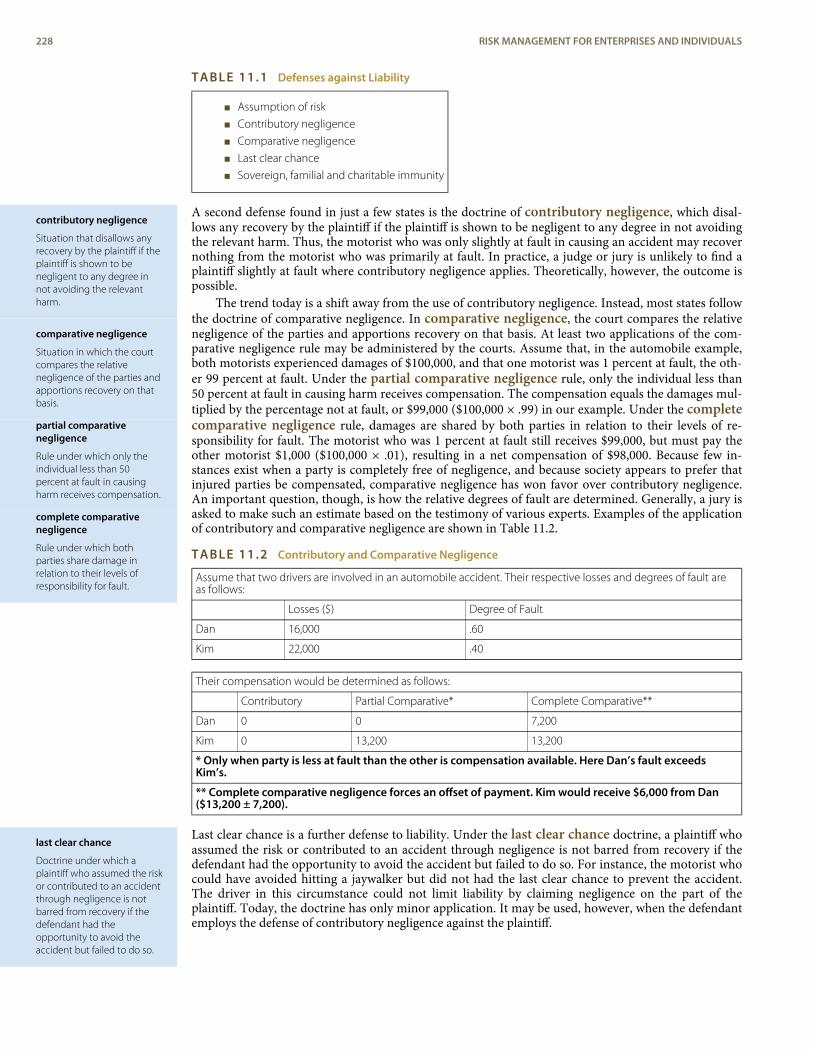
contributory negligence
Situation that disallows anyrecovery by the plaintiff if theplaintiff is shown to benegligent to any degree innot avoiding the relevantharm.
comparative negligence
Situation in which the courtcompares the relativenegligence of the parties andapportions recovery on thatbasis.
partial comparativenegligence
Rule under which only theindividual less than 50percent at fault in causingharm receives compensation.
complete comparativenegligence
Rule under which bothparties share damage inrelation to their levels ofresponsibility for fault.
last clear chance
Doctrine under which aplaintiff who assumed the riskor contributed to an accidentthrough negligence is notbarred from recovery if thedefendant had theopportunity to avoid theaccident but failed to do so.
TABLE 11.1 Defenses against Liability
< Assumption of risk
< Contributory negligence
< Comparative negligence
< Last clear chance
< Sovereign, familial and charitable immunity
A second defense found in just a few states is the doctrine of contributory negligence, which disal-lows any recovery by the plaintiff if the plaintiff is shown to be negligent to any degree in not avoidingthe relevant harm. Thus, the motorist who was only slightly at fault in causing an accident may recovernothing from the motorist who was primarily at fault. In practice, a judge or jury is unlikely to find aplaintiff slightly at fault where contributory negligence applies. Theoretically, however, the outcome ispossible.
The trend today is a shift away from the use of contributory negligence. Instead, most states followthe doctrine of comparative negligence. In comparative negligence, the court compares the relativenegligence of the parties and apportions recovery on that basis. At least two applications of the com-parative negligence rule may be administered by the courts. Assume that, in the automobile example,both motorists experienced damages of $100,000, and that one motorist was 1 percent at fault, the oth-er 99 percent at fault. Under the partial comparative negligence rule, only the individual less than50 percent at fault in causing harm receives compensation. The compensation equals the damages mul-tiplied by the percentage not at fault, or $99,000 ($100,000 × .99) in our example. Under the completecomparative negligence rule, damages are shared by both parties in relation to their levels of re-sponsibility for fault. The motorist who was 1 percent at fault still receives $99,000, but must pay theother motorist $1,000 ($100,000 × .01), resulting in a net compensation of $98,000. Because few in-stances exist when a party is completely free of negligence, and because society appears to prefer thatinjured parties be compensated, comparative negligence has won favor over contributory negligence.An important question, though, is how the relative degrees of fault are determined. Generally, a jury isasked to make such an estimate based on the testimony of various experts. Examples of the applicationof contributory and comparative negligence are shown in Table 11.2.
TABLE 11.2 Contributory and Comparative Negligence
Assume that two drivers are involved in an automobile accident. Their respective losses and degrees of fault areas follows:
Losses ($) Degree of Fault
Dan 16,000 .60
Kim 22,000 .40
Their compensation would be determined as follows:
Contributory Partial Comparative* Complete Comparative**
Dan 0 0 7,200
Kim 0 13,200 13,200
* Only when party is less at fault than the other is compensation available. Here Dan’s fault exceedsKim’s.
** Complete comparative negligence forces an offset of payment. Kim would receive $6,000 from Dan($13,200 ± 7,200).
Last clear chance is a further defense to liability. Under the last clear chance doctrine, a plaintiff whoassumed the risk or contributed to an accident through negligence is not barred from recovery if thedefendant had the opportunity to avoid the accident but failed to do so. For instance, the motorist whocould have avoided hitting a jaywalker but did not had the last clear chance to prevent the accident.The driver in this circumstance could not limit liability by claiming negligence on the part of theplaintiff. Today, the doctrine has only minor application. It may be used, however, when the defendantemploys the defense of contributory negligence against the plaintiff.
228 RISK MANAGEMENT FOR ENTERPRISES AND INDIVIDUALS
immunity
A complete defense againstliability because of status as aprotected entity, professional,or other party.
res ipsa loquitur (“Thething speaks for itself”)
Doctrine that shifts theburden of proof to thedefendant.
strict liability
Liability without regard tofault.
vicarious liability
Situation in which the liabilityof one person may be basedon the tort of another.
Last in this list of defenses is immunity. Where immunity applies, the defendant has a completedefense against liability merely because of status as a protected entity, professional, or other party. Forexample, governmental entities in the United States were long protected under the doctrine of sover-eign immunity. Sovereign immunity held that governments could do no wrong and therefore could notbe held liable. That doctrine has lost strength in most states, but it still exists to some degree in certaincircumstances. Other immunities extend to charitable organizations and family members. Like sover-eign immunity, these too have lost most of their shield against liability.
Modifications
Doctrines of defense are used to prevent a successful negligence (and sometimes strict liability) lawsuit.Other legal doctrines modify the law to assist the plaintiff in a lawsuit. Some of these are discussed hereand are listed in Table 11.3.
TABLE 11.3 Modifications of Negligence
< Res Ipsa Loquitur
< Strict liability
< Vicarious liability
< Joint and several liability
Rules of negligence hold that an injured person has the burden of proof; that is, he or she must provethe defendant’s negligence in order to receive compensation. Courts adhere to these rules unless reas-ons exist to modify them. In some situations, for example, the plaintiff cannot possibly prove negli-gence. The court may then apply the doctrine of res ipsa loquitur (“the thing speaks for itself”),which shifts the burden of proof to the defendant. The defendant must prove innocence. The doctrinemay be used upon proof that the situation causing injury was in the defendant’s exclusive control, andthat the accident was one that ordinarily would not happen in the absence of negligence. Thus, theevent “speaks for itself.”
Illustrations of appropriate uses of res ipsa loquitur may be taken from medical or dental treat-ment. Consider the plaintiff who visited a dentist for the extraction of wisdom teeth and was given ageneral anesthetic for the operation. Any negligence that may have occurred during the extractioncould not be proved by the plaintiff, who could not possibly have observed the negligent act. If, uponwaking, the plaintiff has a broken jaw, res ipsa loquitur might be employed.
Doctrines with similar purposes to res ipsa loquitur may be available when a particular defendantcannot be identified. Someone may be able to prove by a preponderance of evidence, for example, thata certain drug caused an adverse reaction, but that person may be unable to prove which companymanufactured the particular bottle consumed. Courts may shift the burden of proof to the defendantsin such a circumstance.[4]
Liability may also be strict (or, less often, absolute) rather than based on negligence. That is, if youhave property or engage in an activity that is considered ultra-dangerous to others, you may become li-able on the basis of strict liability without regard to fault. In some states, for example, the law holdsowners or operators of aircraft liable with respect to damage caused to persons or property on theground, regardless of the reasonableness of the owner’s or operator’s actions. Similarly, if you dam acreek on your property to build a lake, you will be liable in most situations for injury or damage causedif the dam collapses and floods the area below. In product liability, discussed later in this chapter, amanufacturer may be liable for harm caused by use of its product, even if the manufacturer was reason-able in producing it. Thus, the manufacturer is strictly liable.
In some jurisdictions, the owner of a dangerous animal is liable by statute for any harm or damagecaused by the animal. Such liability is a matter of law. If you own a pet lion, you may become liable fordamages regardless of how careful you are. Similarly, the responsibility your employer has in the eventyou are injured or contract an occupational disease is based on the principle of liability without fault.[5]
Both situations involve strict liability.In addition, liability may be vicarious. That is, the vicarious liability of one person may be based
on the tort of another, particularly in an agency relationship. An employer, for example, may be liablefor damages caused by the negligence of an employee who is on duty. Such an agency relationship mayresult in vicarious liability for the principal (employer) if the agent (employee) commits a tort whileacting as an agent. The principal need not be negligent to be liable under vicarious liability. The em-ployee who negligently fails to warn the public of slippery floors while waxing them, for instance, maycause his or her employer to be liable to anyone injured by falling. Vicarious liability will not, however,shield the wrongdoer from liability. It merely adds a second potentially liable party. The employer andemployee in this case may both be liable. Recall the case of vanishing premiums described in Chapter 8.Insurers were found to have liability because of the actions of their agents.
CHAPTER 11 THE LIABILITY RISK MANAGEMENT 229
joint and several liability
Situation that exists when aplaintiff is permitted to sueany of several defendantsindividually for the full harmincurred.
A controversial modification to negligence is the use of the joint and several liability doctrine.Joint and several liability exists when the plaintiff is permitted to sue any of several defendants indi-vidually for the full harm incurred. Alternatively, the plaintiff may sue all or a portion of the group to-gether. Under this application, a defendant may be only slightly at fault for the occurrence of the harm,but totally responsible for paying for it. The classic example comes from a case in which a DisneyWorld patron was injured on a bumper car ride.[6] The plaintiff was found 14 percent contributory atfault; another park patron was found 85 percent at fault; Disney was found 1 percent at fault. Becauseof the use of the joint and several liability doctrine, Disney was required to pay 86 percent of the dam-ages (the percentage that the plaintiff was not at fault). Note that this case is an exceptional use of jointand several liability, not the common use of the doctrine.
K E Y T A K E A W A Y S
In this section you studied the general notion of liability and the related legal aspects thereof:
< Legal liability is the responsibility to remedy a wrong done to another
< Special damages, general damages, and punitive damages are the types of monetary remedies applied toliability
< Liability exposure arises out of statutory law or common law and cases are heard in criminal or civil court
< Negligent actions may result in liability for losses suffered as a result
< Liability through negligence is proven through existence of a duty to act (or not act) in some way, breachof the duty, injury to one owed the duty, and causal connection between breach of duty and injury
< Defenses against liability include assumption of risk, contributory negligence, comparative negligence, lastclear chance, and immunity
< Modifications to help the plaintiff in a liability case include res ipsa loquitur, strict liability, vicarious liability,and joint and several liability
D I S C U S S I O N Q U E S T I O N S
1. Distinguish between criminal law and civil law.
2. Distinguish between strict liability and negligence-based liability.
3. What is the impact of res ipsa loquitur on general doctrines of liability? What seems to be the rationale forpermitting use of this modification?
4. Considering the factors involved in establishing responsibility for damages based on negligence, what doyou think is your best defense against such a suit?
3. MAJOR SOURCES OF LIABILITY
L E A R N I N G O B J E C T I V E S
In this section we elaborate on the following:
< The liabilities of property owners and property owners’ duties to others< Sources of liability for tenants< Liability in activities and conduct, such as automobile liability, professional liability, product li-
ability, and more
Individuals, families, firms, and other organizations are exposed to countless sources of liability. Thesemay be related to the property they own or control, or to their activities (including using an auto-mobile, providing professional services, manufacturing products, or being involved in e-commerce).
3.1 PropertyYou have a duty to the public not only with regard to your activities but also in connection with realand personal property you own or for which you are responsible. The duty—the degree of care—varieswith the circumstances. The owner or tenant of premises, for example, does not owe the same duty to
230 RISK MANAGEMENT FOR ENTERPRISES AND INDIVIDUALS
trespasser
A person who enters thepremises of another withouteither express or impliedpermission from a personwith the right to give suchpermission.
licensee
A person who enterspremises with permission but(1) not for the benefit of theperson in possession, or (2)without a reasonableexpectation that thepremises have been madesafe.
invitee
A person who enters thepremises with permissionand for the benefit of theperson in possession.
hold-harmless agreement
A contractual provision thattransfers financialresponsibility for liability fromone party to another.
each person who enters the property. The highest degree of care is owed to invitees, whereas the stand-ard of care is less for licensees and lowest for trespassers.
A trespasser is a person who enters the premises of another without either express or impliedpermission from a person with the right to give such permission. Generally, the only duty owed to atrespasser is to refrain from taking steps to harm him or her. There are several exceptions to this, themost important concerning trespassing children. This exception is discussed in connection with thedoctrine of attractive nuisance.
A licensee is a person who enters premises with permission but (1) not for the benefit of the per-son in possession, or (2) without a reasonable expectation that the premises have been made safe. Ifyour automobile breaks down and you ask the owners of the nearest house to use their telephone, thepermission you receive to enter the house makes you a licensee. Because a licensee is the party who re-ceives the benefit of entering the property, he or she is entitled to a minimum degree of care by theowner or tenant. An owner or tenant must avoid harm to licensees and must warn licensees of anydangerous activity or condition of the property. They need not make the place safer, however, than it isnormally.
An invitee is a person who enters the premises with permission and for the benefit of the personin possession. The invitee is entitled to a higher degree of care than a licensee. Thus, a customer in astore is an invitee, whether or not he or she makes a purchase. The property owner is expected to main-tain safe premises for invitees and to warn of dangers that cannot be corrected.
For the most part, it is a person’s reasonable expectation that determines his or her status. If youreasonably expect that the premises have been made safe for you, you are an invitee. For example, if Iinvite you to a party at my home, you are an invitee. If you should reasonably expect to accept thepremises as is without special effort on the part of the possessor, then you are a licensee. The distinc-tion between a licensee and an invitee is not always clear because it depends on reasonable expecta-tions. Further, the courts have tended in recent years to place little weight on these distinctions. Thequestion becomes, What is reasonable of the property owner? Generally, the owner has the responsibil-ity to provide a reasonably safe environment.
In one case, a guest who fell on a slippery floor was awarded damages against the homeowner. Inanother case, a visitor fell down steps that were not properly lighted because a worker had failed to turnon a light. Although it was the worker who was negligent, the homeowner had to pay because theworker was his representative. Thus, the property owner’s liability was vicarious; he was not negligent,but his employee was. In another case, a homeowner repaired a canopy and then hired a painter. Whenthe painter crawled onto the canopy, the canopy collapsed. The homeowner was held liable for the in-juries sustained.
Tenant’s Liability to the Public
If you are a tenant, you cannot assume that the owner alone will be liable for defects in the premises. Inmany cases, the injured party will sue both the owner and the tenant. Furthermore, the owner may shiftresponsibility to the tenant by means of a hold-harmless clause in the lease. A hold-harmless agree-ment is a contractual provision that transfers financial responsibility for liability from one party to an-other. This is particularly important to understand because many tenants who sign a lease do not real-ize they are assuming such liability by contract. A typical clause is as follows:
…That the lessor shall not be liable for any damage, either to person or property, sustained by thelessee or by any other person, due to the building or any part thereof, or any appurtenancesthereof, becoming out of repair, or due to the happening of any accident in or about said building,or due to any act or neglect of any tenant or occupant of said building, or of any other person.
The gist of this clause is to transfer the financial aspects of the landlord’s potential liability to thetenant.
Tenant’s Liability to Owner
If your negligence results in damage to premises you lease, you may be liable to the owner. The factthat the owner has insurance to cover the damage does not mean you will not be required to pay for theloss. After the insurer pays the owner, the insurer receives subrogation of the owner’s right to recoverdamages, meaning that the insurer is given legal recourse against you for any liability you may have tothe owner.
CHAPTER 11 THE LIABILITY RISK MANAGEMENT 231
attractive nuisance
Anything that is (1) artificial,(2) attractive to smallchildren, and (3) potentiallyharmful.
Animals
Ownership of pets and other animals may also result in liability. Anyone owning an animal generally isresponsible for damage or injury that the animal may cause. In many jurisdictions, if the owner actedreasonably in controlling the animal, no liability will result. For example, in many places, a pet dog thathas been friendly and tame need not be leashed. Once that dog has bitten someone, however, morecontrol is required. If the dog bites a second person, the owner is likely to be held liable for the harm.In this case, the owner had forewarning.
Likewise, anyone owning dangerous animals such as lions or poisonous snakes is held to a higherstandard of care. In this case, strict liability may be applied. Knowledge of the potential danger alreadyexists; thus, the owner must be given strong incentives to prevent harm.
In a recent, highly visible California case, a thirty-three-year-old woman was mauled to death by a123-pound English mastiff/Presa Canary Island crossbreed. The owners were found guilty of seconddegree murder by the jury, but the judge, in a surprise move, changed the ruling.[7] This case illumin-ates statistics from the Center for Disease Control and Prevention in Atlanta, which reports ten totwenty deaths annually from dog bites. Lawmakers in various states enacted laws concerning dogs. Theinsurance industry also reacted to curtail the losses caused by dogs. In the Insurance Services Office(ISO) homeowners policy (see [MISSING REF: #baranoff-chappA] in this textbook) there are “specialprovisions that excludes liability coverage for any insured for bodily injury arising out of the actions ofa dangerous or vicious, and out of the insureds failure to keep the dangerous dog leashed or tethered orconfined in a locked pen with a top or locked fenced yard. The owners are required to control the dogsand assure the safety of passersby.”[8]
Attractive Nuisance
In some cases, small children are attracted by dangerous objects or property. In such circumstances,the owner has a special duty toward the children, especially if they are too young to be responsible fortheir own safety. This is called the doctrine of attractive nuisance. An attractive nuisance is anythingthat is (1) artificial, (2) attractive to small children, and (3) potentially harmful. People who own powerlawn mowers, for example, must be especially watchful for small children who may be injured throughtheir own curiosity. If you leave your mower running while you go in the house to answer the tele-phone and there are small children in the neighborhood who may be attracted to the mower, you maybe held financially responsible for any harm they experience. The most common attractive nuisance isthe swimming pool. Although some courts have held that those who own swimming pools are not ne-cessarily babysitters for the community, it appears that pool owners do have the duty of keeping chil-dren out. There have been many cases in which children entered a neighbor’s pool without permissionand drowned. The result is a suit for damages and in many cases a verdict in favor of the plaintiff.
Hazardous Waste
An increasingly important area of potential liability involving property derives from the possibility thatland may be polluted, requiring cleanup and/or compensation to parties injured by the pollution. Be-cause of significant legislation passed in the 1970s and 1980s, the cleanup issue may be of greater con-cern today than previously.
In 1980, the U.S. Congress passed the Comprehensive Environmental Response, Compensation,and Liability Act (known as either CERCLA or Superfund). This act places extensive responsibilities onorganizations involved in the generation, transportation, storage, and disposal of hazardous waste. Re-sponsibility generally involves cleaning or paying to clean polluted sites that are dangerous to the pub-lic. Estimates of total program costs run from $100 billion to $1 trillion, giving an indication of the po-tential severity of liability judgments. Any purchaser of realty (or creditor for that purchase) must beaware of these laws and take steps to minimize involvement in Superfund actions. A small amendmentto the law was signed by President George W. Bush on January 11, 2002. Under the Small Business Li-ability Relief and Brownfields Revitalization Act, certain small contributors to Superfund sites weretaken out of the liability system. The new law creates incentives for developers to purchase and restoreabandoned urban sites known as brownfields.[9]
The area of pollution liability is very complex. Decisions have been made regularly in pollutioncases. In a pollution case that went to the Ohio Supreme Court, Goodyear Tire & Rubber Co. sought torecover the cost of environmental cleanups at some of its sites from its insurers.[10] The insurersclaimed that the coverage was excluded under the pollution exclusions provisions. The court sided withGoodyear, however, ordering that Goodyear be allowed to choose—from the pool of triggeredpolicies—a single primary policy against which to make a claim.
232 RISK MANAGEMENT FOR ENTERPRISES AND INDIVIDUALS
family purpose doctrine
Doctrine that makes theowner of a family carresponsible for whateverdamage it does, regardless ofwhich member of the familymay be operating the car atthe time of the accident.
nonownership liability
Situation in which anemployer is held liable for aninjury caused by an employeeusing his or her own propertywhen acting on theemployer’s behalf.
errors and omissions (E&O)liability coverage
Insurance protection formistakes made byprofessionals that result inprofessional liability claims.
3.2 Activities and ConductPeople also may be liable for damages caused by their own actions or those of someone else. In negli-gence suits, you will be judged on how a “reasonable” person in the same or similar circumstances withyour training and ability would have acted. You will be judged according to different criteria for non-negligence suits.
Automobile Liability
Ownership and operation of an automobile is probably the most common source of liability any indi-vidual will encounter. Details about this liability will be given in Chapter 1.
As the driver of an automobile, you are responsible for its careful and safe operation. If you do notoperate it in a reasonable and prudent fashion and someone is injured as a result of such lack of care,you may be held liable for damages. If, for example, you carelessly drive through a stop sign and run in-to another car, you may be liable for the damage done.
Through either direct or vicarious liability, the owner of an automobile may be responsible for thedamage it causes when driven by another person. In some states, the family purpose doctrine makesthe owner of the family car responsible for whatever damage it does, regardless of which member of thefamily may be operating the car at the time of the accident. The theory is that the vehicle is being usedfor a family purpose, and the owner, as head of the family, is therefore responsible.
Many parents assume responsibility for their children’s automobile accidents without realizingthey are doing so. In some states, minors between the ages of sixteen and eighteen are issued driver’s li-censes only if their applications are signed by a parent or guardian. What many parents do not realizeis that by signing the application, they may assume responsibility for damage arising from the child’sdriving any automobile. Ordinarily, a child is responsible for his or her own torts, but the parent maybecome liable by contract.
Vicarious liability is possible in other settings as well. If you lend your car to a friend, Sid Smith, sohe can go buy a case of liquor for a party you are having, he will be your agent during the trip and youmay be held responsible if he is involved in an accident. Your liability in this case is vicarious; you areresponsible for Smith’s negligence. On the other hand, if Smith is not a competent driver, you may beheld directly liable for putting a dangerous instrument in his hands. In such a case, it is your own negli-gence for which you are responsible.
A special problem for employers is the risk known as nonownership liability, in which an em-ployer is held liable for an injury caused by an employee using his or her own property when acting onthe employer’s behalf. If an employee offers to drop the mail at the post office as he or she drives homefrom work, the firm may be held liable if the employee is involved in an accident in the process. Thispossibility is easily overlooked because the employer may not be aware that employees are using theircars for company business.
Professional Liability
Members of a profession claim to have met high standards of education and training, as well as of char-acter and ethical conduct. They are expected to keep up with developments in their field and maintainthe standards established for the profession. As a result, the duty a professional owes to the public isconsiderably greater than that owed by others. Along with this duty, of course, comes liability for dam-age caused by failure to fulfill it. People expect more from a professional, and when they do not get it,some sue for damages.
As noted above, improper accounting activities to fatten the bottom line by publicly traded firms isbecoming an all-too-prevalent headline in the news. With fraud rampant, it appears that this chapterwill not be closed for a long time. The lack of trust of investors, small or large, in the accounting profes-sion and corporate leadership in the United States led to the creation of the Sarbanes-Oxley Act of2002, as discussed in Chapter 7. The failures of the dot.com companies brought about an “onslaught ofsecurities litigation, increasing claims for directors, officers and accountants’ professional liability in-surers.”[11]
Errors and Omissions
Professionals’ mistakes can result in professional liability claims. The insurance protection for this riskis errors and omissions (E&O) liability coverage. In light of the Enron/Arthur Anderson debacleand the WorldCom fraud, it is no wonder that the price for E&O has skyrocketed.[12]
CHAPTER 11 THE LIABILITY RISK MANAGEMENT 233
class-action lawsuits
Lawsuits filed on behalf ofmany plaintiffs.
malpractice
Failure by a professional touse reasonable care anddiligence, and/or failure touse one’s best judgment inexercising skill and applyingknowledge.
operations liability
Liability arising from theownership, maintenance, anduse of premises and conductof activity.
Directors and Officers
The outcome of all these accounting irregularities and the pure fraud that was alleged also has causedthe rates of directors and officers (D&O) liability coverage to soar.[13] Headlines such as “InsurersLikely to Balk at WorldCom D&O Coverage,”[14] “Lawsuits Send D&O Premiums Soaring,”[15] and“D&O Mkt. Could Face Catastrophic Year”[16] were just some examples of the reflection of the ac-counting, telecom, and Enron scandals.
In 2005, with added allegations against AIG, there was increased regulatory scrutiny of corporateactivities, and insurers became more selective in their underwriting. BestWire reported in 2005 that“typically, D&O insurers offer three types of coverage: The first is coverage provided directly to direct-ors and officers who aren’t indemnified by their companies; the second is coverage to companies forsettlements, judgments and defense costs; and the third is coverage for securities-related claims madedirectly against companies.”[17] AIG has been one of the largest providers of D&O coverage. In 2005, ittested its coverage on its own directors and officers.[18] As described in earlier chapters, AIG’s stockprice was hurt because of irregularities in the way the insurer accounted for the sale of finite risk andother loss mitigation products. These actions also led to class-action lawsuits (lawsuits filed on behalfof many plaintiffs) from the employees who invested in their company through their 401(k) accounts(discussed in Chapter 2).[19]
Medical Malpractice
The risks to which physicians and surgeons are exposed illustrate the position of a professional. In tak-ing cases, doctors represent that they possess—and the law imposes upon them the duty of possess-ing—the degree of learning and skill ordinarily possessed by others in their profession. If medical doc-tors fail to use reasonable care and diligence, and they fail to use their best judgment in exercising theirskill and applying their knowledge, they are guilty of malpractice.
Two cases demonstrate the risk to which medical doctors are exposed. A plastic surgeon whomade his patient look worse instead of better had to pay $115,000 for the damage. A court awarded$4.5 million to a girl suffering acute kidney failure as a result of malpractice.
Unlike the days when a family had one doctor who took care of almost all health problems, themodern health care system is specialized; many patients are dealing primarily with doctors they do notknow. Faith in, and friendship with, the family doctor has been displaced by impersonal, brief contactwith a specialist who may be more efficient than friendly. Furthermore, publicity about fraud by somedoctors under the Medicare and Medicaid programs and about the amount of unneeded medical pro-cedures (often performed as a defense against lawsuits) has reduced the prestige of the medical profes-sion. As a result, there has been a decrease in confidence and an increase in willingness to sue.
Some of the increase in lawsuits, however, has been caused by a combination of unrealistic expect-ations based on news about modern medical miracles and the belief by some that people are entitled toperfect care. When they do not get it, they feel entitled to compensation.
One result of the surge in medical malpractice suits has been a scarcity of professional liability in-surance in the private market and a dramatic increase in the cost of protection for both doctors andhospitals. These costs, of course, are passed along by most doctors to the consumer. They represent onefactor contributing to rising health care costs.
Another result is the rise of defensive medicine. Doctors and hospitals are guided not only by whatis good for the patient but also by their own interests in preventing liability losses. The latter, of course,leads to practices that may not be medically necessary and that increase the size of the patient’s bill.The total effect of defensive medicine on the cost of health care is difficult to determine, but it is likelysignificant.
Medical malpractice lawsuits continued to soar into the new millennium and the availability ofcoverage became scarce in many states. Unable to find liability coverage, many doctors in risky special-ties such as obstetrics and neurosurgery simply left the business. Medical liability rates nearly doubledin some areas, and insurers left many states. In 2005, rates continued to climb but at a slower rate.[20]
Some published studies in 2004 and 2005 concluded that lawsuits against doctors were not necessarilythe cause of med-mal rate increases.[21] For more details, see the box, "The Medical Malpractice Crisis"later in this chapter.
Operations
Many firms are exposed to liability from their operations. Contractors are particularly susceptible tooperations liability, or liability arising from the ownership, maintenance, and use of premises andconduct of activity. Because they perform most of their work away from their premises, contractors’greatest liability exposure is on the job rather than arising from their own premises. Bystanders may beinjured by equipment, excavations may damage the foundation of adjacent buildings, blasting
234 RISK MANAGEMENT FOR ENTERPRISES AND INDIVIDUALS
operations may damage nearby property or injure someone. If harm is caused while performing thejob, as opposed to a negligently completed job, the liability may be an operations one.
E-Commerce Liability
As was discussed in detail in Chapter 10, e-commerce poses not only property and interruption ofbusiness risks but also third-party liability arising from the following:[22]
< Invasion of privacy and identity theft< Employee-related risks and harassment< Intellectual property risks such as copyright, trademark infringement, defamation, encryption,
and discovery< Publishing and advertising risks< Service denial risks (contractual risks)< Professional risks (errors and omissions risks)
Online privacy issues continue to top headlines. According to the respondents of a survey conductedby the Yankee Group, a consulting firm focusing on global e-commerce and wireless markets, 83 per-cent of online consumers are somewhat or very concerned about their privacy on the Internet.[23] Ac-cording to a Fox News/Opinion Dynamics Poll, 69 percent of those polled said they’re “very con-cerned” about their ability to keep personal information, such as medical and financial records, con-fidential. While nearly two-thirds of Americans said they have access to the Internet at work, home, orschool, only 7 percent believed their most personal information is secure from the prying eyes of hack-ers or bosses.[24] The reputation of the business is at stake if customers’ information does not remainprivate and protected. Invasion of privacy is an issue of major public concern, as noted in the box"Insurance and Your Privacy—Who Knows?" in Chapter 7. Businesses often collect data about theircustomers or Web site visitors by having them fill out an online form or by making the user register forpermission to use the site. This information, if not protected, can create liability when the privacy ofthe customer is breached. When so much information is released on the Internet, there are many op-portunities for committing public defamation and opening the door to lawsuits.
Another e-commerce liability risk is raised with encryption, that is, the coding of Internet mes-sages so information cannot be read by an interceptor. Because the terrorists responsible for theSeptember 11 attacks in New York City and Washington, D.C., presumably communicated via encryp-ted Internet messages, some lawmakers renewed calls for restricting the use of encryption and for giv-ing law enforcement unrestricted access to codes, or keys, for unlocking the encrypted text.
Employee privacy and the monitoring of employees’ e-mail by employers are also key privacy is-sues. The courts appear to be on the employer’s side by agreeing that employers have the right to mon-itor employee e-mails. In the case of United States of America v. Eric Neil Angevine, the Tenth CircuitCourt of Appeals held that, when the computer is provided to an employee (in this case, a universityprofessor) by the employer, the employee should not have privacy expectations.[25] Liability falls on theemployer if an employee uses e-mail while at work to commit a federal crime or send a threat. The en-tire computer system can be subject to seizure (Federal Computer Seizure guidelines). A firm is liablefor any e-mails sent by employees; the e-mails are written proof of what the employee promised. Thecompany can also be held liable for any sexually harassing e-mails sent by employees.
Because a business derives much of its value from the uniqueness of its intellectual property, in-cluding trade secrets, copyrights, and trademarks, infringement of these properties opens the firm to li-ability lawsuits. There is increasing liability risk associated with statements posted on the Internet. Tra-ditional publishing methods require many different people to proofread the document, checking forpotentially harmful statements. None of this is required to place information online. This point isstressed by many professors when students are asked to write reports or do research. The validity of thematerial on the Internet is as good as the trust you have in the reputation of the source of the material.In the commercial world, advertising on the Internet brought both state and federal agencies into theact of protecting consumers from false Web-based advertisements. In the early 2000s, the Securitiesand Exchange Commission (SEC) sued to enjoin an illegal offer and sale of securities over AmericaOnline and the Internet without a prospectus, and the Department of Transportation fined Virgin At-lantic Airways for failing to disclose the full price of flights on its home page. The Food and Drug Ad-ministration (FDA) is also looking into online advertisements for pharmaceuticals. The National Asso-ciation of Attorneys General (NAAG) has formed a thirty-eight-state task force to develop enforcementguidelines for combating illegal activity online. The Federal Trade Commission (FTC) has been in-volved in cleaning the Internet of false advertising by finding the perpetrators and fining them withlarge penalties. An example is the advertisers of Super Nutrient Program and Fat Burner Pills, who hadto pay $195,000 in penalties.[26]
Denial of service liability is caused when a third party cannot access a promised Web site. Thismay be a major contractual liability.[27] For example, if a hacker penetrated a company’s Web site and
CHAPTER 11 THE LIABILITY RISK MANAGEMENT 235
product liability
Situation in which amanufacturer may be liablefor harm caused by use of itsproduct, even if themanufacturer was reasonablein producing it.
breach of warranty
Situation arising when anindividual uses a product asdirected and suffers injury asa result.
caused a shutdown, customers and other businesses may file lawsuits contending that their inability toaccess the site caused them to suffer losses. These losses are different from the first-party losses of theattacked company discussed in Chapter 10. The attacked company is covered under first-party insur-ance of property and business interruption income or special e-commerce endorsement. Finally, theprofessional liability of errors and omissions may cause a third party to have a loss of income. This mayoccur when an Internet provider fails or security software fails to perform.
The possible liabilities outlined above are not a complete list. Many of the causes of losses de-scribed in Chapter 10 may be causes for liabilities as well. The important point is that e-commerce ex-poses businesses to liabilities not anticipated prior to the electronic age. These liabilities may not becovered in the traditional commercial liability policy.
Product Manufacture
Product liability is one of the most widely debated sources of risk for a firm. The basis for product li-ability may be negligence, warranty, or strict liability in tort relating to defects causing injury inproducts sold to the public.
Product liability is a somewhat unusual aspect of common law because its development has oc-curred primarily within the twentieth century. One explanation for this late development is the doc-trine of privity. The privity doctrine required a direct contractual relationship between a plaintiff and adefendant in a products suit. Thus, a consumer injured by a product had a cause of action only againstthe party from whom the product was purchased. The seller, however, likely had no control over themanufacture and design of the product, thus limiting potential liability. Consumers’ only recourse wasto claim a breach of warranty by the seller; this cause of action is still available.[28]
Once the privity doctrine was removed, negligence actions against manufacturers surfaced. De-monstrating a manufacturer’s negligence is difficult, however, because the manufacturer controls theproduction process. You may recall that the doctrine of res ipsa loquitur becomes relevant in such acircumstance, placing the burden of proof on the manufacturer.
By 1963, members of the judiciary for the United States seemed to have concluded that consumersdeserved protection beyond res ipsa loquitur. Thus developed strict liability in products, as stated byJustice Traynor:
A manufacturer is strictly liable in tort when an article he places on the market, knowing that it is tobe used without inspection for defects, proves to have a defect that causes injury to a humanbeing.[29]
These three doctrines of breach of warranty, negligence, and strict liability are available today ascauses of action by a consumer in a product liability cases. Each is briefly described below.
Breach of Warranty
Many products are warranted suitable for a particular use, either expressly or by implication. The state-ment on a container of first-aid spray, “This product is safe when used as directed…,” is an expresswarranty. If you use a product as directed and suffer injury as a result, breach of warranty has oc-curred and the manufacturer may be held liable for damages. On the other hand, if you use the productother than as directed and injury results, the warranty has not been breached. Directions on a containermay create an implied warranty. A statement such as “Apply sparingly to entire facial surface” impliesthat the product is not harmful for such use, thus creating an implied warranty. If the product is harm-ful even when the directions are followed, the warranty has been breached.
Negligence
When a firm manufactures a product, sells a commodity, or acts in one of the other points in the mar-keting chain, it has a duty to act reasonably in protecting users of the commodity from harm. Failure tofulfill this duty constitutes negligence and may provide the basis for liability if harm results. Accordingto Noel and Phillips, “Negligence in products cases is most likely to involve a failure to warn or to warnadequately of foreseeable dangers, a failure to inspect fully or test, a failure in either design or produc-tion to comply with standards imposed by law or to live up to the customary standards of the in-dustry.” For example, failure to warn that the paint you sell may burn the skin unless removed immedi-ately may result in injury to the buyer and a liability for the seller. The product liability exposure canextend over the life of a product, which may be a very long time in the case of durable goods. A numberof proposals have been made both nationally and at the state level to limit the time period during whichsuch responsibility exists.
236 RISK MANAGEMENT FOR ENTERPRISES AND INDIVIDUALS
Strict Liability
A firm may be held liable for damage caused by a product even though neither negligence nor breachof warranty is established. This is called strict liability.
The doctrine of strict liability has been applied primarily based on the description provided in1965 by the American Law Institute in section 402 of the Second Restatement of Torts. It reads asfollows:
1. One who sells any product in a defective condition unreasonably dangerous to the user orconsumer or to his property is subject to liability for physical harm thereby caused to the ultimateuser or consumer, or to his property, if
a. the seller is engaged in the business of selling such a product, andb. it is expected to and does reach the user or consumer without substantial change in the
condition in which it is sold.2. The rule stated in Subsection (1) applies although
a. the seller has exercised all possible care in the preparation and sale of his product, andb. the user or consumer has not bought the product from or entered into any contractual
relation with the seller.The important aspects of this description are that the product was sold in a defective condition, whichmakes it unreasonably dangerous, thereby causing physical harm to the ultimate user. Thus, the manu-facturer and/or seller of the product may be held liable even if “all possible care in the preparation andsale” of the product was undertaken, and even if the injured party was not the buyer. Because of the ex-tent of this liability, it is not surprising that manufacturers hope to eliminate or at least limit the use ofstrict liability.
As already discussed, product liability suits were rare prior to the 1960s, and awards were small bytoday’s standards. Two legal changes altered the scope of the product liability system. First came theabolition of the privity rule. With the expansion of trade to include wholesalers and retailers, especiallywith respect to automobiles, the concept of privity seemed inappropriate. Then, in 1963, strict liabilitywas brought to the arena of products cases. With strict liability, an injured party could receive damagesby showing that the product was inherently dangerous and also defective. The result was a subtle shiftfrom focus on the manufacturer’s behavior to the product’s characteristics.[30]
Since 1963, the United States has seen a rapid increase in product liability litigation. One of themost difficult and common forms of litigation today involves strict liability due to defective warnings.Another source of consternation is the mass tort area (also referred to as class-action lawsuits), inwhich thousands of people are injured by the same product or set of circumstances, such as the DalkonShield and asbestos products. Some users of the Dalkon Shield, an intrauterine contraceptive device(IUD), experienced severe medical problems allegedly due to the defective nature of the product.Another cause for mass tort is asbestos. Asbestos is an insulation material made of tiny fibers that,when inhaled, may cause respiratory ailments. Thousands of workers using asbestos in the 1930s and1940s have been diagnosed with various forms of cancer. Their injuries led to class-action lawsuits. In2005, Congress was in the process of passing legislation to create a special fund for the victims of asbes-tos exposure. The proposal was highly debated and the constitutionality of the potential new law ques-tioned. The proposed bill was to provide a no fault $140 billion asbestos compensation trust fund inplace of the existing litigation-based system of compensating victims of asbestos-related diseases.[31]
The increase in product liability litigation and awards is believed to have been a major cause of theliability insurance crisis of the mid-1980s. The cost of insurance increased so much that some firmshave gone out of business, while others have discontinued production of the items that seem to becausing the trouble. In some circumstances, the discontinuance of a product line may not be verynewsworthy. In others, however, the results could be quite detrimental. The threat of lawsuits, for in-stance, appears to have been the impetus for several vaccine manufacturers to leave the business. Merck& Co. is now the sole U.S. producer of the combined measles, mumps, and rubella (MMR) vaccine. Inother circumstances, companies have not only terminated the manufacture of products but have filedfor bankruptcy. Johns Manville Corporation, an asbestos manufacturer, and A. H. Robbins, a producerof the Dalkon Shield IUD, are two examples of companies who filed for Chapter 10 bankruptcy to getout from under liability suits.
The largest liability cases are the tobacco liability cases that started in the 1990s and are continuingwith large awards given to the plaintiffs, who are victims of cancer and other illnesses caused bysmoking cigarettes. A case that stands out is the one against R. J. Reynolds Tobacco Holdings, Inc.,where the Kansas judge, not the jury, levied a $15 million punitive damages awards to the amputeeDavid Burton. The punitive damage awards were fifteen times larger than the $196,416 compensatoryaward.[32] Note also the major case against Philip Morris discussed in the box "Are Punitive Damagesout of Control?" in Chapter 9.
CHAPTER 11 THE LIABILITY RISK MANAGEMENT 237
completed operationsliability
Liability stemming fromactivities of the firm ininstalling equipment or doingother jobs for hire off its ownpremises.
contingent liability
Situation in which a firm isliable for an independentcontractor’s negligencebecause the firm did not usereasonable care in selectingsomeone competent.
dramshop laws
Laws that impose specialliability on anyone engagedin any way in the liquorbusiness.
The tobacco cases did not end in courts. The states brought lawsuits themselves. The states forcedthe industry to the negotiating table, and the tobacco industry settled for $368 billion in 1997, fouryears after the battle began. Some of the stories of the hurt, loss, and misery caused by cigarettesmoking and the lawsuits are described in The People vs. Big Tobacco by the Bloomberg News team ofCarrick Mollenkamp, Adam Levy, Joseph Menn, and Jeffrey Rothfeder (Princeton, NJ: BloombergPress, 1998) and Cornered: Big Tobacco at the Bar of Justice, by Peter Pringle (New York: Henry HoltCo., 1998).
As the courts provide large awards to plaintiffs and the tobacco companies find ways to curtail thedamage,[33] the next wave of lawsuits may be expected to target the food industry because of obesity.This topic is discussed in the box “Obesity and Insurance—Litigation or Self-Discipline?” in thischapter.
Completed Operations
Closely related to product liability is liability stemming from activities of the firm in installing equip-ment or doing other jobs for hire off its own premises, called completed operations liability. De-fective workmanship may cause serious injury or property damage, for which the firm may be heldliable.
Contingent Liability
Generally, a firm that hires an independent contractor is not liable for damage or injury caused by thecontractor. There are a number of exceptions to this general rule, however, resulting in contingent liab-ility. Contingent liability occurs in situations where the firm is liable for an independent contractor’snegligence because the firm did not use reasonable care in selecting someone competent. If the activityto be performed by an independent contractor is inherently dangerous, the firm is strictly liable fordamages and cannot shift its liability to the contractor. The fact that the contractor agrees to hold thefirm harmless will not relieve it from liability. A firm that hires an independent contractor to do a joband then interferes in details of the work may also find itself liable for the contractor’s negligence.
Liquor Liability
Many states have liquor laws—or dramshop laws—which impose special liability on anyone engagedin any way in the liquor business. Some apply not only to those who sell liquor but also to the owner ofthe premises on which it is sold. The laws are concerned with injury, loss of support, and damage toproperty suffered by third parties who have no direct connection with the store or tavern. For example,if liquor is served to an intoxicated person or a minor and the person served causes injury or damage toa third party, the person or firm serving the liquor may be held liable. In some cases, liability has beenextended to employers providing alcohol at employee parties.
Obesity and Insurance—Litigation or Self-Discipline?
Business Insurance reported in January 2005 that obesity claims against fast-food giant McDonald’s were re-vived. The McDonald’s case was the most celebrated 2002 class-action lawsuit. The plaintiffs were a group ofteenagers who sued the chain for causing their obesity. Following a dismissal, a federal appeals court rein-stated the claims that McDonald’s used deceptive advertising to mask the health risks associated with itsfoods. While a U.S. district court judge threw out the complaint in 2003, parts of the dismissed suits were up-held. The obesity cases have not stopped with this fast-food restaurant. In a 2003 California lawsuit againstKraft Foods, the manufacturer of Oreo cookies was asked by the plaintiff to cease its target marketing until thecookies no longer contained trans fat. This lawsuit was later withdrawn, but it did affect the actions of Kraft. Inanother high-profile lawsuit, McDonald’s french fries were the focus of the suit. The plaintiffs accused the fast-food chain of misleading the public by using beef fat while promoting them as vegetarian fries. The case waseventually settled in 2002 for $12.5 million and McDonald’s posted an apology.
These are examples of the problems with the food-obesity-liability triangle. The Centers for Disease Control(CDC) estimates that 60 percent of Americans are overweight, defined as a body mass index score (a ratio ofweight to height) of 25 or above. Forty million people are considered obese, with a BMI of 30 or more.*
Flab has become a national crisis. In December 2001, then-surgeon general David Satcher predicted thatobesity would soon surpass smoking as the leading cause of preventable deaths in the United States. Over-weight people are ten times more likely to develop diabetes and six times more likely to have heart disease.Excess weight is linked to gallbladder disease, gout, respiratory problems, and certain types of cancer. Estim-ates of the annual health care costs of obesity run as high as $100 billion. With major pressure on health caresystems and a growing number of our citizens’ quality of life deteriorating, is obesity the next crisis, destinedto eclipse tobacco in magnitude for liability?
238 RISK MANAGEMENT FOR ENTERPRISES AND INDIVIDUALS
Question for Discussion
Is obesity a disease that needs medical intervention, in your opinion, or a lifestyle issue that calls for self-discip-line? Is it a case of self-discipline or a topic for litigation?
* Check your BMI with the CDC’s Web calculator: http://www.cdc.gov/nccdphp/dnpa/bmi/calc-bmi.htm.
Sources: Karen Shideler, “Rising Cost of Obesity in America Hurts Us All,” The Wichita Eagle, October 27, 2002; “Weight Management and HealthInsurance,” American Obesity Association, http://www.obesity.org; “Overweight and Obesity,” Centers for Disease Control, http://www.cdc.gov/nccdphp/dnpa/obesity/index.htm; Libby Copeland, “Snack Attack: after Taking On Big Tobacco, Social Reformer Jabs at a New Target—Big Fat,”Washington Post, November 3, 2002, F01; Nanci Hellmich, “Weighing the Cost of Obesity,” USA Today, January 20, 2002; reports by the InsuranceInformation Institute in 2005 such as “Obesity, Liability & Insurance” and various articles from the media in 2005.
K E Y T A K E A W A Y S
In this section you studied the various ways that individuals, families, firms, and other entities are exposed to li-ability in property and in activities and conduct:
< Property owners’ duties vary with respect to invitees, licensees, and trespassers; children must be speciallyconsidered when property is an attractive nuisance.
< Tenants face liability to the public and to property owners.
< Property considered hazardous waste has the potential to be an environmental liability.
< The most common source of liability in activities/conduct is the activity of operating an automobile, whichalso invites vicarious and nonownership liabilities.
< Doctors, lawyers, accountants, and other professionals are exposed to professional liability in errors inomissions, activities of directors and officers, and medical malpractice.
< Contractors are susceptible to operations liability.
< E-commerce entails liability risks such as invasion of privacy, intellectual property risks, and contractualservice denials.
< The basis for product liability may be negligence, warranty, or strict liability.
< Completed operations, contingent liability, and liquor liability are other sources of liability in activities andconduct.
D I S C U S S I O N Q U E S T I O N S
1. Explain why a trampoline in a backyard is considered an attractive nuisance.
2. Ceci Willis sells books door to door. What responsibilities do you owe her when she visits your home? Howwould the circumstances change if you were the book seller and Ceci came to your home as a potentialbuyer? What if you owned several pet panthers?
3. Describe when strict liability applies in products. What is the practical effect of this doctrine?
4. Monique rents a one-bedroom apartment. Because she does not own the property, does this mean she isnot liable for any injuries that might occur in her home? Give an example of a situation where she wouldbe responsible.
5. When Vivienne and Paul Jensen’s daughter Heather turned sixteen, they signed a form allowing her to geta driver’s license. Two weeks after she received her license, Heather crashed the family car into a tree. Hefriend Rebecca, who was in the passenger seat, was severely injured. Explain why Heather’s parents areresponsible in this case. What are the consequences to them of this liability?
CHAPTER 11 THE LIABILITY RISK MANAGEMENT 239
contingency fee
A percentage (typically onethird) of the award to aplaintiff, collected by theattorney only if the plaintiffprevails.
statutes of limitation
Laws that determine the timeframe within which a claimmust be filed.
collateral source rule
A legal doctrine that preventsincluding information abouta plaintiff’s financial statusand/or compensation oflosses from other sources inthe litigation.
4. POSSIBLE SOLUTIONS
L E A R N I N G O B J E C T I V E S
In this section we elaborate on the following:
< Methods within the legal system of alleviating liability by limiting use and improvements ofdefenses or reducing incentives to sue
< Risk management for e-commerce liabilities
A number of suggestions have been made to alleviate the problems of product liability and malpractice(professional) liability. Some would limit the right to use or improve the defendant’s defenses; otherswould reduce the incentive to sue or provide an alternative to legal action.
In both areas, proposals would limit the compensation available to plaintiffs’ attorneys. Mostplaintiffs compensate their attorneys with a percentage (typically one third) of their award, called acontingency fee. The advantage of a contingency fee system is that low-income plaintiffs are notbarred from litigation because of inability to pay legal fees. A disadvantage is that lawyers have incent-ives to seek very large awards, even in situations that may appear only marginally appropriate for litiga-tion. Reduced contingency fee percentages and/or caps on lawyer compensation have been recommen-ded as partial solutions to increases in the size of liability awards and the frequency of litigation itself.Similarly, shorter statutes of limitation, which determine the time frame within which a claim mustbe filed, have also been proposed as a means to reduce the number of liability suits.
Placing caps on the amount of damages available and eliminating the collateral source rule are re-commendations that focus on the size of liability payments. Caps on damages typically limit recoveryeither for general damages or for punitive damages. Often, when actually awarded, general and punit-ive damages far exceed the special damages; thus, they dramatically increase the size of the award andcan add significant uncertainty to the system.
The collateral source rule is a legal doctrine that prevents including information about aplaintiff’s financial status and/or compensation of losses from other sources in the litigation. In a set-ting in which a plaintiff has available payments from workers’ compensation or health insurance, forexample, the jury is not made aware of these other payments when determining an appropriate liabilityaward. Thus, the plaintiff may receive double recovery.
Another prominent recommendation is to abolish or limit the use of joint and several liability. Aspreviously described, joint and several liability has the potential to hold a slightly-at-fault party primar-ily responsible for a given loss. The extent of the use of the doctrine, however, is disputed.
4.1 Risk Management of E-Commerce LiabilitiesThe first step in the risk management process of e-commerce liability in particular is the developmentof privacy procedures. This is done to protect consumers and avoid personal injury of defamation ofanother person or entity.
The transfer of e-commerce liability risk is not commonly covered under the usual general liabilitypolicy, which is discussed in Chapter 1. The commercial general liability policy does not cover all of theliabilities that result from loss of electronic information. Therefore, in the risk management process,the risk manager should look into separate e-commerce policies. An e-commerce liability policy gener-ally will include, in Section I, the definitions of claims, defense costs, the named insured, an Internetsite that is noted on the declaration page, policy period, and so forth. Section II usually includes the ex-clusions. As would be expected, bodily injury and property damage are excluded because they are usu-ally covered under the general liability policy. Additional exclusions are fraud, antitrust activities,breach of contract, employment practices, product liability, patent infringement, lotteries, loyalties, se-curities, governmental actions, prior claims, and prior pending litigation. Section III emphasizes thatthe coverage is the liability of only Internet-related activities. The limit of liability is set in the declara-tion page. The last sections of the policy include additional details relating to reporting of notice, de-fense and settlement, other insurance, and more.[34]
E-commerce liability policies are not standardized. Some provide more coverage while others aremore limited. The interested student can find many examples on the Internet and in E-Commerce In-surance and Risk Management by George Sutcliffe (Boston: Standard Publishing Corp., 2001).
240 RISK MANAGEMENT FOR ENTERPRISES AND INDIVIDUALS
The Medical Malpractice Crisis
The Insurance Information Institute stated in its May 2005 “Medical Malpractice” report the following:
< The cost of medical malpractice insurance is rising. This hard market began in 2000 following a longperiod of flat prices. Fewer insurers in the field is one of the causes of rate increases.
< Rate increases led the medical community to lobby for limits on noneconomic damages and otherreforms.
How did the situation get so bad? Doctors blame insurance companies for skyrocketing premiums. Insurersblame personal-injury attorneys who work on contingency. The American Medical Association blames jurorswho award exorbitant punitive damages. In fact, much of the problem can be traced to ordinary businesscycles and a bit of coincidence. Some studies in no way attribute lawsuits to the premium increases. The 1970ssaw sweeping changes in both medicine and jurisprudence; broader liability rulings and rapid advances inmedical technologies coparented a rash of record-breaking lawsuits. Insurers raised premiums, and when law-suits declined in the 1980s, malpractice insurance again became a profit center for insurers—so much so thatby the mid-1990s, the field became very competitive. The competition among insurers led to price wars, butlowering premiums depleted the insurers’ reserves just as malpractice lawsuits began escalating again.
Horror stories abound of frivolous lawsuits on the plaintiff’s side, appalling negligence on the defendant’s, andexorbitant jury awards in the middle. As in the 1970s, many think the answer lies in legislative reform. Twentystates now have medical malpractice caps on jury awards. West Virginia is proposing a state-managed liabilityplan. Pennsylvania has banned “forum shopping,” in which lawyers file their suits in jurisdictions where juriestend to award huge damages; lawsuits now must be tried in the county where the malpractice took place.Mississippi, too, has recently instituted sweeping medical malpractice reform law, including a provision againstforum shopping. The Bush administration urged Congress to pass a bill that would limit noneconomic dam-age awards to $250,000, limit punitive damage awards, place limits on the time allowed for injured patients tofile a lawsuit, and establish a fee schedule for lawyers’ contingency fees. A provision would also provide liabilityprotection for pharmaceutical firms. In May 2005, the American Medical Association (AMA) reported a declinein medical malpractice claims and improved physician recruitment and retention resulting from some states’tort reforms.
Sources: The Insurance Information Institute is a good source for special timely reports. In addition, see Joseph B. Treaster, “Rise in Insurance ForcesHospitals to Shutter Wards,” New York Times, August 25, 2002; Steven Brostoff, “Medical Malpractice Reform Bill Draws Praise From Insurers,” NationalUnderwriter, Property & Casualty/Risk & Benefits Management Edition, October 7, 2002; Rachel Zimmerman and Christopher Oster, “Insurers’ PriceWars Contributed to Doctors Facing Soaring Costs,” Wall Street Journal, June 24, 2002; Lori Chordas, “A Downward Spiral: Medical MalpracticeInsurance Is Losing Its Place as a Top Performing Line of Business in the Property/Casualty Industry,” Best’s Review, August 2001; “Report: Suits Don’tCause Higher Med Mal Premiums” National Underwriter Online News Service, March 11, 2005, accessed March 16, 2009,http://www.propertyandcasualtyinsurancenews.com/cms/NUPC/Breaking%20News/2005/03/11-Report%20Suits%20Dont%20Cause%20Higher%20Med%20Mal%20Premiums? searchfor=suits%20cause%20higher%20premiums; Arthur D. Postal and Matt Brady,“President To Unveil Tort Reform Proposals,” National Underwriter Online News Service, January 4, 2005, accessed March 16, 2009,http://www.propertyandcasualtyinsurancenews.com/cms/NUPC/Breaking%20News/2005/01/05-President%20To%20Unveil%20Tort%20Reform%20Proposals?searchfor=tort%20reform%20proposals.
K E Y T A K E A W A Y S
In this section you studied suggestions for reducing liability losses from legal and risk managementperspectives:
< Reduction in attorneys’ contingency fees would reduce the financial incentive of trying liability suits
< Shorter statutes of limitation on claims would reduce the overall number of liability cases
< Placing caps on the amount of damages and eliminating the collateral source rule are efforts designed tolimit award amounts
< In e-commerce liability, privacy procedures should first be developed
< Risk can be transferred through special e-commerce liability policies
D I S C U S S I O N Q U E S T I O N S
1. How might elimination of the collateral source rule and a shortened statute of limitations affect theavailability and affordability of liability insurance?
2. How does the contingency fee system work?
3. How might the contingency fee system affect the frequency and severity of liability exposures?
CHAPTER 11 THE LIABILITY RISK MANAGEMENT 241
5. REVIEW AND PRACTICE1. Betsy Boomer does not own a car and she must rely on friends for transportation. Last month,
Betsy asked Freda Farnsworth to drive her to the store. Freda is known to be a reckless driver, butBetsy is not in a position to be choosy. On the way to the store, Freda is distracted by Betsy andhits a telephone pole. The car, of course, is damaged, and Betsy is injured. Describe Freda’spossible liability and the various defenses to or modifications of liability that her lawyer may tryto employ in her defense.
2. Your neighbor’s English bulldog, Cedric, is very friendly, but you wouldn’t know it by looking athim. Last Monday, the substitute mail carrier met Cedric as he was approaching the mailbox.Because the mail carrier is afraid of even small dogs, he collapsed from fright at the sight ofCedric approaching, fell to the ground, and broke his left arm. A motorist, who observed thissituation while driving by, rammed the neighbor’s parked car. The parked car then proceededdown the street through two fences, finally stopping in Mrs. Smith’s living room.
a. Is there a case for litigation involving your neighbor?b. Where does the motorist’s liability fit into this picture?
3. Your neighbor’s small children run wild all day, every day, totally ignored by their parents. Youhave forcibly ejected them from your swimming pool several times but they return the next day.Your complaints to their parents have had no effect. Do you think it is fair to hold youresponsible for the safety of these children simply because your swimming pool is an attractivenuisance? Are their parents being negligent? Can you use their possible negligence in yourdefense in the event one of the children drowns in your pool and they sue you for damages?
4. In an interesting case in Arizona, Vanguard Insurance Company v. Cantrell v. Allstate InsuranceCompany, 1973 C.C.H. (automobile) 7684, an insurer was held liable for personal injuriesinflicted on a storeowner when its insured robbed the store and fired a warning shot to scare theowner. The robber’s aim was bad, and he hit the owner. Because he had not intended to harm theowner, the insured convinced the court that the exclusion under a homeowners policy ofintentional injury should not apply.
a. What reasoning might the court have applied to reach this decision?b. Do you agree with this decision? Why or why not?
5. A physician or surgeon may become liable for damages on the basis of contract or negligence.Why is the latter more common than the former? What does your answer to this question tellyou about managing your liability risks?
6. Most states have a vicarious liability law regarding the use of an automobile. For instance,California and New York hold the owner liable for injuries caused by the driver’s negligence,whereas Pennsylvania and Utah make the person furnishing an automobile to a minor liable forthat minor’s negligence. Ohio, Indiana, Texas, Hawaii, and Rhode Island make the parent,guardian, or signer of the minor’s application for a license liable for the minor’s negligence.
a. Why do states differ in their approach to this situation?b. Do you agree with one of these approaches? Explain.c. If you are a resident of a state that has no such vicarious liability statute, does this mean
you are unaffected by these laws? Why or why not?7. Bigz Communications Corp, a small telecommunication company, provides long-distance phone
service and Internet dial-up connections. What types of e-commerce liability does such a firmface?
8. In Steyer v. Westvaco Corporation, 1979 C.C.H. (fire & casualty) 1229, and in Grand River LimeCompany v. Ohio Casualty Insurance Company 1973 C.C.H. (fire and casualty) 383, industrialoperators were held liable for damages caused by their discharge of pollutants over a period ofyears, even though they were not aware of the damage they were causing when discharging thepollutants.
a. How might this decision affect the public at large?b. What impact will it have on liability insurance?c. Because the discharge of pollutants was intentional, should it be insurable at all?
9. Erin Lavinsky works for the Pharmacy On-Line company in Austin, Texas. She likes to work onprivate matters on her business computer and has received a few infected documents. She was toolazy to update her Norton Utilities and did not realize that she was sending her infected material
242 RISK MANAGEMENT FOR ENTERPRISES AND INDIVIDUALS

to her coworkers. Before long, the whole system collapsed and business was interrupted for a dayuntil the backup system was brought up.
a. Describe the types of liability risk exposures Pharmacy On-Line is facing as a result ofErin’s action.
b. If Pharmacy On-Line purchased the ISO e-commerce liability endorsement, would it becovered for the liability?
c. If Erin penetrated into the system and obtained information about the customers, and ifshe later sold that information to a competitor, what would be the liability ramifications?Is there insurance coverage for this breach of privacy issue?
CHAPTER 11 THE LIABILITY RISK MANAGEMENT 243
1.
2.
3.
4.
5.6.
7.8.
9.
10.
11.
12.
13.
14.15.16.
17.
18.
19.
20.
21.
22.
23.
24.
25.
26.
27.
28.
29.30.
31.
32.
33.
34.
ENDNOTES
For class-action lawsuits, see major business and insurance journals during February2005. Examples include Allison Bell, “Industry Welcomes Class-Action Victory,” Na-tional Underwriter Online News Service, February 10, 2005; Jim Drinkard, “Bush to SignBill on Class-Action Suits,” USA Today, February 18, 2005, http://www.usatoday.com/money/2005-02-17-lawsuits-usat_x.htm (accessed March 16, 2009). For AIG stories,see all media outlets in 2005, for example, “401(k) Participants File Class-Action SuitAgainst AIG,” BestWire, May 13, 2005. Also, review many articles in the media duringthe fall of 2008 and the winter of 2009.
H. J. Black, Black’s Law Dictionary, 5th ed. (St. Paul, MI: West Publishing Company,1983), 774.
This was first stated explicitly by Judge Learned Hand in U.S. v. Carroll Towing Co., 159F. 2d 169 (1947).
Two such theories are called enterprise liability and market share liability. Both relyon the plaintiff’s inability to prove which of several possible companies manufac-tured the particular product causing injury when each company makes the sametype of product. Under either theory, the plaintiff may successfully sue a “substantial”share of the market without proving that any one of the defendants manufacturedthe actual product that caused the harm for which compensation is sought.
Workers’ compensation is discussed in Chapter 1.
Walt Disney World Co. v. Wood, 489 So. 2d 61 (Fla. 4th Dist. Ct. Appl. 1986), upheld bythe Florida Supreme Court (515 So. 2d 198, 1987).
Coverage of the story is available in all media stories in the beginning of June 2002.
Diane Richardson, “Bite Claims Can Dog Insurance Companies,” National Underwriter,Property & Casualty/Risk & Benefits Management Edition, May 14, 2001; Daniel Hays,“Insurers Feel the Bite of Policyholders’ Big Bad Dogs,” National Underwriter OnlineNews Service, January 31, 2001.
Steven Brostoff, “New Brownfields Law Falls Short of Sought-After Superfund Re-forms,” National Underwriter Property & Casualty/Risk & Benefits Management Edi-tion, March 25, 2002.
Rodd Zolkos, “Ohio High Court Favors Policyholder in Pollution Case,” Business Insur-ance, June 27, 2002.
Mark E. Ruquet, “Accountants Under Scrutiny Even Before Enron Failure,” NationalUnderwriter, Property & Casualty/Risk & Benefits Management Edition, February 25,2002.
Mark E. Ruquet, “Accountants Paying More for E&O Coverage,” National Underwriter,Property & Casualty/Risk & Benefits Management Edition, February 25, 2002.
The citations are too many to list because the issues develop daily. Review informa-tion in National Underwriter, Best’s Review, and Business Insurance to learn more. Someparts of these Web sites are open only to subscribers, so students are encouraged touse their library’s subscriptions to search these publications.
Best Wire, July 1, 2002.
National Underwriter Online News Service, June 17, 2002.
Lisa S. Howard, National Underwriter, Property & Casualty/Risk & Benefits Manage-ment Edition, February 25, 2002.
“D&O Coverage Evolve in Unstable Regulatory Climate,” BestWire, May 23, 2005,http://www3.ambest.com/Frames/FrameServer.asp?AltSrc=23&Tab=1&Site=news&refnum=74599 (accessed March 16, 2009). This article andthose in footnotes 14 to 16 are a few examples. During the early to mid-2000s, thestudent can find related stories in every media outlet.
Dave Lenckus, “AIG Set to Test Its Own Cover,” Business Insurance, May 16, 2005,http://www.businessinsurance.com/cgi-bin/article.pl?articleId=16843&a=a&bt=AIG+Set+to+Test+Its+Own+Cover (accessed March 16, 2009).
Michael Ha, “AIG Center of Class-Action Lawsuit,” National Underwriter Online NewsService, May 13, 2005, http://www.propertyandcasualtyinsurancenews.com/cms/NUPC/Weekly %20Issues/Issues/2005/20/News/P20AIGUPDATE?searchfor=(accessed March 16, 2009).
Steven Brostoff, “Malpractice Cover Worries Docs: AHA,” National Underwriter OnlineNews Service, June 26, 2002; Daniel Hays, “Another Malpractice Insurer Leaving Flor-ida,” National Underwriter Online News Service, June 24, 2002; “Study: Tort Costs StillEdging Up, Albeit More Slowly,” National Underwriter Online News Service, January 17,2005, http://www.propertyandcasualtyinsurancenews.com/cms/NUPC/Breaking%20News/2005/01/17-Study%20Tort%20Costs%20Still%20Edging%20Up%20Albeit%20More%20Slowly?searchfor=tort%20costs%20edging%20up(accessed March 16, 2009).
Rachel Zimmerman and Christopher Oster, “Insurers’ Price Wars Contributed to Doc-tors Facing Soaring Costs; Lawsuits Alone Didn’t Inflate Malpractice Premiums,” WallStreet Journal, June 24, 2002; “Report: Suits Don’t Cause Higher Med Mal Premiums,”National Underwriter Online News Service, March 11, 2004,http://www.propertyandcasualtyinsurancenews.com/cms/NUPC/Breaking%20News/2005/03/11-Report%20Suits%20Dont%20Cause%20Higher%20Med%20Mal%20Premiums?searchfor=suits%20cause%20higher%20premiums (accessedMarch 16, 2009).; Arthur D. Postal, “More Conflict over What Raises Med-Mal Rates,”National Underwriter Online News Service, May 23, 2005,http://www.propertyandcasualtyinsurancenews.com/cms/NUPC/Breaking%20News/2005/05/23-TORT-dp?searchfor=conflict%20raises%20rates (accessedMarch 16, 2009).
George Sutcliffe, E-Commerce and Insurance Risk Management (Boston: Standard Pub-lishing Corp., 2001); 2004 CSI/FBI Computer Crime and Security Survey at GoCSI.com.
“Online Privacy Continues to Be a Major Concern for Consumers,” research report,the Yankee Group, July 27, 2001. For its 2001 Interactive Consumer (IAC) report, theYankee Group surveyed approximately 3,000 online consumers.
Richard S. Dunham “Who’s Worried About Online Privacy? Who Isn’t?” Business WeekOnline, June 28, 2000, in http://www.businessweek.com/bwdaily/dnflash/june2000/nf00628c.htm?scriptFramed.
Thomas Jackson, “Protecting Your Company Assets and Avoiding Risk in Cyber-space,” online newsletter of legal firm Phillips Nizer Benjamin Krim & Ballon LLP, July16, 1996.
Thomas Jackson, “Protecting Your Company Assets and Avoiding Risk in Cyber-space,” online newsletter of legal firm Phillips Nizer Benjamin Krim & Ballon LLP, July16, 1996.
George Sutcliffe, E-Commerce and Insurance Risk Management (Boston: Standard Pub-lishing Corp., 2001); 2004 CSI/FBI Computer Crime and Security Survey at GoCSI.com.
Dix W. Noel and Jerry J. Phillips, Products Liability in a Nutshell (St. Paul, MI: West Pub-lishing Co., 1981).
Greeman v. Yuba Power Products, Inc., 377 P.2d 897 (Cal 1963).
Many people consider strict product liability to be anything but a subtle shift fromnegligence. For a discussion of the difference, however, see Barrett v. Superior Court(Paul Hubbs), 272 Cal. Rptr. 304 (1990).
“Asbestos Trust Could Face Constitutional Challenges,” BestWire, May 23, 2005; MarkA. Hofmann, “Amendments Delay Vote on Asbestos Trust Fund Bill,” Business Insur-ance, May 16, 2005; Matt Brady, “House Dems Ask Study Of Asbestos Fund Concept,”National Underwriter Online News Service, May 13, 2005; Jerry Geisel, “Insurer GroupsOppose Asbestos Legislation,” Business Insurance, April 19, 2005.
Michael Bradford, “Tobacco Firms Facing String of Legal Defeats,” Business Insurance,July 1, 2002.
Vanessa O’Connell, “Lifting Clouds: New Tactics at Philip Morris Help Stem Tide ofLawsuits: As It Revamps Legal Team, Cigarette Giant Also Gains in Appeals-Court Rul-ings, Some Big Battles Still Loom,” Wall Street Journal, May 11, 2005, A1.
This discussion is based on Safety ‘Net Internet Liability Policy by Chubb Group of In-surance Companies and Executive Risk Indemnity, Inc.
244 RISK MANAGEMENT FOR ENTERPRISES AND INDIVIDUALS
C H A P T E R 1 2Multirisk ManagementContracts: BusinessIn the preceding four chapters, you read about property and liability exposures generally and how families insure
home and auto exposures specifically. Now, we will delve briefly into business, or commercial, insurance.
Commercial insurance is a topic for an extensive separate course, but its importance has been reflected to a great
extent throughout the previous chapters. Employers who take unnecessary risks or who do not practice prudent
risk management may not only cause job losses, they may also cause the loss of pensions and important benefits
such as health insurance (discussed in later chapters).
As members of the work force, we drive our employers’ cars and spend many of our waking hours operating
machines and computers on business premises. Risks are involved in these activities that require insurance
coverage. A case in point is the damage caused by mold in many commercial buildings and schools as well as in
homes. Mold can cause headaches, discomfort, and more serious problems. Employers’ property coverage was of
great help in remedying the problem. However, as a result of the many claims, insurers have excluded mold
coverage or provided very low limits. This and more pertinent issues in different types of commercial coverage will
be discussed in this chapter. Issues such as the complexities of directors and officers coverage due to the improper
behavior of executives in many large corporations, like AIG, Enron, and WorldCom, are discussed in this chapter, as
are the dispute over the limits of coverage of the World Trade Center. The interested student is invited to study in
depth and explore the risk and insurance news media for current commercial coverage issues. Also, Case 3 in
[MISSING REF: #baranoff-ch23] relates to the types of commercial coverage embedded in integrated risk programs.
The programs described in the case use similar commercial packaged policies that are described in this chapter,
which covers the following:
1. Links
2. Commercial package policy and commercial property coverages
3. Other property coverages
4. Commercial general liability policy and commercial umbrella liability policy
5. Other liability risks
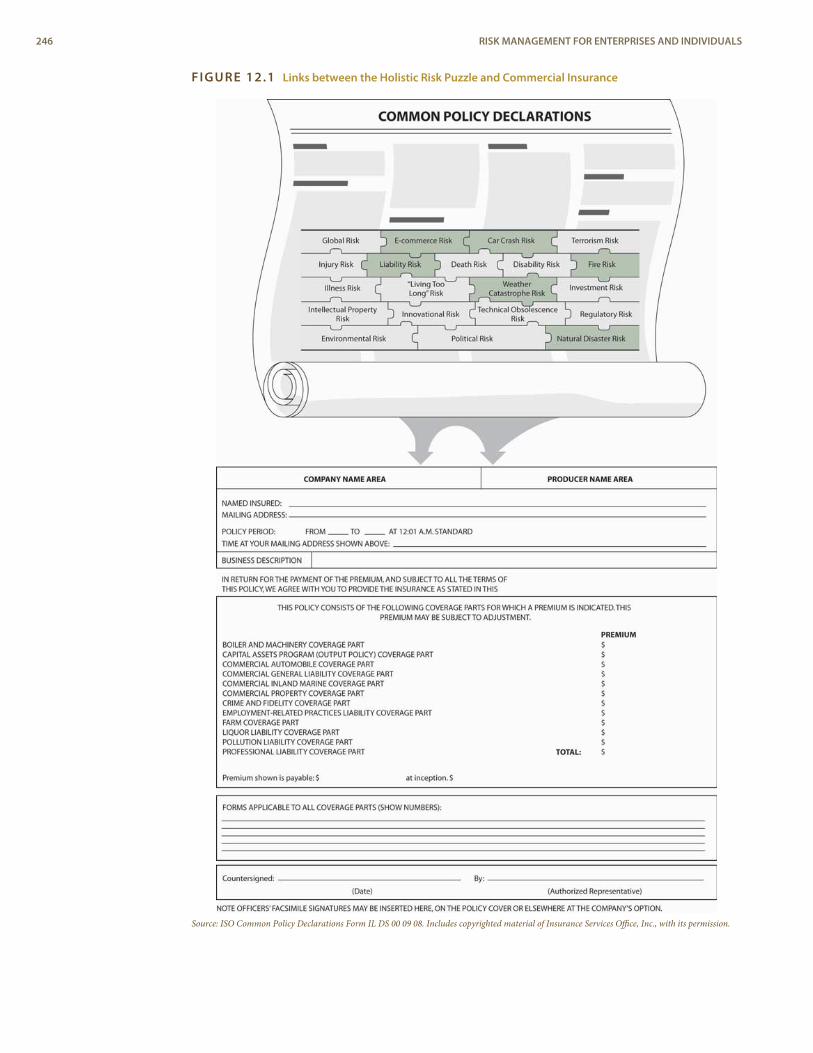
FIGURE 12.1 Links between the Holistic Risk Puzzle and Commercial Insurance
Source: ISO Common Policy Declarations Form IL DS 00 09 08. Includes copyrighted material of Insurance Services Office, Inc., with its permission.
246 RISK MANAGEMENT FOR ENTERPRISES AND INDIVIDUALS
commercial property policy
Policy that provides insurancefor direct physical loss tobusiness property andincome.
commercial generalliability (CGL) policy
The liability module of thecommercial package policy.
1. LINKSAt this point in our study, we are drilling further down into specific, more complex coverages of thecommercial world. Many types of coverage are customized to the needs of the business, but many moreuse the policies designed by the Insurance Services Office (ISO), which have been approved in moststates. We have moved from the narrow realm of personal line coverages, but the basic premises arestill the same. The business risks shown in Figure 12.1 do not clearly differentiate between commercialrisk and personal hazards. The perils of fire and windstorm do not separate personal homes from com-mercial buildings, as we saw from the devastation of hurricanes Katrina, Rita, and Wilma in 2005. Ourbusiness may be sued for mistakes we make as employees because the business is a separate legal entity.We cannot separate between the commercial world and our personal world when it comes to complet-ing our risk management puzzle to ensure holistic coverage.
Figure 12.1 shows how the picture of our risk puzzles connects to the types of commercial cover-age available as a package from the ISO. We use the common policy declarations page, which illustratesthe mechanism of this packaged policy. This program permits businesses to select among a variety ofinsurance options, like a cafeteria where we can choose the items we want to eat and reject those we donot. The program is considered a package because it combines both property and liability options inthe same policy, as well as additional coverages as listed in the common policy declarations page in Fig-ure 12.1. Within each of the property and liability coverages are various options available to tailor pro-tection to the particular needs of the insured, as you will see in this chapter.
2. COMMERCIAL PACKAGE POLICY AND COMMERCIALPROPERTY COVERAGES
L E A R N I N G O B J E C T I V E S
In this section we elaborate on the following commercial property insurance solutions:
< Introduction and overview of the commercial package policy (CPP)< The commercial property policy of the CPP< The building and personal property (BPP) form of the commercial property policy and business
interruption coverage (BIC)< Causes of loss options in the BPP and BIC< Major features of BPP and BIC
The commercial package policy (CPP) program was started by the Insurance Services Office (ISO) in1986. Every policy includes three standard elements: the cover page, common policy conditions, andcommon declarations (shown in Figure 12.1). It is important to elaborate on the declaration page be-cause it provides a visual aid of the various coverages that can be selected by a business, depending onneeds. Some businesses may not need specific parts of the package, but all the elements are listed forthe choice of the potential insured. More specifically, the package may include the following commer-cial coverage elements: boiler and machinery, capital assets program, commercial automobile, com-mercial general liability, commercial inland marine, commercial property, crime and fidelity,employment-related practices liability, farm liability, liquor liability, pollution liability, and profession-al liability. Some of these coverages were discussed in prior chapters. The rest of the coverages will bedescribed here.
Most commercial organizations have similar property exposures. Common business property ex-posures, along with business income exposures, can be insured through the commercial propertypolicy form of the commercial package policy. The liability module of the commercial package policyis the commercial general liability (CGL) policy. It replaced the liability coverage previously avail-able through the comprehensive general liability policy. In 1986, the CGL was made part of the newmodular approach introduced by the ISO in the form of the CPP.
2.1 Commercial Property CoveragesThe commercial property policy form of the CPP begins with property declarations and conditions.These provisions identify the covered location, property values (and limits), premiums, deductibles,and other specific aspects of the coverage. These pages make the insurance unique for a given
CHAPTER 12 MULTIRISK MANAGEMENT CONTRACTS: BUSINESS 247
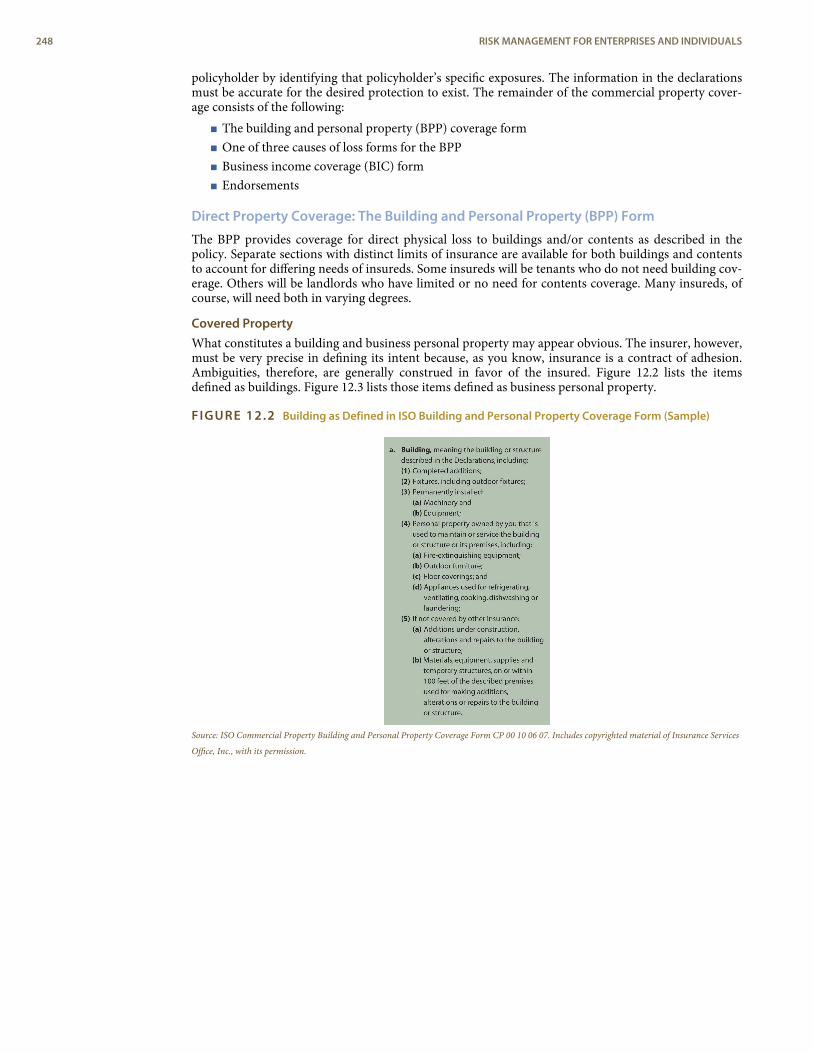
policyholder by identifying that policyholder’s specific exposures. The information in the declarationsmust be accurate for the desired protection to exist. The remainder of the commercial property cover-age consists of the following:
< The building and personal property (BPP) coverage form< One of three causes of loss forms for the BPP< Business income coverage (BIC) form< Endorsements
Direct Property Coverage: The Building and Personal Property (BPP) Form
The BPP provides coverage for direct physical loss to buildings and/or contents as described in thepolicy. Separate sections with distinct limits of insurance are available for both buildings and contentsto account for differing needs of insureds. Some insureds will be tenants who do not need building cov-erage. Others will be landlords who have limited or no need for contents coverage. Many insureds, ofcourse, will need both in varying degrees.
Covered PropertyWhat constitutes a building and business personal property may appear obvious. The insurer, however,must be very precise in defining its intent because, as you know, insurance is a contract of adhesion.Ambiguities, therefore, are generally construed in favor of the insured. Figure 12.2 lists the itemsdefined as buildings. Figure 12.3 lists those items defined as business personal property.
FIGURE 12.2 Building as Defined in ISO Building and Personal Property Coverage Form (Sample)
Source: ISO Commercial Property Building and Personal Property Coverage Form CP 00 10 06 07. Includes copyrighted material of Insurance Services
Office, Inc., with its permission.
248 RISK MANAGEMENT FOR ENTERPRISES AND INDIVIDUALS
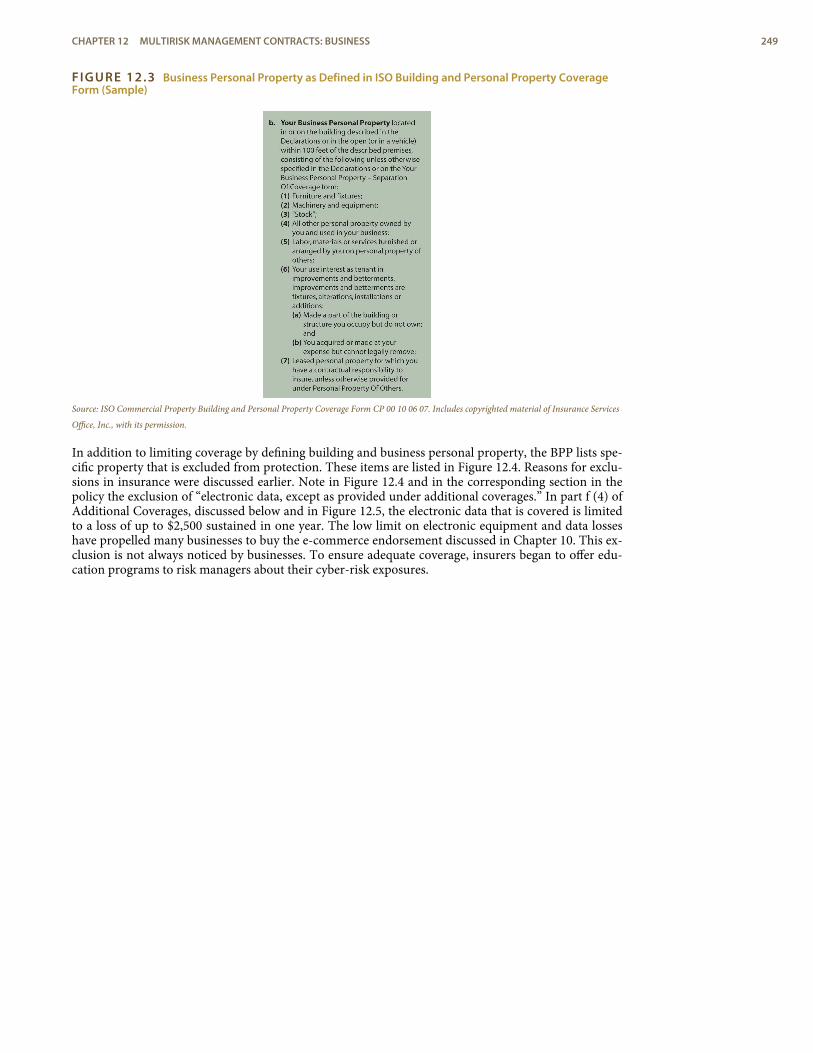
FIGURE 12.3 Business Personal Property as Defined in ISO Building and Personal Property CoverageForm (Sample)
Source: ISO Commercial Property Building and Personal Property Coverage Form CP 00 10 06 07. Includes copyrighted material of Insurance Services
Office, Inc., with its permission.
In addition to limiting coverage by defining building and business personal property, the BPP lists spe-cific property that is excluded from protection. These items are listed in Figure 12.4. Reasons for exclu-sions in insurance were discussed earlier. Note in Figure 12.4 and in the corresponding section in thepolicy the exclusion of “electronic data, except as provided under additional coverages.” In part f (4) ofAdditional Coverages, discussed below and in Figure 12.5, the electronic data that is covered is limitedto a loss of up to $2,500 sustained in one year. The low limit on electronic equipment and data losseshave propelled many businesses to buy the e-commerce endorsement discussed in Chapter 10. This ex-clusion is not always noticed by businesses. To ensure adequate coverage, insurers began to offer edu-cation programs to risk managers about their cyber-risk exposures.
CHAPTER 12 MULTIRISK MANAGEMENT CONTRACTS: BUSINESS 249
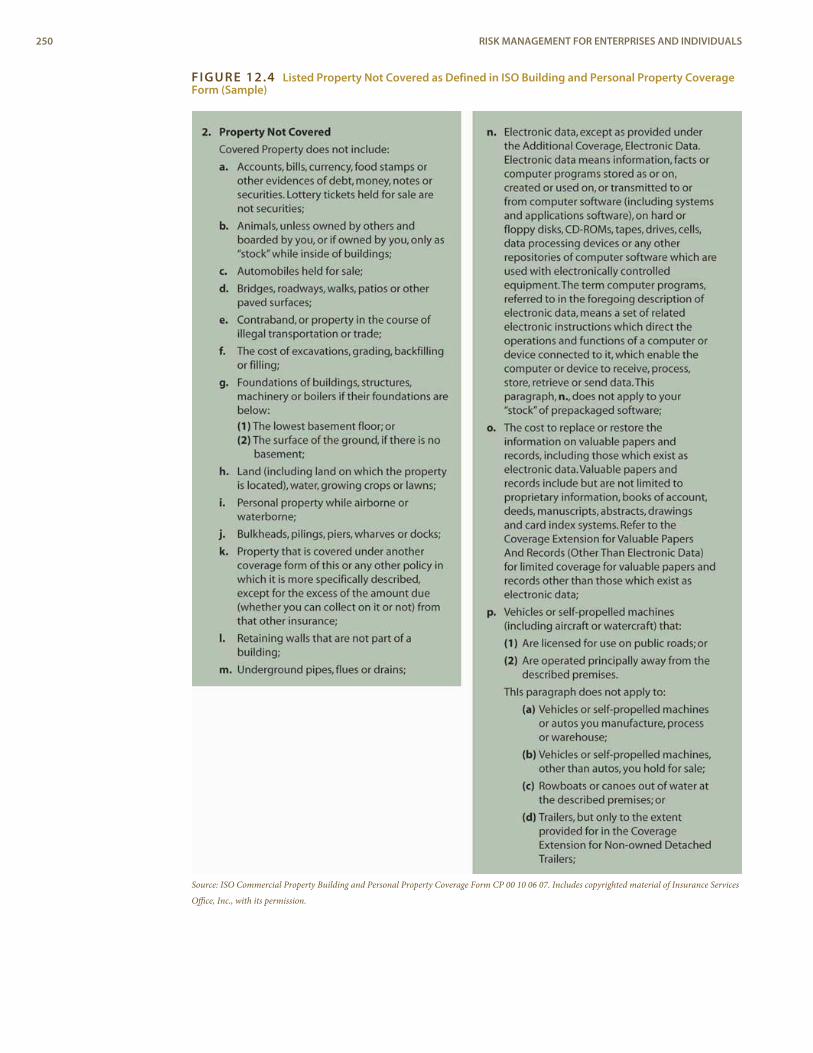
FIGURE 12.4 Listed Property Not Covered as Defined in ISO Building and Personal Property CoverageForm (Sample)
Source: ISO Commercial Property Building and Personal Property Coverage Form CP 00 10 06 07. Includes copyrighted material of Insurance Services
Office, Inc., with its permission.
250 RISK MANAGEMENT FOR ENTERPRISES AND INDIVIDUALS
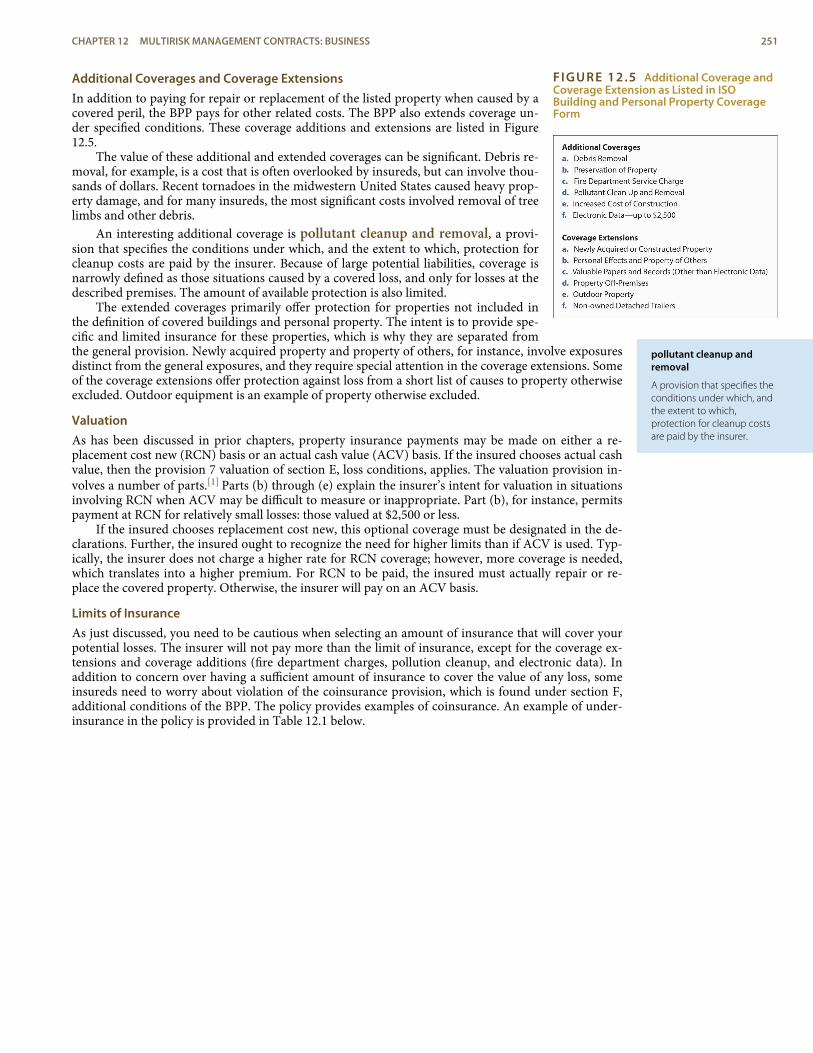
FIGURE 12.5 Additional Coverage andCoverage Extension as Listed in ISOBuilding and Personal Property CoverageForm
pollutant cleanup andremoval
A provision that specifies theconditions under which, andthe extent to which,protection for cleanup costsare paid by the insurer.
Additional Coverages and Coverage ExtensionsIn addition to paying for repair or replacement of the listed property when caused by acovered peril, the BPP pays for other related costs. The BPP also extends coverage un-der specified conditions. These coverage additions and extensions are listed in Figure12.5.
The value of these additional and extended coverages can be significant. Debris re-moval, for example, is a cost that is often overlooked by insureds, but can involve thou-sands of dollars. Recent tornadoes in the midwestern United States caused heavy prop-erty damage, and for many insureds, the most significant costs involved removal of treelimbs and other debris.
An interesting additional coverage is pollutant cleanup and removal, a provi-sion that specifies the conditions under which, and the extent to which, protection forcleanup costs are paid by the insurer. Because of large potential liabilities, coverage isnarrowly defined as those situations caused by a covered loss, and only for losses at thedescribed premises. The amount of available protection is also limited.
The extended coverages primarily offer protection for properties not included inthe definition of covered buildings and personal property. The intent is to provide spe-cific and limited insurance for these properties, which is why they are separated fromthe general provision. Newly acquired property and property of others, for instance, involve exposuresdistinct from the general exposures, and they require special attention in the coverage extensions. Someof the coverage extensions offer protection against loss from a short list of causes to property otherwiseexcluded. Outdoor equipment is an example of property otherwise excluded.
ValuationAs has been discussed in prior chapters, property insurance payments may be made on either a re-placement cost new (RCN) basis or an actual cash value (ACV) basis. If the insured chooses actual cashvalue, then the provision 7 valuation of section E, loss conditions, applies. The valuation provision in-volves a number of parts.[1] Parts (b) through (e) explain the insurer’s intent for valuation in situationsinvolving RCN when ACV may be difficult to measure or inappropriate. Part (b), for instance, permitspayment at RCN for relatively small losses: those valued at $2,500 or less.
If the insured chooses replacement cost new, this optional coverage must be designated in the de-clarations. Further, the insured ought to recognize the need for higher limits than if ACV is used. Typ-ically, the insurer does not charge a higher rate for RCN coverage; however, more coverage is needed,which translates into a higher premium. For RCN to be paid, the insured must actually repair or re-place the covered property. Otherwise, the insurer will pay on an ACV basis.
Limits of InsuranceAs just discussed, you need to be cautious when selecting an amount of insurance that will cover yourpotential losses. The insurer will not pay more than the limit of insurance, except for the coverage ex-tensions and coverage additions (fire department charges, pollution cleanup, and electronic data). Inaddition to concern over having a sufficient amount of insurance to cover the value of any loss, someinsureds need to worry about violation of the coinsurance provision, which is found under section F,additional conditions of the BPP. The policy provides examples of coinsurance. An example of under-insurance in the policy is provided in Table 12.1 below.
CHAPTER 12 MULTIRISK MANAGEMENT CONTRACTS: BUSINESS 251
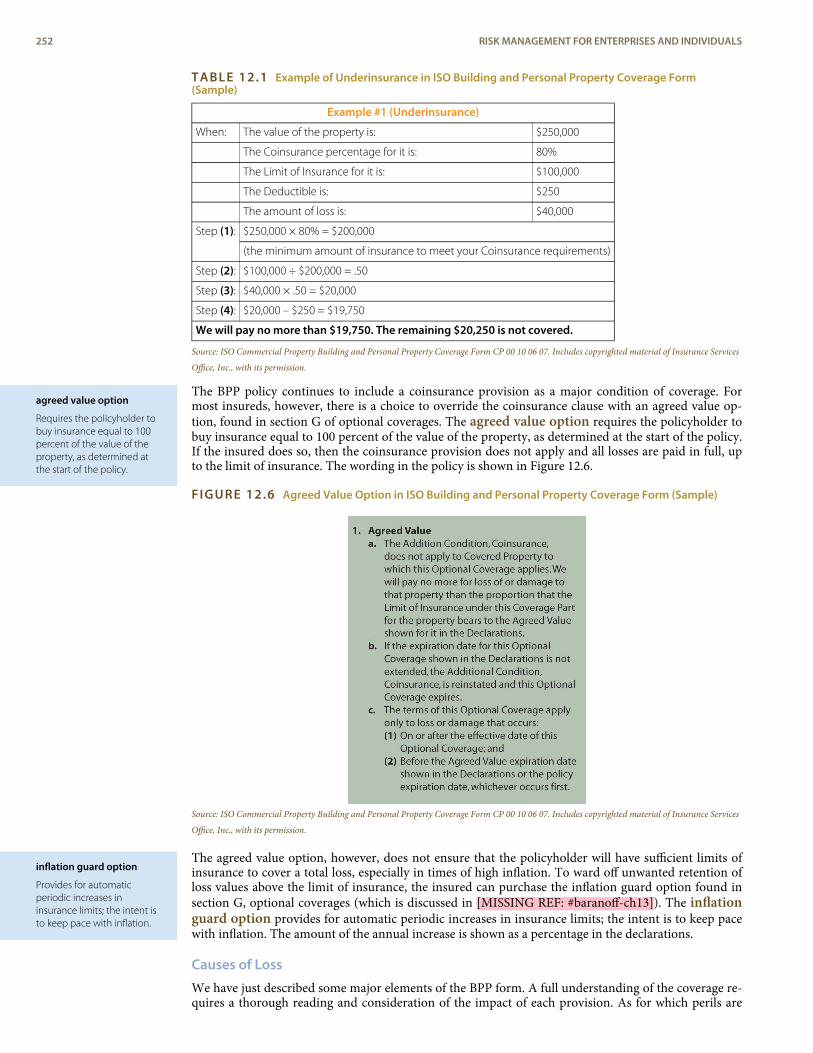
agreed value option
Requires the policyholder tobuy insurance equal to 100percent of the value of theproperty, as determined atthe start of the policy.
inflation guard option
Provides for automaticperiodic increases ininsurance limits; the intent isto keep pace with inflation.
TABLE 12.1 Example of Underinsurance in ISO Building and Personal Property Coverage Form(Sample)
Example #1 (Underinsurance)
When: The value of the property is: $250,000
The Coinsurance percentage for it is: 80%
The Limit of Insurance for it is: $100,000
The Deductible is: $250
The amount of loss is: $40,000
$250,000 × 80% = $200,000Step (1):
(the minimum amount of insurance to meet your Coinsurance requirements)
Step (2): $100,000 ÷ $200,000 = .50
Step (3): $40,000 × .50 = $20,000
Step (4): $20,000 – $250 = $19,750
We will pay no more than $19,750. The remaining $20,250 is not covered.
Source: ISO Commercial Property Building and Personal Property Coverage Form CP 00 10 06 07. Includes copyrighted material of Insurance Services
Office, Inc., with its permission.
The BPP policy continues to include a coinsurance provision as a major condition of coverage. Formost insureds, however, there is a choice to override the coinsurance clause with an agreed value op-tion, found in section G of optional coverages. The agreed value option requires the policyholder tobuy insurance equal to 100 percent of the value of the property, as determined at the start of the policy.If the insured does so, then the coinsurance provision does not apply and all losses are paid in full, upto the limit of insurance. The wording in the policy is shown in Figure 12.6.
FIGURE 12.6 Agreed Value Option in ISO Building and Personal Property Coverage Form (Sample)
Source: ISO Commercial Property Building and Personal Property Coverage Form CP 00 10 06 07. Includes copyrighted material of Insurance Services
Office, Inc., with its permission.
The agreed value option, however, does not ensure that the policyholder will have sufficient limits ofinsurance to cover a total loss, especially in times of high inflation. To ward off unwanted retention ofloss values above the limit of insurance, the insured can purchase the inflation guard option found insection G, optional coverages (which is discussed in [MISSING REF: #baranoff-ch13]). The inflationguard option provides for automatic periodic increases in insurance limits; the intent is to keep pacewith inflation. The amount of the annual increase is shown as a percentage in the declarations.
Causes of Loss
We have just described some major elements of the BPP form. A full understanding of the coverage re-quires a thorough reading and consideration of the impact of each provision. As for which perils are
252 RISK MANAGEMENT FOR ENTERPRISES AND INDIVIDUALS
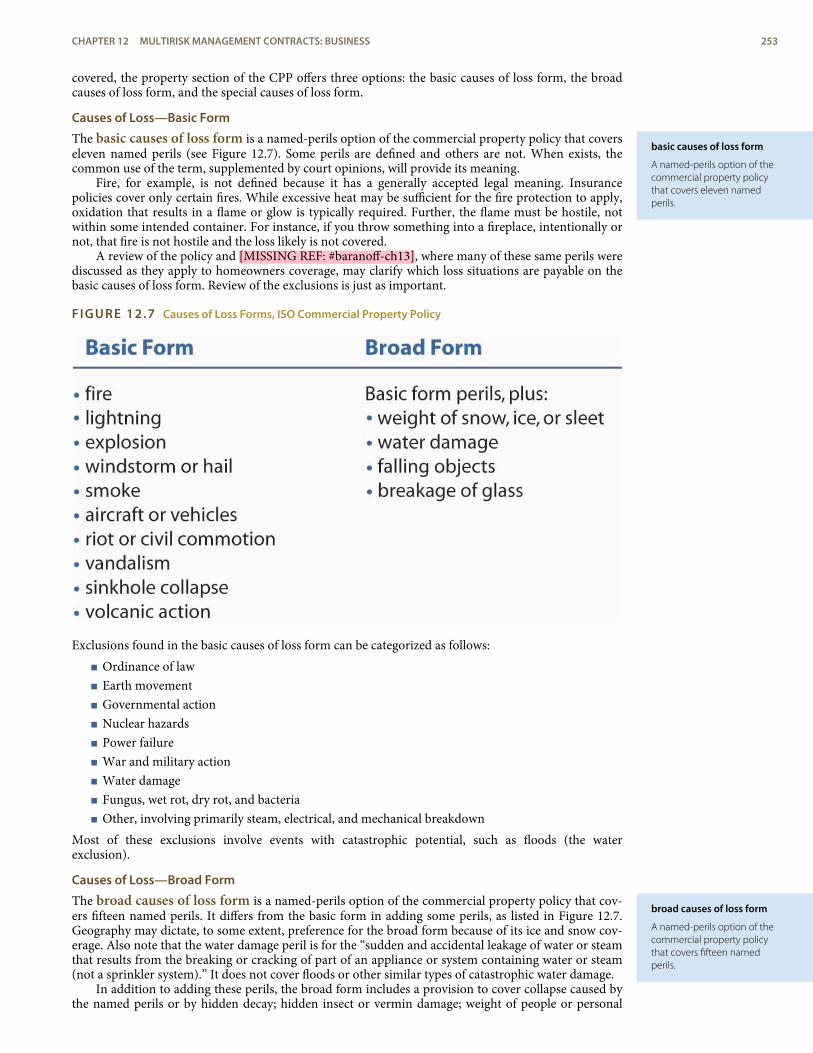
basic causes of loss form
A named-perils option of thecommercial property policythat covers eleven namedperils.
broad causes of loss form
A named-perils option of thecommercial property policythat covers fifteen namedperils.
covered, the property section of the CPP offers three options: the basic causes of loss form, the broadcauses of loss form, and the special causes of loss form.
Causes of Loss—Basic Form
The basic causes of loss form is a named-perils option of the commercial property policy that coverseleven named perils (see Figure 12.7). Some perils are defined and others are not. When exists, thecommon use of the term, supplemented by court opinions, will provide its meaning.
Fire, for example, is not defined because it has a generally accepted legal meaning. Insurancepolicies cover only certain fires. While excessive heat may be sufficient for the fire protection to apply,oxidation that results in a flame or glow is typically required. Further, the flame must be hostile, notwithin some intended container. For instance, if you throw something into a fireplace, intentionally ornot, that fire is not hostile and the loss likely is not covered.
A review of the policy and [MISSING REF: #baranoff-ch13], where many of these same perils werediscussed as they apply to homeowners coverage, may clarify which loss situations are payable on thebasic causes of loss form. Review of the exclusions is just as important.
FIGURE 12.7 Causes of Loss Forms, ISO Commercial Property Policy
Exclusions found in the basic causes of loss form can be categorized as follows:< Ordinance of law< Earth movement< Governmental action< Nuclear hazards< Power failure< War and military action< Water damage< Fungus, wet rot, dry rot, and bacteria< Other, involving primarily steam, electrical, and mechanical breakdown
Most of these exclusions involve events with catastrophic potential, such as floods (the waterexclusion).
Causes of Loss—Broad Form
The broad causes of loss form is a named-perils option of the commercial property policy that cov-ers fifteen named perils. It differs from the basic form in adding some perils, as listed in Figure 12.7.Geography may dictate, to some extent, preference for the broad form because of its ice and snow cov-erage. Also note that the water damage peril is for the “sudden and accidental leakage of water or steamthat results from the breaking or cracking of part of an appliance or system containing water or steam(not a sprinkler system).” It does not cover floods or other similar types of catastrophic water damage.
In addition to adding these perils, the broad form includes a provision to cover collapse caused bythe named perils or by hidden decay; hidden insect or vermin damage; weight of people or personal
CHAPTER 12 MULTIRISK MANAGEMENT CONTRACTS: BUSINESS 253
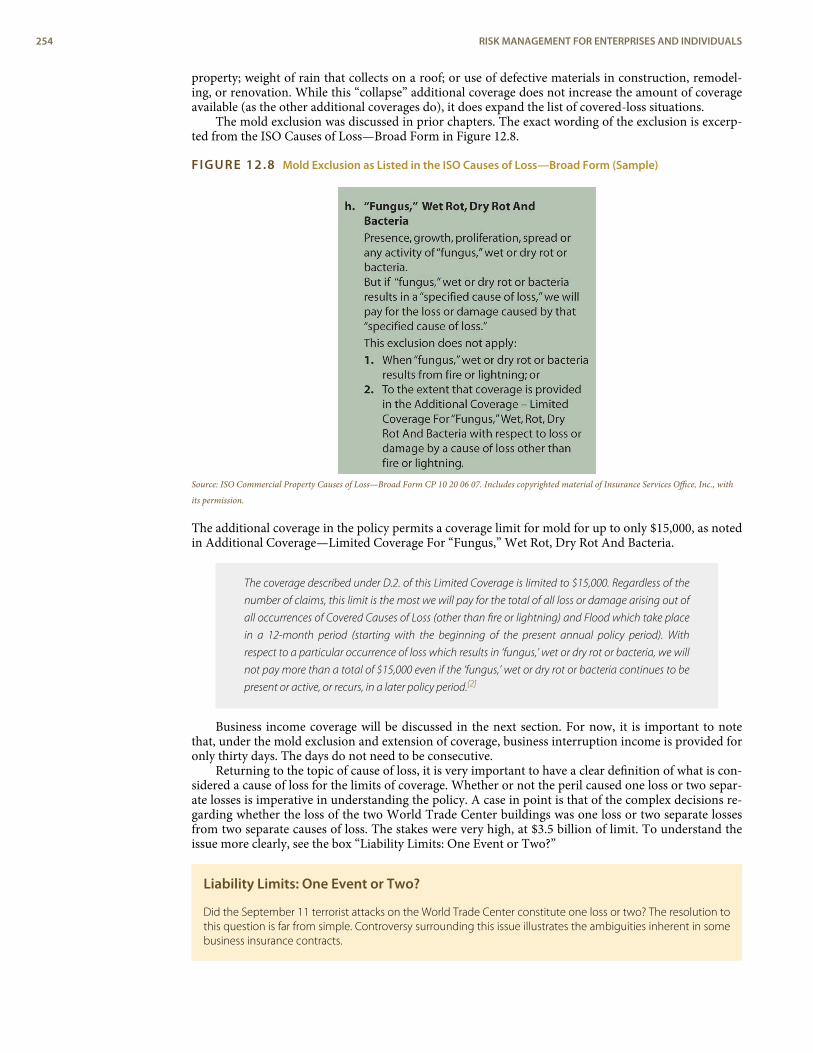
property; weight of rain that collects on a roof; or use of defective materials in construction, remodel-ing, or renovation. While this “collapse” additional coverage does not increase the amount of coverageavailable (as the other additional coverages do), it does expand the list of covered-loss situations.
The mold exclusion was discussed in prior chapters. The exact wording of the exclusion is excerp-ted from the ISO Causes of Loss—Broad Form in Figure 12.8.
FIGURE 12.8 Mold Exclusion as Listed in the ISO Causes of Loss—Broad Form (Sample)
Source: ISO Commercial Property Causes of Loss—Broad Form CP 10 20 06 07. Includes copyrighted material of Insurance Services Office, Inc., with
its permission.
The additional coverage in the policy permits a coverage limit for mold for up to only $15,000, as notedin Additional Coverage—Limited Coverage For “Fungus,” Wet Rot, Dry Rot And Bacteria.
The coverage described under D.2. of this Limited Coverage is limited to $15,000. Regardless of thenumber of claims, this limit is the most we will pay for the total of all loss or damage arising out ofall occurrences of Covered Causes of Loss (other than fire or lightning) and Flood which take placein a 12-month period (starting with the beginning of the present annual policy period). Withrespect to a particular occurrence of loss which results in ‘fungus,’ wet or dry rot or bacteria, we willnot pay more than a total of $15,000 even if the ‘fungus,’ wet or dry rot or bacteria continues to bepresent or active, or recurs, in a later policy period.[2]
Business income coverage will be discussed in the next section. For now, it is important to notethat, under the mold exclusion and extension of coverage, business interruption income is provided foronly thirty days. The days do not need to be consecutive.
Returning to the topic of cause of loss, it is very important to have a clear definition of what is con-sidered a cause of loss for the limits of coverage. Whether or not the peril caused one loss or two separ-ate losses is imperative in understanding the policy. A case in point is that of the complex decisions re-garding whether the loss of the two World Trade Center buildings was one loss or two separate lossesfrom two separate causes of loss. The stakes were very high, at $3.5 billion of limit. To understand theissue more clearly, see the box “Liability Limits: One Event or Two?”
Liability Limits: One Event or Two?
Did the September 11 terrorist attacks on the World Trade Center constitute one loss or two? The resolution tothis question is far from simple. Controversy surrounding this issue illustrates the ambiguities inherent in somebusiness insurance contracts.
254 RISK MANAGEMENT FOR ENTERPRISES AND INDIVIDUALS
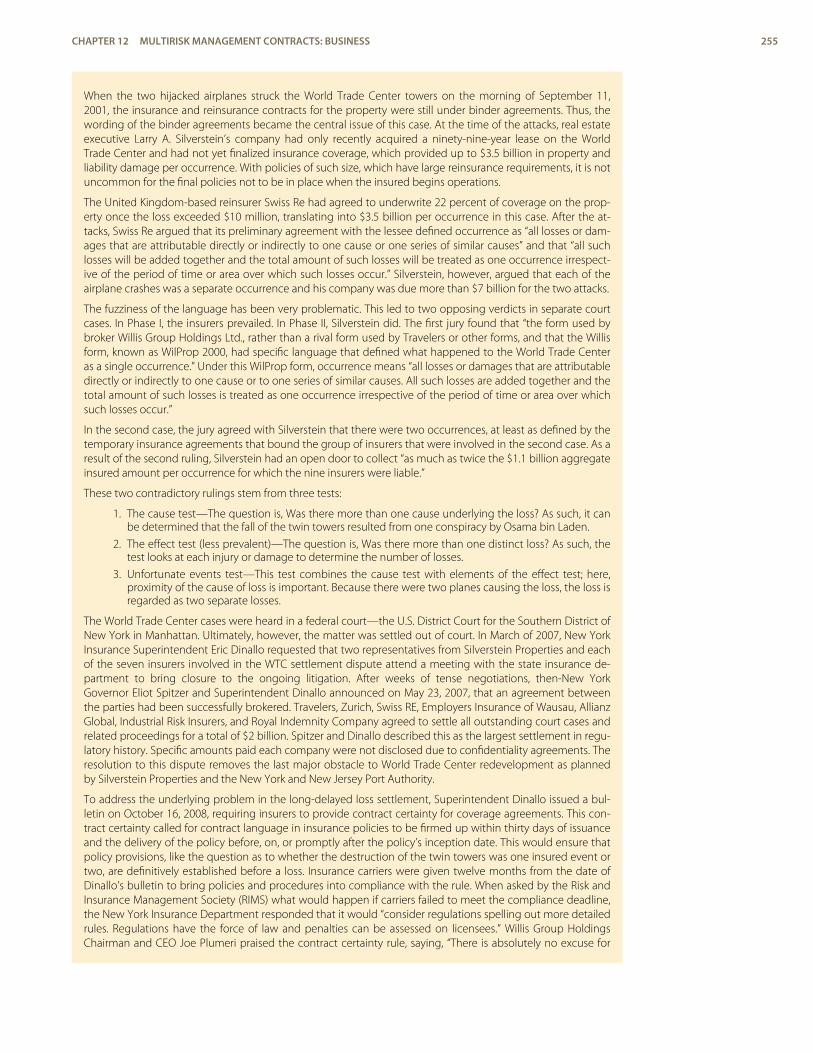
When the two hijacked airplanes struck the World Trade Center towers on the morning of September 11,2001, the insurance and reinsurance contracts for the property were still under binder agreements. Thus, thewording of the binder agreements became the central issue of this case. At the time of the attacks, real estateexecutive Larry A. Silverstein’s company had only recently acquired a ninety-nine-year lease on the WorldTrade Center and had not yet finalized insurance coverage, which provided up to $3.5 billion in property andliability damage per occurrence. With policies of such size, which have large reinsurance requirements, it is notuncommon for the final policies not to be in place when the insured begins operations.
The United Kingdom-based reinsurer Swiss Re had agreed to underwrite 22 percent of coverage on the prop-erty once the loss exceeded $10 million, translating into $3.5 billion per occurrence in this case. After the at-tacks, Swiss Re argued that its preliminary agreement with the lessee defined occurrence as “all losses or dam-ages that are attributable directly or indirectly to one cause or one series of similar causes” and that “all suchlosses will be added together and the total amount of such losses will be treated as one occurrence irrespect-ive of the period of time or area over which such losses occur.” Silverstein, however, argued that each of theairplane crashes was a separate occurrence and his company was due more than $7 billion for the two attacks.
The fuzziness of the language has been very problematic. This led to two opposing verdicts in separate courtcases. In Phase I, the insurers prevailed. In Phase II, Silverstein did. The first jury found that “the form used bybroker Willis Group Holdings Ltd., rather than a rival form used by Travelers or other forms, and that the Willisform, known as WilProp 2000, had specific language that defined what happened to the World Trade Centeras a single occurrence.” Under this WilProp form, occurrence means “all losses or damages that are attributabledirectly or indirectly to one cause or to one series of similar causes. All such losses are added together and thetotal amount of such losses is treated as one occurrence irrespective of the period of time or area over whichsuch losses occur.”
In the second case, the jury agreed with Silverstein that there were two occurrences, at least as defined by thetemporary insurance agreements that bound the group of insurers that were involved in the second case. As aresult of the second ruling, Silverstein had an open door to collect “as much as twice the $1.1 billion aggregateinsured amount per occurrence for which the nine insurers were liable.”
These two contradictory rulings stem from three tests:
1. The cause test—The question is, Was there more than one cause underlying the loss? As such, it canbe determined that the fall of the twin towers resulted from one conspiracy by Osama bin Laden.
2. The effect test (less prevalent)—The question is, Was there more than one distinct loss? As such, thetest looks at each injury or damage to determine the number of losses.
3. Unfortunate events test—This test combines the cause test with elements of the effect test; here,proximity of the cause of loss is important. Because there were two planes causing the loss, the loss isregarded as two separate losses.
The World Trade Center cases were heard in a federal court—the U.S. District Court for the Southern District ofNew York in Manhattan. Ultimately, however, the matter was settled out of court. In March of 2007, New YorkInsurance Superintendent Eric Dinallo requested that two representatives from Silverstein Properties and eachof the seven insurers involved in the WTC settlement dispute attend a meeting with the state insurance de-partment to bring closure to the ongoing litigation. After weeks of tense negotiations, then-New YorkGovernor Eliot Spitzer and Superintendent Dinallo announced on May 23, 2007, that an agreement betweenthe parties had been successfully brokered. Travelers, Zurich, Swiss RE, Employers Insurance of Wausau, AllianzGlobal, Industrial Risk Insurers, and Royal Indemnity Company agreed to settle all outstanding court cases andrelated proceedings for a total of $2 billion. Spitzer and Dinallo described this as the largest settlement in regu-latory history. Specific amounts paid each company were not disclosed due to confidentiality agreements. Theresolution to this dispute removes the last major obstacle to World Trade Center redevelopment as plannedby Silverstein Properties and the New York and New Jersey Port Authority.
To address the underlying problem in the long-delayed loss settlement, Superintendent Dinallo issued a bul-letin on October 16, 2008, requiring insurers to provide contract certainty for coverage agreements. This con-tract certainty called for contract language in insurance policies to be firmed up within thirty days of issuanceand the delivery of the policy before, on, or promptly after the policy’s inception date. This would ensure thatpolicy provisions, like the question as to whether the destruction of the twin towers was one insured event ortwo, are definitively established before a loss. Insurance carriers were given twelve months from the date ofDinallo’s bulletin to bring policies and procedures into compliance with the rule. When asked by the Risk andInsurance Management Society (RIMS) what would happen if carriers failed to meet the compliance deadline,the New York Insurance Department responded that it would “consider regulations spelling out more detailedrules. Regulations have the force of law and penalties can be assessed on licensees.” Willis Group HoldingsChairman and CEO Joe Plumeri praised the contract certainty rule, saying, “There is absolutely no excuse for
CHAPTER 12 MULTIRISK MANAGEMENT CONTRACTS: BUSINESS 255
special causes of loss form
An open perils or all riskcoverage option for thecommercial property policy.
policies to be delivered months after their inception, an all too commonplace practice in this business.…We’re in the business of keeping promises, and the insurance industry as a whole can do no less. We believethat the industry should police itself, take a principled approach to doing business, and adopt these measuresas soon as possible.”
The protracted settlement of the World Trade Center destruction provides a high-profile example of the prob-lems that can arise due to uncertain policy terms. This is not typically an issue with most insurance policieswritten on standardized forms approved by the state insurance department. In the case of large commercialclients, excess and surplus lines, and reinsurance markets, however, it is likely to come up due to complexity ofbusiness scope, degree of risk, and lack of regulatory authority. Should the contract certainty rule in New Yorkprove successful in curtailing disputes, RIMS anticipates that additional states will follow suit in passing similarrequirements.
Questions for Discussion
1. Which ruling do you agree with in this complex case? What is the justification for the ruling againstthe leaseholder in this case, and the one in favor of the leaseholder? Do you think this ruling is ethicalin light of the massive loss?
2. In ethical terms, who should really suffer the burden of the attack on America on September 11?Should it be any private citizen or the private insurance industry?
Sources: E. E. Mazier, “Swiss Re Presses ‘One Attack’ Theory,” National Underwriter, Property & Casualty/Risk & Benefits Management Edition, October 29,2001; E. E. Mazier, “Experts View Swiss Re WTC Lawsuit as Unprecedented Legal Quagmire,” National Underwriter Online News Service, October 31,2001; Mark E. Ruquet, “Insurers to Lose WTC Case: Agent Univ.,” National Underwriter Online News Service, July 22, 2002; E. E. Mazier, “Judges SendsWTC Claim to Jury Trial,” National Underwriter, Property & Casualty/Risk & Benefits Management Edition, June 10, 2002; E. E. Mazier, “Judge Rules WTCTerror Is One Event,” National Underwriter Online News Service, September 25, 2002; E. E. Mazier, “Swiss Re Silverstein WTC Case in Shambles,” NationalUnderwriter Online News Service, September 27, 2002; “Tale of Two Trials: Contract Language Underlies Contradictory World Trade Center Verdicts,”BestWire, December 9, 2004, accessed March 27, 2009, http://www3.ambest.com/Frames/FrameServer.asp?AltSrc=23&Tab=1&Site=news&refnum=70605; Mark E. Ruquet, “Spitzer Spearheads $2 Billion WTC Insurance Settlement,” NationalUnderwriter, Property & Casualty/Risk & Benefits Management Edition, May 23, 2007, accessed March 29, 2009, www.property-casualty.com/News/2007/5/Pages/Spitzer-Spearheads--2-Billion-WTC-Insurance-Settlement.aspx; Mark E. Ruquet, “WTC Deal Gets Dinallow Off on Right Foot,” NationalUnderwriter, Property & Casualty/Risk & Benefits Management Edition, June 18, 2007, accessed March 29, 2009, www.property-casualty.com/Issues/2007/24/Pages/WTC-Deal-Gets-Dinallo-Off-On-Right-Foot.aspx; Daniel Hays, “New N.Y. Regulation Calls For Policy Contract Certainty,” NationalUnderwriter, Property & Casualty/Risk & Benefits Management Edition, October 16, 2008, accessed March 29, 2009, www.property-casualty.com/News/2008/10/Pages/New-N-Y--Regulation-Calls-For-Policy-Contract-Certainty.aspx; Daniel Hays, “RIMS Reacts to N.Y. Contract Certainty Regulation,”National Underwriter, Property & Casualty/Risk & Benefits Management Edition, October 22, 2008, accessed March 29, 2009,www.property-casualty.com/News/2008/10/Pages/RIMS-Reacts-To-N-Y--Contract-Certainty-Regulation.aspx; Mark E. Ruquet, “Willis CEO ApplaudsN.Y. Move On Contract Certainty,” National Underwriter, Property & Casualty/Risk & Benefits Management Edition, October 17, 2008, accessed March29, 2009, http://www.property-casualty.com/News/2008/10/Pages/Willis-CEO-Applauds-N-Y--Move-On-Contract-Certainty.aspx; See all mediacoverage at the end of 2004 and afterward.
Causes of Loss—Special Form
The special causes of loss form is an open perils or all risk coverage option for the commercial prop-erty policy. That is, instead of listing those perils that are covered, the special form provides protectionfor all causes of loss not specifically excluded. In this form, then, the exclusions define the coverage. Re-member that all those exclusions listed in the basic form, except for the “other” category and some as-pects of the water damage exclusion, apply to the special form.
Most of the additional exclusions found in the special form relate either to catastrophic potentialsor to nonfortuitous events. Among the catastrophe exclusions are boiler or machinery explosions.Nonfortuitous exclusions relate to items such as wear and tear, smoke from agricultural smudging, anddamage to a building interior caused by weather conditions, unless the building exterior is damagedfirst.
Some experts believe that the greatest benefit of the special form over the broad form is coverageagainst theft. You may recall that theft is not a listed peril in the broad or the basic form. Coverage oftheft from any cause, however, is too costly for most policyholders. The special form, therefore, in-cludes some limitations on this protection. For instance, employee dishonesty and loss of property thatappears to have been stolen but for which there is no physical evidence of theft (“mysterious disappear-ance”) are not covered. In addition, certain types of property such as patterns, dyes, furs, jewelry, andtickets are covered against theft only up to specified amounts. The special form also provides coveragefor property in transit.
256 RISK MANAGEMENT FOR ENTERPRISES AND INDIVIDUALS
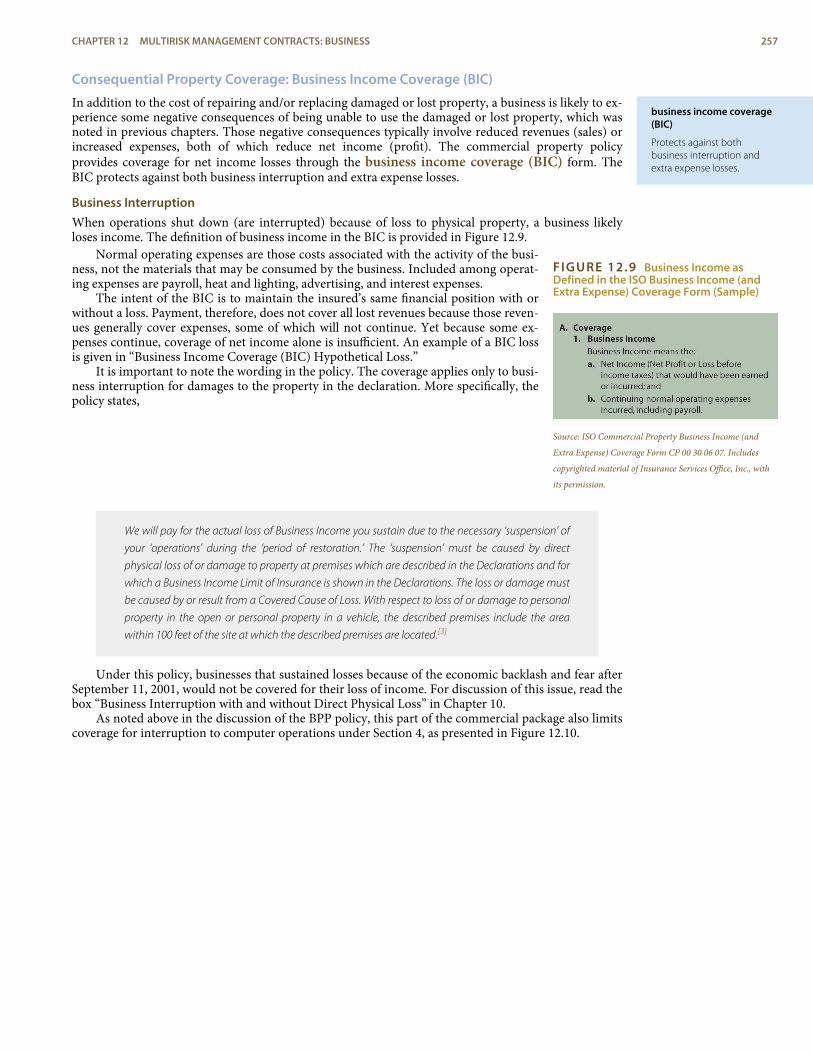
business income coverage(BIC)
Protects against bothbusiness interruption andextra expense losses.
FIGURE 12.9 Business Income asDefined in the ISO Business Income (andExtra Expense) Coverage Form (Sample)
Source: ISO Commercial Property Business Income (and
Extra Expense) Coverage Form CP 00 30 06 07. Includes
copyrighted material of Insurance Services Office, Inc., with
its permission.
Consequential Property Coverage: Business Income Coverage (BIC)
In addition to the cost of repairing and/or replacing damaged or lost property, a business is likely to ex-perience some negative consequences of being unable to use the damaged or lost property, which wasnoted in previous chapters. Those negative consequences typically involve reduced revenues (sales) orincreased expenses, both of which reduce net income (profit). The commercial property policyprovides coverage for net income losses through the business income coverage (BIC) form. TheBIC protects against both business interruption and extra expense losses.
Business InterruptionWhen operations shut down (are interrupted) because of loss to physical property, a business likelyloses income. The definition of business income in the BIC is provided in Figure 12.9.
Normal operating expenses are those costs associated with the activity of the busi-ness, not the materials that may be consumed by the business. Included among operat-ing expenses are payroll, heat and lighting, advertising, and interest expenses.
The intent of the BIC is to maintain the insured’s same financial position with orwithout a loss. Payment, therefore, does not cover all lost revenues because those reven-ues generally cover expenses, some of which will not continue. Yet because some ex-penses continue, coverage of net income alone is insufficient. An example of a BIC lossis given in “Business Income Coverage (BIC) Hypothetical Loss.”
It is important to note the wording in the policy. The coverage applies only to busi-ness interruption for damages to the property in the declaration. More specifically, thepolicy states,
We will pay for the actual loss of Business Income you sustain due to the necessary ‘suspension’ ofyour ‘operations’ during the ‘period of restoration.’ The ‘suspension’ must be caused by directphysical loss of or damage to property at premises which are described in the Declarations and forwhich a Business Income Limit of Insurance is shown in the Declarations. The loss or damage mustbe caused by or result from a Covered Cause of Loss. With respect to loss of or damage to personalproperty in the open or personal property in a vehicle, the described premises include the areawithin 100 feet of the site at which the described premises are located.[3]
Under this policy, businesses that sustained losses because of the economic backlash and fear afterSeptember 11, 2001, would not be covered for their loss of income. For discussion of this issue, read thebox “Business Interruption with and without Direct Physical Loss” in Chapter 10.
As noted above in the discussion of the BPP policy, this part of the commercial package also limitscoverage for interruption to computer operations under Section 4, as presented in Figure 12.10.
CHAPTER 12 MULTIRISK MANAGEMENT CONTRACTS: BUSINESS 257
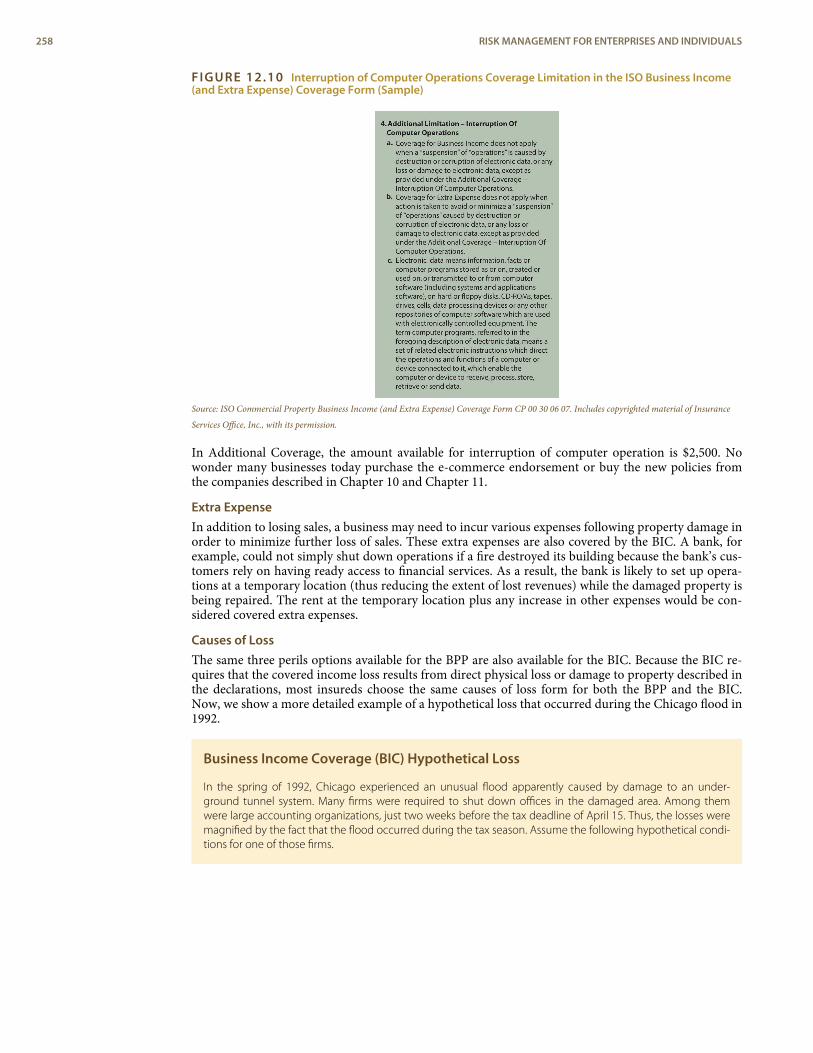
FIGURE 12.10 Interruption of Computer Operations Coverage Limitation in the ISO Business Income(and Extra Expense) Coverage Form (Sample)
Source: ISO Commercial Property Business Income (and Extra Expense) Coverage Form CP 00 30 06 07. Includes copyrighted material of Insurance
Services Office, Inc., with its permission.
In Additional Coverage, the amount available for interruption of computer operation is $2,500. Nowonder many businesses today purchase the e-commerce endorsement or buy the new policies fromthe companies described in Chapter 10 and Chapter 11.
Extra ExpenseIn addition to losing sales, a business may need to incur various expenses following property damage inorder to minimize further loss of sales. These extra expenses are also covered by the BIC. A bank, forexample, could not simply shut down operations if a fire destroyed its building because the bank’s cus-tomers rely on having ready access to financial services. As a result, the bank is likely to set up opera-tions at a temporary location (thus reducing the extent of lost revenues) while the damaged property isbeing repaired. The rent at the temporary location plus any increase in other expenses would be con-sidered covered extra expenses.
Causes of LossThe same three perils options available for the BPP are also available for the BIC. Because the BIC re-quires that the covered income loss results from direct physical loss or damage to property described inthe declarations, most insureds choose the same causes of loss form for both the BPP and the BIC.Now, we show a more detailed example of a hypothetical loss that occurred during the Chicago flood in1992.
Business Income Coverage (BIC) Hypothetical Loss
In the spring of 1992, Chicago experienced an unusual flood apparently caused by damage to an under-ground tunnel system. Many firms were required to shut down offices in the damaged area. Among themwere large accounting organizations, just two weeks before the tax deadline of April 15. Thus, the losses weremagnified by the fact that the flood occurred during the tax season. Assume the following hypothetical condi-tions for one of those firms.
258 RISK MANAGEMENT FOR ENTERPRISES AND INDIVIDUALS
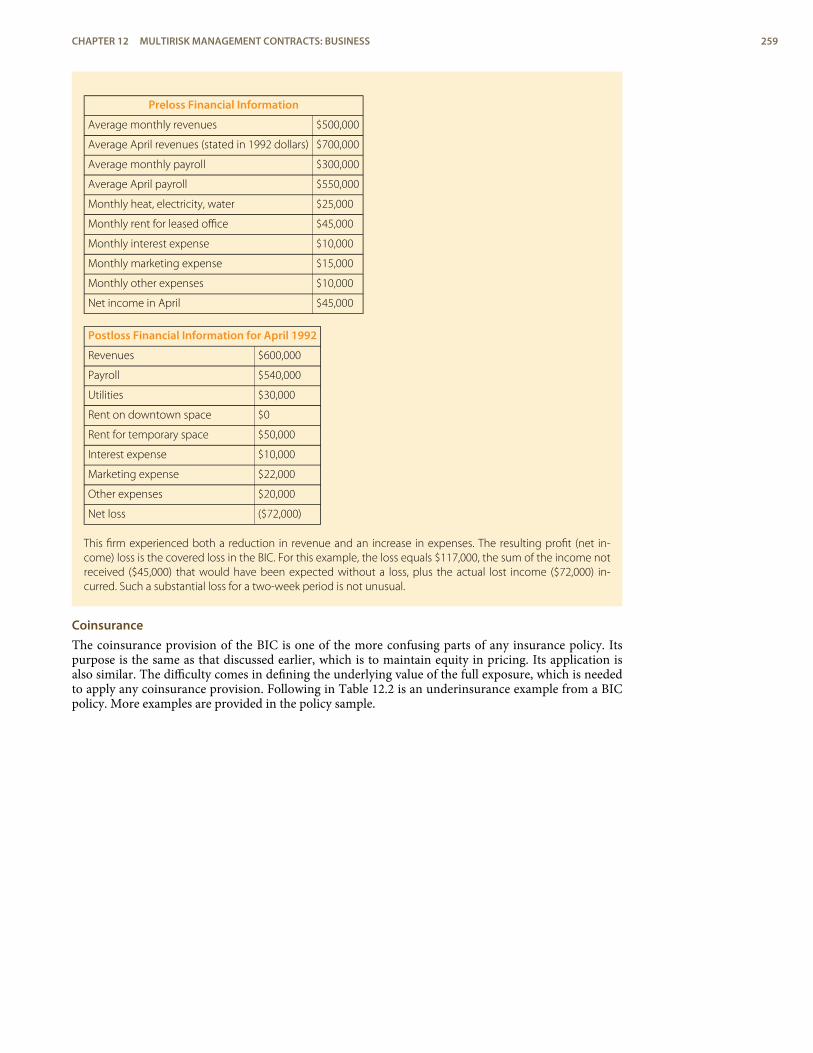
Preloss Financial Information
Average monthly revenues $500,000
Average April revenues (stated in 1992 dollars) $700,000
Average monthly payroll $300,000
Average April payroll $550,000
Monthly heat, electricity, water $25,000
Monthly rent for leased office $45,000
Monthly interest expense $10,000
Monthly marketing expense $15,000
Monthly other expenses $10,000
Net income in April $45,000
Postloss Financial Information for April 1992
Revenues $600,000
Payroll $540,000
Utilities $30,000
Rent on downtown space $0
Rent for temporary space $50,000
Interest expense $10,000
Marketing expense $22,000
Other expenses $20,000
Net loss ($72,000)
This firm experienced both a reduction in revenue and an increase in expenses. The resulting profit (net in-come) loss is the covered loss in the BIC. For this example, the loss equals $117,000, the sum of the income notreceived ($45,000) that would have been expected without a loss, plus the actual lost income ($72,000) in-curred. Such a substantial loss for a two-week period is not unusual.
CoinsuranceThe coinsurance provision of the BIC is one of the more confusing parts of any insurance policy. Itspurpose is the same as that discussed earlier, which is to maintain equity in pricing. Its application isalso similar. The difficulty comes in defining the underlying value of the full exposure, which is neededto apply any coinsurance provision. Following in Table 12.2 is an underinsurance example from a BICpolicy. More examples are provided in the policy sample.
CHAPTER 12 MULTIRISK MANAGEMENT CONTRACTS: BUSINESS 259
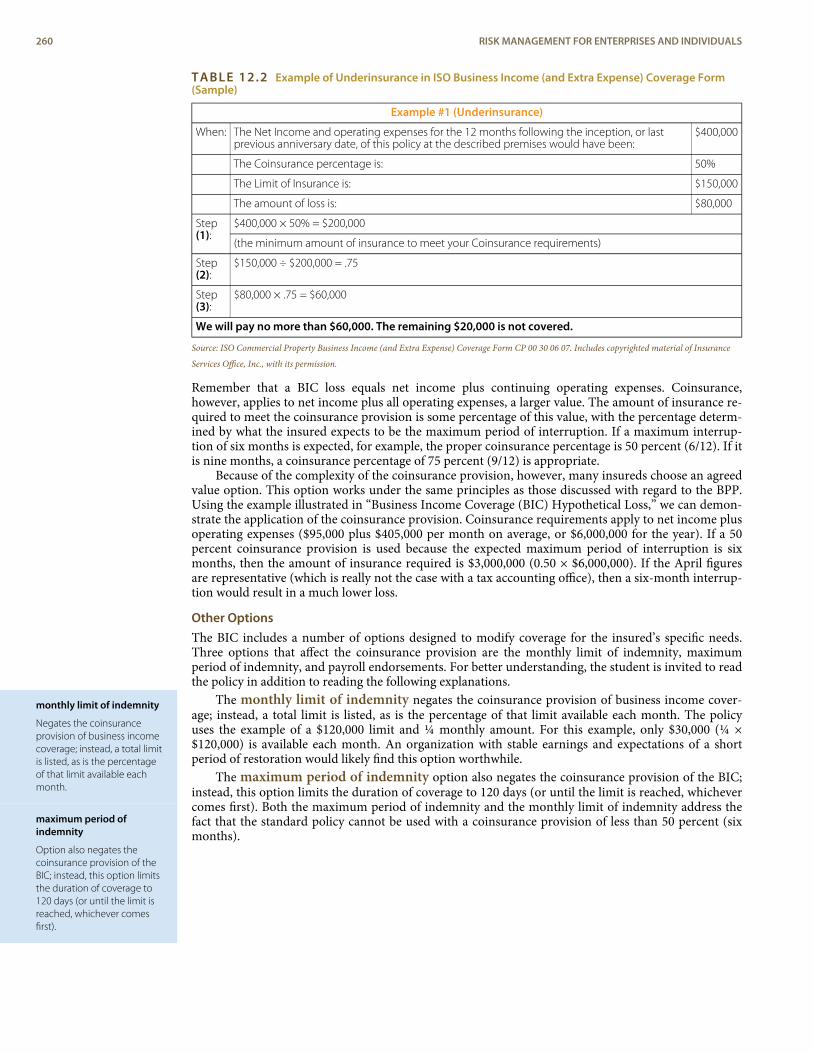
monthly limit of indemnity
Negates the coinsuranceprovision of business incomecoverage; instead, a total limitis listed, as is the percentageof that limit available eachmonth.
maximum period ofindemnity
Option also negates thecoinsurance provision of theBIC; instead, this option limitsthe duration of coverage to120 days (or until the limit isreached, whichever comesfirst).
TABLE 12.2 Example of Underinsurance in ISO Business Income (and Extra Expense) Coverage Form(Sample)
Example #1 (Underinsurance)
When: The Net Income and operating expenses for the 12 months following the inception, or lastprevious anniversary date, of this policy at the described premises would have been:
$400,000
The Coinsurance percentage is: 50%
The Limit of Insurance is: $150,000
The amount of loss is: $80,000
$400,000 × 50% = $200,000Step(1):
(the minimum amount of insurance to meet your Coinsurance requirements)
Step(2):
$150,000 ÷ $200,000 = .75
Step(3):
$80,000 × .75 = $60,000
We will pay no more than $60,000. The remaining $20,000 is not covered.
Source: ISO Commercial Property Business Income (and Extra Expense) Coverage Form CP 00 30 06 07. Includes copyrighted material of Insurance
Services Office, Inc., with its permission.
Remember that a BIC loss equals net income plus continuing operating expenses. Coinsurance,however, applies to net income plus all operating expenses, a larger value. The amount of insurance re-quired to meet the coinsurance provision is some percentage of this value, with the percentage determ-ined by what the insured expects to be the maximum period of interruption. If a maximum interrup-tion of six months is expected, for example, the proper coinsurance percentage is 50 percent (6/12). If itis nine months, a coinsurance percentage of 75 percent (9/12) is appropriate.
Because of the complexity of the coinsurance provision, however, many insureds choose an agreedvalue option. This option works under the same principles as those discussed with regard to the BPP.Using the example illustrated in “Business Income Coverage (BIC) Hypothetical Loss,” we can demon-strate the application of the coinsurance provision. Coinsurance requirements apply to net income plusoperating expenses ($95,000 plus $405,000 per month on average, or $6,000,000 for the year). If a 50percent coinsurance provision is used because the expected maximum period of interruption is sixmonths, then the amount of insurance required is $3,000,000 (0.50 × $6,000,000). If the April figuresare representative (which is really not the case with a tax accounting office), then a six-month interrup-tion would result in a much lower loss.
Other OptionsThe BIC includes a number of options designed to modify coverage for the insured’s specific needs.Three options that affect the coinsurance provision are the monthly limit of indemnity, maximumperiod of indemnity, and payroll endorsements. For better understanding, the student is invited to readthe policy in addition to reading the following explanations.
The monthly limit of indemnity negates the coinsurance provision of business income cover-age; instead, a total limit is listed, as is the percentage of that limit available each month. The policyuses the example of a $120,000 limit and ¼ monthly amount. For this example, only $30,000 (¼ ×$120,000) is available each month. An organization with stable earnings and expectations of a shortperiod of restoration would likely find this option worthwhile.
The maximum period of indemnity option also negates the coinsurance provision of the BIC;instead, this option limits the duration of coverage to 120 days (or until the limit is reached, whichevercomes first). Both the maximum period of indemnity and the monthly limit of indemnity address thefact that the standard policy cannot be used with a coinsurance provision of less than 50 percent (sixmonths).
260 RISK MANAGEMENT FOR ENTERPRISES AND INDIVIDUALS
payroll endorsement
Allows the insured to deductsome or all payroll expensesfrom the value of operatingexpenses before calculatingthe coinsurance requirement.
Instead of negating the coinsurance provision, as do the two options just discussed, the payrollendorsement allows the insured to deduct some or all payroll expenses from the value of operatingexpenses before calculating the coinsurance requirement. Doing so allows the insured to purchase lessinsurance (and usually pay lower premiums) and still meet the coinsurance provision. It also excludespayroll from covered expenses, however, so the insured must feel confident that payroll would not bemaintained during a shutdown. A common payroll endorsement includes ninety days of payroll ex-pense in the coinsurance calculation (and BIC coverage), assuming that a short shutdown might allowthe insured to continue to pay employees. For a longer shutdown, termination of employment mightbe more cost effective.
K E Y T A K E A W A Y S
In this section you studied the commercial package policy (CPP) and the commercial property component ofthe CPP:
< The commercial package policy (CPP) is a modular business insurance option that bundles coverages suchas commercial property, commercial general liability, commercial inland marine, professional liability, andmore, into a single policy.
< The CPP contains the standard elements: cover page, common policy conditions, and commondeclarations.
< Common business property exposures are insured through the commercial property policy of the CPP.
< Property declarations and conditions of the commercial property policy form identify the covered location,property values and limits, premiums, deductibles, and other items.
< The commercial property policy’s building and personal property (BPP) form provides coverage for directphysical loss to buildings and contents and additional or extended coverages, per the insured’s valuationprovision up to the limits of insurance and subject to listed exclusions.
< Three causes of loss options are available in the BPP: basic (eleven named perils), broad (fifteen namedperils), and special (open perils), all subject to exclusions.
< The commercial property policy provides coverage of net income losses as a result of being unable to usedamaged or lost property through the business income coverage (BIC) form.
< BIC protects against business interruption and extra expense losses.
< The BIC offers the same three cause of loss options as the BPP.
< Both the BPP and the BIC are subject to coinsurance provisions; this can be modified in the BIC throughuse of the monthly limit of indemnity, maximum period of indemnity, and payroll endorsements.
CHAPTER 12 MULTIRISK MANAGEMENT CONTRACTS: BUSINESS 261
D I S C U S S I O N Q U E S T I O N S
1. What types of property are covered in the BPP? What are some examples of excluded property, and whyare they excluded?
2. How can an insured get around the coinsurance provision in the BPP? Why might an insured prefer to dothis?
3. What kinds of losses are covered in the BIC? Provide examples.
4. The building where Alpha Mortgage Company’s office was located received minor smoke damage,forcing the company to relocate its operations for one month. Assuming standard BIC coverage and thefollowing hypothetical conditions, what amount of benefits could the company expect to receive?
Preloss Financial Information
Average monthly revenues $220,000
Average monthly payroll $100,000
Monthly heat, electricity, water $25,000
Monthly rent for leased office $25,000
Monthly interest expense $10,000
Monthly marketing expense $5,000
Monthly other expenses $5,000
Postloss Financial Information for One Month
Revenues $170,000
Payroll $100,000
Utilities $30,000
Rent on leased office $0
Rent for temporary space $50,000
Interest expense $0
Marketing expense $6,000
Other expenses $12,000
5. The Bravo Multiplex Movie Theater has a BIC coverage limit of $200,000 with a coinsurance percentage of50 percent. Over the previous one-year period, the theater’s net income and operating expenses totaled$400,000. If Bravo is forced to shut down one of its eight theaters for six months (incurring a total loss of$60,000), how much will BIC cover? Does the company have enough insurance? Do they have otheroptions?
6. Assume that the Steinman Shoe Station owns the $1 million building in which it operates, maintainsinventory and other business properties in the building worth $700,000, and often has possession ofpeople’s property up to a value of $50,000 while they are being repaired. For each of the following losses,what, if anything, will Steinman’s BPP insurer pay? Limits are $1 million on coverage A and $800,000 oncoverage B. The broad causes-of-loss form is used and there was no e-commerce endorsement. Explainyour answers.
a. Wind damage rips off tiles from the roof, costing $20,000 to replace. The actual cash value is$17,000.
b. An angry arsonist starts a fire. The building requires repairs of $15,000, $17,000 of inventory isdestroyed, and $2,000 of other people’s property is burned.
c. A water pipe bursts, destroying $22,000 of inventory and requiring $10,000 to repair the pipe.
d. The computer system crashes for three days.
7. Steinman also bought a BIC with a limit of $250,000 and a 50 percent coinsurance clause. No otherendorsements are used. A limited income statement for last year is shown below.
262 RISK MANAGEMENT FOR ENTERPRISES AND INDIVIDUALS
fidelity bond
A guarantee provided toemployers by each employeepromising loyalty andfaithfulness and stipulating amechanism for financialrecovery should the promisebe broken.
Revenues $2,000,000
Less:
Cost of goods sold $800,000
Utilities $200,000
Payroll $400,000
Other expenses $300,000
$1,700,000
Profit $300,000
a. How much in expenses does Steinman expect to be noncontinuing in the event of a shutdown?Explain.
b. What is the longest shutdown period Steinman would expect following a loss?
c. If a three-month closing occurred following the roof collapsing due to the weight of snow, whatdo you think would be the loss? Explain.
3. OTHER PROPERTY COVERAGES
L E A R N I N G O B J E C T I V E S
In this section we elaborate on the different types of optional property coverage available in the CPPoffering insurance on property otherwise excluded or to meet the special needs of businesses:
< The Crime and Fidelity insurance program< Inland marine (IM) insurance< Boiler and machinery (B&M) insurance< The Capital Assets Program< The business owners policy (BOP)
The commercial package policy is designed to accommodate separate and sometimes special propertyneeds of insureds. Refer again to Figure 12.1.
3.1 Commercial Crime and Fidelity CoverageThe program includes enhancements that protect businesses and government entities against thefollowing:
< Employee theft< Burglary< Other workplace crimes
Historically, crime losses have been insured separately from other property losses. Perhaps the separa-tion was intended to standardize the risk; exposure to crime loss may involve quite different loss-con-trol needs and frequency and severity estimates from those associated with exposure to fire, weatherdamage, or other BPP type losses. Furthermore, within the crime coverage, employee dishonesty hastypically been insured separately from other property crimes, likely also in an effort to recognize vari-ations in risk and loss-control needs between the two. Employee dishonesty protection began as a bond(called a fidelity bond), which was a guarantee provided to employers by each employee promisingloyalty and faithfulness and stipulating a mechanism for financial recovery should the promise bebroken. As a result, bonding companies developed to protect against employee crimes, while insurersexpanded their coverage separately to protect against other property-related crimes.
Today, ISO has a Crime and Fidelity insurance program.[4] The ISO enhancements include cover-age for losses caused by employee theft of the following:
< Money< Securities
CHAPTER 12 MULTIRISK MANAGEMENT CONTRACTS: BUSINESS 263
inland marine (IM)insurance
Covers nonwater forms oftransportation such as railsand trucking.
ocean marine insurance
Coverage for property whilebeing transported by water(including coverage for thevessels doing thetransporting).
boiler and machinery(B&M) insurance
Protects against loss thatresults from property damageto the insured’s own propertyand to nonowned propertycaused by explosions or othersudden breakdowns ofboilers and machinery.
Capital Assets Program
Provides businesses coverageon a blanket,replacement-cost basiswithout a coinsuranceprovision to sufficiently largeaccounts.
business owners policy(BOP)
Provides a comprehensivepolicy that would omit theneed for small businesses tomake numerous decisionswhile also incorporatingcoverage on exposures oftenoverlooked.
< Other property of the insured< Clients’ property on the clients’ premises
Also available is coverage for additional perils, including the following:< Forgery or alteration of negotiable instruments< Loss through transferring money and securities by fraudulent telephone or fax instructions< Extortion threats targeting the insured’s property
3.2 Inland MarineYou may recall that the BPP covers personal property while it is located at the described premises.Many businesses, however, move property from one location to another or have specialized personalproperty that requires insurance coverage not intended by the BPP. These needs are often met by in-land marine (IM) insurance. Despite its name, inland marine (IM) insurance covers nonwaterforms of transportation such as rails and trucking.
Inland marine insurance is an outgrowth of ocean marine insurance, which is coverage forproperty while being transported by water (including coverage for the vessels doing the transporting).IM tends to be broad coverage, often on an open-perils basis and generally for replacement cost. Exclu-sions tend to involve nonfortuitous events, such as wear and tear and intentionally caused loss. Theprotection IM provides is for inland transportation and specialized equipment.
3.3 Boiler and Machinery CoverageWhen a boiler or similar piece of machinery explodes, the cost tends to be enormous. Typically, the en-tire building is destroyed, as are surrounding properties. Anyone in or near the building may be killedor badly injured. Furthermore, the overwhelming majority of such explosions can be preventedthrough periodic inspection and excellent maintenance. As a result, a boiler inspection industry de-veloped, which ultimately became an inspection and insurance industry.
Boiler and machinery (B&M) insurance protects against loss that results from property dam-age to the insured’s own property and to nonowned property caused by explosions or other suddenbreakdowns of boilers and machinery. (Bodily injury liability coverage can be added by endorsement.)The bulk of the premium, however, goes toward costs of inspection and loss control. Any business thatuses a boiler or similar type of machinery needs to consider purchase of this coverage because the po-tential loss is large while the probability of loss is low if proper care is maintained.
3.4 Capital Assets ProgramThe Insurance Services Office introduced “the ISO Capital Assets Program—a manufacturer’s outputtype policy—that enables insurers to provide large and medium commercial accounts superior cover-age and pricing flexibility for buildings and business personal property.”[5]
The Capital Assets Program provides businesses coverage on a blanket, replacement-cost basiswithout a coinsurance provision to sufficiently large accounts. The program also provides options tovalue property at actual cash value, agreed value, or (for buildings) functional replacement cost. Underthe program, “Business income and extra expense coverages are written into the form and can be activ-ated by entries on the policy declaration page.”
3.5 Business Owners PolicyIn 1976, the ISO developed its first business owners policy, which was designed for small businesses inthe office, mercantile, and processing categories and for apartment houses and condominium associ-ations. The intent of the business owners policy (BOP) was to provide a comprehensive policy thatwould omit the need for small businesses to make numerous decisions, while also incorporating cover-age on exposures often overlooked. The original BOP was one policy covering both property and liabil-ity exposures. The current program incorporates the BOP into the commercial package policy throughseparate property and liability policies designed for small businesses. When these coverages are com-bined, they provide protection nearly identical to the old BOP policy.
264 RISK MANAGEMENT FOR ENTERPRISES AND INDIVIDUALS
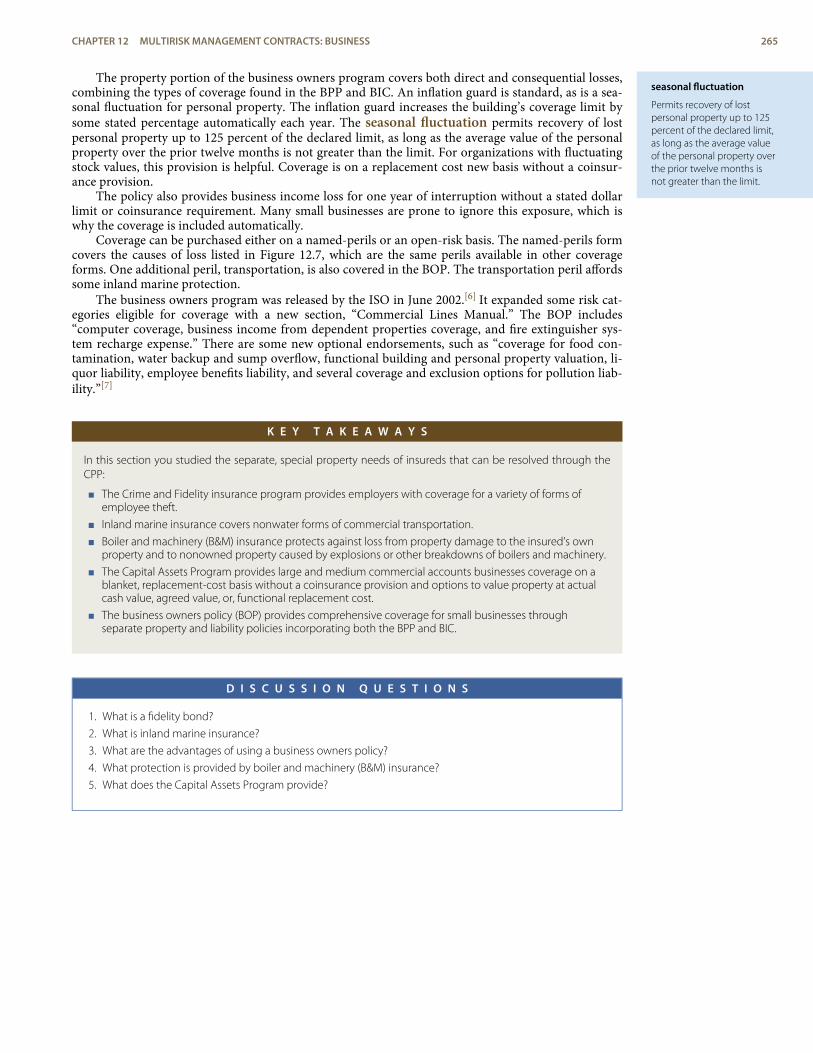
seasonal fluctuation
Permits recovery of lostpersonal property up to 125percent of the declared limit,as long as the average valueof the personal property overthe prior twelve months isnot greater than the limit.
The property portion of the business owners program covers both direct and consequential losses,combining the types of coverage found in the BPP and BIC. An inflation guard is standard, as is a sea-sonal fluctuation for personal property. The inflation guard increases the building’s coverage limit bysome stated percentage automatically each year. The seasonal fluctuation permits recovery of lostpersonal property up to 125 percent of the declared limit, as long as the average value of the personalproperty over the prior twelve months is not greater than the limit. For organizations with fluctuatingstock values, this provision is helpful. Coverage is on a replacement cost new basis without a coinsur-ance provision.
The policy also provides business income loss for one year of interruption without a stated dollarlimit or coinsurance requirement. Many small businesses are prone to ignore this exposure, which iswhy the coverage is included automatically.
Coverage can be purchased either on a named-perils or an open-risk basis. The named-perils formcovers the causes of loss listed in Figure 12.7, which are the same perils available in other coverageforms. One additional peril, transportation, is also covered in the BOP. The transportation peril affordssome inland marine protection.
The business owners program was released by the ISO in June 2002.[6] It expanded some risk cat-egories eligible for coverage with a new section, “Commercial Lines Manual.” The BOP includes“computer coverage, business income from dependent properties coverage, and fire extinguisher sys-tem recharge expense.” There are some new optional endorsements, such as “coverage for food con-tamination, water backup and sump overflow, functional building and personal property valuation, li-quor liability, employee benefits liability, and several coverage and exclusion options for pollution liab-ility.”[7]
K E Y T A K E A W A Y S
In this section you studied the separate, special property needs of insureds that can be resolved through theCPP:
< The Crime and Fidelity insurance program provides employers with coverage for a variety of forms ofemployee theft.
< Inland marine insurance covers nonwater forms of commercial transportation.
< Boiler and machinery (B&M) insurance protects against loss from property damage to the insured’s ownproperty and to nonowned property caused by explosions or other breakdowns of boilers and machinery.
< The Capital Assets Program provides large and medium commercial accounts businesses coverage on ablanket, replacement-cost basis without a coinsurance provision and options to value property at actualcash value, agreed value, or, functional replacement cost.
< The business owners policy (BOP) provides comprehensive coverage for small businesses throughseparate property and liability policies incorporating both the BPP and BIC.
D I S C U S S I O N Q U E S T I O N S
1. What is a fidelity bond?
2. What is inland marine insurance?
3. What are the advantages of using a business owners policy?
4. What protection is provided by boiler and machinery (B&M) insurance?
5. What does the Capital Assets Program provide?
CHAPTER 12 MULTIRISK MANAGEMENT CONTRACTS: BUSINESS 265
claims-made basis
A policy that limits the periodin which the claims forinjuries need to be made.
4. COMMERCIAL GENERAL LIABILITY POLICY ANDCOMMERCIAL UMBRELLA LIABILITY POLICY
L E A R N I N G O B J E C T I V E S
In this section we elaborate on commercial liability insurance solutions:
< The five sections of the commercial general liability (CGL) policy< Features of the commercial umbrella liability policy
4.1 Commercial General Liability PolicyAs discussed in Chapter 11, businesses have a wide variety of liability exposures. Many of these are in-surable through the CGL.
CGL Policy Format
The format of the CGL is very similar to that of the BPP and BIC. The CGL contract includes thefollowing:
< CGL declaration form< CGL coverage form< Any appropriate endorsements, such as the mold exclusion
The CGL itself is comprised of the following five sections:1. Coverages2. Who is an insured3. Limits of insurance4. CGL conditions5. Definitions
Coverage is available either on an occurrence or on a claims-made basis. Claims-made basis is apolicy that limits the period in which the claims for injuries need to be made. Under such a program,claims for injuries that occurred thirty years ago cannot be covered. The claim needs to be filed (made)during the coverage period for injuries that occur during the same period or the designated retroactivetime. This limitation is the result of insurers having to pay for asbestos injuries that occurred years be-fore knowledge of the exposure outcome was discovered. Insurers that provided coverage for those in-juries thirty years ago were required to pay regardless of when the claims were made. Claims for pastunforeseen injuries were not included in the loss development (discussed in Chapter 6) and caused ma-jor unexpected losses to the insurance industry. If the claims-made option is chosen, a sixth section isincorporated into the policy, the extended reporting periods provision.
Coverages
The CGL provides three types of coverage:1. Bodily injury and property damage liability2. Personal and advertising injury liability3. Medical payments
Each coverage involves its own insuring agreement and set of exclusions. Each also provides a distinctlimit of insurance, although an aggregate limit may apply to the sum of all costs under each coveragefor the policy period. Other aggregates also apply, as discussed in the policy limits section below.
266 RISK MANAGEMENT FOR ENTERPRISES AND INDIVIDUALS
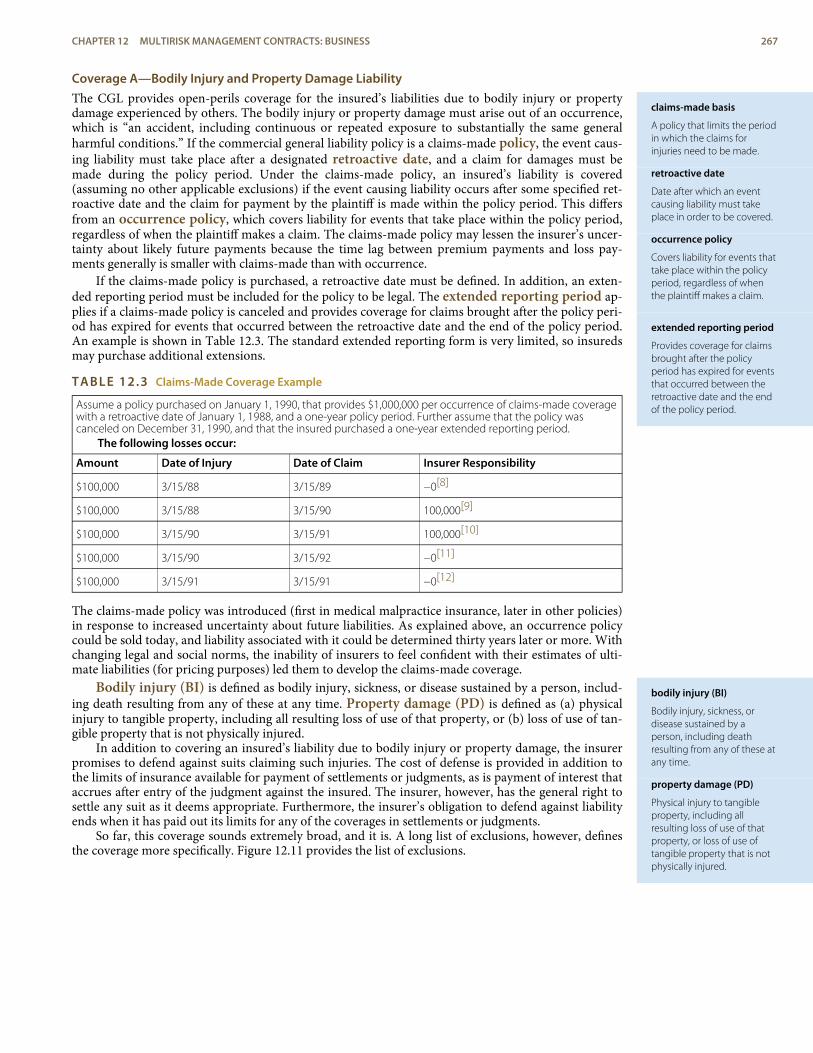
claims-made basis
A policy that limits the periodin which the claims forinjuries need to be made.
retroactive date
Date after which an eventcausing liability must takeplace in order to be covered.
occurrence policy
Covers liability for events thattake place within the policyperiod, regardless of whenthe plaintiff makes a claim.
extended reporting period
Provides coverage for claimsbrought after the policyperiod has expired for eventsthat occurred between theretroactive date and the endof the policy period.
bodily injury (BI)
Bodily injury, sickness, ordisease sustained by aperson, including deathresulting from any of these atany time.
property damage (PD)
Physical injury to tangibleproperty, including allresulting loss of use of thatproperty, or loss of use oftangible property that is notphysically injured.
Coverage A—Bodily Injury and Property Damage LiabilityThe CGL provides open-perils coverage for the insured’s liabilities due to bodily injury or propertydamage experienced by others. The bodily injury or property damage must arise out of an occurrence,which is “an accident, including continuous or repeated exposure to substantially the same generalharmful conditions.” If the commercial general liability policy is a claims-made policy, the event caus-ing liability must take place after a designated retroactive date, and a claim for damages must bemade during the policy period. Under the claims-made policy, an insured’s liability is covered(assuming no other applicable exclusions) if the event causing liability occurs after some specified ret-roactive date and the claim for payment by the plaintiff is made within the policy period. This differsfrom an occurrence policy, which covers liability for events that take place within the policy period,regardless of when the plaintiff makes a claim. The claims-made policy may lessen the insurer’s uncer-tainty about likely future payments because the time lag between premium payments and loss pay-ments generally is smaller with claims-made than with occurrence.
If the claims-made policy is purchased, a retroactive date must be defined. In addition, an exten-ded reporting period must be included for the policy to be legal. The extended reporting period ap-plies if a claims-made policy is canceled and provides coverage for claims brought after the policy peri-od has expired for events that occurred between the retroactive date and the end of the policy period.An example is shown in Table 12.3. The standard extended reporting form is very limited, so insuredsmay purchase additional extensions.
TABLE 12.3 Claims-Made Coverage Example
Assume a policy purchased on January 1, 1990, that provides $1,000,000 per occurrence of claims-made coveragewith a retroactive date of January 1, 1988, and a one-year policy period. Further assume that the policy wascanceled on December 31, 1990, and that the insured purchased a one-year extended reporting period.
The following losses occur:
Amount Date of Injury Date of Claim Insurer Responsibility
$100,000 3/15/88 3/15/89 −0[8]
$100,000 3/15/88 3/15/90 100,000[9]
$100,000 3/15/90 3/15/91 100,000[10]
$100,000 3/15/90 3/15/92 −0[11]
$100,000 3/15/91 3/15/91 −0[12]
The claims-made policy was introduced (first in medical malpractice insurance, later in other policies)in response to increased uncertainty about future liabilities. As explained above, an occurrence policycould be sold today, and liability associated with it could be determined thirty years later or more. Withchanging legal and social norms, the inability of insurers to feel confident with their estimates of ulti-mate liabilities (for pricing purposes) led them to develop the claims-made coverage.
Bodily injury (BI) is defined as bodily injury, sickness, or disease sustained by a person, includ-ing death resulting from any of these at any time. Property damage (PD) is defined as (a) physicalinjury to tangible property, including all resulting loss of use of that property, or (b) loss of use of tan-gible property that is not physically injured.
In addition to covering an insured’s liability due to bodily injury or property damage, the insurerpromises to defend against suits claiming such injuries. The cost of defense is provided in addition tothe limits of insurance available for payment of settlements or judgments, as is payment of interest thataccrues after entry of the judgment against the insured. The insurer, however, has the general right tosettle any suit as it deems appropriate. Furthermore, the insurer’s obligation to defend against liabilityends when it has paid out its limits for any of the coverages in settlements or judgments.
So far, this coverage sounds extremely broad, and it is. A long list of exclusions, however, definesthe coverage more specifically. Figure 12.11 provides the list of exclusions.
CHAPTER 12 MULTIRISK MANAGEMENT CONTRACTS: BUSINESS 267
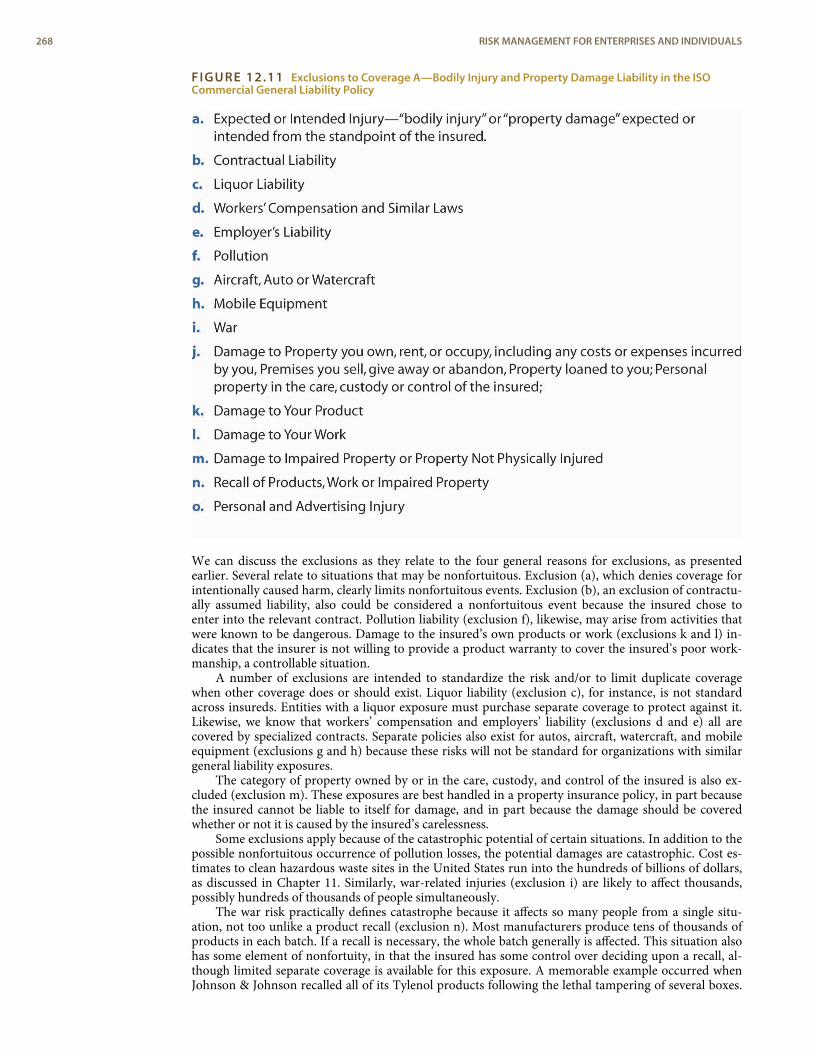
FIGURE 12.11 Exclusions to Coverage A—Bodily Injury and Property Damage Liability in the ISOCommercial General Liability Policy
We can discuss the exclusions as they relate to the four general reasons for exclusions, as presentedearlier. Several relate to situations that may be nonfortuitous. Exclusion (a), which denies coverage forintentionally caused harm, clearly limits nonfortuitous events. Exclusion (b), an exclusion of contractu-ally assumed liability, also could be considered a nonfortuitous event because the insured chose toenter into the relevant contract. Pollution liability (exclusion f), likewise, may arise from activities thatwere known to be dangerous. Damage to the insured’s own products or work (exclusions k and l) in-dicates that the insurer is not willing to provide a product warranty to cover the insured’s poor work-manship, a controllable situation.
A number of exclusions are intended to standardize the risk and/or to limit duplicate coveragewhen other coverage does or should exist. Liquor liability (exclusion c), for instance, is not standardacross insureds. Entities with a liquor exposure must purchase separate coverage to protect against it.Likewise, we know that workers’ compensation and employers’ liability (exclusions d and e) all arecovered by specialized contracts. Separate policies also exist for autos, aircraft, watercraft, and mobileequipment (exclusions g and h) because these risks will not be standard for organizations with similargeneral liability exposures.
The category of property owned by or in the care, custody, and control of the insured is also ex-cluded (exclusion m). These exposures are best handled in a property insurance policy, in part becausethe insured cannot be liable to itself for damage, and in part because the damage should be coveredwhether or not it is caused by the insured’s carelessness.
Some exclusions apply because of the catastrophic potential of certain situations. In addition to thepossible nonfortuitous occurrence of pollution losses, the potential damages are catastrophic. Cost es-timates to clean hazardous waste sites in the United States run into the hundreds of billions of dollars,as discussed in Chapter 11. Similarly, war-related injuries (exclusion i) are likely to affect thousands,possibly hundreds of thousands of people simultaneously.
The war risk practically defines catastrophe because it affects so many people from a single situ-ation, not too unlike a product recall (exclusion n). Most manufacturers produce tens of thousands ofproducts in each batch. If a recall is necessary, the whole batch generally is affected. This situation alsohas some element of nonfortuity, in that the insured has some control over deciding upon a recall, al-though limited separate coverage is available for this exposure. A memorable example occurred whenJohnson & Johnson recalled all of its Tylenol products following the lethal tampering of several boxes.
268 RISK MANAGEMENT FOR ENTERPRISES AND INDIVIDUALS
Even though Johnson & Johnson undertook the recall to prevent future injury (and possible liability),its insurer denied coverage for the recall costs. Insureds can buy an endorsement for product recall.
Another exclusion is the fungi and bacteria exclusion. CGL has a mold exclusion that applies tobodily injury and property damage only. The endorsement states that payment for liability is excludedfor the following:
d. “Bodily injury” or “property damage,” which would not have occurred, in whole or in part, butfor the actual, alleged or threatened inhalation of, ingestion of, contact with, exposure to,existence of, or presence of, any “fungi” or bacteria on or within a building or structure, includingits contents, regardless of whether any other cause, event, material or product contributedconcurrently or in any sequence to such injury or damage
e. Any loss, cost or expenses arising out of the abating, testing for, monitoring, cleaning up,removing, containing, treating, detoxifying, neutralizing, remediating or disposing of, or in anyway responding to, or assessing the effects of, “fungi” or bacteria, by any insured or by any otherperson or entity[13]
Coverage B—Personal and Advertising Injury LiabilityCoverage A provides protection against physical injury or damage due to the insured’s activities. Des-pite the many exclusions, it provides broad coverage for premises, products, completed work, and oth-er liabilities. It does not provide protection, however, against the liabilities arising out of nonphysicalinjuries. Coverage B does provide that protection. The policy states,
“We will pay those sums that the insured becomes legally obligated to pay as damages because of‘personal and advertising injury’ to which this insurance applies. We will have the right and duty todefend the insured against any ‘suit’ seeking those damages. However, we will have no duty todefend the insured against any ‘suit’ seeking damages for ‘personal and advertising injury’ to whichthis insurance does not apply. We may, at our discretion, investigate any offense and settle anyclaim or ‘suit’ that may result.[14] ”
The exclusions for Coverage B, Personal and Advertising Injury Liability, are listed in Figure 12.12.The exclusions eliminate intentional acts (nonaccidental acts), acts that occurred before the cover-
age began, criminal acts, and contractual liability. False statements and failure to conform to state-ments and infringements of copyrights and trademarks are also excluded. As in other coverages, elec-tronic chat rooms and Internet businesses are excluded (see Chapter 11). In this context, insureds inthe Internet and media businesses are completely excluded from coverage B under the 2001 CGLpolicy. The particular exclusion of unauthorized use of another’s name and product was also noted inChapter 11. Because pollution and pollution related-risks are considered catastrophic, they are ex-cluded as well.
CHAPTER 12 MULTIRISK MANAGEMENT CONTRACTS: BUSINESS 269
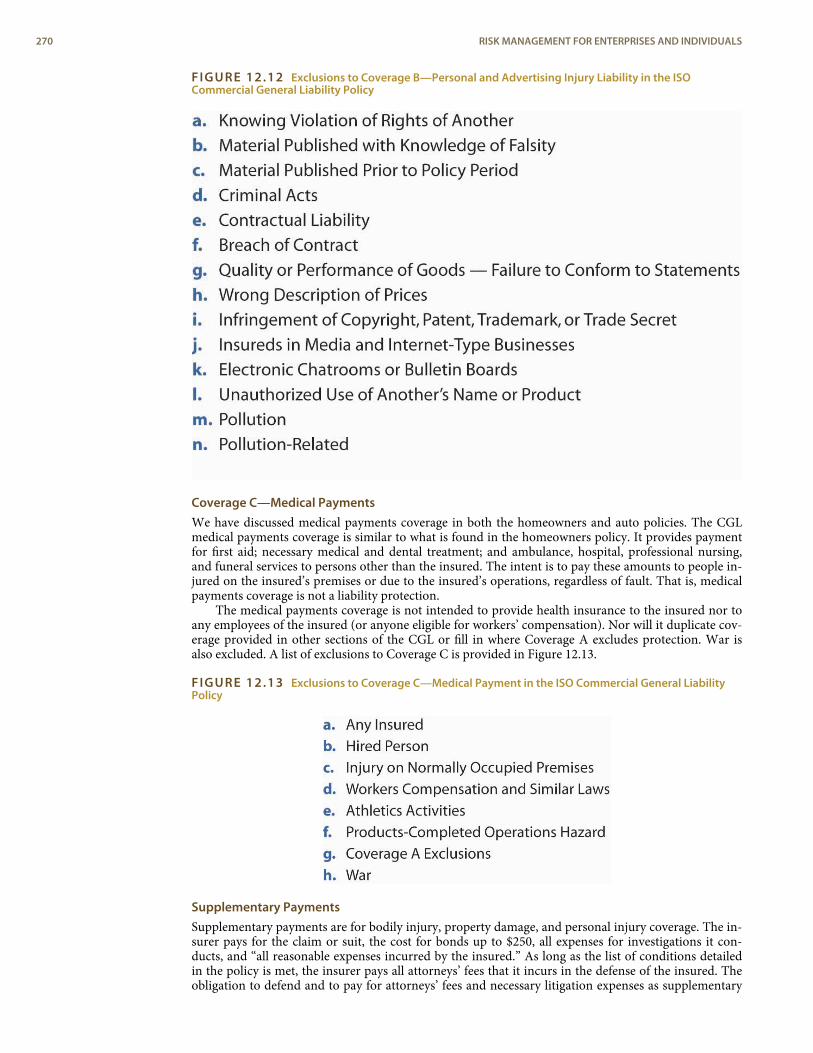
FIGURE 12.12 Exclusions to Coverage B—Personal and Advertising Injury Liability in the ISOCommercial General Liability Policy
Coverage C—Medical PaymentsWe have discussed medical payments coverage in both the homeowners and auto policies. The CGLmedical payments coverage is similar to what is found in the homeowners policy. It provides paymentfor first aid; necessary medical and dental treatment; and ambulance, hospital, professional nursing,and funeral services to persons other than the insured. The intent is to pay these amounts to people in-jured on the insured’s premises or due to the insured’s operations, regardless of fault. That is, medicalpayments coverage is not a liability protection.
The medical payments coverage is not intended to provide health insurance to the insured nor toany employees of the insured (or anyone eligible for workers’ compensation). Nor will it duplicate cov-erage provided in other sections of the CGL or fill in where Coverage A excludes protection. War isalso excluded. A list of exclusions to Coverage C is provided in Figure 12.13.
FIGURE 12.13 Exclusions to Coverage C—Medical Payment in the ISO Commercial General LiabilityPolicy
Supplementary PaymentsSupplementary payments are for bodily injury, property damage, and personal injury coverage. The in-surer pays for the claim or suit, the cost for bonds up to $250, all expenses for investigations it con-ducts, and “all reasonable expenses incurred by the insured.” As long as the list of conditions detailedin the policy is met, the insurer pays all attorneys’ fees that it incurs in the defense of the insured. Theobligation to defend and to pay for attorneys’ fees and necessary litigation expenses as supplementary
270 RISK MANAGEMENT FOR ENTERPRISES AND INDIVIDUALS
payments ends when the insurer has reached the applicable limit of insurance in the payment of judg-ments or settlements.
Who Is an Insured?
Section II of the CGL is very specific and detailed in defining whose liability is covered. The followingare insureds:
< An individual< A partnership or joint venture< A limited liability company< An organization other than a partnership, joint venture, or limited liability company< A trust
The volunteer workers of the business are also insured. However, none of the employees or volunteerworkers are insureds for bodily injury or personal and advertising injury to the insured or damage toproperty that is owned or occupied by the insured.
Limits of Insurance
The limits of insurance, as you know by now, define the maximum responsibility of the insurer underspecified situations. A portion of the declaration for CGL is shown in Figure 12.14.
FIGURE 12.14 Section of the ISO Commercial General Liability Declaration Page ((Sample))
Source: ISO Commercial General Liability Coverage Form CG 00 0110 01. Includes copyrighted material of Insurance Services Office, Inc., with its
permission.
The policy clarifies the limits of insurance shown in the declarations and the applicable rules. The gen-eral aggregate limit is the most that the insurer pays for the sum of
< medical expenses under Coverage C, plus< damages under Coverage A, except damages because of “bodily injury” or “property damage”
included in the “products-completed operations hazard,” plus< damages under Coverage B
The limits are paid regardless of the number of insureds, claims made, or suits brought, or persons ororganizations making claims or bringing suits. The limits apply separately to each consecutive annualperiod.
CGL Conditions
Like all other policies, the CGL includes an extensive conditions section, primarily outlining the dutiesof the insured and insurer. Subrogation, other insurance, proper action in the event of loss, and similarprovisions are spelled out in the conditions section.
Definitions
Words used in insurance policies might not have the same interpretation as when they are used in oth-er documents or conversations. To specify its intent, insurers define significant terms (remember thatinsurance is a contract of adhesion, so ambiguities are read in the manner most favorable to the in-sured). Some defined terms in the CGL have already been discussed, including “bodily injury,”“property damage,” “personal injury,” “advertising injury,” and “occurrence.” In total, twenty-two
CHAPTER 12 MULTIRISK MANAGEMENT CONTRACTS: BUSINESS 271
umbrella liability policy
Provides excess coverageover underlying insurance.Except for excluded risks, italso provides excess over aspecified amount, for whichthere is no underlyingcoverage.
terms are defined in the CGL. Like the rest of the policy, a full interpretation of coverage requires read-ing and analyzing these definitions. The problems that arise out of interpretation of the CGL policywording is discussed in the box “Liability Limits: One Event or Two?”
4.2 Commercial Umbrella Liability PolicyToday, $1,000,000 of liability coverage, the standard limit for a CGL, is insufficient for many busi-nesses. Furthermore, liabilities other than those covered by the CGL may be of significant importanceto a business. To obtain additional amounts and a broader scope of coverage, a business can purchase acommercial umbrella liability policy.
The umbrella liability policy provides excess coverage over underlying insurance. Except for ex-cluded risks, it also provides excess over a specified amount, such as $25,000, for which there is no un-derlying coverage. Typically, you are required to have specified amounts of underlying coverage, suchas the CGL with a $1,000,000 limit and automobile insurance with the same limit. When a loss occurs,the basic contracts pay within their limits and then the umbrella policy pays until its limits are ex-hausted. If there is no underlying coverage for a loss covered by the umbrella, you pay the first $25,000(or whatever is the specified retention), and the umbrella insurer pays the excess.
The umbrella policy covers bodily injury, property damage, personal injury, and advertising injuryliability, similar to what is provided in the CGL. Medical expense coverage is not included. The limitsof coverage, however, are intended to be quite high, and the exclusions are not as extensive as thosefound in the CGL. Most businesses find umbrella liability coverage an essential part of their risk man-agement operations.
K E Y T A K E A W A Y S
In this section you studied the commercial general liability component of the CPP and the umbrella liabilityoption:
< The CGL format is similar to the BPP and BIC; it consists of the declaration form, coverage form, and anyendorsements.
< Five sections make up the CGL: coverages, who is an insured, limits of insurance, conditions, anddefinitions.
< Coverages are available on either an occurrence or a claims-made basis for bodily injury andproperty damage, personal and advertising injury, and medical payments, each subject to manyexclusions.
< The insureds can be an individual, a partnership/joint venture, limited liability company, an otherorganization, or a trust.
< The limits of insurance provide clarification for limits shown in declarations and applicable rulesas follows: paid regardless of number of insureds, claims made, suits brought, or persons/organizations making claims or bringing suits.
< Conditions outlines the duties of the insured and insurer.
< Definitions describes any term of policy in quotation marks.
< The standard limits for CGL may be inadequate for many businesses.
< The umbrella liability policy provides excess coverage above and beyond underlying insurance.
< The umbrella policy has the same coverages as the CGL except medical expense.
272 RISK MANAGEMENT FOR ENTERPRISES AND INDIVIDUALS
D I S C U S S I O N Q U E S T I O N S
1. Provide an example of expenses that would be covered under each of the three CGL coverages.
2. What responsibility does a CGL insurer have with regard to litigation expenses for a lawsuit that, ifsuccessfully pursued by the plaintiff, would result in payment of damages under the terms of the policy?
3. How does personal injury differ from bodily injury?
4. Who needs an umbrella liability policy? Why?
5. Assume that the Baker-Leetch Pet Store has a CGL with a $1,000,000 aggregate limit. The policycommences July 1, 2008, and ends June 30, 2009.
a. If claims-made, the retroactive date is July 1, 2007, and a one-year extended reporting periodapplies. Under both occurrence and claims-made scenarios, would the following losses becovered? The pet shop sold a diseased gerbil in August 2007. The gerbil ultimately infected theowner’s twenty cats and dogs (kept for breeding purposes), who all died. The owner filed alawsuit against Baker-Leetch in September 2008. What if the lawsuit were filed in September2009? September 2010?
b. The pet shop provided dog training in July 2008 and guaranteed the results of the training. InDecember 2008, one of the trained dogs attacked a mail carrier, causing severe injuries. The mailcarrier immediately sued Baker-Leetch.
c. The pet store sold an inoculated rare and expensive cat in October 2008. The cat contracted adisease in October 2009 that would not have occurred if the animal truly had been properlyinoculated. The owners sued in December 2009.
5. OTHER LIABILITY RISKS
L E A R N I N G O B J E C T I V E S
In this section we elaborate on additional liability risks and insurance solutions:
< Auto liability< Professional liability< Employment practices liability
What about the business liability exposures not covered by the CGL? Space limitations prohibit dis-cussing all of them, but several merit some attention: automobile, professional liability, and workers’compensation. Workers’ compensation is discussed in more detail in Chapter 14.
5.1 Automobile LiabilityIf the business is a proprietorship and the only vehicles used are private passenger automobiles, thepersonal auto policy or a similar policy is available to cover the automobile exposure. If the business isa partnership or corporation or uses other types of vehicles, other forms of automobile insurance mustbe purchased if the exposure is to be insured. The coverages are similar to the automobile insurancediscussed in [MISSING REF: #baranoff-ch14].
5.2 Professional LiabilityThe nature and significance of the professional liability risk were discussed in Chapter 11. Most profes-sionals insure this exposure separately with malpractice insurance, errors and omissions insurance, ordirectors and officers (D&O) insurance. These liability coverages were discussed in Chapter 11. You areurged to review the current conditions of the D&O coverage featured in the box “Directors andOfficers Coverage in the Limelight.”
CHAPTER 12 MULTIRISK MANAGEMENT CONTRACTS: BUSINESS 273
Employment-RelatedPractices Liability Program
Covers insureds’ liability forclaims arising out of an injuryto an employee because ofan employment-relatedoffense, as well as providinglegal defense for the insured.
Directors and Officers Coverage in the Limelight
William Webster had enjoyed a long and distinguished career in public service, most notably as the only per-son ever to head both the FBI (under President Carter) and the CIA (under President Reagan). The onetime U.S.District Court judge retired from public office in 1991, at age sixty-seven, and devoted his time to practicinglaw in Washington, D.C., and sitting on the boards of several large corporations. One of them was U.S. Techno-logies, which develops and supports emerging Internet companies. But in July 2002, Webster was told thecompany could no longer provide adequate liability insurance to its directors and officers. He resigned.
All publicly traded companies must have a board of directors, a group of people elected by the stockholdersto govern the company. Generally, the board is charged with selecting and supervising the executive officers,setting overall corporate policy, and overseeing the preparation of financial statements. This role leaves direct-ors vulnerable to lawsuits from shareholders, creditors, customers, or employees on charges such as abuse ofauthority, libel or slander, and—the biggest concern these days—financial mismanagement. Board membersat many corporations became concerned about their personal liability and started taking a closer look at theinsurance known as directors and officers (D&O) coverage that is supposed to protect them.
Not surprisingly, the corporate scandals of 2001 and 2002–2004 had driven up the cost of D&O insurance. Fol-lowing WorldCom’s June 2002 announcement that it had “inappropriately classified” nearly $4 billion in ex-penses, D&O insurers pulled back from covering not just WorldCom but also its banks, its suppliers, and itsbusiness customers. Another reason for the shrinking D&O insurance pool was the late 1990s trend toward as-tronomical settlements in class-action securities lawsuits. By 2002, high-risk companies—in the aircraft, finan-cial, health care, technology, and telecommunications industries—were paying triple what they used to forD&O, if they could find coverage at all.
Directors and officers were made even more vulnerable with the passage of the Sarbanes-Oxley Act in July2002. With this key piece of legislation, Congress hoped to restore the public’s confidence in U.S. financial mar-kets by holding chief executives, directors, and outside auditors more responsible—even criminally liable—forthe accuracy of financial reports. Sarbanes-Oxley was passed just one month after Enron’s outside auditor, theaccounting firm Arthur Andersen, was convicted on obstruction of justice charges for its role in the financialfraud.
The days of shortage in D&O availability and affordability ended as the market softened. According to the 2005Directors and Officers Liability Survey conducted by the Tillinghast business of Towers Perrin, the 2005 stand-ardized premium index (that was created in 1974) decreased about 8 percent in the D&O coverage cost. Theaverage index decreased from its highest level of 1,237 in 2003 to 1,010 in 2005. The only business classes thatreported an increase from 2004 were durable goods, education, health services, and nonbanking financial ser-vices. The report also indicated that coverage limits and deductibles remained level.
The leading insurers for the line are: Chubb (21 percent) and AIG (35 percent). Interestingly, AIG, one of themajor players in this line of insurance, saw its own 2005 D&O rates increasing in the midst of allegations of itsimproper accounting.
Sources: Roberto Ceniceros, “WorldCom Adds to D&O Ills,” Business Insurance, July 8, 2002; Rodd Zolkos and Mark A. Hofmann, “Crises Spur Push forReform,” Business Insurance, July 15, 2002; Richard B. Schmitt, Michael Schroeder, and Shailagh Murray, “Corporate-Oversight Bill Passes, SmoothingWay for New Lawsuits,” Wall Street Journal, July 26, 2002; Carrie Coolidge, “D&O Insurance Gets Closer Scrutiny,” Forbes, November 22, 2002; 2005Survey of Directors and Officers Liability by the Tillinghast business of Towers Perrin is available at http://www.iii.org andhttp://www.Towersperrin.Com/Tillinghast/Publications/Reports/2005_DO/DO_2005_Exec_Sum.pdf, accessed March 27, 2009; Matt Scroggins, “AIGBoard Panel to Oversee Director Indemnification,” Business Insurance, May 25, 2005; Regis Coccia, “AIG to Pay Directors’ Expenses Amid Suits andProbes,” Business Insurance, May 16, 2005.
5.3 Employment Practices LiabilityThe ISO’s Employment-Related Practices Liability Program, which is available to all ISO-participatinginsurance companies, was filed with state insurance regulators for approval effective April 1, 1998.[15] Itwas the newest line introduced in more than twenty years. Because of an increase in the number of law-suits filed for sexual harassment and many more employment-related liability suits, the coverage be-came imperative to most businesses. The ISO is considered a baseline program. “The [Employment-Related Practices Liability Program] covers insureds’ liability for claims arising out of an injury toan employee because of an employment-related offense, as well as providing legal defense for the in-sured. Injury may result from discrimination that results in refusal to hire; failure to promote; termina-tion; demotion; discipline or defamation. Injury also can include coercion of an employee to performan unlawful act; work-related sexual harassment; or verbal, physical, mental or emotional abuse.”
The ISO program excludes the following:1. Criminal, fraudulent, or malicious acts2. Violations of the accommodations requirement of the Americans with Disabilities Act
274 RISK MANAGEMENT FOR ENTERPRISES AND INDIVIDUALS
3. Liability of the perpetrator of sexual harassment4. Injury arising out of strikes and lockouts, employment termination from specified business
decisions, and retaliatory actions taken against whistleblowersThe program makes available a number of optional coverages:
1. Extending the claims-reporting period to three years2. Extending coverage beyond managers and supervisors to all of a firm’s employees3. Insuring organizations that are newly formed or acquired by the insured during the policy period
for ninety days4. Insuring persons or organizations with financial control over the insured or the insured’s
employment-related practices
K E Y T A K E A W A Y S
In this section you studied business liability exposures not covered by the CGL:
< In a proprietorship, if the only vehicles used are private passenger automobiles, the personal auto policy isavailable; if the business uses other types of vehicles, other forms of automobile insurance must bepurchased.
< Most professionals insure professional liability exposure with malpractice insurance, errors and omissionsinsurance, or directors and officers insurance (D&O).
< The Employment-Related Practices Liability Program covers liability for injury to employees because ofemployment-related offenses and provides legal defense for the insured; injury may result fromdiscrimination that results in refusal to hire, failure to promote, termination, demotion, discipline, ordefamation.
D I S C U S S I O N Q U E S T I O N S
1. How does malpractice differ from errors and omissions?
2. The Employment-Related Practices Liability Program is concerned with what kind of injury to employees?
6. REVIEW AND PRACTICE1. How does the insured choose a limit of insurance for the BIC?2. What are the primary differences among the three causes of loss forms available in the
commercial property policy? Why not always choose the special form?3. When would the monthly limit of indemnity, maximum period of indemnity, or payroll
endorsement be appropriate?4. Hurricane Iniki in 1992 caused extensive damage to one of the Hawaiian Islands. A significant
loss in tourist activity resulted. Assume the Kooey Hotel experienced $500,000 in damage to itsproperty. Furthermore, assume Kooey typically brought in $100,000 of revenue per month, onwhich it incurred $80,000 of fixed and variable expenses. For two months following Iniki, theKooey Hotel was shut down, but still incurred expenses of $50,000. The hotel spent $15,000 morethan usual on advertising before reopening. Based on this information, what would be theinsurable consequential losses of the Kooey Hotel from Hurricane Iniki? What can be done toreduce those losses?
5. Compare occurrence and claims-made policies.6. Assume the Koehn Kitchen Corporation, a manufacturer of kitchen gadgets, experiences the
following losses:a. A consumer chops off his finger while using Koehn’s Cutlery Gizmo. The consumer sues
Koehn for medical expenses, lost income, pain and suffering, and punitive damages.b. An employee of Koehn is injured while delivering goods to a wholesaler. The employee
sues for medical expenses and punitive damages.c. Koehn uses toxic substances in its manufacturing process. Neighbors of its plant bring
suit against Koehn, claiming that a higher rate of stillbirths is occurring in the area
CHAPTER 12 MULTIRISK MANAGEMENT CONTRACTS: BUSINESS 275
because of Koehn’s use of toxins. (Consider the variation that an explosion emitted thetoxins rather than normal business operations.)
d. Koehn’s Mighty Mate Slicing Machine must be recalled because of a product defect. Therecall causes massive losses.
e. Based on information in this chapter, which parts of any of these losses are covered byKoehn’s CGL? Explain your answer.
7. Provide a detailed rationale for excluding pollution, auto accidents, and liquor liability in theCGL.
8. What is a BOP? What does it cover?9. The Goldman Cat House is a pet store catering to the needs of felines. The store is a sole
proprietorship, taking in revenues of approximately $1,700,000 annually. Products availableinclude kittens, cat food, cat toys, cages, collars, cat litter and litter boxes, and manuals on catcare. One manual was written by the store owner, who also makes up his own concoction for catlitter. All other goods are purchased from national wholesalers. Two part-time and two full-timeemployees work for Goldman. Sometimes the employees deliver goods to Goldman customers.
a. Identify some of Goldman Cat House’s liability exposures.b. Would Goldman be best advised to purchase an occurrence-based or claims-made
liability policy?c. What liability loss-control techniques would you recommend for Goldman?
276 RISK MANAGEMENT FOR ENTERPRISES AND INDIVIDUALS
1.2.
3.
4.
5.
6.
7.
8.9.
10.
11.12.
13.
14.
15.
ENDNOTES
A detailed description of this part of the policy is beyond the scope of this text.
ISO Commercial Property Causes of Loss—Broad Form CP 10 20 06 07. Includescopyrighted material of Insurance Services Office, Inc., with its permission.
ISO Commercial Property Business Income (and Extra Expense) Coverage Form CP 0030 06 07. Includes copyrighted material of Insurance Services Office, Inc., with itspermission.
ISO press release at http://www.iso.com/products/2200/prod2241.html (accessedMarch 27, 2009).
ISO press release at http://www.iso.com/press_releases/2002/01_22_02.html, Janu-ary 22, 2002 (accessed March 27, 2009).
“New ISO Offering for Smaller Businesses,” National Underwriter Online News Service,June 3, 2002. The press release by ISO “ISO’s NEW BUSINESSOWNERS PROGRAMSIMPLIFIES RATING AND EXPANDS COVERAGE ELIGIBILITY—ISO IntegRater™ and As-cendantOne™ Updated for the New BOP” is available at http://www.iso.com/press_releases/2002/06_03_02.html.
Businessowners Endorsement: BP 05 11 01 02 (N/A To Standard Fire Policy States);Businessowners Endorsement: BP 05 12 02 (Applies In Standard Fire Policy States);Businessowners Endorsement: BP 05 13 01 02.
The claim precedes the coverage period. No coverage exists under this policy.
The event follows the retroactive date and the claim is brought during the policyperiod.
The event follows the retroactive date and the claim is brought in the extended re-porting period.
The claim follows the end of the reporting period.
Even though the claim is brought within the extended reporting period, the eventoccurs.
ISO Commercial General Liability Coverage Form CG 00 0110 01. Includes copy-righted material of Insurance Services Office, Inc., with its permission.
ISO Commercial General Liability Coverage Form CG 00 0110 01. Includes copy-righted material of Insurance Services Office, Inc., with its permission.
ISO press release as of August 19, 1997, at http://www.iso.com/press_releases/1997/08_19_97.html, (accessed March 31, 2009), http://www.iso.com/Press-Releases/1997/ISO-INTRODUCES-FIRST-STANDARDIZED-INSURANCE-PROGRAM-FOR-EMPLOYMENT-PRACTICES-LIABILITY.html.
CHAPTER 12 MULTIRISK MANAGEMENT CONTRACTS: BUSINESS 277

278 RISK MANAGEMENT FOR ENTERPRISES AND INDIVIDUALS
C H A P T E R 1 3The Evolution of RiskManagement: EnterpriseRisk ManagementIn the first three chapters, we provided information to help you understand and measure risks, as well as to
evaluate risk attitudes and risk behavior. Chapter 3 concentrated on risk management and methods for identifying,
measuring, and managing risks. In this chapter we elaborate further on the management of risk, placing greater
emphasis on the opportunities that risk represents. We emphasize prudent opportunities rather than actions
motivated by greed. When trying to identify the main causes of the 2008–2009 credit crisis, the lack of risk
management and prudent behavior emerge as key factors. However, even companies that were not part of the
debacle are paying the price, as the whole economy suffers a lack of credit and consumers’ entrenchment.
Consumers are less inclined to buy something that they don’t consider a necessity. As such, even firms with
prudent and well-organized risk management are currently seeing huge devaluation of their stocks.[1]
In many corporations, the head of the ERM effort is the chief risk officer or CRO. In other cases, the whole
executive team handles the risk management decision with specific coordinators. Many large corporations adopted
a system called Six Sigma, which is a business strategy widely adopted by many corporations to improve processes
and efficiency. Within this model of operation they embedded enterprise risk management. The ERM function at
Textron follows the latter model. Textron’s stock fell from $72 in January 2008 to $15 in December 2008. Let’s recall
that ERM includes every aspect of risks within the corporation, including labor negotiation risks, innovation risks,
lack-of-foresight risks, ignoring market condition risks, managing self-interest and greed risks, and so forth. Take the
case of the three U.S. auto manufacturers—GM, Chrysler, and Ford. Their holistic risks include not only insuring
buildings and automobiles or worker’s compensation. They must look at the complete picture of how to ensure
survival in a competitive and technologically innovative world. The following is a brief examination of the risk
factors that contributed to the near-bankrupt condition of the U.S. automakers: [2]
< Lack of foresight in innovation of fuel-efficient automobiles with endurance and sustainability of value.
< Too much emphasis on the demand for the moment rather than on smart projections of potential
catastrophes impacting fuel prices, like hurricanes Katrina, Wilma, and Ike.
< They did not account for an increase in the worldwide demand for use of fuel.
< Inability to compete in terms of quality control and manufacturing costs because of the labor unions’ high
wage demands. Shutting down individual initiatives and smart thinking. Everything was negotiated rather
than done via smart business decisions and processes.
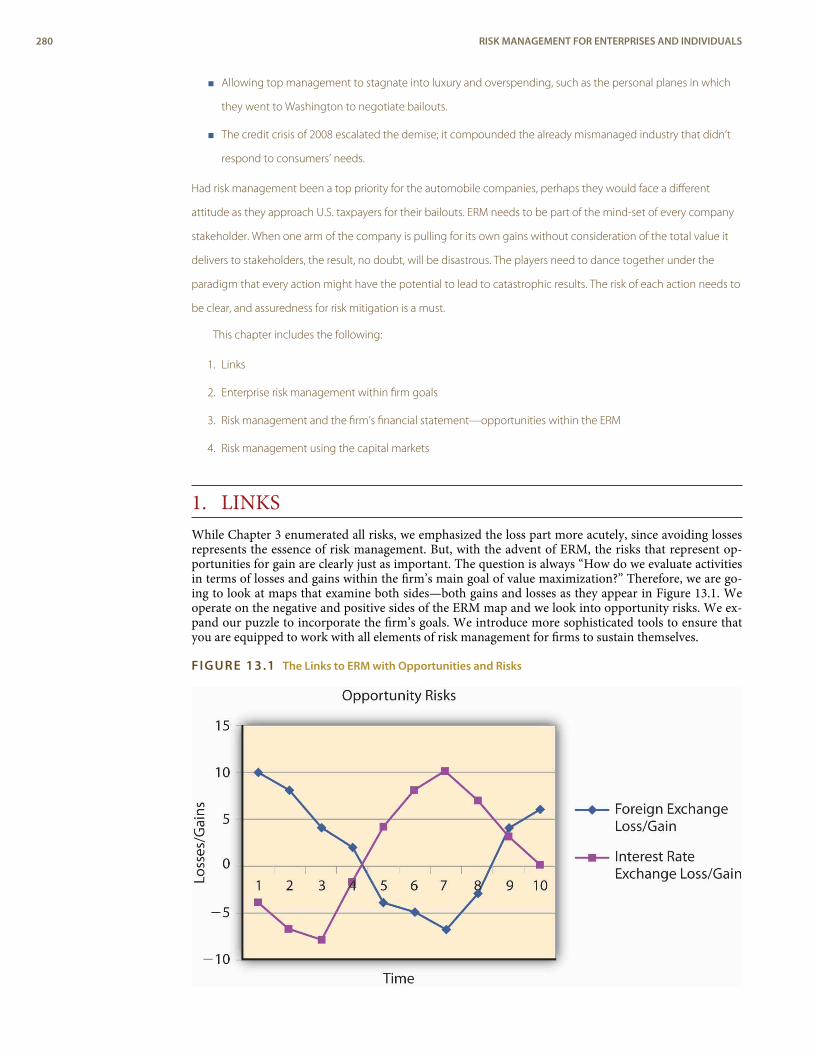
< Allowing top management to stagnate into luxury and overspending, such as the personal planes in which
they went to Washington to negotiate bailouts.
< The credit crisis of 2008 escalated the demise; it compounded the already mismanaged industry that didn’t
respond to consumers’ needs.
Had risk management been a top priority for the automobile companies, perhaps they would face a different
attitude as they approach U.S. taxpayers for their bailouts. ERM needs to be part of the mind-set of every company
stakeholder. When one arm of the company is pulling for its own gains without consideration of the total value it
delivers to stakeholders, the result, no doubt, will be disastrous. The players need to dance together under the
paradigm that every action might have the potential to lead to catastrophic results. The risk of each action needs to
be clear, and assuredness for risk mitigation is a must.
This chapter includes the following:
1. Links
2. Enterprise risk management within firm goals
3. Risk management and the firm’s financial statement—opportunities within the ERM
4. Risk management using the capital markets
1. LINKSWhile Chapter 3 enumerated all risks, we emphasized the loss part more acutely, since avoiding lossesrepresents the essence of risk management. But, with the advent of ERM, the risks that represent op-portunities for gain are clearly just as important. The question is always “How do we evaluate activitiesin terms of losses and gains within the firm’s main goal of value maximization?” Therefore, we are go-ing to look at maps that examine both sides—both gains and losses as they appear in Figure 13.1. Weoperate on the negative and positive sides of the ERM map and we look into opportunity risks. We ex-pand our puzzle to incorporate the firm’s goals. We introduce more sophisticated tools to ensure thatyou are equipped to work with all elements of risk management for firms to sustain themselves.
FIGURE 13.1 The Links to ERM with Opportunities and Risks
280 RISK MANAGEMENT FOR ENTERPRISES AND INDIVIDUALS

Let us emphasize that, in light of the financial crisis of 2008–2009, ERM is a needed mind-set for alldisciplines. The tools are just what ERM-oriented managers can pull out of their tool kits. For example,we provide an example for the life insurance industry as a key to understanding the links. We provide amore complete picture of ERM in Figure 13.2.
CHAPTER 13 THE EVOLUTION OF RISK MANAGEMENT: ENTERPRISE RISK MANAGEMENT 281
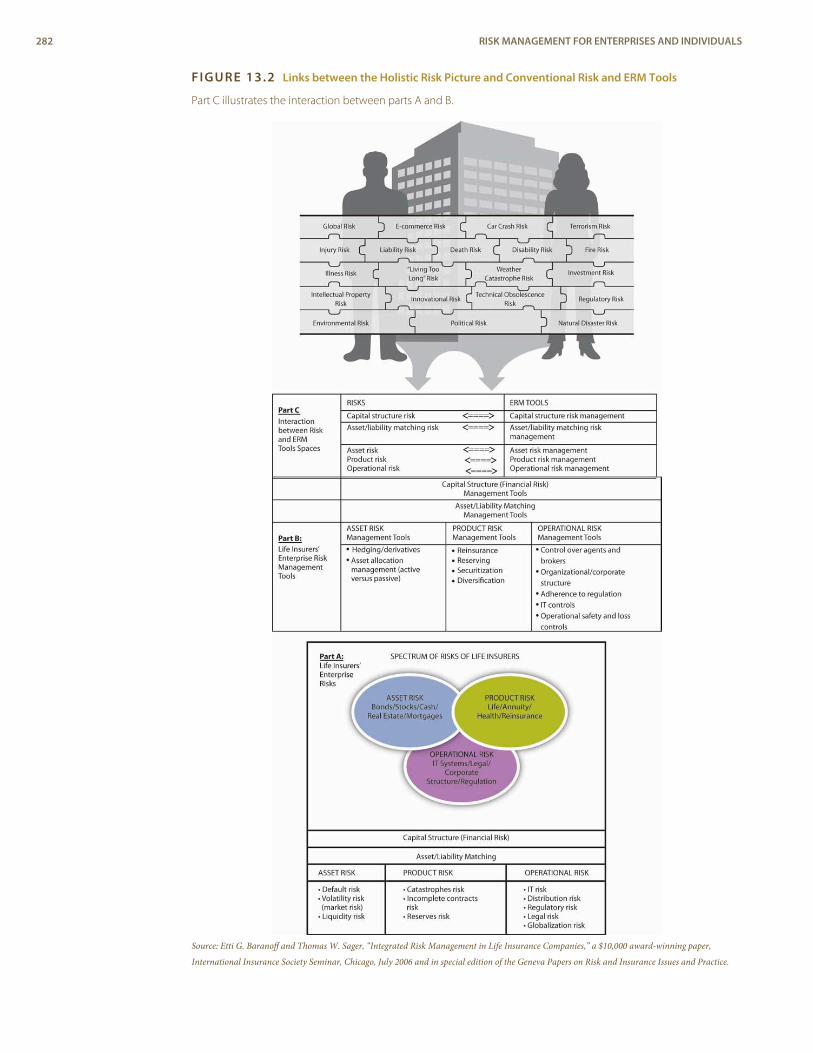
FIGURE 13.2 Links between the Holistic Risk Picture and Conventional Risk and ERM Tools
Part C illustrates the interaction between parts A and B.
Source: Etti G. Baranoff and Thomas W. Sager, “Integrated Risk Management in Life Insurance Companies,” a $10,000 award-winning paper,
International Insurance Society Seminar, Chicago, July 2006 and in special edition of the Geneva Papers on Risk and Insurance Issues and Practice.
282 RISK MANAGEMENT FOR ENTERPRISES AND INDIVIDUALS
chief risk officer (CRO)
Part of the executive teamresponsible for all riskelements in the organization.
stockholders’ wealth
Value of equity held by theowners of a company plusincome in the form ofdividends.
market value
For a public firm, the price ofthe stock times the numberof shares traded.
brand equity
The value created by acompany with a goodreputation and goodproducts.
2. ENTERPRISE RISK MANAGEMENT WITHIN FIRMGOALS
L E A R N I N G O B J E C T I V E S
< In this section you will learn how the ERM function integrates well into the firm’s main theoret-ical and actual goal: to maximize value. We show a hypothetical example of ERM adding valueto a firm.
< We also discuss the ambiguities regarding the firm goals.
As you saw in Chapter 3, risk management functions represent an integrated function within the or-ganization. In Figure 3.2, we map every risk. While the enterprise risk management (ERM) functioncompiles the information, every function should identify risks and examine risk management tools.Finance departments may take the lead, but engineering, legal, product development, and asset man-agement teams also have input. The individual concerned with the organization’s ERM strategy is oftengiven the position chief risk officer (CRO). The CRO is usually part of the corporation’s executiveteam and is responsible for all risk elements—pure and opportunity risks.
In this section, we illustrate in simple terms how the function integrates well into the firm’s goal tomaximize value. In terms of publicly traded corporations, maximizing value translates to maximizingthe company’s stock value. Even nonpublicly traded firms share the same goal. With nonpubliclytraded firms, the market isn’t available to explicitly recognize the company’s true value. Therefore,people may interpret the term “firm’s value” differently with public versus nonpublic companies. In-stead of the simple stock value, nonpublic firms may well create value using inputs such as revenues,costs, or sources of financing (debt of equity). While “cash-rich” companies have greater value, theymay not optimally use their money to invest in growth and future income. External variables, such asthe 2008–2009 credit crisis, may well affect firm value, as can the weather, investors’ attitudes, and thelike. In 2008 and 2009, even strong companies felt the effects from the credit crisis. Textron and otherwell-run companies saw their values plummet.
The inputs for a model that determines value allow us to examine how each input functions in thecontext of all the other variables.[3] Once we get an appropriate model, we can determine firms’ valuesand use these values to reach rational decisions. Traditionally, the drive for the firm to maximize valuereferred to the drive to maximize stockholders’ wealth. In other words, the literature referred to themaximization of the value of the firm’s shares (its market value, or the price of the stock times thenumber of shares traded, for a publicly traded firm). This approach replaces the traditional concept ofprofits maximization, or expected profit maximization, enabling us to introduce risky elements andstatistical models into the decision-making process. We just have to decipher the particular model bywhich we wish to calculate the firm’s value and to enumerate the many factors (including risk variablesfrom the enterprise risk map) that may affect firm value. Actual market value should reflect all theseelements and includes all the information available to the market. This is the efficient-marketshypothesis.
Recently, many developed countries have seen a tendency to change the rules of corporate gov-ernance. Traditionally, many people believed that a firm should serve only its shareholders. However,most people now believe that firms must satisfy the needs of all the stakeholders—including employeesand their families, the public at large, customers, creditors, the government, and others. A company is a“good citizen” if it contributes to improving its communities and the environment. In some countries,corporate laws have changed to include these goals. This newer definition of corporate goals and valuestranslates into a modified valuation formula/model that shows the firm responding to stakeholders’needs as well as shareholder profits. These newly considered values are the hidden “good will” valuesthat are necessary in a company’s risk management. We assume that a firm’s market value reflects thecombined impact of all parameters and the considerations of all other stakeholders (employees, cus-tomers, creditors, etc.) A firm’s brand equity entails the value created by a company with a goodreputation and good products. You may also hear the term a company’s “franchise value,” which is analternative term for the same thing. It reflects positive corporate responsibility image.
2.1 Maximization of Firm’s Value for SustainabilityAnother significant change in a way that firms are valued is the special attention that many are givingto general environmental considerations. A case in point is the issue of fuel and energy. In the summerof 2008, the cost of gas rising to over $150 a barrel and consumers paying more than $4 at the pump for
CHAPTER 13 THE EVOLUTION OF RISK MANAGEMENT: ENTERPRISE RISK MANAGEMENT 283
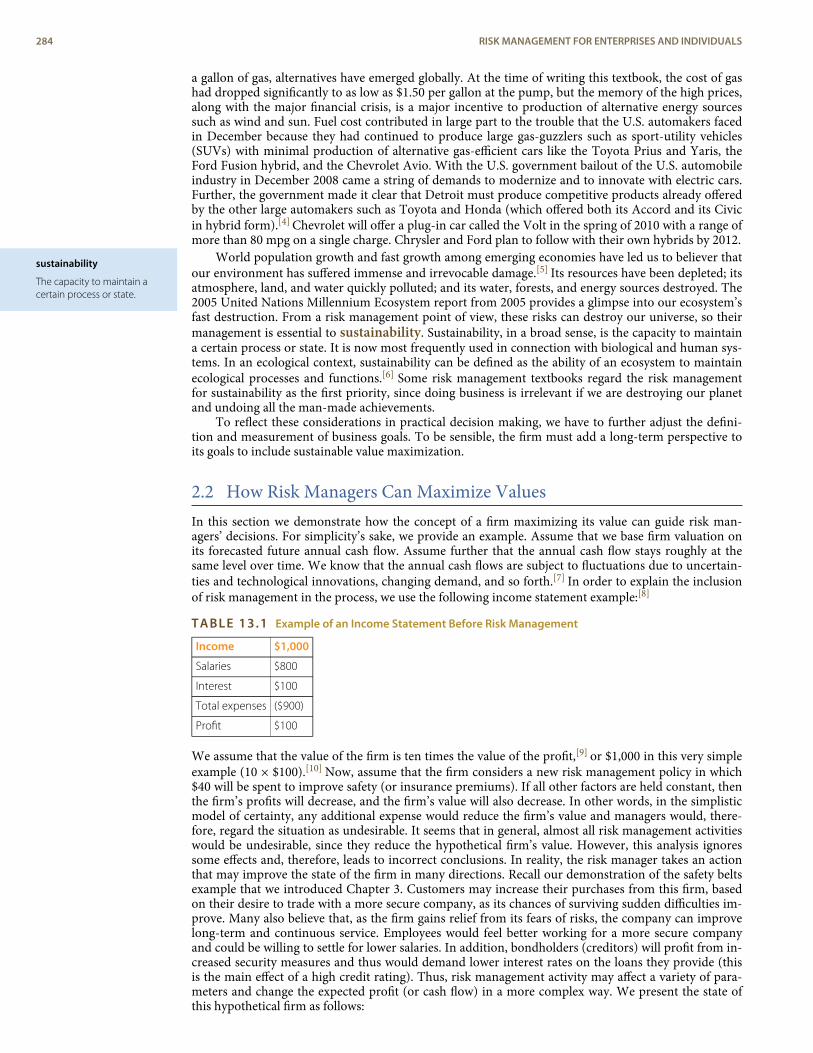
sustainability
The capacity to maintain acertain process or state.
a gallon of gas, alternatives have emerged globally. At the time of writing this textbook, the cost of gashad dropped significantly to as low as $1.50 per gallon at the pump, but the memory of the high prices,along with the major financial crisis, is a major incentive to production of alternative energy sourcessuch as wind and sun. Fuel cost contributed in large part to the trouble that the U.S. automakers facedin December because they had continued to produce large gas-guzzlers such as sport-utility vehicles(SUVs) with minimal production of alternative gas-efficient cars like the Toyota Prius and Yaris, theFord Fusion hybrid, and the Chevrolet Avio. With the U.S. government bailout of the U.S. automobileindustry in December 2008 came a string of demands to modernize and to innovate with electric cars.Further, the government made it clear that Detroit must produce competitive products already offeredby the other large automakers such as Toyota and Honda (which offered both its Accord and its Civicin hybrid form).[4] Chevrolet will offer a plug-in car called the Volt in the spring of 2010 with a range ofmore than 80 mpg on a single charge. Chrysler and Ford plan to follow with their own hybrids by 2012.
World population growth and fast growth among emerging economies have led us to believer thatour environment has suffered immense and irrevocable damage.[5] Its resources have been depleted; itsatmosphere, land, and water quickly polluted; and its water, forests, and energy sources destroyed. The2005 United Nations Millennium Ecosystem report from 2005 provides a glimpse into our ecosystem’sfast destruction. From a risk management point of view, these risks can destroy our universe, so theirmanagement is essential to sustainability. Sustainability, in a broad sense, is the capacity to maintaina certain process or state. It is now most frequently used in connection with biological and human sys-tems. In an ecological context, sustainability can be defined as the ability of an ecosystem to maintainecological processes and functions.[6] Some risk management textbooks regard the risk managementfor sustainability as the first priority, since doing business is irrelevant if we are destroying our planetand undoing all the man-made achievements.
To reflect these considerations in practical decision making, we have to further adjust the defini-tion and measurement of business goals. To be sensible, the firm must add a long-term perspective toits goals to include sustainable value maximization.
2.2 How Risk Managers Can Maximize ValuesIn this section we demonstrate how the concept of a firm maximizing its value can guide risk man-agers’ decisions. For simplicity’s sake, we provide an example. Assume that we base firm valuation onits forecasted future annual cash flow. Assume further that the annual cash flow stays roughly at thesame level over time. We know that the annual cash flows are subject to fluctuations due to uncertain-ties and technological innovations, changing demand, and so forth.[7] In order to explain the inclusionof risk management in the process, we use the following income statement example:[8]
TABLE 13.1 Example of an Income Statement Before Risk Management
Income $1,000
Salaries $800
Interest $100
Total expenses ($900)
Profit $100
We assume that the value of the firm is ten times the value of the profit,[9] or $1,000 in this very simpleexample (10 × $100).[10] Now, assume that the firm considers a new risk management policy in which$40 will be spent to improve safety (or insurance premiums). If all other factors are held constant, thenthe firm’s profits will decrease, and the firm’s value will also decrease. In other words, in the simplisticmodel of certainty, any additional expense would reduce the firm’s value and managers would, there-fore, regard the situation as undesirable. It seems that in general, almost all risk management activitieswould be undesirable, since they reduce the hypothetical firm’s value. However, this analysis ignoressome effects and, therefore, leads to incorrect conclusions. In reality, the risk manager takes an actionthat may improve the state of the firm in many directions. Recall our demonstration of the safety beltsexample that we introduced Chapter 3. Customers may increase their purchases from this firm, basedon their desire to trade with a more secure company, as its chances of surviving sudden difficulties im-prove. Many also believe that, as the firm gains relief from its fears of risks, the company can improvelong-term and continuous service. Employees would feel better working for a more secure companyand could be willing to settle for lower salaries. In addition, bondholders (creditors) will profit from in-creased security measures and thus would demand lower interest rates on the loans they provide (thisis the main effect of a high credit rating). Thus, risk management activity may affect a variety of para-meters and change the expected profit (or cash flow) in a more complex way. We present the state ofthis hypothetical firm as follows:
284 RISK MANAGEMENT FOR ENTERPRISES AND INDIVIDUALS
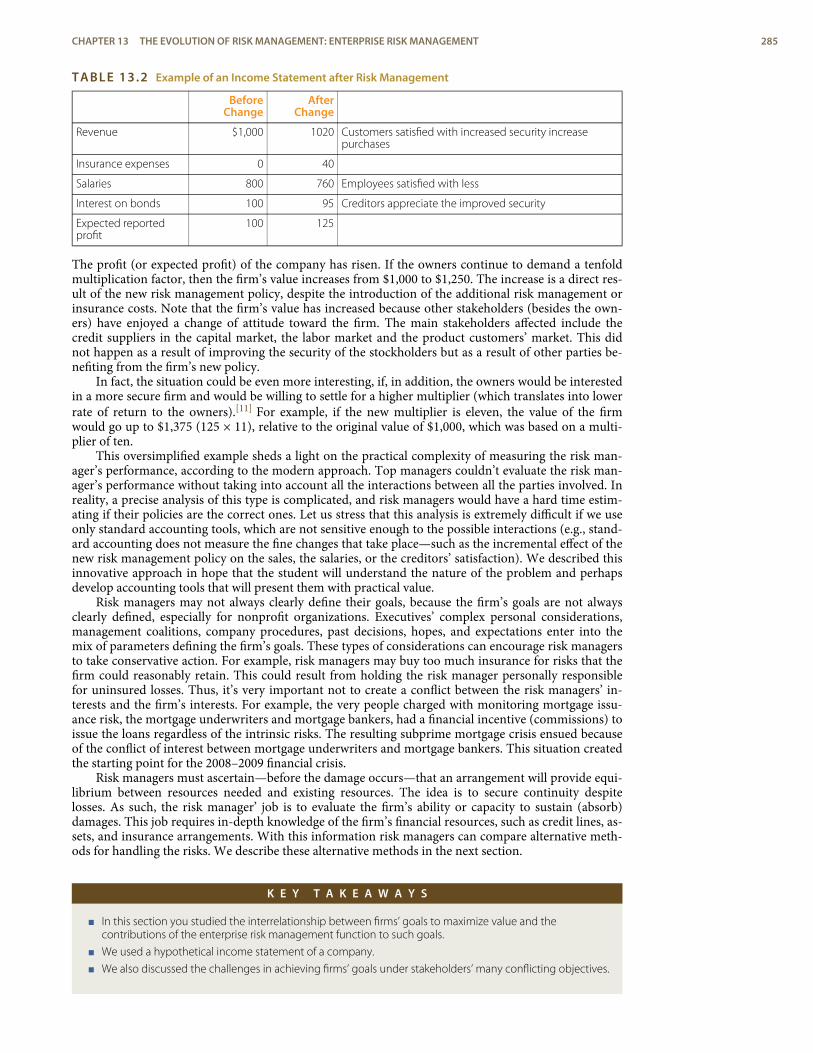
TABLE 13.2 Example of an Income Statement after Risk Management
BeforeChange
AfterChange
Revenue $1,000 1020 Customers satisfied with increased security increasepurchases
Insurance expenses 0 40
Salaries 800 760 Employees satisfied with less
Interest on bonds 100 95 Creditors appreciate the improved security
Expected reportedprofit
100 125
The profit (or expected profit) of the company has risen. If the owners continue to demand a tenfoldmultiplication factor, then the firm’s value increases from $1,000 to $1,250. The increase is a direct res-ult of the new risk management policy, despite the introduction of the additional risk management orinsurance costs. Note that the firm’s value has increased because other stakeholders (besides the own-ers) have enjoyed a change of attitude toward the firm. The main stakeholders affected include thecredit suppliers in the capital market, the labor market and the product customers’ market. This didnot happen as a result of improving the security of the stockholders but as a result of other parties be-nefiting from the firm’s new policy.
In fact, the situation could be even more interesting, if, in addition, the owners would be interestedin a more secure firm and would be willing to settle for a higher multiplier (which translates into lowerrate of return to the owners).[11] For example, if the new multiplier is eleven, the value of the firmwould go up to $1,375 (125 × 11), relative to the original value of $1,000, which was based on a multi-plier of ten.
This oversimplified example sheds a light on the practical complexity of measuring the risk man-ager’s performance, according to the modern approach. Top managers couldn’t evaluate the risk man-ager’s performance without taking into account all the interactions between all the parties involved. Inreality, a precise analysis of this type is complicated, and risk managers would have a hard time estim-ating if their policies are the correct ones. Let us stress that this analysis is extremely difficult if we useonly standard accounting tools, which are not sensitive enough to the possible interactions (e.g., stand-ard accounting does not measure the fine changes that take place—such as the incremental effect of thenew risk management policy on the sales, the salaries, or the creditors’ satisfaction). We described thisinnovative approach in hope that the student will understand the nature of the problem and perhapsdevelop accounting tools that will present them with practical value.
Risk managers may not always clearly define their goals, because the firm’s goals are not alwaysclearly defined, especially for nonprofit organizations. Executives’ complex personal considerations,management coalitions, company procedures, past decisions, hopes, and expectations enter into themix of parameters defining the firm’s goals. These types of considerations can encourage risk managersto take conservative action. For example, risk managers may buy too much insurance for risks that thefirm could reasonably retain. This could result from holding the risk manager personally responsiblefor uninsured losses. Thus, it’s very important not to create a conflict between the risk managers’ in-terests and the firm’s interests. For example, the very people charged with monitoring mortgage issu-ance risk, the mortgage underwriters and mortgage bankers, had a financial incentive (commissions) toissue the loans regardless of the intrinsic risks. The resulting subprime mortgage crisis ensued becauseof the conflict of interest between mortgage underwriters and mortgage bankers. This situation createdthe starting point for the 2008–2009 financial crisis.
Risk managers must ascertain—before the damage occurs—that an arrangement will provide equi-librium between resources needed and existing resources. The idea is to secure continuity despitelosses. As such, the risk manager’ job is to evaluate the firm’s ability or capacity to sustain (absorb)damages. This job requires in-depth knowledge of the firm’s financial resources, such as credit lines, as-sets, and insurance arrangements. With this information risk managers can compare alternative meth-ods for handling the risks. We describe these alternative methods in the next section.
K E Y T A K E A W A Y S
< In this section you studied the interrelationship between firms’ goals to maximize value and thecontributions of the enterprise risk management function to such goals.
< We used a hypothetical income statement of a company.
< We also discussed the challenges in achieving firms’ goals under stakeholders’ many conflicting objectives.
CHAPTER 13 THE EVOLUTION OF RISK MANAGEMENT: ENTERPRISE RISK MANAGEMENT 285
balance sheet
Document that provides asnapshot of a firm’s assetsand liabilities.
financial statements
Income statements andbalance sheets.
D I S C U S S I O N Q U E S T I O N S
1. Discuss the different firm goals that companies seek to fulfill in the late 2000s.
2. How does the risk management function contribute to firm goals?
3. Find a company’s income statement and show how the enterprise risk management functions contributeat least two actions to increase the firm’s value.
4. How might firm stakeholders’ goals conflict? How might such conflicting goals affect value maximizationobjectives?
3. RISK MANAGEMENT AND THE FIRM’S FINANCIALSTATEMENT—OPPORTUNITIES WITHIN THE ERM
L E A R N I N G O B J E C T I V E S
< In this section you will learn the tasks of the enterprise risk managers (ERM) function as itrelates to the balance sheet of the firm annual statement.
< The ERM function manages and ensures sustainability by preventing losses and providing op-portunities within the risk matrix.
< Using hypothetical balance sheets, the student learns the actual ERM functions of both finan-cial and nonfinancial firms.
< Our exploration of financial firms uncovers some of the causes of the 2008–2009 financial crisis.
The enterprise risk manager or CRO must understand the risks inherent in both sides of the balancesheet of the firm’s financial statements. A balance sheet provides a snapshot of a firm’s assets and li-abilities. We show a balance sheet for a nonfinancial firm in Table 13.3. Table 13.5 then shows a bal-ance sheet for an insurance company. Firms must produce annual financial reports including their bal-ance sheets and income statements. Together, we call income statements and balance sheets financialstatements. While we focused in the section above on a simplified hypothetical income statement,now we focus on the assets and liabilities as they appear at a certain point. With this ammunition athand, we will be able to explain why financial institutions created so many problems during the2008–2009 credit crisis. You will be able to explain AIG’s major problems and why the governmentended up bailing it out, along with many other financial institutions. The question that you will be ableto answer is, “What side of the balance sheet did AIG fail to manage appropriately?”
3.1 Nonfinancial FirmFirst, we will work with a hypothetical, small, nonfinancial institution, such as a furniture manufac-turer or high-tech hardware and software company. Table 13.3 shows the hypothetical assets, liabilities,and equity of this business.
286 RISK MANAGEMENT FOR ENTERPRISES AND INDIVIDUALS
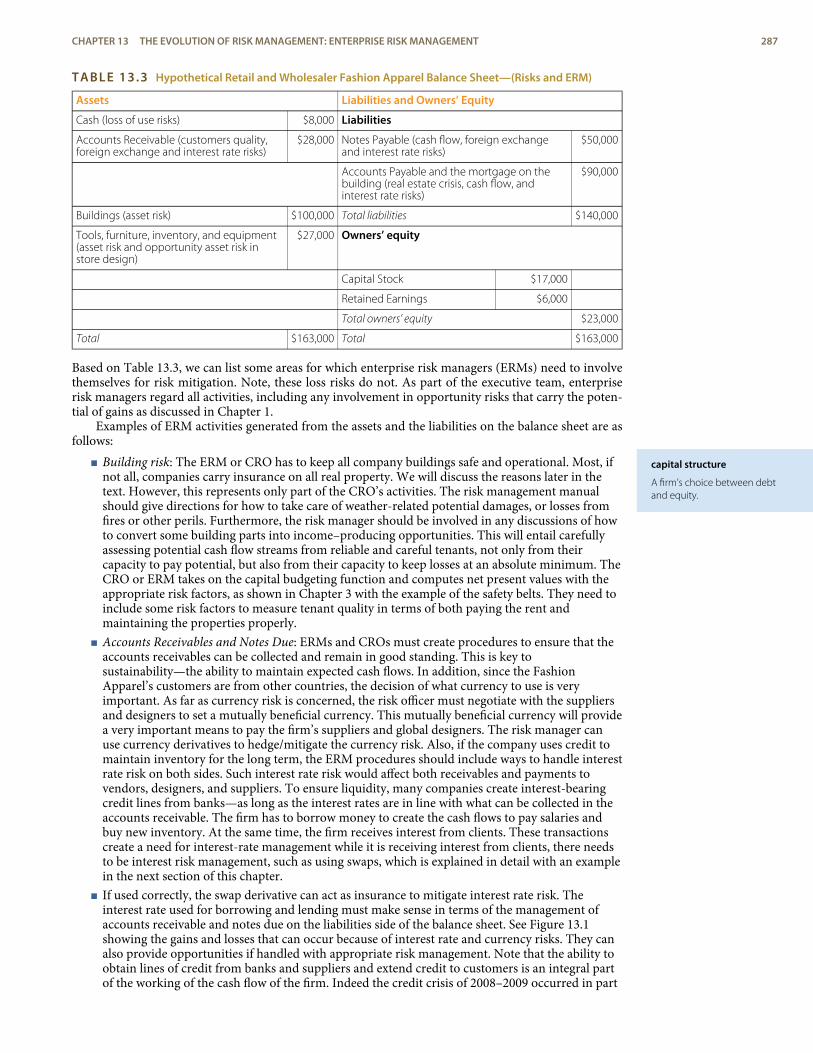
capital structure
A firm’s choice between debtand equity.
TABLE 13.3 Hypothetical Retail and Wholesaler Fashion Apparel Balance Sheet—(Risks and ERM)
Assets Liabilities and Owners’ Equity
Cash (loss of use risks) $8,000 Liabilities
Accounts Receivable (customers quality,foreign exchange and interest rate risks)
$28,000 Notes Payable (cash flow, foreign exchangeand interest rate risks)
$50,000
Accounts Payable and the mortgage on thebuilding (real estate crisis, cash flow, andinterest rate risks)
$90,000
Buildings (asset risk) $100,000 Total liabilities $140,000
Tools, furniture, inventory, and equipment(asset risk and opportunity asset risk instore design)
$27,000 Owners’ equity
Capital Stock $17,000
Retained Earnings $6,000
Total owners’ equity $23,000
Total $163,000 Total $163,000
Based on Table 13.3, we can list some areas for which enterprise risk managers (ERMs) need to involvethemselves for risk mitigation. Note, these loss risks do not. As part of the executive team, enterpriserisk managers regard all activities, including any involvement in opportunity risks that carry the poten-tial of gains as discussed in Chapter 1.
Examples of ERM activities generated from the assets and the liabilities on the balance sheet are asfollows:
< Building risk: The ERM or CRO has to keep all company buildings safe and operational. Most, ifnot all, companies carry insurance on all real property. We will discuss the reasons later in thetext. However, this represents only part of the CRO’s activities. The risk management manualshould give directions for how to take care of weather-related potential damages, or losses fromfires or other perils. Furthermore, the risk manager should be involved in any discussions of howto convert some building parts into income–producing opportunities. This will entail carefullyassessing potential cash flow streams from reliable and careful tenants, not only from theircapacity to pay potential, but also from their capacity to keep losses at an absolute minimum. TheCRO or ERM takes on the capital budgeting function and computes net present values with theappropriate risk factors, as shown in Chapter 3 with the example of the safety belts. They need toinclude some risk factors to measure tenant quality in terms of both paying the rent andmaintaining the properties properly.
< Accounts Receivables and Notes Due: ERMs and CROs must create procedures to ensure that theaccounts receivables can be collected and remain in good standing. This is key tosustainability—the ability to maintain expected cash flows. In addition, since the FashionApparel’s customers are from other countries, the decision of what currency to use is veryimportant. As far as currency risk is concerned, the risk officer must negotiate with the suppliersand designers to set a mutually beneficial currency. This mutually beneficial currency will providea very important means to pay the firm’s suppliers and global designers. The risk manager canuse currency derivatives to hedge/mitigate the currency risk. Also, if the company uses credit tomaintain inventory for the long term, the ERM procedures should include ways to handle interestrate risk on both sides. Such interest rate risk would affect both receivables and payments tovendors, designers, and suppliers. To ensure liquidity, many companies create interest-bearingcredit lines from banks—as long as the interest rates are in line with what can be collected in theaccounts receivable. The firm has to borrow money to create the cash flows to pay salaries andbuy new inventory. At the same time, the firm receives interest from clients. These transactionscreate a need for interest-rate management while it is receiving interest from clients, there needsto be interest risk management, such as using swaps, which is explained in detail with an examplein the next section of this chapter.
< If used correctly, the swap derivative can act as insurance to mitigate interest rate risk. Theinterest rate used for borrowing and lending must make sense in terms of the management ofaccounts receivable and notes due on the liabilities side of the balance sheet. See Figure 13.1showing the gains and losses that can occur because of interest rate and currency risks. They canalso provide opportunities if handled with appropriate risk management. Note that the ability toobtain lines of credit from banks and suppliers and extend credit to customers is an integral partof the working of the cash flow of the firm. Indeed the credit crisis of 2008–2009 occurred in part
CHAPTER 13 THE EVOLUTION OF RISK MANAGEMENT: ENTERPRISE RISK MANAGEMENT 287
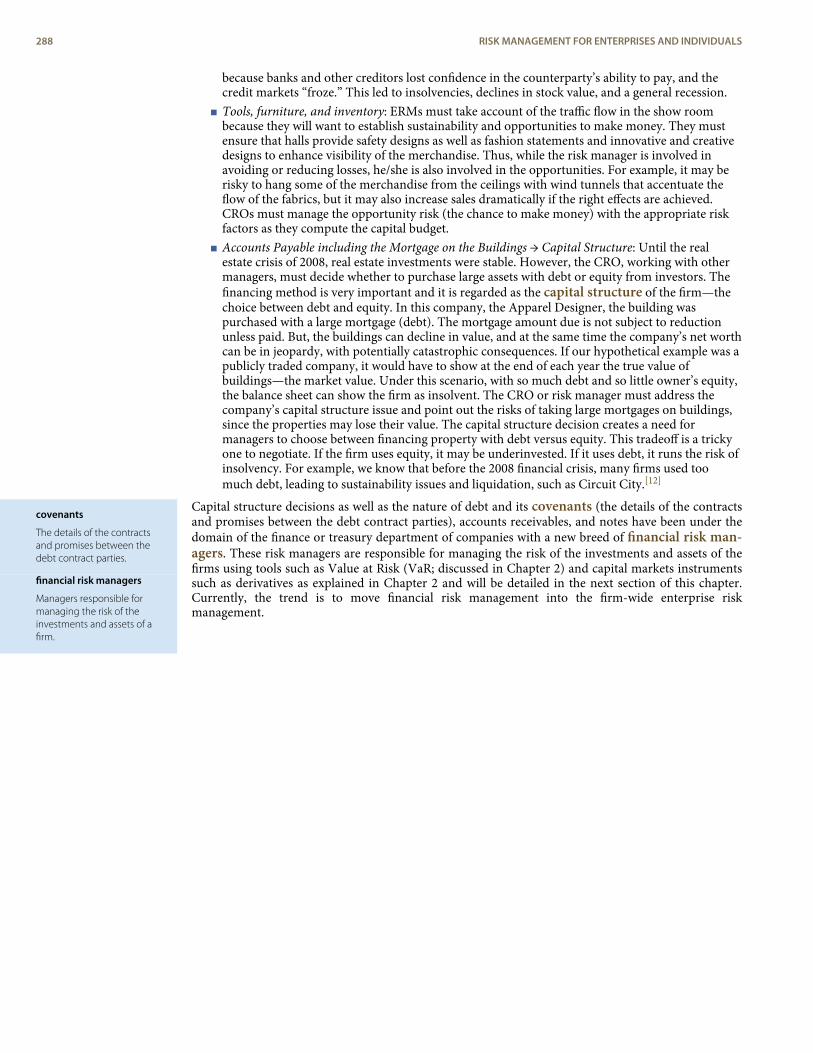
covenants
The details of the contractsand promises between thedebt contract parties.
financial risk managers
Managers responsible formanaging the risk of theinvestments and assets of afirm.
because banks and other creditors lost confidence in the counterparty’s ability to pay, and thecredit markets “froze.” This led to insolvencies, declines in stock value, and a general recession.
< Tools, furniture, and inventory: ERMs must take account of the traffic flow in the show roombecause they will want to establish sustainability and opportunities to make money. They mustensure that halls provide safety designs as well as fashion statements and innovative and creativedesigns to enhance visibility of the merchandise. Thus, while the risk manager is involved inavoiding or reducing losses, he/she is also involved in the opportunities. For example, it may berisky to hang some of the merchandise from the ceilings with wind tunnels that accentuate theflow of the fabrics, but it may also increase sales dramatically if the right effects are achieved.CROs must manage the opportunity risk (the chance to make money) with the appropriate riskfactors as they compute the capital budget.
< Accounts Payable including the Mortgage on the Buildings → Capital Structure: Until the realestate crisis of 2008, real estate investments were stable. However, the CRO, working with othermanagers, must decide whether to purchase large assets with debt or equity from investors. Thefinancing method is very important and it is regarded as the capital structure of the firm—thechoice between debt and equity. In this company, the Apparel Designer, the building waspurchased with a large mortgage (debt). The mortgage amount due is not subject to reductionunless paid. But, the buildings can decline in value, and at the same time the company’s net worthcan be in jeopardy, with potentially catastrophic consequences. If our hypothetical example was apublicly traded company, it would have to show at the end of each year the true value ofbuildings—the market value. Under this scenario, with so much debt and so little owner’s equity,the balance sheet can show the firm as insolvent. The CRO or risk manager must address thecompany’s capital structure issue and point out the risks of taking large mortgages on buildings,since the properties may lose their value. The capital structure decision creates a need formanagers to choose between financing property with debt versus equity. This tradeoff is a trickyone to negotiate. If the firm uses equity, it may be underinvested. If it uses debt, it runs the risk ofinsolvency. For example, we know that before the 2008 financial crisis, many firms used toomuch debt, leading to sustainability issues and liquidation, such as Circuit City.[12]
Capital structure decisions as well as the nature of debt and its covenants (the details of the contractsand promises between the debt contract parties), accounts receivables, and notes have been under thedomain of the finance or treasury department of companies with a new breed of financial risk man-agers. These risk managers are responsible for managing the risk of the investments and assets of thefirms using tools such as Value at Risk (VaR; discussed in Chapter 2) and capital markets instrumentssuch as derivatives as explained in Chapter 2 and will be detailed in the next section of this chapter.Currently, the trend is to move financial risk management into the firm-wide enterprise riskmanagement.
288 RISK MANAGEMENT FOR ENTERPRISES AND INDIVIDUALS
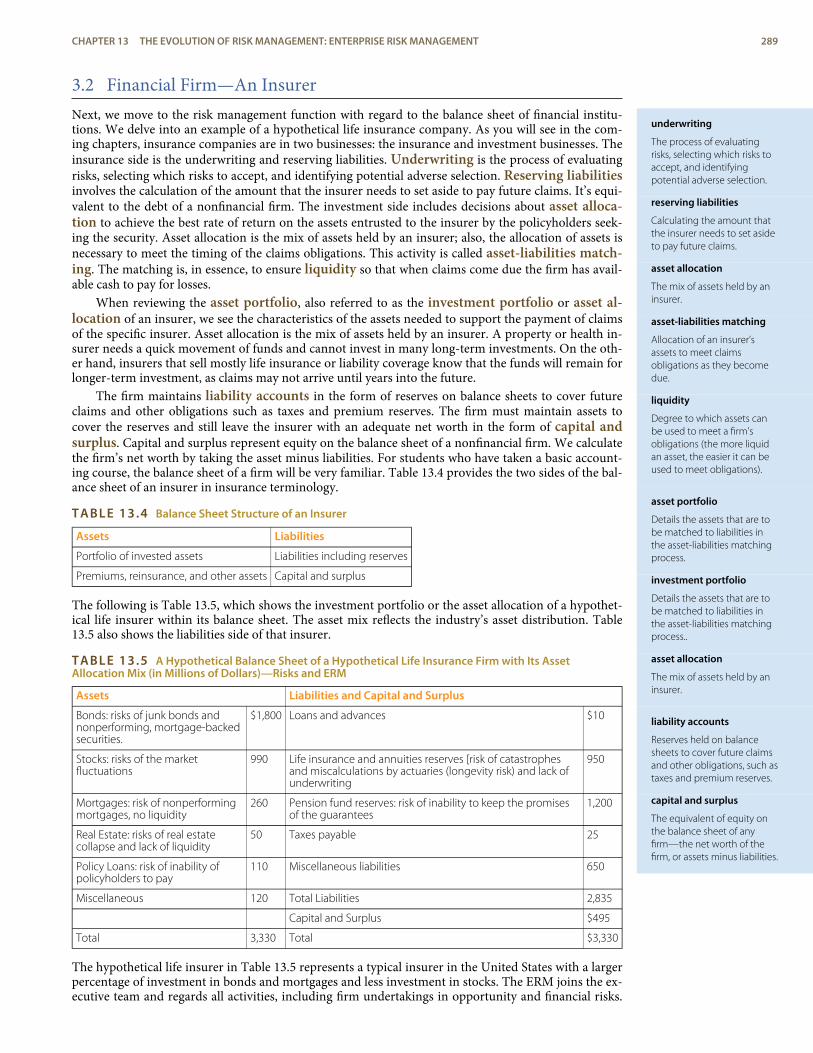
underwriting
The process of evaluatingrisks, selecting which risks toaccept, and identifyingpotential adverse selection.
reserving liabilities
Calculating the amount thatthe insurer needs to set asideto pay future claims.
asset allocation
The mix of assets held by aninsurer.
asset-liabilities matching
Allocation of an insurer’sassets to meet claimsobligations as they becomedue.
liquidity
Degree to which assets canbe used to meet a firm’sobligations (the more liquidan asset, the easier it can beused to meet obligations).
asset portfolio
Details the assets that are tobe matched to liabilities inthe asset-liabilities matchingprocess.
investment portfolio
Details the assets that are tobe matched to liabilities inthe asset-liabilities matchingprocess..
asset allocation
The mix of assets held by aninsurer.
liability accounts
Reserves held on balancesheets to cover future claimsand other obligations, such astaxes and premium reserves.
capital and surplus
The equivalent of equity onthe balance sheet of anyfirm—the net worth of thefirm, or assets minus liabilities.
3.2 Financial Firm—An InsurerNext, we move to the risk management function with regard to the balance sheet of financial institu-tions. We delve into an example of a hypothetical life insurance company. As you will see in the com-ing chapters, insurance companies are in two businesses: the insurance and investment businesses. Theinsurance side is the underwriting and reserving liabilities. Underwriting is the process of evaluatingrisks, selecting which risks to accept, and identifying potential adverse selection. Reserving liabilitiesinvolves the calculation of the amount that the insurer needs to set aside to pay future claims. It’s equi-valent to the debt of a nonfinancial firm. The investment side includes decisions about asset alloca-tion to achieve the best rate of return on the assets entrusted to the insurer by the policyholders seek-ing the security. Asset allocation is the mix of assets held by an insurer; also, the allocation of assets isnecessary to meet the timing of the claims obligations. This activity is called asset-liabilities match-ing. The matching is, in essence, to ensure liquidity so that when claims come due the firm has avail-able cash to pay for losses.
When reviewing the asset portfolio, also referred to as the investment portfolio or asset al-location of an insurer, we see the characteristics of the assets needed to support the payment of claimsof the specific insurer. Asset allocation is the mix of assets held by an insurer. A property or health in-surer needs a quick movement of funds and cannot invest in many long-term investments. On the oth-er hand, insurers that sell mostly life insurance or liability coverage know that the funds will remain forlonger-term investment, as claims may not arrive until years into the future.
The firm maintains liability accounts in the form of reserves on balance sheets to cover futureclaims and other obligations such as taxes and premium reserves. The firm must maintain assets tocover the reserves and still leave the insurer with an adequate net worth in the form of capital andsurplus. Capital and surplus represent equity on the balance sheet of a nonfinancial firm. We calculatethe firm’s net worth by taking the asset minus liabilities. For students who have taken a basic account-ing course, the balance sheet of a firm will be very familiar. Table 13.4 provides the two sides of the bal-ance sheet of an insurer in insurance terminology.
TABLE 13.4 Balance Sheet Structure of an Insurer
Assets Liabilities
Portfolio of invested assets Liabilities including reserves
Premiums, reinsurance, and other assets Capital and surplus
The following is Table 13.5, which shows the investment portfolio or the asset allocation of a hypothet-ical life insurer within its balance sheet. The asset mix reflects the industry’s asset distribution. Table13.5 also shows the liabilities side of that insurer.
TABLE 13.5 A Hypothetical Balance Sheet of a Hypothetical Life Insurance Firm with Its AssetAllocation Mix (in Millions of Dollars)—Risks and ERM
Assets Liabilities and Capital and Surplus
Bonds: risks of junk bonds andnonperforming, mortgage-backedsecurities.
$1,800 Loans and advances $10
Stocks: risks of the marketfluctuations
990 Life insurance and annuities reserves [risk of catastrophesand miscalculations by actuaries (longevity risk) and lack ofunderwriting
950
Mortgages: risk of nonperformingmortgages, no liquidity
260 Pension fund reserves: risk of inability to keep the promisesof the guarantees
1,200
Real Estate: risks of real estatecollapse and lack of liquidity
50 Taxes payable 25
Policy Loans: risk of inability ofpolicyholders to pay
110 Miscellaneous liabilities 650
Miscellaneous 120 Total Liabilities 2,835
Capital and Surplus $495
Total 3,330 Total $3,330
The hypothetical life insurer in Table 13.5 represents a typical insurer in the United States with a largerpercentage of investment in bonds and mortgages and less investment in stocks. The ERM joins the ex-ecutive team and regards all activities, including firm undertakings in opportunity and financial risks.
CHAPTER 13 THE EVOLUTION OF RISK MANAGEMENT: ENTERPRISE RISK MANAGEMENT 289
actuaries
Individuals who specialize inforecasting the losses anddeveloping the losses’potential future impact onthe insurers.
mortality tables
Tables that indicate thepercent of expected deathsfor each age group.
life expectancy
Measure of the length of lifeexpected for people born ineach year.
due diligence
The process of examiningevery action and items in thefinancial statement ofcompanies to ensure the datareflect true value.
Therefore, the risk manager works also as a financial risk manager on the side of the insurer’s asset al-location and capital structure questions. Examples of ERM activities generated from the assets and liab-ilities on the balance sheet are as follows:
< Risks from the liabilities: The liabilities comprise mostly reserves for claims on the products soldby the life insurer. The products here are life and annuities (this insurance company does not sellhealth insurance). Most of the reserves are for these products. The reserves are computed byactuaries, who specialize in forecasting the losses and developing the losses’ potential futureimpact on the insurers. Actuaries use mortality tables and life expectancy tables to estimate thefuture losses that the insurer must pay. Mortality tables indicate the percent of expected deathsfor each age group. Life expectancy shows the length of life expected for people born in eachyear. Chapter 1 delves into this topic in detail. Usually, life insurance firms maintain a high levelof expertise in selling products to people and categorizing them in similar risk levels. Insuranceunderwriters develop specialized expertise to ensure that the insurer does not sell the productstoo cheaply for the risks that the insurer accepts. As such, the enterprise risk manager depends onthe actuarial and underwriting expertise to ensure the liabilities side of the business is wellmanaged. If the reserve calculations miss the mark, the insurer can become insolvent very quicklyand lose the capital and surplus, which is its net worth.[13]
< Risks from the asset mix: The enterprise risk manager or CRO should ensure that the insurer’sinvestment portfolio or asset mix can perform and sustain its value. Our hypothetical life insurerposted $1,800 million in bonds. The mix of these bonds is critical, especially during the recent2008–2009 global crisis (described in Chapter 1). The amount of mortgage-backed securities(MBS) within the bonds is very critical, especially if these MBS are nonperforming and lose theirvalue. As it turns out, the balance sheet we provided above represents a time before the creditcrisis of 2008. This hypothetical insurer held 10 percent of its bonds in MBS and half of themturned into nonperforming assets by the end of 2008. This translates into $90 million of lostassets value in 2008. In addition, the stock market collapse took its toll and the 2008 market valueof the stocks decreased by 30.33 percent. Investment professionals worked with a CRO to ensurea much lower decrease than the market indexes. They ensured that the stock portfolio was moreconservative. If we assume that all other liabilities and assets did not suffer any additional loss, thecapital and surplus of this hypothetical insurer will be almost wiped out at the end of 2008.[14]
$495 − 90 − 330 = $75 worth of capital and surplus
As an insurer, the firm faces an outcome to the ERM function, since underwriting is a critical compon-ent for the insurer’s sustainability. Here, the balance sheet would show that the insurer invested inmortgage-backed securities (MBS), not doing its underwriting work itself. The insurers allowed the in-vestment professionals to invest in financial instruments that did not underwrite the mortgage holdersprudently. If the CRO was in charge completely, he would have known how to apply the expertise ofthe liabilities side into the expertise of the assets side and would have demanded clear due diligence in-to the nature of MBS. Warren Buffet, the owner of insurance companies, said he did not trust MBS anddid not invest in such instruments in his successful and thriving businesses. Due diligence examinesevery action and items in the financial statement of companies to ensure the data reflect true value.
K E Y T A K E A W A Y S
In this section you learned the following:
< How the ERM function has to consider both sides of the balance sheet: assets and liabilities
< How the ERM function ensures the survival of the firm and its net worth
< How the ERM function can help in the due diligence for sustainability
< The differences between the ERM function of a nonfinancial firm and a financial firm
290 RISK MANAGEMENT FOR ENTERPRISES AND INDIVIDUALS
derivatives
Financial securities whosevalue is derived from anotherunderlying asset.
forwards
Financial securities traded inthe over-the-counter marketwhose characteristics can betailored to meet specificcustomer needs.
basis
The amount of money aboveand beyond the futures price.
D I S C U S S I O N Q U E S T I O N S
1. Find the balance sheet of a company such as Best Buy and analyze all the risk and ERM from the assetsside and from the liabilities side. Create a list of actions for the ERM function.
2. Find the balance sheet of Bank of America from 2006 or 2007 and analyze all the risk and ERM from theassets side and from the liabilities side. Create a list of actions for the ERM function.
3. Introduce the 2008–2009 credit crisis to both companies in questions 1 and 2. Explain the impact on thenet worth of these companies. What actions you would suggest to incorporate in the ERM function?
4. RISK MANAGEMENT USING THE CAPITAL MARKETS
L E A R N I N G O B J E C T I V E S
< In this section you will learn how the ERM function can incorporate the capital markets’ instru-ments, such as derivatives.
< You also learn though a case how swaps can help mitigate the interest rate risk of a bank.
Enterprise risk management has emerged from the following steps of maturation:< Risk management using insurance as discussed briefly in Chapter 3 and will be the topic of the
rest of the book< Explosive growth in technology and communications< Development of quantitative techniques and models to measure risk (shown in Chapter 2)< Evolution of the financial markets and financial technology into hedging of risks
These mechanisms combine to create a direct connection between the firm’s overall appetite for risk, asset in company objectives, and choosing appropriate corporate-level for solutions in mitigating risks.
4.1 Evolution of the Financial MarketsThe last two or three decades have been a period of rapid financial innovation. Capital markets soaredand with the growth came the development of derivatives. Derivatives can be defined as financial se-curities whose value is derived from another underlying asset. Our discussion will incorporate threebasic tools used: forwards/futures, swaps, and options. Derivatives are noninsurance instruments usedto hedge, or protect, against adverse movements in prices (in stocks or in commodities such as rice andwheat) or rates (such as interest rates or foreign exchange rates). For example, breakfast cereal manu-facturer Frosty O’s must have wheat to produce its finished goods. As such, the firm is continually vul-nerable to sudden increases in wheat prices. The company’s risk management objective would be toprotect against wheat price fluctuations. Using derivatives, we will explore the different choices in howan enterprise risk manager might mitigate the unwanted price exposure.
Forward/Future Purchase
Forwards and futures are similar in that they are agreements that obligate the owner of the instrumentto buy or sell an asset for a specified price at a specified time in the future. Forwards are traded in theover-the-counter market, and contract characteristics can be tailored to meet specific customer needs.Farmers and grain elevator operators also use forwards to lock in a price for their corn or soybeans orwheat. They may choose to lock in the basis, which is the amount of money above and beyond the fu-tures price. Alternatively, if they like (believe that the prices are at their highest likely levels) the futures’price levels, they can lock in the entire price. Food and beverage companies use forwards to lock intheir costs for grains and fruits and vegetables. Quaker Oats, for example, locks in the prices on cornand oats using forward contracts with growers. Anheuser Busch depends upon forwards to lock in theprice of hops, rice, and other grains used to make beer. Dole fruit companies use forwards to price outpineapples, raspberries, grapes, and other fruits.
CHAPTER 13 THE EVOLUTION OF RISK MANAGEMENT: ENTERPRISE RISK MANAGEMENT 291
futures
Financial securities that tradeon an exchange and thathave standardized contractspecifications.
swaps
Agreements to exchange ortransfer expected futurevariable-price purchases of acommodity or foreignexchange contract for a fixedcontractual price today.
options
Agreements that give theright (but not the obligation)to buy or sell an underlyingasset at a specified price at aspecified time in the future.
Futures, on the other hand, trade on an exchange with standardized contract specifications. For-wards and futures prices derive from the spot, or cash market, which is “today’s” price for a particularasset. An example of a spot contract would be your agreement to purchase a meal at a restaurant. Thespot market is the quoted price on today’s menu. A futures or forwards market would be the price youwould have to pay if you wanted the same meal one year from today. Getting back to our cereal manu-facturer, Frosty O’s can either go to the spot market on an ongoing basis or use the forwards/futuresmarket to contract to buy wheat in the future at an agreed-upon price. Buying in the spot market cre-ates exposure to later price fluctuation. Buying in the forwards/futures market allows the manufacturerto guarantee future delivery of the wheat at a locked-in price. Hence, this strategy is known as a “lock itin” defense. Southwest Airlines’ strategy to buy oil futures during the fuel crisis of 2007–2008 allowedthem to be the only profitable airline. On the other side, Continental Airline is suffering from buyingaviation fuel futures when the price of oil subsequently declined dramatically. Thus, the use of futuresand forwards can create value or losses, depending upon the timing of its implementation.
Swaps
Swaps are agreements to exchange or transfer expected future variable-price purchases of a commod-ity or foreign exchange contract for a fixed contractual price today. In effect, Frosty O’s buys wheat andswaps its expected “floating” price exposure for wheat at different times in the future for a fixed ratecost. For example, if Frosty O’s normally buys wheat on the first of each month, the company will haveto pay whatever the spot price of wheat is on that day. Frosty O’s is exposed to market price fluctu-ations for each of the twelve months over a year’s time period. It can enter into a transaction to pay afixed monthly rate over a year’s time period instead of whatever the floating spot rate may be eachmonth. The net effect of the swap transaction is to receive the necessary wheat allotment each monthwhile paying a fixed, predetermined rate. The swap rate quote would be fixed using the spot marketand the one-year forward market for wheat. Thus Frosty O’s eliminates any adverse price exposure byswitching the “floating” price exposure for an agreed-upon fixed price. Swaps are used in the samemanner to exchange floating interest rate liabilities for fixed-interest rate liabilities. Hence, this strategyis known as a “switch out of it” defense. We will show an elaborate swaps example at the end of thissection.
Options
Agreements that give the right (but not the obligation) to buy or sell an underlying asset at a specifiedprice at a specified time in the future are known as options. Frosty O’s can purchase an option to buythe wheat it needs for production at a given strike price. The strike price (also called exercise price) isthe specified price set in the option contract. In this fashion, Frosty O’s can place a ceiling on the priceit will pay for the needed wheat for production in future time periods. Until the maturity date of theoption passes, option holders can exercise their rights to buy wheat at the strike price. If the future spotprice of wheat rises above the strike price, Frosty O’s will execute its option to purchase the wheat atthe lower strike price. If the future price of wheat falls below the strike price, the company will not ex-ercise its option and will instead purchase wheat directly in the spot market. This differentiates the op-tion contract from the futures contract. An option is the right to buy or sell, whereas a futures/forwardcontract is an obligation to buy of sell. The option buyer pays the cost of the option to buy wheat at thestrike price—also known as the option premium. A call option grants the right to buy at the strikeprice. A put option grants the right to sell at the strike price. A call option acts like insurance to providean upper limit on the cost of a commodity. A put option acts like insurance to protect a floor sellingprice for wheat. Hence, option strategies are known as “cap” and “floor” defenses.[15]
Individuals and companies alike use derivative instruments to hedge against their exposure to un-predictable loss due to price fluctuations. The increasing availability of different derivative products hasarmed enterprise risk managers (ERM) with new risk management tool solutions. An importer of rawmaterials can hedge against changes in the exchange rate of the U.S. dollar relative to foreign curren-cies. An energy company can hedge using weather derivatives to protect against adverse or extremeweather conditions. And a bank can hedge its portfolio against interest rate risk. All of these risk expos-ures interrupt corporate cash flow and affect earnings, capital, and the bottom line, which is the valueof the firm. These solutions, however, create new risk exposures. Over-the-counter market-traded de-rivatives, which feature no exchange acting as counterparty to the trade, expose a company to creditrisk in that the counter party to the contract may not live up to its side of the obligation.
4.2 Risk Management Using Capital MarketsDramatic changes have taken place in the insurance industry in the past two to three decades. A suc-cession of catastrophic losses has caused insurers and reinsurers to reevaluate their risk analyses. Thereassessment effort was made in full realization that these disasters, as horrible as they were, may not be
292 RISK MANAGEMENT FOR ENTERPRISES AND INDIVIDUALS
securitization
Packaging and transferringthe insurance risks to thecapital markets through theissuance of a financialsecurity.
counterparty risk
Risk of loss from failure of acounterparty, or secondparty, in a derivatives contractto perform as agreed orcontracted.
insurance-linked securities
General term forsecuritization instruments.
catastrophe bonds
Bonds that seek to protectthe insurance industry fromcatastrophic events.
the last worst-case scenarios. Past fears of multiple noncorrelated catastrophic events occurring in a rel-atively short period of time are on the top of agendas of catastrophe risk modelers and all constituen-cies responsible for national disaster management. The affordability of coverage, along with reinsurers’credit quality concerns players who have lost large chunks of capital and surplus or equity to those dis-asters led to the first foray into using the capital markets as a reinsurance alternative.[16]
Securitization
Packaging and transferring the insurance risks to the capital markets through the issuance of a financialsecurity is termed securitization.[17] The risks that have been underwritten are pooled together into abundle, which is then considered an asset and the underwriter then sells its shares; hence, the risk istransferred from the insurers to the capital markets. Securitization made a significant difference in theway insurance risk is traded—by making it a commodity and taking it to the capital markets in addi-tion to or instead of to the insurance/reinsurance market. Various insurance companies’ risks for simil-ar exposures in diversified locations are combined in one package that is sold to investors (who mayalso include insurers). Securitized catastrophe instruments can help a firm or an individual to diversifyrisk exposures when reinsurance is limited or not available. Because global capital markets are so vast,they offer a promising means of funding protection for even the largest potential catastrophes. Capitalmarket solutions also allow the industry (insurers and reinsurers) to reduce credit risk exposure, alsoknown as counterparty risk. This is the risk of loss from failure of a counterparty, or second party, ina derivatives contract to perform as agreed or contracted. Capital market solutions also diversify fund-ing sources by spreading the risk across a broad spectrum of capital market investors. Securitization in-struments are also called insurance-linked securities (ISLs). They include catastrophe bonds, cata-strophe risk exchange swaps, insurance-related derivatives/options, catastrophe equity puts (Cat-E-Puts), contingent surplus notes, collateralized debt obligations (CDOs),[18] and weather derivatives.
Catastrophe bonds, or CAT bonds, seek to protect the insurance industry from catastrophicevents. The bonds pay interest and return principal to investors the way other debt securities do—aslong as the issuer does not experience losses above an agreed-upon limit. Insurers can come to the cap-ital market to issue bonds that are tied to a single peril, or even to a portfolio or basket of risks. Embed-ded in each issue is a risk trigger that, in the event of catastrophic loss, allows for forgiveness of interestand/or principal repayment.
The CAT Bond Story
Innovation is key to the success stories on Wall Street. In November 1996, Morgan Stanley & Co. was about tomake history as the first to underwrite an insurance-related issue offered to the public: catastrophe bonds.California Earthquake Authority (CEA), a state agency providing homeowners insurance, needed capital andhad sought Wall Street’s assistance. Morgan Stanley proposed a simple structure: bonds paying a robust 10percent interest but with a catastrophic loss trigger point of $7 billion. If CEA lost that much (or more) fromany one earthquake, the investors would lose their principal.
The deal didn’t happen because Berkshire Hathaway’s insurance division, National Indemnity Co., offered tounderwrite CEA’s earthquake risk. Many speculate that Berkshire was intent on foiling investment bankingfirms’ attempt to steal away traditional reinsurance business. The market didn’t go away, however. By the timeKatrina hit the Gulf Coast in 2005, the market had grown to an estimated $6 billion in value. The market keptgrowing since 1997 when $900 million worth of CAT bonds were sold. In June of that year, USAA, a SanAntonio-based insurer, floated an issue of $477 million in the capital markets with a one-year maturity. The lossthreshold was $1 billion. As long as a hurricane didn’t hit USAA for more than the $1 billion over the one-yeartime period, investors would enjoy a hefty coupon of 11 percent and would get their principal back.
Reinsurer industry executives agreed upon only one thing: CAT bonds would radically change their business.With ongoing property development in catastrophe-prone areas, the insurance industry’s exposure to hugelosses is only increasing. S&P calculated that the probability of a $1 billion loss occurring in any given year isabout 68 percent, while the probability of a $3 billion loss drops to about 31 percent. The chance of a $15 bil-lion loss in a given year is about 4 percent. For example, Hurricane Ike produced losses of about $23 billion in2008.
CAT bonds have been hailed for the following reasons: they add capacity to the market, fill in coverage gaps,and give risk managers leverage when negotiating with insurers by creating a competitive alternative. As theinsurance industry cycles, and the next wave of disasters depletes reinsurance companies’ capital and surplus,Wall Street will be poised to take advantage. During soft markets, CAT bonds are more expensive than tradi-tional reinsurance. If reinsurance markets begin to harden, CAT bond issues are a practical alternative.However, some downside potential threaten. What happens when you have a loss, and the bonds are used topay for the exposure? Andrew Beazley, active underwriter of Beazley Syndicate 623 in London, said, “Once you
CHAPTER 13 THE EVOLUTION OF RISK MANAGEMENT: ENTERPRISE RISK MANAGEMENT 293
catastrophe equity puts(Cat-E-Puts)
Financial instrument thatgives an insurer the option tosell equity (e.g., preferredshares) at predeterminedprices, contingent upon thecatastrophic event.
contingent surplus notes
Options to borrow money incase of a specific event.
collateralized debtobligations (CDOs)
Securities backed by a pool ofdiversified assets.
weather derivatives
Derivative contracts that paybased on weather-relatedevents.
have a loss, the bonds will pay, but you still have the exposure. The question is whether you’ll be able to floatanother bond issue to cover it the next time something happens. Reinsurers are expected to stick around andstill write coverage after a loss, but can the same be said with CAT bond investors?” Apparently, the answer is“yes,” as evidenced from the substantial growth of this risk capital from an estimated $4.04 billion in 2004 toapproximately $6 billion in 2005. The biggest fear of the CAT bonds owners in the aftermath of Katrina did notmaterialize. The insured losses from Katrina did not exceed the agreed level.
Sources: Andrew Osterland, “The CATs Are out of the Bag,” BusinessWeek, January 26, 1998; Douglas McLeod, “Cat Bonds to Grow: Increasing Frequencyof Losses Will Contribute: S&P,” Business Insurance, July 12 1999, 2; Mike Hanley, “Cat Bond Market Almost There,” International Risk Management, 8,no. 1 (2001); Sam Friedman, “There’s More than One Way to Skin a Cat,” National Underwriter, Property & Casualty/Risk & Benefits ManagementEdition, May 8, 2000; Mark E. Ruquet “CAT Bonds Grew 17 Percent In ‘04” National Underwriter Online News Service, April 1, 2005; Richard Beales andJennifer Hughes, “Katrina Misses Cat Bond Holders,” Financial Times, August 31, 2005 at http://news.ft.com/cms/s/59e21066-1a66-11da-b7f5-00000e2511c8.html.
An example of a CAT bond is the issue by Oriental Land Company Ltd., owner and operator of TokyoDisneyland. Oriental Land used CAT bonds to finance one facility providing earthquake coverage andthe other to provide standby financing to continue a $4 billion expansion of the theme park. Each facil-ity raised $100 million via the bond market to cover property risk exposure and subsequent indirectbusiness interruption loss in case of catastrophic loss from an earthquake. The trigger event was for anearthquake, regardless of whether the event caused any direct physical damage to the park.[19] For moreabout how CAT bonds provide protection, see “The CAT Bond Story” in this chapter.
With catastrophe equity puts (Cat-E-Puts), the insurer has the option to sell equity (e.g., pre-ferred shares) at predetermined prices, contingent upon the catastrophic event. Contingent surplusnotes are options to borrow money in case of a specific event. Collateralized debt obligations(CDOs) are securities backed by a pool of diversified assets; these are referred to as collateralized bondobligations (CBOs) when the underlying assets are bonds and as collateralized loan obligations (CLOs)when the underlying assets are bank loans.[20] Weather derivatives are derivative contracts that paybased on weather-related events. All are examples of financial market instruments that have been usedto transfer risk and to provide risk-financing vehicles.[21]
Investors’ advantages in insurance-linked securities are diversification, as these instruments allownoninsurance investors to participate in insurance-related transactions and above-average rates of re-turn. Advantages to the issuers of such instruments include greater capacity and access to the capitalmarkets. Insurance-linked securities provide issuers with more flexibility and less reliance on rein-surers. The presence of new instruments stabilizes reinsurance pricing and provides higher levels ofrisk transfer with cutting-edge understanding for both insurance and capital markets.
We have shown that enterprise risk management (ERM) for a corporation is indeed complex. Fullenterprise-wide risk management entails folding financial risk management into the CRO’s departmentresponsibilities. A chief risk officer’s role is multifaceted. Today, risk managers develop goals to widenthe understanding of risk management so that employees take into account risk considerations in theirday-to-day operations. Risk awareness has become imperative to the overall health of the organization.Sound practices must incorporate the advancements on the technology front so that companies cancompete in the global environment. Viewing all integrated segments of risk from across the enterprisein a holistic manner facilitates a global competitive advantage.
4.3 Example: The Case of Financial Risk Management for theHypothetical Hometown BankJohn Allen is the CEO of Hometown Bank.[22] Mr. Allen is addressing company-wide, long-range plansto incorporate risk management techniques to maximize his bank’s financial performance and share-holder value.
Important note: This hypothetical case reflects a bank’s activities in the early 2000s. It does not dealwith the 2008–2009 credit crisis and it ramifications on many banks and the financial institutionsglobally.
History
In the early years of U.S. banking history, banks seemed to have the easiest job in the corporate world.All a bank manager had to do was receive deposits in the form of checking, savings, and deposit ac-counts (bank liabilities), and provide mortgage and other lending services (bank assets). Throughoutthe twentieth century, the banking industry prospered. For most of the post–World War II era theupward-sloping yield curve meant that interest rates on traditional thirty-year residential mortgage
294 RISK MANAGEMENT FOR ENTERPRISES AND INDIVIDUALS
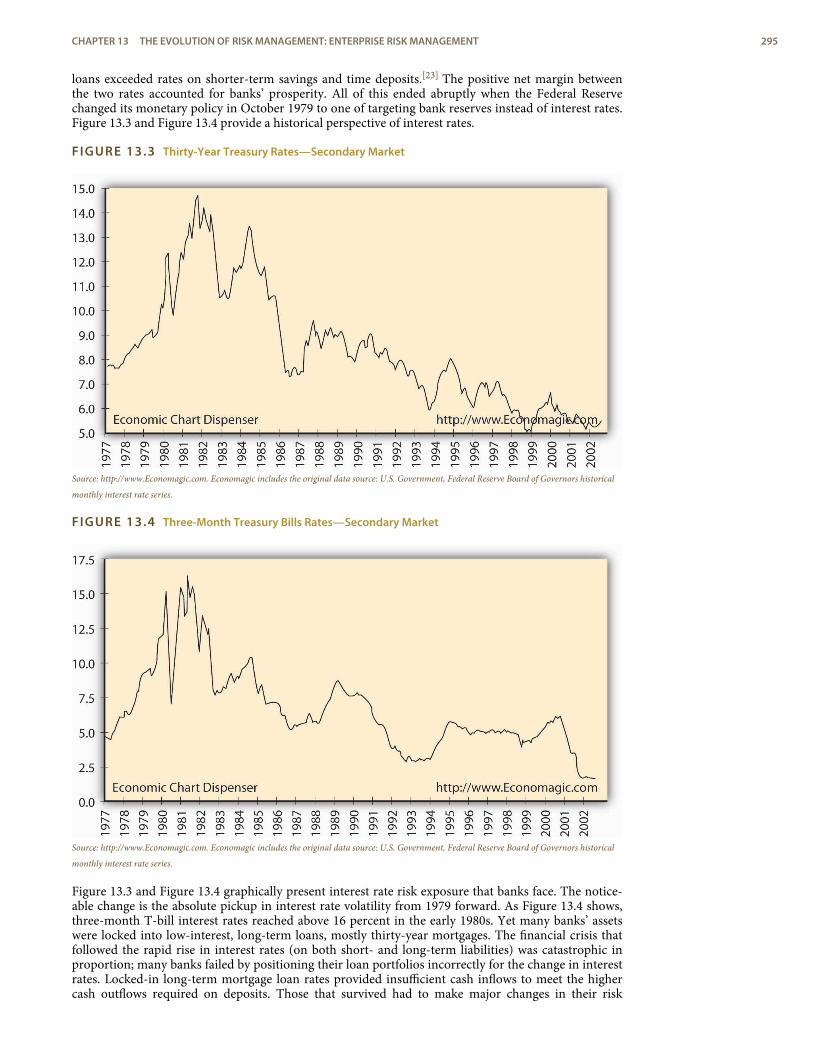
loans exceeded rates on shorter-term savings and time deposits.[23] The positive net margin betweenthe two rates accounted for banks’ prosperity. All of this ended abruptly when the Federal Reservechanged its monetary policy in October 1979 to one of targeting bank reserves instead of interest rates.Figure 13.3 and Figure 13.4 provide a historical perspective of interest rates.
FIGURE 13.3 Thirty-Year Treasury Rates—Secondary Market
Source: http://www.Economagic.com. Economagic includes the original data source: U.S. Government, Federal Reserve Board of Governors historical
monthly interest rate series.
FIGURE 13.4 Three-Month Treasury Bills Rates—Secondary Market
Source: http://www.Economagic.com. Economagic includes the original data source: U.S. Government, Federal Reserve Board of Governors historical
monthly interest rate series.
Figure 13.3 and Figure 13.4 graphically present interest rate risk exposure that banks face. The notice-able change is the absolute pickup in interest rate volatility from 1979 forward. As Figure 13.4 shows,three-month T-bill interest rates reached above 16 percent in the early 1980s. Yet many banks’ assetswere locked into low-interest, long-term loans, mostly thirty-year mortgages. The financial crisis thatfollowed the rapid rise in interest rates (on both short- and long-term liabilities) was catastrophic inproportion; many banks failed by positioning their loan portfolios incorrectly for the change in interestrates. Locked-in long-term mortgage loan rates provided insufficient cash inflows to meet the highercash outflows required on deposits. Those that survived had to make major changes in their risk
CHAPTER 13 THE EVOLUTION OF RISK MANAGEMENT: ENTERPRISE RISK MANAGEMENT 295
management style. Later we will introduce how a specific bank, Hometown Bank, manages its interestrate exposure using derivatives.
“Modern banks employ credit-scoring techniques to ensure that they are making good lending de-cisions, use analytical models to monitor the performance of their loan portfolios, and implement fin-ancial instruments to transfer out those credit risks with which they are not comfortable.”[24] Bankerslearned a costly lesson in the 1980s by not being adequately prepared for a changing interest rate envir-onment. Risk management must be enterprise-wide and inclusive of all components of risk. Homet-own Bank is a surviving bank, with lofty goals for the future. The current focus for CEO John Allen hasthree components:
1. Review the primary elements of Hometown’s financial risks:< Interest rate risk—those risks associated with changes in interest rates< Market risk—risk of loss associated with changes in market price or value< Credit risk—risk of loss through customer default
2. Review Hometown’s nonfinancial, or operational, risks: those risks associated with the operatingprocesses or systems in running a bank
3. Monitor the success of risk mitigation techniques the bank employs
4.4 The Hypothetical Hometown Bank—Early 2000sHometown Bancorp was formed in 1985 as a financial holding company headquartered in Richmond,Virginia. Its only subsidiary is Hometown Bank, which was chartered in 1950 with the opening of itsfirst branch in downtown Richmond. Hometown has experienced a steady growth of core assets: de-posits, money market instruments, and marketable security investments. Table 13.6 shows Homet-own’s investment policy and lists allowable securities for their investment securities account.
TABLE 13.6 Hometown Bancorp Investment Policy, December 31, 2001
The securities portfolio is managed by the president and treasurer of the bank. Investment management ishandled in accordance with the investment policy, which the board of directors approves annually. To assist inthe management process, each investment security shall be classified as “held-for-maturity” or “available-for-sale.”The investment policy covers investment strategies, approved securities dealers, and authorized investments. Thefollowing securities have been approved as investments:
< U.S. Treasury Securities
< Agency Securities
< Municipal Notes and Bonds
< Corporate Notes and Bonds
< GNMA, FNMA, and FHLMC mortgage-backed securities (MBS)
< Collateralized Mortgage Obligations (CMOs)
< Interest Rate Swaps
< Interest Rate Caps
All securities must be investment grade quality and carry a minimum rating of no less than single-A by Moody’s orStandard & Poor’s.
Asset growth has occurred both internally and externally with the acquisition of community banks andbranches in Hometown’s market. Market domain expanded to include the capital region (the city ofRichmond and surrounding counties), the Tidewater region, the Shenandoah Valley region, and thenorthern Virginia markets. In March 2002, Hometown Bank opened its twenty-fifth branch, in Virgin-ia Beach, Virginia. With total assets of approximately $785 million (as of December 2001), Hometownranks as the eighth largest commercial bank in the state of Virginia. The network of branches offers awide range of lending and deposit services to business, government, and consumer clients. The use ofthese deposits funds both the loan and investment portfolio of the bank. Principal sources of revenueare interest and fees on loans and investments and maintenance fees for servicing deposit accounts.Principal expenses include interest paid on deposits and other borrowings and operating expenses.Corporate goals include achieving superior performance and profitability, gaining strategic marketshare, and providing superior client service. Hometown has achieved its fifth consecutive year of recordearnings. Table 13.7 shows Hometown’s consolidated financial statements from 1999 to 2001.
296 RISK MANAGEMENT FOR ENTERPRISES AND INDIVIDUALS
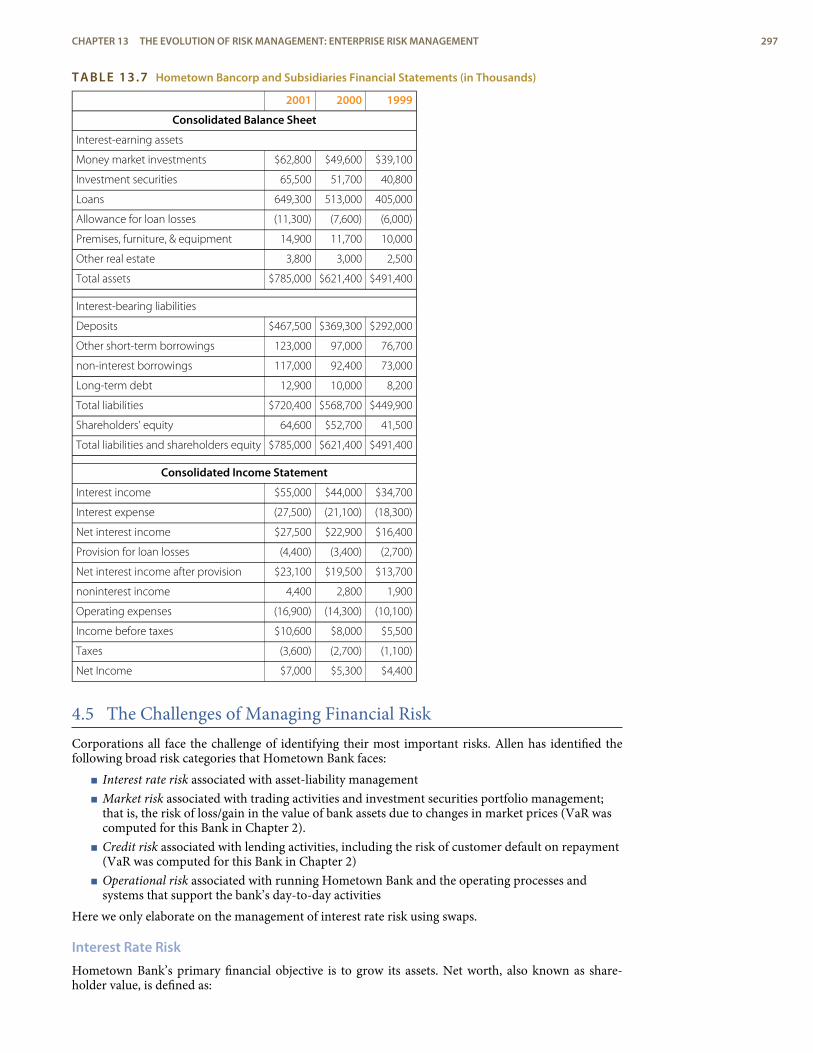
TABLE 13.7 Hometown Bancorp and Subsidiaries Financial Statements (in Thousands)
2001 2000 1999
Consolidated Balance Sheet
Interest-earning assets
Money market investments $62,800 $49,600 $39,100
Investment securities 65,500 51,700 40,800
Loans 649,300 513,000 405,000
Allowance for loan losses (11,300) (7,600) (6,000)
Premises, furniture, & equipment 14,900 11,700 10,000
Other real estate 3,800 3,000 2,500
Total assets $785,000 $621,400 $491,400
Interest-bearing liabilities
Deposits $467,500 $369,300 $292,000
Other short-term borrowings 123,000 97,000 76,700
non-interest borrowings 117,000 92,400 73,000
Long-term debt 12,900 10,000 8,200
Total liabilities $720,400 $568,700 $449,900
Shareholders’ equity 64,600 $52,700 41,500
Total liabilities and shareholders equity $785,000 $621,400 $491,400
Consolidated Income Statement
Interest income $55,000 $44,000 $34,700
Interest expense (27,500) (21,100) (18,300)
Net interest income $27,500 $22,900 $16,400
Provision for loan losses (4,400) (3,400) (2,700)
Net interest income after provision $23,100 $19,500 $13,700
noninterest income 4,400 2,800 1,900
Operating expenses (16,900) (14,300) (10,100)
Income before taxes $10,600 $8,000 $5,500
Taxes (3,600) (2,700) (1,100)
Net Income $7,000 $5,300 $4,400
4.5 The Challenges of Managing Financial RiskCorporations all face the challenge of identifying their most important risks. Allen has identified thefollowing broad risk categories that Hometown Bank faces:
< Interest rate risk associated with asset-liability management< Market risk associated with trading activities and investment securities portfolio management;
that is, the risk of loss/gain in the value of bank assets due to changes in market prices (VaR wascomputed for this Bank in Chapter 2).
< Credit risk associated with lending activities, including the risk of customer default on repayment(VaR was computed for this Bank in Chapter 2)
< Operational risk associated with running Hometown Bank and the operating processes andsystems that support the bank’s day-to-day activities
Here we only elaborate on the management of interest rate risk using swaps.
Interest Rate Risk
Hometown Bank’s primary financial objective is to grow its assets. Net worth, also known as share-holder value, is defined as:
CHAPTER 13 THE EVOLUTION OF RISK MANAGEMENT: ENTERPRISE RISK MANAGEMENT 297
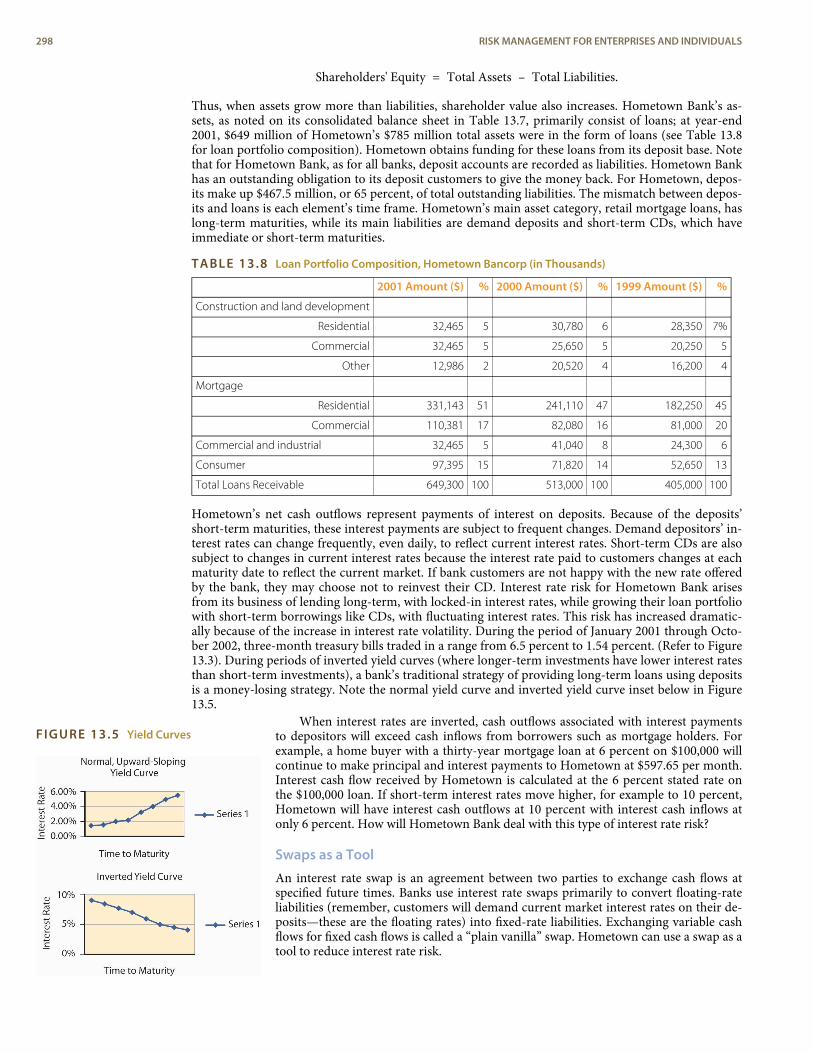
FIGURE 13.5 Yield Curves
Shareholders' Equity = Total Assets – Total Liabilities.
Thus, when assets grow more than liabilities, shareholder value also increases. Hometown Bank’s as-sets, as noted on its consolidated balance sheet in Table 13.7, primarily consist of loans; at year-end2001, $649 million of Hometown’s $785 million total assets were in the form of loans (see Table 13.8for loan portfolio composition). Hometown obtains funding for these loans from its deposit base. Notethat for Hometown Bank, as for all banks, deposit accounts are recorded as liabilities. Hometown Bankhas an outstanding obligation to its deposit customers to give the money back. For Hometown, depos-its make up $467.5 million, or 65 percent, of total outstanding liabilities. The mismatch between depos-its and loans is each element’s time frame. Hometown’s main asset category, retail mortgage loans, haslong-term maturities, while its main liabilities are demand deposits and short-term CDs, which haveimmediate or short-term maturities.
TABLE 13.8 Loan Portfolio Composition, Hometown Bancorp (in Thousands)
2001 Amount ($) % 2000 Amount ($) % 1999 Amount ($) %
Construction and land development
Residential 32,465 5 30,780 6 28,350 7%
Commercial 32,465 5 25,650 5 20,250 5
Other 12,986 2 20,520 4 16,200 4
Mortgage
Residential 331,143 51 241,110 47 182,250 45
Commercial 110,381 17 82,080 16 81,000 20
Commercial and industrial 32,465 5 41,040 8 24,300 6
Consumer 97,395 15 71,820 14 52,650 13
Total Loans Receivable 649,300 100 513,000 100 405,000 100
Hometown’s net cash outflows represent payments of interest on deposits. Because of the deposits’short-term maturities, these interest payments are subject to frequent changes. Demand depositors’ in-terest rates can change frequently, even daily, to reflect current interest rates. Short-term CDs are alsosubject to changes in current interest rates because the interest rate paid to customers changes at eachmaturity date to reflect the current market. If bank customers are not happy with the new rate offeredby the bank, they may choose not to reinvest their CD. Interest rate risk for Hometown Bank arisesfrom its business of lending long-term, with locked-in interest rates, while growing their loan portfoliowith short-term borrowings like CDs, with fluctuating interest rates. This risk has increased dramatic-ally because of the increase in interest rate volatility. During the period of January 2001 through Octo-ber 2002, three-month treasury bills traded in a range from 6.5 percent to 1.54 percent. (Refer to Figure13.3). During periods of inverted yield curves (where longer-term investments have lower interest ratesthan short-term investments), a bank’s traditional strategy of providing long-term loans using depositsis a money-losing strategy. Note the normal yield curve and inverted yield curve inset below in Figure13.5.
When interest rates are inverted, cash outflows associated with interest paymentsto depositors will exceed cash inflows from borrowers such as mortgage holders. Forexample, a home buyer with a thirty-year mortgage loan at 6 percent on $100,000 willcontinue to make principal and interest payments to Hometown at $597.65 per month.Interest cash flow received by Hometown is calculated at the 6 percent stated rate onthe $100,000 loan. If short-term interest rates move higher, for example to 10 percent,Hometown will have interest cash outflows at 10 percent with interest cash inflows atonly 6 percent. How will Hometown Bank deal with this type of interest rate risk?
Swaps as a Tool
An interest rate swap is an agreement between two parties to exchange cash flows atspecified future times. Banks use interest rate swaps primarily to convert floating-rateliabilities (remember, customers will demand current market interest rates on their de-posits—these are the floating rates) into fixed-rate liabilities. Exchanging variable cashflows for fixed cash flows is called a “plain vanilla” swap. Hometown can use a swap as atool to reduce interest rate risk.
298 RISK MANAGEMENT FOR ENTERPRISES AND INDIVIDUALS
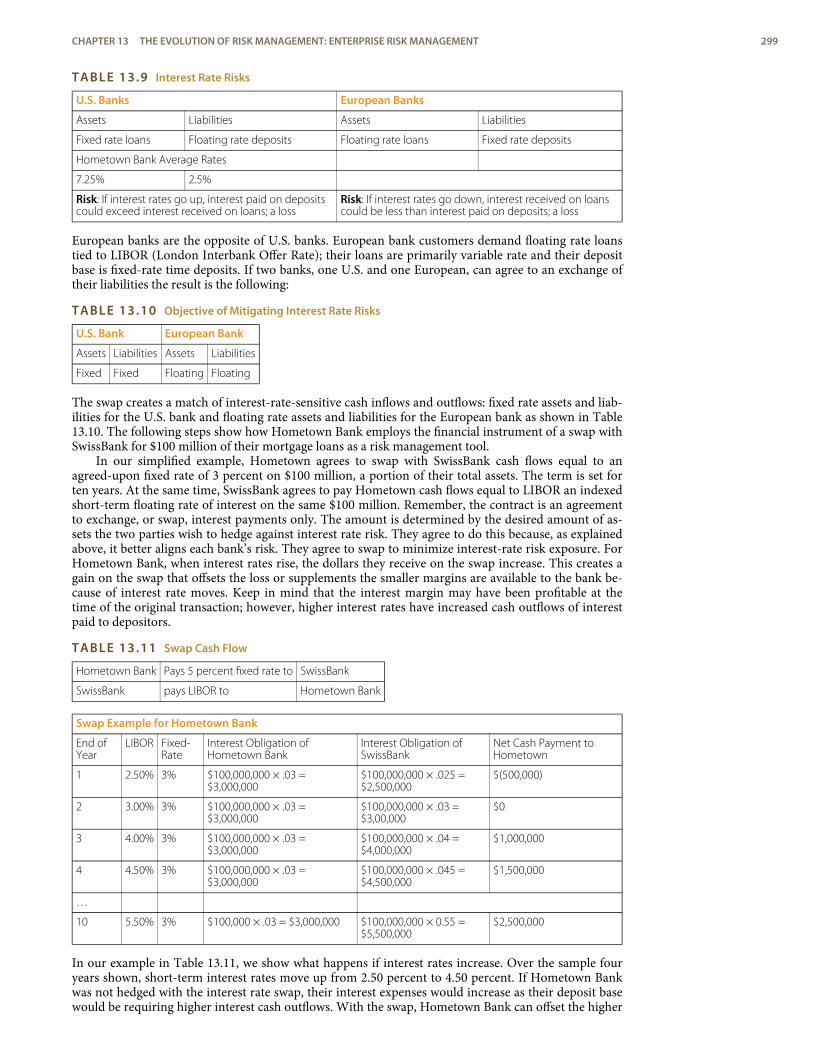
TABLE 13.9 Interest Rate Risks
U.S. Banks European Banks
Assets Liabilities Assets Liabilities
Fixed rate loans Floating rate deposits Floating rate loans Fixed rate deposits
Hometown Bank Average Rates
7.25% 2.5%
Risk: If interest rates go up, interest paid on depositscould exceed interest received on loans; a loss
Risk: If interest rates go down, interest received on loanscould be less than interest paid on deposits; a loss
European banks are the opposite of U.S. banks. European bank customers demand floating rate loanstied to LIBOR (London Interbank Offer Rate); their loans are primarily variable rate and their depositbase is fixed-rate time deposits. If two banks, one U.S. and one European, can agree to an exchange oftheir liabilities the result is the following:
TABLE 13.10 Objective of Mitigating Interest Rate Risks
U.S. Bank European Bank
Assets Liabilities Assets Liabilities
Fixed Fixed Floating Floating
The swap creates a match of interest-rate-sensitive cash inflows and outflows: fixed rate assets and liab-ilities for the U.S. bank and floating rate assets and liabilities for the European bank as shown in Table13.10. The following steps show how Hometown Bank employs the financial instrument of a swap withSwissBank for $100 million of their mortgage loans as a risk management tool.
In our simplified example, Hometown agrees to swap with SwissBank cash flows equal to anagreed-upon fixed rate of 3 percent on $100 million, a portion of their total assets. The term is set forten years. At the same time, SwissBank agrees to pay Hometown cash flows equal to LIBOR an indexedshort-term floating rate of interest on the same $100 million. Remember, the contract is an agreementto exchange, or swap, interest payments only. The amount is determined by the desired amount of as-sets the two parties wish to hedge against interest rate risk. They agree to do this because, as explainedabove, it better aligns each bank’s risk. They agree to swap to minimize interest-rate risk exposure. ForHometown Bank, when interest rates rise, the dollars they receive on the swap increase. This creates again on the swap that offsets the loss or supplements the smaller margins are available to the bank be-cause of interest rate moves. Keep in mind that the interest margin may have been profitable at thetime of the original transaction; however, higher interest rates have increased cash outflows of interestpaid to depositors.
TABLE 13.11 Swap Cash Flow
Hometown Bank Pays 5 percent fixed rate to SwissBank
SwissBank pays LIBOR to Hometown Bank
Swap Example for Hometown Bank
End ofYear
LIBOR Fixed-Rate
Interest Obligation ofHometown Bank
Interest Obligation ofSwissBank
Net Cash Payment toHometown
1 2.50% 3% $100,000,000 × .03 =$3,000,000
$100,000,000 × .025 =$2,500,000
$(500,000)
2 3.00% 3% $100,000,000 × .03 =$3,000,000
$100,000,000 × .03 =$3,00,000
$0
3 4.00% 3% $100,000,000 × .03 =$3,000,000
$100,000,000 × .04 =$4,000,000
$1,000,000
4 4.50% 3% $100,000,000 × .03 =$3,000,000
$100,000,000 × .045 =$4,500,000
$1,500,000
…
10 5.50% 3% $100,000 × .03 = $3,000,000 $100,000,000 × 0.55 =$5,500,000
$2,500,000
In our example in Table 13.11, we show what happens if interest rates increase. Over the sample fouryears shown, short-term interest rates move up from 2.50 percent to 4.50 percent. If Hometown Bankwas not hedged with the interest rate swap, their interest expenses would increase as their deposit basewould be requiring higher interest cash outflows. With the swap, Hometown Bank can offset the higher
CHAPTER 13 THE EVOLUTION OF RISK MANAGEMENT: ENTERPRISE RISK MANAGEMENT 299
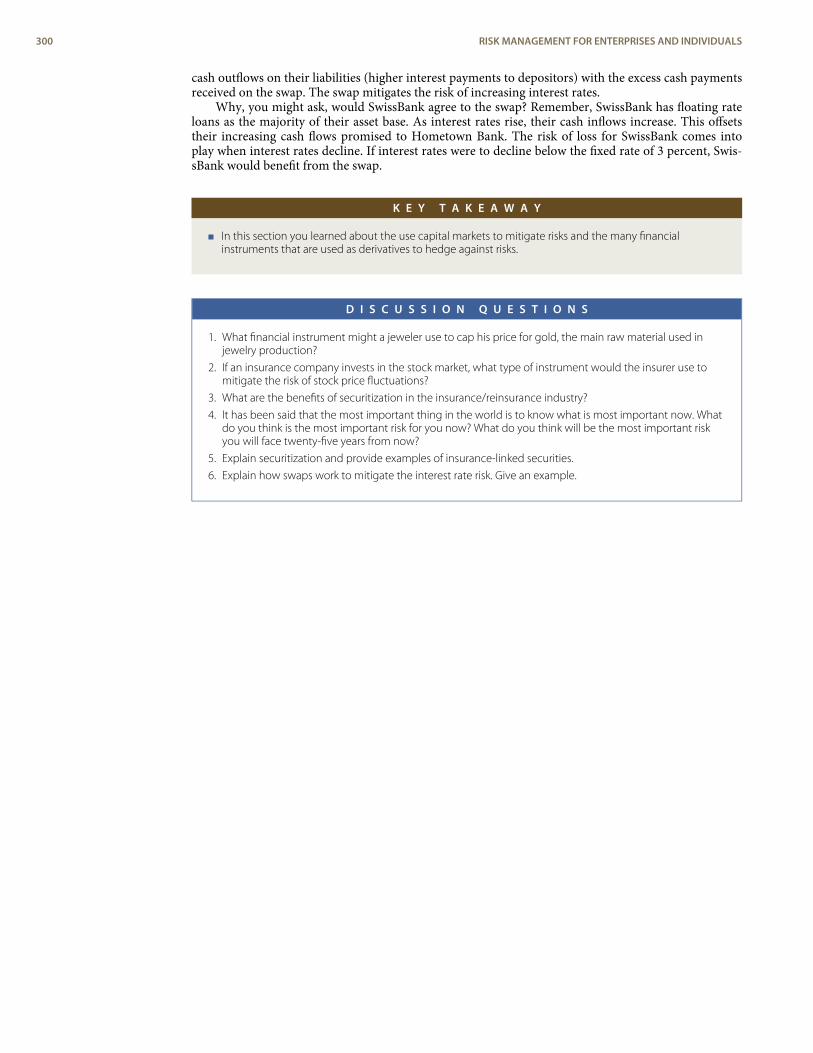
cash outflows on their liabilities (higher interest payments to depositors) with the excess cash paymentsreceived on the swap. The swap mitigates the risk of increasing interest rates.
Why, you might ask, would SwissBank agree to the swap? Remember, SwissBank has floating rateloans as the majority of their asset base. As interest rates rise, their cash inflows increase. This offsetstheir increasing cash flows promised to Hometown Bank. The risk of loss for SwissBank comes intoplay when interest rates decline. If interest rates were to decline below the fixed rate of 3 percent, Swis-sBank would benefit from the swap.
K E Y T A K E A W A Y
< In this section you learned about the use capital markets to mitigate risks and the many financialinstruments that are used as derivatives to hedge against risks.
D I S C U S S I O N Q U E S T I O N S
1. What financial instrument might a jeweler use to cap his price for gold, the main raw material used injewelry production?
2. If an insurance company invests in the stock market, what type of instrument would the insurer use tomitigate the risk of stock price fluctuations?
3. What are the benefits of securitization in the insurance/reinsurance industry?
4. It has been said that the most important thing in the world is to know what is most important now. Whatdo you think is the most important risk for you now? What do you think will be the most important riskyou will face twenty-five years from now?
5. Explain securitization and provide examples of insurance-linked securities.
6. Explain how swaps work to mitigate the interest rate risk. Give an example.
300 RISK MANAGEMENT FOR ENTERPRISES AND INDIVIDUALS
1.
2.
3.
4.
5.
6.7.
8.9.
10.
11.
12.
13.
14.
15.
16.
17.
18.
19.
20.
21.
22.
23.
24.
ENDNOTES
See explanation at http://www.Wikiperdia.org. see also “Executive Suite: Textron CEOZeroes in on Six Sigma,” USA Today, updated January 28, 2008.
Paul Ingrassia, “How Detroit Drove into a Ditch: The Financial Crisis Has Brought theU.S. Auto Industry to a Breaking Point, but the Trouble Began Long Ago,” Wall StreetJournal, October 25, 2008.
See references to Capital versus Risks studies such as Etti G. Baranoff and Thomas W.Sager, “The Impact of Mortgage-backed Securities on Capital Requirements of Life In-surers in the Financial Crisis of 2007–2008,” Geneva Papers on Risk and Insurance Issuesand Practice, The International Association for the Study of Insurance Economics1018–5895/08, http://www.palgrave-journals.com/gpp; Etti G. Baranoff, Tom W.Sager, and Savas Papadopoulos, “Capital and Risk Revisited: A Structural EquationModel Approach for Life Insurers,” Journal of Risk and Insurance, 74, no. 3 (2007):653–81; Etti G. Baranoff and Thomas W. Sager, “The Interrelationship among Organiz-ational and Distribution Forms and Capital and Asset Risk Structures in the Life Insur-ance Industry,” Journal of Risk and Insurance 70, no. 3 (2003): 375; Etti G. Baranoff andThomas W. Sager, “The Relationship between Asset Risk, Product Risk, and Capital inthe Life Insurance Industry,” Journal of Banking and Finance 26, no. 6 (2002): 1181–97.
See references to Capital versus Risks studies such as Etti G. Baranoff and Thomas W.Sager, “The Impact of Mortgage-backed Securities on Capital Requirements of Life In-surers in the Financial Crisis of 2007–2008,” Geneva Papers on Risk and Insurance Issuesand Practice, The International Association for the Study of Insurance Economics1018–5895/08, http://www.palgrave-journals.com/gpp; Etti G. Baranoff, Tom W.Sager, and Savas Papadopoulos, “Capital and Risk Revisited: A Structural EquationModel Approach for Life Insurers,” Journal of Risk and Insurance, 74, no. 3 (2007):653–81; Etti G. Baranoff and Thomas W. Sager, “The Interrelationship among Organiz-ational and Distribution Forms and Capital and Asset Risk Structures in the Life Insur-ance Industry,” Journal of Risk and Insurance 70, no. 3 (2003): 375; Etti G. Baranoff andThomas W. Sager, “The Relationship between Asset Risk, Product Risk, and Capital inthe Life Insurance Industry,” Journal of Banking and Finance 26, no. 6 (2002): 1181–97.
See environmental issues at http://environment.about.com/b/2009/01/20/obama-launches-new-white-house-web-site-environment-near-the-top-of-his-agenda.htm, http://environment.about.com/b/2009/01/12/billions-of-people-face-food-shortages-due-to-global-warming.htm, orhttp://environment.about.com/b/2009/01/20/obamas-first-100-days-an-environmental-agenda-for-obamas-first-100-days.htm.
http://en.wikipedia.org/wiki/Sustainability.
Capital budgeting is a major topic in financial management. The present value of astream of projected income is compared to the initial outlay in order to make the de-cision whether to undertake the project. We discuss Net Present Value (NPV) inChapter 3 for the decision to adopt safety belts. For more methods, the student is in-vited to examine financial management textbooks.
This example follows Doherty’s 1985 Corporate Risk Management.
This assumes an interest rate for the cash flow of 10 percent. The value of the firm isthe value of the perpetuity at 10 percent which yields a factor of ten.
This concept follows the net income (NI) approach, which was shown to have manydrawbacks relative to the Net Operating Income (NOI) approach. See the famousMiller-Modigliani theorems in the financial literature of 1950 and 1960.
This happens if the corporate cost of capital decreases to about 9 percent from 10percent.
Circuit City announced its liquidation in the middle of January 2009 after they couldnot find a buyer to salvage the company that specialized in electronics.
Insurers have a special accounting system called statutory accounting. Only insurersthat are publicly traded are required to show the market value of their assets in aseparate accounting system, called GAAP accounting (Generally Accepted Account-ing Procedures). The assets and liabilities shown in Table 13.5 are based on the stat-utory accounting and the assets are booked at book value, rather than market value,except for the stocks. The differences between the two accounting systems are bey-ond the scope of this textbook. Nevertheless, the most important differences have todo with accrued liabilities and mark-to-market values of the assets. Statutory ac-counting does not require market values of bonds.
This was reflected in the stock market with insurers such as Hartford Life, GenworthLife, and AIG life insurance, for example. This decline, without a decline in the liabilit-ies, lowered the capital amount of these insurers.
James T. Gleason, The New Management Imperative in Finance Risk (Princeton, NJ:Bloomberg Press, 2000), Chapter 3.
Michael Himick et al., Securitized Insurance Risk: Strategic Opportunities for Insurers andInvestors (Chicago: Glenlake Publishing Co., Ltd., 1998), 49–59.
David Na, “Risk Securitization 101, 2000, CAS Special Interest Seminar” (Bermuda:Deloitte & Touche), http://www.casact.org/coneduc/specsem/catastrophe/2000/handouts/na.ppt.
A word of caution: AIG and its CDS without appropriate capitalization and reserves.The rating of credit rating agencies provided the security rather than true funds.Thus, when used inappropriately, the use of such instruments can take down giantcorporations as is the case of AIG during the 2008 to 2009 crisis.
Sam Friedman, “There’s More Than One Way to Skin a Cat,” National Underwriter,Property & Casualty/Risk & Benefits, May 8, 2000.
Definition from Frank J. Fabozzi and Laurie S. Goodman, eds., Investing in Collateral-ized Debt Obligations (Wiley, 2001).
A comprehensive report by Guy Carpenter appears in “The Evolving Market for Cata-strophic Event Risk,” August 1998, http://www.guycarp.com/publications/white/evolving/evolv24.html.
Written by Denise Togger, printed with permission of the author. Denise WilliamsTogger earned her Bachelor of Science degree in economics in 1991 and her Masterof Science in finance in 2002 from Virginia Commonwealth University. In fulfilling theMS degree requirements, she completed an independent study in finance focusingon enterprise risk management tools. Text and case material presented draws fromcurriculum, research, and her eighteen years experience in the investment securitiesindustry. Most recently Denise served as a member of the risk management commit-tee of BB&T Capital Markets as senior vice president and fixed-income preferredtrader. BB&T Capital Markets is the capital markets division of BB&T Corporation, thenation’s fourteenth largest financial holding company. It was featured as part of Case4 in the original “Risk Management and Insurance” Textbook by Etti Baranoff, 2003,Wiley and Sons.
Anthony Saunders, Chapter 1 Financial Institutions Management: A Modern Perspect-ive, 3rd ed. (New York: McGraw-Hill Higher Education, 2000), ch. 1.
Sumit Paul-Choudhury, “Real Options,” Risk Management Magazine, September 2001,38.
CHAPTER 13 THE EVOLUTION OF RISK MANAGEMENT: ENTERPRISE RISK MANAGEMENT 301

302 RISK MANAGEMENT FOR ENTERPRISES AND INDIVIDUALS
C H A P T E R 1 4Risks Related to the Job:Workers’ Compensation andUnemploymentCompensationWorkers’ compensation is a state-mandated coverage that is exclusively related to the workplace. Unemployment
compensation is also a mandated program required of employers. Both are considered social insurance programs,
as is Social Security. Social Security is featured in [MISSING REF: #baranoff-ch18] as a foundation program for
employee benefits (covered in [MISSING REF: #baranoff-ch19] through [MISSING REF: #baranoff-ch22]). Social
insurance programs are required coverages as a matter of law. The programs are based only on the connection to
the labor force, not on need. Both workers’ compensation and unemployment compensation are part of the risk
management of businesses in the United States. The use of workers’ compensation as part of an integrated risk
program is featured in Case 3 of [MISSING REF: #baranoff-ch23].
Workers’ compensation was one of the coverages that helped the families who lost their breadwinners in the
attacks of September 11, 2001. New York City and the state of New York suffered their largest-ever loss of human
lives. Because most of the loss of life occurred while the employees were at work, those injured received medical
care, rehabilitation, and disability income under the New York workers’ compensation system, and families of the
deceased received survivors’ benefits. The huge payouts raised the question of what would happen to workers’
compensation rates. The National Council on Compensation Insurance (NCCI) predicted a grim outlook then, but
by 2005, conditions improved as frequency of losses declined and the industry’s reserves increased.[1] The workers’
compensation line has maintained this strong reserve position and has been helped by a continual downward
trend in loss frequency. Consequently, the industry reported a combined ratio of 93 percent in 2006 and projects a
99 percent combined ratio for 2007. This indicates positive underwriting results. However, medical claims severity
(in contrast to frequency) has continued to grow, as shown in Figure 14.1.
Workers’ compensation is considered a social insurance program. Another social insurance program is the
unemployment compensation offered in all the states. This chapter includes a brief explanation of this program as
well. To better understand how workers’ compensation and unemployment compensation work, this chapter
includes the following:
1. Links
2. Workers’ compensation laws and benefits
3. How benefits are provided
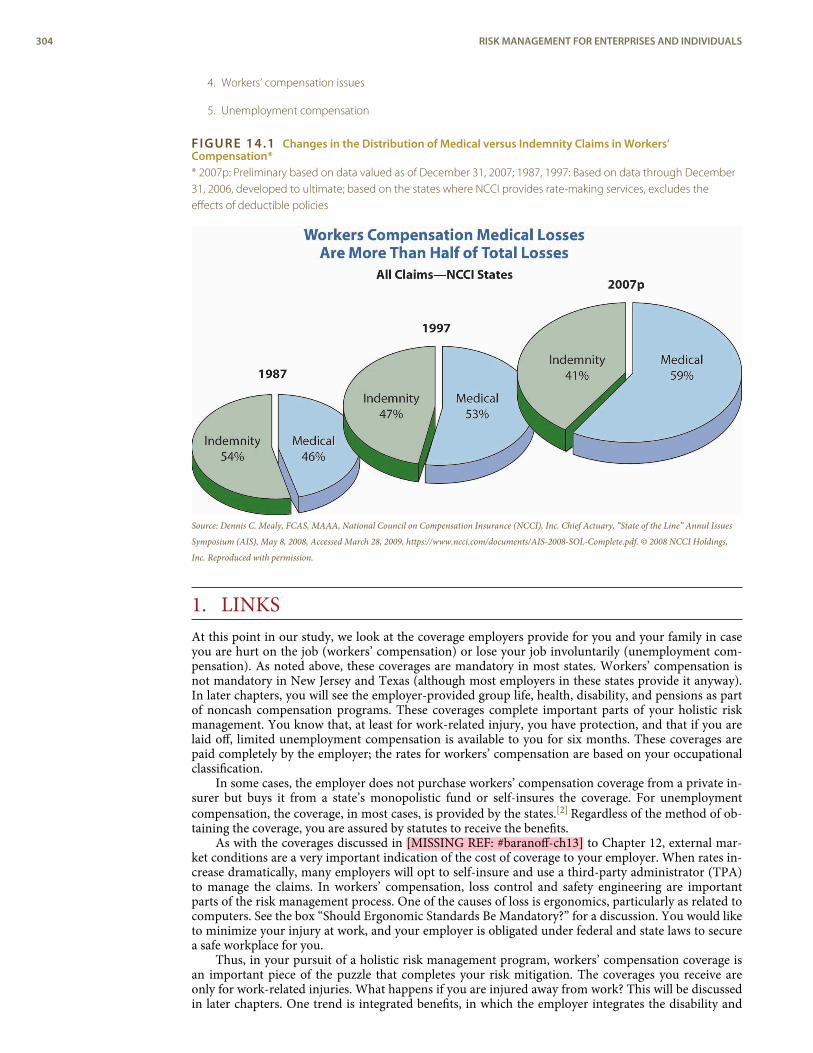
4. Workers’ compensation issues
5. Unemployment compensation
FIGURE 14.1 Changes in the Distribution of Medical versus Indemnity Claims in Workers’Compensation** 2007p: Preliminary based on data valued as of December 31, 2007; 1987, 1997: Based on data through December31, 2006, developed to ultimate; based on the states where NCCI provides rate-making services, excludes theeffects of deductible policies
Source: Dennis C. Mealy, FCAS, MAAA, National Council on Compensation Insurance (NCCI), Inc. Chief Actuary, “State of the Line” Annul Issues
Symposium (AIS), May 8, 2008, Accessed March 28, 2009, https://www.ncci.com/documents/AIS-2008-SOL-Complete.pdf. © 2008 NCCI Holdings,
Inc. Reproduced with permission.
1. LINKSAt this point in our study, we look at the coverage employers provide for you and your family in caseyou are hurt on the job (workers’ compensation) or lose your job involuntarily (unemployment com-pensation). As noted above, these coverages are mandatory in most states. Workers’ compensation isnot mandatory in New Jersey and Texas (although most employers in these states provide it anyway).In later chapters, you will see the employer-provided group life, health, disability, and pensions as partof noncash compensation programs. These coverages complete important parts of your holistic riskmanagement. You know that, at least for work-related injury, you have protection, and that if you arelaid off, limited unemployment compensation is available to you for six months. These coverages arepaid completely by the employer; the rates for workers’ compensation are based on your occupationalclassification.
In some cases, the employer does not purchase workers’ compensation coverage from a private in-surer but buys it from a state’s monopolistic fund or self-insures the coverage. For unemploymentcompensation, the coverage, in most cases, is provided by the states.[2] Regardless of the method of ob-taining the coverage, you are assured by statutes to receive the benefits.
As with the coverages discussed in [MISSING REF: #baranoff-ch13] to Chapter 12, external mar-ket conditions are a very important indication of the cost of coverage to your employer. When rates in-crease dramatically, many employers will opt to self-insure and use a third-party administrator (TPA)to manage the claims. In workers’ compensation, loss control and safety engineering are importantparts of the risk management process. One of the causes of loss is ergonomics, particularly as related tocomputers. See the box “Should Ergonomic Standards Be Mandatory?” for a discussion. You would liketo minimize your injury at work, and your employer is obligated under federal and state laws to securea safe workplace for you.
Thus, in your pursuit of a holistic risk management program, workers’ compensation coverage isan important piece of the puzzle that completes your risk mitigation. The coverages you receive areonly for work-related injuries. What happens if you are injured away from work? This will be discussedin later chapters. One trend is integrated benefits, in which the employer integrates the disability and
304 RISK MANAGEMENT FOR ENTERPRISES AND INDIVIDUALS
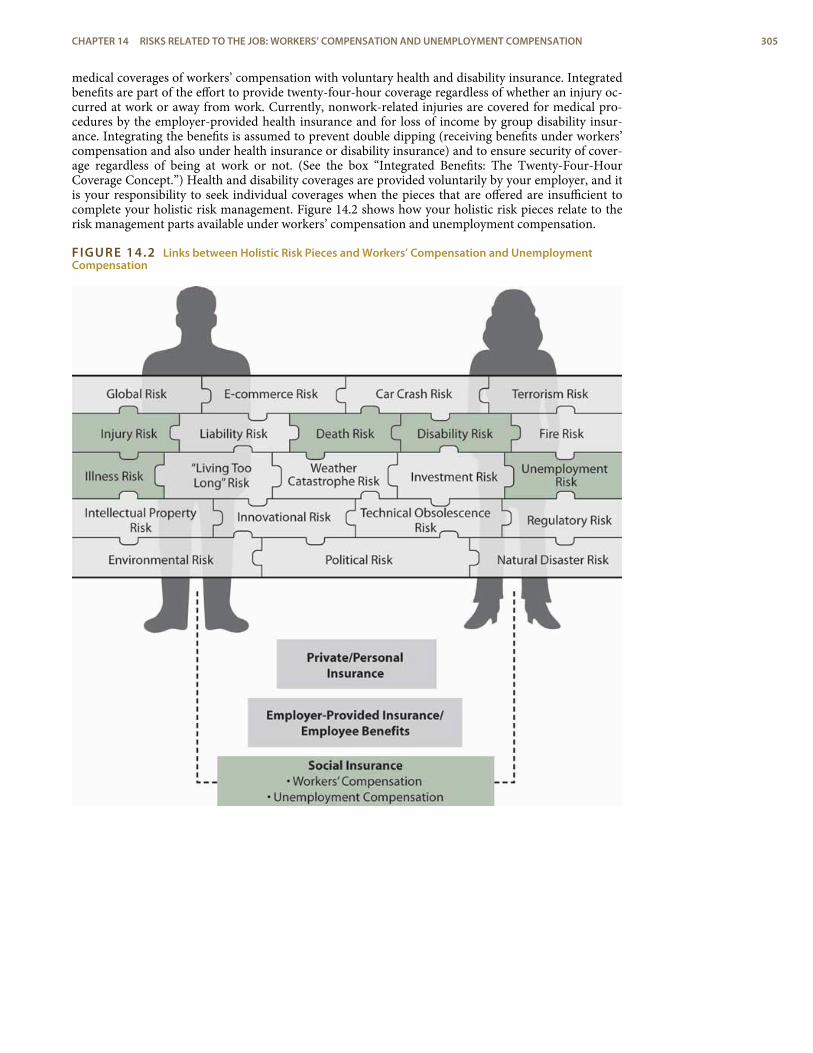
medical coverages of workers’ compensation with voluntary health and disability insurance. Integratedbenefits are part of the effort to provide twenty-four-hour coverage regardless of whether an injury oc-curred at work or away from work. Currently, nonwork-related injuries are covered for medical pro-cedures by the employer-provided health insurance and for loss of income by group disability insur-ance. Integrating the benefits is assumed to prevent double dipping (receiving benefits under workers’compensation and also under health insurance or disability insurance) and to ensure security of cover-age regardless of being at work or not. (See the box “Integrated Benefits: The Twenty-Four-HourCoverage Concept.”) Health and disability coverages are provided voluntarily by your employer, and itis your responsibility to seek individual coverages when the pieces that are offered are insufficient tocomplete your holistic risk management. Figure 14.2 shows how your holistic risk pieces relate to therisk management parts available under workers’ compensation and unemployment compensation.
FIGURE 14.2 Links between Holistic Risk Pieces and Workers’ Compensation and UnemploymentCompensation
CHAPTER 14 RISKS RELATED TO THE JOB: WORKERS’ COMPENSATION AND UNEMPLOYMENT COMPENSATION 305

1.
2.ENDNOTES
Dennis C. Mealy, FCAS, MAAA, Chief Actuary, NCCI, Inc., “State of the Line,” May 8,2008; Orlando, Florida, 2008; NCCI Holdings, Inc.
Exceptions are taxing governmental entities, such as the school districts in Texas,that may be allowed to self-insure unemployment compensation. They have a pooladministered by the Texas Association of School Boards.
306 RISK MANAGEMENT FOR ENTERPRISES AND INDIVIDUALS