Embed Size (px)
Citation preview

Journal of Computer and Education Research (ISSN:2148-2896)
April 2017 Volume 5 Issue 9
www.joucer.com http://dergipark.gov.tr/jcer
Research Article
Investigating of Preservice Science Teachers’ Self-Confidence Level
about Technological Pedagogical Content Knowledge
Yurdagül BOĞAR1
1 Middle East Technical University, Faculty of Education, Department of Mathematics and Science Education, [email protected]
Article Info Abstract
The purpose of this study is to investigate preservice science teachers’
self-confidence level about technological pedagogical content
knowledge with the Technological Pedagogical Content Knowledge
Confidence Survey. In order to determine preservice science teachers’
self-confidence of Technological Pedagogical Content Knowledge
(TPACK) both quantitative and qualitative research methods will be
used in this study. This research will be based on mixed methods
research design. MANOVA was conducted to investigate the impact of
different grade level on perceived technological pedagogical content
knowledge (TPCK) on preservice science teachers. For analysis of
qualitative data, it was conducted the content analysis as the data was
coded, themes were found, the data was organized and defined
according to the codes and themes, and interpretations were made. The
study showed that preservice science teachers have sufficient related to
the four TPACK constructs.
Received:
December 14, 2016
Accepted: March 11, 2017
Online: May 13, 2017
Keywords: Preservice Science
Teacher, Technological Pedagogical
Content Knowledge, Self-Confidence
Introduction
One of the aims of the technology education is developing a technology concept in
students’ minds. In technology education, technological knowledge should be taught with
the normative components of that knowledge, including the ethical norms, in order to make
students justice the nature of technological knowledge. To do this, students should learn
both the functioning of the technological artifacts and norms, standards, and rules of thumbs
of technological knowledge (de Vries, 2005). Moreover, technology makes students more
active and engaged in lessons and stimulates teamwork (Matray & Proulx, 1995). Becta
(2002) report the advantages of using technology in education as greater motivation,
increased self-esteem and confidence, enhanced questioning skills, promoting initiative and
independent learning, improving presentation, developing problem solving capabilities,
To cite this article:
Boğar, Y. (2017). Investigating of preservice science teachers’ self-
confidence level about technological pedagogical content knowledge.
Journal of Computer and Education Research, 5 (9), 125-140.
https://doi.org/10.18009/jcer.54602

126
promoting better information handling skills, increasing ‘time on task’, improving social and
communication skills.
Science Education and Technology
Science teachers are early-adaptors of technology with the use of hand-held graphic
calculators. They started to use technology in science lessons because it makes possible the
lab activities, which cannot be held due to lack of time or equipment (Matray & Proulx,
1995). Technology helps science teachers in terms of solving the environmental regulations,
safety and cleaning up problems. Technology also makes easier the data collection,
experimentation and communication processes with appropriate software programs that
yield immediate graphics or animations. Moreover, it can be more concentrated on process
of science rather than scientific facts with these programs (Savas & Yilmaz-Tuzun, 2012).
The study of Tala (2008) reveals the needs for unification of science and technology
education, although they are considered as separated domains traditionally. Therefore, the
author suggests a new unifying view, techno science in education to increase the coherence
of learning processes of the two elements.
Pedagogical Content Knowledge
Shulman (1986) state the importance of content knowledge of teachers. The author
demonstrated that the content knowledge is the core of the teaching. Then, again Shulman
(1986) first introduced the notion of pedagogical content knowledge (PCK). Shulman (1986)
defines the pedagogical content knowledge as knowing the reasons of difficulty or easiness
of a specific subject matter by knowing different-aged students’ cognitive levels and
backgrounds.
Grossman (1990) elaborated Shulman’s framework in four general areas which are:
(a) subject matter knowledge, (b) general pedagogical knowledge, (c) knowledge of context,
and (d) pedagogical content knowledge.
After little modifications Magnusson et al., (1999) defined the PCK for science
teaching with five components which are (a) orientation toward science teaching, (b)
knowledge of science curriculum, (c) knowledge of assessment for science, (d) knowledge of
science instructional strategies, and (e) knowledge of student science understanding.
Technological Pedagogical Content Knowledge
Mishra and Koehler (2006) recently introduced the union of three different types of
knowledge as representative of what teachers need to know, coining the combined

127
framework, “technological pedagogical content knowledge” or “TPACK” (see Figure 1);
however, other researchers have previously included and named technological knowledge as
a component of teacher knowledge (e.g., Hughes, 2005; Niess, 2005) while work prior to
Mishra and Koehler (2006) also formally introduced the concept of TPACK (e.g., Pierson,
2001). The TPACK framework strives to “capture some of the essential qualities of
knowledge required by teachers for technology integration in their teaching, while
addressing the complex, multifaceted and situated nature of teacher knowledge” (Mishra &
Koehler, 2006):
Figure 1. Technological Pedagogical Content Knowledge Framework (TPACK)
Source: Mishra & Koehler, 2006.
Technology integration is a complex and “wicked” problem (Mishra & Koehler, 2006)
that the educational technology field has long struggled to understand, define, and explain.
The TPCK framework offers us a possible solution.
Aim of the Study
The purpose of this study was to investigate pre-service science teachers’ self-
confidence level about technological pedagogical content knowledge with the Technological
Pedagogical Content Knowledge Confidence Survey (TPCKCS) translated by Timur and
Taşar (2011).
Significance of the Study
Use of technology in education has become more and more important as the time
goes on. The inclusion of technology in the learning process causes changes in the teaching

128
methods currently used in learning environments. It is also important that the teacher
candidates are dominated by these changes and that they are cultivated in this direction.
Teacher education programs should invest in their teachers by thinking long term while
preparing their graduates for their professional lives. It is an inevitable reality for today to
integrate technology with the learning process. Successful candidates who fulfill this task in
the schools they will be working with in the future are linked to the experiences they have
received in the pre-service period and their experiences of learning realistically. In the
teacher education program, technology knowledge must be acquired in the context of the
roles that teachers must assume when technology is integrated into the learning process.
Because the teachers will apply technology to make the learning process effective and
efficient.
Some studies indicated that teachers are not clear about how to use technology to
assist their teaching. Sometimes they use the Web to attract students’ attention but they do
not know how to use it to facilitate students’ development (Lee & Tsai, 2008). Teachers’ level
of TPACK is the determinant that they can successfully integrate technology into education.
Besides, their confidence on integrating technology in education (self-confidence) and their
motivation while they are teaching (outcome expectations) are critical (Niederhauser &
Perkmen, 2010).
According to Niess (2008), pre-service teachers needed to learn and develop their
TPACK and also, she called attention to methods courses in a such a way that preservice
teachers should learn how to teach TPACK ways of thinking before they are ready to teach
through methods courses since she claimed that methods courses provide practical
experiences to preservice teachers (pp. 227-228).
There is lack of research on teachers’ TPACK especially in Turkey, related to self-
confidence expectation levels in science education settings. Role of science education teacher
education programs on development of these variables are not clear, either. Therefore,
studying these technology-related perceptions of the pre-service science education teachers
can improve our understanding of the strengths and weaknesses of those programs in
preparation of future teachers who are expected to educate digital natives.
Research Questions
This study focused on the following two research questions:

129
1) What is the perceived confidence level of pre-service science teachers related to the four
Technological Pedagogical Content Knowledge (TPACK) constructs (i.e., Technological
Knowledge (TK), Technological Pedagogical Knowledge (TPK), Technological Content
Knowledge (TCK) and Technological Pedagogical Content Knowledge (TPCK))?
2) What are differences pre-service science teachers’ who they attend in different grade level,
self-confidence levels?
Method
Research Design
In order to determine pre-service science teachers' self-confidence of TPACK both
quantitative and qualitative research methods were used in this study. This research is a
multiple case study based on a mixed methods research design. The quantitative data was
collected by “TPACK in Science Survey (TPACKSS)” developed by Graham, Burgoyne,
Cantrell, Smith, Clair and Harris (2009). The survey adapted to Turkish and its Cronbach’s
alpha was calculated .95. The instrument was applied 123 pre-service science teachers by the
researcher. The quantitative data were analyzed using the Statistical Package for the Social
Sciences (SPSS). Qualitative data was collected via semi-structured interviews. These
interviews with the pre-service science teachers were recorded in audio and transcribed
verbatim. The aim of the interviews was to collect more detailed information from the
participants. According to Creswell (1998), qualitative research must show enough detail for
the reader to be able to see the case clearly in order for the researcher’s conclusion to make
sense.
Participants and Sampling Procedure
This study was conducted with preservice science teachers who are enrolled in
elementary science education departments of Education Faculties of one public university
located in Central Anatolia. The accessible population constitutes the pre-service science
teachers enrolled in this university. At her convenience the researcher was able to collect
data from one public university. A non-random purposeful sample was used to gather data
from pre-service science teachers. 123 pre-service science teachers participated in the study
on a voluntary basis. Participants’ characteristics are summarised in Table 1.
Table 1. Participants’ Characteristics
Gender N %
Female 102 82.93
Male 21 17.07

130
General characteristics of the participants were provided in Table 1. According to
Table 2.1 most of the participants were female (82.9 %). The other participants were male
(17.07 %).
Instruments
The Technological Pedagogical Content Knowledge Confidence Science (TPCKCS)
instrument which translated to Turkish by Timur and Taşar (2011) was used in this study.
The original survey instrument was created by Graham et al. (2009) and consists of 31 Likert-
type items. Respondents were asked: “How confident are you in your current ability to
complete each of the following tasks?” Responses were given in the form of 6-point Likert-
type questions: 1=not confident at all, 2=slightly confident, 3=somewhat confident, 4=fairly
confident, 5=quite confident, 6=completely confident (the scale for TCK items also had 0=I
don’t know about this kind of technology). The areas of Technological Pedagogical Content
Knowledge (TPCK), Technological Pedagogical Knowledge (TPK), Technological Content
Knowledge (TCK) and Technological Content (TK) were created by combining the domains
of content, pedagogy and technology. The original instrument contains eight items related to
TPCK, seven items related to TPK, five items related to TCK, and 11 items related to TK in
order to measure in-service science teachers’ TPCK confidence (Timur & Taşar, 2011).
After translating the instrument into Turkish, a back translation into English was
made for checking purposes. First, three native Turkish speakers made their translations
independently. Second, three back translations into English were made by three
independent Turkish individuals with PhD degrees. To determine the instruments’ validity
and reliability, a revised version of the scale was applied to 393 science and technology
teachers. Confirmatory factor analysis was conducted to ensure compliance with Turkish
culture. The instrument consisted of 31 items and four dimensions: Technological
Pedagogical Content Knowledge (TPCK), Technological Pedagogical Knowledge (TPK),
Technological Content Knowledge (TCK) and Technological Knowledge (TK). Reliability
analysis of the instrument revealed that the Cronbach-Alpha coefficient was very high (.92)
for the whole instrument. Moreover, the reliability coefficients of the four sub-dimensions
were also very high, at .89, .87, .89 and .86 respectively for the TPCK, TPK, TCK, and TK sub-
dimensions (Timur & Taşar, 2011).

131
Additionally, open-ended questions were asked by the researcher. Open-ended
questions were answered by 10 males and 10 female pre-service science teachers.
Data Collection Procedures
The survey instruments were administered to the preservice science teachers in their
classrooms. The approximate time of filling the scale was 10-15 minutes. The researcher
administered the questionnaire to the participants. Before administration, the researcher
informed the participants about how to fill the questionnaire. Moreover, the researcher
stayed in the class to answer the further questions coming from the participants. Throughout
this procedure, the researcher tried to ensure the consistency in data collection procedure.
Data Analysis Procedures
Data which were gathered from the preservice teachers were analyzed to the SPSS 18,
Statistical Package for the Social Sciences. The imported data were analyzed by using
descriptive statistics. Descriptive statistics was used to summarize, organize and simplify
data. The mean of each of the component of TPACK was able to be calculated. The standard
deviation of each of the component of TPACK was able to be calculated. The Cronbach’s
alpha of each of the component of TPACK was able to be calculated.
Multivariate Analysis of Variance (MANOVA) was conducted to investigate the
impact of different grade level on perceived technological pedagogical content knowledge
(TPCK) on preservice science teachers.
For analysis of qualitative data, it was conducted the content analysis as the data was
coded, themes were found, the data was organized and defined according to the codes and
themes, and interpretations were made.
Findings
In order to address the first research question of the perceived confidence level of
preservice science teachers related to the four TPACK constructs, preservice teachers were
asked, “How would you rate your confidence in doing the following tasks associated with
technology usage?” Thirty-one items in the areas of technological knowledge (TK),
technological pedagogical knowledge (TPK), technological content knowledge (TCK), and
technological pedagogical content knowledge (TPCK) were asked, and responses were made
on a 5-point scale reflecting the level of confidence. Mean, standard deviation and
Cronbach’s alpha were calculated for the four sub-dimensions is Table 3, while Table 3
shows the ranges of confidence levels formed.

132
Table 2. The Confidence Interval for the Likert Scale
Table 3. Summary of Descriptive Statistics for Sub-dimensions
According to Table 3, the pre-service science teachers asserted that they feel fairly
confident in technological pedagogical content knowledge (TPCKmean=3.69) technological
pedagogical knowledge (TPKmean=3.81) and technological knowledge (TKmean=3.65). Hovewer,
they feel somewhat confident in technological content knowledge (TCKmean=3.16). Reliability
analysis of the instrument revealed that the Cronbach-Alpha coefficient was very high (.93)
for the whole instrument. The reliability coefficients (α) of the four sub-dimensions were also
very high, at .82, .87, .86 and .88 respectively for the TPCK, TPK, TCK, and TK sub-
dimensions.
Standard deviation is the most common measure of statistical dispersion, measuring
how widely spread the values in a data set are. If the data points are all close to the mean,
then the standard deviation is close to zero. If many data points are far from the mean, then
the standard deviation is far from zero. If all the data values are equal, then the standard
deviation is zero. A set with a low standard deviation has most of the data points centered
around the average. A set with a high standard deviation has data points that are not so
clustered around the average. The standard deviation of the four sub-dimensions were
different from each other, at .67, .69, 1.19 and .79 respectively for the TPCK, TPK, TCK, and
TK sub-dimensions.
Interval range Confidence level
1.00-1.79 Not confident at all
1.80-2.59 Slightly confident
2.60-3.39 Somewhat confident
3.40-4.19 Fairly confident
4.20-5.00 Completely confident
Sub-dimension Number of Items M SD α
TPCK 8 3.69 .67 .82
TPK 7 3.81 .69 .87
TCK 5 3.16 1.19 .86
TK 11 3.65 .79 .88
Total .93

133
Table 4. Descriptive Statistic Results of Frequency
From this frequency Table 4, we have quickly concluded that in item 1, many of the
participants selected 50% trust. In item 2, many of the participants selected 50% trust. In item
3, many of the participants selected mostly trust. In item 4, many of the participants selected
mostly trust. In item 5, many of the participants selected 50% trust and mostly trust equally.
In item 6, many of the participants selected mostly trust. In item 7, many of the participants
selected mostly trust. In item 8, many of the participants selected 50% trust. In item 9, many
of the participants selected mostly trust.
In item 10, many of the participants selected mostly trust. In item 11, many of the
participants selected mostly trust. In item 12, many of the participants selected mostly trust.
Items None
trust
Rarely
trust
%50 trust Mostly
trust
Totally trust I do
not
know
S1 1 18 54 23 27
S2 3 13 43 35 29
S3 1 8 35 49 30
S4 2 7 29 49 36
S5 2 9 35 35 22
S6 2 11 34 51 25
S7 3 15 29 50 26
S8 1 10 46 45 21
S9 2 5 21 59 36
S10 3 12 27 47 34
S11 3 7 31 46 36
S12 2 10 30 48 33
S13 1 5 26 52 39
S14 2 8 30 54 29
S15 4 11 40 41 27
S16 3 10 34 40 22 14
S17 5 11 33 39 18 17
S18 6 21 23 41 20 12
S19 5 19 28 35 26 10
S20 4 16 30 33 29 11
S21 1 19 24 34 45
S22 1 6 24 32 60
S23 2 17 30 29 45
S24 3 10 25 36 49
S25 2 11 34 33 43
S26 7 19 36 32 29
S27 12 16 38 26 31
S28 2 11 24 38 47
S29 5 12 34 36 36
S30 26 20 28 25 24
S31 21 26 31 17 28

134
In item 13, many of the participants selected mostly trust. In item 14, many of the
participants selected mostly trust. In item 15, many of the participants selected mostly trust.
In item 16, many of the participants selected mostly trust. In item 17, many of the
participants selected mostly trust. In item 18, many of the participants selected mostly trust.
In item 19, many of the participants selected mostly trust. In item 20, many of the
participants selected mostly trust. In item 21, many of the participants selected totally trust.
In item 22, many of the participants selected totally trust.
In item 23, many of the participants selected totally trust. In item 24, many of the
participants selected totally trust. In item 25, many of the participants selected totally trust.
In item 26, many of the participants selected 50% trust. In item 27, many of the participants
selected 50% trust. In item 28, many of the participants selected totally trust. In item 29,
many of the participants selected mostly trust and totally trust equally. In item 30, many of
the participants selected 50% trust. In item 31, many of the participants selected 50% trust.
According to Table 4, many of the participants feel mostly trust in the technological
pedagogical knowledge (TPK) and the technological content knowledge (TCK) sub-
dimensions. Moreover, in the technological knowledge (TK) sub-dimension, many of the
participants feel totally trust.
In order to address the second research question, there were 4 dependent variables
(TPCK, TPK, TCK and TK) of interest and one independent variable (grade level) with;
therefore, multivariate analysis of variance (MANOVA) was conducted to investigate mean
differences among them. Preliminary assumption testing was conducted to check for
normality, linearity, univariate and multivariate outliers, homogeneity of variance-
covariance matrices, and multicollinearity.
1. Sample size. There were more cases in each cell than the number of dependent
variable. There were 4 dependent variables and the sample was 123. Therefore, this
assumption was not violated.
2. Normality. Univariate and multivariate normalities were checked. Univariate
normality was checked by examining skewness, kurtosis values and by visual examination
of histograms. The skewness and kurtosis values were in acceptable range which is between
-2 and +2 for all dependent variables. In order to check multivariate normality, Mahalanobis
distances were calculated to compare the critical value given in the Chi-square table (Pallant,
2007).

135
3. Outliers. In order to determine outliers Mahalanobis distances were examined.
Moreover, the outliers can be accepted since there was a reasonable size data file (Pallant,
2007).
4. Linearity. In order to check linearity scatterplots were generated for each
dependent variable pair. The scatterplots revealed that there was no apparent violation of
linearity assumption.
5. Multicollinearity and singularity. These assumptions were checked by calculating
the correlation coefficients between dependent variables. There was no violation of this
assumption.
6. Homogeneity of variances. In order to check this assumption, Levene’s Test of
Equality of Error Variances was checked. According to the Table 3.4, the error variance of the
dependent variable was not equal across groups for all DVs. This assumption was not
assured for TPCK (p = .803), TPK (p = .793), TCK (p = .055), and TK (p= .058).
Table 5. Levene’s Test Equality of Variances
F df1 df2 Sig.
TPCK ,331 3 119 ,803
TPK ,345 3 119 ,793
TCK 2,605 3 119 ,055
TK 2,563 3 119 ,058
After checking the assumptions of MANOVA, analysis was conducted.
Table 6. Multivariate Test Result
Effect Value F Hypothesis
df
Error df Sig. Partial Eta
Squared
Sinif Pillai's
Trace
,198 2,086 12,000 354,000 ,017 ,066
Wilks'
Lambda
,807 2,162 12,000 307,199 ,013 ,069
Hoteling’s
Trace
,233 2,226 12,000 344,000 ,010 ,072
Roy's
Largest
Root
,203 5,982b 4,000 118,000 ,000 ,169
Table 6 revealed that there was a statistically significant mean difference for grade
level on the combined dependent variables, F (4,118) = 5,982 p = .000; Roy’s Largest Root =
.203; partial eta squared = .169 indicating small effect size.
136
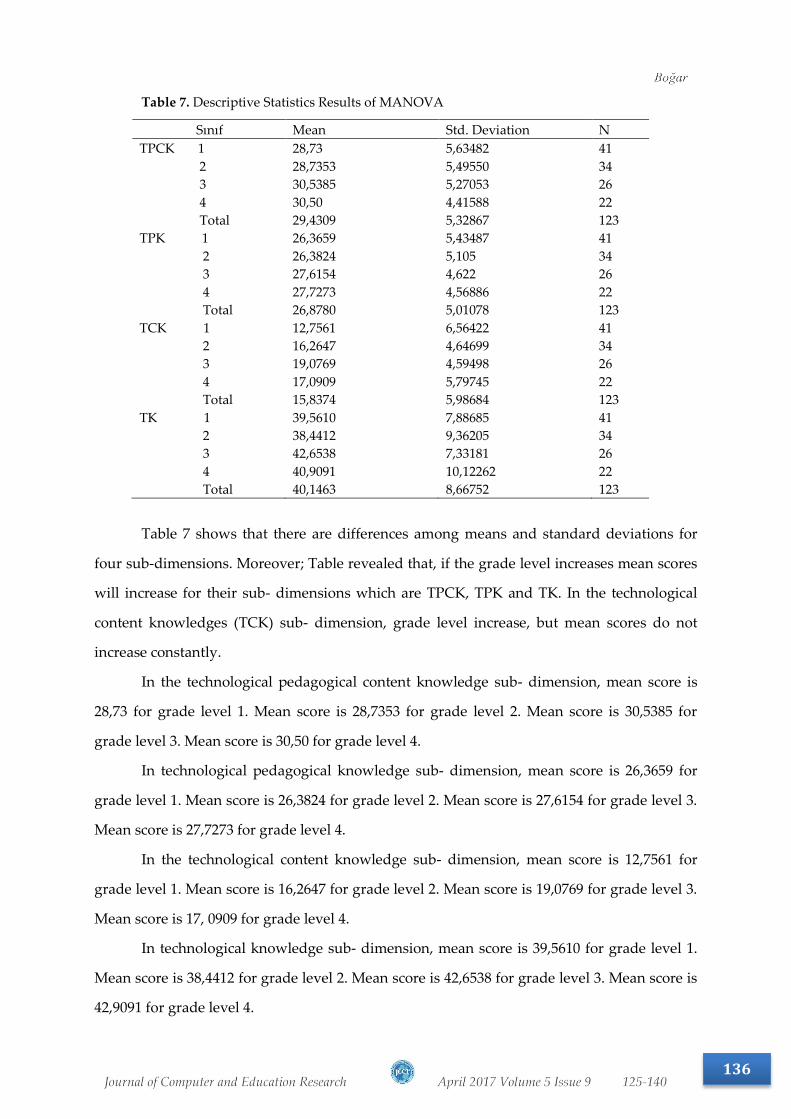
Table 7. Descriptive Statistics Results of MANOVA
Sınıf Mean Std. Deviation N
TPCK 1 28,73 5,63482 41
2 28,7353 5,49550 34
3 30,5385 5,27053 26
4 30,50 4,41588 22
Total 29,4309 5,32867 123
TPK 1 26,3659 5,43487 41
2 26,3824 5,105 34
3 27,6154 4,622 26
4 27,7273 4,56886 22
Total 26,8780 5,01078 123
TCK 1 12,7561 6,56422 41
2 16,2647 4,64699 34
3 19,0769 4,59498 26
4 17,0909 5,79745 22
Total 15,8374 5,98684 123
TK 1 39,5610 7,88685 41
2 38,4412 9,36205 34
3 42,6538 7,33181 26
4 40,9091 10,12262 22
Total 40,1463 8,66752 123
Table 7 shows that there are differences among means and standard deviations for
four sub-dimensions. Moreover; Table revealed that, if the grade level increases mean scores
will increase for their sub- dimensions which are TPCK, TPK and TK. In the technological
content knowledges (TCK) sub- dimension, grade level increase, but mean scores do not
increase constantly.
In the technological pedagogical content knowledge sub- dimension, mean score is
28,73 for grade level 1. Mean score is 28,7353 for grade level 2. Mean score is 30,5385 for
grade level 3. Mean score is 30,50 for grade level 4.
In technological pedagogical knowledge sub- dimension, mean score is 26,3659 for
grade level 1. Mean score is 26,3824 for grade level 2. Mean score is 27,6154 for grade level 3.
Mean score is 27,7273 for grade level 4.
In the technological content knowledge sub- dimension, mean score is 12,7561 for
grade level 1. Mean score is 16,2647 for grade level 2. Mean score is 19,0769 for grade level 3.
Mean score is 17, 0909 for grade level 4.
In technological knowledge sub- dimension, mean score is 39,5610 for grade level 1.
Mean score is 38,4412 for grade level 2. Mean score is 42,6538 for grade level 3. Mean score is
42,9091 for grade level 4.

137
According to Table 7, the technological knowledge (TK) sub- dimension has the
highest mean score in the total. The technological content knowledge (TCK) sub- dimension
has the lowest mean score in the total.
In order to investigate whether grade level differed in all dependent variables or not,
between- subjects’ effects were examined. Table 7 shows that between- subjects’ effects were
examined to better understand the difference in relation to each of dependent variables.
Table 8. Test of Between-Subjects Effect
Source Dependent
Variables
Type III
Sum of
Squares
Mean
Square
F Sig. Partial Eta
Squarel
Sınıf TPCK 93,535 31,178 1,101 .352 .027
TPK 49,112 16,371 ,646 .587 .016
TCK 702,905 234,302 7,598 .000 .161
TK 289,183 96,394 1,292 .280 .032
In order to identify where the significant differences lie, post-hoc analyses were
conducted for TPCK, TPK, TCK, and TK.
The Table 8 shows that, each comparison was tested with Bonferroni. The results of
the analysis revealed that there was a statistically significant difference in TCK means score
at the p <.05 level for different grade level. Although there is statistically significant
difference, the actual difference in mean scores between the groups. According to Table 8,
there are significant differences between first grade level and third grade level. These
differences are in favor of third class level. There are significant differences between first
class level and fourth class level. These differences are in favor of fourth class level. We have
concluded that if the grade level increases, self-confidence of participants will increase.
The open-ended questions show that pre-service science teachers have sufficient
TPACK confidence in science teaching, and that they know the importance of the using
technology in science teaching. Koch (2005) explains, a computer can become part of the
science learning experience if the child feels a need to use it in learning.
Pre-service science teachers asserted that they use computers for showing animations,
simulations, videos and films, and for making representations with Power- Point during
instruction. Pre-service science teachers tend to group the whole class for showing
animations, simulations and videos using a projector.

138
Qualitative analysis shows that there is a need to provide TPACK confidence to pre-
service science teachers in order to create technology-enhanced classrooms. It is important to
improve the education.
As a consequence, in qualitative analysis, this analysis indicates that it is possible to
design suitable technology rich environments to address, and develop, students
understanding of the knowledge components suggested by the TPACK framework.
Discussion and Conclusion
This study aimed to gather information about the self- confidence level of pre- service
science teacher on TPACK. The findings of both descriptive analysis and content analysis can
be used as foreknowledge in further research. These results indicate that the Technological
Pedagogical Content Knowledge Confidence Science (TPCKCS) instrument is a promising
instrument for measuring pre-service teachers’ self-confidence level of the TPACK.
Moreover, the relationships between the content knowledge and the components of
the TPACK and among the components of the TPACK were investigated to understand the
complex structure of the framework and to make clear the interdependence of the
knowledge in the framework. The study shows that pre-service science teachers have
sufficient related to the four Technological Pedagogical Content Knowledge (TPACK)
constructs.
According to Turkish Education Association (2009) report, pre-service teachers need
to have technology competences, or so-called technological pedagogical content knowledge.
They have to know how to integrate technology into their instruction and create effective
technology-rich environments. Moreover; there is a need to provide TPACK confidence to
pre-service science teachers in order to create optimally functioning technology-enhanced
classrooms. It is important to devote time and effort to PD programmes, to exploring the
cognitive, transformative and pedagogical aspects of adopting educational technology in
teaching, rather than merely presenting the hardware and software to be used (Sturdivant,
Dunham, & Jardine, 2009).
There are some recommendations for future research. First of all, this study was
limited to the pre-service science teachers. More studies can be done with in-service teacher,
mathematics teachers and technology teachers. Technological pedagogical content
knowledge, technology integration self-efficacy and instructional technology outcome
expectations of pre-service science education teachers should be examined.

139
Acknowledgements: This study was supported by Turkish Scientific and Technical Research
Council (TUBITAK)
References
Becta. (2002). Information Sheet: Parents, ICT and Education. BECTA.
Creswell. J. W. (2008). Educational research: Planning, conducting, and evaluating quantitative and
qualitative research (3rd cd.). Upper Saddle River. NJ: Merrill.
Graham, C. R., Burgoyne, N., Cantrell, P., Smith, L., Clair, L. S., & Harris, R. (2009). The
Development in TPACK Confidence of In-service Science Teachers. TechTrends, 53(5),
70-79.
Hughes, J. (2005). Technology learning principles for preservice and in-service teacher
education. Contemporary Issues in Technology and Teacher Education, 4(3), 345-362.
Grossman, P.L. (1990). The Making of a Teacher: Teacher Knowledge and Teacher Education. New
York: Teachers College Press.
Koch, J. (2005). Science Stories: Science Methods for Elementary and Middle School Teachers (3rd
Ed.). Boston: Houghton Mifflin.
Lee, M. H., & Tsai, C. C. (2008). Exploring teachers perceived self-efficacy and technological
pedagogical content knowledge with respect to educational use of the world-wide
web. Instructional Science, 38(1), 1-21.
Magnusson, S., Krajcik, J., & Borko, H. (1999). Nature, sources, and development of
pedagogical content knowledge for science teaching. In J. Gess-Newsome & N. G.
Lederman (Eds.), Examining Pedagogical Content Knowledge (pp. 95-144). Dordrecht,
The Netherlands: Kluwer Academic Publishers.
Matray P, Prolux S (1995) Integrating computer/multimedia technology in high school
biology curriculum. Am Biol Teach 57:511–520.
Mishra, P., & Koehler, M. J. (2006). Technological pedagogical content knowledge: A
framework for teacher knowledge. Teachers College Record, 108(6), 1017-1054.
Niederhauser, D. S., & Perkmen, S. (2010). Beyond self-efficacy: Measuring preservice
teachers’ instructional technology outcome expectations. Computers in Human
Behavior, 26(3), 436-442.
Niess, M.L. (2005). Preparing teachers to teach science and mathematics with technology:
Developing a technology pedagogical content knowledge. Teaching and Teacher
Education, 21, 509-523.
Niess, M. L., 2008. Handbook of Technological Pedagogical Content Knowledge (TPCK) for
Educators, Guiding Preservice Teachers in Developing TPCK, ed. AACTE
Committee on Innovation and Technology, Routledge, New York, 223-250. Pierson, M. E.
(2001). Technology integration practice as a function of pedagogical expertise. Journal
of Research on Computing Education, 33(4), 413-429.
Savas, M., &Yılmaz-Tüzün, Ö. (2012). Investigating Pre-service Science Teachers' Content
Knowledge and Perceived TPACK Regarding Genetics, National Association of Research
in Science Teaching (NARST) Indianapolis, IL, USA

140
Shulman, L.S. (1986). Those who understand: Knowledge growth in teaching. Educational
Researcher, 15(2), 4-14.
Sturdivant, R. X., Dunham, P., & Jardine, R. (2009). Preparing mathematics teachers for
technology-rich environments. Primus, 19(2), 161-173.
Tala, S. (2008). The unified view of science and technology for education: Techno science and
techno science education. Science Education, 18(3-4), 275-298.
Timur, B. & Taşar, M. F. (2011, September). The development of pre-service science teachers’
technological pedagogical content knowledge in force and motion subjects. Paper presented
at the European Conference on Educational Research (ECER), Berlin, Germany.
Türk Eğitim Derneği (Türk Education Association) (2009). Öğretmen Yeterlikleri (Teacher
Competences). Ankara: Adım Okan Matbaacılık Basım.
Vries, M.J. de (2005). The nature of technological knowledge: philosophical reflections and
educational consequences. International Journal of Technology and Design Education, 15,
149-154.