Embed Size (px)
Citation preview
8/3/2019 About Smc Test
http://slidepdf.com/reader/full/about-smc-test 1/6
ABOUT THE SMC TEST®
SUMMARY
The SMC Test® was developed to provide a range of useful comminution parameters
through highly controlled breakage of rock samples. Drill core, even quartered small
diameter core is suitable. Only relatively small quantities of sample are required and
can be re-used to conduct Bond ball work index tests.
The results from conducting the SMC Test® are used to determine the so-called drop-
weight index (DWi) which is a measure of the strength of the rock. It is directly
related to the JK rock breakage parameters A, b and ta as well as the JK crusher
model’s t10-Ecs matrix, all of which are generated as part of the standard report
output from the test. These values can then be used to simulate crushing and grindingcircuits using JKTech’s simulator – JKSimMet. Correlations also exist between the
DWi and point load index (IS50) making it valuable in Mine-to-mill studies as well.
For power-based calculations the SMC Test® also provides the comminution indices
Mia, Mih and Mic ,which are routinely reported when a test is carried out (see Table 1
below). In conjunction with the Bond ball mill work index they can be used to
accurately predict the overall specific energy requirements of circuits containing:
• AG and SAG mills.
• Ball mills
• Rod mills• Crushers
• High Pressure Grinding Rolls (HPGR)
For detailed information about how this can be done see this web site for the
document “Using the SMC Test® to Predict Comminution Circuit Performance”
which provides both equations» and worked examples.
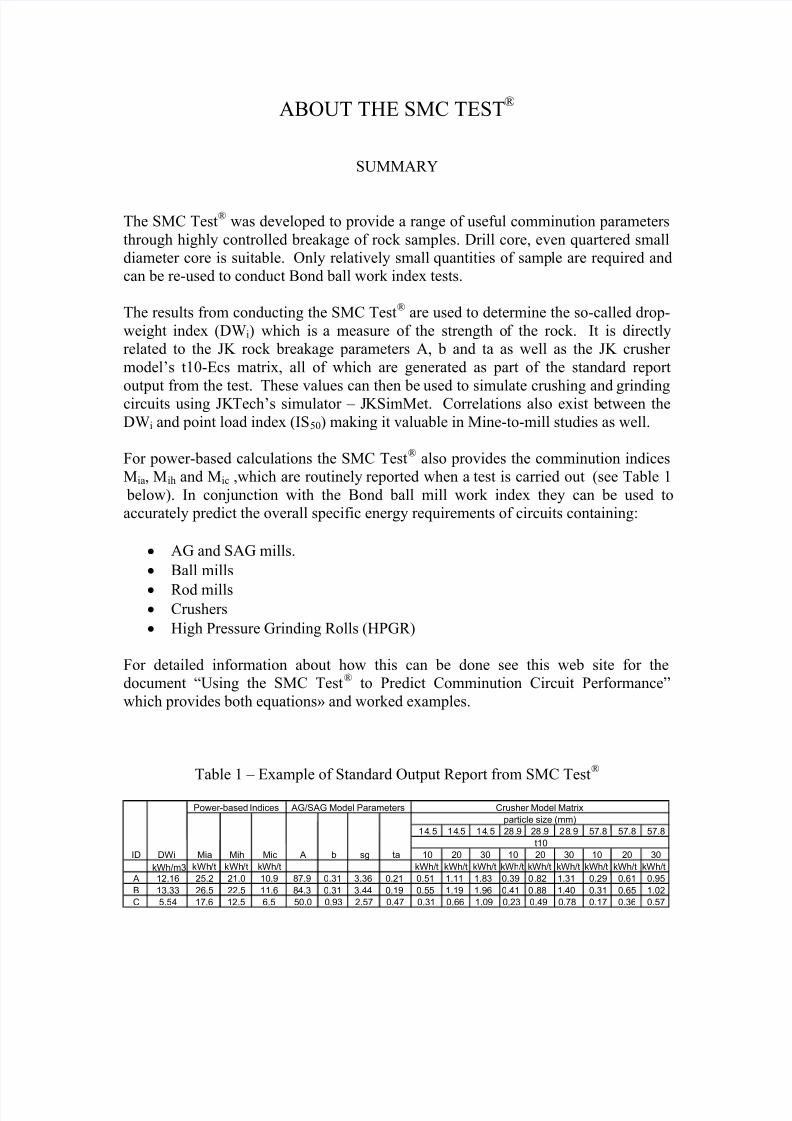
Table 1 – Example of Standard Output Report from SMC Test®
14.5 14.5 14.5 28.9 28.9 28.9 57.8 57.8 57.8
10 20 30 10 20 30 10 20 30
kWh/m3 kWh/t kWh/t kWh/t kWh/t kWh/t kWh/t kWh/t kWh/t kWh/t kWh/t kWh/t kWh/t
A 12.16 25.2 21.0 10.9 87.9 0.31 3.36 0.21 0.51 1.11 1.83 0.39 0 .82 1.31 0.29 0.61 0.95
B 13.33 26.5 22.5 11.6 84.3 0.31 3.44 0.19 0.55 1.19 1.96 0.41 0 .88 1.40 0.31 0.65 1.02
C 5.54 17.6 12.5 6.5 50.0 0.93 2.57 0.47 0.31 0.66 1.09 0.23 0.49 0.78 0.17 0.36 0.57
Crusher Model Matrix AG/SAG Model ParametersPower-based Indices
ID DWi Mia bA Mic Mih
t10
particle size (mm)
tasg
8/3/2019 About Smc Test
http://slidepdf.com/reader/full/about-smc-test 2/6
BACKGROUND
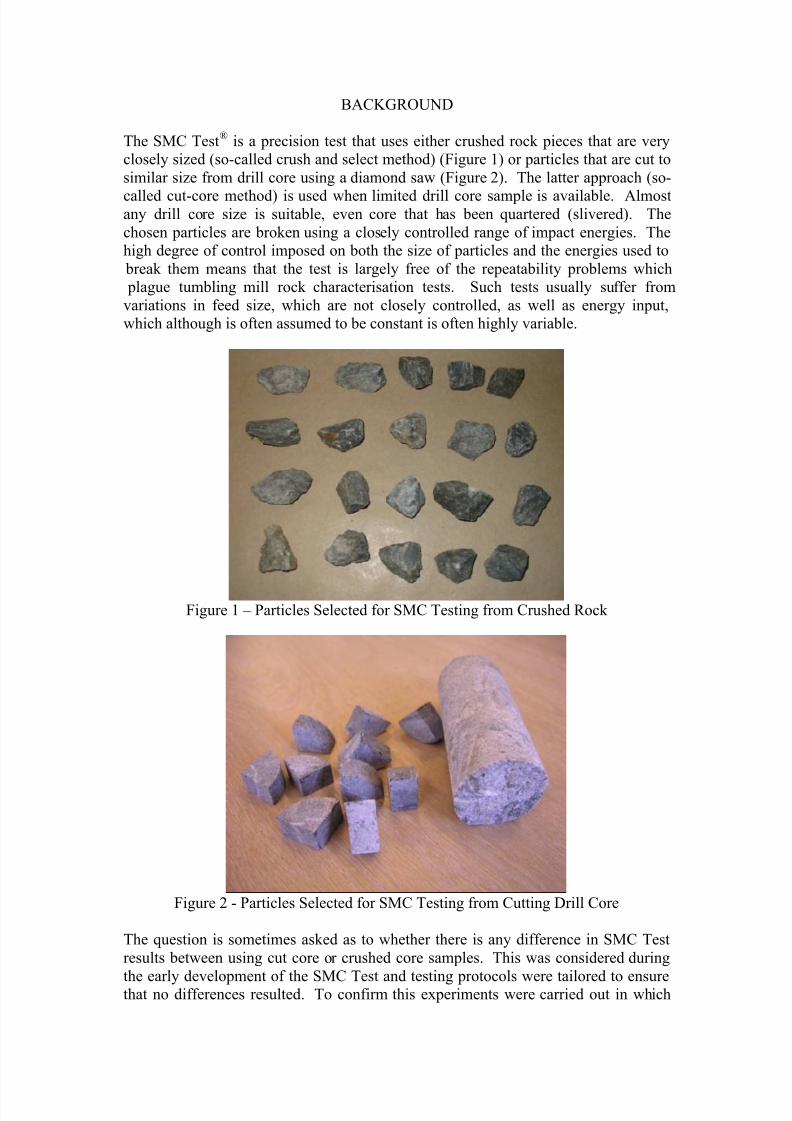
The SMC Test® is a precision test that uses either crushed rock pieces that are very
closely sized (so-called crush and select method) (Figure 1) or particles that are cut to
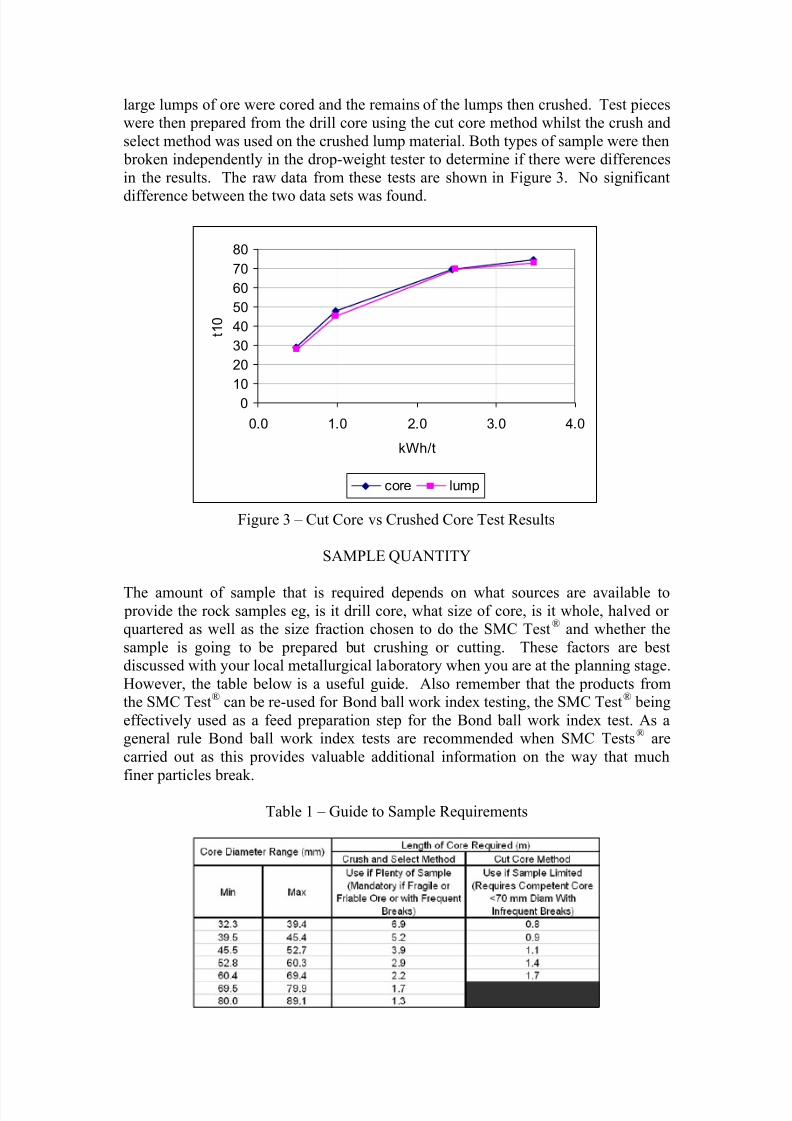
similar size from drill core using a diamond saw (Figure 2). The latter approach (so-
called cut-core method) is used when limited drill core sample is available. Almostany drill core size is suitable, even core that has been quartered (slivered). The
chosen particles are broken using a closely controlled range of impact energies. The
high degree of control imposed on both the size of particles and the energies used to
break them means that the test is largely free of the repeatability problems which
plague tumbling mill rock characterisation tests. Such tests usually suffer from
variations in feed size, which are not closely controlled, as well as energy input,
which although is often assumed to be constant is often highly variable.
Figure 1 – Particles Selected for SMC Testing from Crushed Rock
Figure 2 - Particles Selected for SMC Testing from Cutting Drill Core
The question is sometimes asked as to whether there is any difference in SMC Test
results between using cut core or crushed core samples. This was considered during
the early development of the SMC Test and testing protocols were tailored to ensurethat no differences resulted. To confirm this experiments were carried out in which
8/3/2019 About Smc Test
http://slidepdf.com/reader/full/about-smc-test 3/6
8/3/2019 About Smc Test
http://slidepdf.com/reader/full/about-smc-test 4/6
CALIBRATION for DETERMINATION of Mia, Mih and Mic PARAMETERS
No calibration is required to generate Mia, Mih and Mic parameters from a SMC Test
as they are fixed functions of the DWi, which in turn is produced as a standard output
from the SMC Test®.
CALIBRATION for DETERMINATION of A and b PARAMETERS
Where the SMC Test® is used to estimate values of A and b (used in the JK AG/SAG
mill model) a so-called “calibration” may be required. The relationship between the
DWi and the JK rock breakage parameters A and b makes use of the size-by-size
nature of rock strength that is often apparent from the results of well controlled tests
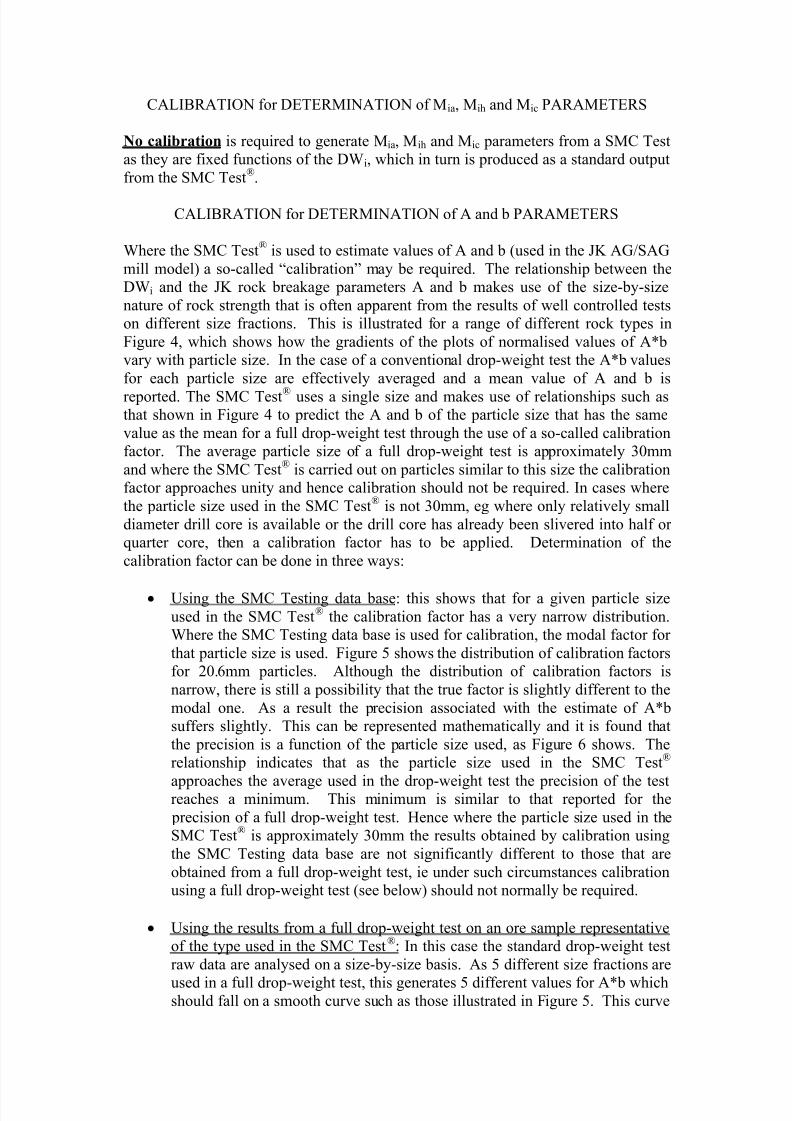
on different size fractions. This is illustrated for a range of different rock types in
Figure 4, which shows how the gradients of the plots of normalised values of A*b
vary with particle size. In the case of a conventional drop-weight test the A*b values
for each particle size are effectively averaged and a mean value of A and b is
reported. The SMC Test® uses a single size and makes use of relationships such asthat shown in Figure 4 to predict the A and b of the particle size that has the same
value as the mean for a full drop-weight test through the use of a so-called calibration
factor. The average particle size of a full drop-weight test is approximately 30mm
and where the SMC Test® is carried out on particles similar to this size the calibration
factor approaches unity and hence calibration should not be required. In cases where
the particle size used in the SMC Test® is not 30mm, eg where only relatively small
diameter drill core is available or the drill core has already been slivered into half or
quarter core, then a calibration factor has to be applied. Determination of the
calibration factor can be done in three ways:
• Using the SMC Testing data base: this shows that for a given particle size
used in the SMC Test® the calibration factor has a very narrow distribution.
Where the SMC Testing data base is used for calibration, the modal factor for
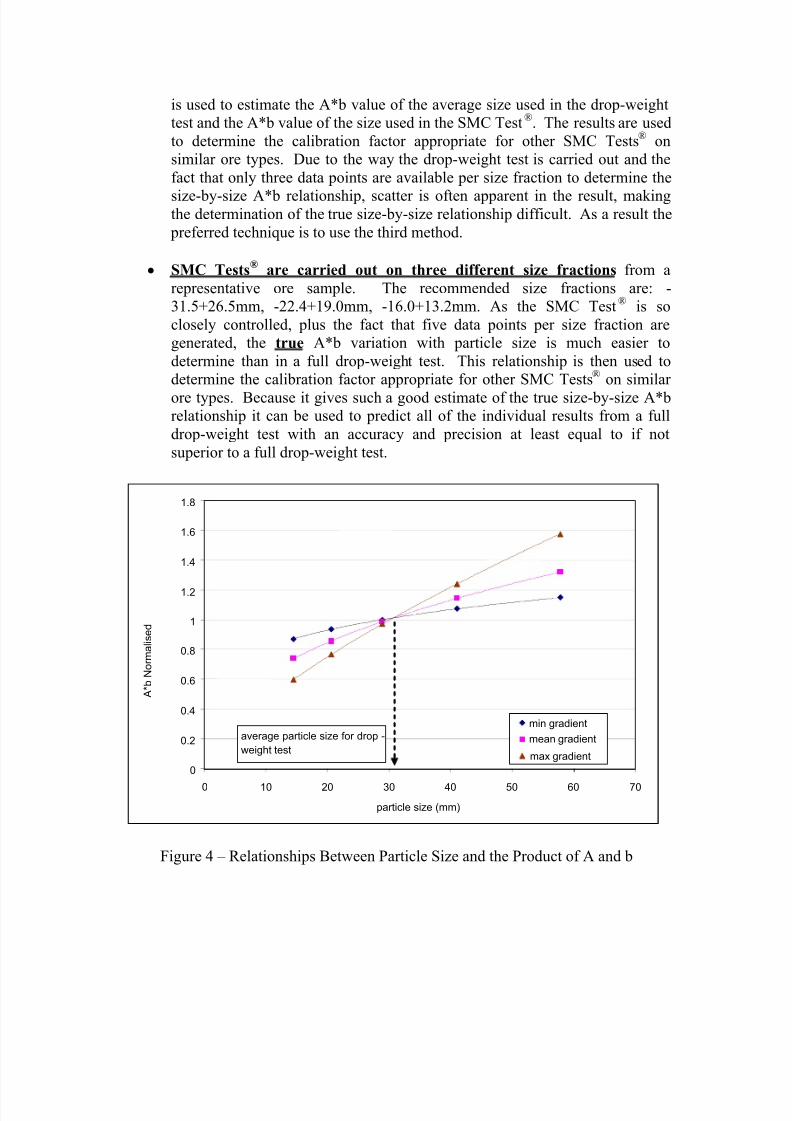
that particle size is used. Figure 5 shows the distribution of calibration factors
for 20.6mm particles. Although the distribution of calibration factors is
narrow, there is still a possibility that the true factor is slightly different to the
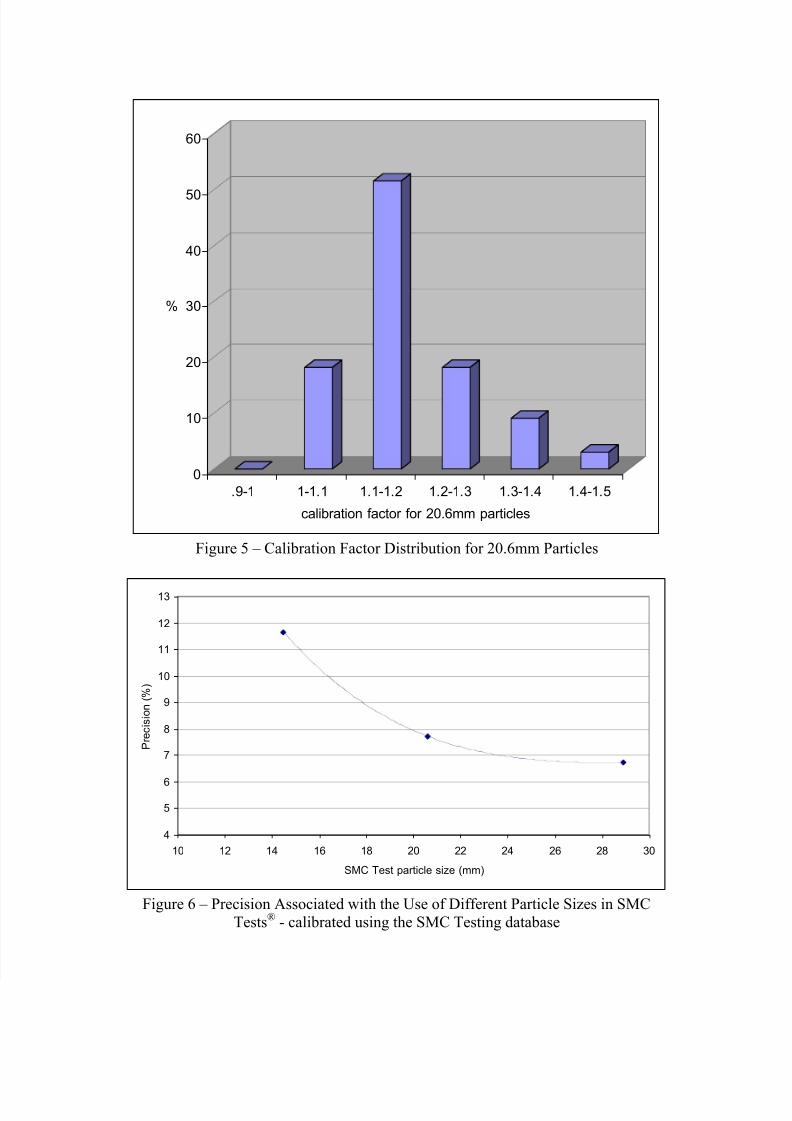
modal one. As a result the precision associated with the estimate of A*b
suffers slightly. This can be represented mathematically and it is found that
the precision is a function of the particle size used, as Figure 6 shows. The
relationship indicates that as the particle size used in the SMC Test®
approaches the average used in the drop-weight test the precision of the testreaches a minimum. This minimum is similar to that reported for the
precision of a full drop-weight test. Hence where the particle size used in the
SMC Test® is approximately 30mm the results obtained by calibration using
the SMC Testing data base are not significantly different to those that are
obtained from a full drop-weight test, ie under such circumstances calibration
using a full drop-weight test (see below) should not normally be required.
• Using the results from a full drop-weight test on an ore sample representative
of the type used in the SMC Test®: In this case the standard drop-weight test
raw data are analysed on a size-by-size basis. As 5 different size fractions are
used in a full drop-weight test, this generates 5 different values for A*b whichshould fall on a smooth curve such as those illustrated in Figure 5. This curve
8/3/2019 About Smc Test
http://slidepdf.com/reader/full/about-smc-test 5/6
is used to estimate the A*b value of the average size used in the drop-weight
test and the A*b value of the size used in the SMC Test®. The results are used
to determine the calibration factor appropriate for other SMC Tests® on
similar ore types. Due to the way the drop-weight test is carried out and the
fact that only three data points are available per size fraction to determine the
size-by-size A*b relationship, scatter is often apparent in the result, makingthe determination of the true size-by-size relationship difficult. As a result the
preferred technique is to use the third method.
• SMC Tests®
are carried out on three different size fractions from a
representative ore sample. The recommended size fractions are: -
31.5+26.5mm, -22.4+19.0mm, -16.0+13.2mm. As the SMC Test® is so
closely controlled, plus the fact that five data points per size fraction are
generated, the true A*b variation with particle size is much easier to
determine than in a full drop-weight test. This relationship is then used to
determine the calibration factor appropriate for other SMC Tests® on similar
ore types. Because it gives such a good estimate of the true size-by-size A*brelationship it can be used to predict all of the individual results from a full
drop-weight test with an accuracy and precision at least equal to if not
superior to a full drop-weight test.
Figure 4 – Relationships Between Particle Size and the Product of A and b
0 0.2
0.4
0.6
0.8
1 1.2
1.4
1.6
1.8
0 10 20 30 40 50 60 70 particle size (mm)
A * b N o r m a l i s e d
min gradient mean gradient max gradient
average particle size for drop -
weight test
8/3/2019 About Smc Test
http://slidepdf.com/reader/full/about-smc-test 6/6
0
10
20
30
40
50
60
%
.9-1 1-1.1 1.1-1.2 1.2-1.3 1.3-1.4 1.4-1.5
calibration factor for 20.6mm particles
Figure 5 – Calibration Factor Distribution for 20.6mm Particles
4
5
6
7
8
9
10
11
12
13
10 12 14 16 18 20 22 24 26 28 30
SMC Test particle size (mm)
P r e c i s i o n ( % )
Figure 6 – Precision Associated with the Use of Different Particle Sizes in SMC
Tests® - calibrated using the SMC Testing database