Embed Size (px)
Citation preview
March 31st 2017
LARGE CAP VALUE STRATEGY
P V G A S S E T
M A N A G E M E N T
L O S S AV E R S E I N V E S T I N G
W W W . P V G A S S E T M A N A G E M E N T . C O M
Content
• About PVG 3
• Philosophy & Process 6
2
• Statistics 17
• Appendix 25
PVG Asset Management LLC
About PVG
3
Overview
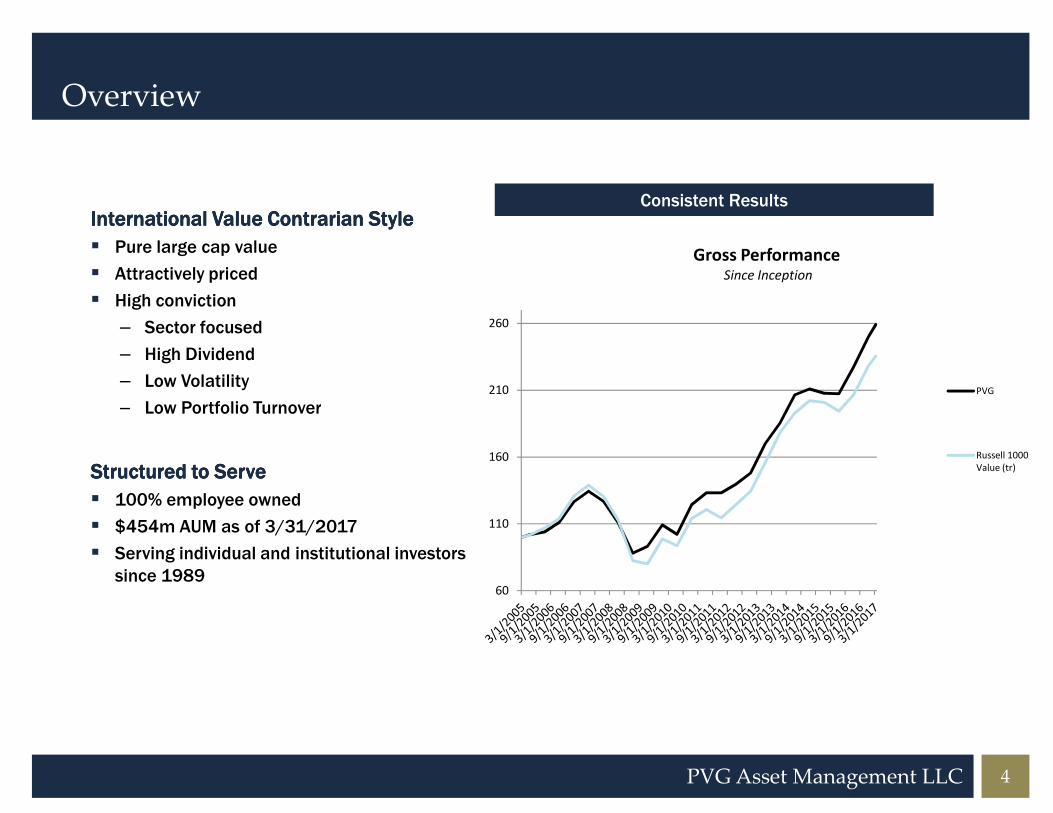
International Value Contrarian StyleInternational Value Contrarian StyleInternational Value Contrarian StyleInternational Value Contrarian Style
� Pure large cap value
� Attractively priced
� High conviction
– Sector focused
– High Dividend
– Low Volatility
– Low Portfolio Turnover
Consistent Results
210
260
Gross Performance
PVG
Since Inception
4PVG Asset Management LLC
– Low Portfolio Turnover
Structured to ServeStructured to ServeStructured to ServeStructured to Serve
� 100% employee owned
� $454m AUM as of 3/31/2017
� Serving individual and institutional investors
since 198960
110
160 Russell 1000
Value (tr)
Dedicated Resources
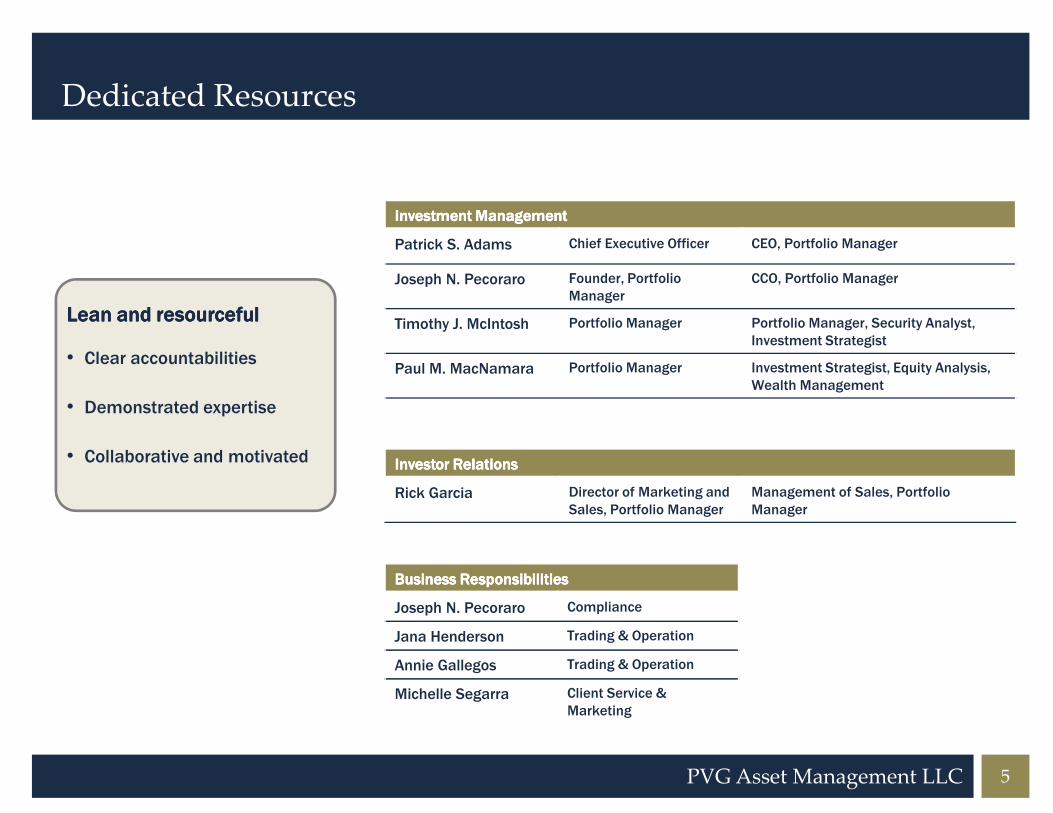
Lean and resourceful Lean and resourceful Lean and resourceful Lean and resourceful
• Clear accountabilities
• Demonstrated expertise
Investment ManagementInvestment ManagementInvestment ManagementInvestment Management
Patrick S. Adams Chief Executive Officer CEO, Portfolio Manager
Joseph N. Pecoraro Founder, Portfolio
Manager
CCO, Portfolio Manager
Timothy J. McIntosh Portfolio Manager Portfolio Manager, Security Analyst,
Investment Strategist
Paul M. MacNamara Portfolio Manager Investment Strategist, Equity Analysis,
Wealth Management
5PVG Asset Management LLC
• Demonstrated expertise
• Collaborative and motivated
Business ResponsibilitiesBusiness ResponsibilitiesBusiness ResponsibilitiesBusiness Responsibilities
Joseph N. Pecoraro Compliance
Jana Henderson Trading & Operation
Annie Gallegos Trading & Operation
Michelle Segarra Client Service &
Marketing
Investor RelationsInvestor RelationsInvestor RelationsInvestor Relations
Rick Garcia Director of Marketing and
Sales, Portfolio Manager
Management of Sales, Portfolio
Manager

Philosophy & Process
6
We Believe
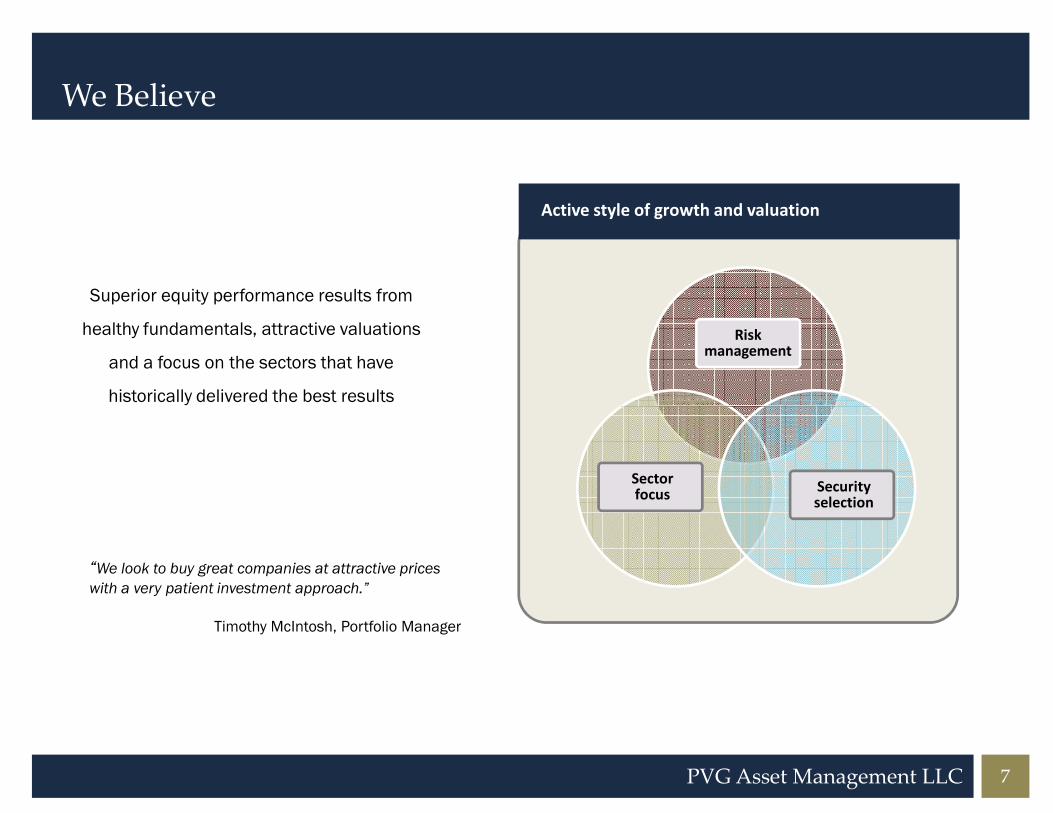
Superior equity performance results from
healthy fundamentals, attractive valuations
and a focus on the sectors that have
historically delivered the best results
Riskmanagement
Active style of growth and valuation
7PVG Asset Management LLC
historically delivered the best results
“We look to buy great companies at attractive prices with a very patient investment approach.”
Timothy McIntosh, Portfolio Manager
Sectorfocus
Securityselection
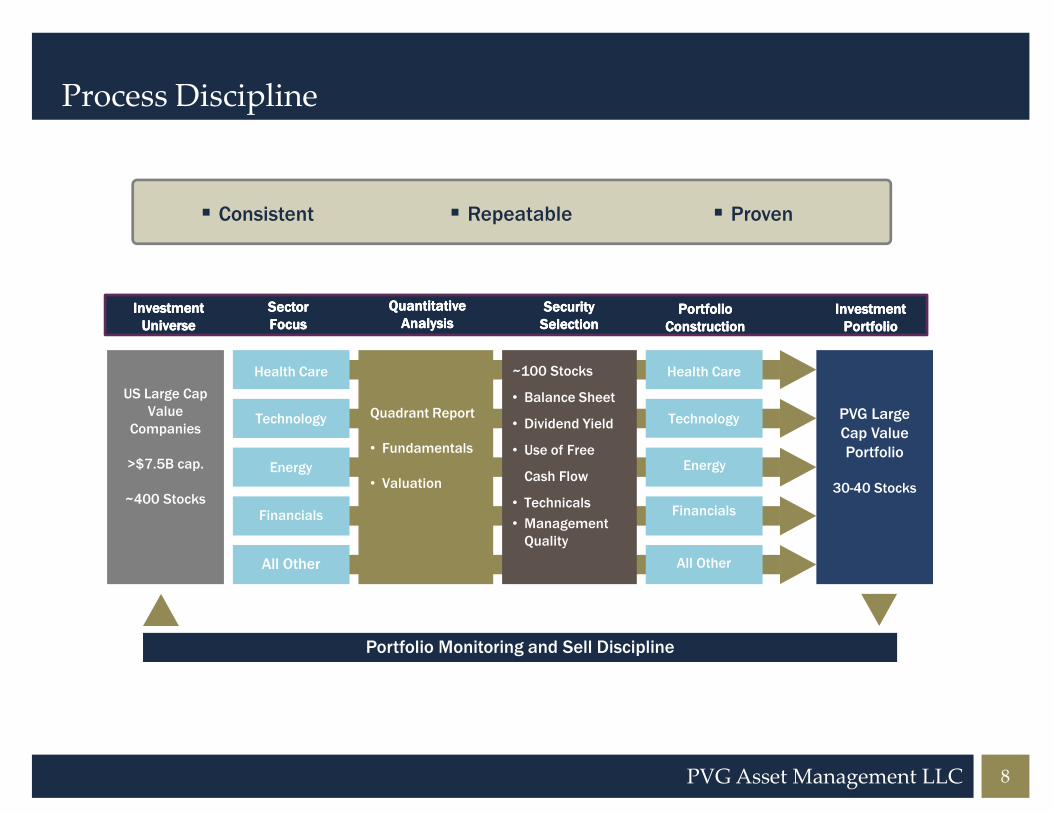
Process Discipline
� Repeatable � Proven� Consistent
US Large Cap
Value
Investment Investment Investment Investment
UniverseUniverseUniverseUniverse
Quantitative Quantitative Quantitative Quantitative
AnalysisAnalysisAnalysisAnalysis
Portfolio Portfolio Portfolio Portfolio
Construction Construction Construction Construction
Security Security Security Security
Selection Selection Selection Selection Sector Sector Sector Sector
FocusFocusFocusFocus
Health Care Health Care
Quadrant Report
~100 Stocks
• Balance SheetPVG Large
Investment Investment Investment Investment
Portfolio Portfolio Portfolio Portfolio Investment Investment Investment Investment
UniverseUniverseUniverseUniverse
Sector Sector Sector Sector
FocusFocusFocusFocus
Quantitative Quantitative Quantitative Quantitative
AnalysisAnalysisAnalysisAnalysisSecurity Security Security Security
Selection Selection Selection Selection Portfolio Portfolio Portfolio Portfolio
Construction Construction Construction Construction
Investment Investment Investment Investment
Portfolio Portfolio Portfolio Portfolio
8PVG Asset Management LLC
Value
Companies
>$7.5B cap.
~400 Stocks
Technology
Energy
Financials
All Other
Portfolio Monitoring and Sell Discipline
Technology
Energy
Financials
All Other
Quadrant Report
• Fundamentals
• Valuation
• Dividend Yield
• Use of Free
Cash Flow
• Technicals
• Management
Quality
PVG Large
Cap Value
Portfolio
30-40 Stocks
Sector Focus
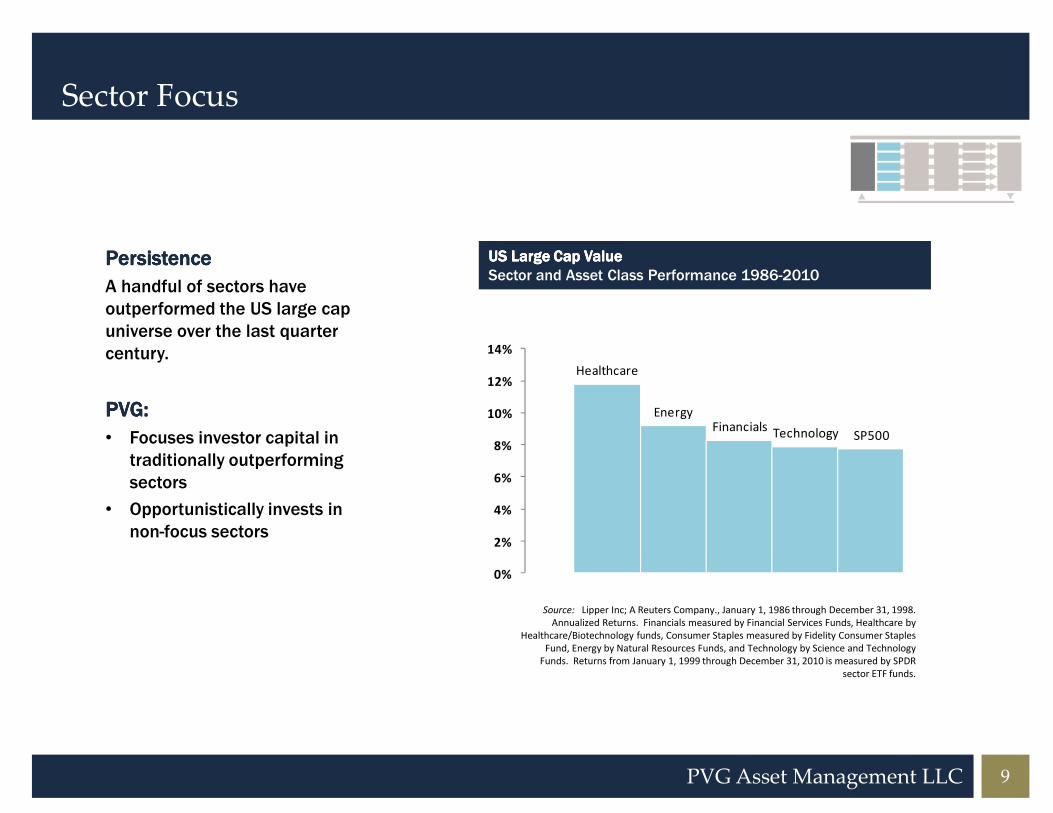
PersistencePersistencePersistencePersistence
A handful of sectors have
outperformed the US large cap
universe over the last quarter
century.
PVG:PVG:PVG:PVG:
US Large Cap ValueUS Large Cap ValueUS Large Cap ValueUS Large Cap Value
Sector and Asset Class Performance 1986-2010
Healthcare
Energy10%
12%
14%
9PVG Asset Management LLC
PVG:PVG:PVG:PVG:
• Focuses investor capital in
traditionally outperforming
sectors
• Opportunistically invests in
non-focus sectors
EnergyFinancials
Technology SP500
0%
2%
4%
6%
8%
10%
Source: Lipper Inc; A Reuters Company., January 1, 1986 through December 31, 1998.
Annualized Returns. Financials measured by Financial Services Funds, Healthcare by
Healthcare/Biotechnology funds, Consumer Staples measured by Fidelity Consumer Staples
Fund, Energy by Natural Resources Funds, and Technology by Science and Technology
Funds. Returns from January 1, 1999 through December 31, 2010 is measured by SPDR
sector ETF funds.
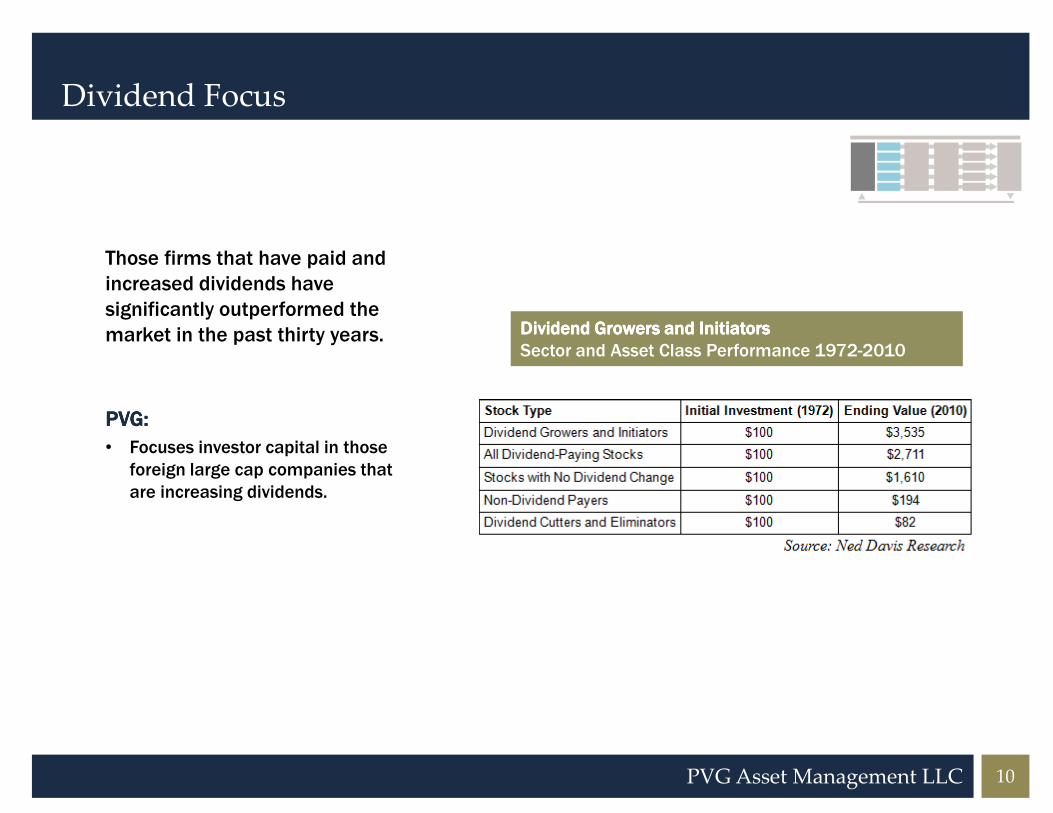
Dividend Focus
Those firms that have paid and
increased dividends have
significantly outperformed the
market in the past thirty years.
PVG:PVG:PVG:PVG:
Dividend Growers and InitiatorsDividend Growers and InitiatorsDividend Growers and InitiatorsDividend Growers and Initiators
Sector and Asset Class Performance 1972-2010
10PVG Asset Management LLC
PVG:PVG:PVG:PVG:
• Focuses investor capital in those
foreign large cap companies that
are increasing dividends.
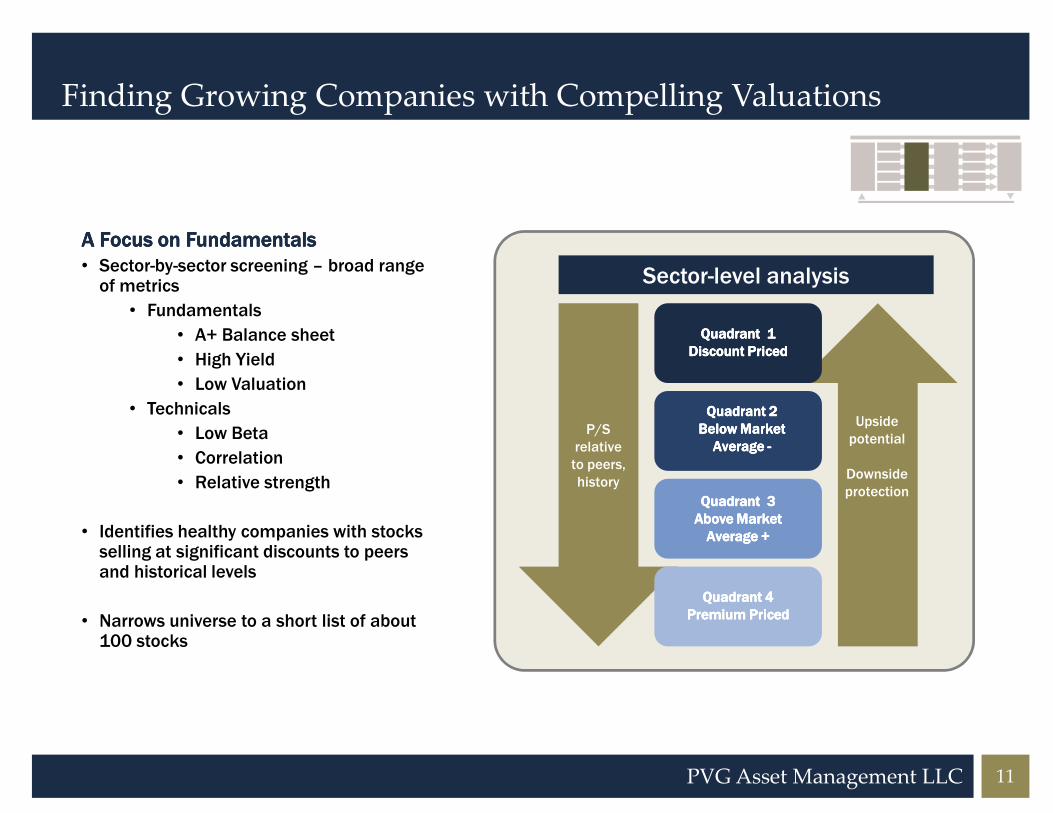
Finding Growing Companies with Compelling Valuations
A Focus on Fundamentals A Focus on Fundamentals A Focus on Fundamentals A Focus on Fundamentals
• Sector-by-sector screening – broad range of metrics
• Fundamentals
• A+ Balance sheet
• High Yield
• Low Valuation
• Technicals
Sector-level analysis
Quadrant 1Quadrant 1Quadrant 1Quadrant 1
Discount PricedDiscount PricedDiscount PricedDiscount Priced
Quadrant 2Quadrant 2Quadrant 2Quadrant 2
11PVG Asset Management LLC
• Technicals
• Low Beta
• Correlation
• Relative strength
• Identifies healthy companies with stocks selling at significant discounts to peers and historical levels
• Narrows universe to a short list of about 100 stocks
P/S
relative
to peers,
history
Quadrant 2Quadrant 2Quadrant 2Quadrant 2
Below Market Below Market Below Market Below Market
Average Average Average Average ----
Quadrant 3Quadrant 3Quadrant 3Quadrant 3
Above Market Above Market Above Market Above Market
Average +Average +Average +Average +
Quadrant 4 Quadrant 4 Quadrant 4 Quadrant 4
Premium PricedPremium PricedPremium PricedPremium Priced
Upside
potential
Downside
protection
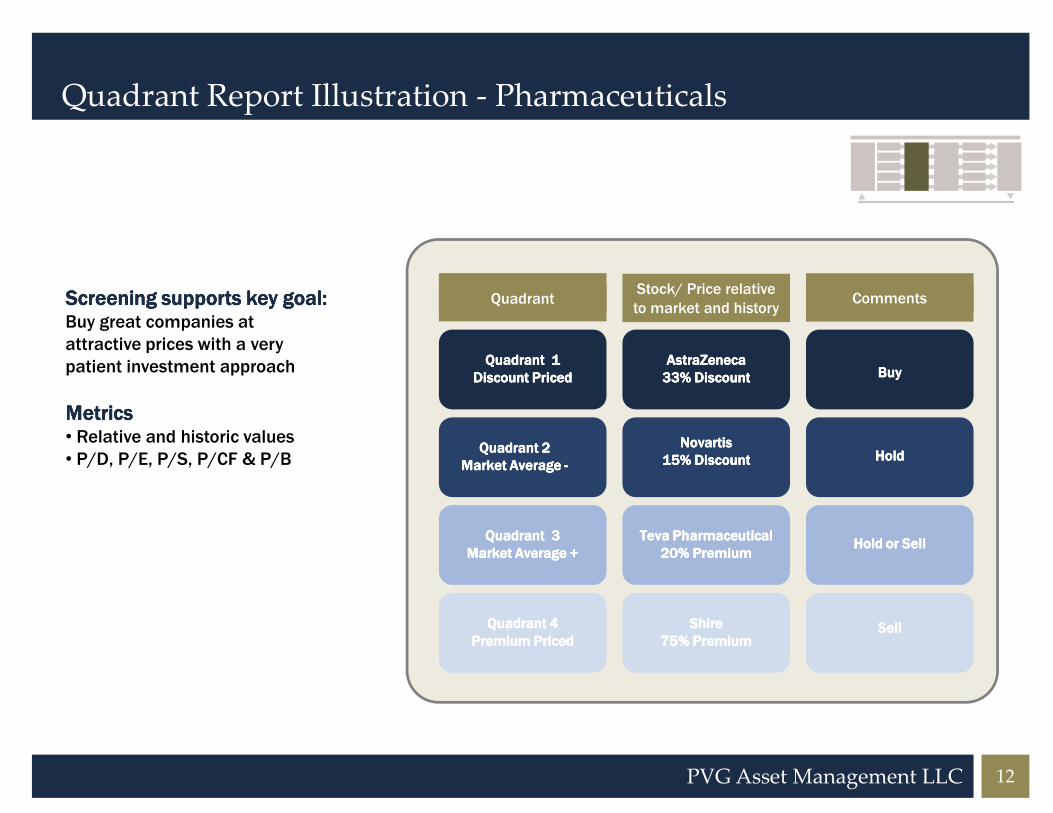
Quadrant Report Illustration - Pharmaceuticals
Screening supports key goal:Screening supports key goal:Screening supports key goal:Screening supports key goal:Buy great companies at
attractive prices with a very
patient investment approach
MetricsMetricsMetricsMetrics
Stock/ Price relative
to market and history
AstraZenecaAstraZenecaAstraZenecaAstraZeneca
33% Discount33% Discount33% Discount33% Discount
Stock/ Price relative
to ma
BuyBuyBuyBuyQuadrant 1Quadrant 1Quadrant 1Quadrant 1
Discount PricedDiscount PricedDiscount PricedDiscount Priced
CommentsStock/ Price relative
to maQuadrant
12PVG Asset Management LLC
MetricsMetricsMetricsMetrics• Relative and historic values
• P/D, P/E, P/S, P/CF & P/BNovartisNovartisNovartisNovartis
15% Discount15% Discount15% Discount15% Discount
Teva PharmaceuticalTeva PharmaceuticalTeva PharmaceuticalTeva Pharmaceutical
20% Premium20% Premium20% Premium20% Premium
ShireShireShireShire
75% Premium75% Premium75% Premium75% Premium
HoldHoldHoldHold
Hold or SellHold or SellHold or SellHold or Sell
SellSellSellSell
Quadrant 2Quadrant 2Quadrant 2Quadrant 2
Market Average Market Average Market Average Market Average ----
Quadrant 3Quadrant 3Quadrant 3Quadrant 3
Market Average +Market Average +Market Average +Market Average +
Quadrant 4 Quadrant 4 Quadrant 4 Quadrant 4
Premium PricedPremium PricedPremium PricedPremium Priced

Security-level Analysis
In selecting stocks for inclusion in the portfolio, PVG analysts seek:
Fundamental strengths Fundamental strengths Fundamental strengths Fundamental strengths
• Low PEG ratio
+
Technical strengths Technical strengths Technical strengths Technical strengths
• Stock price support
13PVG Asset Management LLC
• High relative dividend
• Balance sheet strength
• Earnings consistency
• Culture of stability and achievement
• Quality management
• Focus on creating shareholder value
+• Relative strength to peers
• Relative strength to moving averages
• Stochastic indicators of oversold
conditions
Fundamental Analysis Illustration
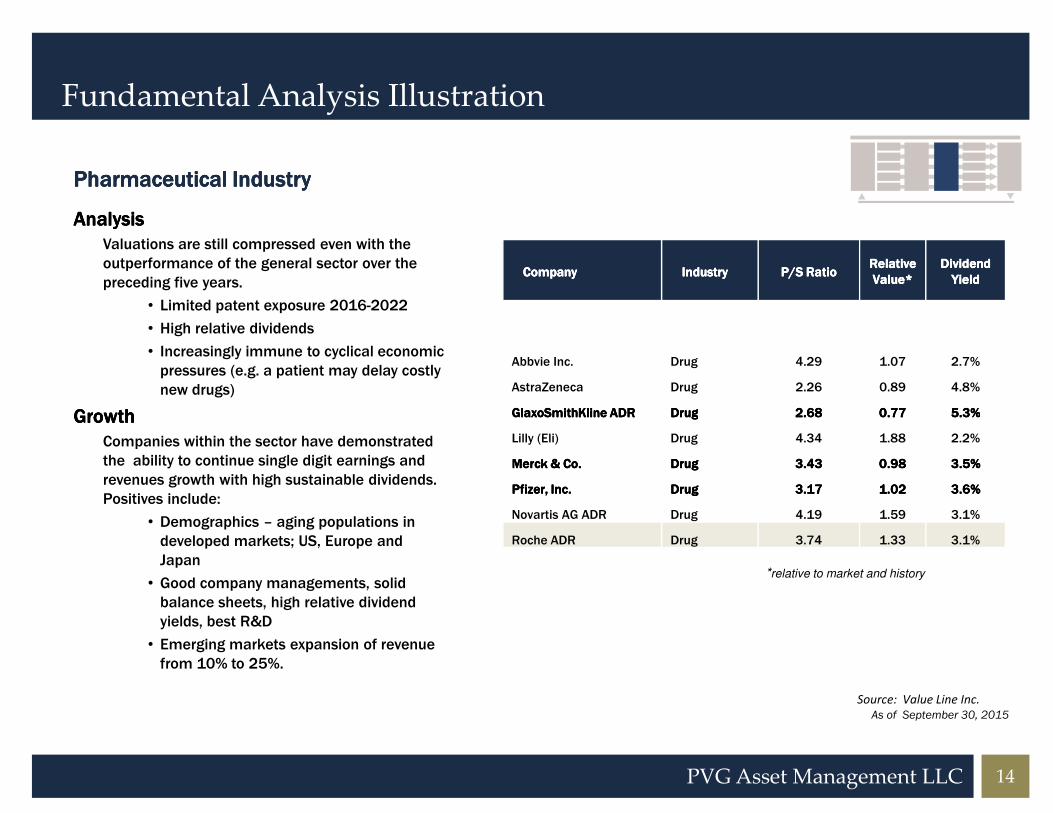
Pharmaceutical IndustryPharmaceutical IndustryPharmaceutical IndustryPharmaceutical Industry
AnalysisAnalysisAnalysisAnalysis
Valuations are still compressed even with the
outperformance of the general sector over the
preceding five years.
• Limited patent exposure 2016-2022
• High relative dividends
• Increasingly immune to cyclical economic
pressures (e.g. a patient may delay costly
new drugs)
GrowthGrowthGrowthGrowth
CompanyCompanyCompanyCompany Industry Industry Industry Industry P/S RatioP/S RatioP/S RatioP/S RatioRelative Relative Relative Relative
Value*Value*Value*Value*
Dividend Dividend Dividend Dividend
YieldYieldYieldYield
CompanyCompanyCompanyCompany Industry Industry Industry Industry P/S RatioP/S RatioP/S RatioP/S RatioRelative Relative Relative Relative
Value*Value*Value*Value*
Dividend Dividend Dividend Dividend
YieldYieldYieldYield
Abbvie Inc. Drug 4.29 1.07 2.7%
AstraZeneca Drug 2.26 0.89 4.8%
GlaxoSmithKline ADRGlaxoSmithKline ADRGlaxoSmithKline ADRGlaxoSmithKline ADR DrugDrugDrugDrug 2.682.682.682.68 0.770.770.770.77 5.3%5.3%5.3%5.3%
14PVG Asset Management LLC
GrowthGrowthGrowthGrowth
Companies within the sector have demonstrated
the ability to continue single digit earnings and
revenues growth with high sustainable dividends.
Positives include:
• Demographics – aging populations in
developed markets; US, Europe and
Japan
• Good company managements, solid
balance sheets, high relative dividend
yields, best R&D
• Emerging markets expansion of revenue
from 10% to 25%.
GlaxoSmithKline ADRGlaxoSmithKline ADRGlaxoSmithKline ADRGlaxoSmithKline ADR DrugDrugDrugDrug 2.682.682.682.68 0.770.770.770.77 5.3%5.3%5.3%5.3%
Lilly (Eli) Drug 4.34 1.88 2.2%
Merck & Co.Merck & Co.Merck & Co.Merck & Co. DrugDrugDrugDrug 3.433.433.433.43 0.980.980.980.98 3.5%3.5%3.5%3.5%
Pfizer, Inc.Pfizer, Inc.Pfizer, Inc.Pfizer, Inc. DrugDrugDrugDrug 3.173.173.173.17 1.021.021.021.02 3.6%3.6%3.6%3.6%
Novartis AG ADR Drug 4.19 1.59 3.1%
Roche ADR Drug 3.74 1.33 3.1%
*relative to market and history
Source: Value Line Inc.
As of September 30, 2015
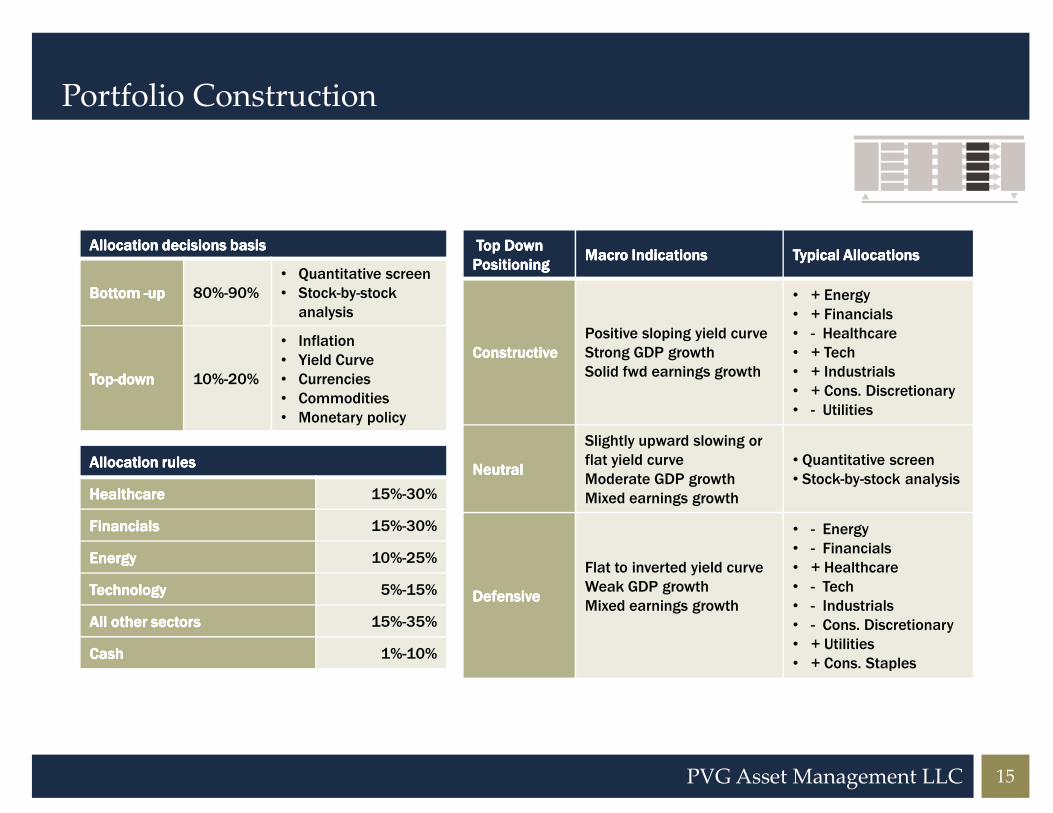
Portfolio Construction
AllocationAllocationAllocationAllocation decisions basis decisions basis decisions basis decisions basis
Bottom Bottom Bottom Bottom ----upupupup 80%-90%
• Quantitative screen
• Stock-by-stock
analysis
TopTopTopTop----downdowndowndown 10%-20%
• Inflation
• Yield Curve
• Currencies
• Commodities
Top DownTop DownTop DownTop Down
PositioningPositioningPositioningPositioningMacro IndicationsMacro IndicationsMacro IndicationsMacro Indications Typical AllocationsTypical AllocationsTypical AllocationsTypical Allocations
ConstructiveConstructiveConstructiveConstructive
Positive sloping yield curve
Strong GDP growth
Solid fwd earnings growth
• + Energy
• + Financials
• - Healthcare
• + Tech
• + Industrials
• + Cons. Discretionary
• - Utilities
15PVG Asset Management LLC
Commodities
• Monetary policy
Allocation rules Allocation rules Allocation rules Allocation rules
HealthcareHealthcareHealthcareHealthcare 15%-30%
FinancialsFinancialsFinancialsFinancials 15%-30%
EnergyEnergyEnergyEnergy 10%-25%
Technology Technology Technology Technology 5%-15%
All other sectorsAll other sectorsAll other sectorsAll other sectors 15%-35%
CashCashCashCash 1%-10%
• - Utilities
NeutralNeutralNeutralNeutral
Slightly upward slowing or
flat yield curve
Moderate GDP growth
Mixed earnings growth
• Quantitative screen
• Stock-by-stock analysis
DefensiveDefensiveDefensiveDefensive
Flat to inverted yield curve
Weak GDP growth
Mixed earnings growth
• - Energy
• - Financials
• + Healthcare
• - Tech
• - Industrials
• - Cons. Discretionary
• + Utilities
• + Cons. Staples
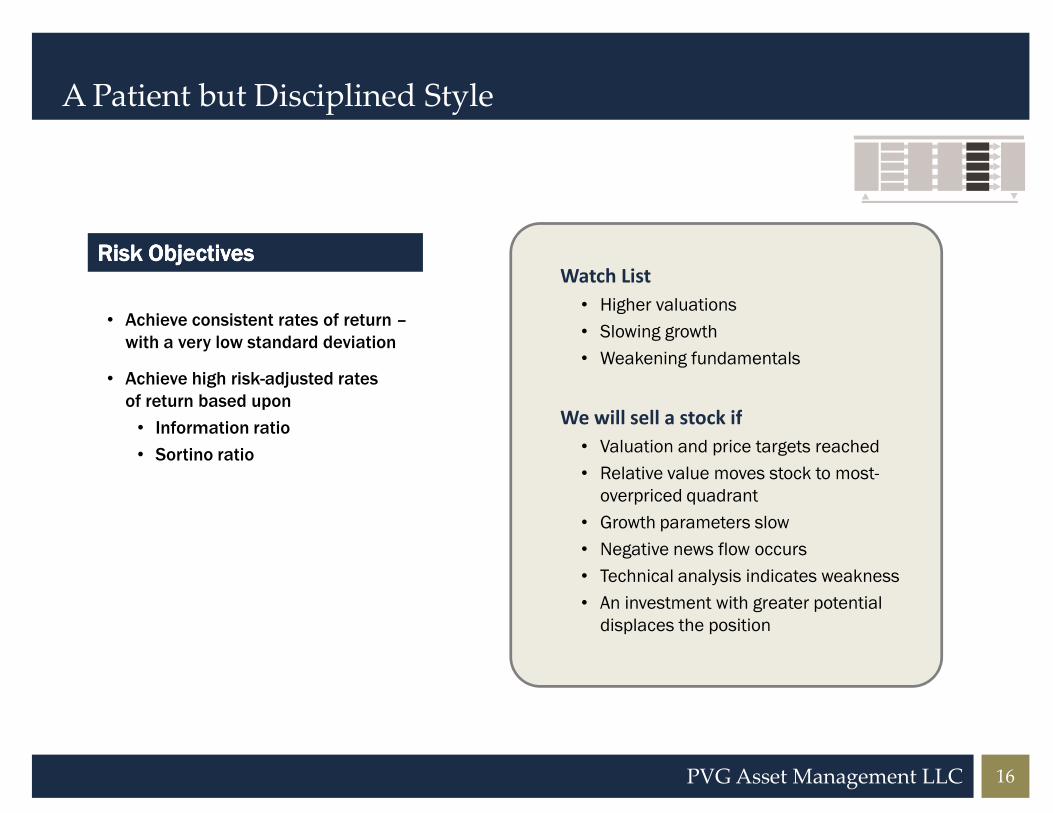
A Patient but Disciplined Style
Risk ObjectivesRisk ObjectivesRisk ObjectivesRisk Objectives
• Achieve consistent rates of return –
with a very low standard deviation
• Achieve high risk-adjusted rates
of return based upon
Watch List
• Higher valuations
• Slowing growth
• Weakening fundamentals
We will sell a stock if
16PVG Asset Management LLC
of return based upon
• Information ratio
• Sortino ratio
We will sell a stock if
• Valuation and price targets reached
• Relative value moves stock to most-
overpriced quadrant
• Growth parameters slow
• Negative news flow occurs
• Technical analysis indicates weakness
• An investment with greater potential
displaces the position

Statistics
17
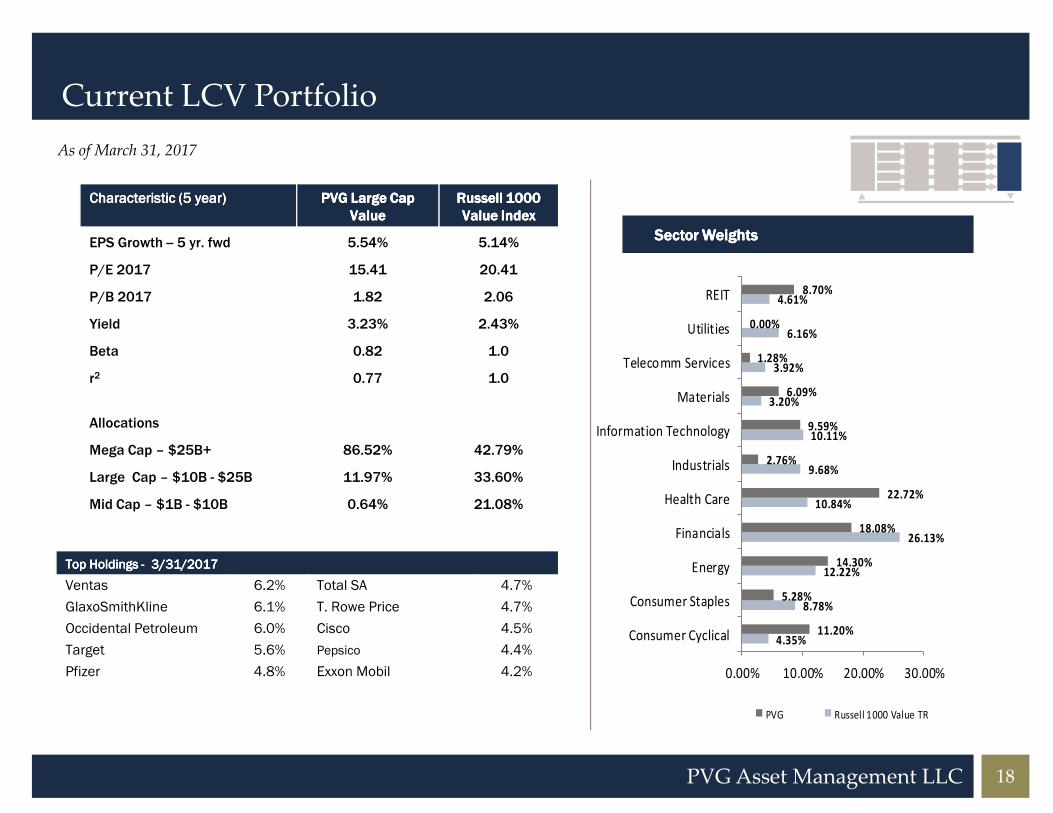
Current LCV Portfolio
As of March 31, 2017
Characteristic (5 year)Characteristic (5 year)Characteristic (5 year)Characteristic (5 year) PVG Large Cap PVG Large Cap PVG Large Cap PVG Large Cap
ValueValueValueValue
Russell 1000 Russell 1000 Russell 1000 Russell 1000
Value IndexValue IndexValue IndexValue Index
EPS Growth -- 5 yr. fwd 5.54% 5.14%
P/E 2017 15.41 20.41
P/B 2017 1.82 2.06
Yield 3.23% 2.43%
Beta 0.82 1.0
r2 0.77 1.0
Sector Weights Sector Weights Sector Weights Sector Weights
3.20%
3.92%
6.16%
4.61%
6.09%
1.28%
0.00%
8.70%
Materials
Telecomm Services
Utilities
REIT
18PVG Asset Management LLC
Allocations
Mega Cap – $25B+ 86.52% 42.79%
Large Cap – $10B - $25B 11.97% 33.60%
Mid Cap – $1B - $10B 0.64% 21.08%
Top Holdings Top Holdings Top Holdings Top Holdings ---- 3/31/20173/31/20173/31/20173/31/2017
Ventas 6.2% Total SA 4.7%
GlaxoSmithKline 6.1% T. Rowe Price 4.7%
Occidental Petroleum 6.0% Cisco 4.5%
Target 5.6% Pepsico 4.4%
Pfizer 4.8% Exxon Mobil 4.2%
4.35%
8.78%
12.22%
26.13%
10.84%
9.68%
10.11%
3.20%
11.20%
5.28%
14.30%
18.08%
22.72%
2.76%
9.59%
0.00% 10.00% 20.00% 30.00%
Consumer Cyclical
Consumer Staples
Energy
Financials
Health Care
Industrials
Information Technology
PVG Russell 1000 Value TR
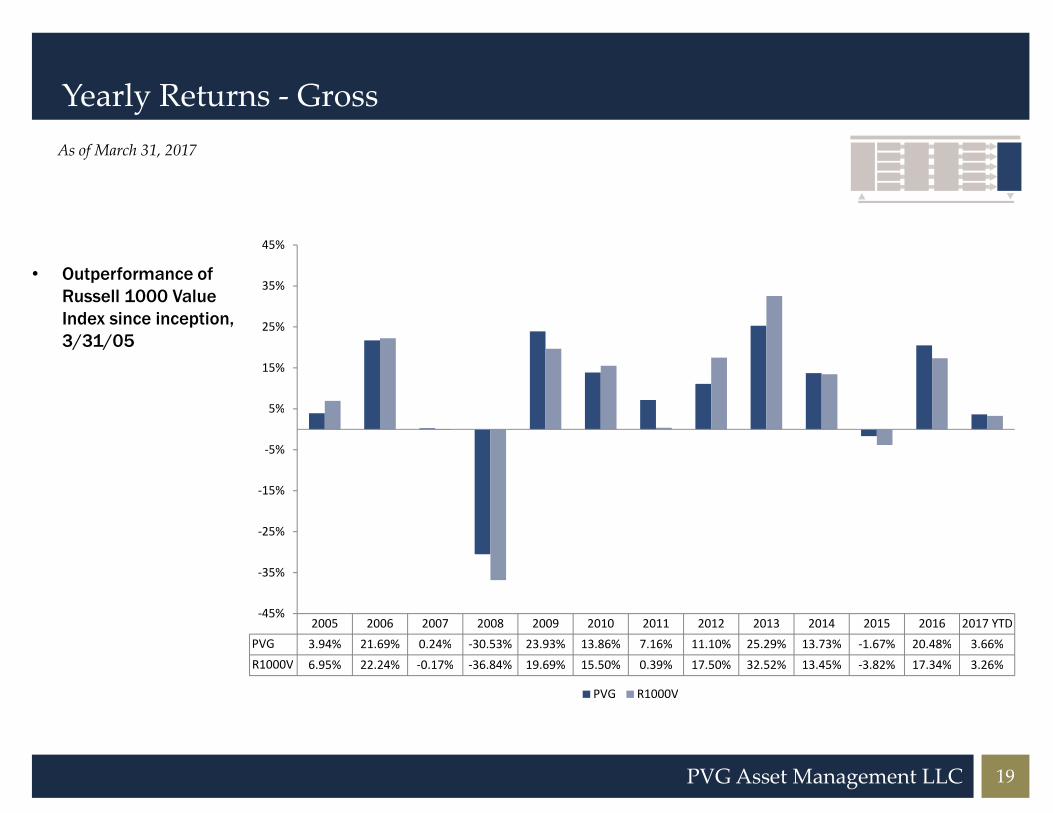
Yearly Returns - Gross
As of March 31, 2017
• Outperformance of
Russell 1000 Value
Index since inception,
3/31/05
5%
15%
25%
35%
45%
19PVG Asset Management LLC
2005 2006 2007 2008 2009 2010 2011 2012 2013 2014 2015 2016 2017 YTD
PVG 3.94% 21.69% 0.24% -30.53% 23.93% 13.86% 7.16% 11.10% 25.29% 13.73% -1.67% 20.48% 3.66%
R1000V 6.95% 22.24% -0.17% -36.84% 19.69% 15.50% 0.39% 17.50% 32.52% 13.45% -3.82% 17.34% 3.26%
-45%
-35%
-25%
-15%
-5%
5%
PVG R1000V
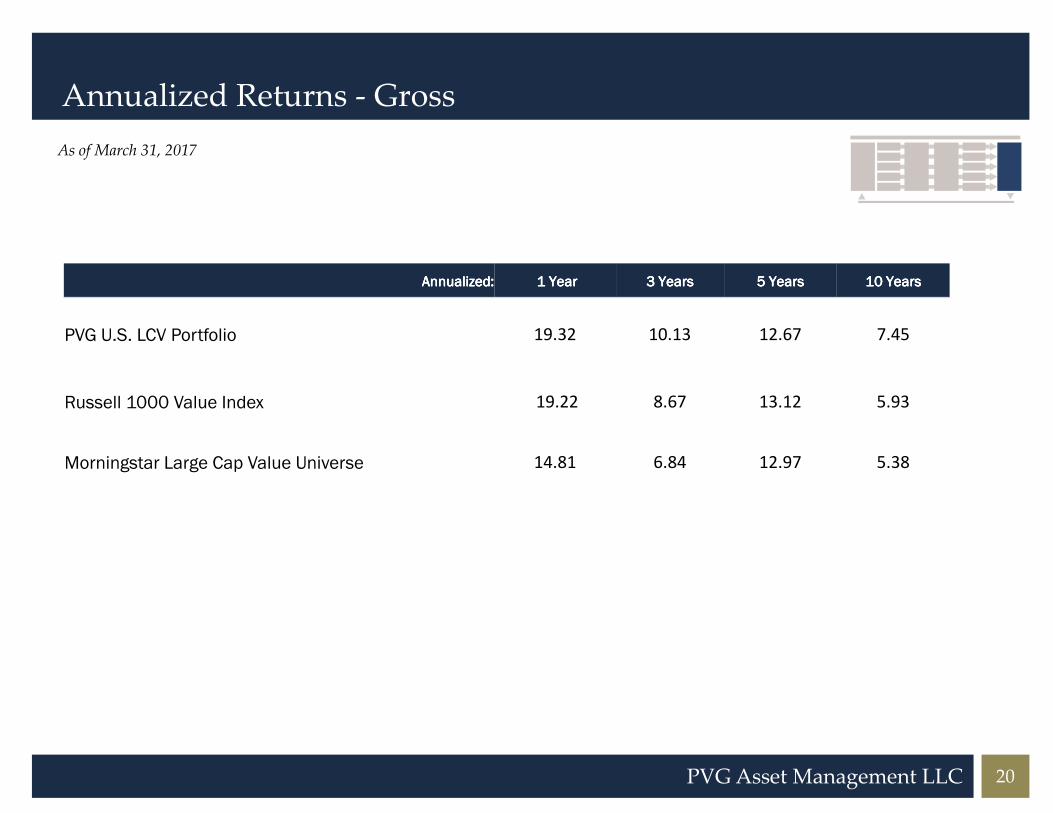
Annualized Returns - Gross
As of March 31, 2017
Annualized: Annualized: Annualized: Annualized: 1 Year1 Year1 Year1 Year 3 Years3 Years3 Years3 Years 5 Years5 Years5 Years5 Years 10 10 10 10 YearsYearsYearsYears
PVG U.S. LCV Portfolio 19.32 10.13 12.67 7.45
Russell 1000 Value Index 19.22 8.67 13.12 5.93
20PVG Asset Management LLC
Russell 1000 Value Index 19.22 8.67 13.12 5.93
Morningstar Large Cap Value Universe 14.81 6.84 12.97 5.38
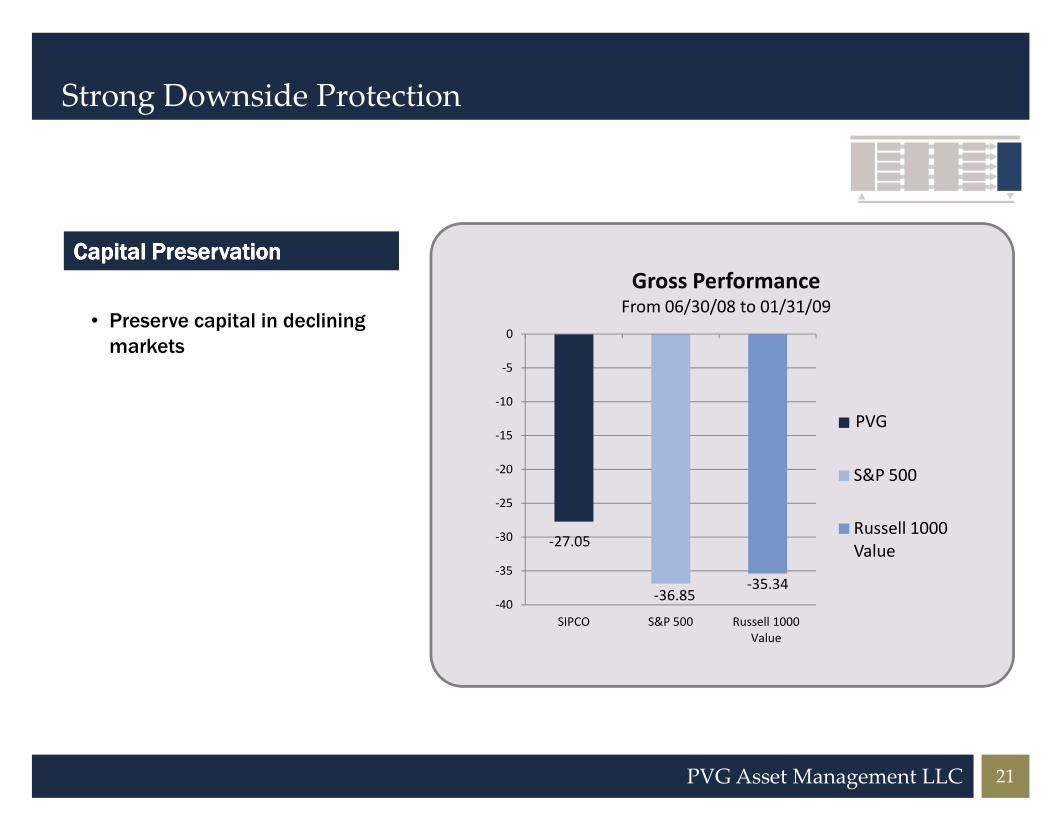
Strong Downside Protection
Capital PreservationCapital PreservationCapital PreservationCapital Preservation
• Preserve capital in declining
markets
-10
-5
0
Gross Performance From 06/30/08 to 01/31/09
21PVG Asset Management LLC
-27.05
-36.85-35.34
-40
-35
-30
-25
-20
-15
-10
SIPCO S&P 500 Russell 1000
Value
SIPCO
S&P 500
Russell 1000
Value
PVG
Looking Forward
U.S. Large Cap Value Portfolio
– Pure international exposure with the benefits of a contrarian approach
– An emphasis on capital preservation and risk management
– A record of long-term risk adjusted outperformance of benchmark and peers
22PVG Asset Management LLC
– A record of long-term risk adjusted outperformance of benchmark and peers
– A focused organization aligned entirely to clients’ needs and interests

Appendix
23
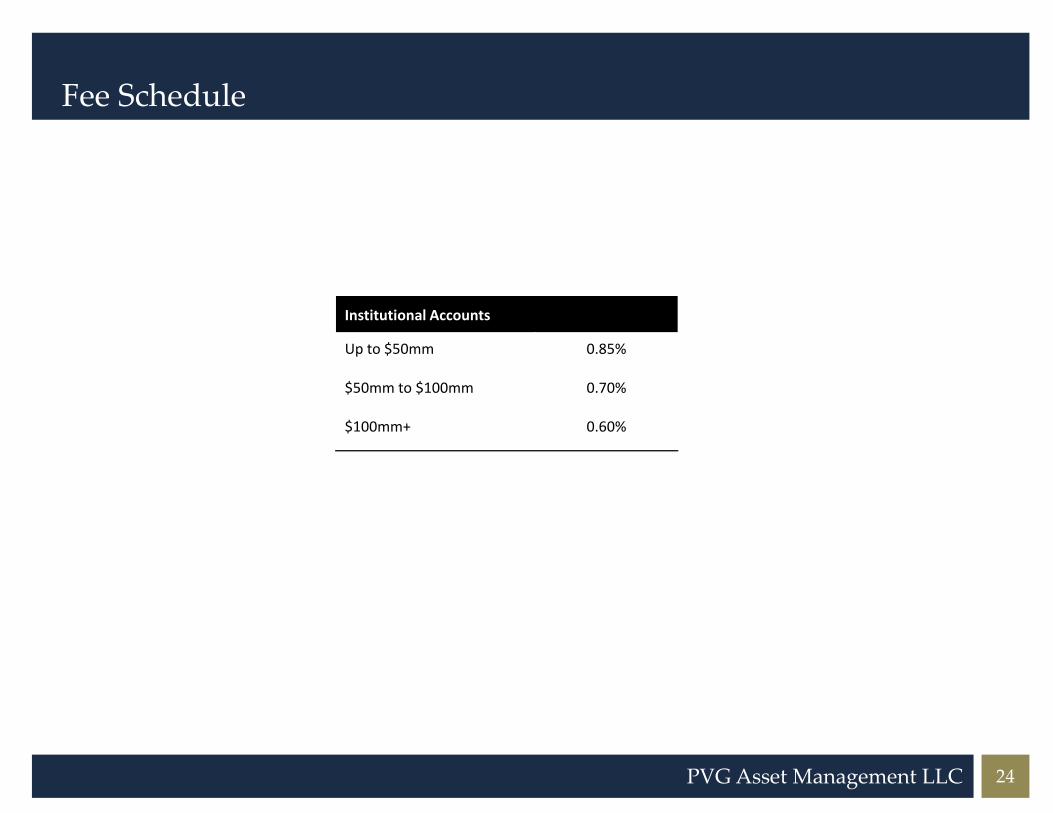
Fee Schedule
Institutional Accounts
Up to $50mm 0.85%
$50mm to $100mm 0.70%
24PVG Asset Management LLC
$100mm+ 0.60%
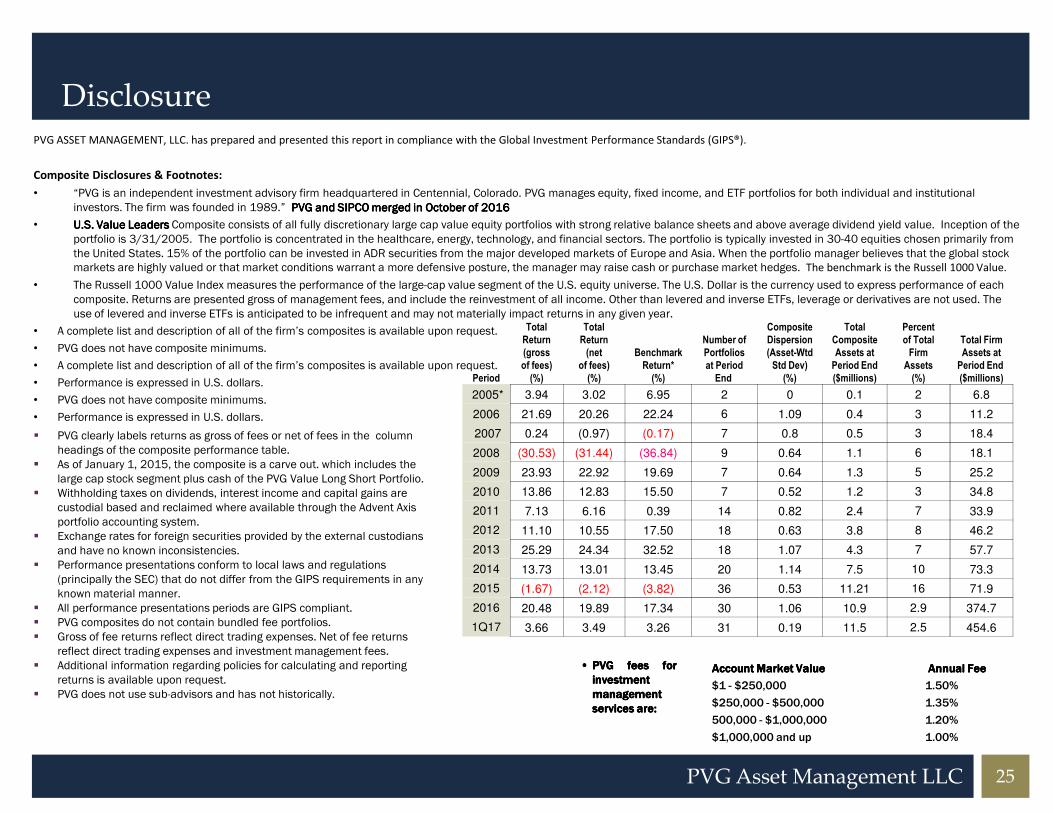
DisclosurePVG ASSET MANAGEMENT, LLC. has prepared and presented this report in compliance with the Global Investment Performance Standards (GIPS®).
Composite Disclosures & Footnotes:
• “PVG is an independent investment advisory firm headquartered in Centennial, Colorado. PVG manages equity, fixed income, and ETF portfolios for both individual and institutional
investors. The firm was founded in 1989.” PVG and SIPCO merged in October of 2016PVG and SIPCO merged in October of 2016PVG and SIPCO merged in October of 2016PVG and SIPCO merged in October of 2016
• U.S. Value Leaders U.S. Value Leaders U.S. Value Leaders U.S. Value Leaders Composite consists of all fully discretionary large cap value equity portfolios with strong relative balance sheets and above average dividend yield value. Inception of the
portfolio is 3/31/2005. The portfolio is concentrated in the healthcare, energy, technology, and financial sectors. The portfolio is typically invested in 30-40 equities chosen primarily from
the United States. 15% of the portfolio can be invested in ADR securities from the major developed markets of Europe and Asia. When the portfolio manager believes that the global stock
markets are highly valued or that market conditions warrant a more defensive posture, the manager may raise cash or purchase market hedges. The benchmark is the Russell 1000 Value.
• The Russell 1000 Value Index measures the performance of the large-cap value segment of the U.S. equity universe. The U.S. Dollar is the currency used to express performance of each
composite. Returns are presented gross of management fees, and include the reinvestment of all income. Other than levered and inverse ETFs, leverage or derivatives are not used. The
use of levered and inverse ETFs is anticipated to be infrequent and may not materially impact returns in any given year.
• A complete list and description of all of the firm’s composites is available upon request.
• PVG does not have composite minimums.
• A complete list and description of all of the firm’s composites is available upon request.
• Performance is expressed in U.S. dollars.
• PVG does not have composite minimums.
Period
TotalReturn(grossof fees)(%)
TotalReturn(net
of fees)(%)
BenchmarkReturn*(%)
Number ofPortfoliosat PeriodEnd
CompositeDispersion(Asset-WtdStd Dev)(%)
TotalCompositeAssets atPeriod End($millions)
Percentof TotalFirmAssets(%)
Total FirmAssets atPeriod End($millions)
2005* 3.94 3.02 6.95 2 0 0.1 2 6.8
25PVG Asset Management LLC
PVG does not have composite minimums.
• Performance is expressed in U.S. dollars.
� PVG clearly labels returns as gross of fees or net of fees in the column
headings of the composite performance table.
� As of January 1, 2015, the composite is a carve out. which includes the
large cap stock segment plus cash of the PVG Value Long Short Portfolio.
� Withholding taxes on dividends, interest income and capital gains are
custodial based and reclaimed where available through the Advent Axis
portfolio accounting system.
� Exchange rates for foreign securities provided by the external custodians
and have no known inconsistencies.
� Performance presentations conform to local laws and regulations
(principally the SEC) that do not differ from the GIPS requirements in any
known material manner.
� All performance presentations periods are GIPS compliant.
� PVG composites do not contain bundled fee portfolios.
� Gross of fee returns reflect direct trading expenses. Net of fee returns
reflect direct trading expenses and investment management fees.
� Additional information regarding policies for calculating and reporting
returns is available upon request.
� PVG does not use sub-advisors and has not historically.
•••• PVGPVGPVGPVG feesfeesfeesfees forforforfor
investmentinvestmentinvestmentinvestment
managementmanagementmanagementmanagement
servicesservicesservicesservices areareareare::::
Account Market ValueAccount Market ValueAccount Market ValueAccount Market Value Annual FeeAnnual FeeAnnual FeeAnnual Fee
$1 - $250,000 1.50%
$250,000 - $500,000 1.35%
500,000 - $1,000,000 1.20%
$1,000,000 and up 1.00%
2006 21.69 20.26 22.24 6 1.09 0.4 3 11.2
2007 0.24 (0.97) (0.17) 7 0.8 0.5 3 18.4
2008 (30.53) (31.44) (36.84) 9 0.64 1.1 6 18.1
2009 23.93 22.92 19.69 7 0.64 1.3 5 25.2
2010 13.86 12.83 15.50 7 0.52 1.2 3 34.8
2011 7.13 6.16 0.39 14 0.82 2.4 7 33.9
2012 11.10 10.55 17.50 18 0.63 3.8 8 46.2
2013 25.29 24.34 32.52 18 1.07 4.3 7 57.7
2014 13.73 13.01 13.45 20 1.14 7.5 10 73.3
2015 (1.67) (2.12) (3.82) 36 0.53 11.21 16 71.9
2016 20.48 19.89 17.34 30 1.06 10.9 2.9 374.7
1Q17 3.66 3.49 3.26 31 0.19 11.5 2.5 454.6
Disclosure
Composite Disclosures & Footnotes: (Cont.)
� All significant events that would help a prospective client interpret the firm’s performance record are believed to be disclosed within the firm’s SEC Form ADV Part II
with Schedule F, the composite performance table and related footnotes, the client’s Investment Management Agreement, the client’s Investment Policy Statement,
the firm’s web site and various firm brochures.
� PVG, as a firm, has not been redefined.
� No composites have been redefined.
� There have been no composite name changes.
� Composite creation date is 3/31/2005
� Calendar month-end or last business day of the month portfolio valuations are used.
� Composite dispersion is the asset-weighted standard deviation of the individual portfolios around the composite mean for the current period. Composites with 5
portfolios or less are shown as NM (not meaningful).
� PVG does not have multiple defined firms within a parent company.
� There have been no changes in calculation methodology or valuation sources that would result in a material impact on the performance of composite returns.
26PVG Asset Management LLC
� There have been no changes in calculation methodology or valuation sources that would result in a material impact on the performance of composite returns.
� Returns for periods of greater than 1 year are annualized.
� The three year annualized ex-post standard deviation of the composite and/or benchmark is not presented because 36 monthly returns are not available.
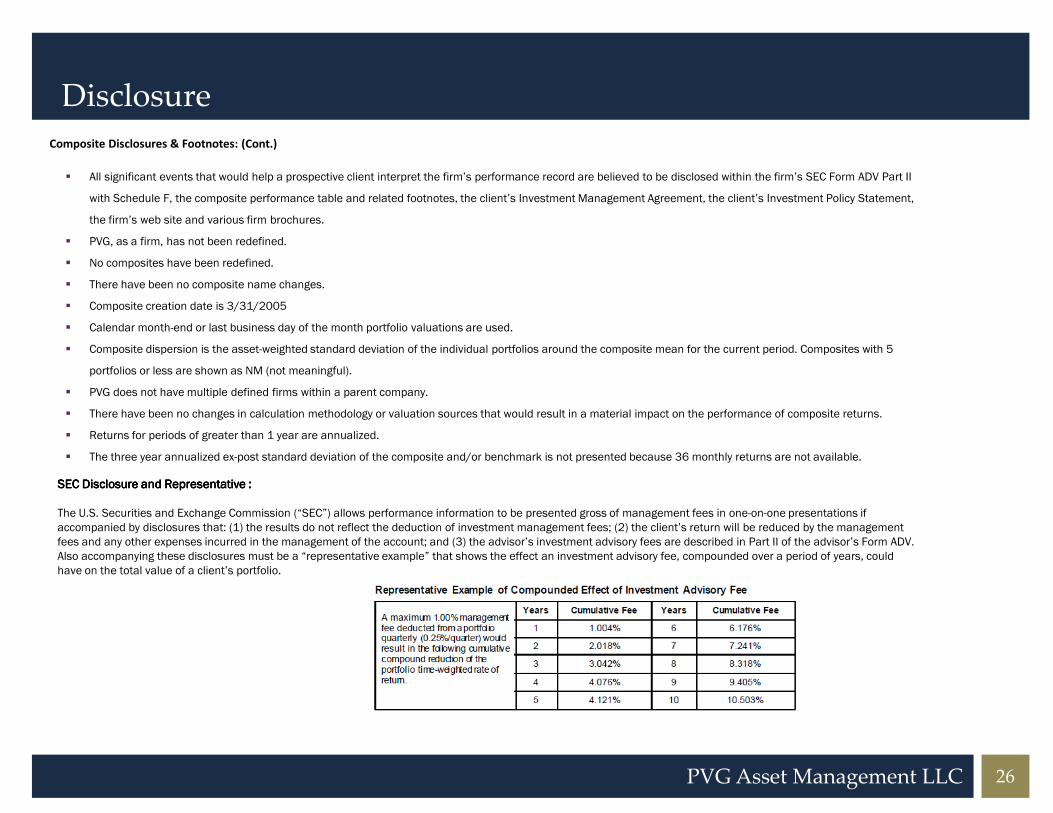
SEC Disclosure and Representative :SEC Disclosure and Representative :SEC Disclosure and Representative :SEC Disclosure and Representative :
The U.S. Securities and Exchange Commission (“SEC”) allows performance information to be presented gross of management fees in one-on-one presentations if
accompanied by disclosures that: (1) the results do not reflect the deduction of investment management fees; (2) the client’s return will be reduced by the management
fees and any other expenses incurred in the management of the account; and (3) the advisor’s investment advisory fees are described in Part II of the advisor’s Form ADV.
Also accompanying these disclosures must be a “representative example” that shows the effect an investment advisory fee, compounded over a period of years, could
have on the total value of a client’s portfolio.
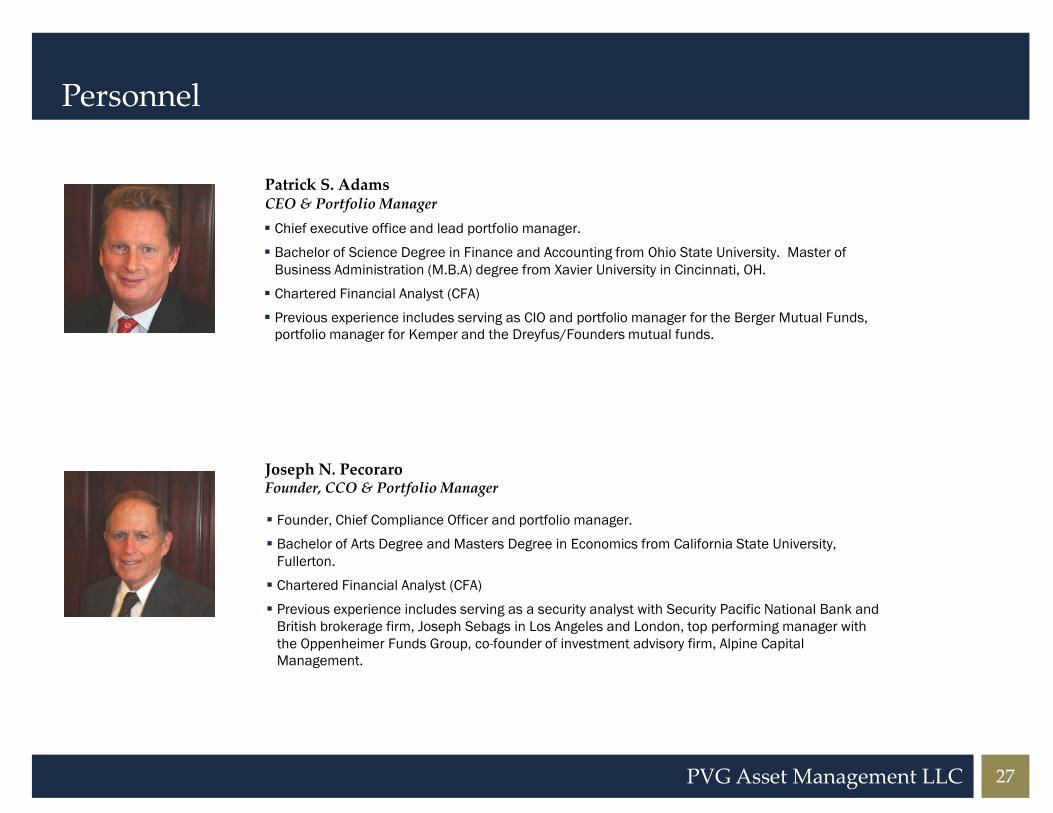
Personnel
Patrick S. AdamsCEO & Portfolio Manager
� Chief executive office and lead portfolio manager.
� Bachelor of Science Degree in Finance and Accounting from Ohio State University. Master of
Business Administration (M.B.A) degree from Xavier University in Cincinnati, OH.
� Chartered Financial Analyst (CFA)
� Previous experience includes serving as CIO and portfolio manager for the Berger Mutual Funds, portfolio manager for Kemper and the Dreyfus/Founders mutual funds.
27PVG Asset Management LLC
Joseph N. PecoraroFounder, CCO & Portfolio Manager
� Founder, Chief Compliance Officer and portfolio manager.
� Bachelor of Arts Degree and Masters Degree in Economics from California State University,
Fullerton.
� Chartered Financial Analyst (CFA)
� Previous experience includes serving as a security analyst with Security Pacific National Bank and
British brokerage firm, Joseph Sebags in Los Angeles and London, top performing manager with
the Oppenheimer Funds Group, co-founder of investment advisory firm, Alpine Capital Management.
Personnel (cont.)
Timothy J. McIntoshPortfolio Manager
� Serves as senior investment officer. Oversees aspects of major client accounts and serves as
lead portfolio manager for the firm’s US Corporate Flexible Bond and US International ADR
portfolios.
� Bachelor of Science Degree in Economics from Florida State University. Master of Business
Administration (M.B.A) degree from University of Sarasota. Master of Public Health Degree
(M.P.H) from the University of South Florida.
� Former finance professor at Eckerd College in St. Petersburg from 1998-2008
� CFA Level II Candidate, Certified Financial Planner™
� Previous experience includes employment with Blue Cross/Blue Shield of Florida and the United
States Army - Military Intelligence
28PVG Asset Management LLC
States Army - Military Intelligence
Paul M. MacNamaraPortfolio Manager
� Provides client service to high net worth clients and serves on investment committee. Assists in
the analysis of equity securities and market valuation.
� Bachelor of Science Degree in History from Millersville University. Master of International
Relations from Troy State University.
� Founder Atlantic Investment Advisors Inc
� Certified Financial Planner™
� U.S. Army Special Forces Officer (Retired Colonel)
Personnel (cont.)
Rick Garcia President, Director of Marketing & Sales, Portfolio Manager
� Serves as the portfolio manager for PVG’s technical strategies. Leadership role includes management of
the sales and marketing division.
� Bachelor of Science Degree in Finance from Metropolitan State College of Denver.
� Previous experience includes serving as a Stock Broker for Charles Schwab & Co., and a Business
Development Consultant for Jackson National Life Distributors.
� U.S. Marine Corps – honorable discharged as a Sergeant.
29PVG Asset Management LLC
Jana Henderson Vice President, Director of Trading & Operations
� Serves as director of operations, responsible for the execution of trades, coordinate new business,
oversee financial controls and manages client reporting.
� Engineer of Finance and Economics from Thomas Beta University, Zlin, Czech Republic
Personnel (cont.)
Annie Gallegos Vice President, Trading & Operations
� Advent Axys & Moxy Trading specialist. Firm’s senior trader and also provides customer support, daily
portfolio reconciliation, performance reporting, and assists in compliance.
� Maintains control procedures and performs data integrity audits to ensure the accuracy and integrity of
data, utilizing Advent software.
� Bachelor of Science Degree in Economics from Northwestern University.
� Previous experience includes employment with Chicago based Premier Asset Management and WaMu
Investment Company.
30PVG Asset Management LLC


![PVG 32 Proportional Valve Group Installation Guide€¦ · LSB B A LSA P109135 Product Rated Pressure PVG 32 w. PVS 300 bar [4351 psi] PVG 32 w. PVSI 350 bar [5076 psi] PVG 32 w](https://img.pdfslide.us/doc/110x75/6061ebbf8add853ee82334b4/pvg-32-proportional-valve-group-installation-guide-lsb-b-a-lsa-p109135-product-rated.jpg)


![[PVG] Adele - Hello](https://img.pdfslide.us/doc/110x75/577c87791a28abe054c47115/pvg-adele-hello.jpg)