Embed Size (px)
Citation preview
2
About E2A
The Evidence to Action Project (E2A) is USAID’s global flagship for strengthening family planning and reproductive
health service delivery. The project aims to address the reproductive healthcare needs of girls, women, and
underserved communities around the world by increasing support, building evidence, and leading the scale-up of
best practices that improve family planning services. A Cooperative Agreement awarded in September 2011, E2A
is led by Pathfinder International in partnership with the African Population and Health Research Center,
ExpandNet, Intrahealth International, Management Sciences for Health, and PATH.
Contact Information
1201 Connecticut Avenue, NW, Suite 700
Washington, D.C. 20036
Tel. 202-775-1977
Fax 202-775-1988
www.e2aproject.org
Twitter: @E2AProject
This publication was made possible through support provided by the Office of Population and
Reproductive Health, Bureau for Global Health, U.S. Agency for International Development, under the
terms of Award No. AID-OAA-A-11-00024. The opinions expressed herein are those of the author(s)
and do not necessarily reflect the views of the U.S. Agency for International Development.
3
Acknowledgements
The health facility assessment (HFA) for the Saving Mothers, Giving Life initiative in Cross River State, Nigeria, was
a joint activity between the USAID-funded Evidence to Action (E2A) Project and Pathfinder International Nigeria.
While E2A staff led the design of the HFA, data collection and analysis, and report writing, Pathfinder International
staff provided the logistics and administrative support for the HFA.
We would like to express our gratitude to the Saving Mothers, Giving Life secretariat for providing financial
support to conduct this study. We are particularly grateful to Claudia Conlon, Mona Steffen, and Kaitlin Cassidy
for their technical input and to Dr. Frank Kaharuza for participating in the training of field workers for HFA 1. We
are also grateful to Dr. Joseph Monehin for his technical support. The support of the Cross River State
Government in the implementation of the HFA is highly appreciated.
We would like to thank all the Local Government Area primary health care coordinators for providing the lists of
public and private health facilities in their Local Government Areas that met the criterion for assessment. We are
grateful to the Cross River State Planning Commission and the State Bureau of statistics for their logistic and
technical support. We are also grateful to: Dr. Aba Nwachuku (the lead field supervisor, HFA 1); Dr. Sakina Bello
(the lead field supervisor, HFA II); Dr. Ukong Akpan (HFA quality monitor); and the fieldworkers who collected
data for the health facility assessments. They worked very hard under difficult situations to obtain the required
data and to meet deadlines. Our gratitude also goes to Mrs. Toyin Akpan and her team at Auricle Services for
developing data-entry templates and entering the HFA data.
Within Pathfinder International Nigeria, several individuals deserve special mention for their support at different
stages of the assessment. Not only were they involved in the design of the HFA, they provided technical or
administrative support for the implementation the HFA. These individuals include: Dr. Farouk Jega, Pathfinder
International Country Representative; Dr. Habeeb Salami, Program Manager, RH/FP; Dr. Yemisi Femi-Pius, Ms.
Nenka Alobi; and Mrs. Olamide Situ (Finance).
Within E2A, we would like to thank Carina Stover, Project Director, and Gwen Morgan, Deputy Project Director,
and Elham Hassen, Program Officer, Field Support, for their support. We are very grateful to Papa Fall (Finance
Director), Seda Yener (Senior Finance and Administrative Associate), and Raneem Kayed (Finance and
Administrative Associate) for managing the contract to Auricle Services. We are also grateful to Laurel Lundstrom
and Maru Valdes for their support in formatting the report.
The HFA team consisted of: Dr. Bamikale Feyisetan, Director, Monitoring and Evaluation, E2A Project; Dr. Fariyal
Fikree, Senior Research Advisor, E2A Project; Dr. Abdulmumin Saad, Research and Metrics Advisor, E2A Project;
Dr. Murtala Mai, Director, Field Support, E2A Project; Ms. Jumoke Azogu, Senior Advisor, MERL, Pathfinder
International; and Dr. Farouk Jega, Country Representative, Pathfinder International.
Suggested Citation:
Bamikale Feyisetan, Fariyal Fikree, Abdulmumin Saad, Murtala Mai, Jumoke Azogu, and Farouk Jega,
Summary Report of the Pre-Intervention Health Facility Assessment of Emergency Obstetric Care in Cross River
State, Nigeria: The Saving Mothers, Giving Life Initiative (Washington, DC: Evidence to Action Project,
December 2015).
4
Contents
1. Background .............................................................................................................................................................. 11
1.1 The Health Care System in Nigeria .................................................................................................. 11
1.2. The Goal and Objectives of the Saving Mothers, Giving Life Program in Nigeria .......................... 12
1.3. SMGL Programming Approach ........................................................................................................ 13
1.4. Maternal, Newborn and Child Health in Cross River State ............................................................ 13
Table 1: Relevant SMGL indicators at the national, South-South, and CRS levels ................................. 14
1.5. The Health Facility Assessments, Phases 1&2 ................................................................................. 14
1.5.1 Selection of Health Facilities, Training of Research Assistants, and Fieldwork ................................... 14
1.5.2 Data Collection Instruments .......................................................................................................... 15
1.5.3 The Field Workers ........................................................................................................................ 15
1.5.4 Training of Field Workers .............................................................................................................. 15
1.5.5 Data Collection ............................................................................................................................. 15
1.5.6 Data Quality Assurance ................................................................................................................ 16
1.5.7 Data Entry and Analysis ................................................................................................................ 16
1.5.8 Limitations of the Health Facility Assessments ................................................................................ 16
2. Health Facilities with One or More Deliveries in the 12 Months Preceding the HFA in Cross River
State ........................................................................................................................................................................... 17
2.1 Types of Facilities Assessed .............................................................................................................. 17
2.2 Basic and Comprehensive Emergency Obstetric and Newborn Care Services: .............................. 18
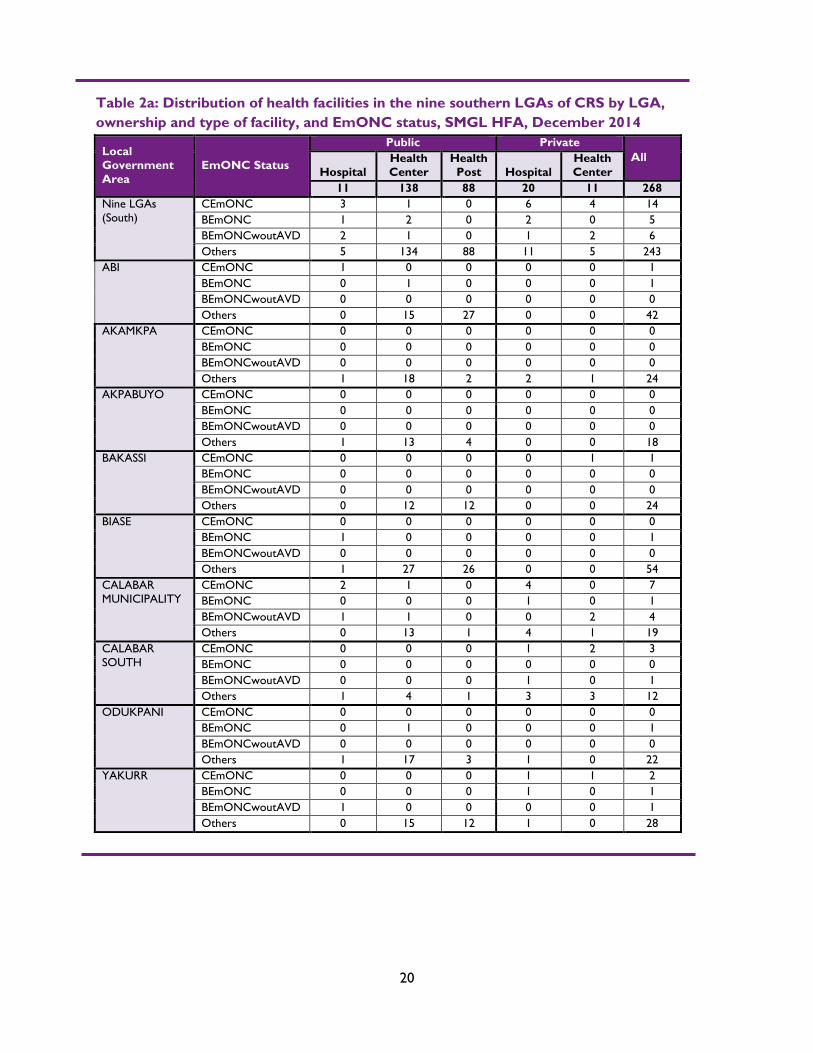
Table 2a: Distribution of health facilities in the nine southern LGAs of CRS by LGA, ownership and
type of facility, and EmONC status, SMGL HFA, December 2014 ........................................................ 20
Table 2b: Distribution of health facilities in the nine northern LGAs of CRS by LGA, ownership and
type of facility, and EmONC status, SMGL HFA, June 2015 .................................................................. 21
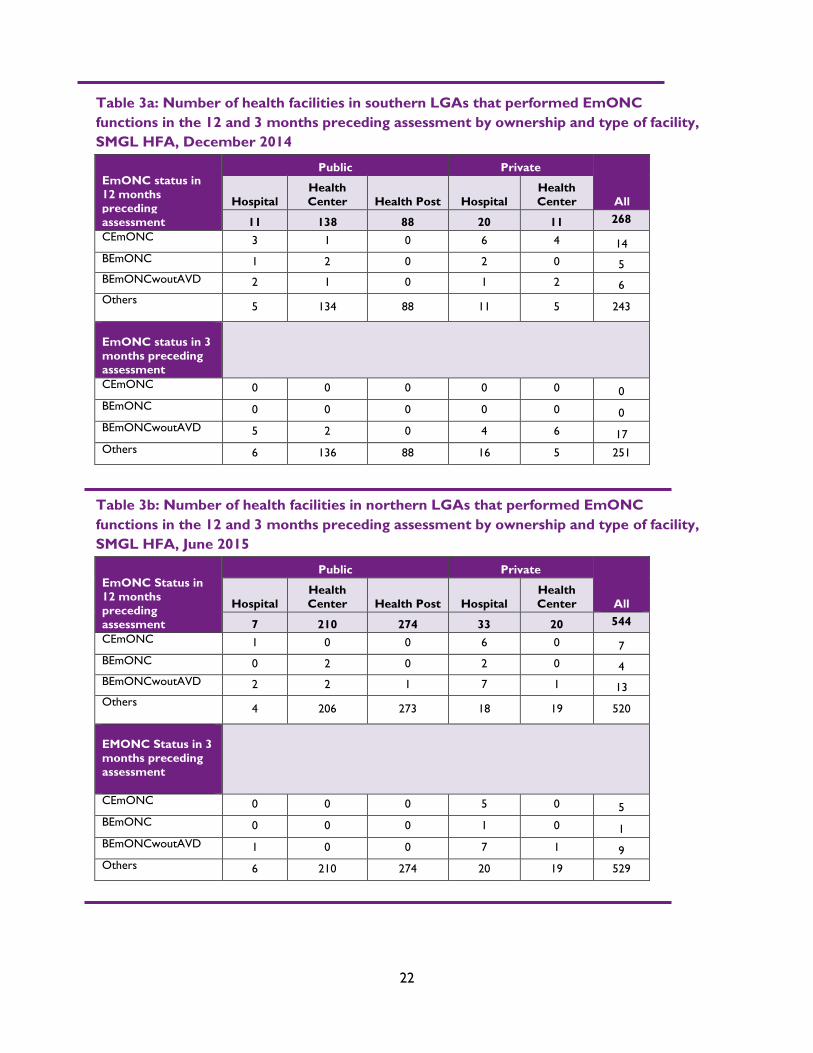
Table 3a: Number of health facilities in southern LGAs that performed EmONC functions in the 12
and 3 months preceding assessment by ownership and type of facility, SMGL HFA, December 2014 22
Table 3b: Number of health facilities in northern LGAs that performed EmONC functions in the 12
and 3 months preceding assessment by ownership and type of facility, SMGL HFA, June 2015 .......... 22
3. The Signal Functions ................................................................................................................................................... 23
Figure 2a: Mean number of signal functions performed in the 12 months preceding HFA by facilities in
southern LGAs, by facility type, SMGL HFA December 2014 ............................................................... 29
Figure 2b: Mean number of signal functions performed in the 12 months preceding HFA by facilities in
northern LGAs, by facility type, SMGL HFA, June 2015 ........................................................................ 29
5
4. Deliveries, Obstetric and Neonatal Complications and Mortality (still births, maternal and neonatal) in
the 12 months preceding the HFA ..................................................................................................................... 30
5. Human Resources and Staffing ................................................................................................................................. 34
6. Equipment, Supplies and Essential Drugs............................................................................................................... 36
7. Other Maternal and Newborn Health Services ................................................................................................... 39
8. Quality of Care Practices .......................................................................................................................................... 41
9. Basic Services (Water, Toilet and Electricity) ...................................................................................................... 43
10. Community Mobilization Efforts ........................................................................................................................... 45
11. Summary and Conclusion ....................................................................................................................................... 47
Appendix: Field Workers .............................................................................................................................................. 49
6
Acronyms
AMSTL Active Management of Third Stage of Labor
AVD Assisted Vaginal Delivery
BEmONC Basic Emergency Obstetric and Newborn Care
CBO Community Based Organizations
CEmONC Comprehensive Emergency Obstetric and Newborn Care
CHEW Community Health Extension Worker
CHO Community Health Officer
CRS Cross River State
E2A Evidence to Action for Strengthened Family Planning and Reproductive Health Services
for Women and Girls
EmONC Emergency Obstetric and Newborn Care
FHI Family Health International
FMoH Federal Ministry of Health
HC Health Center
HFA Health Facility Assessment
HMIS Health Management Information System
HP Health Post
LGA Local Government Authority
M&E Monitoring and Evaluation
MMR Maternal Mortality Ratio
MNH Maternal and Newborn Health
MVA Manual Vacuum Aspiration
NDHS Nigeria Demographic and Health Survey
NGO Non-Governmental Organization
NMR Neonatal Mortality Rate
NYSC National Youth Service Corps
PHC Primary Health Care
PMTCT Preventing Mother-to-Child Transmission of HIV
SBA Skilled Birth Attendance/Attendants
SMGL Saving Mothers Giving Life
USAID United States Agency for International Development
WHO World Health Organization
7
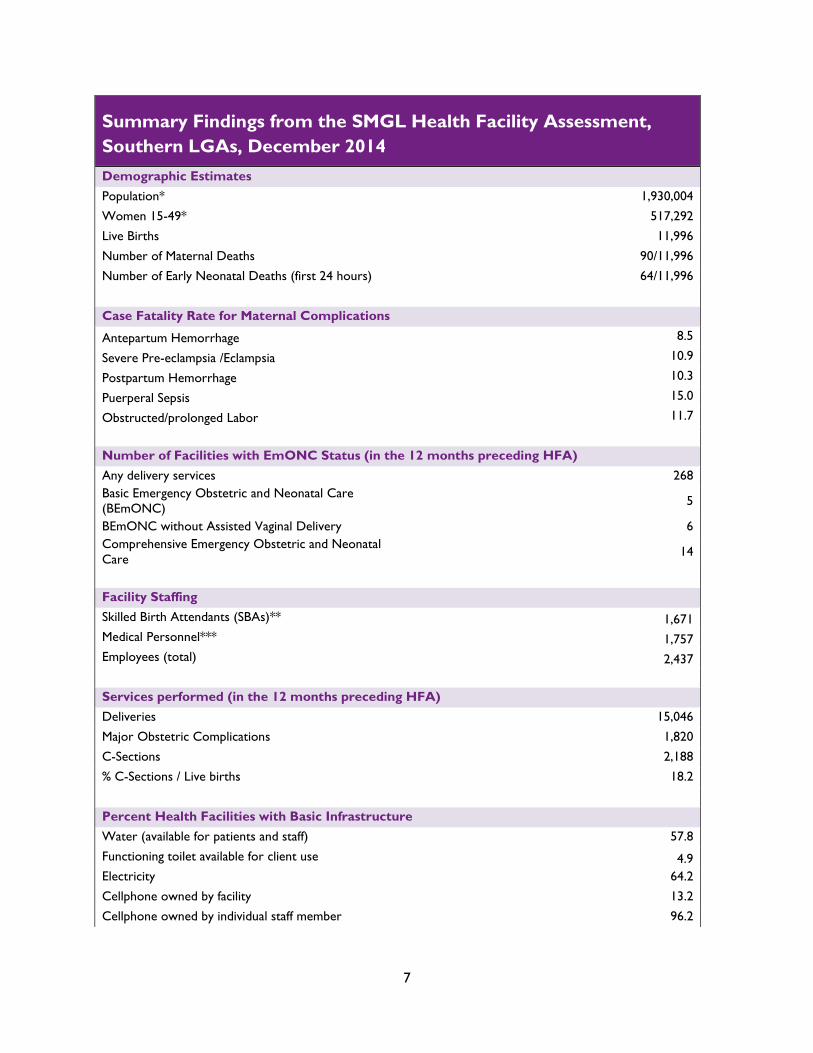
Summary Findings from the SMGL Health Facility Assessment,
Southern LGAs, December 2014
Demographic Estimates
Population*
1,930,004
Women 15-49*
517,292
Live Births
11,996
Number of Maternal Deaths 90/11,996
Number of Early Neonatal Deaths (first 24 hours) 64/11,996
Case Fatality Rate for Maternal Complications
Antepartum Hemorrhage 8.5
Severe Pre-eclampsia /Eclampsia 10.9
Postpartum Hemorrhage 10.3
Puerperal Sepsis
15.0
Obstructed/prolonged Labor 11.7
Number of Facilities with EmONC Status (in the 12 months preceding HFA)
Any delivery services 268
Basic Emergency Obstetric and Neonatal Care
(BEmONC)
5
BEmONC without Assisted Vaginal Delivery 6
Comprehensive Emergency Obstetric and Neonatal
Care
14
Facility Staffing
Skilled Birth Attendants (SBAs)** 1,671
Medical Personnel*** 1,757
Employees (total) 2,437
Services performed (in the 12 months preceding HFA)
Deliveries
15,046
Major Obstetric Complications 1,820
C-Sections
2,188
% C-Sections / Live births 18.2
Percent Health Facilities with Basic Infrastructure
Water (available for patients and staff) 57.8
Functioning toilet available for client use 4.9
Electricity
64.2
Cellphone owned by facility 13.2
Cellphone owned by individual staff member 96.2
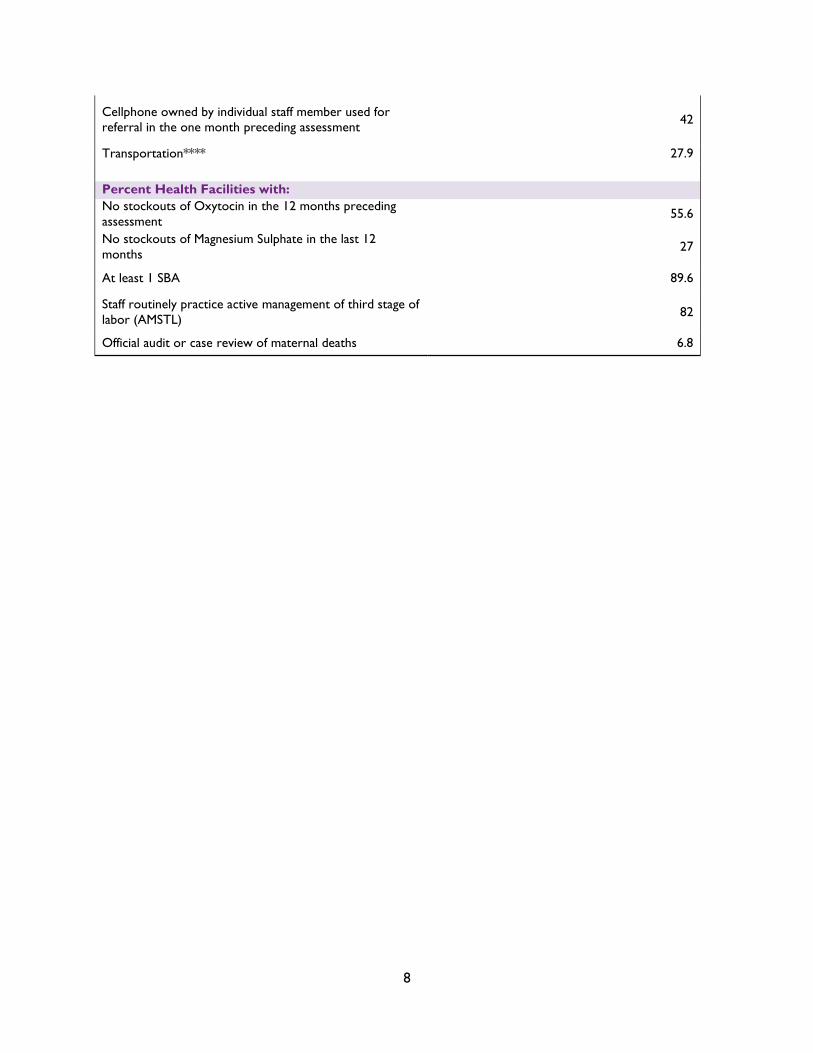
8
Cellphone owned by individual staff member used for
referral in the one month preceding assessment 42
Transportation**** 27.9
Percent Health Facilities with:
No stockouts of Oxytocin in the 12 months preceding
assessment 55.6
No stockouts of Magnesium Sulphate in the last 12
months 27
At least 1 SBA 89.6
Staff routinely practice active management of third stage of
labor (AMSTL) 82
Official audit or case review of maternal deaths 6.8
9
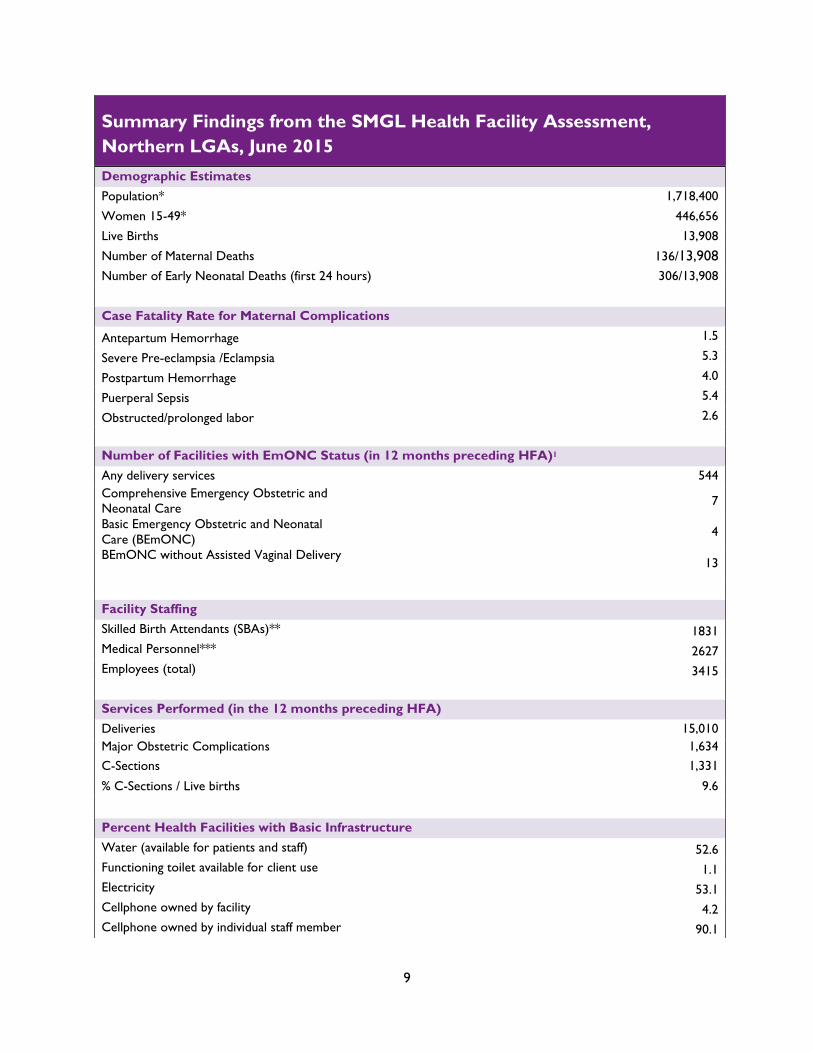
Summary Findings from the SMGL Health Facility Assessment,
Northern LGAs, June 2015
Demographic Estimates
Population*
1,718,400
Women 15-49*
446,656
Live Births
13,908
Number of Maternal Deaths
136/13,908
Number of Early Neonatal Deaths (first 24 hours) 306/13,908
Case Fatality Rate for Maternal Complications
Antepartum Hemorrhage 1.5
Severe Pre-eclampsia /Eclampsia 5.3
Postpartum Hemorrhage 4.0
Puerperal Sepsis
5.4
Obstructed/prolonged labor 2.6
Number of Facilities with EmONC Status (in 12 months preceding HFA)1
Any delivery services 544
Comprehensive Emergency Obstetric and
Neonatal Care
7
Basic Emergency Obstetric and Neonatal
Care (BEmONC)
4
BEmONC without Assisted Vaginal Delivery
13
Facility Staffing
Skilled Birth Attendants (SBAs)** 1831
Medical Personnel*** 2627
Employees (total)
3415
Services Performed (in the 12 months preceding HFA)
Deliveries
15,010
Major Obstetric Complications 1,634
C-Sections
1,331
% C-Sections / Live births 9.6
Percent Health Facilities with Basic Infrastructure
Water (available for patients and staff) 52.6
Functioning toilet available for client use 1.1
Electricity
53.1
Cellphone owned by facility 4.2
Cellphone owned by individual staff member 90.1
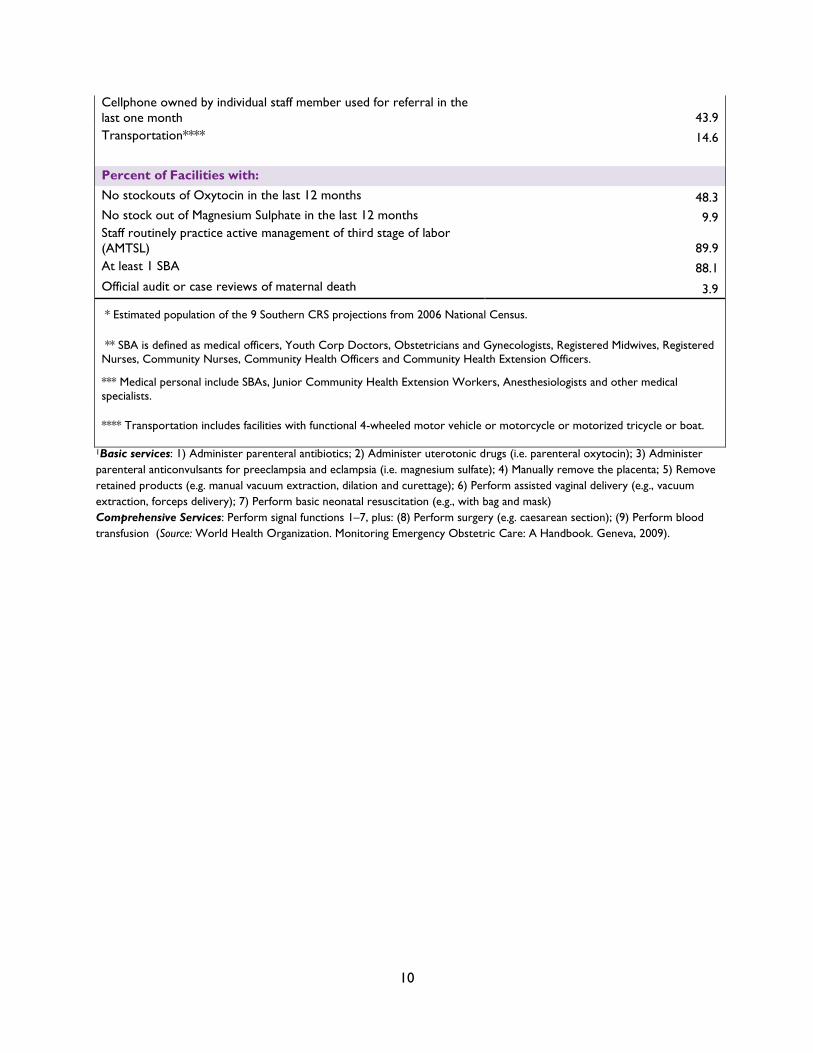
10
Cellphone owned by individual staff member used for referral in the
last one month 43.9
Transportation**** 14.6
Percent of Facilities with:
No stockouts of Oxytocin in the last 12 months 48.3
No stock out of Magnesium Sulphate in the last 12 months 9.9
Staff routinely practice active management of third stage of labor
(AMTSL) 89.9
At least 1 SBA 88.1
Official audit or case reviews of maternal death 3.9
* Estimated population of the 9 Southern CRS projections from 2006 National Census.
** SBA is defined as medical officers, Youth Corp Doctors, Obstetricians and Gynecologists, Registered Midwives, Registered
Nurses, Community Nurses, Community Health Officers and Community Health Extension Officers.
*** Medical personal include SBAs, Junior Community Health Extension Workers, Anesthesiologists and other medical
specialists.
**** Transportation includes facilities with functional 4-wheeled motor vehicle or motorcycle or motorized tricycle or boat.
1Basic services: 1) Administer parenteral antibiotics; 2) Administer uterotonic drugs (i.e. parenteral oxytocin); 3) Administer
parenteral anticonvulsants for preeclampsia and eclampsia (i.e. magnesium sulfate); 4) Manually remove the placenta; 5) Remove
retained products (e.g. manual vacuum extraction, dilation and curettage); 6) Perform assisted vaginal delivery (e.g., vacuum
extraction, forceps delivery); 7) Perform basic neonatal resuscitation (e.g., with bag and mask)
Comprehensive Services: Perform signal functions 1–7, plus: (8) Perform surgery (e.g. caesarean section); (9) Perform blood
transfusion (Source: World Health Organization. Monitoring Emergency Obstetric Care: A Handbook. Geneva, 2009).
11
1. Background
The health context in Nigeria, particularly for mothers and newborns, leave much to be desired, despite
several decades of donor investments in different interventions: newborn, infant, and child mortality
rates and the maternal mortality rates are still high, showing little improvement over the years. The
2013 Nigeria Demographic and Health Survey (DHS) report showed that:
Neonatal mortality rate (NMR) declined from 46 per 1,000 live births in the 1999-2003 period to 37
per 1,000 live births in the 2009-2013 period;
Infant mortality rate declined from 93 per 1,000 live births in the 1999-2003 period to 69 per 1,000
live births in the 2009-2013 period;
Under-five mortality rate declined from 185 per 1,000 live births in the 1999-2003 period to 128
per 1,000 live births in the 2009-2013 period; and
Maternal mortality ratio (MMR) was 576 maternal deaths per 100,000 live births.
The infant and child mortality data show that in the 2009-2013 period 29% of under-five deaths
occurred in the first month of life. At 576, Nigeria’s MMR was one of the highest in the world in 2013.
The above infant, child and maternal death data translate to a staggering 241,000 newborns and 33,000
women dying each year from largely preventable causes. Unfortunately, these tragic losses have been
occurring within a growing Nigerian economy, with a large number of trained health providers, the
existence of low-cost life-saving interventions, and Nigeria’s strong commitment to the global pledge to
end preventable child and maternal deaths and achieve an AIDS-free generation by 2035. Over the
years, budget allocations for health have been inadequate, availability and deployment of existing
resources have been uneven across regions/states (and within states, between rural and urban centers),
and the decentralized nature of the healthcare system poses additional challenges. It will be necessary to
cultivate support and leadership from several levels of government and professional associations for an
initiative to facilitate positive health outcomes at the community, local government, state and federal
levels.
Coverage of key maternal and neonatal health (MNH) interventions such as skilled birth attendance
(SBA), delivery at health facilities, and tetanus toxoid injections vary widely across regions and within
regions/states, influencing availability of quality health services. Caution must however be exercised in
interpreting coverage data. High coverage of the aforementioned MNH interventions might not
necessarily translate to better maternal and newborn outcomes—as reflected in the MMR and the NMR.
Unless the quality of care at the health facilities is generally good, increased health facility deliveries may
not necessarily translate to significant improvements in maternal and newborn survival. Thus, while
efforts should be invested to improve the coverage of key MNH interventions, more efforts are
required to improve quality of obstetric and newborn care services in health facilities in Nigeria. The
Saving Mothers, Giving Life (SMGL) initiative addresses the three delays in accessing maternal and child
health care by improving quality of obstetric and neonatal care with a special focus on the time of labor,
delivery, and the first 48 hours postpartum. The three delays addressed are: (1) recognition of the need
to seek care and making the decision to do so; (2) physically accessing care when necessary; and (3)
receiving appropriate care once in a health facility. A major objective of the SMGL initiative is to have
every pregnant woman deliver in a functional health care facility, attended by SBAs, with access to
emergency obstetric care, when needed.
1.1 The Health Care System in Nigeria
Nigeria operates both orthodox and traditional health care delivery systems that are formally
independent of each other.1 While individuals or families largely provide traditional health care services,
1 National Planning Commission (2008) Draft National Development Plan Abuja: National Planning Commission
12
the public and private sectors operate the orthodox health care system. The public health service is
organized into primary, secondary, and tertiary care. Different categories of community health extension
workers (CHEWS) provide primary health care (PHC) at the primary health facilities (health centers and
health posts) owned by communities and local governments. The primary health facility services are
complemented by those of the voluntary village health workers at the community level. In 2011, the
estimated total number of health facilities in Nigeria was 34,300, of which 30,221 (88%) were PHC
facilities; 3,996 (11%) were secondary health care facilities; and 83 (1%) were tertiary health care
facilities. Of the 30,221 PHC facilities, 21,028 (72%) were public sector owned, while the remaining
8,413 (28%) were private sector owned. At the secondary health care level, 969 (24%) of 3,996 health
facilities were publicly owned while 3027 (76%) were privately owned. Of the 36 states and the Federal
Capital Territory, Lagos State, with 2,253 facilities, had the most health facilities. Kaduna State was
second with 1,588 health facilities, and Cross River State (CRS) was 24th with 734 health facilities.2
The National Health Policy ascribes responsibilities for PHC to local governments, secondary care to
states, and tertiary care to the federal government. However, federal-level parastatals—for example, the
National Primary Health Care Development Agency—are involved in the development and provision of
PHC services. Although national policies, formulated by the Federal Ministry of Health, provide some
level of standardization, each level is largely autonomous in the financing and management of services
under its jurisdiction.
The PHC facilities are the communities’ entry points into the healthcare system. They include health
centers (HCs) and clinics, dispensaries, and health posts (HPs) which typically provide general
preventive, curative, promotive, and pre-referral care. PHC facilities are typically staffed by nurses,
community health officers (CHOs), CHEWs, junior CHEWs, and environmental health officers. Local
Government Areas (LGAs) finance and manage PHC services under the supervisory oversight of the
state government.3
1.2. The Goal and Objectives of the Saving Mothers, Giving Life Program in Nigeria
Goal: In collaboration with host governments and other stakeholders, the SMGL Initiative is committed
to accelerating the reduction in maternal and newborn mortality. In line with this commitment, the
SMGL program interventions in Nigeria are expected to lead to a 15% reduction in maternal mortality
ratio and a 10% reduction in neonatal mortality rate in the intervention areas of Cross River State (CRS)
at the end of the first two years of program implementation (that is, at the end of September 2017).
Objectives:
In line with the overall objective of the SMGL initiative, which is to have every pregnant woman deliver
in a functional healthcare facility attended by skilled birth attendants with access to emergency obstetric
care as needed, the objectives of the SMGL initiative in Nigeria are to:
1. Increase timely utilization of institutional delivery services.
2. Ensure women and their newborns are provided key health services including the use of life-
saving innovations in an integrated manner (e.g., counseling on self-care, knowledge of
danger signs, and the importance of birth preparedness and birth planning; access to HIV counseling
and testing, use of Anti-Retroviral Therapy and PMTCT services; prevention and treatment of
malaria; treatment of anemia; postabortion care; postpartum family planning.
3. Improve the quality of maternity care and institutional delivery services, including emergency
obstetric and newborn care (EmONC).
2 FMOH, 2011. National list of Health Facilities. 3 Federal Ministry of Health, Nigeria and USAID, 2009. Nigeria Health System Assessment, 2008.
13
4. Strengthen the capacity of health system to capture, evaluate, and report on birth outcomes using
community and facility health information systems, and strengthen essential drugs/commodity
logistics systems.
1.3. SMGL Programming Approach
The SMGL interventions aim to increase the coverage and quality of MNH and HIV services with
consequent improvements in health outcomes. In Nigeria, as in other countries, the SMGL district
strengthening approach will address the three delays to women accessing life-saving care. These are the
delays in taking a decision to seek appropriate care, in reaching healthcare provider in a timely manner,
and, in receiving quality respectful care at the facility, with a special focus on the time of labor, delivery,
and the first 48 hours postpartum. In addition, SMGL will provide technical assistance at the national
level to support updating of policies and standards by government, adaptation of training materials, and
training of national master trainers on high-impact interventions. The SMGL activity is intended and
designed to leverage and integrate MNH services with ongoing and planned family planning/reproductive
health/maternal, newborn, and child health and HIV/AIDS programs in CRS, particularly with E2A’s
USAID-funded Nigeria Private Sector PMTCT Plus project and the FHI360-led Strengthening the
Delivery of HIV/AIDS Service project.
The SMGL interventions will be implemented in public, and with additional funding from Merck for
Mothers, private health facilities in the 18 LGAs of CRS from 2015–2017. The selection of CRS for the
implementation of the SMGL initiative entailed the following steps:
1. Selection of states from the PEPFAR Tiers 1 and 2 (top priority, based on desire to build on a
robust PEPFAR platform). Of the 36 states in Nigeria and the Federal Capital Territory (FCT), 8
were in Tiers 1 and 2 Akwa Ibom, Benue, Cross River, FCT, Kaduna, Lagos, Nassarawa, and Rivers.
2. Elimination of 3 states with a level 3 security rating (high risk) (leaving 5 states).
3. Discussions with key stakeholders about programming realities and a review of the epidemiologic
context, which led to the selection of CRS in South-South Nigeria as the most promising location
for SMGL implementation.
To obtain buy-in and stakeholder support at the federal and state levels for the SMGL initiative, a
number of activities were implemented. First, USAID and E2A/SMGL co-hosted a national stakeholders
meeting in Abuja, November 20, 2014, to formally present the SMGL initiative, including E2A’s Health
Facility Assessment (HFA). Participants included staff of the Federal Ministry of Health, CRS Ministry of
Health, donors, professional associations, relevant regulatory bodies and implementing partners engaged
in MNH. Two dissemination meetings were held to present preliminary findings from HFA 1 and 2 and
seek input for specific programming strategies to be implemented based on the results. During the
dissemination/stakeholder meetings, criteria for the selection of program implementation sites were
discussed and approved. At appropriate times during the implementation phase, regular briefings were
planned with relevant stakeholders.
1.4. Maternal, Newborn and Child Health in Cross River State
CRS is a coastal state located in the Niger Delta region of Nigeria. It does not enjoy the huge oil
revenue that accrues to the remaining Niger Delta states. It shares borders with Benue, Akwa-Ibom,
Abia, and Ebonyi States as well as with t Cameroon. While the NMR and MMR are unavailable for CRS,
other relevant statistics from the 2013 DHS describe a slightly better state statistics than national
statistics. For example, the 2013 DHS shows that in CRS, nearly 73% of women seek antenatal care and
73.2% receive Tetanus Toxoid, compared to the national averages of 61% and 53% for antenatal care
and Tetanus Toxoid, respectively. However, only about 40% of all deliveries took place in the health
facilities (about 34% in public health facilities and 6% in the private health facilities). Among those not
14
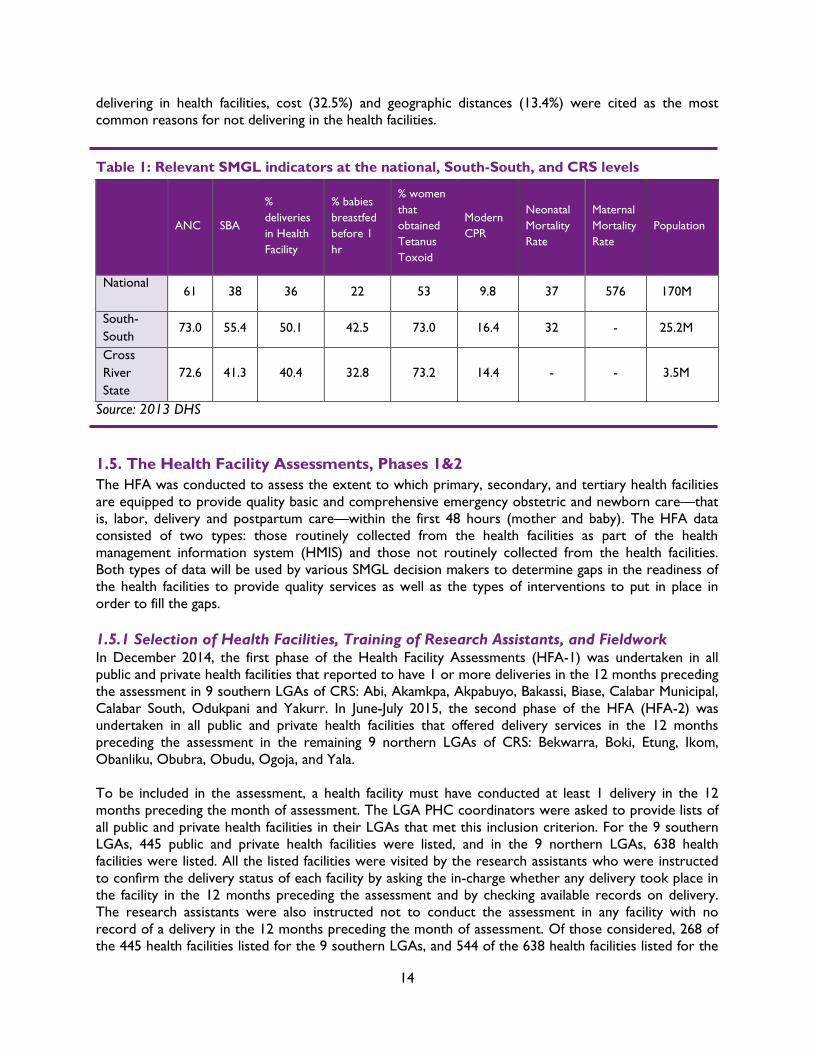
delivering in health facilities, cost (32.5%) and geographic distances (13.4%) were cited as the most
common reasons for not delivering in the health facilities.
Table 1: Relevant SMGL indicators at the national, South-South, and CRS levels
ANC SBA
%
deliveries
in Health
Facility
% babies
breastfed
before 1
hr
% women
that
obtained
Tetanus
Toxoid
Modern
CPR
Neonatal
Mortality
Rate
Maternal
Mortality
Rate
Population
National
61 38 36 22 53 9.8 37 576 170M
South-
South 73.0 55.4 50.1 42.5 73.0 16.4 32 - 25.2M
Cross
River
State
72.6 41.3 40.4 32.8 73.2 14.4 - - 3.5M
Source: 2013 DHS
1.5. The Health Facility Assessments, Phases 1&2
The HFA was conducted to assess the extent to which primary, secondary, and tertiary health facilities
are equipped to provide quality basic and comprehensive emergency obstetric and newborn care—that
is, labor, delivery and postpartum care—within the first 48 hours (mother and baby). The HFA data
consisted of two types: those routinely collected from the health facilities as part of the health
management information system (HMIS) and those not routinely collected from the health facilities.
Both types of data will be used by various SMGL decision makers to determine gaps in the readiness of
the health facilities to provide quality services as well as the types of interventions to put in place in
order to fill the gaps.
1.5.1 Selection of Health Facilities, Training of Research Assistants, and Fieldwork In December 2014, the first phase of the Health Facility Assessments (HFA-1) was undertaken in all
public and private health facilities that reported to have 1 or more deliveries in the 12 months preceding
the assessment in 9 southern LGAs of CRS: Abi, Akamkpa, Akpabuyo, Bakassi, Biase, Calabar Municipal,
Calabar South, Odukpani and Yakurr. In June-July 2015, the second phase of the HFA (HFA-2) was
undertaken in all public and private health facilities that offered delivery services in the 12 months
preceding the assessment in the remaining 9 northern LGAs of CRS: Bekwarra, Boki, Etung, Ikom,
Obanliku, Obubra, Obudu, Ogoja, and Yala.
To be included in the assessment, a health facility must have conducted at least 1 delivery in the 12
months preceding the month of assessment. The LGA PHC coordinators were asked to provide lists of
all public and private health facilities in their LGAs that met this inclusion criterion. For the 9 southern
LGAs, 445 public and private health facilities were listed, and in the 9 northern LGAs, 638 health
facilities were listed. All the listed facilities were visited by the research assistants who were instructed
to confirm the delivery status of each facility by asking the in-charge whether any delivery took place in
the facility in the 12 months preceding the assessment and by checking available records on delivery.
The research assistants were also instructed not to conduct the assessment in any facility with no
record of a delivery in the 12 months preceding the month of assessment. Of those considered, 268 of
the 445 health facilities listed for the 9 southern LGAs, and 544 of the 638 health facilities listed for the
15
northern LGAs met the inclusion criterion at the time of assessment. Consequently, the HFA was
undertaken in 812 health facilities in CRS (268 in the southern LGAs and 544 in the northern LGAs).
The HFA 1 & 2 results will inform how the SMGL global programming model will be adapted in both the
Northern and Southern LGAs of CRS. In addition, the results will provide the baseline figures for some
SMGL program performance indicators.
1.5.2 Data Collection Instruments Two instruments were used to collect data—the HFA core questionnaire and the data extraction forms.
The HFA core questionnaire had seven modules: Introduction and Consent; Identification of Facility and
Infrastructure; Human Resources; Maternal and Neonatal Healthcare Medications, Equipment, and
Supplies; EmONC Signal Functions and Other Essential Services; Documents, Protocols and Guidelines;
and, Community Mobilization.
The data extraction form was used to extract relevant SMGL program indicators from the service
delivery monthly summary forms, and maternity and newborn service delivery registers.
SMGL has standard HFA tools used across all three SMGL countries—Uganda, Zambia, and Nigeria—to
permit cross-country comparisons. The shortened core tool was pretested and applied in Nigeria.
1.5.3 The Field Workers The field team members were composed of supervisors and data collectors/research assistants. The
supervisors were selected from a pool of mid-level health officials from the Ministry of Health, other
relevant government departments, and the Association of Private Medical Practice Medical Practitioners
of Nigeria (AGPMPN). The LGA PHC coordinators were also involved in identifying the field workers.
For each phase of the assessment, there were nine supervisors (one for each local government area). In
addition, a lead supervisor was recruited to oversee the implementation of each phase of the HFA. The
data collectors consisted of recent graduates from tertiary institutions in Nigeria who were on national
service (youth corps) and others with some survey experience.
1.5.4 Training of Field Workers For each phase of the HFA, the research assistants (supervisors and data collectors) were trained to
improve their interviewing skills as well as their ability to conduct health facility inventories, observe
physical conditions of the health facilities, and extract relevant maternal and newborn performance
indicators from the monthly summary forms and labor and delivery register. For HFA 1, a four-day
training, consisting of plenary sessions, small group discussions and practice was conducted. For HFA 2,
which included several questions from the Health Finance and Governance project,4 a five-day general
training of field workers was preceded by a two-day training of supervisors, aimed at preparing the
supervisors to effectively lead their teams. In order to assess level of understanding and promote
participation, supervisors were assigned sessions to lead under the guidance of the facilitators (E2A M&E
staff). Both the two-day training of supervisors and the five-day training of all field workers consisted of
plenary sessions, small group discussions and practice. In addition, the general training included field
practice. The HFA I training was supported by SMGL Uganda staff to encourage “South-to-South”
collaboration.
1.5.5 Data Collection For each phase of the HFA, data collection started the week after the training. For the nine southern
LGAs, data collection started on December 1, 2014 and ended about December 19, 2014. For the nine
4 USAID Nigeria asked E2A to integrate some Health Finance and Governance project questions into the HFA-2
questionnaire to avoid multiple assessment visits to the same HFs within a short period of time.
16
northern LGAs, data collection started on June 15, 2015 and ended around July 10, 2015. Nine teams of
fieldworkers were deployed for each phase, representing one team per LGA. The size of each team was
determined by the estimated number of facilities to be assessed, with LGAs with more health facilities
having bigger teams. Data were collected using the HFA core questionnaire and the data extraction
form. In addition, supervisors and team members obtained geographic information system (GIS)
coordinates of each facility to determine the spatial distribution of the health facilities. The supervisors
reviewed completed tools for data quality daily—in the field for completeness and later in the evening to
identify any data inconsistencies. The lead supervisor did a second-level review of completed forms and
recommended follow-up actions as necessary.
1.5.6 Data Quality Assurance Several quality-assurance measures were adopted to ensure that data were of high quality. In addition to
the training described above, supervisors and E2A/Pathfinder staff monitored the fieldwork to ensure
completeness of data and ensure adherence to assessment guidelines. A data quality consultant also
collected data independently in randomly selected facilities and his data were not significantly different
from those earlier collected by the field workers. Field teams also met daily to review their work,
discuss problems and challenges, explore ways to improve data-collection activities, and plan work for
the following day.
1.5.7 Data Entry and Analysis For the HFA core questionnaire, a data-entry template was developed in CSPro by Auricle Services,
Nigeria. The data-entry screens were made to mirror the questionnaires to facilitate speedy and
accurate data entry. Double entry was done for about 20% of the facilities. Once the data for all the
assessed facilities were completely entered electronically, the CSPro dataset was converted to SPSS. For
HFA 1, the data collected through the data extraction form were entered in Excel. However, based on
the challenges encountered in generating relevant tables from the Excel file, Phase II data extraction
form data was entered in CSPro. The CSPro data file was later converted into SPSS.
E2A staff analyzed the data, using a data analysis plan generated by SMGL M&E team for cross-country
standardization, which outlined the type of analysis to be conducted. Frequency tables were generated,
as appropriate, to show the distribution of facilities by variables of interest or level of indicators.
Bivariate analyses explored relationships between variables. E2A staff wrote this report.
1.5.8 Limitations of the Health Facility Assessments Although the HFA is a census of all health facilities that reported 1 or more deliveries in the 12 months
preceding the assessment, our selection might have missed a few facilities that, for one reason or the
other, did not record nor confirm any delivery during the reference period. In addition, there were
several cases of missing data, particularly in the nine northern LGAs, making it difficult to have true
values for some indicators of interest. In several cases, it was difficult to determine whether the missing
values represented ‘not applicable,’ ‘no response’ or ‘non-availability of data’ at the time of the HFA.
Furthermore, the GIS coordinates of a few health facilities, as recorded during the assessments, were
inaccurate. Consequently, the initial GIS mapping showed those facilities to be outside of the LGAs in
which they are physically located. The assessment team was able to fix most of the errors by revisiting
the affected health facilities to retake the GIS coordinates.
17
2. Health Facilities with One or More Deliveries in the 12 Months
Preceding the HFA in Cross River State
The results of the HFA are presented in this and subsequent sections. As indicated above, a census of all
facilities that reported to conduct 1 or more deliveries in the 12 months preceding the HFA was
undertaken. The distribution of health facilities in both the 9 southern and 9 northern LGAs of CRS are
provided below by whether or not they reported to have provided all basic or comprehensive
emergency obstetric and newborn care services in the 12 and 3 months preceding the HFA. The basic
emergency obstetric and newborn care (BEmONC) services consist of the following 7 signal functions:5
parenteral administration of antibiotics; administration of uterotonic drugs (Oxytoxics or Misoprostol);
parenteral anticonvulsants (Magnesium Sulphate); manual removal of placenta; removal of retained
products; assisted vaginal delivery; and newborn resuscitation. BEmONC without the assisted vaginal
delivery (AVD) is labeled as ‘BEmONCwoutAVD’ in this report. The comprehensive emergency
obstetric and newborn care (CEmONC) services consist of the seven BEmONC signal functions and the
following two: cesarean delivery and blood transfusion related to labor and delivery.
2.1 Types of Facilities Assessed
In the 9 southern LGAs, 268 health facilities (237 public and 31 private) reported to have conducted at
least a delivery in the 12 months preceding the HFA (Table 2a). The 237 public health facilities consisted
of 11 hospitals (1 tertiary and 10 secondary), 138 HCs—both basic and comprehensive—and 88 HPs.
The 31 private health facilities consisted of 20 hospitals and 11 HCs. Table 2a shows significant
variations in the numbers of health facilities by LGA, probably due to differences in population sizes and
the rural-urban composition of the LGAs.6 While Calabar municipality had 37 of the 11 public hospitals
and 9 of the 20 private hospitals assessed, Abi and Bakassi had neither public nor private hospitals that
reported to conduct at least a delivery in the 12 months preceding the HFA. And, 14 of the 20 private
hospitals were located in Calabar municipality and Calabar South with the remaining 6 distributed as
follows: Akampa, 2; Odukpani, 1; and Yakurr, 3. While all the LGAs had some type of public health
facilities, 4 of the LGAs—Abi, Akpabuyo, Bakassi, and Biase—did not have any private facility, hospital or
HC, which conducted at least a delivery in the twelve months preceding the assessment.
In the 9 northern LGAs, 544 health facilities (491 public and 53 private) that reported to conduct
deliveries in the 12 months preceding the HFA were assessed (Table 2b). The 491 public health facilities
consisted of 7 hospitals, 210 health centers (both basic and comprehensive), and 274 HPs. The 53
private health facilities consisted of 33 hospitals and 20 HCs. As observed for the southern LGAs, Table
2b also shows significant variations in the numbers of health facilities by LGA. For instance, there was no
public hospital in Boki, Etung, Ikom, or Obudu LGAs. Of the 33 private hospitals, 13 (39%) were located
in Ikom, 5 (15%) in Ogoja, 5 (15%) in Boki, and 3 (9%) in Obudu, with the remaining LGAs, except
Etung, that had none, having 1 or 2. The number of public HCs ranges from 11 in Etung to 42 in Yala
and the number of private HCs ranges from 0 in Etung and Obudu to 6 inYala. The number of HPs also
ranges from 14 in Ogoja to 49 in Yala.
5 The signal functions are practices or life-saving procedures identified by the United Nations to determine
whether a health facility is providing services that respond to obstetric complications that are responsible for the
majority of direct maternal deaths. 6 Health facilities are usually more concentrated in the urban areas. 7 One of the three hospitals is the University of Calabar Teaching Hospital, the only tertiary health facility in the
state.
18
2.2 Basic and Comprehensive Emergency Obstetric and Newborn Care Services:
In Nigeria, the HCs are expected to provide BEmONC and hospitals are expected to provide full-scale
CEmONC.8 However, because several HPs reported to have conducted 1 or more deliveries in the 12
months preceding the HFA, they have been included in our analysis (and are expected to provide
delivery services according to national standards).
The Nine Southern LGAs
In the nine southern LGAs, low percentages of health facilities that are expected to perform BEmONC
and CEmONC functions (HCs and hospitals, respectively) reported to actually do so (Table 3a):
Only 9 of 31 hospitals (3 of 11 public hospitals and 6 of 20 private hospitals) reported to
provide CEmONC in the 12-month period before the HFA. Of the 9, 6 (2 of 3 public hospitals
and 4 of 9 private hospitals) were in Calabar. Other hospitals performed a few of the signal
functions expected of them. Five HCs, possibly comprehensive HCs, also reported to provide
CEmONC services in the 12-month reference period. Of these 5, only 1 was a public HC.
Only 2 of 149 HCs, both of them public, reported to provide BEmONC services in the 12-
month period before the HFA. All the others performed 1 or more signal functions with none
reporting to have not performed any signal function in the 12-month period.
Regarding the length of time before the HFA that the BEmONC and CEmONC services were
performed, Table 3a shows that none of the 14 health facilities (9 hospitals and 5 HCs) that
reported to offer CEmONC in the 12-month period before the HFA did so in the 3-month
period before the HFA. Similarly, none of the 5 health facilities (1 hospital and 4 HCs) that
offered BEmONC services in the 12-month period before the HFA did so in the 3-month
period before the HFA. However, almost all the facilities that reported to offer CEmONC or
BEmONC services in the 12-month period before the HFA provided BEmONC without assisted
vaginal delivery in the three-month period before the HFA.
The Nine Northern LGAs
In the 9 northern LGAs, Table 3b shows that few hospitals and HCs reported to offer CEmONC and
BEmONC functions, respectively, in the 12-month period before the HFA:
Only 7 of 40 hospitals (1 of 7 public hospitals and 6 of 33 private hospitals) reported to offer
CEmONC services. Of the 9, 3 (all private) were in Ikom. Other hospitals performed a few of
the signal functions expected of them. Unlike the situation in the southern LGAs, no HC in the
northern LGAs reported to offer CEmONC services.
Only 2 of 230 HCs, both of them public, reported to offer BEmONC services. However, all the
HCs reported to offer 1 or more BEmONC related signal functions with none of them
reporting to have not offered any signal function.
Table 3b shows that 5 of the 6 private hospitals that reported to offer CEmONC services in the
12-month period before the HFA provided the services in the 3-month period before the HFA.
However, neither of the 2 public HCs that reported to perform the BEmONC services in the
12-month period before the HFA did so in the 3-month period before the HFA. Only 1 private
HC provided BEmONC without assisted vaginal delivery in the 3-month period before the HFA.
8 BEmONC and CEmONC statistics were gathered based on the number of signal functions a health facility
reported to have provided in the 12 or 3 months preceding the assessment. A health facility is classified as
providing BEmONC services if it reported to have performed all 7 signal functions associated with BEmONC. To
qualify as a CEmONC health facility, a facility must report to have provided all 9 signal functions associated with
CEmONC. Health facilities that performed all other basic emergency obstetric care functions except assisted
vaginal delivery are classified as BEmONCwoutAVD. The ‘Others category refer to non-EmONC functions.

19
That only a few of the hospitals and HCs offered CEmONC and BEmONC services, respectively, could
be attributed to two factors: low demand for these services; and, lack of capability to offer the services
when demanded. Unfortunately, because we did not collect data on reasons for not providing the
services, we could not say with certainty why several health facilities did not offer them in the 12
months preceding the HFA. This is an issue that should be examined in subsequent rapid assessments of
the facilities selected for program implementation.
20
Table 2a: Distribution of health facilities in the nine southern LGAs of CRS by LGA,
ownership and type of facility, and EmONC status, SMGL HFA, December 2014
Local
Government
Area
EmONC Status
Public Private
All
Hospital
Health
Center
Health
Post Hospital
Health
Center
11 138 88 20 11 268
Nine LGAs
(South)
CEmONC 3 1 0 6 4 14
BEmONC 1 2 0 2 0 5
BEmONCwoutAVD 2 1 0 1 2 6
Others 5 134 88 11 5 243
ABI CEmONC 1 0 0 0 0 1
BEmONC 0 1 0 0 0 1
BEmONCwoutAVD 0 0 0 0 0 0
Others 0 15 27 0 0 42
AKAMKPA CEmONC 0 0 0 0 0 0
BEmONC 0 0 0 0 0 0
BEmONCwoutAVD 0 0 0 0 0 0
Others 1 18 2 2 1 24
AKPABUYO CEmONC 0 0 0 0 0 0
BEmONC 0 0 0 0 0 0
BEmONCwoutAVD 0 0 0 0 0 0
Others 1 13 4 0 0 18
BAKASSI CEmONC 0 0 0 0 1 1
BEmONC 0 0 0 0 0 0
BEmONCwoutAVD 0 0 0 0 0 0
Others 0 12 12 0 0 24
BIASE CEmONC 0 0 0 0 0 0
BEmONC 1 0 0 0 0 1
BEmONCwoutAVD 0 0 0 0 0 0
Others 1 27 26 0 0 54
CALABAR
MUNICIPALITY
CEmONC 2 1 0 4 0 7
BEmONC 0 0 0 1 0 1
BEmONCwoutAVD 1 1 0 0 2 4
Others 0 13 1 4 1 19
CALABAR
SOUTH
CEmONC 0 0 0 1 2 3
BEmONC 0 0 0 0 0 0
BEmONCwoutAVD 0 0 0 1 0 1
Others 1 4 1 3 3 12
ODUKPANI CEmONC 0 0 0 0 0 0
BEmONC 0 1 0 0 0 1
BEmONCwoutAVD 0 0 0 0 0 0
Others 1 17 3 1 0 22
YAKURR CEmONC 0 0 0 1 1 2
BEmONC 0 0 0 1 0 1
BEmONCwoutAVD 1 0 0 0 0 1
Others 0 15 12 1 0 28

21
Table 2b: Distribution of health facilities in the nine northern LGAs of CRS by LGA,
ownership and type of facility, and EmONC status, SMGL HFA, June 2015
Local
Government
Area
EmONC Status
Public Private
All
Hospital
Health
Center
Health
Post Hospital
Health
Center
7 210 274 33 20 544
Nine LGAs
(North)
CEmONC 1 0 0 6 0 7
BEmONC 0 2 0 2 0 4
BEmONCwoutAVD 2 2 1 7 1 13
Others 4 206 273 18 19 520
BEKWARRA
CEmONC 1 0 0 0 0 1
BEmONC 0 1 0 0 0 1
BEmONCwoutAVD 0 0 0 0 1 1
Others 0 14 37 1 3 55
BOKI
CEmONC 0 0 0 1 0 1
BEmONC 0 0 0 1 0 1
BEmONCwoutAVD 0 0 0 1 0 1
Others 0 40 34 2 1 77
OGOJA
CEmONC 0 0 0 1 0 1
BEmONC 0 0 0 0 0 0
BEmONCwoutAVD 1 0 0 0 0 1
Others 0 26 14 4 1 45
ETUNG
CEmONC 0 0 0 0 0 0
BEmONC 0 0 0 0 0 0
BEmONCwoutAVD 0 0 0 0 0 0
Others 0 11 15 0 0 26
IKOM
CEmONC 0 0 0 3 0 3
BEmONC 0 0 0 1 0 1
BEmONCwoutAVD 0 0 0 2 0 2
Others 0 20 22 7 5 54
OBANLIKU
CEmONC 0 0 0 0 0 0
BEmONC 0 1 0 0 0 1
BEmONCwoutAVD 0 0 1 2 0 3
Others 2 28 23 0 2 55
OBUBRA
CEmONC 0 0 0 0 0 0
BEmONC 0 0 0 0 0 0
BEmONCwoutAVD 0 2 0 1 0 3
Others 1 13 32 1 1 48
OBUDU
CEmONC 0 0 0 1 0 1
BEmONC 0 0 0 0 0 0
BEmONCwoutAVD 0 0 0 1 0 1
Others 0 12 47 1 0 60
YALA CEmONC 0 0 0 0 0 0
BEmONC 0 0 0 0 0 0
BEmONCwoutAVD 1 0 0 0 0 1
Others 1 42 49 2 6 100
22
Table 3a: Number of health facilities in southern LGAs that performed EmONC
functions in the 12 and 3 months preceding assessment by ownership and type of facility,
SMGL HFA, December 2014
EmONC status in
12 months
preceding
assessment
Public Private
All Hospital
Health
Center Health Post Hospital
Health
Center
11 138 88 20 11 268
CEmONC 3 1 0 6 4 14
BEmONC 1 2 0 2 0 5
BEmONCwoutAVD 2 1 0 1 2 6
Others
5 134 88 11 5 243
EmONC status in 3
months preceding
assessment
CEmONC 0 0 0 0 0 0
BEmONC 0 0 0 0 0 0
BEmONCwoutAVD 5 2 0 4 6 17
Others 6 136 88 16 5 251
Table 3b: Number of health facilities in northern LGAs that performed EmONC
functions in the 12 and 3 months preceding assessment by ownership and type of facility,
SMGL HFA, June 2015
EmONC Status in
12 months
preceding
assessment
Public Private
All Hospital
Health
Center Health Post Hospital
Health
Center
7 210 274 33 20 544
CEmONC 1 0 0 6 0 7
BEmONC 0 2 0 2 0 4
BEmONCwoutAVD 2 2 1 7 1 13
Others
4 206 273 18 19 520
EMONC Status in 3
months preceding
assessment
CEmONC 0 0 0 5 0 5
BEmONC 0 0 0 1 0 1
BEmONCwoutAVD 1 0 0 7 1 9
Others 6 210 274 20 19 529
23
3. The Signal Functions
The preceding section shows that low percentages of hospitals and HCs reported to provide CEmONC
and BEmONC services, respectively, in the 12-month period before the HFA:
Only 16 hospitals (9 from the southern LGAs and 7 from the northern LGAs) and 5 HCs (all from
the southern LGAs) reported to provide CEmONC services; and,
Five hospitals (3 from the southern LGAs and 2 from the northern LGAs) and only 4 HCs (2 each
from the southern and northern LGAs) provided BEmONC services.
Although only a few hospitals and HCs reported to provide CEmONC and BEmONC services,
respectively, no hospital or HC reported to have not performed at least 1 signal function in the 12
months preceding the HFA. Consequently, we examine the extent to which each signal function was
performed in the 2 reference periods: the 12-month and 3-month periods before the HFA.
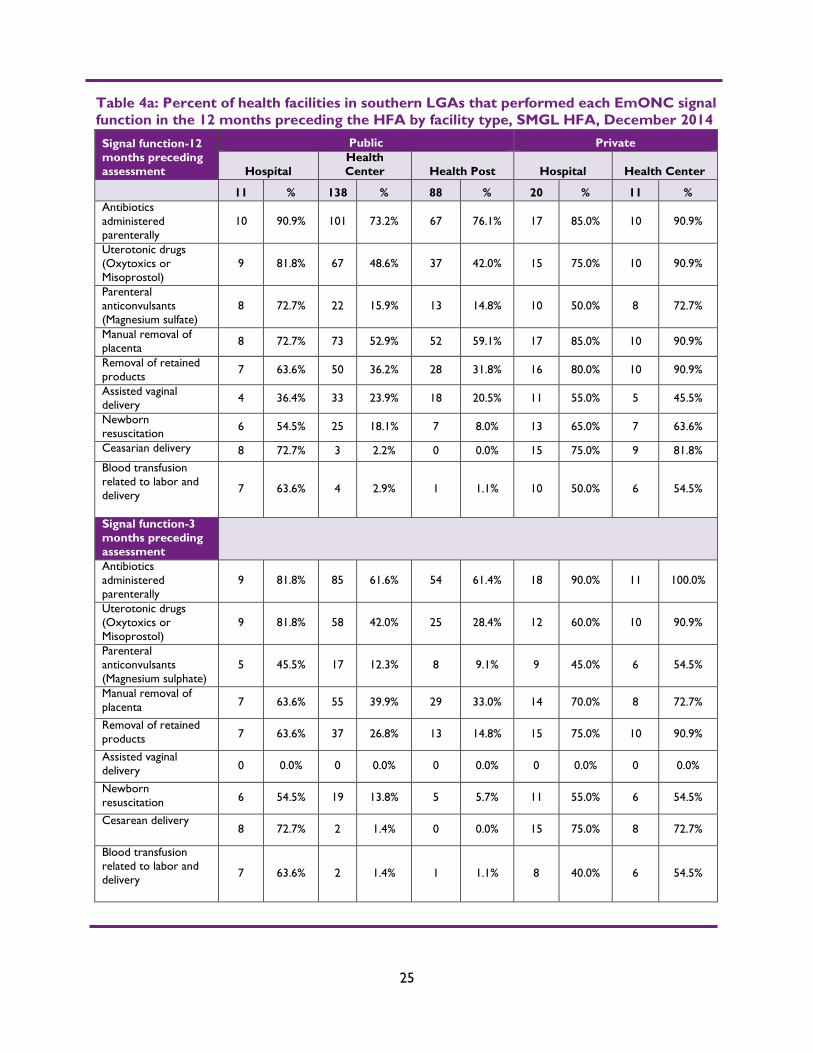
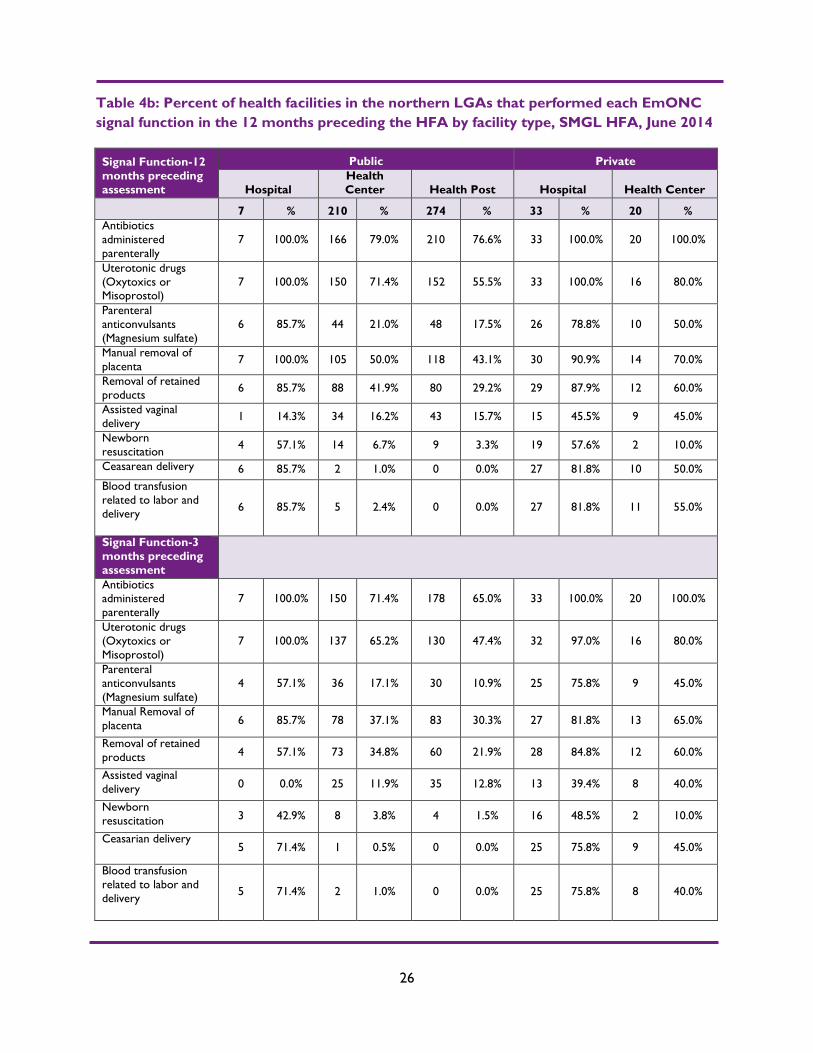
The percentages of health facilities that reported to provide each of the 9 signal functions are presented
in Table 4a and Figure 1a (for the 9 southern LGAs) and Table 4b and Figure 1 (for the 9 northern
LGAs).
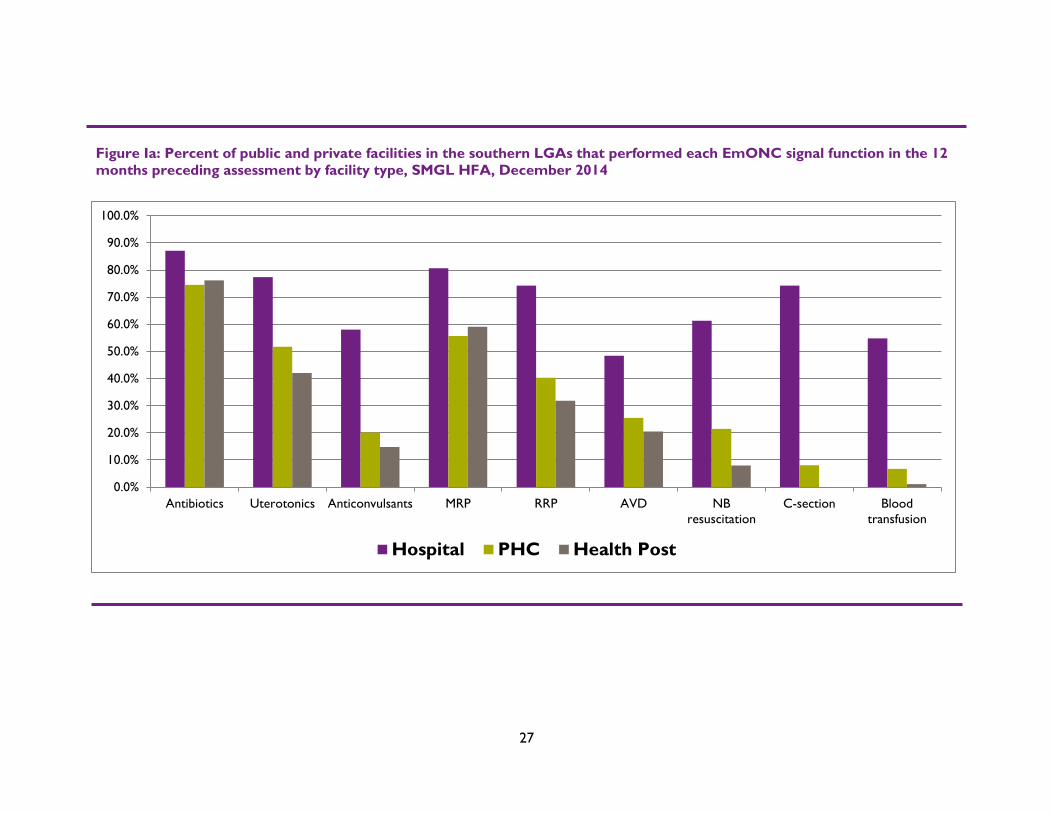
Table 4a and Figure 1a show that in the 9 southern LGAs:
No individual function was performed by all hospitals, HCs or HPs, public or private, in the 12-
month period before the HFA. As we stated earlier, we do not have the data to determine why the
functions were not performed. The functions might not have been performed because they were
not demanded or because the health facilities lacked the capability to provide them. Further
assessments should shed more light on this.
Among public health facilities, both in the 12- and 3-month periods before the HFA, the hospitals
were most likely to perform each signal function with the HCs and the HPs almost equally likely9 to
perform them. Among the public hospitals, the 2 most commonly reported signal functions for the
12-month period are parenteral administration of antibiotics (90%) and administration of uterotonic
drugs—oxytoxics or misoprostol (82%).10 The two least-reported signal functions are newborn
resuscitation (55%) and assisted vaginal delivery (36%). Among the public HCs and HPs, the 2 most
commonly reported of the 7 BEmONC functions expected to be performed are parenteral
administration of antibiotics (73% HCs and 76% HPs) and manual removal of placenta (53% HCs and
59% HPs). The two least-reported BEmONC functions are parenteral anticonvulsants (16% HC and
15% HPs) and newborn resuscitation (18% HCs and 8% HPs). The patterns are the same for the 3-
month period before the HFA.
The private hospitals and HCs were equally likely to perform 5 of the signal functions in the 12
months preceding the HFA. While a higher percentage of private hospitals reported to have assisted
vaginal delivery (55% hospitals and 46% HCs), higher percentages of private HCs reported to have
administered uterotonic drugs (75% hospitals and 91% HCs); administered parenteral anticonvulsants
(50% hospitals and 73% PHCs); and removed retained products (80% hospitals, 91% PHCs). The most
commonly reported signal functions conducted by the private hospitals in the 12-month reference
period are parenteral administration of antibiotics (85%), manual removal of placenta (85%), and removal
of retained products (80%). The least-reported signal functions are parenteral anticonvulsants and blood
transfusion related to labor and delivery (50% each). Almost all the private HCs (10 of 11) reported to
have provided the following services in the 12-month reference period: parenteral administration of
antibiotics, administration of uterotonic drugs (oxytoxics or misoprostol), manual removal of placenta
and removal of retained products. More facilities reported to have conducted caesarian delivery than
transfused blood. The percentages performing these functions remained the same for the 3-month
9 Equally likely if the difference between the percentage points is less than 10%.
10 The percentages were rounded off to the nearest whole umber (upward/downward).
24
period before the HFA with the exception of manual removal of placenta (8 of 11) and antibiotics
administered (11 of 11).
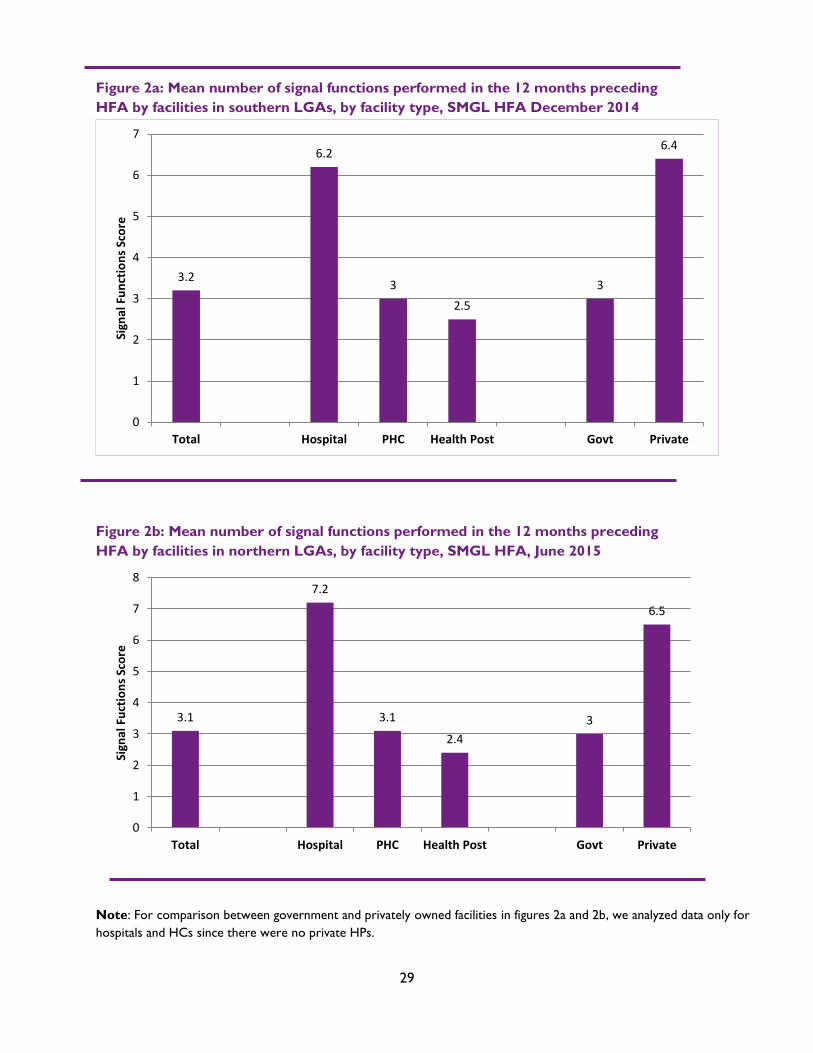
Figure 2a shows that in the southern LGAs, the mean numbers of signal function performed in the 12
months preceding the HFA is higher among private health facilities11 (3 public hospitals and HCs vs. 6.4
private hospitals and HCs), implying that, on average, private hospitals and HCs performed more signal
functions than public hospitals and HCs.
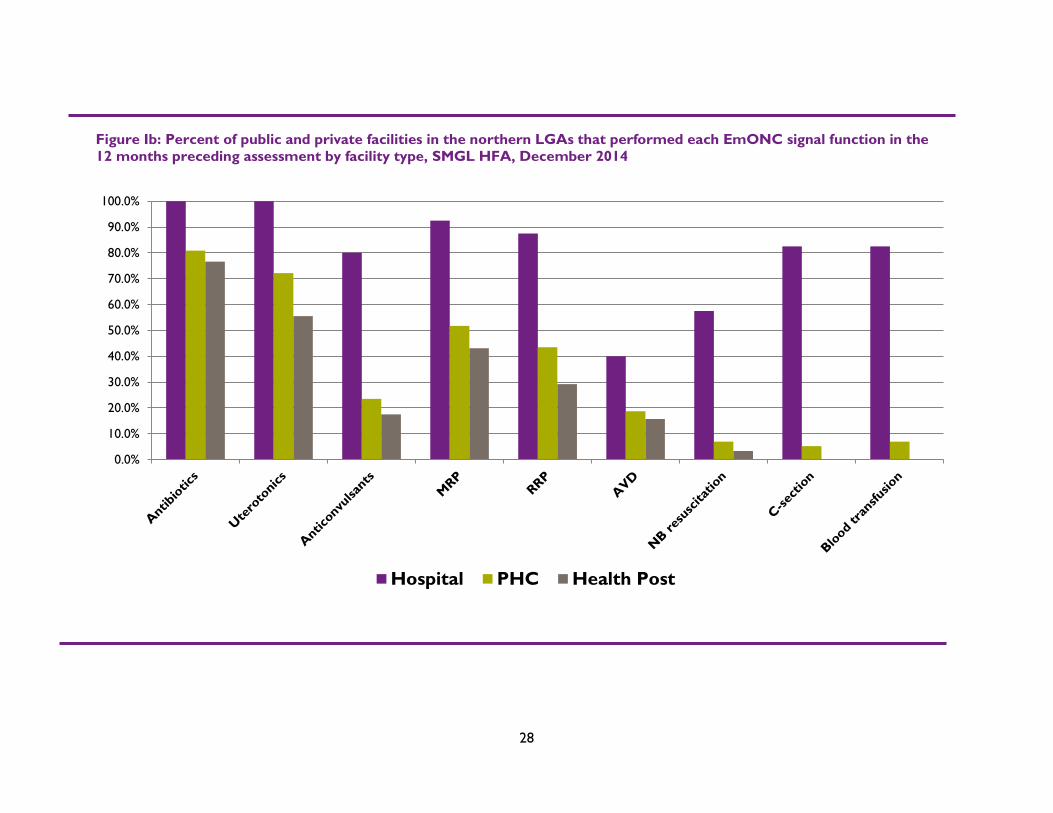
For the 9 northern LGAs, Table 4b and Figure 1b show that:
Unlike in the southern LGAs where no individual signal function was reported to have been
performed by all hospitals or PHCs, in the northern LGAs, there are a few signal functions that all
hospitals or HCs reported to have performed in the 12- or 3-month period before the HFA.
However, the data still show major deficiencies in the amount of emergency obstetric and newborn
services provided across types of health facilities.
Among the public health facilities, both in the 12- and 3-month reference periods, the hospitals were
most likely to perform each signal function with the HCs and the HPs almost equally likely12 to
perform each signal function. Among the public hospitals, the three most commonly reported signal
functions for the 12-month period are parenteral administration of antibiotics, administration of
uterotonic drugs (oxytoxics or misoprostol) and manual removal of placenta, each of which was
reported by the 7 public hospitals. The two least-reported signal functions are newborn
resuscitation (57%) and assisted vaginal delivery (14%). Among the public HCs and HPs, the 3 most
commonly reported of the 7 BEmONC functions expected to be performed are parenteral
administration of antibiotics (79% HCs and 77% HPs), administration of uterotonic drugs—oxytoxics
or misoprostol (71% HCs and 56% HPs), and manual removal of placenta (50% HCs and 43% HPs).
The two least-reported BEmONC functions are assisted vaginal delivery (16% HCs and 16% HPs)
\and newborn resuscitation (7%2 HCs and 3% HPs). The patterns are the same for the 3-month
period before the HFA.
The private hospitals were also more likely than the private HCs to perform the signal functions,
both in the 12- and 3-month periods. The three most commonly reported signal functions by the
private hospitals and HCs are parenteral administration of antibiotics (100% hospital, 100% HC),
administration of uterotonic drugs—oxytoxics or misoprostol (100% hospital and 80% HCs), and
manual removal of placenta (91%, hospital and 70%, HCs). The least-reported signal functions are
newborn resuscitation (58% hospital, 10% HCs) and assisted vaginal delivery (46% hospital, 45%
HCs).
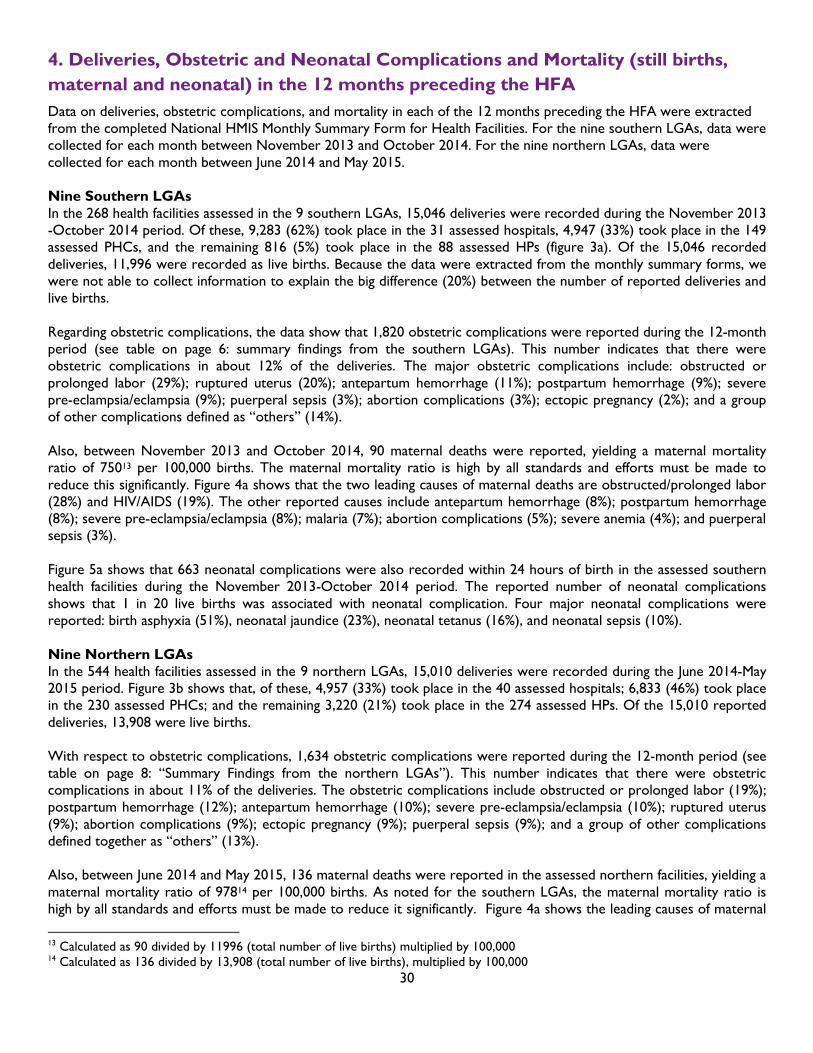
Figure 2b also shows that the mean number of signal functions performed in the 12 months preceding
the HFA is higher among privately owned health facilities (3 public hospitals and HCs vs. 6.5 private
hospitals and HCs).
11
Since there were no private HPs, the comparison between government and privately owned facilities is limited
to hospitals and health centers. 12
Equally likely if the difference between the percentage points is less than 10%
25
Table 4a: Percent of health facilities in southern LGAs that performed each EmONC signal
function in the 12 months preceding the HFA by facility type, SMGL HFA, December 2014
Signal function-12
months preceding
assessment
Public Private
Hospital
Health
Center Health Post Hospital Health Center
11 % 138 % 88 % 20 % 11 %
Antibiotics
administered
parenterally
10 90.9% 101 73.2% 67 76.1% 17 85.0% 10 90.9%
Uterotonic drugs
(Oxytoxics or
Misoprostol)
9 81.8% 67 48.6% 37 42.0% 15 75.0% 10 90.9%
Parenteral
anticonvulsants
(Magnesium sulfate)
8 72.7% 22 15.9% 13 14.8% 10 50.0% 8 72.7%
Manual removal of placenta
8 72.7% 73 52.9% 52 59.1% 17 85.0% 10 90.9%
Removal of retained
products 7 63.6% 50 36.2% 28 31.8% 16 80.0% 10 90.9%
Assisted vaginal
delivery 4 36.4% 33 23.9% 18 20.5% 11 55.0% 5 45.5%
Newborn
resuscitation 6 54.5% 25 18.1% 7 8.0% 13 65.0% 7 63.6%
Ceasarian delivery 8 72.7% 3 2.2% 0 0.0% 15 75.0% 9 81.8%
Blood transfusion
related to labor and
delivery
7 63.6% 4 2.9% 1 1.1% 10 50.0% 6 54.5%
Signal function-3
months preceding
assessment
Antibiotics
administered
parenterally
9 81.8% 85 61.6% 54 61.4% 18 90.0% 11 100.0%
Uterotonic drugs
(Oxytoxics or
Misoprostol)
9 81.8% 58 42.0% 25 28.4% 12 60.0% 10 90.9%
Parenteral
anticonvulsants
(Magnesium sulphate)
5 45.5% 17 12.3% 8 9.1% 9 45.0% 6 54.5%
Manual removal of
placenta 7 63.6% 55 39.9% 29 33.0% 14 70.0% 8 72.7%
Removal of retained
products 7 63.6% 37 26.8% 13 14.8% 15 75.0% 10 90.9%
Assisted vaginal
delivery 0 0.0% 0 0.0% 0 0.0% 0 0.0% 0 0.0%
Newborn
resuscitation 6 54.5% 19 13.8% 5 5.7% 11 55.0% 6 54.5%
Cesarean delivery 8 72.7% 2 1.4% 0 0.0% 15 75.0% 8 72.7%
Blood transfusion
related to labor and
delivery
7 63.6% 2 1.4% 1 1.1% 8 40.0% 6 54.5%
26
Table 4b: Percent of health facilities in the northern LGAs that performed each EmONC
signal function in the 12 months preceding the HFA by facility type, SMGL HFA, June 2014
Signal Function-12
months preceding
assessment
Public Private
Hospital
Health
Center Health Post Hospital Health Center
7 % 210 % 274 % 33 % 20 %
Antibiotics
administered
parenterally
7 100.0% 166 79.0% 210 76.6% 33 100.0% 20 100.0%
Uterotonic drugs
(Oxytoxics or Misoprostol)
7 100.0% 150 71.4% 152 55.5% 33 100.0% 16 80.0%
Parenteral
anticonvulsants
(Magnesium sulfate)
6 85.7% 44 21.0% 48 17.5% 26 78.8% 10 50.0%
Manual removal of
placenta 7 100.0% 105 50.0% 118 43.1% 30 90.9% 14 70.0%
Removal of retained
products 6 85.7% 88 41.9% 80 29.2% 29 87.9% 12 60.0%
Assisted vaginal
delivery 1 14.3% 34 16.2% 43 15.7% 15 45.5% 9 45.0%
Newborn
resuscitation 4 57.1% 14 6.7% 9 3.3% 19 57.6% 2 10.0%
Ceasarean delivery 6 85.7% 2 1.0% 0 0.0% 27 81.8% 10 50.0%
Blood transfusion
related to labor and
delivery
6 85.7% 5 2.4% 0 0.0% 27 81.8% 11 55.0%
Signal Function-3
months preceding
assessment
Antibiotics administered
parenterally
7 100.0% 150 71.4% 178 65.0% 33 100.0% 20 100.0%
Uterotonic drugs
(Oxytoxics or
Misoprostol)
7 100.0% 137 65.2% 130 47.4% 32 97.0% 16 80.0%
Parenteral
anticonvulsants
(Magnesium sulfate)
4 57.1% 36 17.1% 30 10.9% 25 75.8% 9 45.0%
Manual Removal of
placenta 6 85.7% 78 37.1% 83 30.3% 27 81.8% 13 65.0%
Removal of retained
products 4 57.1% 73 34.8% 60 21.9% 28 84.8% 12 60.0%
Assisted vaginal
delivery 0 0.0% 25 11.9% 35 12.8% 13 39.4% 8 40.0%
Newborn
resuscitation 3 42.9% 8 3.8% 4 1.5% 16 48.5% 2 10.0%
Ceasarian delivery 5 71.4% 1 0.5% 0 0.0% 25 75.8% 9 45.0%
Blood transfusion
related to labor and
delivery
5 71.4% 2 1.0% 0 0.0% 25 75.8% 8 40.0%
27
Figure Ia: Percent of public and private facilities in the southern LGAs that performed each EmONC signal function in the 12
months preceding assessment by facility type, SMGL HFA, December 2014
0.0%
10.0%
20.0%
30.0%
40.0%
50.0%
60.0%
70.0%
80.0%
90.0%
100.0%
Antibiotics Uterotonics Anticonvulsants MRP RRP AVD NB
resuscitation
C-section Blood
transfusion
Hospital PHC Health Post
28
0.0%
10.0%
20.0%
30.0%
40.0%
50.0%
60.0%
70.0%
80.0%
90.0%
100.0%
Hospital PHC Health Post
Figure Ib: Percent of public and private facilities in the northern LGAs that performed each EmONC signal function in the
12 months preceding assessment by facility type, SMGL HFA, December 2014
29
Figure 2a: Mean number of signal functions performed in the 12 months preceding
HFA by facilities in southern LGAs, by facility type, SMGL HFA December 2014
Figure 2b: Mean number of signal functions performed in the 12 months preceding
HFA by facilities in northern LGAs, by facility type, SMGL HFA, June 2015
Note: For comparison between government and privately owned facilities in figures 2a and 2b, we analyzed data only for
hospitals and HCs since there were no private HPs.
3.2
6.2
3
2.5
3
6.4
0
1
2
3
4
5
6
7
Total Hospital PHC Health Post Govt Private
Sign
al F
un
ctio
ns
Sco
re
3.1
7.2
3.1
2.4
3
6.5
0
1
2
3
4
5
6
7
8
Total Hospital PHC Health Post Govt Private
Sign
al F
uct
ion
s Sc
ore
30
4. Deliveries, Obstetric and Neonatal Complications and Mortality (still births,
maternal and neonatal) in the 12 months preceding the HFA
Data on deliveries, obstetric complications, and mortality in each of the 12 months preceding the HFA were extracted
from the completed National HMIS Monthly Summary Form for Health Facilities. For the nine southern LGAs, data were
collected for each month between November 2013 and October 2014. For the nine northern LGAs, data were
collected for each month between June 2014 and May 2015.
Nine Southern LGAs
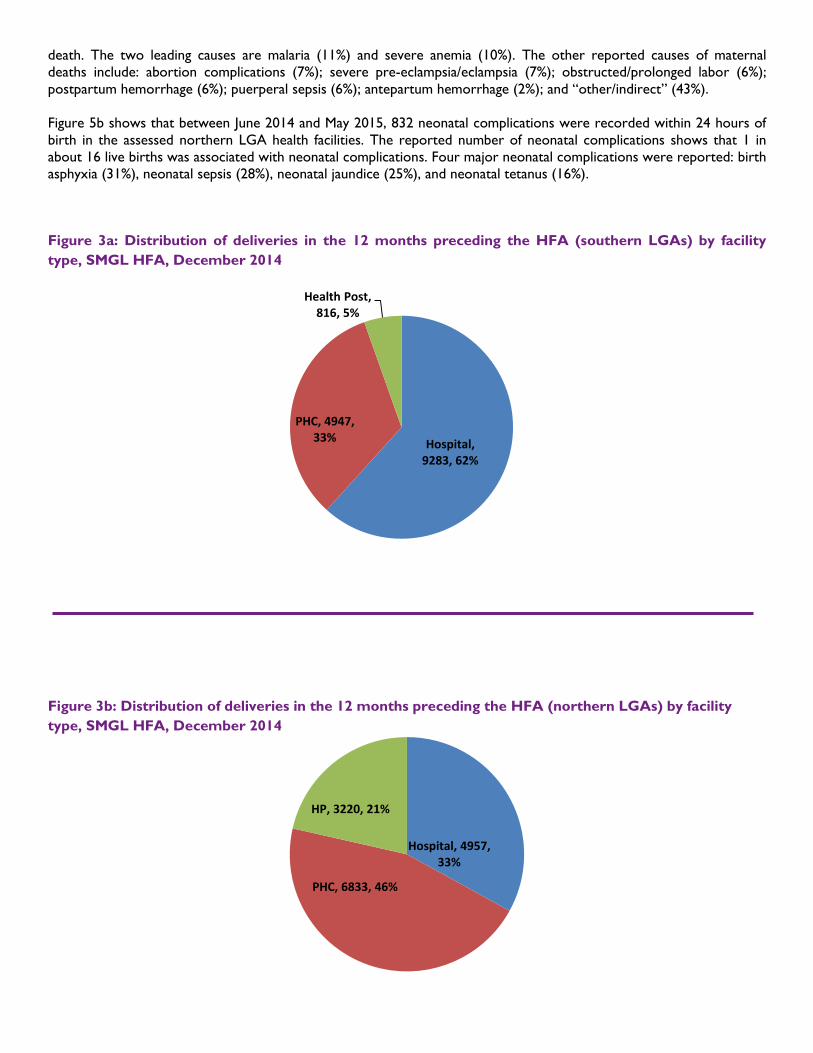
In the 268 health facilities assessed in the 9 southern LGAs, 15,046 deliveries were recorded during the November 2013
-October 2014 period. Of these, 9,283 (62%) took place in the 31 assessed hospitals, 4,947 (33%) took place in the 149
assessed PHCs, and the remaining 816 (5%) took place in the 88 assessed HPs (figure 3a). Of the 15,046 recorded
deliveries, 11,996 were recorded as live births. Because the data were extracted from the monthly summary forms, we
were not able to collect information to explain the big difference (20%) between the number of reported deliveries and
live births.
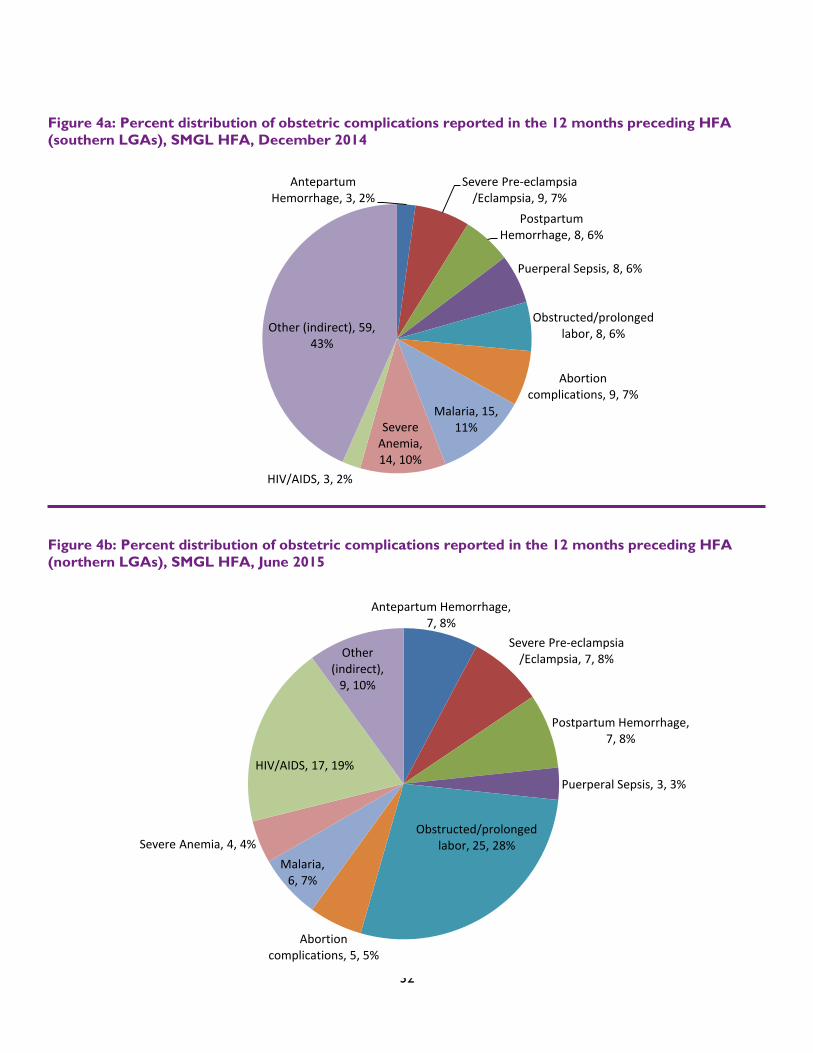
Regarding obstetric complications, the data show that 1,820 obstetric complications were reported during the 12-month
period (see table on page 6: summary findings from the southern LGAs). This number indicates that there were
obstetric complications in about 12% of the deliveries. The major obstetric complications include: obstructed or
prolonged labor (29%); ruptured uterus (20%); antepartum hemorrhage (11%); postpartum hemorrhage (9%); severe
pre-eclampsia/eclampsia (9%); puerperal sepsis (3%); abortion complications (3%); ectopic pregnancy (2%); and a group
of other complications defined as “others” (14%).
Also, between November 2013 and October 2014, 90 maternal deaths were reported, yielding a maternal mortality
ratio of 75013 per 100,000 births. The maternal mortality ratio is high by all standards and efforts must be made to
reduce this significantly. Figure 4a shows that the two leading causes of maternal deaths are obstructed/prolonged labor
(28%) and HIV/AIDS (19%). The other reported causes include antepartum hemorrhage (8%); postpartum hemorrhage
(8%); severe pre-eclampsia/eclampsia (8%); malaria (7%); abortion complications (5%); severe anemia (4%); and puerperal
sepsis (3%).
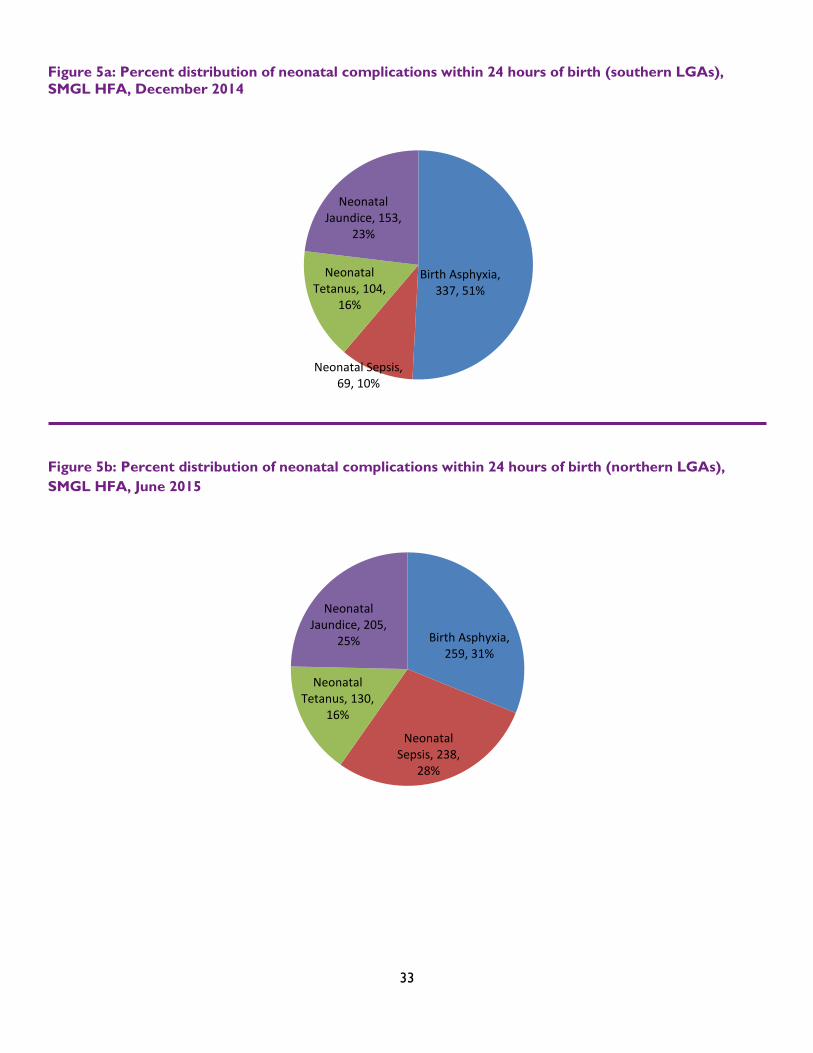
Figure 5a shows that 663 neonatal complications were also recorded within 24 hours of birth in the assessed southern
health facilities during the November 2013-October 2014 period. The reported number of neonatal complications
shows that 1 in 20 live births was associated with neonatal complication. Four major neonatal complications were
reported: birth asphyxia (51%), neonatal jaundice (23%), neonatal tetanus (16%), and neonatal sepsis (10%).
Nine Northern LGAs
In the 544 health facilities assessed in the 9 northern LGAs, 15,010 deliveries were recorded during the June 2014-May
2015 period. Figure 3b shows that, of these, 4,957 (33%) took place in the 40 assessed hospitals; 6,833 (46%) took place
in the 230 assessed PHCs; and the remaining 3,220 (21%) took place in the 274 assessed HPs. Of the 15,010 reported
deliveries, 13,908 were live births.
With respect to obstetric complications, 1,634 obstetric complications were reported during the 12-month period (see
table on page 8: “Summary Findings from the northern LGAs”). This number indicates that there were obstetric
complications in about 11% of the deliveries. The obstetric complications include obstructed or prolonged labor (19%);
postpartum hemorrhage (12%); antepartum hemorrhage (10%); severe pre-eclampsia/eclampsia (10%); ruptured uterus
(9%); abortion complications (9%); ectopic pregnancy (9%); puerperal sepsis (9%); and a group of other complications
defined together as “others” (13%).
Also, between June 2014 and May 2015, 136 maternal deaths were reported in the assessed northern facilities, yielding a
maternal mortality ratio of 97814 per 100,000 births. As noted for the southern LGAs, the maternal mortality ratio is
high by all standards and efforts must be made to reduce it significantly. Figure 4a shows the leading causes of maternal
13 Calculated as 90 divided by 11996 (total number of live births) multiplied by 100,000 14 Calculated as 136 divided by 13,908 (total number of live births), multiplied by 100,000
31
Hospital, 9283, 62%
PHC, 4947, 33%
Health Post, 816, 5%
Hospital, 4957, 33%
PHC, 6833, 46%
HP, 3220, 21%
death. The two leading causes are malaria (11%) and severe anemia (10%). The other reported causes of maternal
deaths include: abortion complications (7%); severe pre-eclampsia/eclampsia (7%); obstructed/prolonged labor (6%);
postpartum hemorrhage (6%); puerperal sepsis (6%); antepartum hemorrhage (2%); and “other/indirect” (43%).
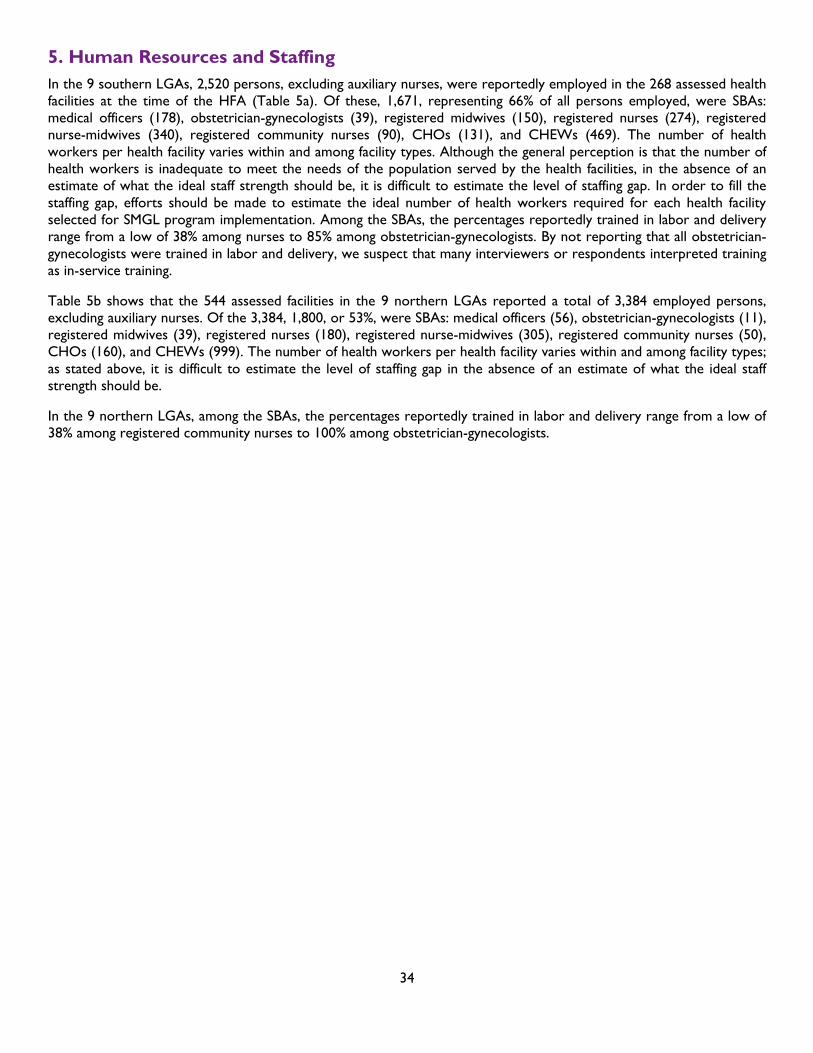
Figure 5b shows that between June 2014 and May 2015, 832 neonatal complications were recorded within 24 hours of
birth in the assessed northern LGA health facilities. The reported number of neonatal complications shows that 1 in
about 16 live births was associated with neonatal complications. Four major neonatal complications were reported: birth
asphyxia (31%), neonatal sepsis (28%), neonatal jaundice (25%), and neonatal tetanus (16%).
Figure 3a: Distribution of deliveries in the 12 months preceding the HFA (southern LGAs) by facility
type, SMGL HFA, December 2014
Figure 3b: Distribution of deliveries in the 12 months preceding the HFA (northern LGAs) by facility
type, SMGL HFA, December 2014
32
Antepartum Hemorrhage, 3, 2%
Severe Pre-eclampsia /Eclampsia, 9, 7%
Postpartum Hemorrhage, 8, 6%
Puerperal Sepsis, 8, 6%
Obstructed/prolonged labor, 8, 6%
Abortion complications, 9, 7%
Malaria, 15, 11% Severe
Anemia, 14, 10%
HIV/AIDS, 3, 2%
Other (indirect), 59, 43%
Figure 4a: Percent distribution of obstetric complications reported in the 12 months preceding HFA
(southern LGAs), SMGL HFA, December 2014
Figure 4b: Percent distribution of obstetric complications reported in the 12 months preceding HFA
(northern LGAs), SMGL HFA, June 2015
Antepartum Hemorrhage
10%
Severe Pre-eclampsia /Eclampsia
10%
Postpartum Hemorrhage
12%
Puerperal Sepsis
9%
Obstructed/prolonged labor 19%
Ruptured Uterus
9%
Abortion complications
9%
Ectopic Pregnancy 9%
Other 13%
Antepartum Hemorrhage, 7, 8%
Severe Pre-eclampsia /Eclampsia, 7, 8%
Postpartum Hemorrhage, 7, 8%
Puerperal Sepsis, 3, 3%
Obstructed/prolonged labor, 25, 28%
Abortion complications, 5, 5%
Malaria, 6, 7%
Severe Anemia, 4, 4%
HIV/AIDS, 17, 19%
Other (indirect),
9, 10%
33
Birth Asphyxia, 259, 31%
Neonatal Sepsis, 238,
28%
Neonatal Tetanus, 130,
16%
Neonatal Jaundice, 205,
25%
Figure 5a: Percent distribution of neonatal complications within 24 hours of birth (southern LGAs),
SMGL HFA, December 2014
Figure 5b: Percent distribution of neonatal complications within 24 hours of birth (northern LGAs),
SMGL HFA, June 2015
Birth Asphyxia, 337, 51%
Neonatal Sepsis, 69, 10%
Neonatal Tetanus, 104,
16%
Neonatal Jaundice, 153,
23%
34
5. Human Resources and Staffing
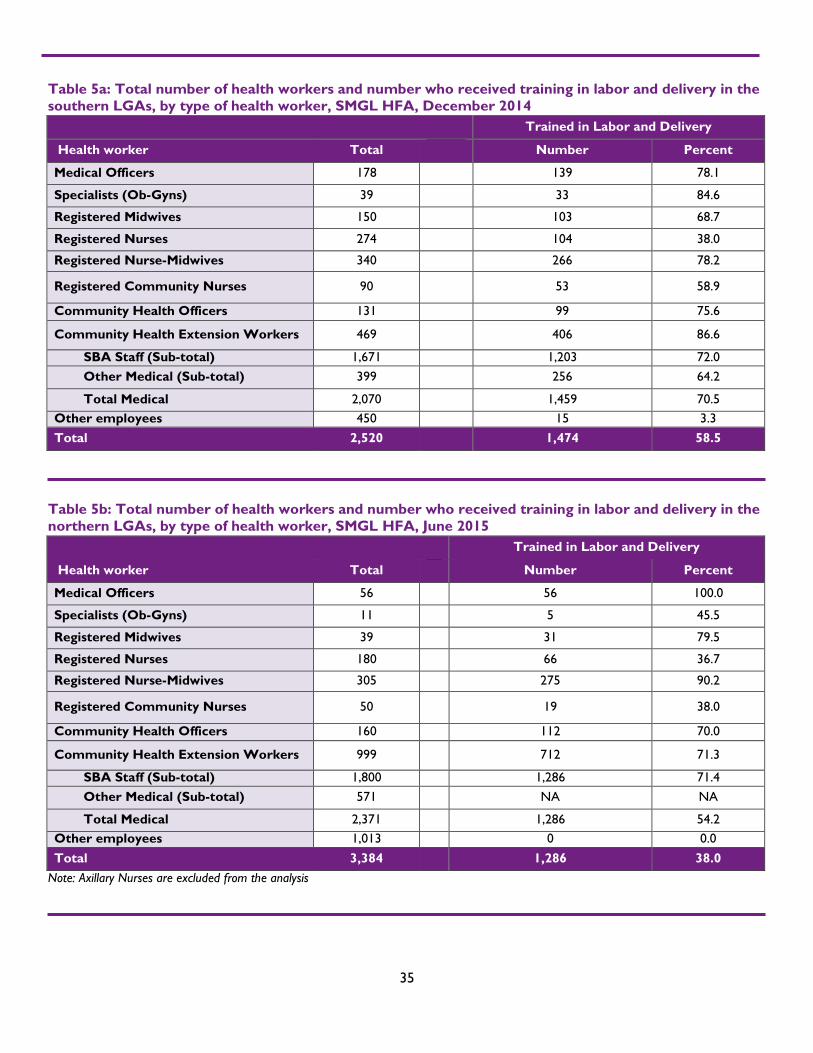
In the 9 southern LGAs, 2,520 persons, excluding auxiliary nurses, were reportedly employed in the 268 assessed health
facilities at the time of the HFA (Table 5a). Of these, 1,671, representing 66% of all persons employed, were SBAs:
medical officers (178), obstetrician-gynecologists (39), registered midwives (150), registered nurses (274), registered
nurse-midwives (340), registered community nurses (90), CHOs (131), and CHEWs (469). The number of health
workers per health facility varies within and among facility types. Although the general perception is that the number of
health workers is inadequate to meet the needs of the population served by the health facilities, in the absence of an
estimate of what the ideal staff strength should be, it is difficult to estimate the level of staffing gap. In order to fill the
staffing gap, efforts should be made to estimate the ideal number of health workers required for each health facility
selected for SMGL program implementation. Among the SBAs, the percentages reportedly trained in labor and delivery
range from a low of 38% among nurses to 85% among obstetrician-gynecologists. By not reporting that all obstetrician-
gynecologists were trained in labor and delivery, we suspect that many interviewers or respondents interpreted training
as in-service training.
Table 5b shows that the 544 assessed facilities in the 9 northern LGAs reported a total of 3,384 employed persons,
excluding auxiliary nurses. Of the 3,384, 1,800, or 53%, were SBAs: medical officers (56), obstetrician-gynecologists (11),
registered midwives (39), registered nurses (180), registered nurse-midwives (305), registered community nurses (50),
CHOs (160), and CHEWs (999). The number of health workers per health facility varies within and among facility types;
as stated above, it is difficult to estimate the level of staffing gap in the absence of an estimate of what the ideal staff
strength should be.
In the 9 northern LGAs, among the SBAs, the percentages reportedly trained in labor and delivery range from a low of
38% among registered community nurses to 100% among obstetrician-gynecologists.
35
Table 5a: Total number of health workers and number who received training in labor and delivery in the
southern LGAs, by type of health worker, SMGL HFA, December 2014
Trained in Labor and Delivery
Health worker Total Number Percent
Medical Officers 178
139 78.1
Specialists (Ob-Gyns) 39
33 84.6
Registered Midwives 150
103 68.7
Registered Nurses 274
104 38.0
Registered Nurse-Midwives 340
266 78.2
Registered Community Nurses 90
53 58.9
Community Health Officers 131
99 75.6
Community Health Extension Workers 469
406 86.6
SBA Staff (Sub-total) 1,671
1,203 72.0
Other Medical (Sub-total) 399
256 64.2
Total Medical 2,070
1,459 70.5
Other employees 450
15 3.3
Total 2,520
1,474 58.5
Table 5b: Total number of health workers and number who received training in labor and delivery in the
northern LGAs, by type of health worker, SMGL HFA, June 2015
Trained in Labor and Delivery
Health worker Total Number Percent
Medical Officers 56 56 100.0
Specialists (Ob-Gyns) 11 5 45.5
Registered Midwives 39 31 79.5
Registered Nurses 180 66 36.7
Registered Nurse-Midwives 305 275 90.2
Registered Community Nurses 50 19 38.0
Community Health Officers 160 112 70.0
Community Health Extension Workers 999 712 71.3
SBA Staff (Sub-total) 1,800 1,286 71.4
Other Medical (Sub-total) 571 NA NA
Total Medical 2,371 1,286 54.2
Other employees 1,013 0 0.0
Total 3,384 1,286 38.0
Note: Axillary Nurses are excluded from the analysis
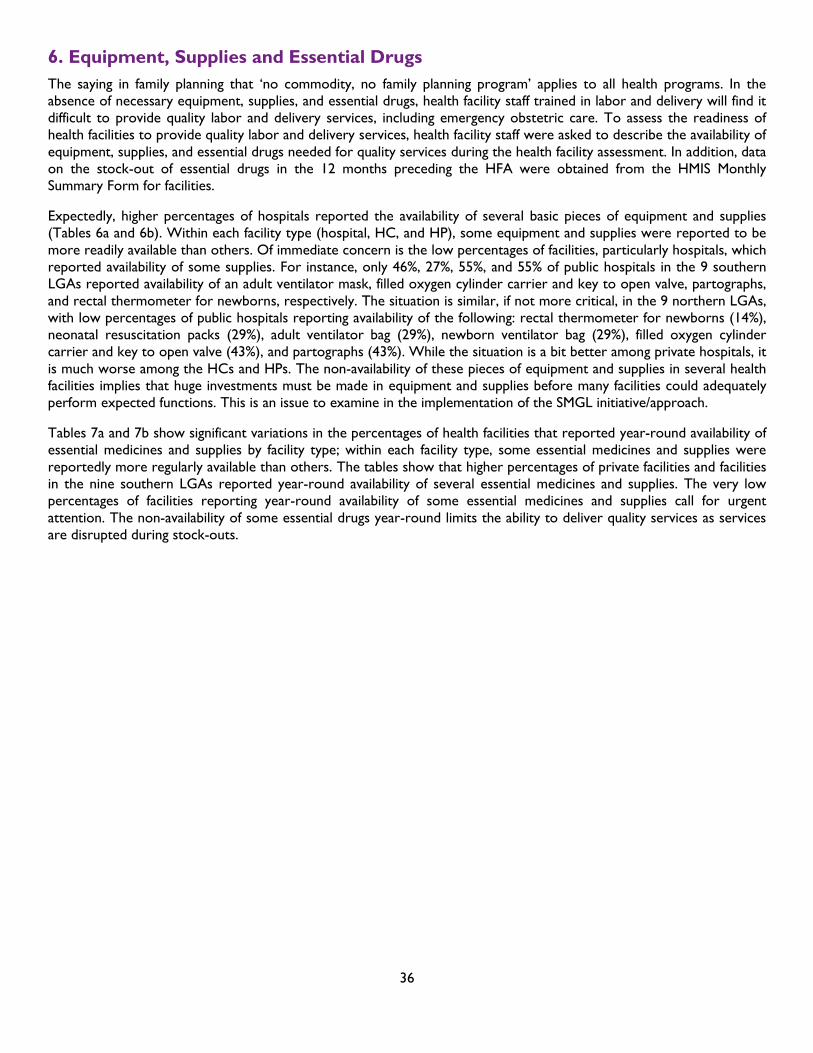
36
6. Equipment, Supplies and Essential Drugs
The saying in family planning that ‘no commodity, no family planning program’ applies to all health programs. In the
absence of necessary equipment, supplies, and essential drugs, health facility staff trained in labor and delivery will find it
difficult to provide quality labor and delivery services, including emergency obstetric care. To assess the readiness of
health facilities to provide quality labor and delivery services, health facility staff were asked to describe the availability of
equipment, supplies, and essential drugs needed for quality services during the health facility assessment. In addition, data
on the stock-out of essential drugs in the 12 months preceding the HFA were obtained from the HMIS Monthly
Summary Form for facilities.
Expectedly, higher percentages of hospitals reported the availability of several basic pieces of equipment and supplies
(Tables 6a and 6b). Within each facility type (hospital, HC, and HP), some equipment and supplies were reported to be
more readily available than others. Of immediate concern is the low percentages of facilities, particularly hospitals, which
reported availability of some supplies. For instance, only 46%, 27%, 55%, and 55% of public hospitals in the 9 southern
LGAs reported availability of an adult ventilator mask, filled oxygen cylinder carrier and key to open valve, partographs,
and rectal thermometer for newborns, respectively. The situation is similar, if not more critical, in the 9 northern LGAs,
with low percentages of public hospitals reporting availability of the following: rectal thermometer for newborns (14%),
neonatal resuscitation packs (29%), adult ventilator bag (29%), newborn ventilator bag (29%), filled oxygen cylinder
carrier and key to open valve (43%), and partographs (43%). While the situation is a bit better among private hospitals, it
is much worse among the HCs and HPs. The non-availability of these pieces of equipment and supplies in several health
facilities implies that huge investments must be made in equipment and supplies before many facilities could adequately
perform expected functions. This is an issue to examine in the implementation of the SMGL initiative/approach.
Tables 7a and 7b show significant variations in the percentages of health facilities that reported year-round availability of
essential medicines and supplies by facility type; within each facility type, some essential medicines and supplies were
reportedly more regularly available than others. The tables show that higher percentages of private facilities and facilities
in the nine southern LGAs reported year-round availability of several essential medicines and supplies. The very low
percentages of facilities reporting year-round availability of some essential medicines and supplies call for urgent
attention. The non-availability of some essential drugs year-round limits the ability to deliver quality services as services
are disrupted during stock-outs.
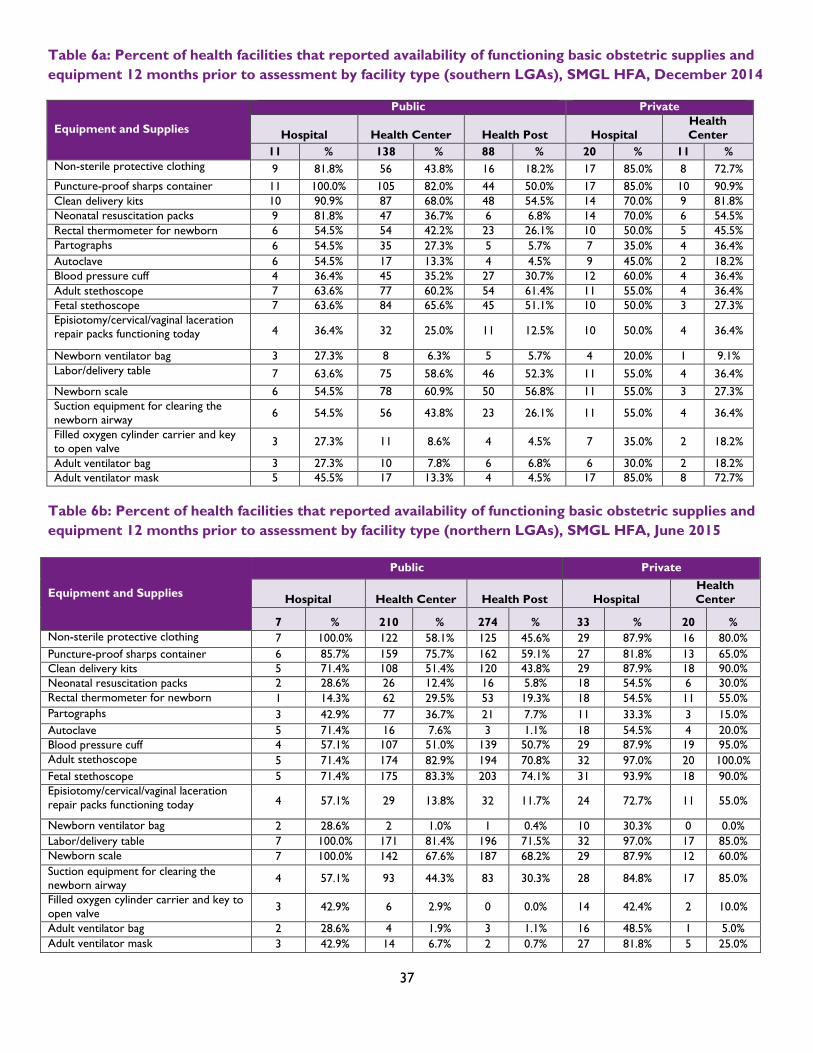
37
Table 6a: Percent of health facilities that reported availability of functioning basic obstetric supplies and
equipment 12 months prior to assessment by facility type (southern LGAs), SMGL HFA, December 2014
Equipment and Supplies
Public Private
Hospital Health Center Health Post Hospital
Health
Center
11 % 138 % 88 % 20 % 11 %
Non-sterile protective clothing 9 81.8% 56 43.8% 16 18.2% 17 85.0% 8 72.7%
Puncture-proof sharps container 11 100.0% 105 82.0% 44 50.0% 17 85.0% 10 90.9%
Clean delivery kits 10 90.9% 87 68.0% 48 54.5% 14 70.0% 9 81.8%
Neonatal resuscitation packs 9 81.8% 47 36.7% 6 6.8% 14 70.0% 6 54.5%
Rectal thermometer for newborn 6 54.5% 54 42.2% 23 26.1% 10 50.0% 5 45.5%
Partographs 6 54.5% 35 27.3% 5 5.7% 7 35.0% 4 36.4%
Autoclave 6 54.5% 17 13.3% 4 4.5% 9 45.0% 2 18.2%
Blood pressure cuff 4 36.4% 45 35.2% 27 30.7% 12 60.0% 4 36.4%
Adult stethoscope 7 63.6% 77 60.2% 54 61.4% 11 55.0% 4 36.4%
Fetal stethoscope 7 63.6% 84 65.6% 45 51.1% 10 50.0% 3 27.3%
Episiotomy/cervical/vaginal laceration
repair packs functioning today 4 36.4% 32 25.0% 11 12.5% 10 50.0% 4 36.4%
Newborn ventilator bag 3 27.3% 8 6.3% 5 5.7% 4 20.0% 1 9.1%
Labor/delivery table 7 63.6% 75 58.6% 46 52.3% 11 55.0% 4 36.4%
Newborn scale 6 54.5% 78 60.9% 50 56.8% 11 55.0% 3 27.3%
Suction equipment for clearing the
newborn airway 6 54.5% 56 43.8% 23 26.1% 11 55.0% 4 36.4%
Filled oxygen cylinder carrier and key
to open valve 3 27.3% 11 8.6% 4 4.5% 7 35.0% 2 18.2%
Adult ventilator bag 3 27.3% 10 7.8% 6 6.8% 6 30.0% 2 18.2%
Adult ventilator mask 5 45.5% 17 13.3% 4 4.5% 17 85.0% 8 72.7%
Table 6b: Percent of health facilities that reported availability of functioning basic obstetric supplies and
equipment 12 months prior to assessment by facility type (northern LGAs), SMGL HFA, June 2015
Equipment and Supplies
Public Private
Hospital Health Center Health Post Hospital
Health
Center
7 % 210 % 274 % 33 % 20 %
Non-sterile protective clothing 7 100.0% 122 58.1% 125 45.6% 29 87.9% 16 80.0%
Puncture-proof sharps container 6 85.7% 159 75.7% 162 59.1% 27 81.8% 13 65.0%
Clean delivery kits 5 71.4% 108 51.4% 120 43.8% 29 87.9% 18 90.0%
Neonatal resuscitation packs 2 28.6% 26 12.4% 16 5.8% 18 54.5% 6 30.0%
Rectal thermometer for newborn 1 14.3% 62 29.5% 53 19.3% 18 54.5% 11 55.0%
Partographs 3 42.9% 77 36.7% 21 7.7% 11 33.3% 3 15.0%
Autoclave 5 71.4% 16 7.6% 3 1.1% 18 54.5% 4 20.0%
Blood pressure cuff 4 57.1% 107 51.0% 139 50.7% 29 87.9% 19 95.0%
Adult stethoscope 5 71.4% 174 82.9% 194 70.8% 32 97.0% 20 100.0%
Fetal stethoscope 5 71.4% 175 83.3% 203 74.1% 31 93.9% 18 90.0%
Episiotomy/cervical/vaginal laceration
repair packs functioning today 4 57.1% 29 13.8% 32 11.7% 24 72.7% 11 55.0%
Newborn ventilator bag 2 28.6% 2 1.0% 1 0.4% 10 30.3% 0 0.0%
Labor/delivery table 7 100.0% 171 81.4% 196 71.5% 32 97.0% 17 85.0%
Newborn scale 7 100.0% 142 67.6% 187 68.2% 29 87.9% 12 60.0%
Suction equipment for clearing the
newborn airway 4 57.1% 93 44.3% 83 30.3% 28 84.8% 17 85.0%
Filled oxygen cylinder carrier and key to
open valve 3 42.9% 6 2.9% 0 0.0% 14 42.4% 2 10.0%
Adult ventilator bag 2 28.6% 4 1.9% 3 1.1% 16 48.5% 1 5.0%
Adult ventilator mask 3 42.9% 14 6.7% 2 0.7% 27 81.8% 5 25.0%
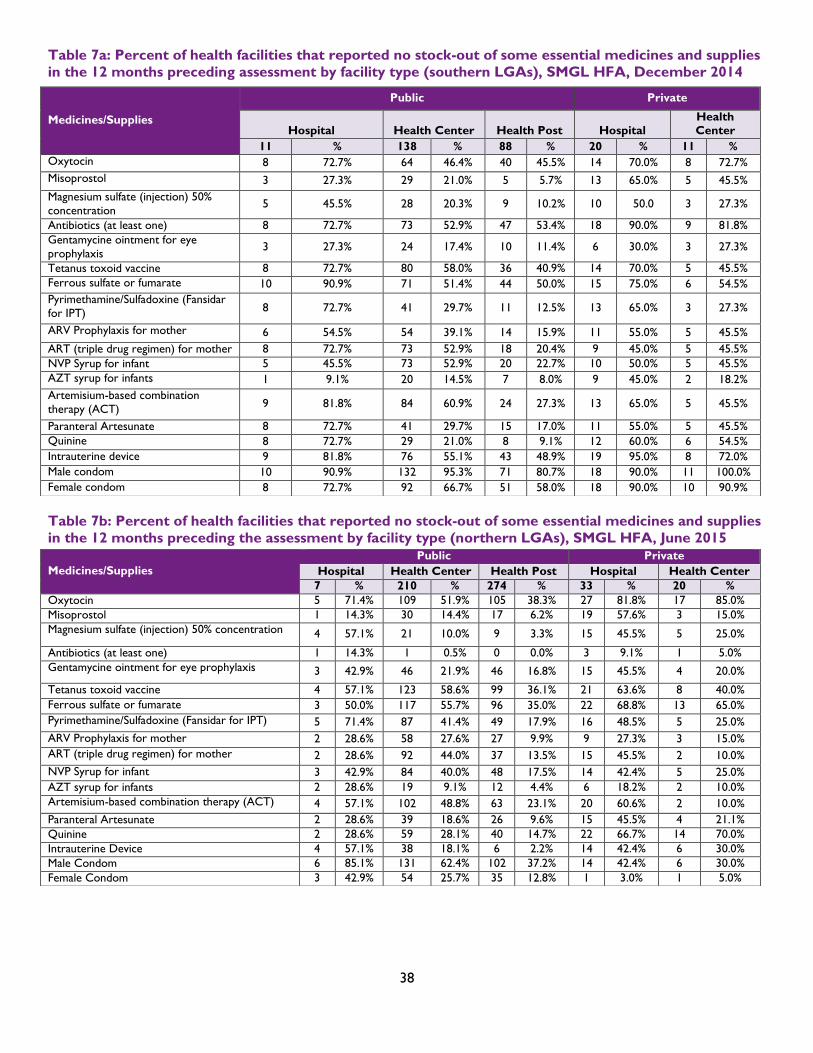
38
Table 7a: Percent of health facilities that reported no stock-out of some essential medicines and supplies
in the 12 months preceding assessment by facility type (southern LGAs), SMGL HFA, December 2014
Table 7b: Percent of health facilities that reported no stock-out of some essential medicines and supplies
in the 12 months preceding the assessment by facility type (northern LGAs), SMGL HFA, June 2015
Medicines/Supplies
Public Private
Hospital Health Center Health Post Hospital Health Center
11 % 138 % 88 % 20 % 11 %
Oxytocin 8 72.7% 64 46.4% 40 45.5% 14 70.0% 8 72.7%
Misoprostol 3 27.3% 29 21.0% 5 5.7% 13 65.0% 5 45.5%
Magnesium sulfate (injection) 50%
concentration 5 45.5% 28 20.3% 9 10.2% 10 50.0 3 27.3%
Antibiotics (at least one) 8 72.7% 73 52.9% 47 53.4% 18 90.0% 9 81.8%
Gentamycine ointment for eye
prophylaxis 3 27.3% 24 17.4% 10 11.4% 6 30.0% 3 27.3%
Tetanus toxoid vaccine 8 72.7% 80 58.0% 36 40.9% 14 70.0% 5 45.5%
Ferrous sulfate or fumarate 10 90.9% 71 51.4% 44 50.0% 15 75.0% 6 54.5%
Pyrimethamine/Sulfadoxine (Fansidar
for IPT) 8 72.7% 41 29.7% 11 12.5% 13 65.0% 3 27.3%
ARV Prophylaxis for mother 6 54.5% 54 39.1% 14 15.9% 11 55.0% 5 45.5%
ART (triple drug regimen) for mother 8 72.7% 73 52.9% 18 20.4% 9 45.0% 5 45.5%
NVP Syrup for infant 5 45.5% 73 52.9% 20 22.7% 10 50.0% 5 45.5%
AZT syrup for infants 1 9.1% 20 14.5% 7 8.0% 9 45.0% 2 18.2%
Artemisium-based combination
therapy (ACT) 9 81.8% 84 60.9% 24 27.3% 13 65.0% 5 45.5%
Paranteral Artesunate 8 72.7% 41 29.7% 15 17.0% 11 55.0% 5 45.5%
Quinine 8 72.7% 29 21.0% 8 9.1% 12 60.0% 6 54.5%
Intrauterine device 9 81.8% 76 55.1% 43 48.9% 19 95.0% 8 72.0%
Male condom 10 90.9% 132 95.3% 71 80.7% 18 90.0% 11 100.0%
Female condom 8 72.7% 92 66.7% 51 58.0% 18 90.0% 10 90.9%
Medicines/Supplies
Public Private
Hospital Health Center Health Post Hospital Health Center
7 % 210 % 274 % 33 % 20 %
Oxytocin 5 71.4% 109 51.9% 105 38.3% 27 81.8% 17 85.0%
Misoprostol 1 14.3% 30 14.4% 17 6.2% 19 57.6% 3 15.0%
Magnesium sulfate (injection) 50% concentration 4 57.1% 21 10.0% 9 3.3% 15 45.5% 5 25.0%
Antibiotics (at least one) 1 14.3% 1 0.5% 0 0.0% 3 9.1% 1 5.0%
Gentamycine ointment for eye prophylaxis 3 42.9% 46 21.9% 46 16.8% 15 45.5% 4 20.0%
Tetanus toxoid vaccine 4 57.1% 123 58.6% 99 36.1% 21 63.6% 8 40.0%
Ferrous sulfate or fumarate 3 50.0% 117 55.7% 96 35.0% 22 68.8% 13 65.0%
Pyrimethamine/Sulfadoxine (Fansidar for IPT) 5 71.4% 87 41.4% 49 17.9% 16 48.5% 5 25.0%
ARV Prophylaxis for mother 2 28.6% 58 27.6% 27 9.9% 9 27.3% 3 15.0%
ART (triple drug regimen) for mother 2 28.6% 92 44.0% 37 13.5% 15 45.5% 2 10.0%
NVP Syrup for infant 3 42.9% 84 40.0% 48 17.5% 14 42.4% 5 25.0%
AZT syrup for infants 2 28.6% 19 9.1% 12 4.4% 6 18.2% 2 10.0%
Artemisium-based combination therapy (ACT) 4 57.1% 102 48.8% 63 23.1% 20 60.6% 2 10.0%
Paranteral Artesunate 2 28.6% 39 18.6% 26 9.6% 15 45.5% 4 21.1%
Quinine 2 28.6% 59 28.1% 40 14.7% 22 66.7% 14 70.0%
Intrauterine Device 4 57.1% 38 18.1% 6 2.2% 14 42.4% 6 30.0%
Male Condom 6 85.1% 131 62.4% 102 37.2% 14 42.4% 6 30.0%
Female Condom 3 42.9% 54 25.7% 35 12.8% 1 3.0% 1 5.0%
39
7. Other Maternal and Newborn Health Services
All the facilities providing delivery services reported to be providing some other maternal and newborn health services
that include rapid test for HIV, administration of ARVs to HIV-infected mothers and HIV-exposed newborns, mother
care, family planning (short-term, long acting reversible methods and permanent methods), application of the HBB
(hemoglobin Beta) protocol, and intensive care for preterm/low birth weight babies.
Tables 8a and 8b show that the percentages of health facilities in the southern and northern LGAs, respectively, that
reported to perform other MNH services decreases from higher- to lower-level facilities: higher percentages of
hospitals, public or private, reported to provide the services. Within each facility type (hospital, HC, HP) the
percentages that reported to perform the services vary significantly by service. High percentages of public hospitals
reported to provide short-term family planning methods, such as pills, injectables or condoms (100%, both in the South
and North); conduct rapid tests among mothers with unknown HIV status (91% South, 86% North); offer mother care
services (91% South, 86% North); routinely practice AMTSL (82%, South, 100% North); and give ARV to HIV-exposed
newborns (82% South, 86% North). Much lower percentages reported to offer permanent contraceptive methods (46%
South, 29% North); provide intensive care for preterm/low birth weight babies (55% South, 43% North); and use
partographs to manage labor (55% South, 29% North). Among private hospitals, high percentages reported to practice
AMTSL (95% South, 97% North); offer mother care services (85% in both South and North); and conduct rapid tests for
mothers with unknown HIV status (85% South and 91% North). Much lower percentages reported to offer permanent
contraceptive methods (25% South, 21% North); provide special or intensive care for preterm/low birth weight babies
(30% South, 24% North); use partographs to manage labor (35% South, 27% North); and give ARVs to HIV-Infected
mothers (45% South, 39% North). In both the southern and northern LGAs, public hospitals were most likely to report
provision of long acting reversible methods (IUD and implants) (72% of public hospitals in the South and 71% of public
hospitals in the North). The variations in the percentages reporting to provide the services also vary among HCs and
HPs. The findings point to the need to investigate why significant percentages of health facilities were not providing
some essential MNH services.
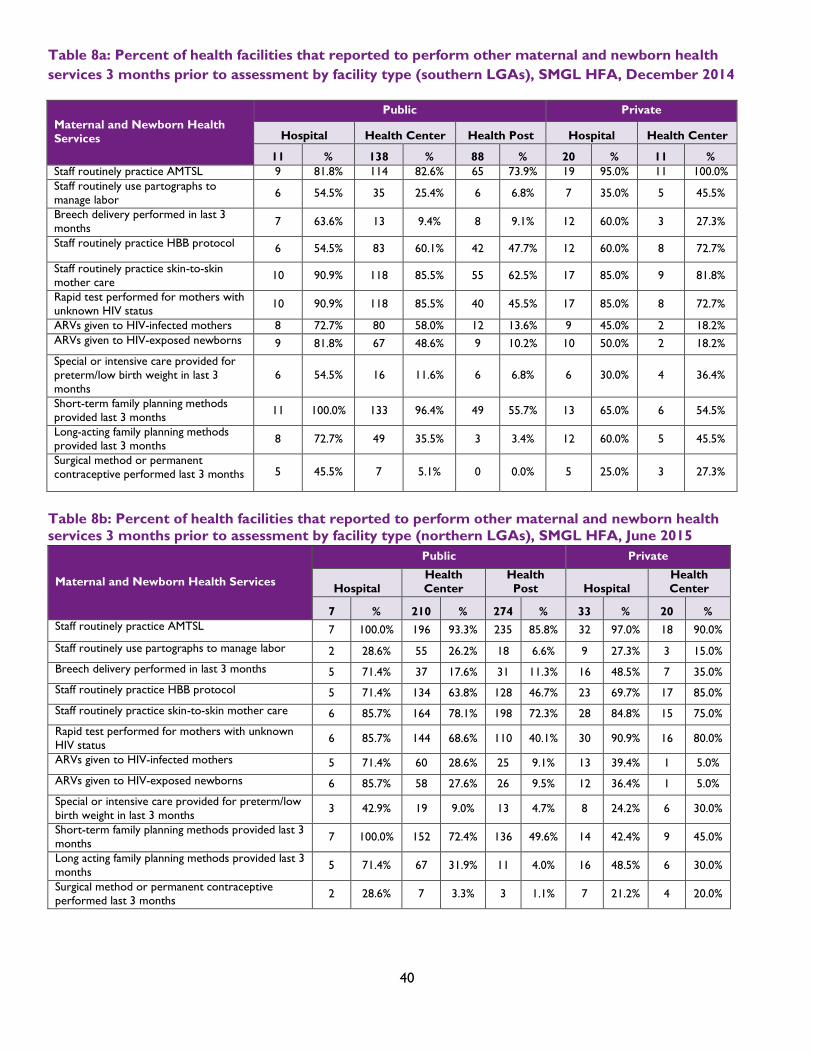
40
Table 8a: Percent of health facilities that reported to perform other maternal and newborn health
services 3 months prior to assessment by facility type (southern LGAs), SMGL HFA, December 2014
Maternal and Newborn Health
Services
Public Private
Hospital Health Center Health Post Hospital Health Center
11 % 138 % 88 % 20 % 11 %
Staff routinely practice AMTSL 9 81.8% 114 82.6% 65 73.9% 19 95.0% 11 100.0%
Staff routinely use partographs to
manage labor 6 54.5% 35 25.4% 6 6.8% 7 35.0% 5 45.5%
Breech delivery performed in last 3
months 7 63.6% 13 9.4% 8 9.1% 12 60.0% 3 27.3%
Staff routinely practice HBB protocol 6 54.5% 83 60.1% 42 47.7% 12 60.0% 8 72.7%
Staff routinely practice skin-to-skin
mother care 10 90.9% 118 85.5% 55 62.5% 17 85.0% 9 81.8%
Rapid test performed for mothers with
unknown HIV status 10 90.9% 118 85.5% 40 45.5% 17 85.0% 8 72.7%
ARVs given to HIV-infected mothers 8 72.7% 80 58.0% 12 13.6% 9 45.0% 2 18.2%
ARVs given to HIV-exposed newborns 9 81.8% 67 48.6% 9 10.2% 10 50.0% 2 18.2%
Special or intensive care provided for
preterm/low birth weight in last 3
months
6 54.5% 16 11.6% 6 6.8% 6 30.0% 4 36.4%
Short-term family planning methods
provided last 3 months 11 100.0% 133 96.4% 49 55.7% 13 65.0% 6 54.5%
Long-acting family planning methods
provided last 3 months 8 72.7% 49 35.5% 3 3.4% 12 60.0% 5 45.5%
Surgical method or permanent
contraceptive performed last 3 months 5 45.5% 7 5.1% 0 0.0% 5 25.0% 3 27.3%
Table 8b: Percent of health facilities that reported to perform other maternal and newborn health
services 3 months prior to assessment by facility type (northern LGAs), SMGL HFA, June 2015
Maternal and Newborn Health Services
Public Private
Hospital
Health
Center
Health
Post Hospital
Health
Center
7 % 210 % 274 % 33 % 20 %
Staff routinely practice AMTSL 7 100.0% 196 93.3% 235 85.8% 32 97.0% 18 90.0%
Staff routinely use partographs to manage labor 2 28.6% 55 26.2% 18 6.6% 9 27.3% 3 15.0%
Breech delivery performed in last 3 months 5 71.4% 37 17.6% 31 11.3% 16 48.5% 7 35.0%
Staff routinely practice HBB protocol 5 71.4% 134 63.8% 128 46.7% 23 69.7% 17 85.0%
Staff routinely practice skin-to-skin mother care 6 85.7% 164 78.1% 198 72.3% 28 84.8% 15 75.0%
Rapid test performed for mothers with unknown
HIV status 6 85.7% 144 68.6% 110 40.1% 30 90.9% 16 80.0%
ARVs given to HIV-infected mothers 5 71.4% 60 28.6% 25 9.1% 13 39.4% 1 5.0%
ARVs given to HIV-exposed newborns 6 85.7% 58 27.6% 26 9.5% 12 36.4% 1 5.0%
Special or intensive care provided for preterm/low
birth weight in last 3 months 3 42.9% 19 9.0% 13 4.7% 8 24.2% 6 30.0%
Short-term family planning methods provided last 3
months 7 100.0% 152 72.4% 136 49.6% 14 42.4% 9 45.0%
Long acting family planning methods provided last 3
months 5 71.4% 67 31.9% 11 4.0% 16 48.5% 6 30.0%
Surgical method or permanent contraceptive
performed last 3 months 2 28.6% 7 3.3% 3 1.1% 7 21.2% 4 20.0%
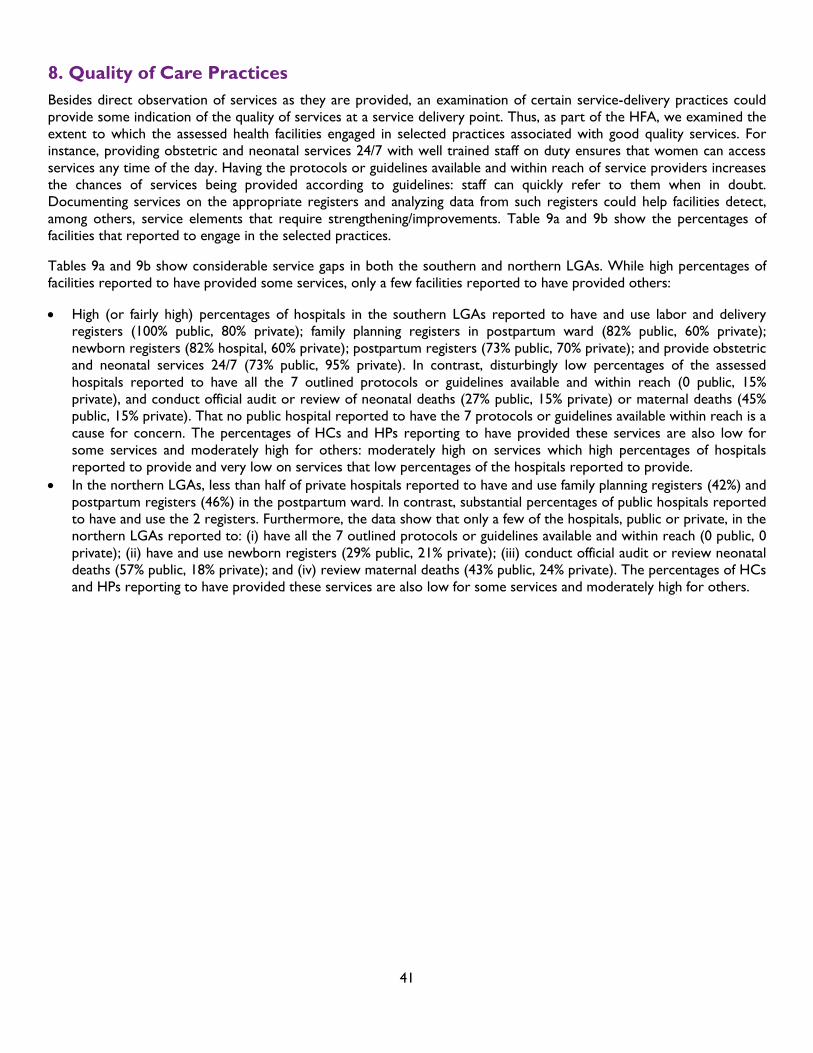
41
8. Quality of Care Practices
Besides direct observation of services as they are provided, an examination of certain service-delivery practices could
provide some indication of the quality of services at a service delivery point. Thus, as part of the HFA, we examined the
extent to which the assessed health facilities engaged in selected practices associated with good quality services. For
instance, providing obstetric and neonatal services 24/7 with well trained staff on duty ensures that women can access
services any time of the day. Having the protocols or guidelines available and within reach of service providers increases
the chances of services being provided according to guidelines: staff can quickly refer to them when in doubt.
Documenting services on the appropriate registers and analyzing data from such registers could help facilities detect,
among others, service elements that require strengthening/improvements. Table 9a and 9b show the percentages of
facilities that reported to engage in the selected practices.
Tables 9a and 9b show considerable service gaps in both the southern and northern LGAs. While high percentages of
facilities reported to have provided some services, only a few facilities reported to have provided others:
High (or fairly high) percentages of hospitals in the southern LGAs reported to have and use labor and delivery
registers (100% public, 80% private); family planning registers in postpartum ward (82% public, 60% private);
newborn registers (82% hospital, 60% private); postpartum registers (73% public, 70% private); and provide obstetric
and neonatal services 24/7 (73% public, 95% private). In contrast, disturbingly low percentages of the assessed
hospitals reported to have all the 7 outlined protocols or guidelines available and within reach (0 public, 15%
private), and conduct official audit or review of neonatal deaths (27% public, 15% private) or maternal deaths (45%
public, 15% private). That no public hospital reported to have the 7 protocols or guidelines available within reach is a
cause for concern. The percentages of HCs and HPs reporting to have provided these services are also low for
some services and moderately high for others: moderately high on services which high percentages of hospitals
reported to provide and very low on services that low percentages of the hospitals reported to provide.
In the northern LGAs, less than half of private hospitals reported to have and use family planning registers (42%) and
postpartum registers (46%) in the postpartum ward. In contrast, substantial percentages of public hospitals reported
to have and use the 2 registers. Furthermore, the data show that only a few of the hospitals, public or private, in the
northern LGAs reported to: (i) have all the 7 outlined protocols or guidelines available and within reach (0 public, 0
private); (ii) have and use newborn registers (29% public, 21% private); (iii) conduct official audit or review neonatal
deaths (57% public, 18% private); and (iv) review maternal deaths (43% public, 24% private). The percentages of HCs
and HPs reporting to have provided these services are also low for some services and moderately high for others.
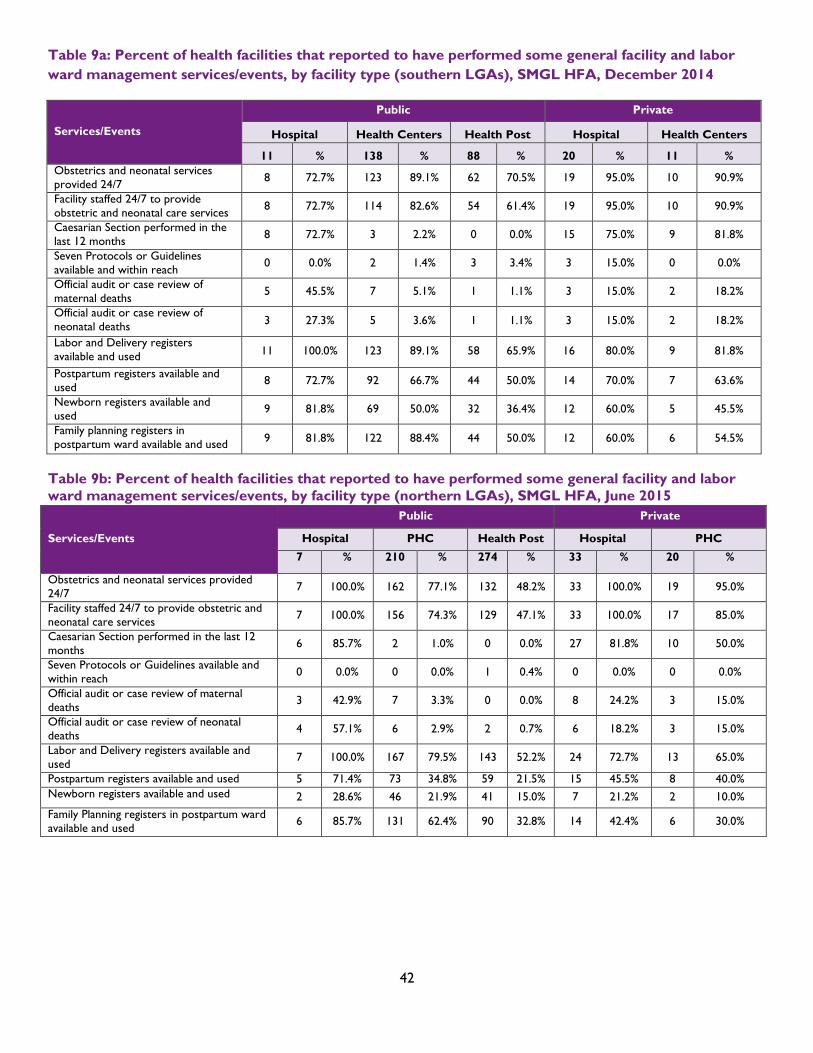
42
Table 9a: Percent of health facilities that reported to have performed some general facility and labor
ward management services/events, by facility type (southern LGAs), SMGL HFA, December 2014
Services/Events
Public Private
Hospital Health Centers Health Post Hospital Health Centers
11 % 138 % 88 % 20 % 11 %
Obstetrics and neonatal services
provided 24/7 8 72.7% 123 89.1% 62 70.5% 19 95.0% 10 90.9%
Facility staffed 24/7 to provide
obstetric and neonatal care services 8 72.7% 114 82.6% 54 61.4% 19 95.0% 10 90.9%
Caesarian Section performed in the
last 12 months 8 72.7% 3 2.2% 0 0.0% 15 75.0% 9 81.8%
Seven Protocols or Guidelines
available and within reach 0 0.0% 2 1.4% 3 3.4% 3 15.0% 0 0.0%
Official audit or case review of
maternal deaths 5 45.5% 7 5.1% 1 1.1% 3 15.0% 2 18.2%
Official audit or case review of
neonatal deaths 3 27.3% 5 3.6% 1 1.1% 3 15.0% 2 18.2%
Labor and Delivery registers
available and used 11 100.0% 123 89.1% 58 65.9% 16 80.0% 9 81.8%
Postpartum registers available and
used 8 72.7% 92 66.7% 44 50.0% 14 70.0% 7 63.6%
Newborn registers available and
used 9 81.8% 69 50.0% 32 36.4% 12 60.0% 5 45.5%
Family planning registers in
postpartum ward available and used 9 81.8% 122 88.4% 44 50.0% 12 60.0% 6 54.5%
Table 9b: Percent of health facilities that reported to have performed some general facility and labor
ward management services/events, by facility type (northern LGAs), SMGL HFA, June 2015
Services/Events
Public Private
Hospital PHC Health Post Hospital PHC
7 % 210 % 274 % 33 % 20 %
Obstetrics and neonatal services provided
24/7 7 100.0% 162 77.1% 132 48.2% 33 100.0% 19 95.0%
Facility staffed 24/7 to provide obstetric and
neonatal care services 7 100.0% 156 74.3% 129 47.1% 33 100.0% 17 85.0%
Caesarian Section performed in the last 12
months 6 85.7% 2 1.0% 0 0.0% 27 81.8% 10 50.0%
Seven Protocols or Guidelines available and
within reach 0 0.0% 0 0.0% 1 0.4% 0 0.0% 0 0.0%
Official audit or case review of maternal
deaths 3 42.9% 7 3.3% 0 0.0% 8 24.2% 3 15.0%
Official audit or case review of neonatal
deaths 4 57.1% 6 2.9% 2 0.7% 6 18.2% 3 15.0%
Labor and Delivery registers available and
used 7 100.0% 167 79.5% 143 52.2% 24 72.7% 13 65.0%
Postpartum registers available and used 5 71.4% 73 34.8% 59 21.5% 15 45.5% 8 40.0%
Newborn registers available and used 2 28.6% 46 21.9% 41 15.0% 7 21.2% 2 10.0%
Family Planning registers in postpartum ward
available and used 6 85.7% 131 62.4% 90 32.8% 14 42.4% 6 30.0%
43
9. Basic Services (Water, Toilet and Electricity)
Besides medicine, equipment, and staff, health facilities require other basic amenities to adequately deliver obstetric and
newborn care services. These basic amenities include functioning electricity, water, and toilet. The percentages of
facilities that reported to have the basic amenities are presented in Table10a (for the nine southern LGAS) and Table
10b (for the nine northern LGAs).
In both the southern and northern LGAs, there were significant deficiencies in the availability of the aforementioned
amenities—deficiencies that were more pronounced among public HCs and HPs. Tables 10a and 10b show that:
In the southern LGAs, 9% of public hospitals, 30% of public HCs, 59% of HPs, and 9% of private HCs reported to
not have access to electricity15, and substantial percentages of those that reported to have access to electricity
reported to not have power supply at the time of the HFA: 10%16 of public hospitals, 56% of public HCs, 42% of
HPs, 10% of private hospitals, and 40% of private HCs. In the northern LGAs, 32% of public HCs, 67% of HPs, 3% of
private hospitals, and 10% of private HCs reported to not have access to electricity. To minimize the effects of
incessant power outages on service delivery, several health facilities in CRS, as in other parts of Nigeria, obtained
back-up power in form of generators. Unfortunately, at the times of the assessments, the back-up power was not
functioning in some of the public health facilities that reported to have it: 22%17 of public HCs and 37% of HPs in the
southern LGAs. Even with the availability of back-up power, the percentages of facilities that had experienced power
outages while delivering obstetric services call for urgent attention: 27% of public hospitals, 25% of private hospitals,
81% of public HCs, 45% of private HCs, and 90% of HPs in the southern LGAs; and, 100% of public hospitals, 79% of
private hospitals, 98% of public HCs, 95% of private HCs, and 98% of HPs in the northern LGAs18.
There are variations in the availability of water for staff and patients’ use by facility type (hospital, HC, and HP) and
ownership (private and public). In the southern LGAs, all hospitals (private or public), 57% of public HCs, 90% of
private HCs, and 41% of HPs reported to have water available for staff and patients’ use. In the northern LGAs, all
public hospitals, 94% of private hospitals, 58% of public HCs, 95% of private HCs, and 39% of HPs reported to have
water available for staff and patients’ use. Among the health facilities that reported to have water for staff and
patients’ use, considerable percentages reported that, in the month preceding the assessments, the water system did
not function: (i) in the operating theatre (45% of public hospitals and 86% of public HCs in the southern LGAs; 57%
of public hospitals, 45% of private hospitals, 100% of public HCs and 74% of private HCs in the northern LGAs); and,
(ii) in the delivery room (36% of public hospitals, 55% of public HCs, and 80% of HPs in the southern LGAs; 43% of
public hospitals, 45% of private hospitals, 75% of public HCs, 74% of private HCs, and 85% of HPs in the northern
LGAs). Overall, very low percentages of public facilities reported to have never experienced interruption in their
water supply. There was greater access to water at private health facilities.
The percentages of facilities that reported to have a functional toilet for clients’ use are abysmally low: In the
southern LGAs, 18% of public hospitals, 5% of private hospitals, 4% of public HCs, 5% of private HCs, and 3% of
HPs; in the northern LGAs, 14% of public hospitals, no private hospitals, 1% of public HCs, no private HCs, and 1%
of HPs.
In the southern LGAs, soap was available near the toilet being used by clients in 91% of public hospitals, 36% of
public HCs, 17% of HPs, 80% of private hospitals, and 9% of private HCs. In the northern LGAs, soap was not
available in any public hospitals, 13% of public HCs, 16% of HPs, 18% private hospitals, and 45% private HCs.
15 The percentages reporting to not have electricity were calculated as 100% minus percentage reporting to have electricity. 16
The 10% is estimated as [(90.9-81.8)/90.9)*100. Other values in the sentence were similarly estimated. 17
The percentage with back-up power not functioning was estimated as the percentage reporting back-up power minus the
percentage reporting that the backup power was not functioning at the time of the HFA divided by the percentage reporting backup
power multiplied by 100. That is, 22% was estimated as [(46.4-36.2)/46.4]*100. 18 The percentages not having electricity interruption for obstetric services were estimated as 100% minus percentage reporting
interruption.
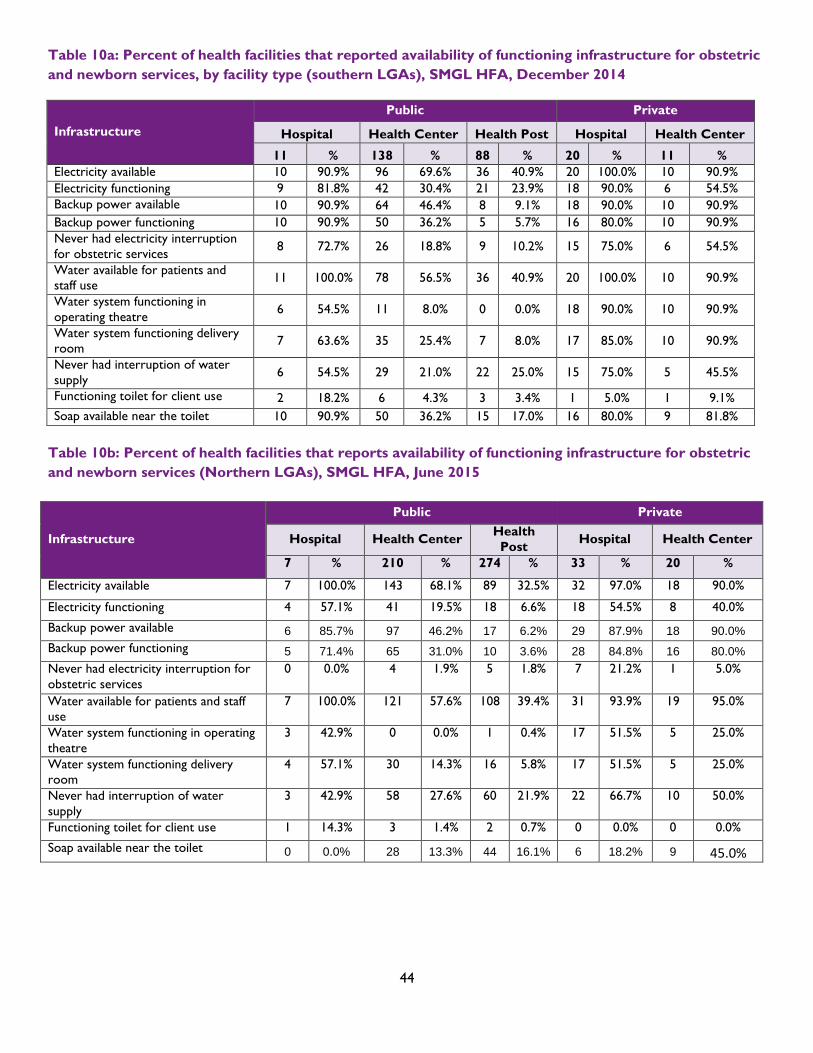
44
Table 10a: Percent of health facilities that reported availability of functioning infrastructure for obstetric
and newborn services, by facility type (southern LGAs), SMGL HFA, December 2014
Infrastructure
Public Private
Hospital Health Center Health Post Hospital Health Center
11 % 138 % 88 % 20 % 11 %
Electricity available 10 90.9% 96 69.6% 36 40.9% 20 100.0% 10 90.9%
Electricity functioning 9 81.8% 42 30.4% 21 23.9% 18 90.0% 6 54.5%
Backup power available 10 90.9% 64 46.4% 8 9.1% 18 90.0% 10 90.9%
Backup power functioning 10 90.9% 50 36.2% 5 5.7% 16 80.0% 10 90.9%
Never had electricity interruption
for obstetric services 8 72.7% 26 18.8% 9 10.2% 15 75.0% 6 54.5%
Water available for patients and
staff use 11 100.0% 78 56.5% 36 40.9% 20 100.0% 10 90.9%
Water system functioning in
operating theatre 6 54.5% 11 8.0% 0 0.0% 18 90.0% 10 90.9%
Water system functioning delivery
room 7 63.6% 35 25.4% 7 8.0% 17 85.0% 10 90.9%
Never had interruption of water
supply 6 54.5% 29 21.0% 22 25.0% 15 75.0% 5 45.5%
Functioning toilet for client use 2 18.2% 6 4.3% 3 3.4% 1 5.0% 1 9.1%
Soap available near the toilet 10 90.9% 50 36.2% 15 17.0% 16 80.0% 9 81.8%
Table 10b: Percent of health facilities that reports availability of functioning infrastructure for obstetric
and newborn services (Northern LGAs), SMGL HFA, June 2015
Infrastructure
Public Private
Hospital Health Center Health
Post Hospital Health Center
7 % 210 % 274 % 33 % 20 %
Electricity available 7 100.0% 143 68.1% 89 32.5% 32 97.0% 18 90.0%
Electricity functioning 4 57.1% 41 19.5% 18 6.6% 18 54.5% 8 40.0%
Backup power available 6 85.7% 97 46.2% 17 6.2% 29 87.9% 18 90.0%
Backup power functioning 5 71.4% 65 31.0% 10 3.6% 28 84.8% 16 80.0%
Never had electricity interruption for
obstetric services
0 0.0% 4 1.9% 5 1.8% 7 21.2% 1 5.0%
Water available for patients and staff
use
7 100.0% 121 57.6% 108 39.4% 31 93.9% 19 95.0%
Water system functioning in operating
theatre
3 42.9% 0 0.0% 1 0.4% 17 51.5% 5 25.0%
Water system functioning delivery
room
4 57.1% 30 14.3% 16 5.8% 17 51.5% 5 25.0%
Never had interruption of water
supply
3 42.9% 58 27.6% 60 21.9% 22 66.7% 10 50.0%
Functioning toilet for client use 1 14.3% 3 1.4% 2 0.7% 0 0.0% 0 0.0%
Soap available near the toilet 0 0.0% 28 13.3% 44 16.1% 6 18.2% 9 45.0%
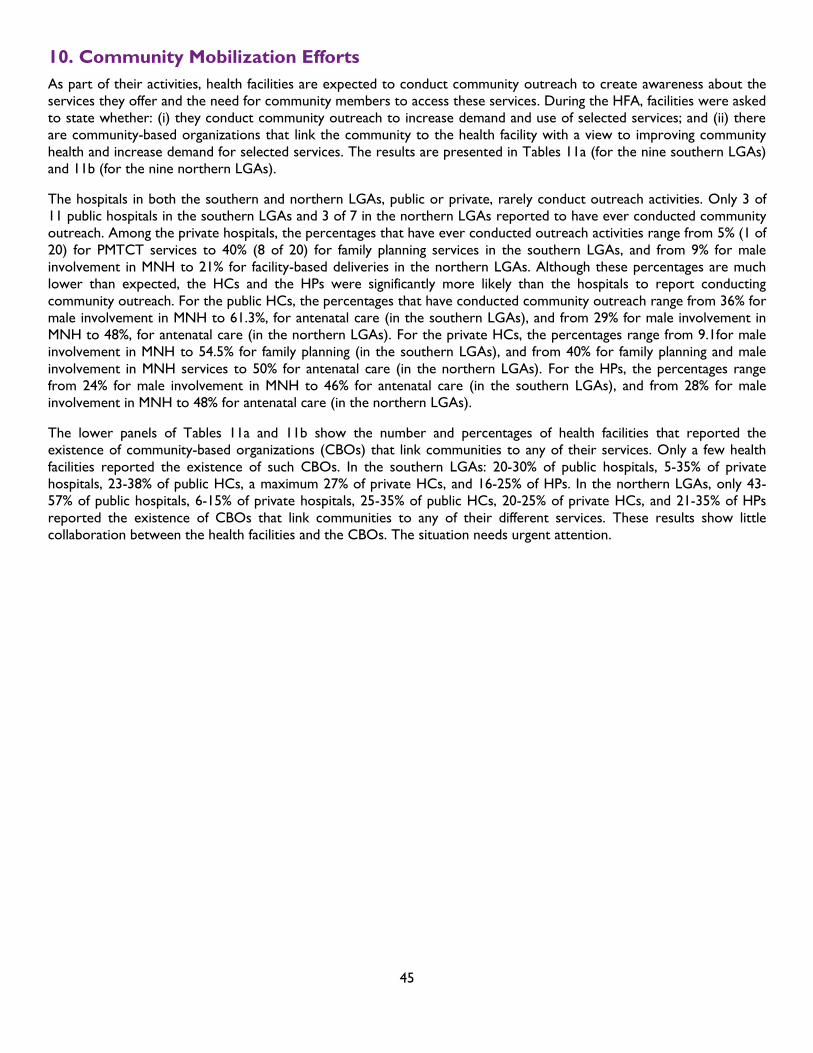
45
10. Community Mobilization Efforts
As part of their activities, health facilities are expected to conduct community outreach to create awareness about the
services they offer and the need for community members to access these services. During the HFA, facilities were asked
to state whether: (i) they conduct community outreach to increase demand and use of selected services; and (ii) there
are community-based organizations that link the community to the health facility with a view to improving community
health and increase demand for selected services. The results are presented in Tables 11a (for the nine southern LGAs)
and 11b (for the nine northern LGAs).
The hospitals in both the southern and northern LGAs, public or private, rarely conduct outreach activities. Only 3 of
11 public hospitals in the southern LGAs and 3 of 7 in the northern LGAs reported to have ever conducted community
outreach. Among the private hospitals, the percentages that have ever conducted outreach activities range from 5% (1 of
20) for PMTCT services to 40% (8 of 20) for family planning services in the southern LGAs, and from 9% for male
involvement in MNH to 21% for facility-based deliveries in the northern LGAs. Although these percentages are much
lower than expected, the HCs and the HPs were significantly more likely than the hospitals to report conducting
community outreach. For the public HCs, the percentages that have conducted community outreach range from 36% for
male involvement in MNH to 61.3%, for antenatal care (in the southern LGAs), and from 29% for male involvement in
MNH to 48%, for antenatal care (in the northern LGAs). For the private HCs, the percentages range from 9.1for male
involvement in MNH to 54.5% for family planning (in the southern LGAs), and from 40% for family planning and male
involvement in MNH services to 50% for antenatal care (in the northern LGAs). For the HPs, the percentages range
from 24% for male involvement in MNH to 46% for antenatal care (in the southern LGAs), and from 28% for male
involvement in MNH to 48% for antenatal care (in the northern LGAs).
The lower panels of Tables 11a and 11b show the number and percentages of health facilities that reported the
existence of community-based organizations (CBOs) that link communities to any of their services. Only a few health
facilities reported the existence of such CBOs. In the southern LGAs: 20-30% of public hospitals, 5-35% of private
hospitals, 23-38% of public HCs, a maximum 27% of private HCs, and 16-25% of HPs. In the northern LGAs, only 43-
57% of public hospitals, 6-15% of private hospitals, 25-35% of public HCs, 20-25% of private HCs, and 21-35% of HPs
reported the existence of CBOs that link communities to any of their different services. These results show little
collaboration between the health facilities and the CBOs. The situation needs urgent attention.
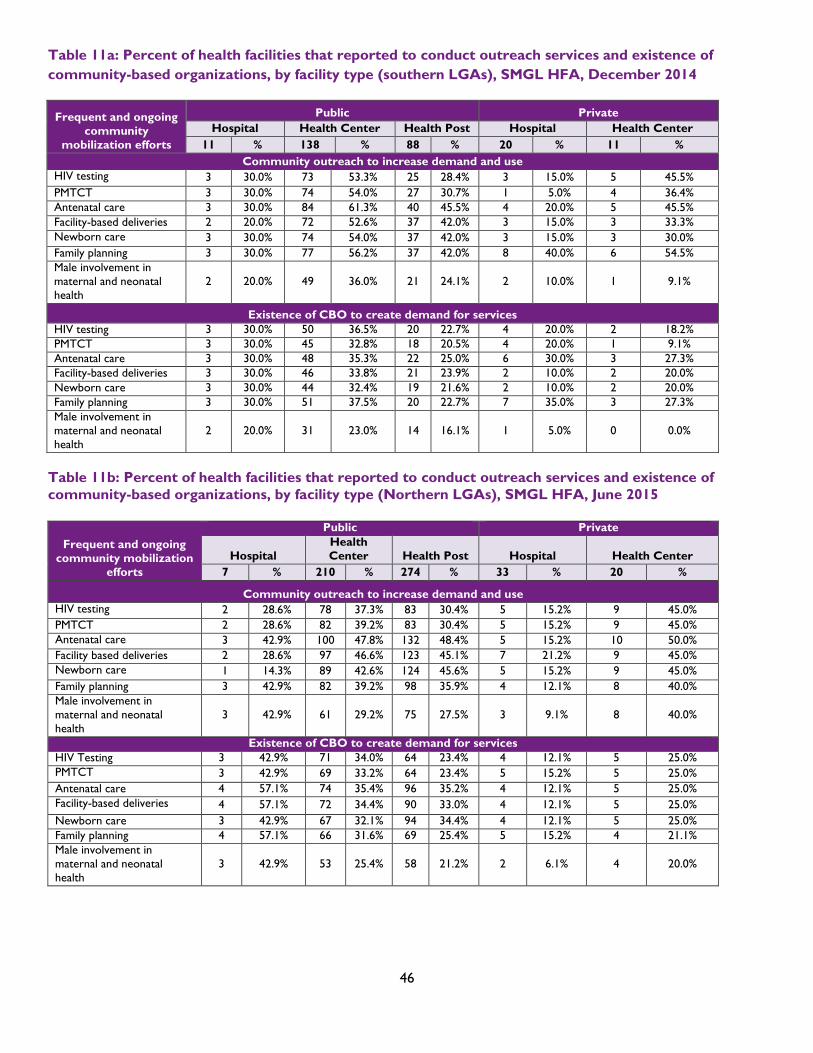
46
Table 11a: Percent of health facilities that reported to conduct outreach services and existence of
community-based organizations, by facility type (southern LGAs), SMGL HFA, December 2014
Frequent and ongoing
community
mobilization efforts
Public Private
Hospital Health Center Health Post Hospital Health Center
11 % 138 % 88 % 20 % 11 %
Community outreach to increase demand and use
HIV testing 3 30.0% 73 53.3% 25 28.4% 3 15.0% 5 45.5%
PMTCT 3 30.0% 74 54.0% 27 30.7% 1 5.0% 4 36.4%
Antenatal care 3 30.0% 84 61.3% 40 45.5% 4 20.0% 5 45.5%
Facility-based deliveries 2 20.0% 72 52.6% 37 42.0% 3 15.0% 3 33.3%
Newborn care 3 30.0% 74 54.0% 37 42.0% 3 15.0% 3 30.0%
Family planning 3 30.0% 77 56.2% 37 42.0% 8 40.0% 6 54.5%
Male involvement in
maternal and neonatal
health
2 20.0% 49 36.0% 21 24.1% 2 10.0% 1 9.1%
Existence of CBO to create demand for services
HIV testing 3 30.0% 50 36.5% 20 22.7% 4 20.0% 2 18.2%
PMTCT 3 30.0% 45 32.8% 18 20.5% 4 20.0% 1 9.1%
Antenatal care 3 30.0% 48 35.3% 22 25.0% 6 30.0% 3 27.3%
Facility-based deliveries 3 30.0% 46 33.8% 21 23.9% 2 10.0% 2 20.0%
Newborn care 3 30.0% 44 32.4% 19 21.6% 2 10.0% 2 20.0%
Family planning 3 30.0% 51 37.5% 20 22.7% 7 35.0% 3 27.3%
Male involvement in
maternal and neonatal
health
2 20.0% 31 23.0% 14 16.1% 1 5.0% 0 0.0%
Table 11b: Percent of health facilities that reported to conduct outreach services and existence of
community-based organizations, by facility type (Northern LGAs), SMGL HFA, June 2015
Frequent and ongoing
community mobilization
efforts
Public Private
Hospital
Health
Center Health Post Hospital Health Center
7 % 210 % 274 % 33 % 20 %
Community outreach to increase demand and use
HIV testing 2 28.6% 78 37.3% 83 30.4% 5 15.2% 9 45.0%
PMTCT 2 28.6% 82 39.2% 83 30.4% 5 15.2% 9 45.0%
Antenatal care 3 42.9% 100 47.8% 132 48.4% 5 15.2% 10 50.0%
Facility based deliveries 2 28.6% 97 46.6% 123 45.1% 7 21.2% 9 45.0%
Newborn care 1 14.3% 89 42.6% 124 45.6% 5 15.2% 9 45.0%
Family planning 3 42.9% 82 39.2% 98 35.9% 4 12.1% 8 40.0%
Male involvement in
maternal and neonatal
health
3 42.9% 61 29.2% 75 27.5% 3 9.1% 8 40.0%
Existence of CBO to create demand for services
HIV Testing 3 42.9% 71 34.0% 64 23.4% 4 12.1% 5 25.0%
PMTCT 3 42.9% 69 33.2% 64 23.4% 5 15.2% 5 25.0%
Antenatal care 4 57.1% 74 35.4% 96 35.2% 4 12.1% 5 25.0%
Facility-based deliveries 4 57.1% 72 34.4% 90 33.0% 4 12.1% 5 25.0%
Newborn care 3 42.9% 67 32.1% 94 34.4% 4 12.1% 5 25.0%
Family planning 4 57.1% 66 31.6% 69 25.4% 5 15.2% 4 21.1%
Male involvement in
maternal and neonatal
health
3 42.9% 53 25.4% 58 21.2% 2 6.1% 4 20.0%
47
11. Summary and Conclusion
This HFA report attempts to examine the readiness of health facilities in CRS, Nigeria, to provide quality basic and
comprehensive emergency obstetric and newborn care services—measured by availability of essential medicines and
supplies, required equipment and infrastructural amenities, and different cadres of adequately trained health personnel
The issues of interest, as determined by this HFA, are those that could influence the three delays in accessing MNH
services. For example, in terms of helping mothers recognize the need to seek care and make the decision to do so, we
examined the extent to which health facilities have conducted community-mobilization activities to provide general
information on MNH services as well as where services could be obtained. Unfortunately, the health facilities performed
much below expectation in this area. Regarding the delay in mothers physically accessing care when necessary, we
examined the availability and adequacy of transport and communication with facilities for emergencies and referrals.
Again, the HFA shows that the availability and quality of emergency care at these facilities leave much to be desired; the
inadequate availability of transport might have led to delays in emergencies getting to the health facilities in time, thus
contributing to high maternal deaths from obstructed labor and ruptured uterus. To determine the readiness of the
health facilities to address the delay in receiving appropriate care once a client reaches the health facility, we examined
the availability of different cadres of adequately trained health personnel, essential medicines and supplies, and required
equipment.
In terms of sheer numbers, the HFA shows that CRS had a reasonably good number of facilities that, if well equipped,
should be able to provide quality BEmONC and CEmONC services to a large number of mothers and their newborns.
Though not evenly distributed across LGAs, 369 HCs that should be providing BEmONC services and 71 hospitals that
should be providing CEmONC services were assessed. These numbers do not include HCs and hospitals that were not
assessed due to lack of records on delivery in the 12 months preceding the survey and hundreds of assessed and non-
assessed HPs.
Regarding the performance of the health facilities in the 12 months preceding the HFA, the data show that only a few
health facilities performed BEmONC or CEmONC signal functions: only 16 of 71 assessed hospitals (9 of 31 in the
southern LGAs and 7 of 40 in the northern LGAs) performed all CEmONC signal functions; only 4 of 379 HCs (2 of
149 in the southern LGAs and 2 of 230 in the northern LGAs) performed all BEmONC signal functions. There were no
hospitals or HCs that did not perform 1 or more signal functions. Although 2 factors could account for health facilities
not performing BEmONC and CEMONC—lack of demand for these services and lack of capability to offer the
services—we did not collect data that could inform which of the 2 factors predominates.
In order to determine readiness to provide BEmONC- or CEmONC-related signal functions, we examined the
availability of required material and human resources: equipment and infrastructure, essential medicines and supplies, and
health personnel. The HFA data reveal high variations in the availability of: (i) functioning basic obstetric supplies and
equipment by type of supply/equipment and facility type; and, (ii) essential medicines and supplies by type of
medicine/supply and facility type. While reasonably high percentages of facilities reported the availability of some basic
obstetric supplies and essential medicines, abysmally low percentages of facilities reported the availability of others. The
percentage reporting the availability of functioning basic obstetric supplies and equipment and essential medicines
decreases from the hospital level to the HP level, implying that the lowest quality services exist at the rural/community
level where the HPs are located and where the majority of women live. Although more pronounced at the HC and HP
levels, the HFA data reveal unacceptably high-level unavailability of functioning equipment and essential medicines at the
time of the HFA. To ensure that these facilities perform their expected BEmONC or CEmONC services, substantial
investments would have to be made in the procurement of required equipment and essential medicines. SMGL and the
Government of CRS will have to work together to ensure steady supply of required medicines and equipment and, in
turn, to take a major step in raising the standards of the health facilities.
A steady supply of equipment and essential medicines will not necessarily lead to improvements in the quality of services
provided unless combined with adequately skilled health personnel. At the time of the HFA, 2,489 SBAs were reported
by the 812 health facilities assessed (1,203 from the 268 southern LGA facilities and 1,286 from the 544 northern LGA
facilities). The number of SBAs varies significantly by type of facility. As stated above, the general perception is that the
number of SBAs is inadequate to meet the needs of women and newborns served by these health facilities.
48
The HFA results directly informed the joint development of an operational plan and interventions for the SMGL
program in CRS. The operational plan and interventions aim to substantially improve the gaps identified in the quality of
services offered by health facilities. To reduce deaths related to pregnancy and childbirth in CRS, the operational plan
proposes a systematic, integrated, and coordinated approach that strengthens reproductive health and MNH services,
and addresses the three delays: delay in seeking services, delay in reaching services, and delay in receiving quality care. A
total of 73 health facilities (both public and private) were selected for the interventions, based on providing optimal
coverage. Several health centers are to be upgraded to provide BEmONC services and feed into one or two central
hospitals that will be upgraded to provide CEmONC services. The operational plan, including the health facilities
selected, intends to ensure that every pregnant woman in CRS will be able to access quality reproductive and MNH
services, and in the event of an obstetrical complication, access care within 2 hours.
To increase timely utilization of institutional delivery services, planned priority interventions include:
Training and supporting CHWs to mobilize communities for behavior change, positive health-seeking behavior,
and to extend access to some clinical interventions at community level.
Engage and support existing community development committees to integrate safe motherhood activities,
complement CHWs’ demand-generation activities, and improve referral systems/linkages to facilities.
Use mHealth tools (activating hotlines at the facilities, SMS messaging, linking to MAMA stage-based messaging
service) to improve case management, referral, and supervision.
To improve access and availability of services, planned priority interventions include:
Based on GIS travel time-mapping, ensure that the arrangement of BEmONC and CEmONC facilities within the
cluster model provide optimal coverage and ensure that the selected 40 BEmONC health centers are within 2-
hour travel time to catchment area of the selected 33 CEmONC hospitals.
Strengthen/establish and support community-organized and -operated local transportation system using
vouchers.
Expand access to services by supporting CHWs to deliver defined reproductive, MNH/HIV information and
services (birth kits, birth preparedness, postnatal care, and postpartum family planning).
To improve the quality of maternity care and institutional delivery services, including EmONC, planned priority
interventions include;
Provision of comprehensive, integrated, in-service training for health providers at selected facilities
(EmONC/life-saving skills (antenatal and postnatal care, and labor and delivery), PMTCT, postpartum family
planning, and respectful maternity care).
Through close collaboration with and support from the Government of CRS, improve facility infrastructure
(availability of water, toilet facilities, back-up power, rehabilitation/upgrading of labor and delivery rooms and
blood banks) and provide adequate SBAs through recruitment and redistribution at selected facilities.
Ensure availability of basic equipment and supplies, including essential drugs and commodities, to meet and
maintain BEmONC and CEmONC status for selected facilities.
To strengthen the health system, planned priority interventions include:
Support and build capacity of LGA PHC teams in management and integrated supportive supervision.
Strengthen the capacity of service providers and health managers in t forecasting and management of
drugs/commodity logistic/supply chain system.
Strengthen and support community and facility-based registrations of births and deaths.
Strengthen HMIS, data quality audits, and data use for decision-making.
In focusing on key high-priority interventions, it is anticipated that by the end of the 2-year SMGL intervention, there will
be a 15% reduction in the maternal mortality ratio and 10% reduction in the neonatal mortality ratio from the baseline
statistics.

49
Appendix: Field Workers
HFA I: The Nine Southern LGAs
Lead Supervisor: Dr. Aba Nwachukwu
Data Quality Monitoring Consultant: Dr. Ukong Akpan
Abi
1 Igbigbi Jennifer Ogheneochuko
2 Nnaji Ekene Henry
3 Olaleye Akinola Emmanuel
4 Chukwu Ezekiel Christopher
5 Nwufo Jude Nonso
6 Ibitoye Rashidat Olubunmi
7 Egbe Richard Edu Supervisor
Akamkpa
1 Okeke Lovelyn Chilezie
2 Okache Winifred Y.
3 Ayim Linda Egbor
4 James Benjamin Onuh
5 Nwatu Chidiebere Boniface
6 Nkoyo Okon Ekanem
7 Dominic Onwe Ogri Supervisor
Akpabuyo
1 Akinwale Akiwumi Kolawole
2 Anene Ifeoma Linda
3 Ukpanyang Okon E. (Father account)
4 Umeh Felicia Chiamaka
5 Edet Inemesit Emmanuel
6 Isaac Emmanuel Umanah
7 Ogbonna Chukwuemeka O.
8 Anidebe Chinelo Ada
9 Ukpanyang Nsa Okon Effiong Supervisor
Bakassi
1 John Lohya
2 Onye Jovita Ijeoma
3 Mabayoje Ifeoluwa Peter
4 Mewojuaye Segun

50
5 Nnaji Stella Ukamaka
6 Umezurike Nnanna R.
7 Theresa Aleka Supervisor
Biase
1 Abass Rukayat Olamide
2 Amusat Wasiu Lanre
3 Babalola Tayo Nimotalah
4 Jimoh Wasiu Ayinde
5 Ngoka Nzube John
6 Oduola Abdulroqeeb Opeyemi
7 Oduyoye Hajarat Abimbola
8 Nnoruga Perpetua Obiageli
9 Lovelyn P. Eteng Supervisor
Calabar Municipal
1 Nkuma Chisom Ukpai
2 Franka Kewoyong E.
3 Inok Edim Edim
4 Justin Mbang Enang
5 Ekanem Samuel Effiong
6 Umeojiego Chioma Bibian
7 Ogundele Bolanle
8 Odey Margaret A.
9 Chukwu Victor Ekene
10 Anom Itaogim Ekip
11 Nwagba Fiona N.
12 Ugo Bassey Edu
13 Patience O. Uke Supervisor
Calabar South
1 Adeyemi Adeyinka Oluwafemi
2 Etim, Aniekan Nicholas
3 Felicia Nsimaka Eyaba
4 Mika Karen A.
5 Ogbonnaya Joshua Isaac
6 Oyintoye Ebikewenimoh
7 Udom Ini Aslina
8 Dan Akamobong Young
9 Anom Thomas Itaogim
10 Ekpo Doris Chidimma
11 Okoho Archibong Edet Supervisor
51
Odukpani
1 Emmanuel Bassey Ekpo
2 Ethothi Jane Uno
3 Mbah Alice Nkechinyere
4 Adeyonu Oluwatomilola Adetoro
5 Morah Nnamdi Francis
6 Mary Egbe Irek
7 Neji Angela Ochang
8 Glory Atakpo
9 Udiba, Dorathy Dien Supervisor
Yakurr
1 Ojukwu Anthony Elisha
2 Joshua Kevin-Israel
3 Ubi Celestina Ofem
4 Vincent Ibiang Ikpi
5 Ogbonna Abigail Ndidiamaka
6 Ogumka Innocent
7 Onyeogaziri Udonna Raphael
8 Oyebamiji Wuraola Oluwakemi
9 Nenka Alobi Supervisor
HFA II: The Nine Northern LGAs
Lead Supervisor: Dr. Sakina Bello
Data Quality Monitoring Consultant: Dr. Ukong Akpan
BEKWARRA
1 Apaa Reuben Bem
2 Nwachukwu C.
3 Obuba I. Ezinne
4 Funmilayo Amarvi
5 Ugochi Jumbo
6 Justin Enang
7 Lucy Okeh Supervisor
BOKI
1 Ezeh Robinson Izuchukwu
2 Okwesilieze Vivian
3 Emmanuel Chukwu
4 Yetunde Popoola
5 Nnaji Stella Ukamaka
6 Osayawe Ogieva
7 Alice Thompson Amatey
8 Raphael Onyeogaziri
9 Nkese Offiong Okon Supervisor
52
ETUNG
1 Omotosho Tunde
2 Mika Karen A.
3 Tyogba Doom Ruth
4 Vincent Ibiang
5 Thomas Itaogim Anom
6 Joy Patrick
7 Mrs. Okoho Edet Supervisor
IKOM
1 Okoronkwo Constance
2 Anom,Emmanuel Ekip
3 Obatoke Deborah
4 Benard Onwaji
5 Bola Ogundele
6 Osarumwense Igudia
7 Rita Fele
8 Innocent Ogumka
9 Patience Uke Supervisor
OBANLIKWU
1 Okoli Callistus Oluchukwu
2 Eruo Julia Chinenye
3 Ojerinde Gbenga David
4 Onwukaike Chioma
5 Aniako Nnenia Hilda
6 Mary Egbe
7 Blessing U. Aleka
8 Celestina Ubi
9 Dominic Onwe Ogri Supervisor
OBUDU
1 Uzembe Ann-
2 Agikwa Daniel Chibuike
3 Chinnaya Chizoba Vivian
4 Silas Undie
5 Dorathy Andeshi
6 Omole Halima Omotayo
7 Franka Eyaba
8 Akhaine Osaide Godwin
9 Dr. Kenneth Takur Supervisor
53
OGOJA
1 Ajewole Bosede Adenike
2 Nduaguba Chioma Gladys
3 Onukak Kate
4 Pawa Dooyum
5 Nwokocha Linda C.
6 Daniel Okon
7 Emenike Praise
8 Elijah Ogar Odey
9 Ukpayang Nsa Supervisor
OBUBRA
1 Abigail Ogbonna
2 Wuraola Oyebamiji
3 Bassey Effiong
4 Jude N. Aseme
5 Kingsley Eworo
6 Maraizu Fortune Chibuike
7 Oriaku Eninnaya Paschal
8 Lohya John
9 Lovelyn P Eteng Supervisor
YALA
1 Azubuike Clara. C.
2 Eleweke Chiemeka
3 Egbogu Mercy O.
4 Okeiyi Daniel
5 Glory Okama
6 Fiona Nwagba
7 Isaac Olufemi Adesuyi
8 Margaret Odey
9 Akamobong Dan Young
10 Olaoluwa Rufus Giwa
11 Egbe Richard Edu Supervisor