Embed Size (px)
Citation preview

1
1
Abnormal fetal muscle forces result in defects in spinal curvature and alterations in 2
vertebral segmentation and shape 3
Short title: Fetal movements for spinal development 4
5
Rebecca A. Rolfe1, James H. Bezer1, Tyler Kim1, Ahmed Z. Zaidon1, Michelle L. Oyen2, 6
James C. Iatridis3, Niamh C. Nowlan1 7
8
1. Department of Bioengineering, Imperial College London, London, United Kingdom 9
2. Engineering Department, University of Cambridge, Cambridge, United Kingdom 10
3. Department of Orthopaedics, Icahn School of Medicine at Mount Sinai, New York, NY 11
10029 12
13
Correspondence: Dr Niamh Nowlan 14
Phone: +44 (0) 20 759 45189 15
E-mail: [email protected] 16
17
Author Contributions: 18
RR carried out experiments, analyzed the data, and drafted the manuscript. NN, JI and MO 19
were involved in conception of the present study and contributed to discussions of the findings 20
and drafting of the manuscript. TK and AZZ contributed to the experiments and JB contributed 21
to the data analysis. NN participated in data analysis and oversaw drafting of the manuscript. 22
All authors read and approved the final manuscript. 23
24

2
ABSTRACT 25
The incidence of congenital spine deformities, including congenital scoliosis, kyphosis and 26
lordosis, may be influenced by the in utero mechanical environment, and particularly by fetal 27
movements at critical time-points. There is a limited understanding of the influence of fetal 28
movements on spinal development, despite the fact that mechanical forces have been shown to 29
play an essential role in skeletal development of the limb. This study investigates the effects of 30
muscle forces on spinal curvature, vertebral segmentation and vertebral shape by inducing rigid 31
or flaccid paralysis in the embryonic chick. The critical time-points for the influence of fetal 32
movements on spinal development were identified by varying the time of onset of paralysis. 33
Prolonged rigid paralysis induced severe defects in the spine, including curvature 34
abnormalities, posterior and anterior vertebral fusions and altered vertebral shape, while flaccid 35
paralysis did not affect spinal curvature or vertebral segmentation. Early rigid paralysis resulted 36
in more severe abnormalities in the spine than later rigid paralysis. The findings of this study 37
support the hypothesis that the timing and nature of fetal muscle activity are critical influences 38
on the normal development of the spine, with implications for the understanding of congenital 39
spine deformities. 40
41
KEYWORDS 42
Development, congenital spine deformities, chick immobilization, rigid paralysis, flaccid 43
paralysis, muscle forces 44
45
46
47

3
INTRODUCTION 48
A congenital spine deformity is an abnormality of the postnatal spine in which abnormal 49
curvature and deformations of the vertebrae occur1-3. Congenital scoliosis is the most common 50
congenital spine deformity1, while congenital kyphosis and lordosis, although rare, can have 51
much more severe consequences than scoliosis if left untreated2,3. The incidence of congenital 52
scoliosis is 0.5−1 per 1000 live births3,4 and is classified as failed formation or incorrect 53
segmentation of vertebrae, leading to full or partial vertebral fusion and subsequent alterations 54
in spinal curvature2. The aetiology of congenital spine deformities is poorly understood, but is 55
believed to be multifactorial, involving both genetic and environmental factors5. A number of 56
environmental stimuli have been shown to have an influence on the development of congenital 57
spinal deformities (reviewed in Li et al6), such as maternal exposures during pregnancy to 58
hypoxia7, carbon monoxide8, and vitamin deficiency6. Conditions in which fetal movements 59
are absent or abnormal indicate that the development of the spine could also depend on a normal 60
pattern of fetal movements. A complete absence of fetal movement occurs in the rare, neonatal-61
lethal syndrome fetal akinesia deformation sequence (FADS) (also known as Pena-Shokeir 62
syndrome)9,10. A range of spinal abnormalities in FADS cases has been reported and include 63
underdevelopment of vertebral bodies11, failure of formation of the cervical vertebrae12 and 64
abnormalities in spinal curvature11,13-17. Undiagnosed or mild congenital spinal deformities 65
may also play an important role in adolescent idiopathic scoliosis, since even relatively small 66
changes in curvature can lead to progressive scoliosis with vertebral body wedging due to 67
asymmetric muscular loading during adolescent growth18. 68
Mechanical stimulation has been shown to play an essential role in multiple aspects of skeletal 69
development (reviewed in Nowlan et al. 19), with decreased fetal movement leading to 70
abnormal ossification patterns, loss of tissue definition in joint regions and altered rudiment 71
shape20-23. In the developing chick spine, fusion of vertebrae and alterations in spinal curvature 72
4
have been reported following prolonged rigid paralysis24-27. Effects of immobility on the spine 73
have also been briefly mentioned in mammalian models of abnormal fetal movements, 74
including fusion of cervical vertebrae28 and loss of joints in the cervical and lumbar regions20. 75
However, curvature effects and vertebral shape changes have never been described in detail for 76
any model system of abnormal fetal movements, and much remains unknown about the effects 77
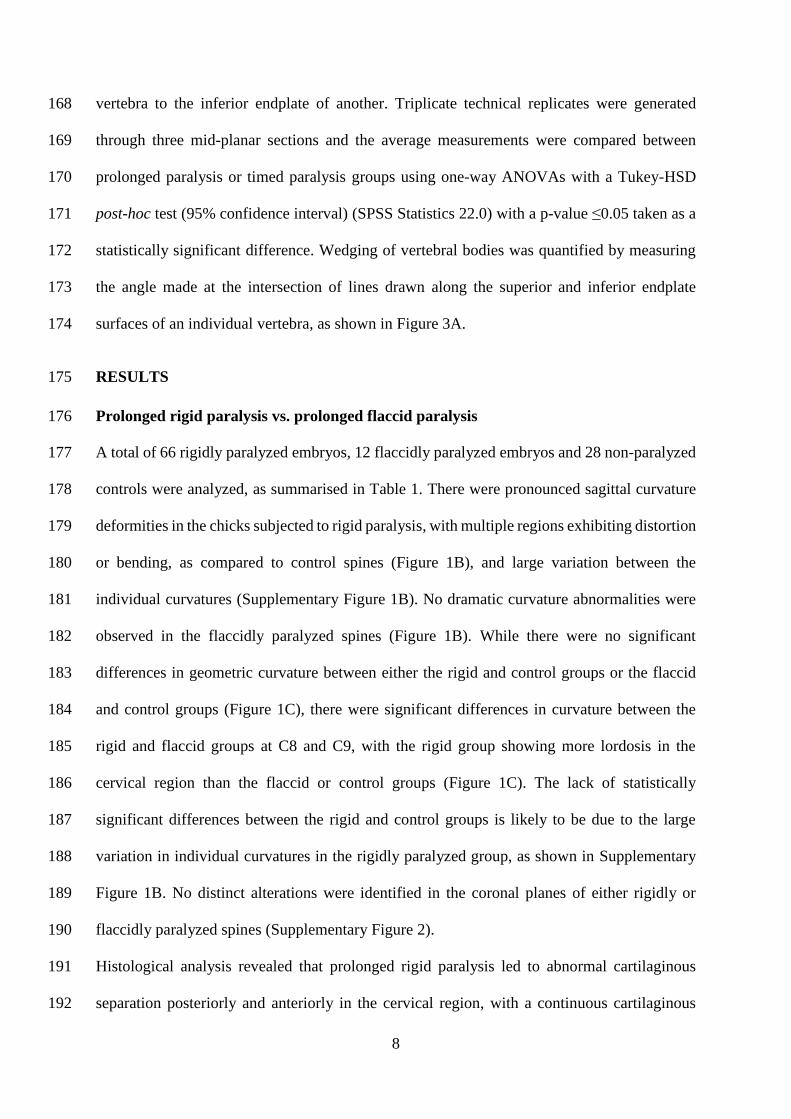
of the type of muscle forces and the critical timing of fetal movement on the developing spine. 78
This study uses the pharmacologically paralyzed chick embryo model to determine the nature 79
of mechanical stimulation due to muscle activity required for normal spinal curvature and 80
vertebral segmentation and shape. The embryonic chick model is commonly used for 81
investigating the role of fetal movements in skeletal development due to the ease of exogenous 82
manipulation of the developing embryo. In contrast to the human spine, which consists of 7 83
cervical, 12 thoracic, 5 lumbar vertebrae and the sacrum and coccyx29, the chick spine consists 84
of 14 cervical, 7 thoracic, 7 lumbar, 7 sacral and 7 caudal vertebrae (Figure 1A). An important 85
difference between the avian and the mammalian spine is that no involution of the notochord 86
takes place, and no nucleus pulposus is present in the avian intervertebral disc (IVD)30. 87
The hypothesis that fetal movements influence the development of the spine is tested by 88
comparing the effects of prolonged rigid paralysis (constant static muscle forces without any 89
dynamic component) and flaccid paralysis (no static or dynamic muscle forces) to development 90
with normal fetal movements. Furthermore, we tested the hypothesis that earlier paralysis 91
induces more severe effects on spine development than later paralysis, and aim to establish the 92
critical time-points for the influence of muscle forces on spine development. 93
94

5
METHODS 95
In ovo paralysis 96
Fertilised eggs (DeKalb white, MedEggs, Norfolk, UK), were incubated at 37.5°C in a 97
humidified incubator for 9 days. Controls were treated with 100µl of PBS plus 100units/ml 98
antibiotic (Pen. Strep, Sigma, UK). 0.5% Decamethonium bromide (DMB) was used for rigid 99
paralysis, or 5mg/ml Pancuronium bromide (PB), both dissolved in PBS plus 100units/ml 100
antibiotic (Pen. Strep) (all Sigma, UK) for flaccid paralysis. Paralyzed embryos were visually 101
monitored for movement daily, and no independent spontaneous movements were detected 102
during monitoring. DMB is a neuromuscular blocking agent that induces rigid paralysis, where 103
contraction of all skeletal muscle fibres is sustained, while PB induces flaccid paralysis wherein 104
both dynamic and static forces are removed31. Neuromuscular blocking agents lead to a 105
reduction in muscle size and contractile properties32, and therefore, the static forces that would 106
be experienced in the case of rigid paralysis would be substantially less than those experienced 107
during normal dynamic muscle contractions. Treatments were delivered once every 24 hours 108
in 100μl volumes that were administered on to the vasculature of the developing embryo. All 109
experiments were performed in accordance with European Legislation (Directive 2010/63/EU), 110
under which no license is required when working with embryos younger than two thirds 111
gestation. Two types of paralysis regimen were applied; prolonged paralysis (treatment every 112
24 hours from embryonic day (E)3, equivalent to day 3 of incubation, until harvest at E9), and 113
timed paralysis (varying day of initiation of paralysis). Prolonged paralysis was performed for 114
both rigid and flaccid treatments, while timed paralysis was performed for rigid paralysis only. 115
In the timed paralysis study, rigid paralysis was initiated at E3, 4, 5, 6, 7 or 8, and continued 116
on consecutive days until E9. Euthanasia and harvesting of each specimen was performed by 117
cutting the vasculature surrounding the embryo and placing it in ice cold PBS, following which 118
the spines were carefully dissected. 119

6
Skeletal preparation, 3D scanning and image processing 120
Whole spines were stained in 0.015% alcian Blue in 95% Ethanol for 6–8 hours, and cleared 121
in 1% Potassium Hydroxide (KOH) for 4–6 hours. Specimens were scanned in 3D using 122
Optical Projection Tomography (OPT)33. 3D surface representations were produced for each 123
spine using ImageJ34. In order to visualise curvature changes, these 3D representations were 124
rotated so that the vertebral bodies and spinous processes were visible, and a line traced along 125
the centres of the vertebral bodies to obtain an outline trace of the sagittal plane curvature. 126
Next, the 3D representations were rotated so that the anterior aspect of the vertebral bodies 127
were foremost and the posterior and lateral portions out of view, and a line traced along the 128
centres of the vertebral bodies to provide an outline trace of the curvature in the coronal plane. 129
Both sets of outline traces were aligned at thoracic vertebra 1 (T1). 130
Quantitative analysis of curvature in the sagittal plane 131
The geometric curvature (GC), where GC=1/ radius of curvature35, was calculated for each 132
vertebral body in the sagittal plane. For identifying the centre of each vertebra from the 3D 133
data, each vertebra was individually aligned to a sagittal view such that the vertebral body and 134
spinous processes were parallel. Within this plane, the virtual section which represented the 135
mid-sagittal section of the notochord (which, in the chick spine, goes through the centre of the 136
vertebral body) was identified. From this section, the point at the centre and halfway along the 137
length of the notochord was taken as the x and y co-ordinates for the centre of the vertebra in 138
the mid-sagittal section. Therefore, the points representing the centre of each vertebra are not 139
precisely aligned in a single plane, but rather lie on the mid-planes bisecting each vertebral 140
body. A curve was fitted to the vertebral coordinates using a cubic smoothing spline function, 141
which places a third order polynomial around each point to fit an accurate curve across the 142
data-set (MathWorks®, R2015a). Geometric curvature is defined for an arbitrary position on 143
the spine as the reciprocal to the radius R of the osculating circle in 3D at that position and 144

7
represents the amount by which the 3D vertebral body-line deviates from being straight. The 145
geometric curvature was obtained as previously described35: 146
𝐺𝐶(𝑝) =|𝑑𝑪(𝑝)𝑑𝑝
×𝑑2𝑪(𝑝)𝑑𝑝2
|
|𝑑𝑪(𝑝)𝑑𝑝
|3 =
1
𝑅(𝑝) 147
where C(p) is the vector [x(p), y(p)], giving the x and y coordinates of the curve as a function 148
of the pth vertebra, and R(p) is the radius of curvature. Changes in geometric curvature at each 149
vertebra along the sagittal plane of the spines were compared between prolonged paralysis or 150
timed paralysis groups using one-way ANOVAs with a Tukey-HSD post-hoc test (95% 151
confidence interval) (GraphPadPrism 4), with a p-value ≤0.05 taken as a statistically significant 152
difference between groups. Data are expressed in the form of mean standard error of the mean 153
(SEM). 154
Vertebral segmentation 155
Histological analysis of vertebral segmentation, the distinct spatial separation of cartilaginous 156
vertebrae, was performed following paraffin embedding, sectioning (8µm) and staining with 157
0.025% alcian blue in 3% acetic acid (for cartilage) for 1 hour followed by 1% picro-sirus red 158
(for collagen) for 1 hour. 159
Vertebral shape 160
Measurements were made of individual vertebral bodies, of functional spinal units (FSUs: two 161
adjoining vertebrae and an intervertebral disc) and of spinal segments (multiple FSUs) of 162
selected regions of the cervical (C10–C14), thoracic (T4–T7) and lumbar (L4-L7) spine. 163
Virtual dissection and 2D measurements were performed in ImageJ. Vertebral body height, 164
anterior to posterior vertebral sagittal width, and vertebral width from neural arch to neural 165
arch were measured. The heights of individual FSUs and spinal segments were measured on 166
mid-sagittal sections, with height defined as the distance from the superior endplate of one 167
8
vertebra to the inferior endplate of another. Triplicate technical replicates were generated 168
through three mid-planar sections and the average measurements were compared between 169
prolonged paralysis or timed paralysis groups using one-way ANOVAs with a Tukey-HSD 170
post-hoc test (95% confidence interval) (SPSS Statistics 22.0) with a p-value ≤0.05 taken as a 171
statistically significant difference. Wedging of vertebral bodies was quantified by measuring 172
the angle made at the intersection of lines drawn along the superior and inferior endplate 173
surfaces of an individual vertebra, as shown in Figure 3A. 174
RESULTS 175
Prolonged rigid paralysis vs. prolonged flaccid paralysis 176
A total of 66 rigidly paralyzed embryos, 12 flaccidly paralyzed embryos and 28 non-paralyzed 177
controls were analyzed, as summarised in Table 1. There were pronounced sagittal curvature 178
deformities in the chicks subjected to rigid paralysis, with multiple regions exhibiting distortion 179
or bending, as compared to control spines (Figure 1B), and large variation between the 180
individual curvatures (Supplementary Figure 1B). No dramatic curvature abnormalities were 181
observed in the flaccidly paralyzed spines (Figure 1B). While there were no significant 182
differences in geometric curvature between either the rigid and control groups or the flaccid 183
and control groups (Figure 1C), there were significant differences in curvature between the 184
rigid and flaccid groups at C8 and C9, with the rigid group showing more lordosis in the 185
cervical region than the flaccid or control groups (Figure 1C). The lack of statistically 186
significant differences between the rigid and control groups is likely to be due to the large 187
variation in individual curvatures in the rigidly paralyzed group, as shown in Supplementary 188
Figure 1B. No distinct alterations were identified in the coronal planes of either rigidly or 189
flaccidly paralyzed spines (Supplementary Figure 2). 190
Histological analysis revealed that prolonged rigid paralysis led to abnormal cartilaginous 191
separation posteriorly and anteriorly in the cervical region, with a continuous cartilaginous 192

9
posterior structure (fused spinous processes) and abnormal definition of the joint between 193
vertebral bodies (symphysis joints), as shown in Figure 2B. Fusion of the posterior spinous 194
processes was also present in the thoracic and lumbar regions of rigidly paralyzed spines, while 195
the symphysis joints in these regions appeared to form normally, as shown in Supplementary 196
Figure 3. No segmentation abnormalities were evident with flaccid paralysis, yet the 197
morphologies of the spinous processes were abnormal in the cervical region (as shown in 198
Figure 2B). The spinous processes of the thoracic and lumbar regions in flaccidly paralyzed 199
specimens were similar to those of non-paralyzed controls. Histological analyses also revealed 200
unusual pathological changes in the vertebrae of rigidly paralyzed spines, including distortions 201
in the normal sagittal cross-sectional shape of the vertebral bodies in the cervical and thoracic 202
regions (Supplementary Figure 4). A feature evident from visual inspection of the rigidly 203
paralyzed spines is regions of extreme curvature (also visible in Figure 1B, Rigid) in which 204
separation of the joints of vertebral bodies has taken place (Figure 3C ii & iv), while the spinal 205
column remains intact through the posterior spinous process joints. Histological analysis 206
revealed regions in which the spinal cord protrudes anteriorly, separating the vertebral bodies 207
(as shown in Supplementary Figure 4i), and this is likely what is leading to these regions of 208
extreme curvature. 209
Changes in size and shape of vertebral bodies and spinal segment shapes were quantified in 210
sub-regions of the cervical, thoracic and lumbar spine (vertebrae of the sacral and caudal 211
regions were not analyzed based on a lack of relevance to the human spine). When heights of 212
individual and multiple FSUs in selected sub-regions were measured, no differences were 213
found in any region for either paralysis group. However, analysis of individual vertebrae 214
revealed that the vertebral body height of C10 was significantly reduced in both prolonged 215
paralysis groups, with average reductions of 16.8% following rigid paralysis and 18.1% 216
following flaccid paralysis (Figure 2C-E). No FSUs within which C10 was contained showed 217

10
changes in height, which could be due to the effects of wedging, as shown in Figure 3. The 218
only other significant shape change found was an increase in vertebral sagittal width in T6 and 219
T7 (by an average of 26.3% and 24.1%, respectively) in the rigidly paralyzed group (Figure 220
2D-E). Wedging was apparent in the thoracic region of the rigidly paralyzed spines, as 221
illustrated in Figure 3. While control vertebral endplates were parallel (angle of zero degrees), 222
all of the vertebrae within the T4 to T7 spinal segment exhibited posterior wedging, with 223
average angles of 6.7±2.9° (T4), 7.2±2.0° (T5) 6.2±2.2° (T6) and 7.8±1.7° (T7) (Table 2). 224
While it is likely that wedging also was present in the cervical spine of rigidly paralyzed spines, 225
vertebral fusion in this region prevented measurement of wedging angles. No wedging was 226
present in the flaccidly paralyzed spines (Table 2g). 227
Timed initiation of rigid paralysis 228
In addition to the prolonged rigid paralysis experiment (E3–E9) already described, five further 229
rigid paralysis regimes were administered by varying the day of onset of paralysis from E4 to 230
E8. The numbers of specimens analyzed are summarised in Table 1, with controls being pooled 231
between groups. When rigid paralysis was initiated on or before E5, this resulted in multiple 232
regions of abnormal kyphosis and lordosis compared to normal sagittal curvatures (Figure 4A). 233
However, only paralysis from E4 led to significant differences in curvature as compared to 234
controls, with significant changes in geometric curvature at five vertebral locations; C3, C4 235
and L5–L7 (Figure 4B). As in the case of prolonged rigid paralysis, the lack of statistically 236
significant changes in geometric curvature in spines paralyzed on E5 or earlier is likely to be 237
due to the large variation between individual specimens (Supplementary Figure 1). 238
Commencing rigid paralysis on or after E6 did not have a measurable effect on curvature, with 239
no distinct abnormalities in sagittal curvature evident from outlines (Figure 4A), and no 240
significant differences in geometric curvature (Figure 4B). These results suggest that onset of 241
rigid paralysis on or before E5, which is prior to formation of the vertebrae at E636, has the 242

11
most severe effects on development of general spinal curvature, with initiation of rigid 243
paralysis at E4 leading to the most consistent effects on geometric curvature. 244
Histological analysis of the additional groups in which rigid paralysis was initiated on or before 245
E5 exhibited similar results to those described for the prolonged rigid paralysis (E3–E9) group. 246
All of these groups had fusion of the posterior spinous processes in the cervical, thoracic and 247
lumbar regions (Figure 5A, Supplementary Figure 3), and fusion of the symphysis joints in the 248
cervical region, with apparently normal segmentation of the symphysis joints in the thoracic 249
and lumbar regions (Figure 5A, supplementary Figure 3). In all three of the groups paralyzed 250
on or after E6, a collagen rich space was visible posteriorly and anteriorly between the vertebrae 251
(Figure 5A), indicating normal segmentation of both the spinous processes and symphysis 252
joints. As performed previously, changes in size and shape of vertebral bodies and spinal 253
segment shapes were quantified in sub-regions of the cervical, thoracic and lumbar spine. As 254
in the prolonged rigid paralysis results, no difference in FSU or spinal segment height was 255
found in either of the additional groups paralyzed on or before E5. Similarly to the prolonged 256
rigid paralysis group, there were reductions in the vertebral body height of C10, with average 257
reductions of 19.3% for the E4–E9 group and 21.8% for the E5–E9 group (Figure 5B). The 258
only other significant difference measured in these groups was a reduction in the vertebral body 259
width of L5 by an average of 22% in the group that underwent paralysis from E4–E9 (Figure 260
5C). The only shape difference found in the groups paralyzed from E6 onwards was a reduction 261
in the vertebral width of T6 by 18.8% in the E7–E9 group (Figure 5D). Average posterior 262
wedging angles in T4–T7 varied from 6–7º for the E3–E9 group (as previously described), 3–263
5º for the E4–E9 and E5–E9 groups, 2–3º for the E6–E9 group and less than 1º for the E7–E9 264
and E8–E9 groups, as summarized in Table 2. Therefore, the longer paralysis was maintained, 265
the more severe the average posterior wedging angles. 266

12
DISCUSSION 267
Our primary hypothesis, that altering fetal movement causes abnormalities in the developing 268
spine has been corroborated. Rigidly paralyzed spines showed distinct defects in all three of 269
the key variables; curvature, segmentation and vertebral shape, while flaccidly paralyzed spines 270
exhibited only subtle changes in vertebral shape, with no effects on curvature or segmentation. 271
These results suggest that sustained, static muscle loading is highly detrimental to early spine 272
development, while the removal of both static and dynamic components of muscle activity has 273
mild effects on spine development at the single timepoint examined. The timing of initiation 274
of rigid paralysis had a distinct influence on the extent of the effects on the spine, corroborating 275
our secondary hypothesis that paralysis at earlier stages of development would result in more 276
severe spinal deformations. Spines subjected to initiation of rigid paralysis on or before E5 277
were severely affected with curvature and segmentation abnormalities, while the only 278
measureable differences to controls in spines of specimens paralyzed from E6 onwards were 279
slight wedging angles, and a change in one shape parameter in one of the sub-groups. 280
There are some limitations to this research. As all of our analyses were performed at E9, we do 281
not know how segmentation, shape morphogenesis and spinal curvature are affected prior to, 282
or after this timepoint. For example, although prolonged flaccid paralysis did not lead to 283
dramatic effects on the spine at E9, it is possible that had development been allowed to progress 284
further, more pronounced effects would have emerged. Such investigations will be undertaken 285
in future studies. The prolonged paralysis regimes used in this study are well-controlled and 286
prioritise the identification of effects, but would be extreme compared to what might occur in 287
a clinical condition of reduced or abnormal fetal movement. However, the prolonged paralysis 288
regimes would be analogous to fetal akinesia deformation sequence (FADS)9,10, and the timed 289
studies illustrate that even short periods of immobility can have local effects on vertebral shape 290
and wedging angles. Finally, since the chick notochord does not undergo involution and since 291

13
the disc lacks a nucleus pulposus, this study does not characterise the effects of paralysis on 292
the intervertebral disc, and a mammalian model system of abnormal fetal movements would 293
be necessary to investigate the disc. Nonetheless, many aspects of the current study have only 294
have been possible due to the flexibility of the chick system, and investigation of the effects of 295
timed paralysis in a mammalian system would be very difficult, if not impossible. 296
Aspects of abnormal spine development identified in this study correlate with the key features 297
of congenital spine deformities, namely curvature abnormalities and vertebral wedging. 298
Initiation of rigid paralysis on or before E5 induced severe effects on spinal curvature, with 299
regions of hyper-lordosis and hyper-kyphosis, as seen, respectively, in congenital lordosis and 300
kyphosis2. Vertebral body wedging was evident in the thoracic region following rigid paralysis, 301
which, in the case of scoliosis, has been shown to correlate with the severity of curvature 302
defect37,38. While curvature changes in the coronal plane are the most common presentation of 303
congenital spine deformities1 (which, however, are commonly associated with a sagittal 304
deformity2) no changes in coronal curvature were seen in the model system. This difference 305
could be due to the pronounced differences in spinal anatomy of the chicken and human, and 306
could also be related to the differences in developmental mechanical environments of the 307
mammal and bird. Future work will explore use of a mammalian model system of abnormal 308
fetal movements to provide insight into this aspect. 309
While there is very sparse literature from animal models with which to compare our results, 310
alternations in spinal curvature have previously been reported, but not quantified, in 311
immobilized chicks under prolonged paralysis24-26, and in mammalian models of absent fetal 312
movements20,28,39. Fusion of the vertebrae has also been previously reported in animal models 313
of abnormal fetal movements20,24,25,27,28, but this study is the first to describe region-specific 314
fusion, both in the description of fusion of posterior and anterior aspects of the vertebrae 315
(spinous processes vs. symphysis joints), and the identification of the cervical spine as the part 316

14
of the spine most prone to vertebral fusions following prolonged rigid paralysis. Furthermore, 317
this is the first study to look at the effects of varying the time of onset of paralysis on the spine, 318
and the only study to describe the effects of flaccid paralysis on the spine. 319
A number of aspects of the results merit further discussion. For all of the experiments 320
described, global paralysis led to local effects, with some regions being more affected than 321
others. With both types of prolonged paralysis, the cervical spine was the most affected region, 322
with shape changes in C10, and significant differences in curvature in C8 and C9 between the 323
paralyzed groups. In the prolonged and early (on or before E5) rigidly paralyzed groups, only 324
the cervical region had abnormal segmentation for both the anterior symphysis joints and the 325
posterior spinous process joints while in the prolonged flaccid group, the spinous process joints 326
of only the cervical region were abnormally shaped. Considering the very long length of the 327
cervical spine in the chick (Figure 1), and the large size of the chick head at early stages of 328
development, it is possible that the weight of the head exacerbates the effects of paralysis. Since 329
the human cervical spine has much fewer vertebrae than in the chick, the cervical region may 330
not be disproportionately affected during human development. It is unclear why the shape of 331
C10 was particularly prone to shape changes. C10 falls within the normal kyphotic curve of 332
the cervical spine, which could potentially lead to a higher likelihood of deformation of this 333
region. Commencing rigid paralysis on or prior to E6 led to substantial (>1°) wedging in the 334
thoracic spine. Rib cartilage appears in the chick from E7–7.536, and alterations in the 335
development of ribs have previously been reported following a reduction in mechanical 336
stimulation39,40. Therefore, the alterations seen in the thoracic region may be due to an 337
alteration in rib architecture, which will be investigated in future studies. Finally, this study 338
quantified shape changes in sub-regions of the cervical, thoracic and lumbar spine. Even within 339
the regions in which changes in curvature occurred, the shape parameters measured (vertebral 340
body height, sagittal width and anterior width) were not significantly different from the 341

15
equivalent measurements in non-paralyzed controls. Since our analyses were performed at a 342
single timepoint, it is possible that vertebral shape abnormalities prior to E9 could lead to 343
changes in curvature in other regions of the spine as development progresses. 344
With rigid paralysis, only the dynamic component of the muscle forces is absent and sustained 345
static loading is applied, while with flaccid paralysis, both the rigid and static components are 346
absent. In the joints of the chick limb, rigid paralysis has been shown to have slightly more 347
pronounced effects on the length and breadth of the cartilaginous epiphyses than flaccid 348
paralysis31, while conversely, late application of rigid paralysis induced more normal cavitation 349
of the joints of the limb as compared to late flaccid paralysis31. The current study shows that 350
the effects on the spine of prolonged rigid paralysis are dramatic, while the effects of prolonged 351
flaccid paralysis are more subtle. Our working hypothesis is that the structures of the very early 352
spinal column are malleable, leading to their deformation under sustained static loading (rigid 353
paralysis). It has previously been proposed that static loading supresses cartilaginous growth 354
in the rudiments of the limbs31, and we believe that this is what occurs in the spine. This theory 355
is bolstered by the fact that the very small, delicate joints of the spinous processes are more 356
widely affected than the thicker joints of the vertebral bodies in rigidly paralyzed spines. 357
Although the effects of rigid paralysis were more dramatic, prolonged flaccid paralysis did 358
have some effects on the shape of some spinous processes and on the shape of one vertebral 359
body, which could become more pronounced over subsequent development. Another key novel 360
finding of this study is the apparent “cut-off” timepoint of E6, where rigid paralysis from E5 361
or earlier leads to abnormal curvatures and vertebral segmentation, while paralysis after E6 did 362
not affect curvature or vertebral segmentation. E3 marks the developmental timepoint at which 363
a well-defined myotome is present in the developing chick36, while movement of the embryonic 364
chick neck and spine has been reported to start at E3.541. Formation of the sclerotome, from 365
which the vertebral bodies and spinous processes form, begins at around E2.5, but the 366

16
segmentation of distinct cartilaginous vertebrae is not complete until E636,42 (all timings for the 367
chick embryo). These results therefore indicate that sustained, static loading is particularly 368
detrimental to the process of sclerotome development during which it is sub-369
compartmentalized to form the different parts of the axial skeleton, most likely due to 370
compression of the emerging, delicate structures. 371
In conclusion, this study demonstrates that both the timing and the type of mechanical 372
stimulation due to fetal movements are key to a number of aspects of the developing spine, 373
including spinal curvature and vertebral segmentation and shape, with important implications 374
for future research into the aetiology of congenital spine deformities. 375
376
ACKNOWLEDGEMENTS 377
This research was funded by a Leverhulme Trust Research Project Grant (RPG-2014-339). 378
379
REFERENCES 380
1 Burnei, G. et al. Congenital scoliosis: an up-to-date. Journal of medicine and life 8, 381
388-397 (2015). 382
2 Lonstein, J. E. Congenital spine deformities: scoliosis, kyphosis, and lordosis. The 383
Orthopedic clinics of North America 30, 387-405, viii (1999). 384
3 McMaster, M. J. & Singh, H. Natural history of congenital kyphosis and 385
kyphoscoliosis. A study of one hundred and twelve patients. The Journal of bone and 386
joint surgery. American volume 81, 1367-1383 (1999). 387
4 Batra, S. & Ahuja, S. Congenital scoliosis: management and future directions. Acta 388
orthopaedica Belgica 74, 147-160 (2008). 389
5 Giampietro, P. F. et al. Clinical, genetic and environmental factors associated with 390
congenital vertebral malformations. Molecular syndromology 4, 94-105, 391
doi:10.1159/000345329 (2013). 392
6 Li, Z. et al. Vitamin A deficiency induces congenital spinal deformities in rats. PloS 393
one 7, e46565, doi:10.1371/journal.pone.0046565 (2012). 394

17
7 Sparrow, D. B. et al. A mechanism for gene-environment interaction in the etiology 395
of congenital scoliosis. Cell 149, 295-306, doi:10.1016/j.cell.2012.02.054 (2012). 396
8 Loder, R. T. et al. The induction of congenital spinal deformities in mice by maternal 397
carbon monoxide exposure. Journal of pediatric orthopedics 20, 662-666 (2000). 398
9 Moessinger, A. C. Fetal akinesia deformation sequence: an animal model. Pediatrics 399
72, 857-863 (1983). 400
10 Hall, J. G. Pena-Shokeir phenotype (fetal akinesia deformation sequence) revisited. 401
Birth defects research. Part A, Clinical and molecular teratology 85, 677-694, 402
doi:10.1002/bdra.20611 (2009). 403
11 Bisceglia, M., Zelante, L., Bosman, C., Cera, R. & Dallapiccola, B. Pathologic 404
features in two siblings with the Pena-Shokeir I syndrome. European journal of 405
pediatrics 146, 283-287 (1987). 406
12 Crane, J. P. & Heise, R. L. New syndrome in three affected siblings. Pediatrics 68, 407
235-237 (1981). 408
13 Elias, S., Boelen, L. & Simpson, J. L. Syndromes of camptodactyly, multiple 409
ankylosis, facial anomalies, and pulmonary hypoplasia. Birth defects original article 410
series 14, 243-251 (1978). 411
14 Lazjuk, G. I., Cherstvoy, E. D., Lurie, I. W. & Nedzved, M. K. Pulmonary 412
hypoplasia, multiple ankyloses, and camptodactyly: one syndrome or some related 413
forms? Helvetica paediatrica acta 33, 73-79 (1978). 414
15 Lindhout, D. et al. The Pena-Shokeir syndrome: report of nine Dutch cases. American 415
journal of medical genetics 21, 655-668, doi:10.1002/ajmg.1320210407 (1985). 416
16 Mailhes, J. B., Lancaster, K., Bourgeois, M. J. & Sanusi, I. D. 'Pena-Shokeir 417
syndrome' in a newborn male infant. American journal of diseases of children (1960) 418
131, 1419-1420 (1977). 419
17 Ochi, H., Kobayashi, E., Matsubara, K., Katayama, T. & Ito, M. Prenatal sonographic 420
diagnosis of Pena-Shokeir syndrome type I. Ultrasound in obstetrics & gynecology : 421
the official journal of the International Society of Ultrasound in Obstetrics and 422
Gynecology 17, 546-547, doi:10.1046/j.1469-0705.2001.00405.x (2001). 423
18 Stokes, I. A., Burwell, R. G. & Dangerfield, P. H. Biomechanical spinal growth 424
modulation and progressive adolescent scoliosis--a test of the 'vicious cycle' 425
pathogenetic hypothesis: summary of an electronic focus group debate of the IBSE. 426
Scoliosis 1, 16, doi:10.1186/1748-7161-1-16 (2006). 427

18
19 Nowlan, N. C., Murphy, P. & Prendergast, P. J. Mechanobiology of embryonic limb 428
development. Annals of the New York Academy of Sciences 1101, 389-411, 429
doi:10.1196/annals.1389.003 (2007). 430
20 Kahn, J. et al. Muscle contraction is necessary to maintain joint progenitor cell fate. 431
Developmental cell 16, 734-743, doi:10.1016/j.devcel.2009.04.013 (2009). 432
21 Nowlan, N. C. et al. Developing bones are differentially affected by compromised 433
skeletal muscle formation. Bone 46, 1275-1285, doi:10.1016/j.bone.2009.11.026 434
(2010). 435
22 Nowlan, N. C., Chandaria, V. & Sharpe, J. Immobilized chicks as a model system for 436
early-onset developmental dysplasia of the hip. Journal of orthopaedic research : 437
official publication of the Orthopaedic Research Society 32, 777-785, 438
doi:10.1002/jor.22606 (2014). 439
23 Roddy, K. A., Prendergast, P. J. & Murphy, P. Mechanical influences on 440
morphogenesis of the knee joint revealed through morphological, molecular and 441
computational analysis of immobilised embryos. PloS one 6, e17526, 442
doi:10.1371/journal.pone.0017526 (2011). 443
24 Murray, P. D. & Drachman, D. B. The role of movement in the development of joints 444
and related structures: the head and neck in the chick embryo. Journal of embryology 445
and experimental morphology 22, 349-371 (1969). 446
25 Sullivan, G. Prolonged paralysis of the chick embryo, with special reference to effects 447
on the vertebral column. Australian Journal of Zoology 14, 1-17, 448
doi:http://dx.doi.org/10.1071/ZO9660001 (1966). 449
26 Sullivan, G. Skeletal abnormalities in chick embryos paralysed with decamethonium. 450
Australian Journal of Zoology 22, 429-438, doi:http://dx.doi.org/10.1071/ZO9740429 451
(1974). 452
27 Hosseini, A. & Hogg, D. A. The effects of paralysis on skeletal development in the 453
chick embryo. I. General effects. Journal of anatomy 177, 159-168 (1991). 454
28 Rot-Nikcevic, I. et al. Myf5-/- :MyoD-/- amyogenic fetuses reveal the importance of 455
early contraction and static loading by striated muscle in mouse skeletogenesis. 456
Development genes and evolution 216, 1-9, doi:10.1007/s00427-005-0024-9 (2006). 457
29 Kaplan, K. M., Spivak, J. M. & Bendo, J. A. Embryology of the spine and associated 458
congenital abnormalities. The spine journal : official journal of the North American 459
Spine Society 5, 564-576, doi:10.1016/j.spinee.2004.10.044 (2005). 460

19
30 Bruggeman, B. J. et al. Avian intervertebral disc arises from rostral sclerotome and 461
lacks a nucleus pulposus: implications for evolution of the vertebrate disc. 462
Developmental dynamics : an official publication of the American Association of 463
Anatomists 241, 675-683, doi:10.1002/dvdy.23750 (2012). 464
31 Osborne, A. C., Lamb, K. J., Lewthwaite, J. C., Dowthwaite, G. P. & Pitsillides, A. A. 465
Short-term rigid and flaccid paralyses diminish growth of embryonic chick limbs and 466
abrogate joint cavity formation but differentially preserve pre-cavitated joints. Journal 467
of musculoskeletal & neuronal interactions 2, 448-456 (2002). 468
32 Reiser, P. J., Stokes, B. T. & Walters, P. J. Effects of immobilization on the isometric 469
contractile properties of embryonic avian skeletal muscle. Experimental neurology 99, 470
59-72 (1988). 471
33 Sharpe, J. et al. Optical projection tomography as a tool for 3D microscopy and gene 472
expression studies. Science (New York, N.Y.) 296, 541-545, 473
doi:10.1126/science.1068206 (2002). 474
34 Schneider, C. A., Rasband, W. S. & Eliceiri, K. W. NIH Image to ImageJ: 25 years of 475
image analysis. Nature methods 9, 671-675 (2012). 476
35 Vrtovec, T., Likar, B. & Pernus, F. Quantitative analysis of spinal curvature in 3D: 477
application to CT images of normal spine. Physics in medicine and biology 53, 1895-478
1908, doi:10.1088/0031-9155/53/7/006 (2008). 479
36 Shapiro, F. Vertebral development of the chick embryo during days 3-19 of 480
incubation. Journal of morphology 213, 317-333, doi:10.1002/jmor.1052130305 481
(1992). 482
37 Braun, J. T. et al. Experimental scoliosis in an immature goat model: a method that 483
creates idiopathic-type deformity with minimal violation of the spinal elements along 484
the curve. Spine 28, 2198-2203, doi:10.1097/01.brs.0000085095.37311.46 (2003). 485
38 Perdriolle, R., Becchetti, S., Vidal, J. & Lopez, P. Mechanical process and growth 486
cartilages. Essential factors in the progression of scoliosis. Spine 18, 343-349 (1993). 487
39 Pai, A. C. Developmental Genetics of a Lethal Mutation, Muscular dysgenesis 488
(MGD),in the mouse. I. Genetaic analysis and gross morphology. . Developmental 489
biology 11, 82-92 (1965). 490
40 Hall, B. K. & Herring, S. W. Paralysis and growth of the musculoskeletal system in 491
the embryonic chick. Journal of morphology 206, 45-56, 492
doi:10.1002/jmor.1052060105 (1990). 493

20
41 Hamburger, V. & Balaban, M. Observations and experiments on spontaneous 494
rhythmical behavior in the chick embryo. Developmental biology 6, 533-545 (1963). 495
42 Scaal, M. Early development of the vertebral column. Seminars in cell & 496
developmental biology, doi:10.1016/j.semcdb.2015.11.003 (2015). 497
498
499

21
TABLES AND FIGURE LEGENDS 500
Table 1: Numbers of paralyzed and non-paralyzed chick embryos harvested at embryonic day 501
(E) 9. 502
503
Table 2: Average posterior vertebral wedge angles for thoracic vertebrae T4–T7 for control 504
(h) and paralyzed groups (a-g). Measurements shown in degrees. SD; standard deviation. 505
506
Figure 1: Rigid paralysis induced more severe abnormalities in curvature than flaccid 507
paralysis. (A) E9 chick whole spine stained for cartilage. P; posterior, A; Anterior. (B) Overlays 508
of curvatures in the sagittal plane of control spines (blue, n=21), prolonged flaccidly paralyzed 509
spines (orange, n=7) and prolonged rigidly paralyzed spines (red, n=8), with all spines aligned 510
to thoracic vertebra 1 (T1). Regions of pronounced abnormal lordosis (green arrows) and 511
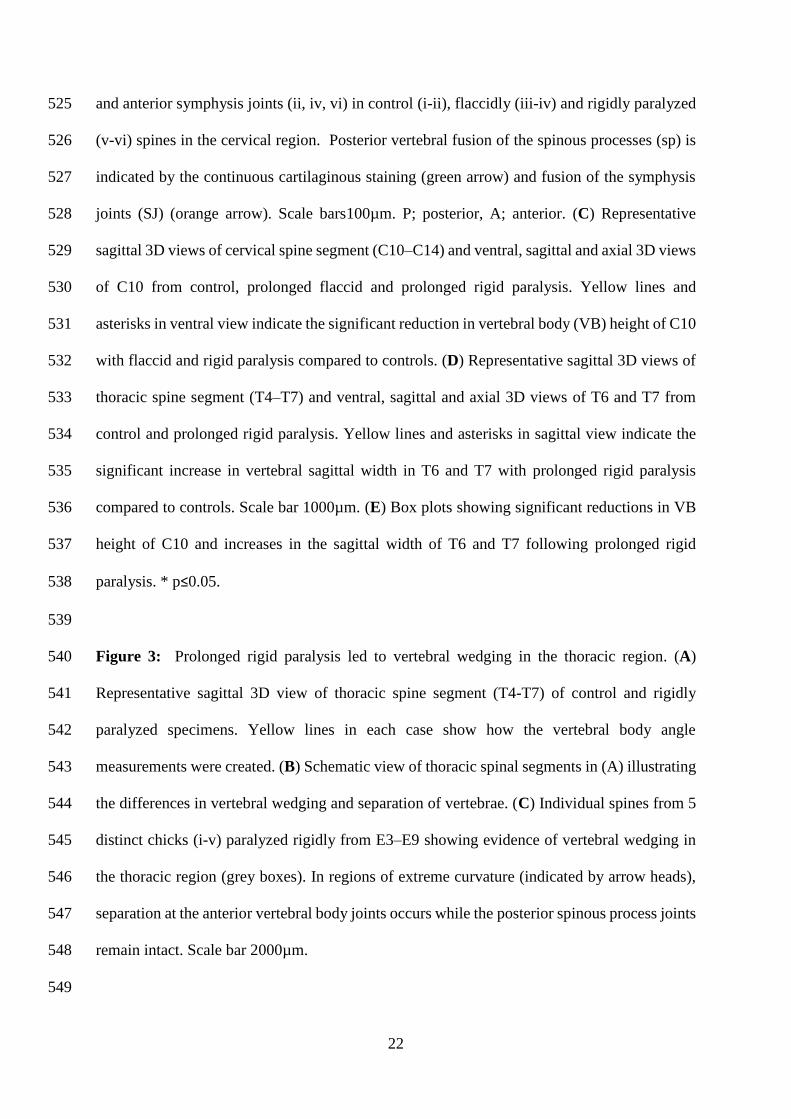
kyphosis (purple stars) are highlighted. Scale Bars 2000µm. (C) Geometric curvature (GC) 512
analysis of flaccidly paralyzed spines (orange line, n=7), rigid paralyzed spines (red line, n=8) 513
and control curves (blue line, n=21). Y-axis; 1/ radius of curvature, represented by arbitrary 514
units of length. GC>0 lordotic curve, GC<0 kyphotic curve, GC=0 straight spine. X-axis; the 515
craniocaudal individual vertebrae. Significant differences were identified between paralysis 516
regimes at C8 and C9, * p≤0.05. C; cervical, T; thoracic, L; lumbar, S; sacral. 517
518
Figure 2: Prolonged rigid paralysis induced vertebral cartilaginous fusion while both 519
prolonged paralysis regimes led to a reduction in vertebral body height in C10. Prolonged rigid 520
paralysis also led to a decrease in the vertebral sagittal width of T6 and T7. (A) Schematic of a 521
normal sagittal cross section of a portion of the cervical region indicating clear separation of 522
the spinous process (sp) and the symphysis joints (SJ). (B) Sagittal sections stained with alcian 523
blue (for cartilage) and picrosirus red (for collagen) show posterior spinous process (i, iii, v) 524
22
and anterior symphysis joints (ii, iv, vi) in control (i-ii), flaccidly (iii-iv) and rigidly paralyzed 525
(v-vi) spines in the cervical region. Posterior vertebral fusion of the spinous processes (sp) is 526
indicated by the continuous cartilaginous staining (green arrow) and fusion of the symphysis 527
joints (SJ) (orange arrow). Scale bars100µm. P; posterior, A; anterior. (C) Representative 528
sagittal 3D views of cervical spine segment (C10–C14) and ventral, sagittal and axial 3D views 529
of C10 from control, prolonged flaccid and prolonged rigid paralysis. Yellow lines and 530
asterisks in ventral view indicate the significant reduction in vertebral body (VB) height of C10 531
with flaccid and rigid paralysis compared to controls. (D) Representative sagittal 3D views of 532
thoracic spine segment (T4–T7) and ventral, sagittal and axial 3D views of T6 and T7 from 533
control and prolonged rigid paralysis. Yellow lines and asterisks in sagittal view indicate the 534
significant increase in vertebral sagittal width in T6 and T7 with prolonged rigid paralysis 535
compared to controls. Scale bar 1000µm. (E) Box plots showing significant reductions in VB 536
height of C10 and increases in the sagittal width of T6 and T7 following prolonged rigid 537
paralysis. * p≤0.05. 538
539
Figure 3: Prolonged rigid paralysis led to vertebral wedging in the thoracic region. (A) 540
Representative sagittal 3D view of thoracic spine segment (T4-T7) of control and rigidly 541
paralyzed specimens. Yellow lines in each case show how the vertebral body angle 542
measurements were created. (B) Schematic view of thoracic spinal segments in (A) illustrating 543
the differences in vertebral wedging and separation of vertebrae. (C) Individual spines from 5 544
distinct chicks (i-v) paralyzed rigidly from E3–E9 showing evidence of vertebral wedging in 545
the thoracic region (grey boxes). In regions of extreme curvature (indicated by arrow heads), 546
separation at the anterior vertebral body joints occurs while the posterior spinous process joints 547
remain intact. Scale bar 2000µm. 548
549
23
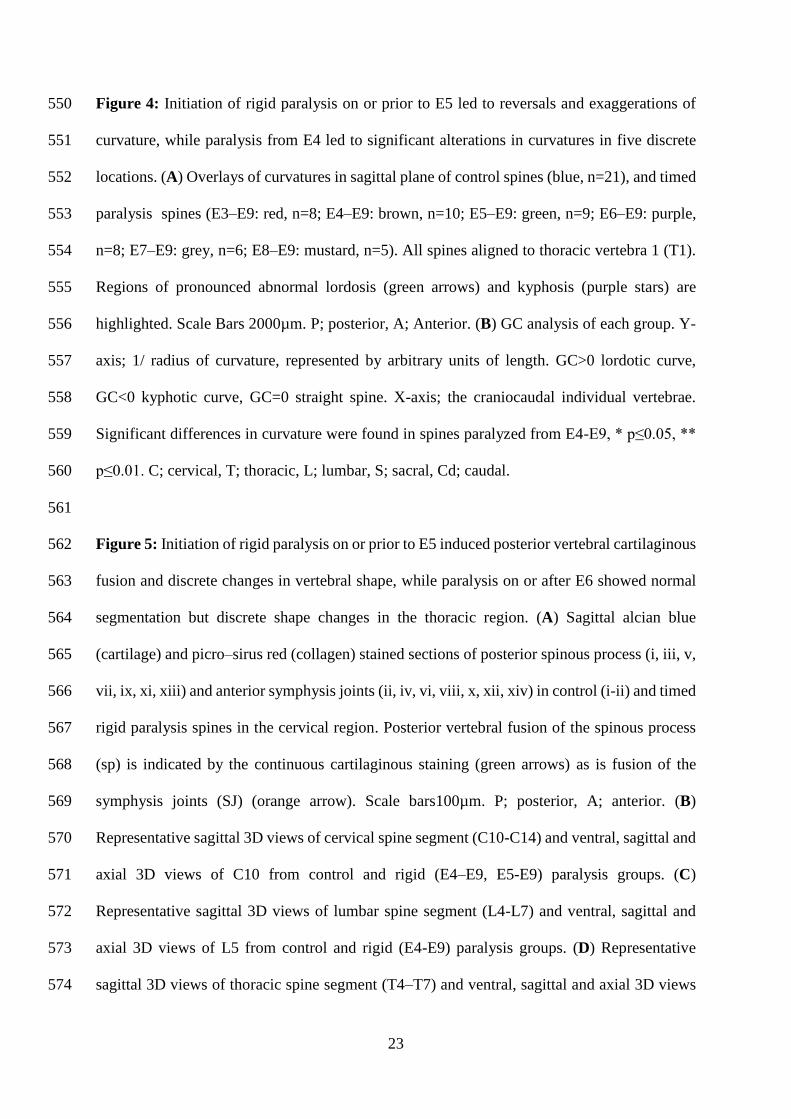
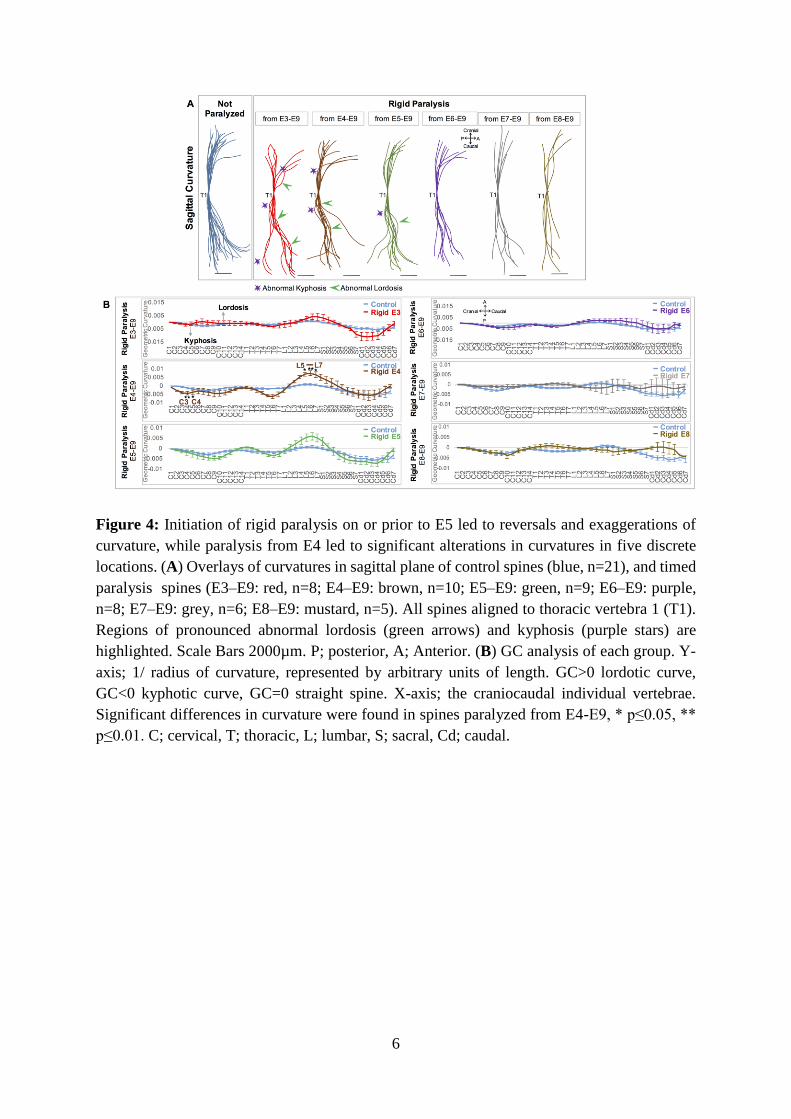
Figure 4: Initiation of rigid paralysis on or prior to E5 led to reversals and exaggerations of 550
curvature, while paralysis from E4 led to significant alterations in curvatures in five discrete 551
locations. (A) Overlays of curvatures in sagittal plane of control spines (blue, n=21), and timed 552
paralysis spines (E3–E9: red, n=8; E4–E9: brown, n=10; E5–E9: green, n=9; E6–E9: purple, 553
n=8; E7–E9: grey, n=6; E8–E9: mustard, n=5). All spines aligned to thoracic vertebra 1 (T1). 554
Regions of pronounced abnormal lordosis (green arrows) and kyphosis (purple stars) are 555
highlighted. Scale Bars 2000µm. P; posterior, A; Anterior. (B) GC analysis of each group. Y-556
axis; 1/ radius of curvature, represented by arbitrary units of length. GC>0 lordotic curve, 557
GC<0 kyphotic curve, GC=0 straight spine. X-axis; the craniocaudal individual vertebrae. 558
Significant differences in curvature were found in spines paralyzed from E4-E9, * p≤0.05, ** 559
p≤0.01. C; cervical, T; thoracic, L; lumbar, S; sacral, Cd; caudal. 560
561
Figure 5: Initiation of rigid paralysis on or prior to E5 induced posterior vertebral cartilaginous 562
fusion and discrete changes in vertebral shape, while paralysis on or after E6 showed normal 563
segmentation but discrete shape changes in the thoracic region. (A) Sagittal alcian blue 564
(cartilage) and picro–sirus red (collagen) stained sections of posterior spinous process (i, iii, v, 565
vii, ix, xi, xiii) and anterior symphysis joints (ii, iv, vi, viii, x, xii, xiv) in control (i-ii) and timed 566
rigid paralysis spines in the cervical region. Posterior vertebral fusion of the spinous process 567
(sp) is indicated by the continuous cartilaginous staining (green arrows) as is fusion of the 568
symphysis joints (SJ) (orange arrow). Scale bars100µm. P; posterior, A; anterior. (B) 569
Representative sagittal 3D views of cervical spine segment (C10-C14) and ventral, sagittal and 570
axial 3D views of C10 from control and rigid (E4–E9, E5-E9) paralysis groups. (C) 571
Representative sagittal 3D views of lumbar spine segment (L4-L7) and ventral, sagittal and 572
axial 3D views of L5 from control and rigid (E4-E9) paralysis groups. (D) Representative 573
sagittal 3D views of thoracic spine segment (T4–T7) and ventral, sagittal and axial 3D views 574

24
of T6 from control, rigid (E7–E9) paralysis. (B-D) Yellow lines indicate the significant 575
differences with paralysis compared to controls. Scale bar 1000µm. 576
577
Supplementary Figure 1: Individual curvatures in the sagittal plane of (B–D) spines paralyzed 578
on or prior to E5 compared to (A) control curvatures aligned to thoracic vertebra 1 (T1). 579
Variation in control curvatures is evident, with more pronounced variation in the cervical and 580
caudal regions depending on the position of the head, and the position of the embryonic 581
pygostyle (plate of bone at the posterior end of the spine). Lordotic (green arrows) and kyphotic 582
(purple stars) curvatures resulted from rigid paralysis, with more severe alterations observed in 583
various sub-regions (B) from E3-E9, (C) E4-E9 and (D) E5-E9 paralyzed spines. Scale bars 584
2000µm 585
586
Supplementary Figure 2: Paralysis induced no pronounced changes in curvatures in the 587
coronal plane. Overlays of curvatures in the coronal plane of control spines (n=21), prolonged 588
flaccidly paralyzed spines (n=7), and rigidly paralyzed spines (E3–E9: n=8; E4–E9: n=10; E5–589
E9: n=9; E6–E9: n=8; E7–E9: n=6; E8–E9: n=5). All spines aligned to thoracic vertebra 1 (T1). 590
Scale bars 2000µm. 591
592
Supplementary Figure 3: Comprehensive histological analysis of vertebral segmentation in 593
E9 spines following (b, j, r) flaccid paralysis and (c–h, k–p, s–x) rigid paralysis from multiple 594
initiation time-points compared to controls (a, i, q). Sections stained with alcian Blue- cartilage/ 595
picro-sirus red- collagen. sc: spinal cord, n; notochord. P; posterior, A; anterior. Scale bars 596
100µm. 597
598

25
Supplementary Figure 4: Pathological changes in the vertebrae were observed following rigid 599
paralysis commenced on or before E5. Dorsal (a–b) and lateral (c–d) views of paralyzed 600
vertebrae show further evidence of vertebral fusion. (b’ and d’) are corresponding red boxes 601
shown at higher magnifications. (f–g, red arrows) Distortions in normal sagittal cross-sectional 602
shape of the vertebral bodies (vb) compared to (e) controls. A unique bending and anterior 603
protrusion of the spinal cord (sc) was observed in one rigidly paralyzed specimen (i, orange 604
arrow) compared to control (h) in which the spinal cord is enclosed within the vertebrae. Sp; 605
spinous process, n; notochord, Scale bar in (a) 500µm, (b–i) 100µm. 606

1
Table 1: Numbers of paralyzed and non-paralyzed chick embryos harvested at embryonic day
(E) 9.
Non-
paralyzed
controls
Paralyzed
Rigid Flaccid
Total 28 66 12
E3–
E9
E4–
E9
E5–
E9
E6–
E9
E7–
E9
E8–
E9 E3–E9
3D 21 8 10 9 8 6 5 7
Histology 7 5 4 3 3 3 2 5

2
Table 2: Average posterior vertebral wedge angles for thoracic vertebrae T4–T7 for control
(h) and paralyzed groups (a-g). Measurements shown in degrees. SD; standard deviation.
(a) Rigid Paralysis E3-E9 (b) Rigid Paralysis E4-E9
Average SD Average SD
T4 6.72º 2.87 T4 4.29º 1.67
T5 7.24º 1.96 T5 4.79º 2.74
T6 6.19º 2.16 T6 3.96º 2.20
T7 7.82º 1.66 T7 3.60º 2.17
(c) Rigid Paralysis E5-E9 (d) Rigid Paralysis E6-E9
Average SD Average SD
T4 3.09º 1.35 T4 2.34 º 1.94
T5 3.95º 2.53 T5 2.27 º 1.46
T6 3.68º 2.05 T6 2.65 º 1.92
T7 3.16º 2.38 T7 2.40 º 1.07
(e) Rigid Paralysis E7-E9 (f) Rigid Paralysis E8-E9
Average SD Average SD
T4 0.26º 0.41 T4 0.40 º 0.90
T5 0.23º 0.37 T5 0.40 º 0.90
T6 0.45º 0.62 T6 0º 0
T7 0.77º 1.05 T7 0º 0
(g) Flaccid Paralysis E3-E9 (h) Non Paralyzed Controls
Average SD Average SD
T4 0º 0 T4 0º 0
T5 0º 0 T5 0º 0
T6 0º 0 T6 0º 0
T7 0º 0 T7 0º 0

3
Figure 1: Rigid paralysis induced more severe abnormalities in curvature than flaccid
paralysis. (A) E9 chick whole spine stained for cartilage. P; posterior, A; Anterior. (B) Overlays
of curvatures in the sagittal plane of control spines (blue, n=21), prolonged flaccidly paralyzed
spines (orange, n=7) and prolonged rigidly paralyzed spines (red, n=8), with all spines aligned
to thoracic vertebra 1 (T1). Regions of pronounced abnormal lordosis (green arrows) and
kyphosis (purple stars) are highlighted. Scale Bars 2000µm. (C) Geometric curvature (GC)
analysis of flaccidly paralyzed spines (orange line, n=7), rigid paralyzed spines (red line, n=8)
and control curves (blue line, n=21). Y-axis; 1/ radius of curvature, represented by arbitrary
units of length. GC>0 lordotic curve, GC<0 kyphotic curve, GC=0 straight spine. X-axis; the
craniocaudal individual vertebrae. Significant differences were identified between paralysis
regimes at C8 and C9, * p≤0.05. C; cervical, T; thoracic, L; lumbar, S; sacral.

4
Figure 2: Prolonged rigid paralysis induced vertebral cartilaginous fusion while both
prolonged paralysis regimes led to a reduction in vertebral body height in C10. Prolonged rigid
paralysis also led to a decrease in the vertebral sagittal width of T6 and T7. (A) Schematic of a
normal sagittal cross section of a portion of the cervical region indicating clear separation of
the spinous process (sp) and the symphysis joints (SJ). (B) Sagittal sections stained with alcian
blue (for cartilage) and picrosirus red (for collagen) show posterior spinous process (i, iii, v)
and anterior symphysis joints (ii, iv, vi) in control (i-ii), flaccidly (iii-iv) and rigidly paralyzed
(v-vi) spines in the cervical region. Posterior vertebral fusion of the spinous processes (sp) is
indicated by the continuous cartilaginous staining (green arrow) and fusion of the symphysis
joints (SJ) (orange arrow). Scale bars100µm. P; posterior, A; anterior. (C) Representative
sagittal 3D views of cervical spine segment (C10–C14) and ventral, sagittal and axial 3D views
of C10 from control, prolonged flaccid and prolonged rigid paralysis. Yellow lines and
asterisks in ventral view indicate the significant reduction in vertebral body (VB) height of C10
with flaccid and rigid paralysis compared to controls. (D) Representative sagittal 3D views of
thoracic spine segment (T4–T7) and ventral, sagittal and axial 3D views of T6 and T7 from
control and prolonged rigid paralysis. Yellow lines and asterisks in sagittal view indicate the
significant increase in vertebral sagittal width in T6 and T7 with prolonged rigid paralysis
compared to controls. Scale bar 1000µm. (E) Box plots showing significant reductions in VB
height of C10 and increases in the sagittal width of T6 and T7 following prolonged rigid
paralysis. * p≤0.05.

5
Figure 3: Prolonged rigid paralysis led to vertebral wedging in the thoracic region. (A)
Representative sagittal 3D view of thoracic spine segment (T4-T7) of control and rigidly
paralyzed specimens. Yellow lines in each case show how the vertebral body angle
measurements were created. (B) Schematic view of thoracic spinal segments in (A) illustrating
the differences in vertebral wedging and separation of vertebrae. (C) Individual spines from 5
distinct chicks (i-v) paralyzed rigidly from E3–E9 showing evidence of vertebral wedging in
the thoracic region (grey boxes). In regions of extreme curvature (indicated by arrow heads),
separation at the anterior vertebral body joints occurs while the posterior spinous process joints
remain intact. Scale bar 2000µm.
6
Figure 4: Initiation of rigid paralysis on or prior to E5 led to reversals and exaggerations of
curvature, while paralysis from E4 led to significant alterations in curvatures in five discrete
locations. (A) Overlays of curvatures in sagittal plane of control spines (blue, n=21), and timed
paralysis spines (E3–E9: red, n=8; E4–E9: brown, n=10; E5–E9: green, n=9; E6–E9: purple,
n=8; E7–E9: grey, n=6; E8–E9: mustard, n=5). All spines aligned to thoracic vertebra 1 (T1).
Regions of pronounced abnormal lordosis (green arrows) and kyphosis (purple stars) are
highlighted. Scale Bars 2000µm. P; posterior, A; Anterior. (B) GC analysis of each group. Y-
axis; 1/ radius of curvature, represented by arbitrary units of length. GC>0 lordotic curve,
GC<0 kyphotic curve, GC=0 straight spine. X-axis; the craniocaudal individual vertebrae.
Significant differences in curvature were found in spines paralyzed from E4-E9, * p≤0.05, **
p≤0.01. C; cervical, T; thoracic, L; lumbar, S; sacral, Cd; caudal.
7

8
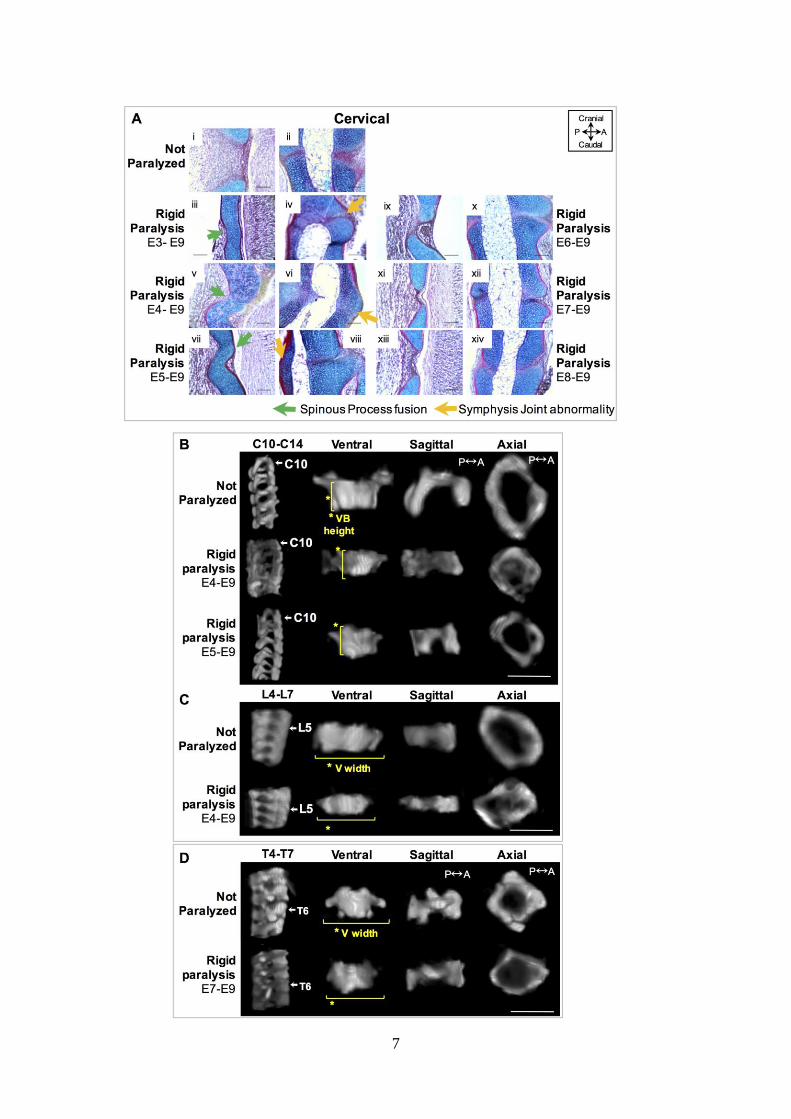
Figure 5: Initiation of rigid paralysis on or prior to E5 induced posterior vertebral cartilaginous
fusion and discrete changes in vertebral shape, while paralysis on or after E6 showed normal
segmentation but discrete shape changes in the thoracic region. (A) Sagittal alcian blue
(cartilage) and picro–sirus red (collagen) stained sections of posterior spinous process (i, iii, v,
vii, ix, xi, xiii) and anterior symphysis joints (ii, iv, vi, viii, x, xii, xiv) in control (i-ii) and timed
rigid paralysis spines in the cervical region. Posterior vertebral fusion of the spinous process
(sp) is indicated by the continuous cartilaginous staining (green arrows) as is fusion of the
symphysis joints (SJ) (orange arrow). Scale bars100µm. P; posterior, A; anterior. (B)
Representative sagittal 3D views of cervical spine segment (C10-C14) and ventral, sagittal and
axial 3D views of C10 from control and rigid (E4–E9, E5-E9) paralysis groups. (C)
Representative sagittal 3D views of lumbar spine segment (L4-L7) and ventral, sagittal and
axial 3D views of L5 from control and rigid (E4-E9) paralysis groups. (D) Representative
sagittal 3D views of thoracic spine segment (T4–T7) and ventral, sagittal and axial 3D views
of T6 from control, rigid (E7–E9) paralysis. (B-D) Yellow lines indicate the significant
differences with paralysis compared to controls. Scale bar 1000µm.
9
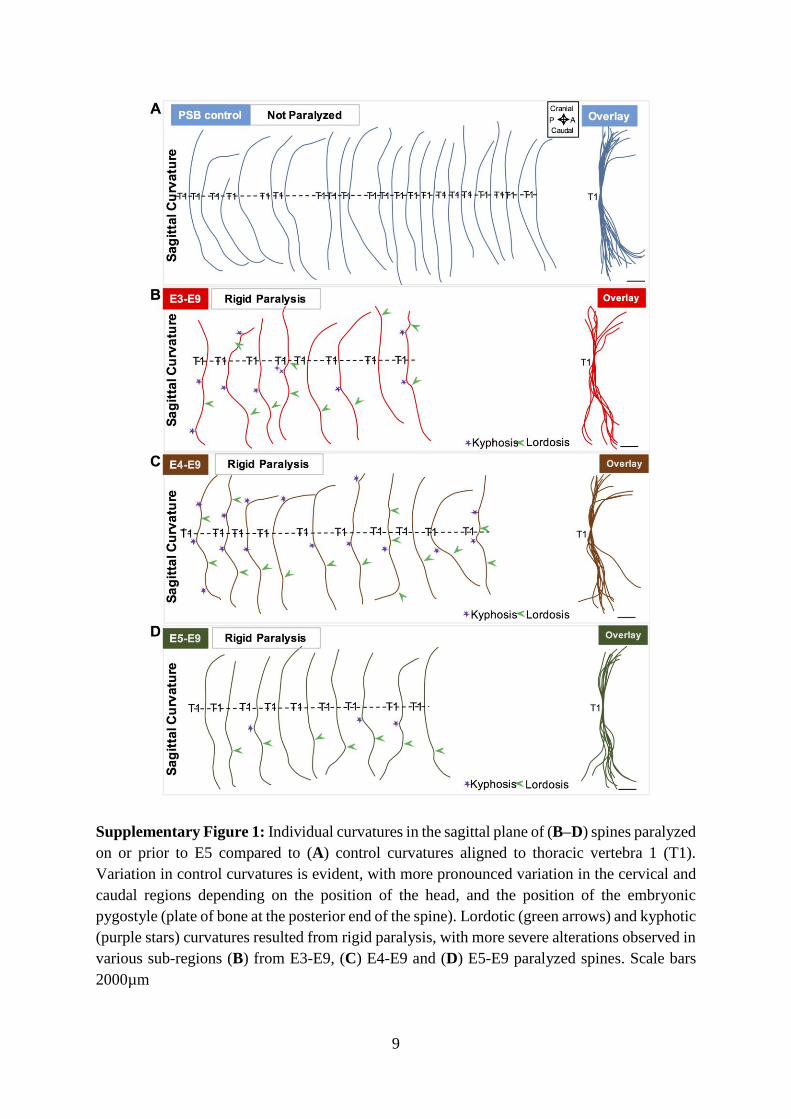
Supplementary Figure 1: Individual curvatures in the sagittal plane of (B–D) spines paralyzed
on or prior to E5 compared to (A) control curvatures aligned to thoracic vertebra 1 (T1).
Variation in control curvatures is evident, with more pronounced variation in the cervical and
caudal regions depending on the position of the head, and the position of the embryonic
pygostyle (plate of bone at the posterior end of the spine). Lordotic (green arrows) and kyphotic
(purple stars) curvatures resulted from rigid paralysis, with more severe alterations observed in
various sub-regions (B) from E3-E9, (C) E4-E9 and (D) E5-E9 paralyzed spines. Scale bars
2000µm

10
Supplementary Figure 2: Paralysis induced no pronounced changes in curvatures in the
coronal plane. Overlays of curvatures in the coronal plane of control spines (n=21), prolonged
flaccidly paralyzed spines (n=7), and rigidly paralyzed spines (E3–E9: n=8; E4–E9: n=10; E5–
E9: n=9; E6–E9: n=8; E7–E9: n=6; E8–E9: n=5). All spines aligned to thoracic vertebra 1 (T1).
Scale bars 2000µm.

11
Supplementary Figure 3: Comprehensive histological analysis of vertebral segmentation in
E9 spines following (b, j, r) flaccid paralysis and (c–h, k–p, s–x) rigid paralysis from multiple
initiation time-points compared to controls (a, i, q). Sections stained with alcian Blue- cartilage/
picro-sirus red- collagen. sc: spinal cord, n; notochord. P; posterior, A; anterior. Scale bars
100µm.

12
Supplementary Figure 4: Pathological changes in the vertebrae were observed following rigid
paralysis commenced on or before E5. Dorsal (a–b) and lateral (c–d) views of paralyzed
vertebrae show further evidence of vertebral fusion. (b’ and d’) are corresponding red boxes
shown at higher magnifications. (f–g, red arrows) Distortions in normal sagittal cross-sectional
shape of the vertebral bodies (vb) compared to (e) controls. A unique bending and anterior
protrusion of the spinal cord (sc) was observed in one rigidly paralyzed specimen (i, orange
arrow) compared to control (h) in which the spinal cord is enclosed within the vertebrae. Sp;
spinous process, n; notochord, Scale bar in (a) 500µm, (b–i) 100µm.