Embed Size (px)
Citation preview
Abiotic and Microbial Oxidation ofLaboratory-Produced Black Carbon(Biochar)A N D R E W R . Z I M M E R M A N †
Department of Geological Sciences, University of Florida,241 Williamson Hall, P. O. Box 112120, Gainesville,Florida 32611-2120
Received October 14, 2009. Revised manuscript receivedDecember 12, 2009. Accepted December 15, 2009.
Pyrogenic or “black” carbon is a soil and sediment componentthat may control pollutant migration. Biochar, black carbonmade intentionally by biomass pyrolysis, is increasingly discussedas a possible soil amendment to increase fertility and sequestercarbon. Though thought to be extremely refractory, it mustdegrade at some rate. Better understanding of the rates andfactorscontrolling itsremineralizationintheenvironment isneeded.Release of CO2 was measured over 1 year from microbialand sterile incubations of biochars made from a range of biomasstypes and combustion conditions. Carbon release fromabiotic incubations was 50-90% that of microbially inoculatedincubations, and both generally decreased with increasingcharring temperature. All biochars displayed log-linearlydecreasing mineralization rates that, when modeled, were usedto calculate 100 year C losses of 3-26% and biochar C half-lives on orders ranging from 102 to 107 years. Because biocharlability was found to be strongly controlled by the relativeamountofamorealiphaticandvolatilecomponent,measurementsof volatile weight content may be a convenient predictor ofbiochar C longevity. These results are of practical value to thoseconsidering biochar as a tool for soil remediation, amelioration,or atmospheric C sequestration.
IntroductionBlack carbon (BC) is composed of a continuum of pyrogenicorganic materials ranging from slightly charred biomass tocharcoal to soot (1). It has received recent attention fromenvironmental chemists for its strong sorption affinity fororganic contaminants (2) and for the recent realization thata large portion of the organic carbon found in soils andsediments may be BC (5-40%; e.g., refs 3-6). Thus, BCrepresents a large, but poorly understood portion of the globalcarbon that may have served as a carbon sink and oxygensource over geological time scales (7). The intentionalproduction of BC by pyrolysis of biomass yields biochar,which has been suggested as a soil amendment both toimprove soil fertility (8) and to sequester atmospheric CO2
into soils (9). One can envision a “closed-loop” systemwhereby agricultural or other waste biomass is pyrolyzed toproduce bioenergy, and biochar is added back to the soil,aiding the growth of more biomass and yielding “carbonoffsets” for the producer or user.
Before we can understand the role BC may have playedin past climate changes or how it can be used to mitigate
future climate change, however, we must better understandthe stability of BC or biochar in the environment. Becauseof its highly condensed aromatic structure, its resistance tochemical treatment (e.g., refs 10 and 11) and its occurrencein ancient soils and sediments (e.g., refs 12 and 13); BC hasgenerally been regarded as biologically and chemicallyrecalcitrant (e.g., refs 5, 14, and 15). However, a number ofrecent observations suggest that, to the contrary, abioticoxidation of BC occurs and BC can be utilized, at least tosome extent, by microbes as a carbon source.
Assuming a BC production rate via natural biomassburning of 0.05-0.3 Gt of C year-1 (7) and a 80 Gt C inventoryof BC in soil representing, on average, 5% of the total soilorganic matter (1600 Gt of C (16)), an average BC residencetime of between 266 and 1600 years (or half-lives of 102-103
years) can be calculated, assuming steady-state conditions.It is clear that there must be BC losses; otherwise, soil carbonwould be primarily BC (7). Even in the soils of regions ofdocumented repeated fire activity, the quantity of BCcalculated to have been produced has not been found (17, 18).Some BC may be lost to erosion, but the pool of BC foundin marine sediments is not large enough to balance terrestrialBC production (1). Using 14C-dating of BC in sediment, BCturnover has been estimated to be in the 1000 year timescale (4), while a soil study comparing fire-affected and fire-protected savannah soils calculated a BC half-life of <100years (19).
Degradation of BC may occur both abiotically (e.g.,chemical oxidation, photooxidation, and solublization) andbiotically (microbial incorporation or oxidative respirationof carbon). A number of studies have claimed that abioticprocesses play a major, perhaps even dominant, role intransforming BC. In the presence of oxygen and elevatedtemperatures (20-22), chemical oxidants (23, 24), ozone(25, 26), or air alone (20, 27-29), the BC surface has beenobserved to gain O-containing functional groups such ascarboxylic acid and become more hydrophilic over time.
Biological utilization of very refractory carbon sourcessuch as charred wood and coal (e.g., refs 30 and 31) andgraphite incubated in soils (32) have long been observed.More recently, longer time scale (month to year) laboratoryincubations of a number of biochar types have been carriedout. Baldock and Smernik (33) found that 20, 13, and 2% ofthe carbon in red pine wood uncharred or charred at 150and 350 °C, respectively, was remineralized after 4 months(though this conclusion was based on the insensitivetechnique of C weight loss). During 60 day microbialincubations, Hamer et al. (34) measured a 0.8, 0.7, and 0.3%loss char BC derived from maize and rye (350 °C, 2 h) andoak (800 °C, 22 h), respectively, as recorded by CO2 evolution.Incubations of BC mixed with soils have also been carriedout with a limited number of biochar types and yielded BClosses of about 0.5 and 3% over 48 days for rye grass and pine(charred briefly in air at 350 °C), respectively (35), and about4% over 3 years for rye grass charred at 400 °C for 13 h (36).
Because these previous studies were each carried out ona limited number of biochar types, we still have a poorunderstanding of the natural range of BC lability and howthe chemical and physical characteristics of BC control itsdegradation rate. Here, both abiotic (sterilized) and microbialincubations were carried out on a suite of well-characterizedbiochars made from a number of parent biomass types andunder a range of well-defined combustion conditions. Carbonremineralization was measured monthly as evolved CO2 overthe course of about a year, generating enough detailed data
† Corresponding author phone: (352) 392-0070; fax: (352)392-9294; e-mail: [email protected].
Environ. Sci. Technol. 2010, 44, 1295–1301
10.1021/es903140c 2010 American Chemical Society VOL. 44, NO. 4, 2010 / ENVIRONMENTAL SCIENCE & TECHNOLOGY 9 1295
Published on Web 01/19/2010
to construct, for the first time, experimentally based long-term biochar degradation rate models.
Materials and MethodsBiochar Production. Black carbon was produced from sixbiomass types: the living wood portion of oak (Laurel oak,Quercus laurifolia), pine (Loblolly pine, Pinus taeda), cedar(Eastern red cedar, Juniperus virginiana), and bubinga (thetropical hardwood, Guibourtia demeusei), mixed stems andblades of live Eastern gamma grass (Tripsacum dactyloides),and sugar cane baggase (sugar cane following industrialprocessing provided by Florida Crystal Corp.). These materi-als, all obtained from Florida sources except for bubinga,were dried (60 °C for at least 5 days), cut into 1 cm × 1 cm× 5 cm pieces, and either placed in a thin layer and combustedin an 0.04 m3 oven under full atmosphere (250 °C, chosento minimize ash formation) or pyrolyzed under N2 at 400,525, or 650 °C. For the latter, samples were loosely wrappedin foil in portions of about 4 cm × 4 cm × 10 cm and placedin a 5.5 cm diameter × 50 cm length pipe, which was pipedwith flowing N2 (2.3 oven volumes exchanged/min). Thetemperature routine was 26 °C min-1 heating rate, followedby a 3 h peak temperature hold time and a 3 °C min-1 coolingrate. After cooling, biochars were lightly crushed and sievedinto particle size fractions of <0.25 (fine) and 0.25-2 mm(coarse). Additionally, an oak sample and a pine sample werepyrolyzed for peak temperature durations of 72 h.
Biochar Characterization. The biochars produced werechemically and physically examined by a number of methodsto investigate the characteristics of BC that may be relatedto its lability. Specific surface area was determined aQuantachrome Autosorb 1 using both N2 and CO2 adsorptionfor mesopore and micropore surfaces, respectively. ElementalC, N, and H abundances were determined on a Carlo-ErbaNA-1500 elemental analyzer, and oxygen content wasdetermined by difference, assuming biochar to be composedof C, N, H, and O only. Volatile matter and ash content(inorganic mass) were determined using a slightly modifiedASTM method (D-1762-84) involving measurement of weightloss following combustion of about 10 g of char in a ceramiccrucible at 900 °C for 6 min and 750 °C for 6 h, respectively.Volatile C was determined by mass balance following Canalysis of the nonvolatile residue. Detailed method descrip-tions are provided in the Supporting Information.
BC Mineralization Rate. Abiotic and microbial incuba-tions of biochar were carried out in sterilized 12 mLborosilicate vials with rubber septa. For each treatment, sixreplicate incubations of 20 mg of biochar+200 mg of cleanedquartz sand + 80 µL of aqueous nutrient solution [60 g of(NH4)2SO4 + 6 g of KH2PO4 L-1] were prepared. The sand wasadded to increase permeability, thus increasing the waterand oxygen accessibility for the char. To half of the vials, 20µL (bringing the incubation to water holding capacity) ofsterilized water (abiotic incubation) was added, and to halfwas added a microbial inoculate, the supernatant of a localforest soil after 24 h shaking in water and centrifugation (bioticincubation). Tubes were incubated in the dark at 32 °C.Oxidation of BC was determined every 2 weeks initially andevery 6 weeks after the first 3 months by measuring CO2
evolution into the vial headspace. Molecular genetic char-acterization of the microbial inoculate is published else-where (37).
Headspace CO2 was measured by purging for 5 min withCO2-free air into an automated CO2 coulometer (UIC Inc.,Joliet, IL), leaving the vials refilled with CO2-free air forreincubation. The analytical detection limit for CO2, deter-mined using acidification of CaCO3 standards, was found tobe 0.1 µg of C. About every 4 months, 50 µL of sterilizeddeionized water was added to vials to return samples to aboutwater holding capacity state. For most abiotic and microbial
incubation time periods, variation in C mineralized amongreplicates was low (standard deviation represented only 13%of the mean, on average, but usually less than 5%). Highervariation often indicated leakage and was corrected bychanging the septa in tube caps. Experimental control tubesthat were empty or inoculated but contained no char yieldedCO2 measurements of less than 2 µg for any given time period,or the equivalent of 0.1 mg of C/(g of char).
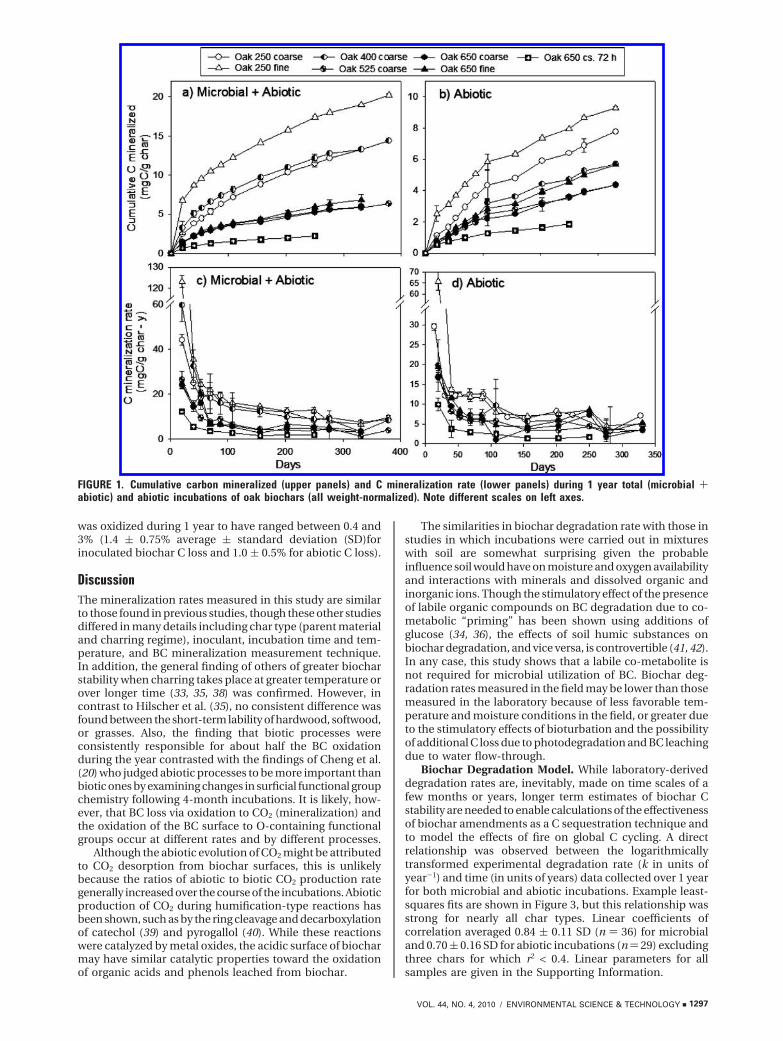
ResultsThe physical and chemical characteristics of the biocharsproduced, including their elemental composition and surfacearea, are provided in Table S1 of the Supporting Information.Time-course plots of cumulative C mineralization and theC mineralization rate for different oak biochars (char weight-normalized, Figure 1a,b and Figure 1c,d, respectively) il-lustrate trends that were generally observed for all biochartypes. First, carbon mineralized from sterilized incubations(abiotic) was always less than or equal to those inoculatedwith soil microbes (on average, by 41% for oak biochars and27% overall). Next, the fine biochar (<0.25 mm) grain sizefraction released more CO2 than its corresponding coarsefraction (on average, by 23% for oak biochar and 34% overallfor abiotic incubations, and by 22% for oak biochar and 16%overall for microbially inoculated incubations). Lastly, bio-mass charred at lower temperatures was generally more labilethan when charred at higher temperatures. The carbonmineralization rate decreased over the year in both inoculatedand abiotic incubations (Figure 1c,d). For both incubationconditions, about half of the C mineralized during 1 yearoccurred in the first 3-4 months, after which time, miner-alization rates were more stable and similar for differentbiochar types.
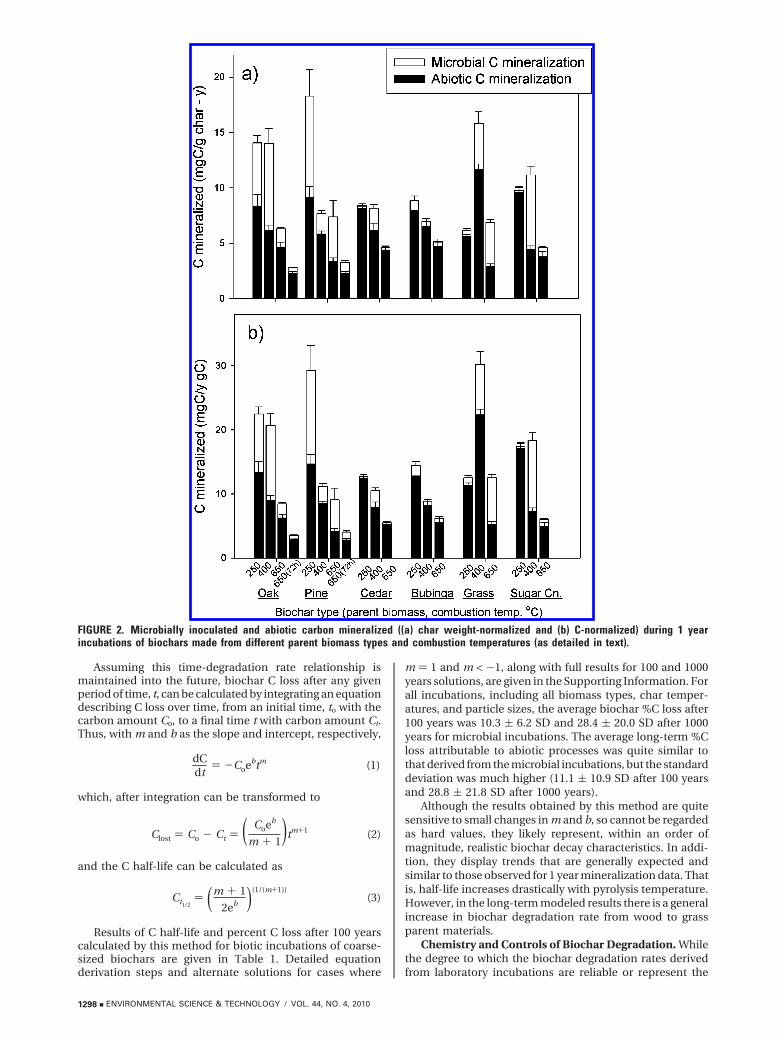
So that the lability of different biochar types could bemore easily compared, 1 year (exactly) mineralization rateswere calculated for all biochars using the slope of the cumula-tive mineralization versus time curve for the last three datapoints collected, which was linear in all cases. The results,plotted on both a char weight and C-normalized basis (Figure2a,b, respectively), show that char lability was controlledmore strongly by combustion temperature and duration thanby parent biomass type. However, two-way ANOVA analysis(with replication) indicated that both charring temperatureand biomass type effects on lability were significant, as wasthe interaction between these effects.
Compared to lightly charred oak (250 °C under atmo-sphere, coarse fraction), the C mineralized in 1 year microbialincubations was 27, 43, 44, and 72% less for 400, 525, and650 °C, and 650 °C at 72 h charred oak, respectively. Thispattern of decreasing lability with increasing pyrolysistemperature held for all wood biochars and abiotic incuba-tions as well. However, abiotic and microbial incubations ofgrass biochar and microbial incubations of sugar canebaggase biochar released the most CO2 in 1 year whenpyrolyzed at 400 °C. A significant direct linear relationshipwas found between microbial and abiotic C mineralization,both within biomass types (e.g., for oak, r2 ) 0.86, p ) 0.01),and overall, (r2 ) 0.55, p > 0.01).
Since the C content of these biochars generally increasedwith charring temperature and duration, the general trendof increasing recalcitrance with increasing charring tem-perature is even more pronounced when C mineralizationis expressed on a C-normalized basis (Figure 2b). Thus, therewas a significant negative linear correlation between char Ccontent and cumulative C mineralized in inoculated andabiotic incubations within biomass types such as oak (r2 )0.65, p ) 0.01 and r2 ) 0.65, p ) 0.02, respectively) and forchars as a whole (r2 ) 0.34, and 0.36, respectively; p > 0.01for both). Figure 2b also depicts the proportion of BC that
1296 9 ENVIRONMENTAL SCIENCE & TECHNOLOGY / VOL. 44, NO. 4, 2010
was oxidized during 1 year to have ranged between 0.4 and3% (1.4 ( 0.75% average ( standard deviation (SD)forinoculated biochar C loss and 1.0 ( 0.5% for abiotic C loss).
DiscussionThe mineralization rates measured in this study are similarto those found in previous studies, though these other studiesdiffered in many details including char type (parent materialand charring regime), inoculant, incubation time and tem-perature, and BC mineralization measurement technique.In addition, the general finding of others of greater biocharstability when charring takes place at greater temperature orover longer time (33, 35, 38) was confirmed. However, incontrast to Hilscher et al. (35), no consistent difference wasfound between the short-term lability of hardwood, softwood,or grasses. Also, the finding that biotic processes wereconsistently responsible for about half the BC oxidationduring the year contrasted with the findings of Cheng et al.(20) who judged abiotic processes to be more important thanbiotic ones by examining changes in surficial functional groupchemistry following 4-month incubations. It is likely, how-ever, that BC loss via oxidation to CO2 (mineralization) andthe oxidation of the BC surface to O-containing functionalgroups occur at different rates and by different processes.
Although the abiotic evolution of CO2 might be attributedto CO2 desorption from biochar surfaces, this is unlikelybecause the ratios of abiotic to biotic CO2 production rategenerally increased over the course of the incubations. Abioticproduction of CO2 during humification-type reactions hasbeen shown, such as by the ring cleavage and decarboxylationof catechol (39) and pyrogallol (40). While these reactionswere catalyzed by metal oxides, the acidic surface of biocharmay have similar catalytic properties toward the oxidationof organic acids and phenols leached from biochar.
The similarities in biochar degradation rate with those instudies in which incubations were carried out in mixtureswith soil are somewhat surprising given the probableinfluence soil would have on moisture and oxygen availabilityand interactions with minerals and dissolved organic andinorganic ions. Though the stimulatory effect of the presenceof labile organic compounds on BC degradation due to co-metabolic “priming” has been shown using additions ofglucose (34, 36), the effects of soil humic substances onbiochar degradation, and vice versa, is controvertible (41, 42).In any case, this study shows that a labile co-metabolite isnot required for microbial utilization of BC. Biochar deg-radation rates measured in the field may be lower than thosemeasured in the laboratory because of less favorable tem-perature and moisture conditions in the field, or greater dueto the stimulatory effects of bioturbation and the possibilityof additional C loss due to photodegradation and BC leachingdue to water flow-through.
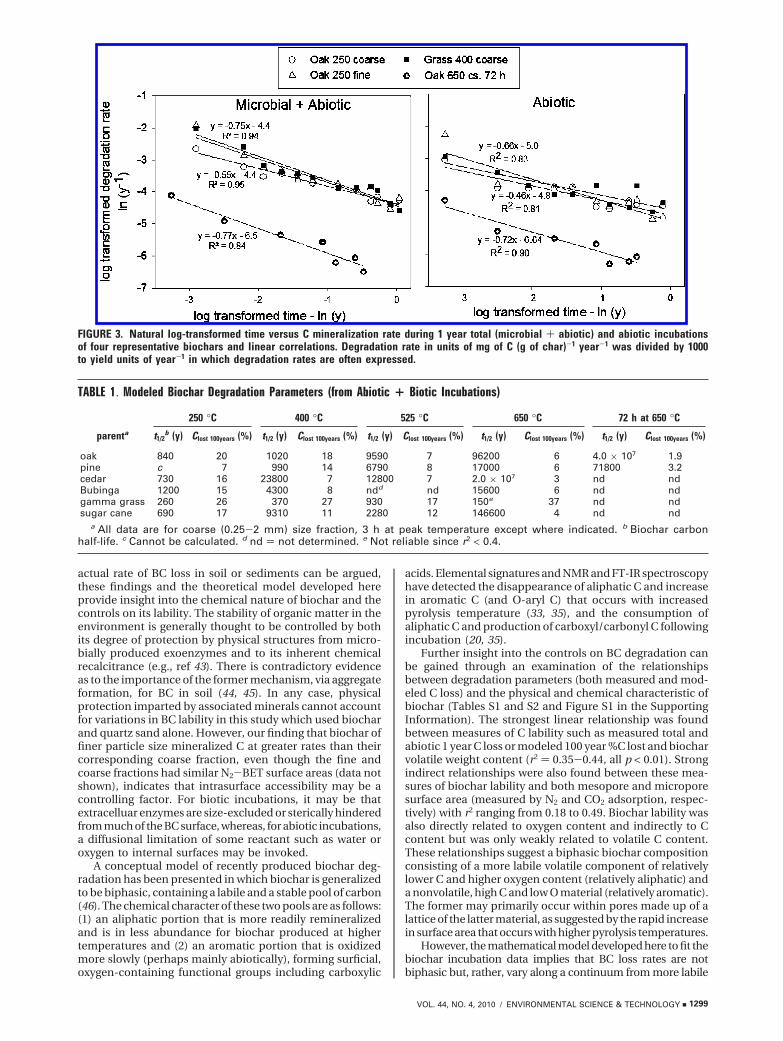
Biochar Degradation Model. While laboratory-deriveddegradation rates are, inevitably, made on time scales of afew months or years, longer term estimates of biochar Cstability are needed to enable calculations of the effectivenessof biochar amendments as a C sequestration technique andto model the effects of fire on global C cycling. A directrelationship was observed between the logarithmicallytransformed experimental degradation rate (k in units ofyear-1) and time (in units of years) data collected over 1 yearfor both microbial and abiotic incubations. Example least-squares fits are shown in Figure 3, but this relationship wasstrong for nearly all char types. Linear coefficients ofcorrelation averaged 0.84 ( 0.11 SD (n ) 36) for microbialand 0.70( 0.16 SD for abiotic incubations (n) 29) excludingthree chars for which r2 < 0.4. Linear parameters for allsamples are given in the Supporting Information.
FIGURE 1. Cumulative carbon mineralized (upper panels) and C mineralization rate (lower panels) during 1 year total (microbial +abiotic) and abiotic incubations of oak biochars (all weight-normalized). Note different scales on left axes.
VOL. 44, NO. 4, 2010 / ENVIRONMENTAL SCIENCE & TECHNOLOGY 9 1297
Assuming this time-degradation rate relationship ismaintained into the future, biochar C loss after any givenperiod of time, t, can be calculated by integrating an equationdescribing C loss over time, from an initial time, to with thecarbon amount Co, to a final time t with carbon amount Ct.Thus, with m and b as the slope and intercept, respectively,
which, after integration can be transformed to
and the C half-life can be calculated as
Results of C half-life and percent C loss after 100 yearscalculated by this method for biotic incubations of coarse-sized biochars are given in Table 1. Detailed equationderivation steps and alternate solutions for cases where
m ) 1 and m < -1, along with full results for 100 and 1000years solutions, are given in the Supporting Information. Forall incubations, including all biomass types, char temper-atures, and particle sizes, the average biochar %C loss after100 years was 10.3 ( 6.2 SD and 28.4 ( 20.0 SD after 1000years for microbial incubations. The average long-term %Closs attributable to abiotic processes was quite similar tothat derived from the microbial incubations, but the standarddeviation was much higher (11.1 ( 10.9 SD after 100 yearsand 28.8 ( 21.8 SD after 1000 years).
Although the results obtained by this method are quitesensitive to small changes in m and b, so cannot be regardedas hard values, they likely represent, within an order ofmagnitude, realistic biochar decay characteristics. In addi-tion, they display trends that are generally expected andsimilar to those observed for 1 year mineralization data. Thatis, half-life increases drastically with pyrolysis temperature.However, in the long-term modeled results there is a generalincrease in biochar degradation rate from wood to grassparent materials.
Chemistry and Controls of Biochar Degradation. Whilethe degree to which the biochar degradation rates derivedfrom laboratory incubations are reliable or represent the
FIGURE 2. Microbially inoculated and abiotic carbon mineralized ((a) char weight-normalized and (b) C-normalized) during 1 yearincubations of biochars made from different parent biomass types and combustion temperatures (as detailed in text).
dCdt
) -Coebtm (1)
Clost ) Co - Ct ) ( Coeb
m + 1)tm+1 (2)
Ct1/2) (m + 1
2eb )(1/(m+1))(3)
1298 9 ENVIRONMENTAL SCIENCE & TECHNOLOGY / VOL. 44, NO. 4, 2010
actual rate of BC loss in soil or sediments can be argued,these findings and the theoretical model developed hereprovide insight into the chemical nature of biochar and thecontrols on its lability. The stability of organic matter in theenvironment is generally thought to be controlled by bothits degree of protection by physical structures from micro-bially produced exoenzymes and to its inherent chemicalrecalcitrance (e.g., ref 43). There is contradictory evidenceas to the importance of the former mechanism, via aggregateformation, for BC in soil (44, 45). In any case, physicalprotection imparted by associated minerals cannot accountfor variations in BC lability in this study which used biocharand quartz sand alone. However, our finding that biochar offiner particle size mineralized C at greater rates than theircorresponding coarse fraction, even though the fine andcoarse fractions had similar N2-BET surface areas (data notshown), indicates that intrasurface accessibility may be acontrolling factor. For biotic incubations, it may be thatextracelluar enzymes are size-excluded or sterically hinderedfrom much of the BC surface, whereas, for abiotic incubations,a diffusional limitation of some reactant such as water oroxygen to internal surfaces may be invoked.
A conceptual model of recently produced biochar deg-radation has been presented in which biochar is generalizedto be biphasic, containing a labile and a stable pool of carbon(46). The chemical character of these two pools are as follows:(1) an aliphatic portion that is more readily remineralizedand is in less abundance for biochar produced at highertemperatures and (2) an aromatic portion that is oxidizedmore slowly (perhaps mainly abiotically), forming surficial,oxygen-containing functional groups including carboxylic
acids. Elemental signatures and NMR and FT-IR spectroscopyhave detected the disappearance of aliphatic C and increasein aromatic C (and O-aryl C) that occurs with increasedpyrolysis temperature (33, 35), and the consumption ofaliphatic C and production of carboxyl/carbonyl C followingincubation (20, 35).
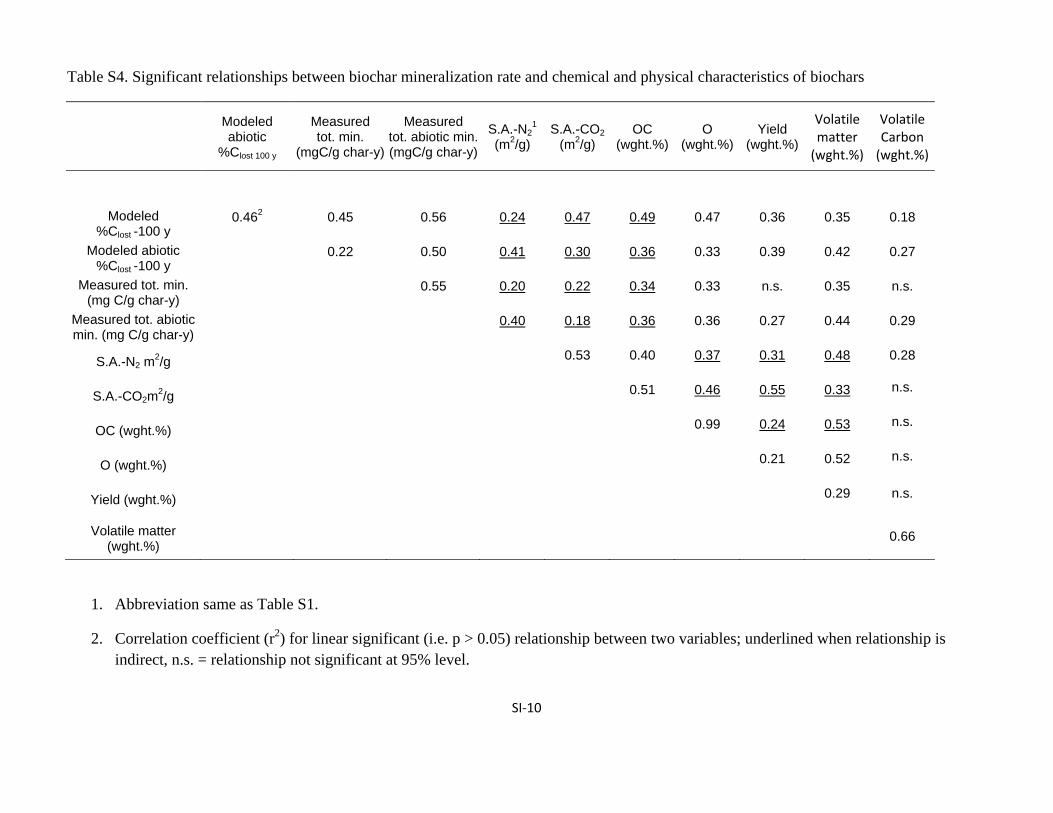
Further insight into the controls on BC degradation canbe gained through an examination of the relationshipsbetween degradation parameters (both measured and mod-eled C loss) and the physical and chemical characteristic ofbiochar (Tables S1 and S2 and Figure S1 in the SupportingInformation). The strongest linear relationship was foundbetween measures of C lability such as measured total andabiotic 1 year C loss or modeled 100 year %C lost and biocharvolatile weight content (r2 ) 0.35-0.44, all p < 0.01). Strongindirect relationships were also found between these mea-sures of biochar lability and both mesopore and microporesurface area (measured by N2 and CO2 adsorption, respec-tively) with r2 ranging from 0.18 to 0.49. Biochar lability wasalso directly related to oxygen content and indirectly to Ccontent but was only weakly related to volatile C content.These relationships suggest a biphasic biochar compositionconsisting of a more labile volatile component of relativelylower C and higher oxygen content (relatively aliphatic) anda nonvolatile, high C and low O material (relatively aromatic).The former may primarily occur within pores made up of alattice of the latter material, as suggested by the rapid increasein surface area that occurs with higher pyrolysis temperatures.
However, the mathematical model developed here to fit thebiochar incubation data implies that BC loss rates are notbiphasic but, rather, vary along a continuum from more labile
FIGURE 3. Natural log-transformed time versus C mineralization rate during 1 year total (microbial + abiotic) and abiotic incubationsof four representative biochars and linear correlations. Degradation rate in units of mg of C (g of char)-1 year-1 was divided by 1000to yield units of year-1 in which degradation rates are often expressed.
TABLE 1. Modeled Biochar Degradation Parameters (from Abiotic + Biotic Incubations)
250 °C 400 °C 525 °C 650 °C 72 h at 650 °C
parenta t1/2b (y) Clost 100years (%) t1/2 (y) Clost 100years (%) t1/2 (y) Clost 100years (%) t1/2 (y) Clost 100years (%) t1/2 (y) Clost 100years (%)
oak 840 20 1020 18 9590 7 96200 6 4.0 × 10⁷ 1.9pine c 7 990 14 6790 8 17000 6 71800 3.2cedar 730 16 23800 7 12800 7 2.0 × 10⁷ 3 nd ndBubinga 1200 15 4300 8 ndd nd 15600 6 nd ndgamma grass 260 26 370 27 930 17 150e 37 nd ndsugar cane 690 17 9310 11 2280 12 146600 4 nd nd
a All data are for coarse (0.25-2 mm) size fraction, 3 h at peak temperature except where indicated. b Biochar carbonhalf-life. c Cannot be calculated. d nd ) not determined. e Not reliable since r2 < 0.4.
VOL. 44, NO. 4, 2010 / ENVIRONMENTAL SCIENCE & TECHNOLOGY 9 1299
to extremely refractory. A similar model, the so-called “power-model” has been used to describe the log-log relationshipbetween degradation rate and time of burial of a mixture oforganic matter types in a sediment core (47). Reactivitycontinuously and exponentially decreases as more labile or,perhaps,morephysicallyaccessibleorganiccompoundsoxidize,leaving behind a progressively more refractory or more physi-cally inaccessible residue. In a sample of biochar, the C that islost first is most likely to be aliphatic and closer to a particle’sexternal surfaces, and residual C is more likely to be either partof highly condensed aromatic structures or condensates withinprotective internal pores that are more abundant in highertemperature biochars. The greater degradation rate of thebiochar samples of finer particle size attests to the additionalimportanceofphysicalprotectionincontrollingBCdegradation.
For the purposes of those planning C sequestrationprojects or assigning C credits for biochar burial, volatilecontent appears to be the most convenient method forestimating biochar C longevity. A figure and equationdescribing the linear relationship between biochar C lossafter 100 years and volatile carbon content is provided inthe Supporting Information. However, experiments as-sessing the role of the soil environment, including tem-perature and moisture, are needed to better predict biocharC sequestration.
AcknowledgmentsI thank Dr. Mark Panning (Department of Geological Sciences,University of Florida) for his generous help with mathematicalsolutions and Dr. Jason Curtis and Atanu Mukherjee forassistance with chemical analyses. This work was supportedby NSF-EAR Grant No. 0819706, the Geobiology and LowTemperature Geochemistry Program.
Supporting Information AvailableAdditional details on the materials and methods used,detailed mathematical derivation of the model equations,and full tabulated experimental and model results. Thismaterial is available free of charge via the Internet athttp://pubs.acs.org.
Literature Cited(1) Masiello, C. A. New directions in black carbon organic geochem-
istry. Mar. Chem. 2004, 92 (1-4), 201–213.(2) Cornelissen, G.; Gustafsson, O.; Bucheli, T. D.; Jonker, M. T. O.;
Koelmans, A. A.; Van Noort, P. C. M. Extensive sorption of organiccompounds to black carbon, coal, and kerogen in sedimentsand soils: Mechanisms and consequences for distribution,bioaccumulation, and biodegradation. Environ. Sci. Technol.2005, 39, 6881–6895.
(3) Song, J.; Peng, P. A.; Huang, W. Black carbon and kerogen insoils and sediments. 1. Quantification and characterization.Environ. Sci. Technol. 2002, 36, 3960–3967.
(4) Masiello, C. A.; Druffel, E. R. M. Organic and black carbon C-13and C-14 through the Santa Monica Basin sediment oxic-anoxictransition. Geophys. Res. Lett. 2003, 30 (4), 1185.
(5) Skjemstad, J. O.; Reicosky, D. C.; Wilts, A. R.; McGowan, J. A.Charcoal carbon in US agricultural soils. Soil Sci. Soc. Am. J.2002, 66 (4), 1249–1255.
(6) Schmidt, M. W. I.; Skjemstad, J. O.; Czimczik, C. I.; Glaser, B.;Prentice, K. M.; Gelinas, Y.; Kuhlbusch, T. A. Comparativeanalysis of black carbon in soils. Global Biogeochem. Cycles 2001,15 (1), 163–167.
(7) Kuhlbusch, T. A.; Crutzen, P. J. Toward a global estimate ofblack carbon in residues of vegetation fires representing a sinkof atmospheric CO2 and a source of O2. Global Biogeochem.Cycles 1995, 9 (4), 491–501.
(8) Glaser, B.; Lehmann, J.; Zech, W. Ameliorating physical andchemical properties of highly weathered soils in the tropicswith charcoalsA review. Biol. Fert. Soils 2002, 35 (4), 219–230.
(9) Lehmann, J. A handful of carbon. Nature 2007, 447 (7141), 143–144.
(10) Skjemstad, J. O.; Clarke, P.; Taylor, J. A.; Oades, J. M.; McCLure,S. G. The chemistry and nature of protected carbon in soil. Aust.J. Soil Res. 1996, 34, 251–271.
(11) Glaser, B.; Haumaier, L.; Guggenberger, G.; Zech, W. Black carbonin soils: The use of benzenecarboxylic acid as specific markers.Org. Geochem. 1998, 29 (4), 811–819.
(12) Pessenda, L. C. R.; Ledru, M. P.; Gouveia, S. E. M.; Aravena, R.;Ribeiro, A. S.; Bendassolli, J. A.; Boulet, R. Holocene palaeoen-vironmental reconstruction in northeastern Brazil inferred frompollen, charcoal and carbon isotope records. Holocene 2005, 15(6), 812–820.
(13) Schmidt, M. W. I.; Noack, A. G. Black carbon in soils andsediments: Analysis, distribution, implications, and currentchallenges. Global Biogeochem. Cycles 2000, 14 (3), 777–793.
(14) Seiler, W.; Crutzen, P. J. Estimates of gross and net fluxes ofcarbon between the biosphere and the atmosphere frombiomass burning. Climatic Change 1980, 2 (3), 207–247.
(15) Kuhlbusch, T. A. J. Black carbon and the global carbon cycle.Science 1998, 280, 1903–1904.
(16) Eswaran, H.; Van Den Berg, E.; Reich, P. Organic carbon in soilsof the world. Soil Sci. Soc. Am. J. 1993, 57 (1), 192–194.
(17) Ohlson, M.; Tryterud, E. Interpretation of the charcoal recordin forest soils: forest fires and their production and depositionof macroscopic charcoal. Holocene 2000, 10 (4), 519–525.
(18) Czimczik, C. I.; Preston, C. M.; Schmidt, M. W. I.; Schulze, E. D.How surface fire in Siberian Scots pine forests affects soil organiccarbon in the forest floor: Stocks, molecular structure, andconversion to black carbon (charcoal). Global Biogeochem. Cycles2003, 17 (1), 20.1-20.14.
(19) Bird, M. I.; Moyo, C.; Veenendaal, E. M.; Lloyd, J.; Frost, P. Stabilityof elemental carbon in a savanna soil. Global Biogeochem. Cycles1999, 13 (4), 923–932.
(20) Cheng, C. H.; Lehmann, J.; Thies, J. E.; Burton, S. D.; Engelhard,M. H. Oxidation of black carbon by biotic and abiotic processes.Org. Geochem. 2006, 37 (11), 1477–1488.
(21) Morterra, C.; Low, M. J. D.; Severdia, A. G. IR studies of carbons.3. The oxidation of cellulose chars. Carbon 1984, 22 (1), 5–12.
(22) Toles, C. A.; Marshall, W. E.; Johns, M. M. Surface functionalgroups on acid-activated nutshell carbons. Carbon 1999, 37 (8),1207–1214.
(23) Moreno-Castilla, C.; Lopez-Ramon, M. V.; Carrasco-Marin, F.Changes in surface chemistry of activated carbons by wetoxidation. Carbon 2000, 38 (14), 1995–2001.
(24) Puri, B. R.; Sharma, S. K. Studies in formation and propertiesof carbon-oxygen surface complexes. 2. Nature of surfacecomplexes formed on progressive treatment with oxidisingsolutions. J. Indian Chem. Soc. 1968, 45 (12), 1115-&.
(25) Kawamoto, K.; Ishimaru, K.; Imamura, Y. Reactivity of woodcharcoal with ozone. J. Wood Sci. 2005, 51 (1), 66–72.
(26) Sergides, C. A.; Jassim, J. A.; Chughtai, A. R.; Smith, D. M. Thestructure of hexane soot. 3. Ozonation studies. Appl. Spectrosc.1987, 41 (3), 482–492.
(27) Billinge, B. H. M.; Evans, M. G. The growth of surface oxygencomplexes on the surface of activated carbon exposed to moistair and their effect on methyl iodide-131 retention. J. Chim.Phys. Phys.-Chim. Biol. 1984, 81 (11-1), 779–784.
(28) Adams, L. B.; Hall, C. R.; Holmes, R. J.; Newton, R. A. Anexamination of how exposure to humid air can result in changesin the adsorption properties of activated carbons. Carbon 1988,26 (4), 451–459.
(29) Cohen-Ofri, I.; Popovitz-Biro, R.; Weiner, S. Structural char-acterization of modern and fossilized charcoal produced innatural fires as determined by using electron energy lossspectroscopy. Chem.sEur. J. 2007, 13 (8), 2306–2310.
(30) Potter, M. C. Bacteria as agents in the oxidation of amorphouscarbon. Proc. R. Soc. London, Ser. B 1908, 80 (539), 239–259.
(31) Scott, C. D.; Strandberg, G. W.; Lewis, S. N. Microbial solubi-lization of coal. Biotechnol. Prog. 1986, 2, 131–139.
(32) Shneour, E. A. Oxidation of graphitic carbon in certain soils.Science 1966, 151 (3713), 991-&.
(33) Baldock, J. A.; Smernik, R. J. Chemical composition andbioavailability of thermally, altered Pinus resinosa (Red Pine)wood. Org. Geochem. 2002, 33 (9), 1093–1109.
(34) Hamer, U.; Marschner, B.; Brodowski, S.; Amelung, W. Interactivepriming of black carbon and glucose mineralisation. Org.Geochem. 2004, 35, 823–830.
(35) Hilscher, A.; Heister, K.; Siewert, C.; Knicker, H. Mineralisationand structural changes during the initial phase of microbialdegradation of pyrogenic plant residues in soil. Org. Geochem.2009, 40 (3), 332–342.
1300 9 ENVIRONMENTAL SCIENCE & TECHNOLOGY / VOL. 44, NO. 4, 2010
(36) Kuzyakov, Y.; Subbotina, I.; Chen, H. Q.; Bogomolova, I.; Xu,X. L. Black carbon decomposition and incorporation into soilmicrobial biomass estimated by C-14 labeling. Soil Biol. Biochem.2009, 41 (2), 210–219.
(37) Khodadad, C. L. M.; Zimmerman, A. R.; Uthandi, S.; Foster, J. S.Changes in microbial community composition in soils amendedwith pyrogenic carbon. Appl. Environ. Microb., submitted forpublication.
(38) Bruun, S.; Jensen, E. S.; Jensen, L. S. Microbial mineralizationand assimilation of black carbon: Dependency on degree ofthermal alteration. Org. Geochem. 2008, 39 (7), 839–845.
(39) Majcher, E. H.; Chorover, J.; Bollag, J. M.; Huang, P. M. Evolutionof CO2 during birnessite-induced oxidation of C-14-labeledcatechol. Soil Sci. Soc. Am. J. 2000, 64 (1), 157–163.
(40) Wang, M. C.; Huang, P. M. Ring cleavage and oxidativetransformation of pyrogallol catalyzed by Mn, Fe, Al, and Sioxides. Soil Sci. 2000, 165 (12), 934–942.
(41) Lehmann, J.; Sohi, S. Comment on “fire-derived charcoal causesloss of forest humus”. Science 2008, 321, 5894.
(42) Wardle, D. A.; Nilsson, M. C.; Zackrisson, O. Fire-derived charcoalcauses loss of forest humus. Science 2008, 320 (5876), 629–629.
(43) Sollins, P.; Homann, P.; Caldwell, B. A. Stabilization anddestabilization of soils organic matter: Mechansisms andcontrols. Geoderma 1996, 74, 65–105.
(44) Brodowski, S.; John, B.; Flessa, H.; Amelung, W. Aggregate-occluded black carbon in soil. Eur. J. Soil Sci. 2006, 57 (4), 539–546.
(45) Liang, B.; Lehmann, J.; Solomon, D.; Sohi, S.; Thies, J. E.;Skjemstad, J. O.; Luizao, F. J.; Engelhard, M. H.; Neves, E. G.;Wirick, S. Stability of biomass-derived black carbon in soils.Geochim. Cosmochem. Acta 2008, 72 (24), 6069–6078.
(46) Lehmann, J.; Czimczik, C.; Laird, D.; Sohi, S. Stability of biocharin the soil. In Biochar for Environmental Management: Scienceand Technology, Lehmann, J., Joseph, S., Eds. Earthscan: London,2009; pp 183-205.
(47) Middleburg, J. J. A simple rate model for organic matterdecomposition in marine sediments. Geochim. Cosmochem. Acta1989, 53, 1577–1581.
ES903140C
VOL. 44, NO. 4, 2010 / ENVIRONMENTAL SCIENCE & TECHNOLOGY 9 1301
SI‐1
Supporting Information Section
Title: Abiotic and microbial oxidation of laboratory-produced black carbon (biochar) Author: Andrew R. Zimmerman, University of Florida, Department of Geological Sciences
Journal: Environmnetal Science & Technology Prepared: December 10, 2009 15 pages 1 figure 6 tables

SI‐2
SI‐3
Additional Method Information Specific Surface Area was determined using both N2 and CO2 adsorption on a Quantachrome
Autosorb 1. External surface area, which includes pores >1.5 nm was calculated using multi-
point adsorption data from the linear segment (in partial pressur range of 0.001 to 0.03) of the N2
adsorption isotherms (at 77 K) using Brunauer-Emmett-Teller (BET: Brunauer et al., 1938)
theory. Pore size distributions were calculated from desorption branch isotherms using the
Barrett-Joyner-Halenda (BJH) theory (Barrett et al., 1951). Internal surface area and pore volume
for pores <1.5 nm were determined using CO2 adsorption isotherms (at 273 K) generated in the
partial pressure range <0.02. These isotherms, which constitute the so-called kernel, are
interpreted using Grand Canonical Monte Carlo (GCMC) simulations or the Non-Local Density
Functional Theory (NLDFT). All BC samples were de-gassed under vacuum at 200°C for at least
24 hours prior to analysis.
Elemental C, N and H abundances were determined on a Carlo-Erba NA-1500 CNS Elemental
Analyzer. After grinding in a silica mortar and pestle, biochar amounts of about 6 mg for H and
N and about 0.5 mg for C were weighed into tin capsules. Samples were flash-combusted in a
quartz column containing chromium oxide and silvered cobaltous/cobaltic oxide at 1000°C in an
oxygen-rich atmosphere. The sample gas is then carried in a He carrier stream through a hot
reduction column (650°C) consisting of reduced elemental copper to remove oxygen and convert
NOx to N2. The effluent stream then passes through a chemical (magnesium perchlorate) trap to
remove water. The stream then passes through a 1.5 meter gas chromatographic column at 55°C
that separates the N2, H2 and CO2 gases before detection by thermal conductivity. Oxygen
content was calculated by difference assuming a composition of C, N, H, and O, only. This
assumption could have led to an over-estimate of oxygen content. If ash content (below) is
assumed to represent inorganic elemental weight %, oxygen weight% can be re-calculated as 1-
10% less for most samples. For Oak650, for an ash content of 3.7%, oxygen weight% would be
20.4% less and the grasses, with ash contents ranging 7-25% would have re-calculated oxygen
weight% that are 16-50% less.
Volatile matter and ash content was determined using a slightly modified version of ASTM
method (D-1762-84). About 10 mg of non-ground biochar that had been kept in a drying oven
for at least 2 hrs at 100oC and allowed to cool in a desiccator was weighed into pre-weighed
SI‐4
ceramic crucibles. Volatile matter content was determined as weight loss after combustion with a
loose ceramic cap at 850-900oC for 6 min. (set-point was 900oC but some cooling occurred while
oven door was open). Ash content was determined as weight loss after combustion at 750oC for 6
h with no ceramic cap. Sample weight was taken after cooling in a desiccator for 1 h. Volatile C
was determined by mass balance following analysis of the C content of the ground non-volatile
residue (as above).
SI‐5
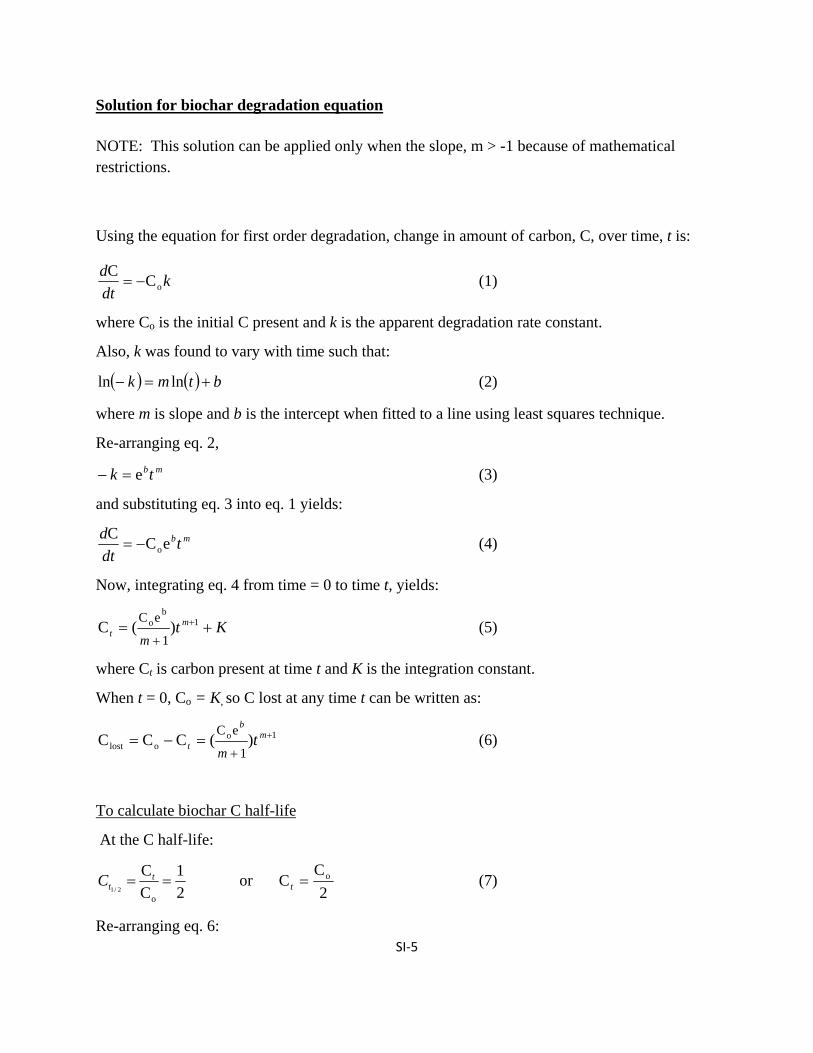
Solution for biochar degradation equation
NOTE: This solution can be applied only when the slope, m > -1 because of mathematical restrictions.
Using the equation for first order degradation, change in amount of carbon, C, over time, t is:
kdt
doC
C (1)
where Co is the initial C present and k is the apparent degradation rate constant.
Also, k was found to vary with time such that:
btmk lnln (2)
where m is slope and b is the intercept when fitted to a line using least squares technique.
Re-arranging eq. 2,
mbtk e (3)
and substituting eq. 3 into eq. 1 yields:
mbtdt
deC
Co (4)
Now, integrating eq. 4 from time = 0 to time t, yields:
Kt mt
m
1
bo )(C
1
eC (5)
where Ct is carbon present at time t and K is the integration constant.
When t = 0, Co = K, so C lost at any time t can be written as:
1oolost )(CCC
1
eC
m
b
t tm
(6)
To calculate biochar C half-life
At the C half-life:
2
1
C
C
o2/1
ttC or
2
CC ot (7)
Re-arranging eq. 6:
SI‐6
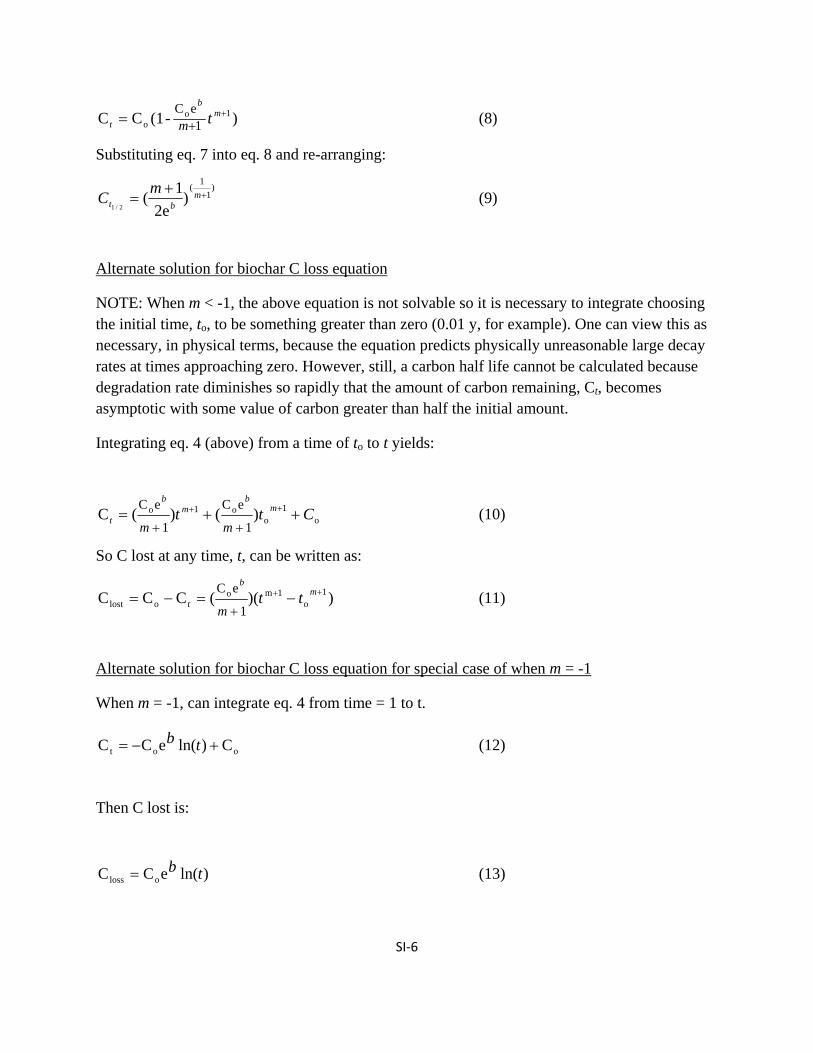
)-(1CC 1oo 1
eC m
b
t tm (8)
Substituting eq. 7 into eq. 8 and re-arranging:
)1
1(
)2e
1(
2/1
m
bt
mC (9)
Alternate solution for biochar C loss equation
NOTE: When m < -1, the above equation is not solvable so it is necessary to integrate choosing the initial time, to, to be something greater than zero (0.01 y, for example). One can view this as necessary, in physical terms, because the equation predicts physically unreasonable large decay rates at times approaching zero. However, still, a carbon half life cannot be calculated because degradation rate diminishes so rapidly that the amount of carbon remaining, Ct, becomes asymptotic with some value of carbon greater than half the initial amount.
Integrating eq. 4 (above) from a time of to to t yields:
o1
oo1o )()(C
1
eC
1
eCCtt m
bm
b
tmm
(10)
So C lost at any time, t, can be written as:
))((CCC 1o
1moolost
1
eC
mb
t ttm
(11)
Alternate solution for biochar C loss equation for special case of when m = -1
When m = -1, can integrate eq. 4 from time = 1 to t.
oot C)ln(eCC tb (12)
Then C lost is:
)ln(eCC oloss tb (13)
SI‐7
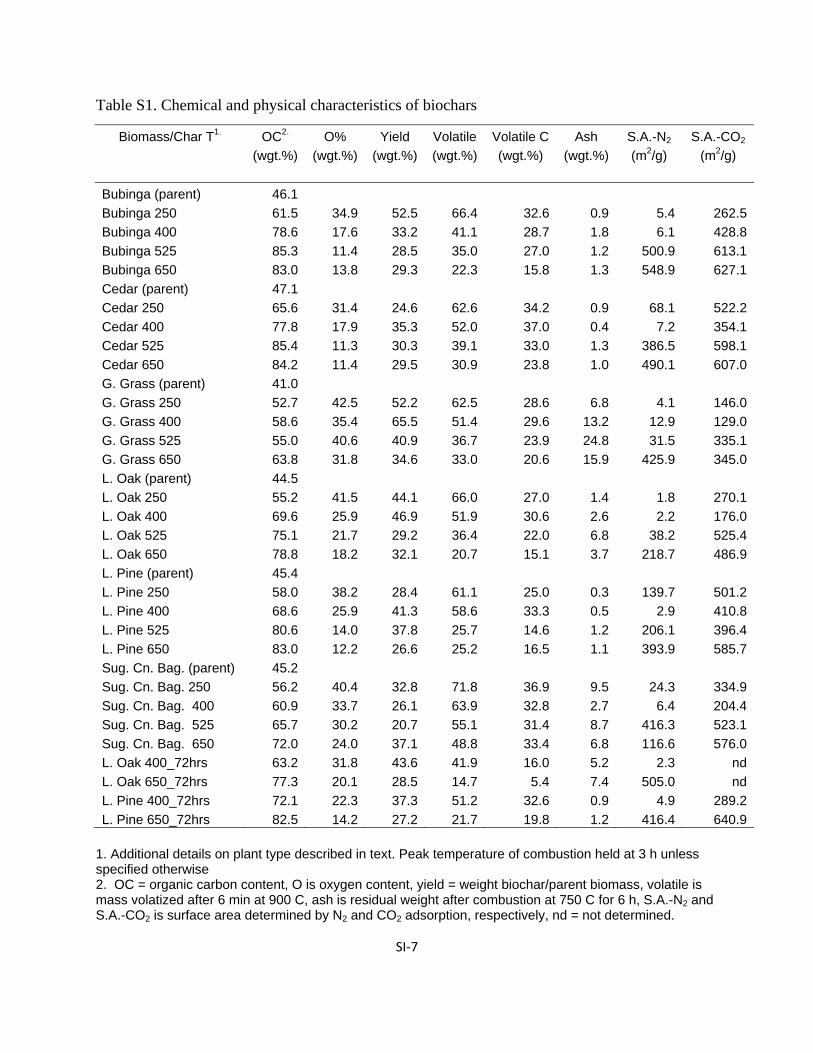
Table S1. Chemical and physical characteristics of biochars
Biomass/Char T1. OC2. O% Yield Volatile Volatile C Ash S.A.-N2 S.A.-CO2
(wgt.%) (wgt.%) (wgt.%) (wgt.%) (wgt.%) (wgt.%) (m2/g) (m2/g)
Bubinga (parent) 46.1
Bubinga 250 61.5 34.9 52.5 66.4 32.6 0.9 5.4 262.5
Bubinga 400 78.6 17.6 33.2 41.1 28.7 1.8 6.1 428.8
Bubinga 525 85.3 11.4 28.5 35.0 27.0 1.2 500.9 613.1
Bubinga 650 83.0 13.8 29.3 22.3 15.8 1.3 548.9 627.1
Cedar (parent) 47.1
Cedar 250 65.6 31.4 24.6 62.6 34.2 0.9 68.1 522.2
Cedar 400 77.8 17.9 35.3 52.0 37.0 0.4 7.2 354.1
Cedar 525 85.4 11.3 30.3 39.1 33.0 1.3 386.5 598.1
Cedar 650 84.2 11.4 29.5 30.9 23.8 1.0 490.1 607.0
G. Grass (parent) 41.0
G. Grass 250 52.7 42.5 52.2 62.5 28.6 6.8 4.1 146.0
G. Grass 400 58.6 35.4 65.5 51.4 29.6 13.2 12.9 129.0
G. Grass 525 55.0 40.6 40.9 36.7 23.9 24.8 31.5 335.1
G. Grass 650 63.8 31.8 34.6 33.0 20.6 15.9 425.9 345.0
L. Oak (parent) 44.5
L. Oak 250 55.2 41.5 44.1 66.0 27.0 1.4 1.8 270.1
L. Oak 400 69.6 25.9 46.9 51.9 30.6 2.6 2.2 176.0
L. Oak 525 75.1 21.7 29.2 36.4 22.0 6.8 38.2 525.4
L. Oak 650 78.8 18.2 32.1 20.7 15.1 3.7 218.7 486.9
L. Pine (parent) 45.4
L. Pine 250 58.0 38.2 28.4 61.1 25.0 0.3 139.7 501.2
L. Pine 400 68.6 25.9 41.3 58.6 33.3 0.5 2.9 410.8
L. Pine 525 80.6 14.0 37.8 25.7 14.6 1.2 206.1 396.4
L. Pine 650 83.0 12.2 26.6 25.2 16.5 1.1 393.9 585.7
Sug. Cn. Bag. (parent) 45.2
Sug. Cn. Bag. 250 56.2 40.4 32.8 71.8 36.9 9.5 24.3 334.9
Sug. Cn. Bag. 400 60.9 33.7 26.1 63.9 32.8 2.7 6.4 204.4
Sug. Cn. Bag. 525 65.7 30.2 20.7 55.1 31.4 8.7 416.3 523.1
Sug. Cn. Bag. 650 72.0 24.0 37.1 48.8 33.4 6.8 116.6 576.0
L. Oak 400_72hrs 63.2 31.8 43.6 41.9 16.0 5.2 2.3 nd
L. Oak 650_72hrs 77.3 20.1 28.5 14.7 5.4 7.4 505.0 nd
L. Pine 400_72hrs 72.1 22.3 37.3 51.2 32.6 0.9 4.9 289.2
L. Pine 650_72hrs 82.5 14.2 27.2 21.7 19.8 1.2 416.4 640.9 1. Additional details on plant type described in text. Peak temperature of combustion held at 3 h unless specified otherwise 2. OC = organic carbon content, O is oxygen content, yield = weight biochar/parent biomass, volatile is mass volatized after 6 min at 900 C, ash is residual weight after combustion at 750 C for 6 h, S.A.-N2 and S.A.-CO2 is surface area determined by N2 and CO2 adsorption, respectively, nd = not determined.
SI‐8
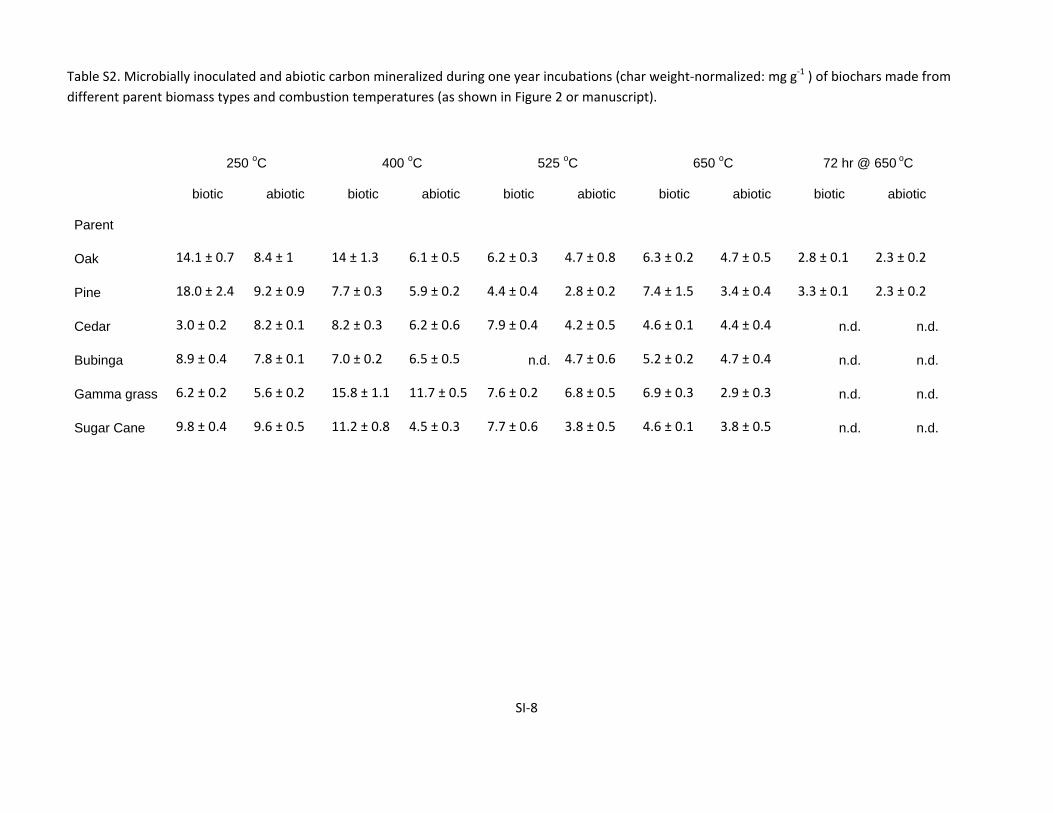
Table S2. Microbially inoculated and abiotic carbon mineralized during one year incubations (char weight‐normalized: mg g‐1 ) of biochars made from
different parent biomass types and combustion temperatures (as shown in Figure 2 or manuscript).
250 oC 400 oC 525 oC 650 oC 72 hr @ 650 oC
biotic abiotic biotic abiotic biotic abiotic biotic abiotic biotic abiotic
Parent
Oak 14.1 ± 0.7 8.4 ± 1 14 ± 1.3 6.1 ± 0.5 6.2 ± 0.3 4.7 ± 0.8 6.3 ± 0.2 4.7 ± 0.5 2.8 ± 0.1 2.3 ± 0.2
Pine 18.0 ± 2.4 9.2 ± 0.9 7.7 ± 0.3 5.9 ± 0.2 4.4 ± 0.4 2.8 ± 0.2 7.4 ± 1.5 3.4 ± 0.4 3.3 ± 0.1 2.3 ± 0.2
Cedar 3.0 ± 0.2 8.2 ± 0.1 8.2 ± 0.3 6.2 ± 0.6 7.9 ± 0.4 4.2 ± 0.5 4.6 ± 0.1 4.4 ± 0.4 n.d. n.d.
Bubinga 8.9 ± 0.4 7.8 ± 0.1 7.0 ± 0.2 6.5 ± 0.5 n.d. 4.7 ± 0.6 5.2 ± 0.2 4.7 ± 0.4 n.d. n.d.
Gamma grass 6.2 ± 0.2 5.6 ± 0.2 15.8 ± 1.1 11.7 ± 0.5 7.6 ± 0.2 6.8 ± 0.5 6.9 ± 0.3 2.9 ± 0.3 n.d. n.d.
Sugar Cane 9.8 ± 0.4 9.6 ± 0.5 11.2 ± 0.8 4.5 ± 0.3 7.7 ± 0.6 3.8 ± 0.5 4.6 ± 0.1 3.8 ± 0.5 n.d. n.d.
SI‐9
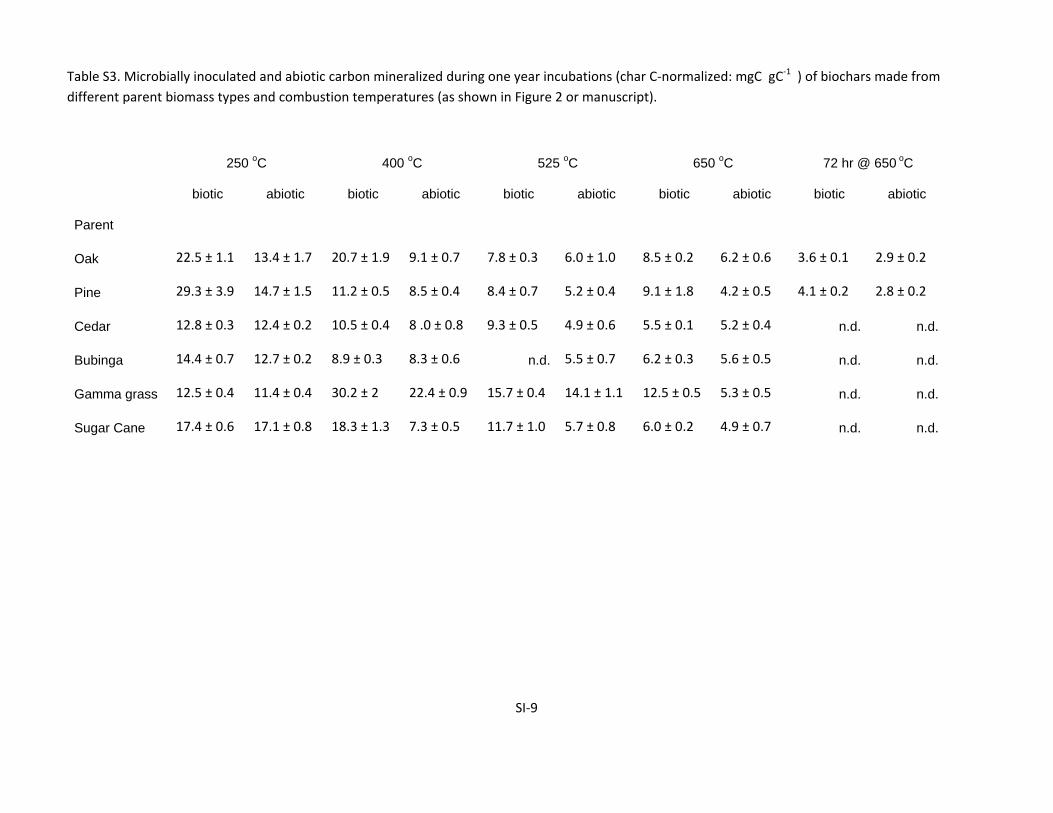
Table S3. Microbially inoculated and abiotic carbon mineralized during one year incubations (char C‐normalized: mgC gC‐1 ) of biochars made from
different parent biomass types and combustion temperatures (as shown in Figure 2 or manuscript).
250 oC 400 oC 525 oC 650 oC 72 hr @ 650 oC
biotic abiotic biotic abiotic biotic abiotic biotic abiotic biotic abiotic
Parent
Oak 22.5 ± 1.1 13.4 ± 1.7 20.7 ± 1.9 9.1 ± 0.7 7.8 ± 0.3 6.0 ± 1.0 8.5 ± 0.2 6.2 ± 0.6 3.6 ± 0.1 2.9 ± 0.2
Pine 29.3 ± 3.9 14.7 ± 1.5 11.2 ± 0.5 8.5 ± 0.4 8.4 ± 0.7 5.2 ± 0.4 9.1 ± 1.8 4.2 ± 0.5 4.1 ± 0.2 2.8 ± 0.2
Cedar 12.8 ± 0.3 12.4 ± 0.2 10.5 ± 0.4 8 .0 ± 0.8 9.3 ± 0.5 4.9 ± 0.6 5.5 ± 0.1 5.2 ± 0.4 n.d. n.d.
Bubinga 14.4 ± 0.7 12.7 ± 0.2 8.9 ± 0.3 8.3 ± 0.6 n.d. 5.5 ± 0.7 6.2 ± 0.3 5.6 ± 0.5 n.d. n.d.
Gamma grass 12.5 ± 0.4 11.4 ± 0.4 30.2 ± 2 22.4 ± 0.9 15.7 ± 0.4 14.1 ± 1.1 12.5 ± 0.5 5.3 ± 0.5 n.d. n.d.
Sugar Cane 17.4 ± 0.6 17.1 ± 0.8 18.3 ± 1.3 7.3 ± 0.5 11.7 ± 1.0 5.7 ± 0.8 6.0 ± 0.2 4.9 ± 0.7 n.d. n.d.
SI‐10
Table S4. Significant relationships between biochar mineralization rate and chemical and physical characteristics of biochars
Modeled abiotic
%Clost 100 y
Measured tot. min.
(mgC/g char-y)
Measured tot. abiotic min.(mgC/g char-y)
S.A.-N21
(m2/g) S.A.-CO2
(m2/g) OC
(wght.%)O
(wght.%)Yield
(wght.%)
Volatile matter (wght.%)
Volatile Carbon (wght.%)
Modeled %Clost -100 y
0.462 0.45 0.56 0.24 0.47 0.49 0.47 0.36 0.35 0.18
Modeled abiotic %Clost -100 y
0.22 0.50 0.41 0.30 0.36 0.33 0.39 0.42 0.27
Measured tot. min. (mg C/g char-y)
0.55 0.20 0.22 0.34 0.33 n.s. 0.35 n.s.
Measured tot. abiotic min. (mg C/g char-y)
0.40 0.18 0.36 0.36 0.27 0.44 0.29
S.A.-N2 m2/g 0.53 0.40 0.37 0.31 0.48 0.28
S.A.-CO2m2/g 0.51 0.46 0.55 0.33 n.s.
OC (wght.%) 0.99 0.24 0.53 n.s.
O (wght.%) 0.21 0.52 n.s.
Yield (wght.%) 0.29 n.s.
Volatile matter (wght.%)
0.66
1. Abbreviation same as Table S1.
2. Correlation coefficient (r2) for linear significant (i.e. p > 0.05) relationship between two variables; underlined when relationship is indirect, n.s. = relationship not significant at 95% level.
SI‐11
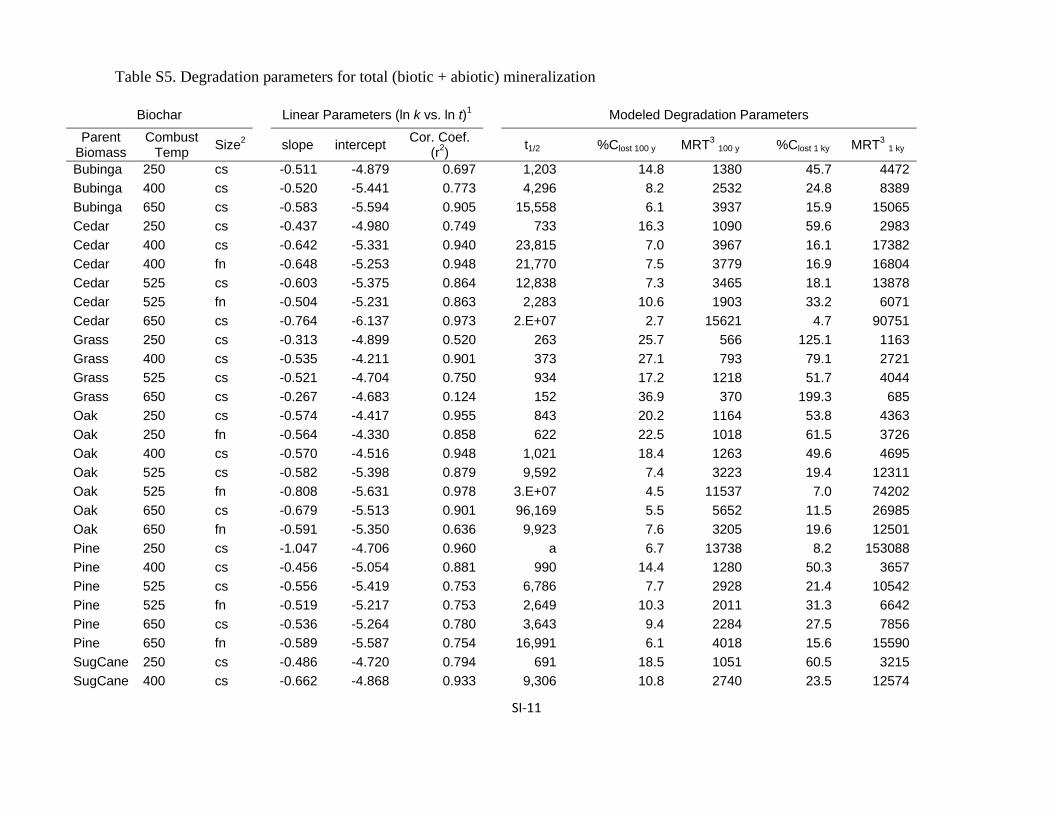
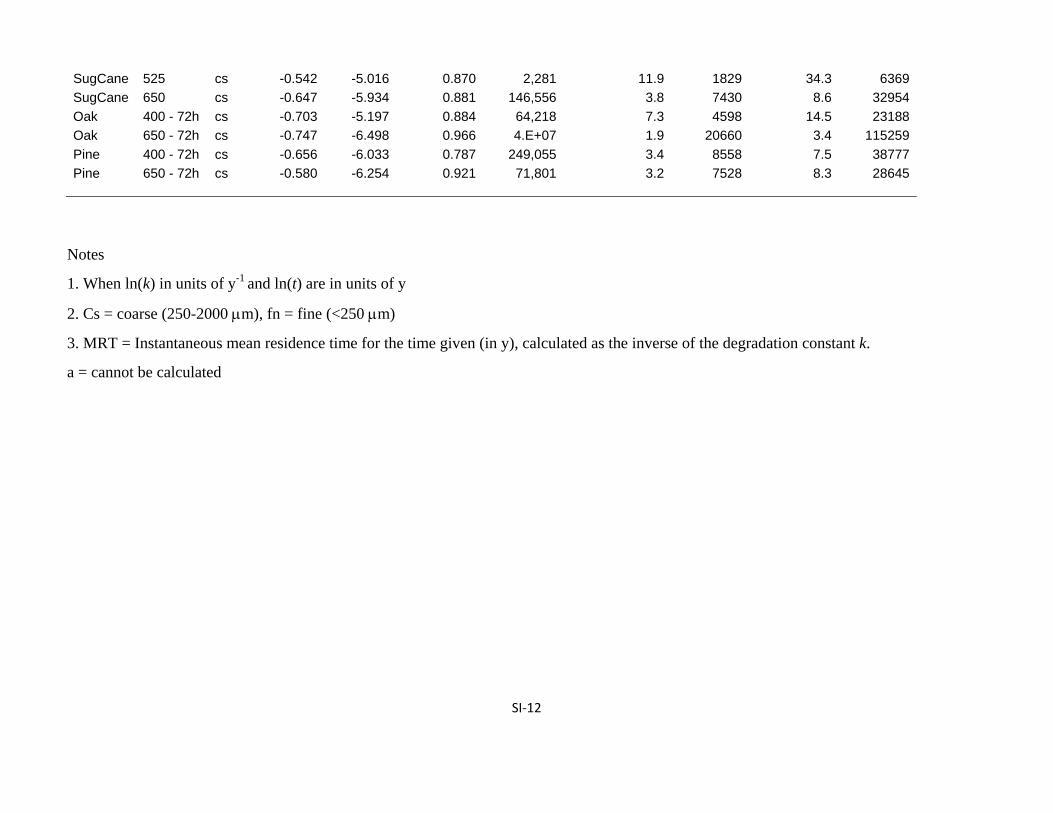
Table S5. Degradation parameters for total (biotic + abiotic) mineralization
Biochar Linear Parameters (ln k vs. ln t)1 Modeled Degradation Parameters
Parent Biomass
Combust Temp
Size2 slope intercept Cor. Coef.
(r2) t1/2 %Clost 100 y MRT3 100 y %Clost 1 ky MRT3 1 ky
Bubinga 250 cs -0.511 -4.879 0.697 1,203 14.8 1380 45.7 4472
Bubinga 400 cs -0.520 -5.441 0.773 4,296 8.2 2532 24.8 8389
Bubinga 650 cs -0.583 -5.594 0.905 15,558 6.1 3937 15.9 15065
Cedar 250 cs -0.437 -4.980 0.749 733 16.3 1090 59.6 2983
Cedar 400 cs -0.642 -5.331 0.940 23,815 7.0 3967 16.1 17382
Cedar 400 fn -0.648 -5.253 0.948 21,770 7.5 3779 16.9 16804
Cedar 525 cs -0.603 -5.375 0.864 12,838 7.3 3465 18.1 13878
Cedar 525 fn -0.504 -5.231 0.863 2,283 10.6 1903 33.2 6071
Cedar 650 cs -0.764 -6.137 0.973 2.E+07 2.7 15621 4.7 90751
Grass 250 cs -0.313 -4.899 0.520 263 25.7 566 125.1 1163
Grass 400 cs -0.535 -4.211 0.901 373 27.1 793 79.1 2721
Grass 525 cs -0.521 -4.704 0.750 934 17.2 1218 51.7 4044
Grass 650 cs -0.267 -4.683 0.124 152 36.9 370 199.3 685
Oak 250 cs -0.574 -4.417 0.955 843 20.2 1164 53.8 4363
Oak 250 fn -0.564 -4.330 0.858 622 22.5 1018 61.5 3726
Oak 400 cs -0.570 -4.516 0.948 1,021 18.4 1263 49.6 4695
Oak 525 cs -0.582 -5.398 0.879 9,592 7.4 3223 19.4 12311
Oak 525 fn -0.808 -5.631 0.978 3.E+07 4.5 11537 7.0 74202
Oak 650 cs -0.679 -5.513 0.901 96,169 5.5 5652 11.5 26985
Oak 650 fn -0.591 -5.350 0.636 9,923 7.6 3205 19.6 12501
Pine 250 cs -1.047 -4.706 0.960 a 6.7 13738 8.2 153088
Pine 400 cs -0.456 -5.054 0.881 990 14.4 1280 50.3 3657
Pine 525 cs -0.556 -5.419 0.753 6,786 7.7 2928 21.4 10542
Pine 525 fn -0.519 -5.217 0.753 2,649 10.3 2011 31.3 6642
Pine 650 cs -0.536 -5.264 0.780 3,643 9.4 2284 27.5 7856
Pine 650 fn -0.589 -5.587 0.754 16,991 6.1 4018 15.6 15590
SugCane 250 cs -0.486 -4.720 0.794 691 18.5 1051 60.5 3215
SugCane 400 cs -0.662 -4.868 0.933 9,306 10.8 2740 23.5 12574
SI‐12
SugCane 525 cs -0.542 -5.016 0.870 2,281 11.9 1829 34.3 6369
SugCane 650 cs -0.647 -5.934 0.881 146,556 3.8 7430 8.6 32954
Oak 400 - 72h cs -0.703 -5.197 0.884 64,218 7.3 4598 14.5 23188
Oak 650 - 72h cs -0.747 -6.498 0.966 4.E+07 1.9 20660 3.4 115259
Pine 400 - 72h cs -0.656 -6.033 0.787 249,055 3.4 8558 7.5 38777
Pine 650 - 72h cs -0.580 -6.254 0.921 71,801 3.2 7528 8.3 28645
Notes
1. When ln(k) in units of y-1 and ln(t) are in units of y
2. Cs = coarse (250-2000 m), fn = fine (<250 m)
3. MRT = Instantaneous mean residence time for the time given (in y), calculated as the inverse of the degradation constant k.
a = cannot be calculated
SI‐13
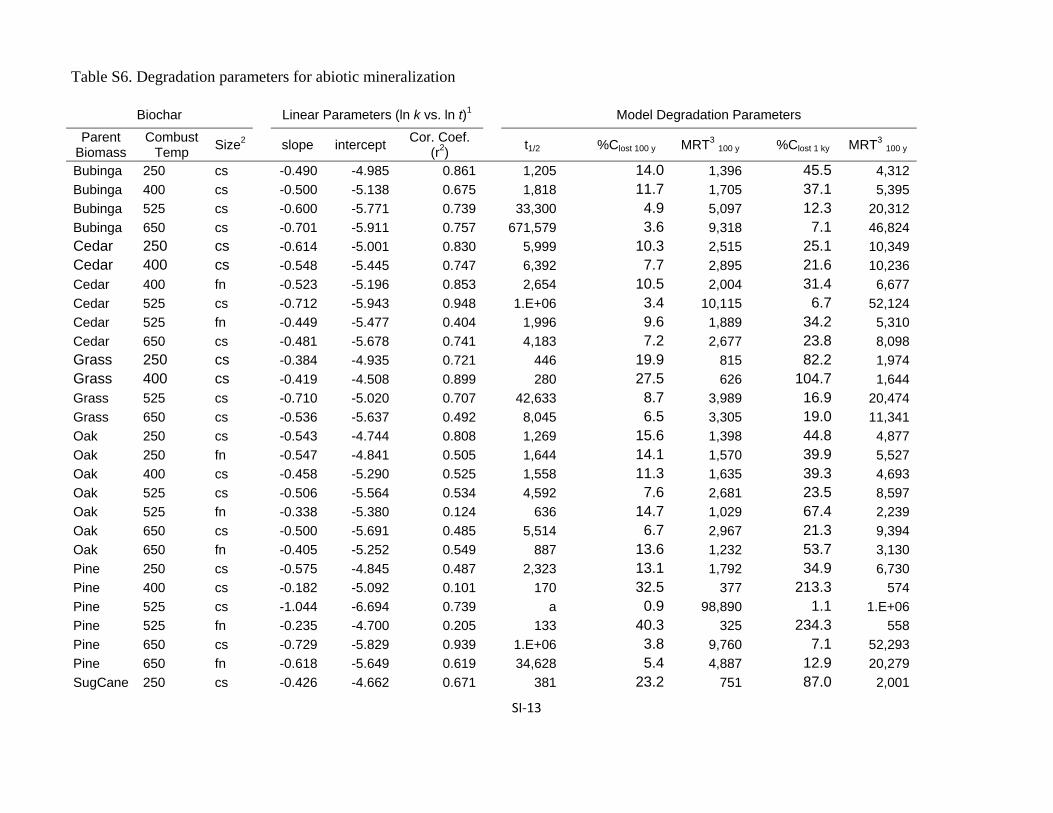
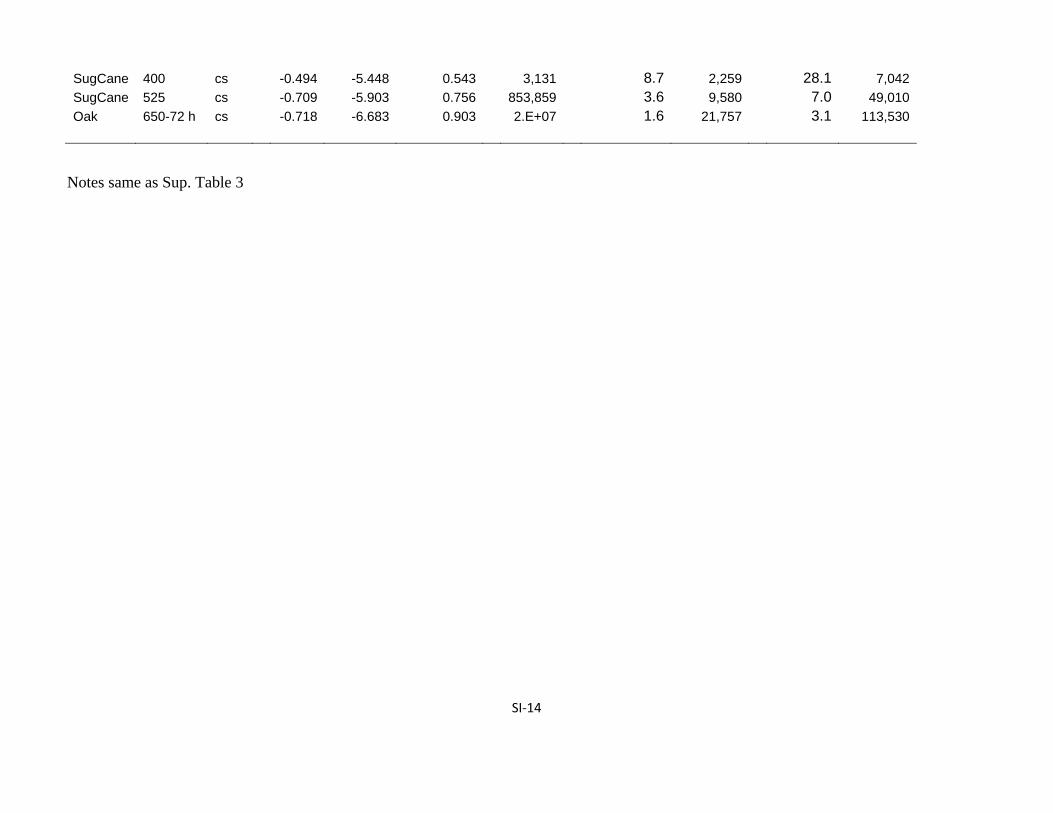
Table S6. Degradation parameters for abiotic mineralization
Biochar Linear Parameters (ln k vs. ln t)1 Model Degradation Parameters
Parent Biomass
Combust Temp
Size2 slope intercept Cor. Coef.
(r2) t1/2 %Clost 100 y MRT3 100 y %Clost 1 ky MRT3 100 y
Bubinga 250 cs -0.490 -4.985 0.861 1,205 14.0 1,396 45.5 4,312
Bubinga 400 cs -0.500 -5.138 0.675 1,818 11.7 1,705 37.1 5,395
Bubinga 525 cs -0.600 -5.771 0.739 33,300 4.9 5,097 12.3 20,312
Bubinga 650 cs -0.701 -5.911 0.757 671,579 3.6 9,318 7.1 46,824
Cedar 250 cs -0.614 -5.001 0.830 5,999 10.3 2,515 25.1 10,349
Cedar 400 cs -0.548 -5.445 0.747 6,392 7.7 2,895 21.6 10,236
Cedar 400 fn -0.523 -5.196 0.853 2,654 10.5 2,004 31.4 6,677
Cedar 525 cs -0.712 -5.943 0.948 1.E+06 3.4 10,115 6.7 52,124
Cedar 525 fn -0.449 -5.477 0.404 1,996 9.6 1,889 34.2 5,310
Cedar 650 cs -0.481 -5.678 0.741 4,183 7.2 2,677 23.8 8,098
Grass 250 cs -0.384 -4.935 0.721 446 19.9 815 82.2 1,974
Grass 400 cs -0.419 -4.508 0.899 280 27.5 626 104.7 1,644
Grass 525 cs -0.710 -5.020 0.707 42,633 8.7 3,989 16.9 20,474
Grass 650 cs -0.536 -5.637 0.492 8,045 6.5 3,305 19.0 11,341
Oak 250 cs -0.543 -4.744 0.808 1,269 15.6 1,398 44.8 4,877
Oak 250 fn -0.547 -4.841 0.505 1,644 14.1 1,570 39.9 5,527
Oak 400 cs -0.458 -5.290 0.525 1,558 11.3 1,635 39.3 4,693
Oak 525 cs -0.506 -5.564 0.534 4,592 7.6 2,681 23.5 8,597
Oak 525 fn -0.338 -5.380 0.124 636 14.7 1,029 67.4 2,239
Oak 650 cs -0.500 -5.691 0.485 5,514 6.7 2,967 21.3 9,394
Oak 650 fn -0.405 -5.252 0.549 887 13.6 1,232 53.7 3,130
Pine 250 cs -0.575 -4.845 0.487 2,323 13.1 1,792 34.9 6,730
Pine 400 cs -0.182 -5.092 0.101 170 32.5 377 213.3 574
Pine 525 cs -1.044 -6.694 0.739 a 0.9 98,890 1.1 1.E+06
Pine 525 fn -0.235 -4.700 0.205 133 40.3 325 234.3 558
Pine 650 cs -0.729 -5.829 0.939 1.E+06 3.8 9,760 7.1 52,293
Pine 650 fn -0.618 -5.649 0.619 34,628 5.4 4,887 12.9 20,279
SugCane 250 cs -0.426 -4.662 0.671 381 23.2 751 87.0 2,001
SI‐14
SugCane 400 cs -0.494 -5.448 0.543 3,131 8.7 2,259 28.1 7,042
SugCane 525 cs -0.709 -5.903 0.756 853,859 3.6 9,580 7.0 49,010
Oak 650-72 h cs -0.718 -6.683 0.903 2.E+07 1.6 21,757 3.1 113,530
Notes same as Sup. Table 3
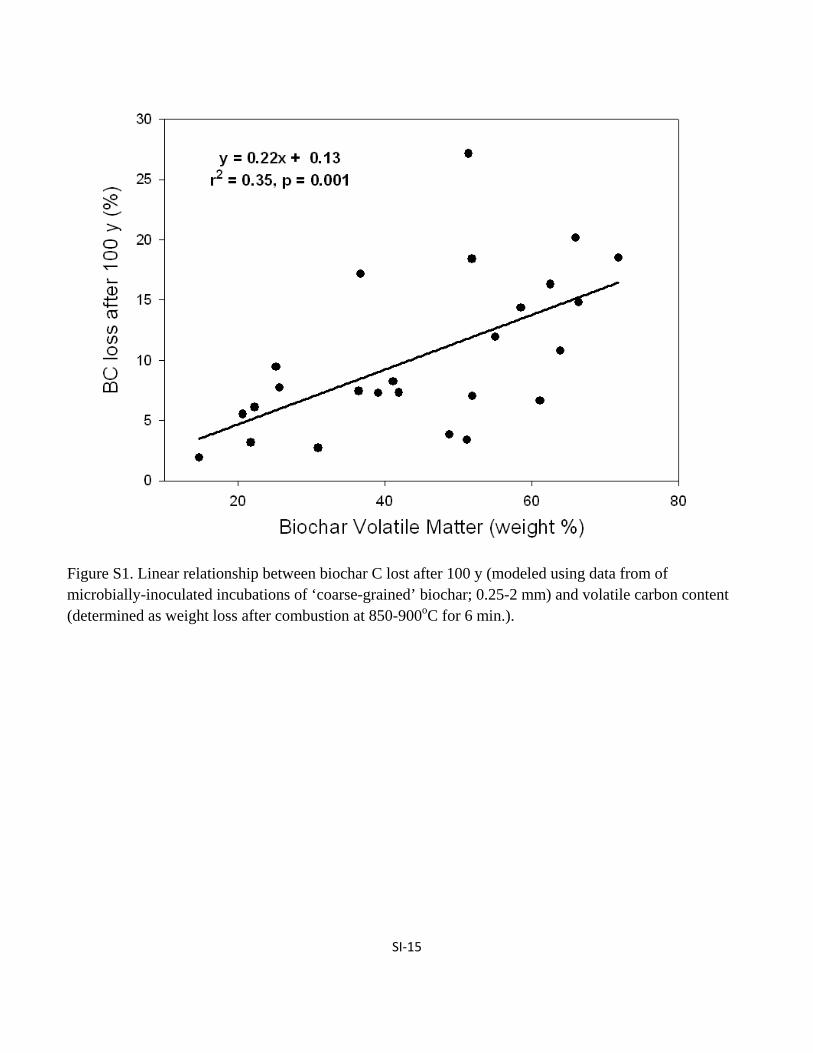
SI‐15
Figure S1. Linear relationship between biochar C lost after 100 y (modeled using data from of microbially-inoculated incubations of ‘coarse-grained’ biochar; 0.25-2 mm) and volatile carbon content (determined as weight loss after combustion at 850-900oC for 6 min.).