Embed Size (px)
Citation preview
Version of 3/19/2018
Abiding by the Law: Using Benford’s Law to Examine Nonprofit Financial
Reports
Heng Qu*
The Bush School of Government and Public Service
Texas A&M University
Richard Steinberg**
Department of Economics and Lilly Family School of Philanthropy
IUPUI
Ronelle Burger***
Department of Economics
Stellenbosch University
Abstract: Tax-exempt organizations generally must file annual informational re-
turns (Form 990) with the Internal Revenue Service (IRS). Funders, charity
watchdogs, and regulators use this information as their primary source for finan-
cial accountability, and scholars rely on the data to evaluate and understand non-
profit behavior. The IRS is charged with protecting the integrity of 990 data but
lacks resources and rarely audits these returns. We show that a mathematical odd-
ity known as Benford’s Law can flag data as suspicious and prioritize candidates
for more detailed investigation. The results confirm that those organizations pre-
dicted to be more likely to file misleading or fabricated data are more likely to be
flagged by Benford’s Law. Further methodological refinement will enable Ben-
ford’s Law to become an effective screening tool for nonprofit financial reports.
* Corresponding Author. The Bush School of Government and Public Service, Texas A&M Uni-
versity, 4220 TAMU, College Station, TX 77843-4220. USA. [email protected]
** Dept. of Economics, IUPUI, Indianapolis, IN 46236. [email protected]
*** Dept. of Economics, Stellenbosch University. Private Bag X1, Matieland, 7602, Stellen-
bosch, South Africa. [email protected]
Abiding by the Law: Using Benford’s Law to Examine Nonprofit Financial
Reports
Abstract: Tax-exempt organizations generally must file annual informational returns (Form 990)
with the Internal Revenue Service (IRS). Funders, charity watchdogs, and regulators use this in-
formation as their primary source for financial accountability, and scholars rely on the data to
evaluate and understand nonprofit behavior. The IRS is charged with protecting the integrity of
990 data but lacks resources and rarely audits these returns. We show that a mathematical oddity
known as Benford’s Law can flag data as suspicious and prioritize candidates for more detailed
investigation. The results confirm that those organizations predicted to be more likely to file mis-
leading or fabricated data are more likely to be flagged by Benford’s Law. Further methodologi-
cal refinement will enable Benford’s Law to become an effective regulatory tool for nonprofit
financial reports.
Practitioner Points:
Benford’s Law is useful for flagging suspicious financial data, which can be used as a
mechanism to enhance the reliability of nonprofit financial data, thus promoting account-
ability and transparency in the nonprofit sector.
We suggest a neglected statistical test and argue that it is less likely to produce false neg-
atives than conventional tests used in Benford analysis.
Besides nonprofit financial reports, Benford’s Law can also be applied to many other
kinds of government data.
Nonprofit organizations offer an important alternative institutional form for delivering
welfare, health, education, arts and culture, international, religious, and other social services.
Several agencies are charged with oversight of U.S. nonprofit organizations, including the Inter-
nal Revenue Service (IRS), the National Association of State Charity Officials (NASCO), and
more informally a number of peer review and monitoring bodies. Parallel to debates on transpar-
ency in public spheres, there are concerns that the effectiveness of these oversight channels are
impeded by weaknesses in the Form 990 data.
Most U.S. nonprofits with gross receipts exceeding $25,000 must file an informational
return each year (Form 990 or 990-EZ) with the IRS and make this form publicly available.1 This
information disclosure is an important mechanism for nonprofit accountability. The IRS (2017,
1) explains the purpose in its instructions: “Some members of the public rely on Form 990 or
Form 990-EZ as their primary or sole source of information about a particular organization. How
the public perceives an organization in such cases can be determined by information presented
on its return.” Form 990 contains extensive financial information as well as categorical infor-
mation on activities and governance. Major funders require that their applicants submit copies of
their Forms 990, charitable ratings services (e.g., Charity Navigator, the Better Business Bu-
reau’s Wise Giving Alliance, and Charity Watch) use 990 data to evaluate nonprofit financial ac-
countability, and Guidestar posts the Forms 990 of all registered nonprofits to advance transpar-
ency and inform donor decisions. Finally, the comprehensive panels of 990 data are a goldmine
for scholars who advance knowledge on nonprofit behavior.
Therefore, the reliability of 990 data is important. Yet, there are many problems. Prior re-
search finds that some Form 990 reports may violate generally accepted accounting principles
(GAAP), containing errors and reporting biases (e.g. Keating and Frumkin 2003). Keating and
Frumkin (2003) conclude that weaknesses in Form 990 data are due to structural factors such as
the limited market for nonprofit information (e.g. no stock market of investors) and heterogene-
ity in the needs of data users. They also argue that while greater transparency and credibility may
be socially optimal – improving the reputation of the sector and consequently increasing invest-
ments and donations in the sector – it is never beneficial for an individual nonprofit to disclose
more in a competitive funding environment.
In particular, Form 990 requires nonprofits to divide their total expenditures into three
functional categories: program, fundraising, and administrative. Many studies reveal the misre-
porting of functional expenses. Donors, regulators, charity watchdogs, the media, and the public
have paid the most attention to program ratio (i.e. the ratio of program to total expenses) as an
important metric for nonprofit performance (see Garven, Hofmann, and McSwain 2016 for a re-
view). Therefore, nonprofits have the incentive to improve their program ratio by reallocating
(thereby underreporting) some fundraising and/or administrative expenses to program expenses
(thereby overreporting). Studies confirm that the patterns of functional expense reporting are
consistent with stakeholder-impression management, as the reported program ratios are exces-
sive while the reported ratios of fundraising (or administrative) to total expenditures are too low
(Trussel 2003; Wing et al. 2006; Jones and Roberts 2006; Krishnan, Yetman, and Yetman 2006;
Keating, Parsons, and Roberts 2008; Krishnan and Yetman 2011). Other studies find that non-
profits may also manipulate data to reduce their unrelated-business income tax obligations (Omer
and Yetman 2003; 2007). Some support their conclusions by comparing 990 data with audited
financial statements (Froelich, Knoepfle, and Pollak 2000; Keating and Frumkin 2003; Krishnan
et al 2006; Burks 2015). Others compare annual reports to state regulatory agencies with 990
data (Keating et al 2008; Krishnan and Yetman 2011). None use the approach taken in this arti-
cle, comparing the distribution of reported numbers with that predicted by mathematical theory.
The Internal Revenue Service (IRS) is charged with protecting the integrity of 990 data,
but lacks resources and rarely audits Forms 990 (Mayer 2016). In this article, we verify the ap-
plicability of Benford’s Law to flag suspicious data and prioritize candidates for a more detailed
investigation. Benford’s Law states that the leading digits of most kinds of naturally generated
numerical data are not equally likely to occur – it is far more likely that the first digit will be a 1
(30% of the time) than a 9 (less than a 5% of the time). The leading digits of made-up numbers
have different distributions, so we test for data integrity by seeing whether the frequencies of
leading 1s, 2s, 3s, etc. in Form 990 data differs from the Benford frequencies.
Some of the deviations from the Benford distribution are more excusable than others, re-
flecting differing reporting periods, accounting methods, or transcription errors. However, the
differences that reflect conscious manipulation of the data, designed to manage stakeholder per-
ceptions or to elude taxes and regulations, are of far greater concern. Benford analysis can signal
that such abuses are present.
We analyze compliance with Benford’s law at multiple levels– across the whole sample,
by selected variables, and by individual organizations, using a panel of 990 data from 1998 to
2003. We develop hypotheses around three broad institutional characteristics that prior literature
suggests would make nonprofits more likely to deviate from Benford’s law, namely: 1) philan-
thropic amateurism, 2) compliance with public perception, and 3) lack of funder oversight. Our
statistical tests and regression analysis provide support for all three sets of hypotheses.
In the next section, we provide background on Benford’s Law. Then we develop our hy-
potheses, describe the data and method. The following section presents results, and we conclude
with a discussion of implications for government practice.
Benford’s Law
Paging through library copies of logarithm tables, the American astronomer Simon New-
comb observed that the pages at front dealing with the low digits were far more worn out than
those in back. Based on this, he formulated a hypothesis that the ten digits do not occur with
equal frequency, with more numbers beginning with the lowest digits (1 or 2) than with the high-
est digits (8 or 9). Specifically, “the law of probability of the occurrence of numbers is such that
all mantissae of their logarithms are equally likely” (Newcomb, 1881). Given this, the frequency
of “natural” numbers beginning with digit 1 should be about 30% of the time, and that with digit
2 should be about 18% of the time, and so on, the frequency of numbers with leading digit 8
should be 5.1%, and that with leading digit 9 should be 4.6%. This phenomenon was later re-
ferred to as Benford’s Law.
Newcomb did not provide any theoretical explanation and his discovery did not raise much
attention. Until 1938, when Frank Benford, a physicist with the General Electric Company, noted
the same pattern again. He went further to confirm this hypothesis by experimenting on 20 dif-
ferent types of “natural” numbers (20,229 observations), ranging from square roots of integers,
atomic weights, population sizes, surface areas of rivers, and death rates, to street addresses of
American Men of Science, and every number from an issue of Readers Digest (Benford, 1938).
For a long time, Benford’s Law was deemed a mysterious law of nature. The mathematician
Theodore Hill (1995) gave the first rigorous theoretical explanations of the law, followed by later
scholars that continued his unfinished work. Although the mathematical proof of Benford’s Law
is complicated, the natural relationship between growth rates and the log of first digits provides
some intuition. Suppose the total revenue of an organization is $1,000,000. Then it must grow
100% before it reaches $2,000,000 (leading digit of 2), 50% for the leading digit to be 3, and
only 12.5% to raise a leading digit 8 to 9. This makes 1 more common than any other digit
(Durtschi, Hillison, and Pacini 2004).
Practical applications of Bedford’s Law did not arrive until the 1970s. Hal Varian (1972)
first suggested that Benford’s Law could be used to verify the plausibility of economic forecast
data, finding that both the input data and forecasts were consistent with the Benford distribution.
Extending his insight, later researchers compared the first-digit frequency distribution of a da-
taset with the Benford’s Law distribution to test whether the data is naturally generated or made
up. Later, accounting scholars began applying Benford’s Law to detect possibly fraudulent finan-
cial data (e.g. Nigrini 1996), and digital analysis based on Bedford’s Law has become a standard
tool in forensic accounting to identify suspicious cases for further investigation (Archambault
and Archambault 2011; Collins 2017). In addition to accounting data, Benford’s Law was instru-
mental in detecting that Greece had falsified the macroeconomic data submitted for entry into the
EU (Rauch et al. 2011). Similarly, Benford’s Law provided evidence of fraud in Russian election
results (Myagkov, Ordeshook, and Shakin 2005). It is now widely viewed as a credible approach
to help detect fieldworker cheating in household surveys (Finn and Ranchod 2017; Schräpler
2011), and to flag suspicious self-reported information on compliance with regulations (De
Marchi and Hamilton 2006). Benford’s Law produces false positives and false negatives2 and
therefore deviations from Benford’s Law should be used diagnostically, to direct or prioritize re-
sources for further investigations, rather than probatively (Tam Cho and Gaines 2007).
Hill (1995; 1998) noted that natural data will follow Benford’s law when the numbers are
combinations of naturally-generated data in several steps.3 Most accounting data is a combina-
tion of transactions, so Benford analysis is appropriate (Durtschi et al. 2004). Certain types of
data do not conform to Benford’s Law (Durtschi et al. 2004; Schräpler 2011). First, when there is
a binding maximum or minimum value for the data, it will have a non-Benford distribution. Sec-
ond, assigned numbers, such as zip codes or check numbers, are expected to follow a uniform
distribution rather than a Benford distribution. Numbers influenced by human thought, such as
ATM withdrawal amounts or price setting at $9.99 to exploit psychological thresholds, do not
conform to the Benford distribution. Third, data consisting of single transactions does not obey
the Law, which relies on the combination of transactions.
We have located only one article (Van Caneghem 2016: Belgian nonprofits), two work-
ing papers (Dang and Owens 2016: UK charities; Burger, Dang, and Owens 2017: Ugandan
NGOs), and two blog posts (Galbi 2012; Kane 2011) that apply Benford analysis to nonprofit fi-
nancial data. Van Caneghem (2016) used a variant of Benford that predicts the frequency distri-
bution of the first two digits on Belgian nonprofit data. He found that 0 and 5 appeared as the
second digit much more often than Benford predicted, and that all other digits were observed less
frequently than predicted. He attributes this to roundoff error.4 Because roundoff error is a less
important inaccuracy, where there would usually be no intention to mislead, our Benford analy-
sis is conducted on the leading digit because it cannot be rounded off. In addition, we are among
the first to apply Benford analysis to the U.S. nonprofit tax return data.
Theory and Hypotheses
The reliability of nonprofit financial reports is important, yet prior research provides evi-
dence of misreporting. Some suggest that nonprofit financial misreporting could be uninten-
tional, due to constraints in organizational resources, such as accounting expertise, management
experience, and governance mechanisms (Yetman and Yetman 2013; Keating et al 2008). Oth-
ers imply that misreporting could be a result of intentional managerial manipulation, that is, non-
profit managers have an incentive to understate their administrative and/or fundraising expenses
for improved efficiency ratios (Krishnan et al 2006; Jones and Roberts 2006). We propose eight
hypotheses suggested by prior literature, falling into three categories – philanthropic amateurism,
public perception compliance, and funder oversight.
Philanthropic amateurism versus professionalism. Salamon (1987) proposed that volun-
tary failure should be weighed against market and government failures to decide on the role of
nonprofit organizations in a three-sector economy. He noted that government employees must be
credentialed to ensure the legitimacy of political institutions, and there are strong forces in favor
of professionalism in the for-profit sector as well. In contrast, voluntary actors, rooted in dedica-
tion to mission, may not acquire the same sorts of professional training. For example, performing
arts organizations are often led by former performers rather than those trained in arts manage-
ment and business methods.
This “philanthropic amateurism” is defined here as the lack of accounting sophistication
or management professionalization. First, there are variations in the reported accounting method
on Form 990: cash, accrual, or other. Although not required by the IRS, accrual accounting is
recommended in the Generally Accepted Accounting Principles (GAAP) because it provides a
more accurate picture of a firm’s overall financial health (Keating and Frumkin 2003). Keating et
al. (2008) suggest that the use of GAAP indicates organizations’ accounting sophistication, and
they find that those with less accounting sophistication are more likely to misreport the costs of
telemarketing campaigns on Form 990. Following previous literature, our first hypothesis is:
H1: Organizations employing accrual accounting are more compliant with the Benford
distribution (i.e. proper reporting) than organizations using cash or other accounting methods.
Second, organizations using external professional accountants are more likely to
properly report their financials on Form 990, compared with those with no external professional
accountants and reported zero accounting fees (Keating et al. 2008; Krishnan et al. 2006). Our
second hypothesis is:
H2: Nonprofits using external professional accounting services (i.e. reporting positive ac-
counting fees) are more compliant with the Benford distribution than other organizations.
The third form of philanthropic amateurism is the absence of professional management,
indicated by zero compensation to officers and/or directors. Prior research suggests that the exist-
ence of professional management may reflect a higher ability to produce high-quality financial
reports (Tinkelman 1999). On the other hand, principal-agent theory, which describes difficulties
when a principal works with others (agents) who do not necessarily share the principal’s interest,
provides a counterargument. Here, nonprofit managers (as agents of the nonprofit board) may
misreport some expenses in order to increase their compensation (Krishnan et al. 2006; Baber,
Daniel, and Roberts 2002). Because we do not know which effect is bigger, we test the two-sided
null hypothesis that:
H3: Nonprofits that employ paid officers and/or directors and those relying on volunteer
officers or directors are equally compliant with the Benford distribution.
Public perception compliance. Philanthropic amateurism is one reason for misreporting,
managerial manipulation is another. Rightly or wrongly, donors, charity watchdogs, regulators,
and media all pressure nonprofits to have a low overhead ratio (i.e. fundraising and administra-
tion expenses divided by total expenses) and consequentially, a high program ratio (i.e. program
expenses divided by total expenses). To improve its program ratio and thus lower the overhead
ratio, a nonprofit may misallocate part or all its fundraising and administrative expenses as pro-
gram expenses, or net-out fundraising expenses from funds raised instead of separately reporting
fundraising expenses (Garven et al. 2016). More severely, many nonprofits reported zero fund-
raising expenses (despite receiving substantial contributions) and/or zero administrative ex-
penses. For example, Urban Institute and Center on Philanthropy at Indiana University (2004)
analyzed 220,000 Forms 990 (1999-2004) and reported that 37% of nonprofit organizations with
at least $50,000 in contributions reported no fundraising costs and 25% for those receiving be-
tween $1 million and $5 million in contributions. In addition, 13% of nonprofits reported zero
administrative costs. Similarly, in a sample of 73,107 Forms 990 reporting at least $10,000 in to-
tal expenses (1998-2006), Yetman and Yetman (2013) found 36% of organizations receiving at
least $10,000 in donations reported no fundraising expenses and 3% reported no administrative
expenses. Following prior research, we hypothesize that:
H4: Organizations receiving at least $10,000 in donations while reporting zero fundrais-
ing expenses are less compliant with Benford’s Law than other organizations.
H5: Organizations reporting zero administrative expenses are less compliant with Ben-
ford’s Law than those reporting positive administrative expenses.
Funder oversight and monitoring. There are many principal-agent relationships among
nonprofits and their stakeholders, with the nonprofit sometimes acting as the principal and some-
times as the agent (Steinberg 2010). The manipulation of nonprofit financial reports by managers
as agents of the board as principal was discussed in H3. Here we have a principal-agent problem
between the organization as the agent and outside stakeholders as principals. Donors and funders
use nonprofit organizations to provide services and personal benefits (such as enhanced reputa-
tion and warm glow) and seek accurate information about the use of their contributions. The non-
profits pursue their mission and know that in some cases that mission can be advanced by manip-
ulating financial data to increase grants, contracts, and donations. Monitoring and oversight by
funders reduces this mismatch (Hansmann 1996).
Government agencies, as principals, use various monitoring strategies and oversight re-
quirements to ensure that their agents provide accurate financial feedback regarding the use of
their grant and contract receipts, using financial audits, quarterly fiscal reports, and other tech-
niques (Van Slyke 2007). We therefore hypothesize:
H6: Organizations receiving government grants are more compliant with Benford’s Law
than those that never received government grants.
Nonprofits often receive “indirect public support” through federated fundraising agencies
(e.g. United Way). Federated campaigns often impose audit and other financial accountability
requirements on participating organizations to ensure the reputability of the combined campaign.
For example, the umbrella organization of United Way requires that local United Ways assure
that all local member organizations “undergo annual financial audits conducted by independent
certified public accountants whose examination complies with generally accepted auditing stand-
ards. In addition, United Ways have developed comprehensive requirements for completion of
audited financial statements to ensure consistency and transparency system-wide” (United Way
n.d.). We hypothesize:
H7: Organizations receiving indirect public support are more compliant with Benford’s
Law than those that never received indirect public support.
Finally, some organizations have temporarily or permanently restricted assets. These time
or purpose restrictions are imposed by major donors, who have the motivation and power to exert
more oversight. Prior research provides evidence that organizations with donor-restricted assets
are associated with less misreporting (e.g. Keating et al. 2008; Yetman and Yetman 2013). We
therefore propose:
H8: Organizations receiving temporarily or permanently restricted assets are more com-
pliant with the Benford distribution than other organizations.
Data
We use the National Center on Charitable Statistics (NCCS)-GuideStar National Non-
profit Research Database (“digitized data”) for our analyses. The database includes tax-exempt
nonprofit organizations that are required to file IRS Form 990 or 990-EZ between 1998 and
2003. Although there are other Form 990 datasets with a longer time span and more recent data,
the digitized data best suits the needs of this study by providing the most detailed financial infor-
mation across all datasets. Because we are testing for dirty data, we did not clean the data except
to exclude observations with unknown National Taxonomy of Exempt Entities (NTEE) codes
and include only those organizations filing in all six years in order to obtain a balanced panel of
organizations. We then draw a random sample of 1,000 organizations for our analyses,5 includ-
ing 6,000 organization-year observations and up to 214 financial variables for each organization.
Methods
We conduct digital analysis to the sample, that is, compare the observed first-digit fre-
quencies of the sample Form 990 data with the expected first-digit frequencies according to Ben-
ford’s Law. Benford’s Law is violated (and thus plausible misreporting occurs) when the
empirical distribution of first digits in our data differs from the first-digit distribution based on
Benford’s Law. We therefore test the joint null hypothesis:
against the two-sided alternative, where pE (d) is the empirical probability of the first digit equal-
ing d. Following convention, we exclude observations from our analysis whenever they take neg-
ative values, as the distribution of negative values is likely different from the distribution of posi-
tive values. First-digit analysis also exclude zeros, decimals, and missing values.
If the null hypothesis that the frequencies of the observed leading digits conform to the
Bedford’s distribution is rejected at the 5% level, then the organization warrants further investi-
gation. We test the null hypothesis using three alternative statistics: the Pearson chi-squared (χ2),
the modified Kolmogorov-Smirnov (KS) (Joenssen 2015), and the Freedman-Watson U2 (U2)
tests. Each test has advantages and shortcomings described in more detail in the appendix. The χ2
test is traditional in this literature, reported for comparability. The modified KS test is also con-
ventional in this literature because it is more powerful, that is, better able to detect a true rejec-
tion of the null hypothesis. However, neither of these tests is fully appropriate for Benford analy-
sis because they assume that we are testing whether the observed distributions are far from the
expected distributions along a line of numbers. This assumption incorrectly implies that the lead-
ing digits 9 and 1 are furthest from each other. Instead, we should be testing for distance around
a circle, because the leading digits move in order from 1 to 9 and then back to 1 again. The U2
test is specifically designed for circular data, and has additional desirable statistical properties
explained in the appendix. We believe we are among the first to apply this test to Benford analy-
sis. The U2 test is found to be more powerful than χ2 and KS tests in most cases (Lesperance et al.
2016), we therefore prefer the U2 test whenever the results of the three tests differ.
We also report a descriptive measure, the mean absolute deviation (MAD), to indicate the
magnitude of nonconformance. This measure calculates the sum of the absolute differences be-
tween the observed and expected frequencies of each leading digit, divided by nine. According to
Nigrini (2012), a MAD statistic ranging from 0 to 0.006 indicates close conformance to the Ben-
ford’s Law, 0.006 to 0.012 indicates acceptable conformance, 0.012 to 0.015 indicates margin-
ally acceptable conformance, and nonconformance if the MAD statistic is above 0.015.
We conduct the digital analysis at three levels. First, we test whether the entire sample
complies with the Benford distribution. Then, we test data at the variable level to see whether
selected variables violate Benford’s Law. Finally, we test the compliance of individual organiza-
tions.
In addition to the digital analysis, we test our hypothesis at the organizational level.
Specifically, we estimate the effects of philanthropic amateurism, public perception compliance,
and funder oversight on the magnitude of nonconformance at the organizational level using OLS
regressions with robust standard errors. The regressions control for organizational size, age, and
sector, so the empirical model takes the form:
Magnitude of Nonconformancei = + Accrual Accountingi + Accounting Feesi +
Officer Compensationi + Zero Fundraising Expensesi + Zero Management Expensesi +
Government Grantsi + Indirect Public Supporti + Donor Restrictionsi + Sizei + Agei +
Subsectori +
Operationally, the dependent variable is organizational MAD, calculated by pooling all
the reported numbers from all the years for each organization. Three indicator variables measure
philanthropic professionalism/amateurism. First, Accrual Accounting equals 1 if the organization
reported using accrual accounting all six years, 0 otherwise. Second, Accounting Fees equals 1 if
the organization reported positive accounting fees for all years, 0 otherwise. Third, Officer Com-
pensation equals 1 if the organization reported positive compensation of officers and/or directors
for at least one year, 0 otherwise. We predict negative coefficients for the first two measures, and
the coefficient for Officer Compensation could be either direction.
Two indicator variables are used to measure public perception compliance. The first indi-
cator, Zero Fundraising Expenses, equals 1 if the organization reported zero fundraising ex-
penses while receiving at least $10,000 in total contributions in at least one year, 0 otherwise
(following Krishnan et al. 2006). The second indicator, Zero Management Expenses, equals 1 if
the organization reported zero management expenses for at least one year, 0 otherwise. We pre-
dict positive coefficients for both indicators.
Three indicator variables measure funder monitoring. First, Government Grants equals 1
if the organization received positive government grants for at least one year, 0 otherwise. Sec-
ond, Indirect Public Support, equals 1 if the organization received a positive amount of indirect
public support in at least one year, 0 otherwise. Third, Donor Restrictions equals 1 if the organi-
zation received any temporarily or permanently restricted assets in at least one year, 0 otherwise.
We predict the coefficients of these three variables will be negative.
Finally, we include control variables for size, age, and subsector, following prior litera-
ture. Size is the natural log of an organization’s six-year average total expenses (we used alterna-
tive size measures six-year average total revenue and six-year average total assets for robustness
checks). Age is the organization’s age in 2003 (years since granted tax-exempt status), the latest
year in our data. We also control for the organization’s subsector using indicator variables for the
five major subsectors coded in the National Taxonomy for Exempt Entities – Arts, Culture and
Humanities; Education; Health; Human Services; and Other.
Results
Digital Analysis
Whole Sample Conformance. First, we test the overall conformance of the whole sample
by polling all reported numbers from all organizations and years (n = 427,329). The frequencies
of leading digits are very close to those predicted by the Benford distribution, with an average
deviation of only 0.07%. While χ2 (p = 0.0010) and KS (p = 0.049) statistics indicate non-con-
formance with Benford’s Law, the preferred U2 test (p = 0.2043) shows otherwise. We cannot
confidently reject the null hypothesis that the frequencies of first digits follow the Benford distri-
bution. This provides support that the law generally holds for the sample of nonprofit organiza-
tions, which is encouraging.
[Figure 1]
Variable Conformance. Certain variables are of particular interest to donors, watchdogs,
or scholars, including total contributions, program service revenue, total revenue, management
expenses, fundraising expenses, and total expenses. Our tests serve to triangulate the results of
other studies finding that some of these variables are misreported.
Noncompliance with Benford’s Law may indicate a problem with the financial reporting
guidance provided to organizations, rather than organizations’ intent to mislead. For example,
the instructions and guidance for allocating expenses between the program, fundraising, and
management expenses can be complicated and ambiguous, prompting some organizations to use
human judgment and approximation, rather than precise calculations. While such made-up num-
bers may often provide a reasonably accurate reflection of the NPO’s expense shares, it may
cause non-conformance with Benford’s Law.
By the preferred U2 test, we cannot reject the null hypothesis that the reported numbers
follow the Benford distribution for Total Contributions (p = 0.3172) and Management Expenses
(p = 0.2194). However, we can reject the null for Total Revenues (p = 0.0116), Fundraising Ex-
penses (p = 0.0438), Total Expenses (p = 0.0424), and perhaps Program Service Revenues (p =
0.0772). The MAD statistic shows that the deviations for these variables are small, ranging from
0.4% to 0.6%.
The other statistical tests do not always agree with U2 test. For example, for Fundraising
Expenses, we cannot reject the null hypothesis of conformance using the χ2 statistic (p = 0.3628),
but the U2 statistic indicates nonconformance. Similarly, we would reject the null for Total Con-
tributions using the χ2 statistic (p = 0.0256) while both KS and U2 statistics indicate the opposite.
If we are correct that U2 is a more appropriate test, this illustrates the possibility that conven-
tional tests produce misleading conclusions. We therefore suggest that users of digital analysis
include U2 testing in their toolkit and interpret results with caution when conventional tests dif-
fer.
Organizational Conformance. To test each organization’s conformance with Benford’s
Law, we pool all the reported numbers from all years for each organization. We obtained both
the test statistics and MAD for each organization. By the preferred U2 test, less than 20% of the
sample reported financial data that are compliant with Benford’s Law. These organizations have
a smaller MAD on average (n = 182, MAD = 0.015) than those that do not pass the U2 test (n =
818, MAD = 0.034 ) (Table 2). Results are similar using the other two tests. About 25% of the
sample conforms using the KS test, and less than 15% conform using the χ2 test.6 This is similar
to the findings from the financial reports of UK charities that only 25% of the sample conforms
to Benford’s Law using the KS test (Dang and Owens 2016). Table 2 reports the test p-values
and MAD statistics for the whole sample, selected variables, and organizations.
[Table 2]
Hypothesis Testing
We split the sample according to our hypotheses to see whether there are significant dif-
ferences in the MAD across subsamples. Table 3 reports the summary statistics and Table 4 re-
ports OLS regressions with robust standard errors.
Philanthropic amateurism. We use three different indicators of philanthropic amateur-
ism/professionalism. First, we compare organizations using the accrual accounting method with
those using other accounting methods, hypothesizing that the former has more accounting so-
phistication and are more likely to produce high-quality financial reports. We find that nonprofits
using cash or other accounting methods in any year (n = 411, MAD = 0.0384) depart from the
Benford’s distribution significantly more than those using accrual accounting every year (n =
589, MAD = 0.0244; p < 0.0001). Second, we compare organizations that reported positive ac-
counting fees with those that did not, based on the hypothesis that organizations hiring external
accountants are more likely to produce high-quality financial reports. This hypothesis is also
confirmed: nonprofits reporting positive accounting fees every year conform with the Benford
distribution (n = 406, MAD = 0.0265) significantly more than those reporting zero accounting
fees in at least one year (n = 594, MAD = 0.0326; p < 0.0001). Third, we report the differences
between organizations that have paid officers and/or directors and those reliant on unpaid volun-
teers, and find that those reporting positive compensation for at least one year (n = 568, MAD =
0.0241) are significantly more conformant than those reporting zero compensation every year (n
= 432, MAD = 0.0381, p < 0.0001).
Public perception compliance. Our two hypotheses related to image manipulation are
also confirmed. Organizations with suspiciously reported fundraising expenditures, those that re-
ported spending nothing and receiving at least $10,000 in donations in any year, are significantly
less conformant with Benford’s distribution (n = 601, MAD = 0.0311) than those that never re-
ported suspicious fundraising expenditures during the period (n = 399, MAD = 0.0287; p <
0.0001). The same is true for organizations reporting no administrative expenditures in any year
(n = 730; MAD = 0.0430) versus those reporting positive administrative expenses (n = 270;
MAD = .0254; p < 0.0001).
Funder oversight. We offered three hypotheses related to funder oversight, and all are con-
firmed. Conformance is significantly better for those organizations receiving government grants
for at least one year (n = 433, MAD = 0.0247) than for organizations that received no govern-
ment grants during the sampled years (n = 567, MAD = 0.0343; p < 0.0001). Conformance is
also significantly better for those organizations receiving indirect public support in at least one
year (n = 287, MAD = 0.0238) than for those that never received indirect public support (n =
713, MAD = 0.0327; p < 0.0001). Finally, conformance is also significantly higher for those or-
ganizations that received temporarily or permanently restricted donations in any year (n = 456,
MAD = 0.0228) than for those that never received restricted donations (n = 544, MAD = 0.0363;
p < 0.0001).
[Table 3]
Regression Results. The dependent variable is organizational MAD statistic. Each of our
hypotheses is tested by the coefficient on the corresponding indicator variable. We also control
for subsector using NTEE codes, age in 2003, and one of the three alternative measures of organ-
izational size. A negative coefficient indicates that the factor improves conformance with the
Benford distribution, and a positive coefficient indicates that conformance is lowered.
First, our hypotheses are confirmed for two out of three tests of philanthropic amateurism
– the use of accrual accounting method and the presence of paid officers. However, the impact of
positive accounting fees was small and not statistically significant. Second, for our public per-
ception compliance hypotheses, zero reported management expense is positively associated with
lower conformance to Benford’s Law. However, the association between zero fundraising ex-
penses and conformance is small and not significant. Third, the evidence supports our donor
oversight hypotheses in all cases.
Turning to the control variables, we find that larger organizations are more conformant
by two measures (total revenues and total expenses) but total assets have no significant effect.
Education, Human Service, and Other subsector organizations appear significantly less conform-
ant than Arts and Culture organizations (the excluded category), whereas there are small and in-
significant differences between Health and the excluded subsector. Age had a tiny effect on con-
formance that was significant in two specifications and borderline significant in the third.
[Table 4]
Discussion
Previous research in other sectors concludes that Benford’s Law is reliable and robust
when applied to aggregated numbers that have no natural ceiling or cut-off. In this study, we
demonstrate that digital analysis can be used to test the conformance of nonprofit financial data
with Benford’s Law at different levels: across the whole sample, by selected variables, and by
individual organizations. We recommend that users of Benford analysis include U2 testing in
their toolkit and interpret results with caution if conventional tests differ from U2 test. By the
preferred U2 test, we cannot confidently reject the null hypothesis that the observed first-digit fre-
quencies follow the Benford distribution for the whole sample, suggesting that the reported num-
bers generally follow Benford’s law. We find that deviations from Benford’s Law are larger and
more frequent for organizations that have lower accounting and management sophistication,
questionable functional expense reporting, and weaker funder oversight. This pattern of devia-
tions follows our hypotheses, bolstering the case that violations of Benford’s Law signal the mis-
reporting of data. Our analysis for selected variables suggests that violations appear to be more
prevalent for functional expense reporting where guidelines are more complicated to interpret
and follow, and this finding provide further support for Burger et al (2017) that nonconformance
with Benford’s Law is higher when there is an increased reporting burden.
Similar to Dang and Owens (2016), we find that the majority of organizations in our sam-
ple do not comply with Benford’s Law. The IRS cannot audit the majority of nonprofits, thus
sharper discernment will be required. Additionally, our hypothesis analysis showed that devia-
tions from Benford’s Law are associated with not only intentional manipulations but also ama-
teurism and it would be important to examine ways to better distinguish between the two types of
deviations.
Therefore, we suggest that future research provides appropriate modification to the MAD
threshold for noncompliance. Based on an analysis of 25 data sets, Nigrini (2012) labels organi-
zations as noncompliant whenever organizational MAD exceeds 0.015, but this threshold may
not generalize to nonprofit data. A higher threshold may be appropriate for regulators, attorneys
general, and charitable watchdogs. We also recommend using a broader set of forensic analytic
such as the last two digits test and number duplication test (Nigiri, 2012). The diversification of
tools will also ensure that regulators cannot be easily duped by more sophisticated manipulators
who fabricate data that conforms with the Benford distribution.
Conclusion
There is a longstanding belief that public nonprofit organizations, which invest in com-
munities, care for the fragile, and protect the weak, are clearly doing good and therefore should
be exempt from scrutiny. While there has been increased pressure to monitor and report, non-
profits want to insure that new requirements not burden them to the detriment of their core pur-
poses.
In general, our results support inclusion of Benford analysis in regulatory toolkits. We
find that the patterns of violation are consistent with factors expected to increase reporting prob-
lems. This suggests that this forensic tool is picking up meaningful patterns in nonprofit financial
reporting. However, we also find that Benford analysis of nonprofit financial information flags a
high number of suspicious cases, which suggests that it may include some false positive results.
In order to help the government use its limited resources more effectively, the ideal screen would
flag a small number of cases that are true positives (violations), minimize the number of false
positives (so that few resources are devoted to investigating the excusable), and minimize the
number of false negatives (so that few wrongdoers escape notice). Thus, it requires further re-
finement for Benford’s analysis to function as an effective screening tool for egregious misre-
porting. Benford screening can also be enhanced by combining with other forensic analytical
tools.
Enhanced screening will improve the credibility and reliability of nonprofit financial in-
formation and benefit all users of this information – government contractors, government regula-
tors, and donors. More reliable numbers are expected to enhance the accountability reputation of
the nonprofit sector. Although we focus on nonprofit tax return data, Benford’s Law can also be
applied to many other kinds of government data and is relevant to a broader discussion on the
importance of organizational transparency and reputation in public arena.
Notes
1) The current filing threshold is gross receipts exceeding $50,000, but the threshold was
$25,000 during the years of our data. Most political organizations, as well as churches and cer-
tain related religious institutions are not required to file form 990, and private foundations (ex-
cluded from this study) file annual forms 990 PF.
2) False positives are discussed later in this article. For false negatives, there is an online debate
over whether fraudster Bernard Madoff filed Benford-compatible monthly returns. Kedrosky
(2009) found that data were compliant, but Falkenstein (2008) challenged his methods. It appears
that the original Kedrosky (2009) blog has been removed from his site (hence this is not cited in
the references) although he continues to cite it in Kedrosky (2009). Because of its reliance on
data to detect non-conforming patterns, Benford’s Law will also fail to detect fraud that involves
the omissions of transactions or non-reporting.
3) Specifically, when naturally-created data is combined with other naturally-created data in
many steps involving addition, subtraction, multiplication, and division, the distribution of first
digits approaches the Benford distribution as the number of steps grows, regardless of the distri-
bution of the uncombined data.
4) Further, his analysis shows that deviations were higher for small firms and those reliant on
grants. These findings plausibly relate to his focus on second digits and consequent rounding.
5) We limit the sample size because bootstrap is computationally intensive. Although the panel is
balanced at the organization level, organizations vary in reporting on individual variables each
year, so the number of reported variables used to create organization-specific compliance statis-
tics varies across organizations.
6) By all three statistical tests, 71% of the sample are flagged as suspicious and about 11% are
compliant to the Benford’s Law. Identification of suspicious cases varies across statistical tests
for 18% of the sample. For example, 92 cases are flagged as suspicious by U2 test but not KS
(MAD = 0216). On the other hand, 19 cases are flagged as suspicious by KS but not U2 test
(MAD = .0180).
References
Archambault, Jeffrey J., and Marie E. Archambault. 2011. "Earnings Management among Firms
during the Pre-SEC Era: A Benford's Law Analysis." Accounting Historians Journal 38,
no. 2: 145-170.
Baber, William R., Patricia L. Daniel, and Andrea A. Roberts. 2002. ”Compensation to Manag-
ers of Charitable Organizations: An Empirical Study of the Role of Accounting Measures
of Program Activities." The Accounting Review 77, no. 3: 679-693.
Benford, Frank. 1938. "The Law of Anomalous Numbers." Proceedings of the American philo-
sophical society: 551-572.
Burger, Ronelle, Canh Thien Dang, and Trudy Owens, 2017. “Better Performing NGOs do Re-
port More Accurately: Evidence from Investigating Ugandan NGO Financial Accounts.”
Nottingham: CREDIT, Centre for Research in Economic Development and International
Trade, working paper No. 17/10. https://www.nottingham.ac.uk/credit/documents/pa-
pers/2017/17-10.pdf
Burks, Jeffrey J. 2015. "Accounting Errors in Nonprofit Organizations." Accounting Hori-
zons 29, no. 2: 341-361.
Collins, J. Carlton. 2017. "Using Excel and Benford's Law to Detect Fraud: Learn the Formulas,
Functions, and Techniques That Enable Efficient Benford Analysis of Data Sets." Jour-
nal of Accountancy 223, no. 4: 44.
Conover, William J. 1972. "A Kolmogorov Goodness-of-Fit Test for Discontinuous Distribu-
tions." Journal of the American Statistical Association 67, no. 339: 591-596.
David, Kane. 2011. “Benford’s Law and Charity Data.”
https://blogs.ncvo.org.uk/2011/09/21/benfords-law-and-charity-data.
Dang, Canh Thien and Trudy Owens, 2016. “How Accurate Are Financial Reports Of British
Charities?” Nottingham: CREDIT, Centre for Research in Economic Development and
International Trade, working paper No. 16/05. https://www.nottingham.ac.uk/credit/do-
cuments/papers/2016/16-05.pdf
De Marchi, Scott, and James T. Hamilton. 2006. "Assessing the Accuracy of Self-Reported Data:
An Evaluation of the Toxics Release Inventory." Journal of Risk and Uncertainty 32 (1):
57-76.
Durtschi, Cindy, William Hillison, and Carl Pacini. 2004. "The Effective Use of Benford's Law
to Assist in Detecting Fraud in Accounting Data." Journal of Forensic Accounting 5 (1):
17.
Falkenstein, Eric. 2008. “Benford’s Law Catches Madoff (error!).” http://falkenblog.blog-
spot.com/2008/12/benfords-law-catches-madoff.html.
Finn, Arden and Vimal Ranchhod. 2017. "Genuine Fakes: The Prevalence and Implications of
Data Fabrication in a Large South African Survey." World Bank Economic Review 31
(1): 129-157.
Froelich, Karen A., Terry W. Knoepfle, and Thomas H. Pollak. 2000. "Financial Measures in
Nonprofit Organization Research: Comparing IRS 990 Return and Audited Financial State-
ment Data." Nonprofit and Voluntary Sector Quarterly 29 (2): 232-254.
Galbi, Douglas. 2012. “Non-profits' Distribution of Management Expenses.” https://www.pur-
plemotes.net/2012/03/25/non-profits-distribution-of-management-expenses/.
Garven, Sarah A., Mary Ann Hofmann, and Dwayne N. McSwain. 2016. “Playing the Numbers
Game.” Nonprofit Management and Leadership 26, no. 4: 401-416.
Hansmann, Henry. 1996. "The changing roles of Public, Private, and Nonprofit Enterprise in Ed-
ucation, Health Care, and Other Human Services." In Individual and Social Responsibil-
ity: Child Care, Education, Medical Care, and Long-term Care in America, edited by
Victor R. Fuchs, 245-276. University of Chicago Press.
Hill, Theodore P. 1995. “A Statistical Derivation of the Significant-Digit Law.” Statistical Sci-
ence 10(4): 354-363.
Hill, Theodore P. 1998. “The First Digital Phenomenon.” American Scientist. 86(4):358-363.
IRS. 2017. “Instructions for Form 990 Return of Organization Exempt from Income Tax”. Ac-
cessed July 3, 2017. https://www.irs.gov/pub/irs-pdf/i990.pdf.
Joenssen, Dieter William. 2015. “BenfordTests: Statistical Tests for Evaluating Conformity to
Benford’s Law." https://rdrr.io/cran/BenfordTests/
Jones, Christopher L., and Andrea Alston Roberts. 2006. "Management of Financial Information
in Charitable Organizations: The Case of Joint-Cost Allocations." The Accounting Re-
view 81 (1): 159-178.
Kane, David. 2011. “Benford’s Law and Charity Data.”. NCVO (blog).
https://blogs.ncvo.org.uk/2011/09/21/benfords-law-and-charity-data/
Keating, Elizabeth K., and Peter Frumkin. 2003. "Reengineering Nonprofit Financial Accounta-
bility: Toward a More Reliable Foundation for Regulation." Public Administration Re-
view 63 (1): 3-15.
Keating, Elizabeth K., Linda M. Parsons, and Andrea Alston Roberts. 2008. "Misreporting Fun-
draising: How do Nonprofit Organizations Account for Telemarketing Campaigns?" The
Accounting Review 83 (2): 417-446.
Kedrosky, Paul. 2009. “Madoff’s Results Really were Random” Seeking Alphaα (blog), at
https://seekingalpha.com/article/173294-madoffs-results-really-were-random.
Krishnan, Ranjani, and Michelle H. Yetman. 2011. "Institutional Drivers of Reporting Decisions
in Nonprofit Hospitals." Journal of Accounting Research 49 (4): 1001-1039.
Krishnan, Ranjani, Michelle H. Yetman, and Robert J. Yetman. 2006. "Expense Misreporting in
Nonprofit Organizations." The Accounting Review 81 (2): 399-420.
Lesperance, M., W. J. Reed, M. A. Stephens, C. Tsao, and B. Wilton. 2016. "Assessing Confor-
mance with Benford's Law: Goodness-of-Fit Tests and Simultaneous Confidence Inter-
vals." PloS One 11 (3): e0151235.
Mayer, Lloyd Hitoshi. 2016. "The Rising of the States in Nonprofit Oversight." Nonprofit Quar-
terly. https://nonprofitquarterly.org/2016/08/11/rising-states-nonprofit-oversight/.
Myagkov, Mikhail, Peter C. Ordeshook, and Dimitry Shakin. 2005. "Fraud Or Fairytales: Russia
and Ukraine's Electoral Experience." Post-Soviet Affairs 21 (2): 91-131.
Newcomb, Simon. 1881. "Note on the Frequency of Use of the Different Digits in Natural Num-
bers." American Journal of Mathematics 4 (1): 39-40.
Nigrini, Mark J. 1996. “Taxpayer Compliance Application of Benford’s Law.” Journal of the
American Taxation Association. 18(1):72-92.
Nigrini, Mark J. 2012. Benford’ s Law: Applications for Forensic Accounting, Auditing and
Fraud Detection. Vol. 586. New Jersey: John Wiley & Sons,
Omer, Thomas C. and Robert J. Yetman. 2003. "Near Zero Taxable Income Reporting by Non-
profit Organizations." The Journal of the American Taxation Association 25 (2): 19-34.
Omer, Thomas C. and Robert J. Yetman. 2007. "Tax Misreporting and Avoidance by Nonprofit
Organizations." Journal of the American Taxation Association 29 (1): 61-86.
Rauch, Bernhard, Max Göttsche, Gernot Brähler, and Stefan Engel. 2011. "Fact and Fiction in
EU‐Governmental Economic Data." German Economic Review 12 (3): 243-255.
Salamon, L. M. 1987. "Partners in Public Services: The Scope and Theory of Government.”
In The Nonprofit Sector: A Research Handbook, edited by Walter Powell, 99-117. New
Haven: Yale University Press.
Schräpler, Jörg-Peter. 2011. "Benford's Law as an Instrument for Fraud Detection in Surveys
using the Data of the Socio-Economic Panel (SOEP)." Jahrbücher Für Nationalökonomie
Und Statistik / Journal of Economics and Statistics 231 (5/6): 685-718.
Steinberg, Richard. 2010. “Principal-Agent Theory and Nonprofit Accountability." Comparative
Corporate Governance of Non-Profit Organizations: 73-125.
Tam Cho, Wendy K., and Brian J. Gaines. 2007. "Breaking the (Benford) Law: Statistical Fraud
Detection in Campaign Finance." The American Statistician 61 (3): 218-223.
Tinkelman, Daniel. 1999. “Factors Affecting the Relation between Donations to Not-for- profit
Organizations and an Efficiency Ratio. Research in Government and Nonprofit Account-
ing, 10: 135-161.
Trussel, John. 2003. "Assessing Potential Accounting Manipulation: The Financial Characteris-
tics of Charitable Organizations with Higher than Expected Program-Spending Ra-
tios." Nonprofit and Voluntary Sector Quarterly 32 (4): 616-634.
United Way. (n.d.). “Accountability.” Accessed October 21, 2017. https://www.united-
way.org/about/public-reporting/accountability.
Urban Institute and Center on Philanthropy at Indiana University. 2004. “What We Know about
Overhead Costs in the Nonprofit Sector.” Nonprofit Overhead Cost Study, Brief No. 1.
https://www.urban.org/sites/default/files/publication/57576/310930-What-We-Know-
about-Overhead-Costs-in-the-Nonprofit-Sector.PDF.
Van Caneghem, Tom. 2016. ”NPO Financial Statement Quality: An Empirical Analysis Based
on Benford’s Law." VOLUNTAS: International Journal of Voluntary and Nonprofit Or-
ganizations 27, no. 6: 2685-2708.
Van Slyke, David M. 2007. "Agents or Stewards: Using Theory to Understand the Government-
Nonprofit Social Service Contracting Relationship." Journal of Public Administration
Research and Theory 17, no. 2: 157-187.
Varian, Hal. R., 1972. “Benford’s Law.” The American Statistician. 25, 65–66.
Wing, Kennard, Teresa Gordon, Mark Hager, Thomas Pollak, and Patrick Rooney. 2006. "Func-
tional Expense Reporting for Nonprofits: The Accounting Profession's Next Scandal?" The
CPA Journal 76 (8): 14.
Yetman, Michelle H., and Robert J. Yetman. 2013. "Do Donors Discount Low-Quality Account-
ing Information?" Accounting Review 88 (3): 1041-1067.
Appendix: Statistical Tests
If we treat the observed first digits as a set of unordered categories, the Pearson chi-
squared test is appropriate. However, this test neglects the fact that the categories are ordered.
The Kolmogorov-Smirnov test is well-known and often employed in Benford studies. It accounts
for the ordering of the Benford distribution and tests the equality of an empirical distribution
with a specified continuous distribution. The test is nonparametric when applied to continuous
distributions. However, because the null (Benford) distribution is discrete, Kolmogorov-Smirnov
p-values are conservative and depend on the parameters of the null distribution (Conover, 1972).
We therefore use the modified Kolmogorov-Smirnov test (Joenssen, 2015). To avoid numerical
instability issues, we use empirically simulated standard errors. The modified Kolmogorov-
Smirnov test is powerful when there is a large violation of Benford’s Law over a small portion of
the support (range of possible values) of the statistical distribution and less powerful for small
deviations spread throughout the support. This is because the test statistic is based on whichever
digit has the largest deviation between empirical and null distributions, rather than combining the
deviations of all digits.
Although the modified Kolmogorov-Smirnov test accounts for the ordering of the digits,
it does not account for the circularity of this ordering. If we increase the value of a number with
first digit 9, the result is a number with one more digit and a leading digit of 1. The digit 2 is to
the right of the digit 1, the digit 3 is to the right of 2, …, and the digit 1 is to the right of 9. The
Freedman-Watson U2 test is specifically designed for distributions with a circular support. The
U2 statistic does not depend on labeling the minimum of a support, because there is no minimum
on a circle. This is unlike the Kolmogorov-Smirnov test, which relies on cumulative distributions
that would be different if we started with a 2 or a 3. In addition, the U2 test incorporates all the
deviations in frequencies of digits, not just the largest deviation. The continuous Watson U2 test
is known to be more powerful than the continuous Kolmogorov-Smirnov test when the devia-
tions from Benford’s frequencies are spread throughout the support. Analytic results are not
available for the discrete versions, but Monte Carlo simulations by Lesperance et al. (2016) find
that the Freedman-Watson U2 test is more powerful than Pearson chi-square and Kolmogorov-
Smirnov tests (except when deviations are expected to be concentrated on larger values of the
first significant digit and then Pearson’s chi-square statistic is superior). Because we have no
prior beliefs on the distribution of deviations, we prefer the U2 test whenever the results of the
three tests differ.
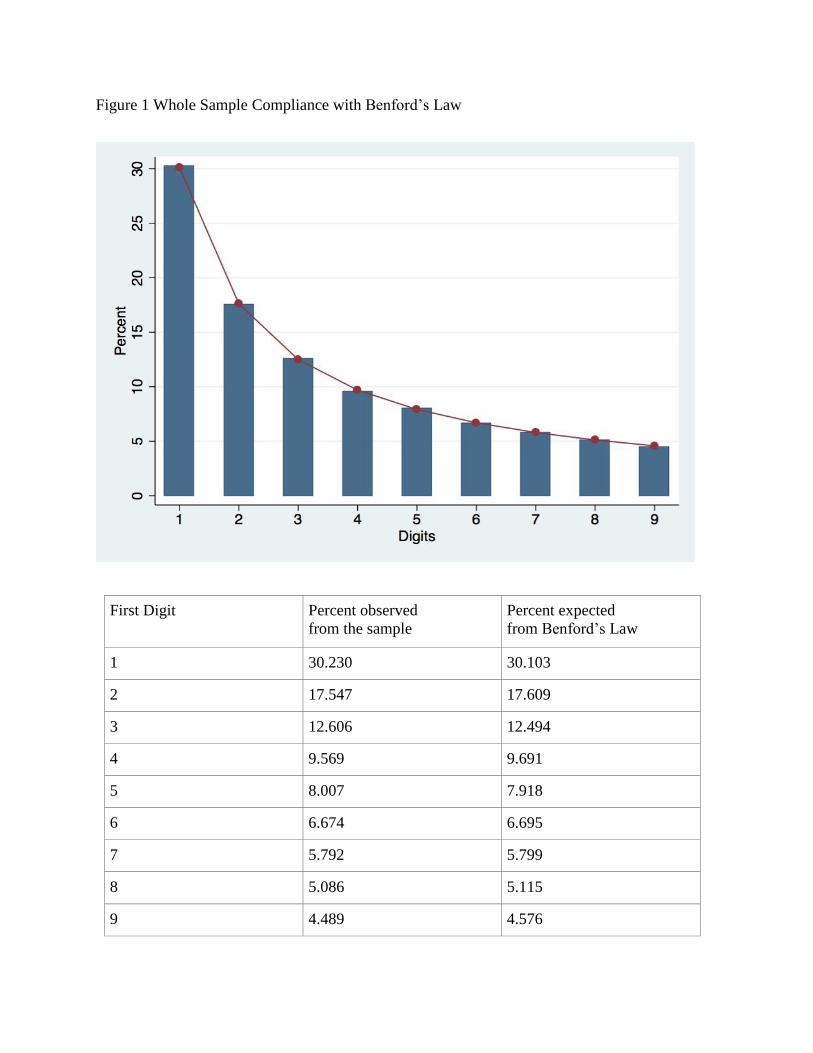
Figure 1 Whole Sample Compliance with Benford’s Law
First Digit Percent observed
from the sample
Percent expected
from Benford’s Law
1 30.230 30.103
2 17.547 17.609
3 12.606 12.494
4 9.569 9.691
5 8.007 7.918
6 6.674 6.695
7 5.792 5.799
8 5.086 5.115
9 4.489 4.576
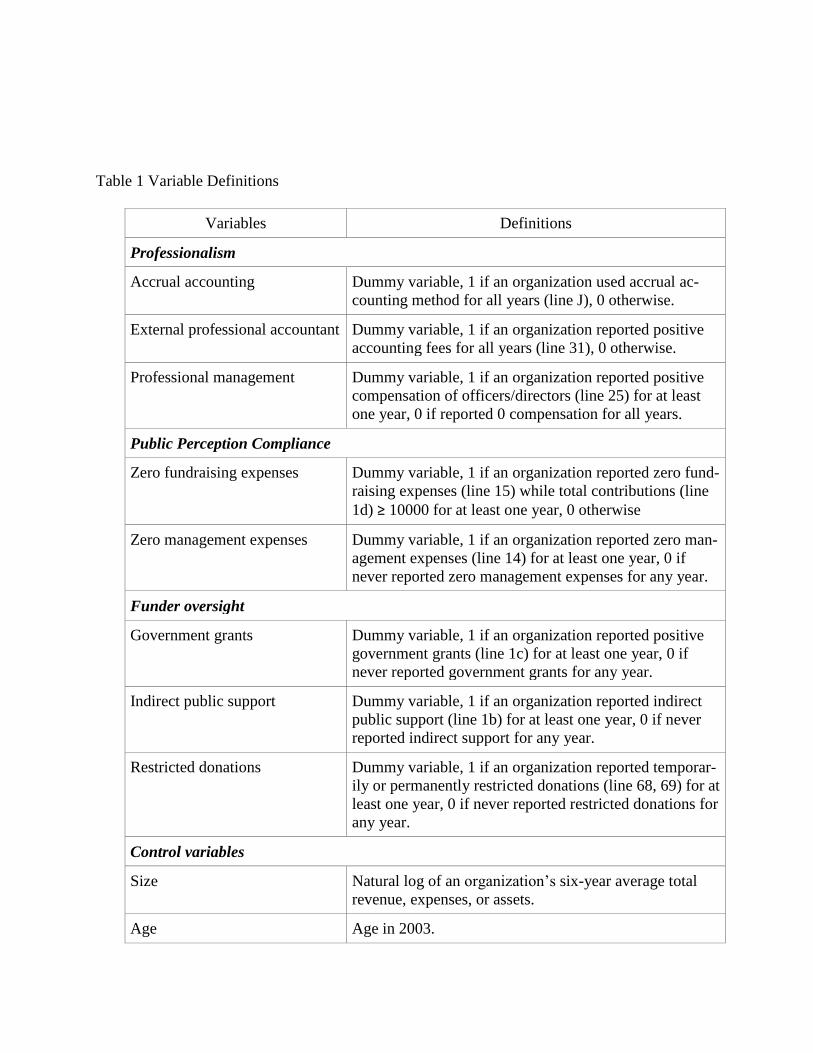
Table 1 Variable Definitions
Variables Definitions
Professionalism
Accrual accounting Dummy variable, 1 if an organization used accrual ac-
counting method for all years (line J), 0 otherwise.
External professional accountant Dummy variable, 1 if an organization reported positive
accounting fees for all years (line 31), 0 otherwise.
Professional management Dummy variable, 1 if an organization reported positive
compensation of officers/directors (line 25) for at least
one year, 0 if reported 0 compensation for all years.
Public Perception Compliance
Zero fundraising expenses Dummy variable, 1 if an organization reported zero fund-
raising expenses (line 15) while total contributions (line
1d) ≥ 10000 for at least one year, 0 otherwise
Zero management expenses Dummy variable, 1 if an organization reported zero man-
agement expenses (line 14) for at least one year, 0 if
never reported zero management expenses for any year.
Funder oversight
Government grants Dummy variable, 1 if an organization reported positive
government grants (line 1c) for at least one year, 0 if
never reported government grants for any year.
Indirect public support Dummy variable, 1 if an organization reported indirect
public support (line 1b) for at least one year, 0 if never
reported indirect support for any year.
Restricted donations Dummy variable, 1 if an organization reported temporar-
ily or permanently restricted donations (line 68, 69) for at
least one year, 0 if never reported restricted donations for
any year.
Control variables
Size Natural log of an organization’s six-year average total
revenue, expenses, or assets.
Age Age in 2003.

Subsector NTEE Major Subsector: 4 dummy variables for Arts,
Culture, and Humanities; Education; Health; Human Ser-
vices; and Other (excluded category).
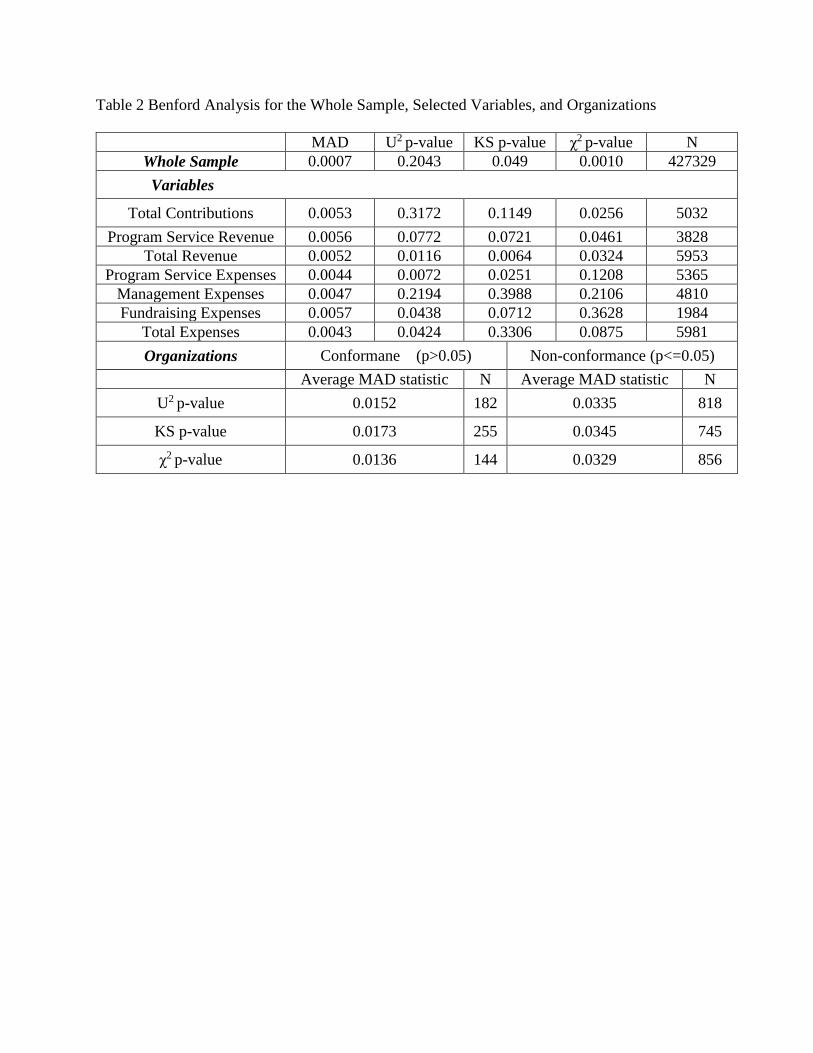
Table 2 Benford Analysis for the Whole Sample, Selected Variables, and Organizations
MAD U2 p-value KS p-value χ2 p-value N
Whole Sample 0.0007 0.2043 0.049 0.0010 427329
Variables
Total Contributions 0.0053 0.3172 0.1149 0.0256 5032
Program Service Revenue 0.0056 0.0772 0.0721 0.0461 3828
Total Revenue 0.0052 0.0116 0.0064 0.0324 5953
Program Service Expenses 0.0044 0.0072 0.0251 0.1208 5365
Management Expenses 0.0047 0.2194 0.3988 0.2106 4810
Fundraising Expenses 0.0057 0.0438 0.0712 0.3628 1984
Total Expenses 0.0043 0.0424 0.3306 0.0875 5981
Organizations Conformane (p>0.05) Non-conformance (p<=0.05)
Average MAD statistic N Average MAD statistic N
U2 p-value 0.0152 182 0.0335 818
KS p-value 0.0173 255 0.0345 745
χ2 p-value 0.0136 144 0.0329 856
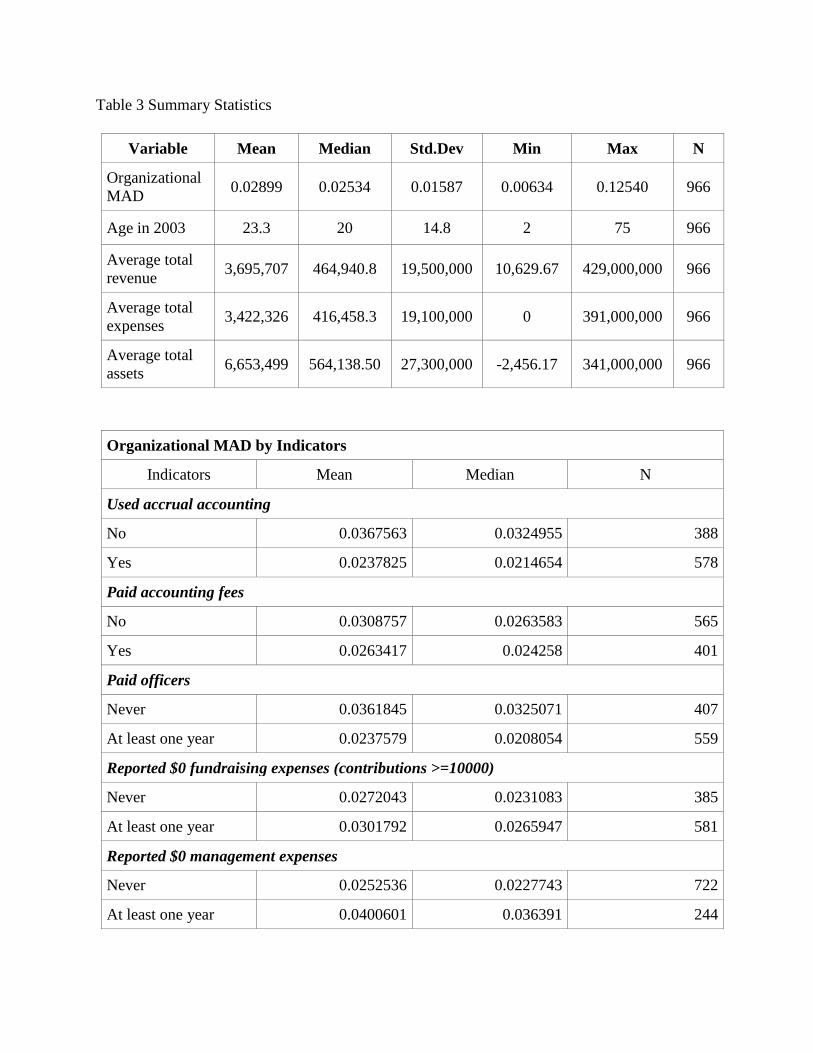
Table 3 Summary Statistics
Variable Mean Median Std.Dev Min Max N
Organizational
MAD 0.02899 0.02534 0.01587 0.00634 0.12540 966
Age in 2003 23.3 20 14.8 2 75 966
Average total
revenue 3,695,707 464,940.8 19,500,000 10,629.67 429,000,000 966
Average total
expenses 3,422,326 416,458.3 19,100,000 0 391,000,000 966
Average total
assets 6,653,499 564,138.50 27,300,000 -2,456.17 341,000,000 966
Organizational MAD by Indicators
Indicators Mean Median N
Used accrual accounting
No 0.0367563 0.0324955 388
Yes 0.0237825 0.0214654 578
Paid accounting fees
No 0.0308757 0.0263583 565
Yes 0.0263417 0.024258 401
Paid officers
Never 0.0361845 0.0325071 407
At least one year 0.0237579 0.0208054 559
Reported $0 fundraising expenses (contributions >=10000)
Never 0.0272043 0.0231083 385
At least one year 0.0301792 0.0265947 581
Reported $0 management expenses
Never 0.0252536 0.0227743 722
At least one year 0.0400601 0.036391 244
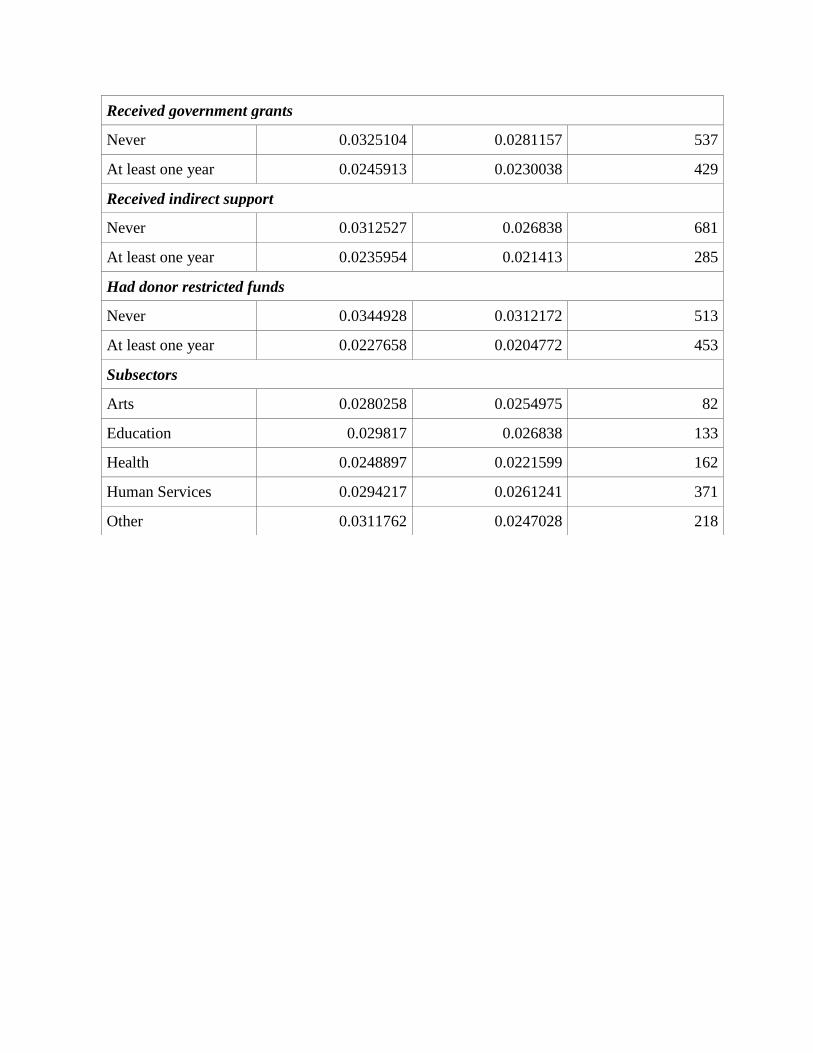
Received government grants
Never 0.0325104 0.0281157 537
At least one year 0.0245913 0.0230038 429
Received indirect support
Never 0.0312527 0.026838 681
At least one year 0.0235954 0.021413 285
Had donor restricted funds
Never 0.0344928 0.0312172 513
At least one year 0.0227658 0.0204772 453
Subsectors
Arts 0.0280258 0.0254975 82
Education 0.029817 0.026838 133
Health 0.0248897 0.0221599 162
Human Services 0.0294217 0.0261241 371
Other 0.0311762 0.0247028 218
Table 4 OLS Regressions on Organizational MAD
(1) (2) (3)
Received government
grants (≥ 1 year)
-0.00234*** -0.00231***
-0.00272****
(-2.89) (-2.90) (-3.32)
Received indirect sup-
port (≥ 1 year)
-0.00220*** -0.00210**
-0.00241***
(-2.66) (-2.54) (-2.85)
Donor restricted funds
(≥ 1 year)
-0.00398**** -0.00421****
-0.00447****
(-4.08) (-4.40) (-4.33)
Accrual accounting -0.00441**** -0.00412****
-0.00599****
(-4.60) (-4.33) (-6.16)
Accounting fees -0.000767 -0.000802 -0.000753
(-1.02) (-1.07) (-0.96)
Paid officers
(≥ 1 year)
-0.00612**** -0.00590****
-0.00701****
(-6.94) (-6.65) (-7.80)
Reported $0 fundrais-
ing (≥ 1 year)
0.00105 0.000996 0.000955
(1.23) (1.17) (1.10)
Reported $0 manage-
ment (≥ 1 year)
0.00564**** 0.00554****
0.00683****
(4.72) (4.60) (5.56)
Education subsector 0.00332** 0.00344**
0.00207
(2.28) (2.38) (1.41)
Health subsector 0.00185 0.00207 0.000147
(1.30) (1.46) (0.10)
Human Services sub-
sector
0.00461**** 0.00474****
0.00387***
(3.78) (3.90) (3.14)
Other subsectors 0.00529**** 0.00527****
0.00484****
(3.73) (3.72) (3.38)
Age in 2003 0.0000743*** 0.0000768***
0.0000538*
(2.66) (2.77) (1.82)
Average total revenue
(natural logs)
-0.00185****
(-6.54)
Average total expenses
(natural logs)
-0.00194****
(-7.27)
Average total assets
(natural logs)
-0.000289
(-1.25)
Constant 0.0559**** 0.0566****
0.0384****
(16.45) (17.31) (13.74)
N 966 967 966
R2 0.370 0.376 0.346
* p < 0.10, ** p < 0.05, *** p < 0.01, **** p < 0.001. t statistics in parentheses