Embed Size (px)
Citation preview

January 2009ABHI SegmentationGfK bluemoon
ABHI Segmentation• Report

January 2009ABHI SegmentationGfK bluemoon
Table of contents
1 Background
2 Detailed Findings
3 Appendices• Using this research• Terms of business

January 2009ABHI SegmentationGfK bluemoon
1 Background

4
January 2009ABHI SegmentationGfK bluemoon
Background
• The Coalition of Australian Governments (COAG) has set aside $500 million over four years for the Australian Better Health Initiative (ABHI). This initiative aims to reduce morbidity and mortality in the population caused by lifestyle related chronic diseases. A range of interventions is planned including a rolling program of social marketing campaigns. The long term objectives of the campaign are to encourage Australians to make and sustain healthy lifestyle choices and stimulate behaviour change and therebycontribute to reducing morbidity and mortality due to lifestyle related chronic diseases.
• Phase one of the campaign involves a large scale, national communications strategy. The campaign was developed following the developmental qualitative research conducted by GfK Blue Moon which supported the conclusion from the SNAP-O research1 that modifying lifestyle behaviour requires an appreciation of ‘what’ change is needed, ‘why’ it is necessary and ‘how’ it can be achieved.
1 SNAP-O Concept Testing Research for the Department of Health and Ageing (June 2006)

5
January 2009ABHI SegmentationGfK bluemoon
Background
• This quantitative evaluation research was required to benchmark current beliefs, attitudes and behaviour in relation to the lifestyle risk factors prior to the ABHI campaign and subsequently track any changes in these measures following the campaign.
• This quantitative research comprises three stages:
1. a benchmark survey consisting of telephone interviews among the Australian public;
2. a short advertising diagnostic telephone survey using a national omnibus; and
3. a post-communications evaluation telephone survey of the Australian public.
• The benchmark survey is also being used to confirm and market size the attitudinalsegmentation explored in the developmental qualitative research conducted by GfK Blue Moon.
• If required, the segmentation can be duplicated in the tracking survey so that any changes in the segment sizes can be measured following the campaign.
• This report summarises the quantitative benchmark segmentation findings.

January 2009ABHI SegmentationGfK bluemoon
2 Summary of qualitative segmentation research

7
January 2009ABHI SegmentationGfK bluemoon
Exploratory qualitative research
• The quantitative segments described in this report are based, in part, on exploratory qualitative research GfK Blue Moon conducted in early 2007.
• The original qualitative research and design was based on well established health behaviour theories, in particular:
- Transtheoretical ‘Stages of Change’ model:
• behaviour and attitudes to change pass through five stages:
- pre-contemplation, contemplation, preparation, action, maintenance
• Focus groups were conducted with people at each stage.
• The research found that individuals could be at a different stage of change for each risk behaviour (nutrition, physical activity, smoking, drinking, overweight and obesity) but appeared to have a single dominant attitude to lifestyle change as a whole.
• The qualitative research found that there was a low appreciation of ‘why’ change is needed in relation to nutrition and activity and that a healthy lifestyle is often not considered to be a high priority. There was also low appreciation of ‘how’ lifestylechange can be achieved.

8
January 2009ABHI SegmentationGfK bluemoon
Six key attitudinal segments were identified in the qualitative research
DEFIANTRESISTERS
QUIETFATALISTS
HELPSEEKERS
AT RISK LOW(ER) RISK
APATHETICPOSTPONERS ENDEAVOURERS BALANCE
ATTAINERS
DESIRABLE PROGRESSION OF ATTITUDES

9
January 2009ABHI SegmentationGfK bluemoon
These correlate to some extent with the ‘Stages of Change’
DEFIANTRESISTERS
QUIETFATALISTS
HELPSEEKERS
AT RISK LOW(ER) RISK
APATHETICPOSTPONERS ENDEAVOURERS BALANCE
ATTAINERS
DESIRABLE PROGRESSION OF ATTITUDES
CORRELATION WITH ‘STAGES OF CHANGE’*
PRE-CONTEMPLATION
CONTEMPLATION & PREPARATION
ACTION & MAINTENANCE

10
January 2009ABHI SegmentationGfK bluemoon
Campaign targets
• Each of the segments related to a different perspective on the possibility and desirability of lifestyle change overall. ‘Defiant Resisters’, ‘Quiet Fatalists’, ‘Apathetic Postponers’and ‘Help Seekers’ all had a limited appreciation of ‘why’ lifestyle behaviour change is important and ‘how’ it can be achieved.
• It was suggested, therefore, that the aim of the social marketing campaign could be to shift those people’s attitudes so that they become ‘Endeavourers’ or ‘Balance Attainers’.
• These latter groups have a better appreciation of ‘what’ change is needed, ‘why’ it is important and ‘how’ it can be achieved. They are therefore likely to be ‘at lower risk’ ofdeveloping lifestyle related chronic diseases.
11
January 2009ABHI SegmentationGfK bluemoon
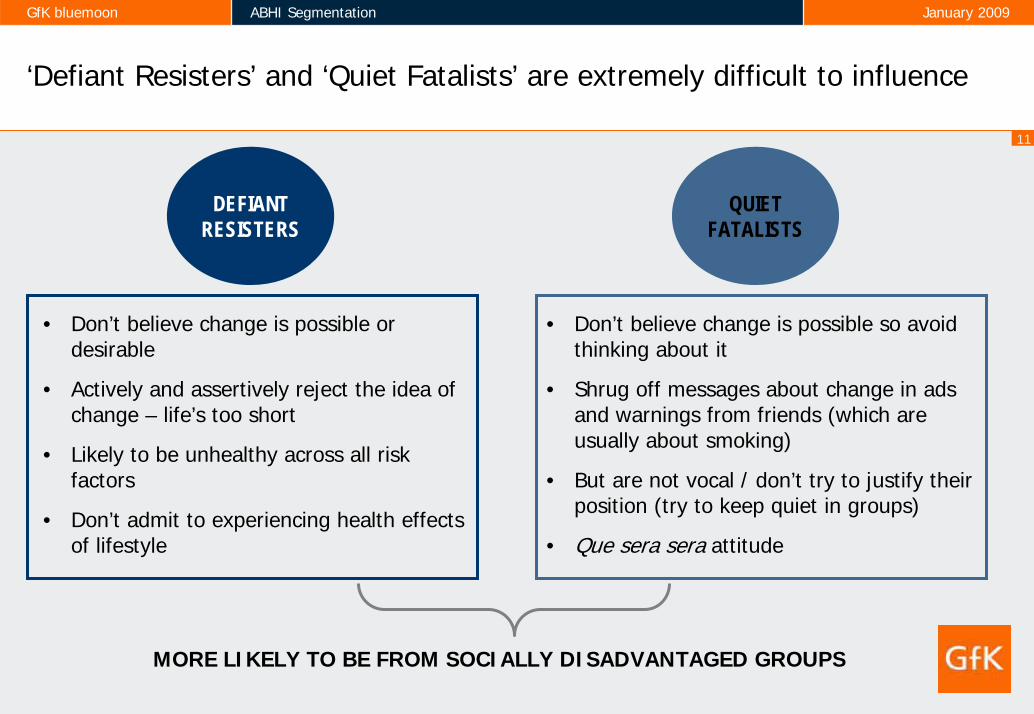
‘Defiant Resisters’ and ‘Quiet Fatalists’ are extremely difficult to influence
DEFIANTRESISTERS
QUIETFATALISTS
• Don’t believe change is possible or desirable
• Actively and assertively reject the idea of change – life’s too short
• Likely to be unhealthy across all risk factors
• Don’t admit to experiencing health effectsof lifestyle
• Don’t believe change is possible so avoid thinking about it
• Shrug off messages about change in ads and warnings from friends (which are usually about smoking)
• But are not vocal / don’t try to justify their position (try to keep quiet in groups)
• Que sera sera attitude
MORE LIKELY TO BE FROM SOCIALLY DISADVANTAGED GROUPS

12
January 2009ABHI SegmentationGfK bluemoon
‘Apathetic Postponers’ and ‘Help Seekers’ are open to ‘Why’ and ‘How’messages about change
HELPSEEKERS
APATHETICPOSTPONERS
Either latent or manifest appreciation of the need to change
Usually because they’re starting to see the effects of their lifestyle (weight gain, early stages of a chronic condition)
Scared because they don’t know how to change – may have tried and failed
More likely to be from socially disadvantaged groups – social / cultural norms prevent appreciation of ‘How’
• Believe they probably should (and could) change one day but it’s not a high enoughpriority to think about today
• Under 25s put off thinking about change until they’re older
• 25+ put it off until next month / year
• More likely to be blue collar but represented in all social groups

13
January 2009ABHI SegmentationGfK bluemoon
‘Endeavourers’ and ‘Balance Attainers’ are open to messages that reinforce their positive attitudes
ENDEAVOURERS BALANCEATTAINERS
• Good appreciation of ‘What’ and ‘Why’and some appreciation of ‘How’
• but have strong urges to relapse in two or three areas
• May cope by trading off vices and virtues (e.g. go to the gym to justify ice cream)
• But basically on track: ‘try again, fail againbetter’ / ‘I’ll start again on Monday’mentality
• Have incorporated healthy behaviour into their lifestyle so it’s no longer a struggle
• May have the odd minor vice but consistently follow recommendations across all five lifestyle areas – so no change is required
• Advocates for the healthy lifestyle and may draw others’ attention to advertising – though this can be counter-productive if rejected as smug
MORE LIKELY TO BE FROM SOCIALLY ADVANTAGED GROUPS

January 2009ABHI SegmentationGfK bluemoon
3 Quantitative segmentation process
15
January 2009ABHI SegmentationGfK bluemoon
Quantitative research methodology
• In the quantitative benchmark survey 2,800 telephone interviews were conducted amongst Australian adults aged 18-65 years.
• Quotas were set representative of the Australian population for age, location and gender. The data was post-weighted to the population using ABS Census figures.
• Fieldwork was conducted from 2-18 October 2008.
• Statistically significant differences have been noted in this report where a segment is significantly different, with 95% confidence, to the rest of the sample. These differences were measured using a z-test of difference between proportions or a t-test of difference between means.

16
January 2009ABHI SegmentationGfK bluemoon
The quantitative segmentation
• The qualitative research results were used to create the attitudinal statements used in the quantitative questionnaire. First of all, a number of key “factors” differentiating the segments were identified. These were:
1 Intention / desire to change lifestyle
2 Ability to change
3 Perceived healthiness
4 Appreciation of unhealthy effects of lifestyle
5 Actively / vocally reject idea of change
6 Fatalists – whatever will be, will be
7 Perceived need to change
8 Postponement of changes
9 Knowledge of how to make changes
10 Keep trying to change but failing

17
January 2009ABHI SegmentationGfK bluemoon
Attitudinal statements
• These factors were used to create a list of attitudinal statements. These statements were asked as a series of questions with answers on a five point scale (strongly agree to strongly disagree).
- I really want to change to be healthier (1)- I am going to change my lifestyle to become healthier (1)- I am confident I could increase my physical activity to improve my health (2)- I am confident I could increase the amount of fruit and vegetables I eat to improve my health (2)- Others would say that I have very healthy lifestyle (3)- My lifestyle is increasing my risk of getting a chronic disease (4)- I know that I should change my lifestyle so it is healthier (4)- I tell others that life’s too short to worry about having a healthy lifestyle (5)- I avoid thinking about or discussing how healthy my lifestyle is (6)- I don’t need to make any changes to my lifestyle (7)- I keep putting off healthy changes - Ill do it later (8)- I know exactly how to change my lifestyle to be healthier (9)- I am always trying to make changes to my lifestyle but I find they don’t last (10)

18
January 2009ABHI SegmentationGfK bluemoon
Identifying the health segments
• Cluster analysis (K-means) was conducted to cluster respondents according to these factor scores. Clusters were formed from people who were similar to each other and different to those outside the cluster.
• A number of solutions were examined, ranging from a five cluster to a seven cluster solution using a number of techniques. One of the five cluster solutions appeared both statistically efficient and practical.
• The preferred solution was also very close to the qualitative segmentation. Although there were two key differences:
1. The qualitative segments of Defiant Resisters and Quiet Fatalists were combined into a singlesegment, Avoiders:
• in the qualitative research, the key differences between these two segments were that the Defiant Resisters were vocal about not changing their lifestyle and Quiet Fatalistswere silent. The quantitative research found very little discrimination between segments on the statement “I tell others that life’s too short to worry about having a healthy lifestyle” and so these two groups formed a single segment.
2. Apathetic Postponers were renamed Postponers. The quantitative research found that this group did have a desire to change their lifestyle but later. They weren’tquite as apathetic as indicated in the qualitative research.

19
January 2009ABHI SegmentationGfK bluemoon
The five key lifestyle change segments identified in the quantitative research
AVOIDERS HELPSEEKERS
POSTPONERS ENDEAVOURERS BALANCEATTAINERS
A combined segmentof Defiant Resistersand Quiet Fatalists AT RISK LOW(ER) RISK
DESIRABLE PROGRESSION OF ATTITUDES

20
January 2009ABHI SegmentationGfK bluemoon
Two of the key factors are desire to change and perceived health
High
LowLow High
Desire tochangelifestyle
HelpSeekers
25%
Avoiders20%
Postponers12%
Endeavourers26%
BalanceAttainers
17%
Perceived health

21
January 2009ABHI SegmentationGfK bluemoon
Health and lifestyle attitudes (1)
TotalSample Avoiders Postponers
HelpSeekers Endeavourers
BalanceAttainers
n= 2806 555 346 698 735 472
% % % % % %
I know exactly how to change my lifestyle to be healthier (9) 86 76 82 93 95 78
I am confident I could increase my physicalactivity to improve my health (6) 81 71 87 94 95 46
I really want to change to be healthier (1) 76 68 87 98 94 19
I am confident I could increase the amount of fruit and vegetables I eat to improve my health (6)
76 62 86 92 88 45
I know that I should change my lifestyle so it is healthier (4) 73 70 92 99 82 10
I am going to change my lifestyle to becomehealthier (1) 71 50 86 95 92 14
Others would say that I have very healthy lifestyle (3) 64 48 53 43 85 89
Red indicates that segment has scored significantly lower than the rest of the sample.Green indicates that segment has scored significantly higher than the rest of the sample.

22
January 2009ABHI SegmentationGfK bluemoon
Health and lifestyle attitudes (2)
TotalSample Avoiders Postponers
HelpSeekers Endeavourers
BalanceAttainers
n= 2806 555 346 698 735 472
% % % % % %
I am always trying to make changes to my lifestyle but I find they don't last (10) 43 25 76 80 30 6
I keep putting off healthy changes - I'll do it later (8) 41 38 84 73 15 5
My lifestyle is increasing my risk of getting achronic disease (4) 35 29 56 79 8 5
I avoid thinking about or discussing how healthy my lifestyle is (6) 30 34 68 39 7 17
I don't need to make any changes to my lifestyle (7) 24 18 38 3 16 64
I tell others that life’s too short to worry about having a healthy lifestyle (5) 12 9 62 3 3 7
Red indicates that segment has scored significantly lower than the rest of the sample.Green indicates that segment has scored significantly higher than the rest of the sample.

23
January 2009ABHI SegmentationGfK bluemoon
Sizing the segments
• The key targets of the campaign are Postponers, comprising 12 % of the population and Help Seekers, comprising 25% of the population.
Avoiders20%
Postponers12%
Help Seekers25%
Endeavourers26%
Balance Attainers17%

24
January 2009ABHI SegmentationGfK bluemoon
Snapshot of the 5 segments
Avoiders (20%)• Disinterested in healthy lifestyles
• No intention to change
• Of low to medium health, nutrition and exercise levels
Postponers (12%)• Want to change lifestyle but MUCH later
• Poor health, poor nutrition, low physical activity
Help Seekers (25%)• Health deteriorating
• Poor health, poor nutrition, overweight
• Know they need to change lifestyle and have the desire to do so
Endeavourers (26%)• Desire to increase healthy lifestyle
• Of medium health, relatively good nutrition and activity levels
Balance Attainers (17%)• Very healthy and stable lifestyle
• No changes desired or perceived to be required

January 2009ABHI SegmentationGfK bluemoon
4 Key measures by segment

26
January 2009ABHI SegmentationGfK bluemoon
Nutrition behaviour – Daily vegetable intake
2.52.3 2.3 2.2
2.73
0
1
2
3
Total
Avoiders
Postponers
Help Seekers
Endeavourers
Balance Attainers
Serves of vegetables eaten a day
MEA
N
indicates that segment has scored significantly higher than the rest of the sampleindicates that segment has scored significantly lower than the rest of the sampleBase: Total Sample (2806)

27
January 2009ABHI SegmentationGfK bluemoon
Nutrition behaviour – Daily fruit intake
2.1 21.8 1.9
2.3 2.4
0
1
2
3
Total
Avoiders
Postponers
Help Seekers
Endeavourers
Balance Attainers
Serves of fruit eaten per dayM
EAN
indicates that segment has scored significantly higher than the rest of the sampleindicates that segment has scored significantly lower than the rest of the sampleBase: Total Sample (2806)

28
January 2009ABHI SegmentationGfK bluemoon
Nutrition behaviour – Daily fast food intake
1.2 1.31.5 1.4
1.1
0.8
0
1
2
3
Total
Avoiders
Postponers
Help Seekers
Endeavourers
Balance Attainers
How often eaten Fast Food each day
MEA
N
indicates that segment has scored significantly higher than the rest of the sampleindicates that segment has scored significantly lower than the rest of the sampleBase: Total Sample (2806)

29
January 2009ABHI SegmentationGfK bluemoon
Change behaviour in last 6 months – Daily vegetable intake
34
2431
46 43
14
0
20
40
60
80
100
TotalAvoiders
PostponersHelp Seekers
Endeavourers
Balance Attainers
Yes, tried to increase amount vegetables
%
indicates that segment has scored significantly higher than the rest of the sampleindicates that segment has scored significantly lower than the rest of the sampleBase: Total Sample (2806)

30
January 2009ABHI SegmentationGfK bluemoon
Change behaviour in last 6 months – Daily fruit intake
2820
30
3933
15
0
20
40
60
80
100
TotalAvoiders
PostponersHelp Seekers
Endeavourers
Balance Attainers
Yes, tried to increase amount of fruit
%
indicates that segment has scored significantly higher than the rest of the sampleindicates that segment has scored significantly lower than the rest of the sampleBase: Total Sample (2806)

31
January 2009ABHI SegmentationGfK bluemoon
Change behaviour in last 6 months – Physical activity
48
39 41
60 63
22
0
20
40
60
80
100
TotalAvoiders
PostponersHelp Seekers
Endeavourers
Balance Attainers
Yes, tried to increase amount of physical activity
%
indicates that segment has scored significantly higher than the rest of the sampleindicates that segment has scored significantly lower than the rest of the sampleBase: Total Sample (2806)

32
January 2009ABHI SegmentationGfK bluemoon
Health indicators – Satisfaction with waist measurement
5551
55
32
60
86
0
20
40
60
80
100
TotalAvoiders
PostponersHelp Seekers
Endeavourers
Balance Attainers
Very / somewhat satisfied with waist measurement
%
indicates that segment has scored significantly higher than the rest of the sampleindicates that segment has scored significantly lower than the rest of the sampleBase: Total Sample (2806)

33
January 2009ABHI SegmentationGfK bluemoon
Intentions to change behaviour
Eat more vegetables Eat more fruit
25 14 2145
286
1513
21
18
15
7
40
27
42
63
43
13
0
20
40
60
80
100
TotalAvoiders
PostponersHelp Seekers
Endeavourers
Balance Attainers
Yes, in the next month Yes, probably in the next 6 months
%
Decrease fast food consumption
22 14 2035 26
8
2016
22
2820
8
42
30
42
63
46
16
0
20
40
60
80
100
TotalAvoiders
PostponersHelp Seekers
Endeavourers
Balance Attainers
Yes, in the next month Yes, probably in the next 6 months
%
23 13 21 32 2913
1715
2424
16
8
40
28
4556
45
21
0
20
40
60
80
100
TotalAvoiders
PostponersHelp Seekers
Endeavourers
Balance Attainers
Yes, in the next month Yes, probably in the next 6 months
%
39 29 3254 50
19
2424
30
3025
11
6353
62
8475
30
0
20
40
60
80
100
TotalAvoiders
PostponersHelp Seekers
Endeavourers
Balance Attainers
Yes, in the next month Yes, probably in the next 6 months
%
Increase physical activity
3021
3039 36
18
0
20
40
60
80
100
TotalAvoiders
PostponersHelp Seekers
Endeavourers
Balance Attainers
Intend to measure waist in next month
%
indicates that segment has scored significantly higher than the rest of the sampleindicates that segment has scored significantly lower than the rest of the sample

34
January 2009ABHI SegmentationGfK bluemoon
Health indicators
55 51 55
32
60
86
0
20
40
60
80
100
TotalAvoiders
PostponersHelp Seekers
Endeavourers
Balance Attainers
Very / somewhat satisfied with waist measurement
%41 3625 22
5168
0
20
40
60
80
100
TotalAvoiders
PostponersHelp Seekers
Endeavourers
Balance Attainers
Excellent / Very Good health
%
35 33 37
57
32
9
0
20
40
60
80
100
TotalAvoiders
PostponersHelp Seekers
Endeavourers
Balance Attainers
Overweight
%
19 1927 29
11 9
0
20
40
60
80
100
TotalAvoiders
PostponersHelp Seekers
Endeavourers
Balance Attainers
Yes Smoke cigarettes
%35 32
40 45
2820
0
20
40
60
80
100
TotalAvoiders
PostponersHelp Seekers
Endeavourers
Balance Attainers
Have a chronic health condition
%
50 53 5061
4735
0
20
40
60
80
100
TotalAvoiders
PostponersHelp Seekers
Endeavourers
Balance Attainers
BMI of 25+ (overweight/obese)
%

35
January 2009ABHI SegmentationGfK bluemoon
Seek information about healthier lifestyles
4537 37
53 57
31
0
20
40
60
80
100
TotalAvoiders
PostponersHelp Seekers
Endeavourers
Balance Attainers
Looked for Information on healthy lifestyles
% 4537 37
53 57
31
0
20
40
60
80
100
TotalAvoiders
PostponersHelp Seekers
Endeavourers
Balance Attainers
Looked for Information on healthy lifestyles
% 49
33
52
6356
30
0
20
40
60
80
100
TotalAvoiders
PostponersHelp Seekers
Endeavourers
Balance Attainers
Seek information on healthy lifestyles
%
indicates that segment has scored significantly higher than the rest of the sampleindicates that segment has scored significantly lower than the rest of the sampleBase: Total Sample (2806)

January 2009ABHI SegmentationGfK bluemoon
Detailed Description of Quantitative Segments

37
January 2009ABHI SegmentationGfK bluemoon
Avoiders (Defiant Resisters and Quiet Fatalists in the qual research)
Disinterested in healthy lifestyles, not a prioritySkew to pre-contemplation status 20%
WHO ARE THEY?• Male (60%)• Less likely to be the household food decision maker• Less likely to have children in household
HEALTH/WEIGHT• Overall health self-rated as low to medium• Perceived to be of average weight (but BMI more likely to
be “overweight”)
BEHAVIOUR• Low-medium consumption of vegetables • Average consumption of fruit• Average physical activity• Low knowledge of recommended serves of vegetables or
fruit
INTENTIONS• No intention to change consumption of fruit, vegetables,
fast food, exercise or weight or measure waist
ATTITUDES• Have no desire to change lifestyle• Don’t think they need to change lifestyle• Low ability to change• Low level of knowledge about how to change• Perceive themselves to have a low to medium
healthy lifestyle• The least likely to consider that a range of healthy
behaviours are important
38
January 2009ABHI SegmentationGfK bluemoon
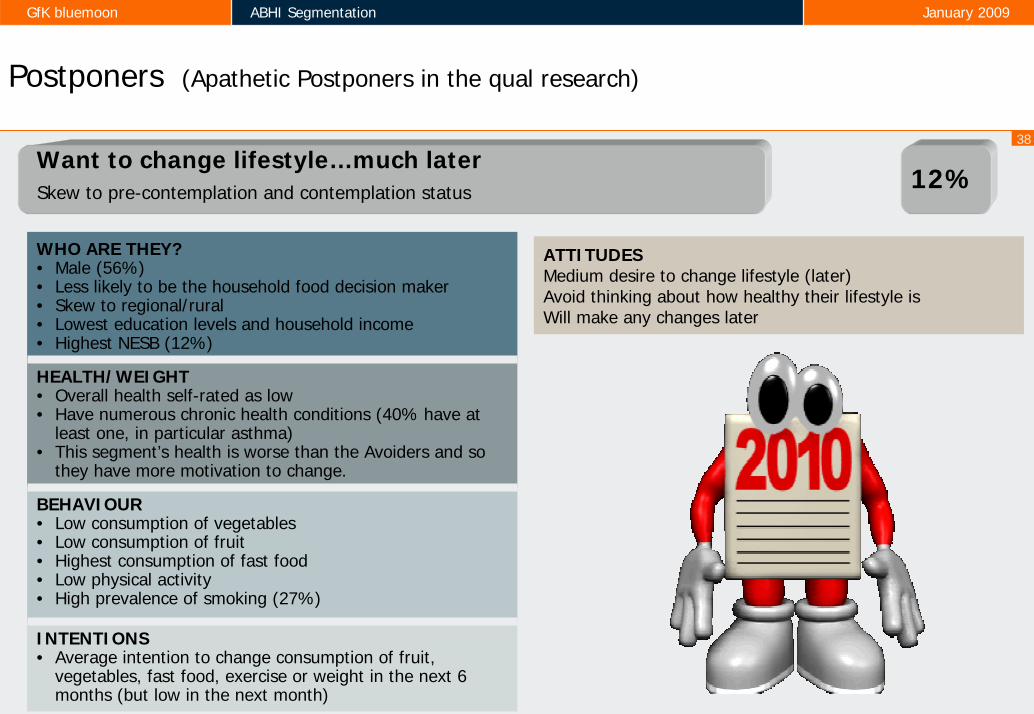
Postponers (Apathetic Postponers in the qual research)
Want to change lifestyle…much laterSkew to pre-contemplation and contemplation status 12%
WHO ARE THEY?• Male (56%)• Less likely to be the household food decision maker• Skew to regional/rural• Lowest education levels and household income• Highest NESB (12%)
HEALTH/WEIGHT• Overall health self-rated as low• Have numerous chronic health conditions (40% have at
least one, in particular asthma)• This segment’s health is worse than the Avoiders and so
they have more motivation to change.
BEHAVIOUR• Low consumption of vegetables• Low consumption of fruit• Highest consumption of fast food• Low physical activity• High prevalence of smoking (27%)
INTENTIONS• Average intention to change consumption of fruit,
vegetables, fast food, exercise or weight in the next 6months (but low in the next month)
ATTITUDESMedium desire to change lifestyle (later)Avoid thinking about how healthy their lifestyle isWill make any changes later

39
January 2009ABHI SegmentationGfK bluemoon
Help Seekers
Health deteriorating, know they need to change lifestyleSkew to contemplation and preparation status
25%
WHO ARE THEY?• Female (55%)• Skew to 35-44 year olds• More likely to be the household food decision maker• Skew to urban• Low household income
HEALTH/WEIGHT• Overall self-rating of health is the lowest• Have numerous chronic health conditions (45% have at least one, in
particular asthma and depression)• Least satisfied with waist measurement• Strong awareness of waist measurement as an indicator of good health
(possibly due to increased Dr’s visits?)• Most likely to perceive they are overweight (57%) and have tried to lose
weight in last 6 months (64%)• Most likely to have a BMI of 30+ (obese)
BEHAVIOUR• Low consumption of vegetables and fruit• 2nd highest consumption of fast food• Likely to have sought information on healthy lifestyles• High prevalence of smoking (29%)
INTENTIONS• Strong intention to improve consumption of fruit, vegetables, fast food,
exercise or weight in the next 6 months• Most likely to intend to reduce waist measurement (62%)
ATTITUDES• Medium to high desire to change lifestyle• Know that they need to change lifestyle• Perceive themselves to be unhealthy• Acknowledge the unhealthy effects of their
lifestyle and that they have a high chance of developing a chronic disease
• Keep trying and failing to change lifestyle

40
January 2009ABHI SegmentationGfK bluemoon
Endeavourers
Want to increase level of healthy lifestyleSkew to preparation and maintenance status
26%
WHO ARE THEY?• Female (58%)• Most likely to have children• Skew to 25-49 year olds with children• More likely to be the household food decision maker• High education and highest household income
HEALTH/WEIGHT• Overall health self-rated as 2nd highest• Have few chronic health conditions (28% have at least one)• 2nd most likely to have a normal BMI• 2nd most satisfied with waist measurement, likely to have tried to
lose weight and reduce waist measurement in last 6 months• Most likely to have measured waist in last 6 months• Strong awareness of waist measurement as an indicator of good
health
BEHAVIOUR• 2nd highest consumption of vegetables and fruit• 2nd lowest consumption of fast good• 2nd highest level of physical activity• Low prevalence of smoking (11%)
INTENTIONS• Strong intention to improve consumption of fruit, vegetables, fast
food, exercise of weight in the next 6 months
ATTITUDES• Medium to high desire to change lifestyle• Know that they need to change lifestyle• Perceive themselves to be of medium healthiness• Acknowledge the unhealthy effects of their lifestyle
and that they have a high chance of developing a chronic disease
• Keep trying and failing to change lifestyle

41
January 2009ABHI SegmentationGfK bluemoon
Balance Attainers
Very healthy and stable lifestyle, no change needed / desiredSkew to maintenance status
17%
WHO ARE THEY?• Even gender split• Older (29% are 55-65 vs 19% for total sample)• Highly educated
HEALTH/WEIGHT• Overall health self-rated as highest• Have few chronic health conditions (28% have at least one)• Most satisfied with waist measurement• Most likely to have a normal BMI• Least likely to have tried to lose weight and reduce waist
measurement in last 6 months
BEHAVIOUR• Highest consumption of vegetables and fruit• Lowest consumption of fast food• Highest level of physical activity• Low prevalence of smoking (9%)
INTENTIONS• Least likely to have tried, or intend to try, to improve vegetable,
fruit or fast food consumption or increase physical actvity
ATTITUDES• Low desire to change lifestyle• They have no need to change their lifestyle• Perceive themselves to be very healthy

January 2009ABHI SegmentationGfK bluemoon
APPENDIX – Detailed results by segment
January 2009ABHI SegmentationGfK bluemoon
Demographics

44
January 2009ABHI SegmentationGfK bluemoon
Gender
S1 Record gender?
5060 56
45 4252
5040 44
55 5848
0
20
40
60
80
100
Total Avoiders Postponers Help Seekers Endeavourers BalanceAttainers
Female
Male
%
Base: Total Sample (2806)indicates that segment has scored significantly higher than the rest of the sampleindicates that segment has scored significantly lower than the rest of the sample
45
January 2009ABHI SegmentationGfK bluemoon
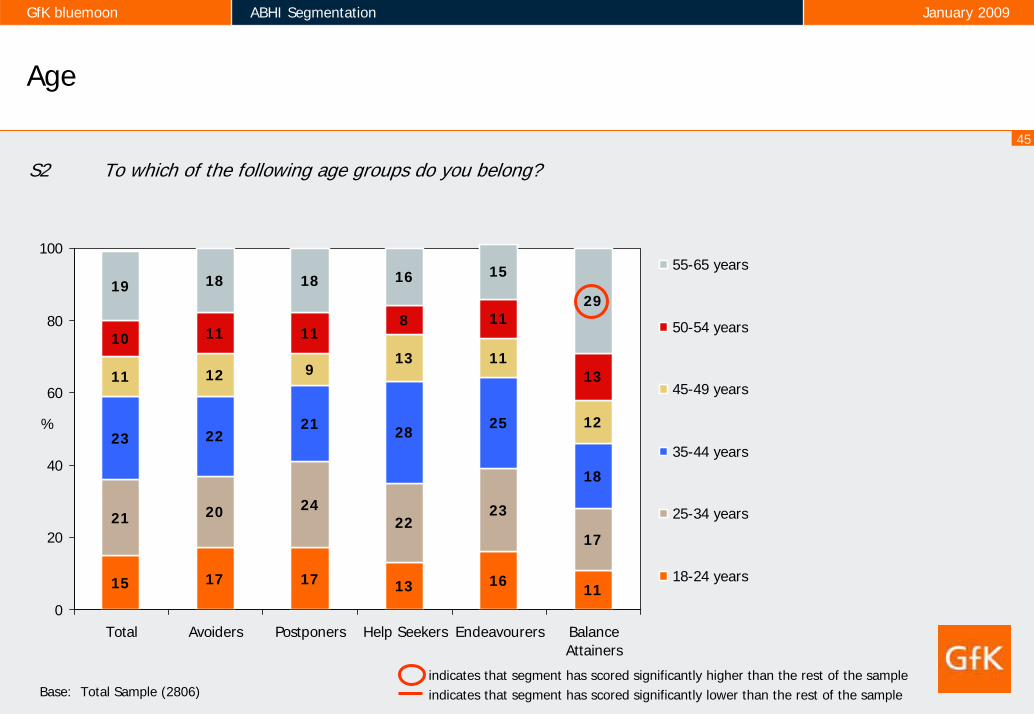
Age
S2 To which of the following age groups do you belong?
15 17 17 13 16 11
21 20 2422
23
17
23 2221 28 25
18
11 12 913 11
12
10 11 118 11
13
19 18 18 16 15
29
0
20
40
60
80
100
Total Avoiders Postponers Help Seekers Endeavourers BalanceAttainers
55-65 years
50-54 years
45-49 years
35-44 years
25-34 years
18-24 years
%
Base: Total Sample (2806)indicates that segment has scored significantly higher than the rest of the sampleindicates that segment has scored significantly lower than the rest of the sample

46
January 2009ABHI SegmentationGfK bluemoon
Education completed
D6 What is the highest level of education you have completed?
15 12
2516
10 14
64
8
8
7 3
2225
25
22
20 20
54
5
3
6 5
1110
10
12
10 11
811
3
9
9 8
20 22
1517
23 21
13 11 811 16
17
1 1 1 1
0
20
40
60
80
100
Total Avoiders Postponers Help Seekers Endeavourers BalanceAttainers
Other
Post-GraduateDegree
BachelorDegree
Diploma
TAFE /TechnicalCertificateTrade /apprenticeship
Year 12 orbelow
Year 11 orbelow
Year 10 orbelow
%
Base: Total Sample (2806)indicates that segment has scored significantly higher than the rest of the sampleindicates that segment has scored significantly lower than the rest of the sample
47
January 2009ABHI SegmentationGfK bluemoon
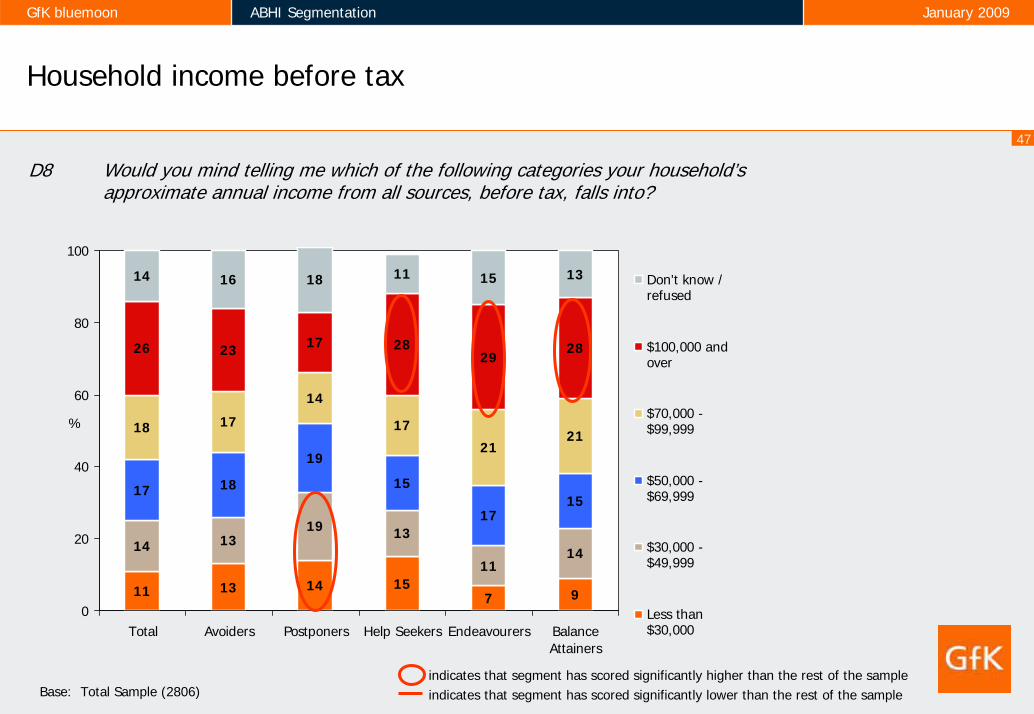
Household income before tax
D8 Would you mind telling me which of the following categories your household’sapproximate annual income from all sources, before tax, falls into?
11 13 14 157 9
14 1319 13
1114
17 18
19
15
1715
18 17
14
17
2121
26 23 17 2829
28
14 16 18 11 15 13
0
20
40
60
80
100
Total Avoiders Postponers Help Seekers Endeavourers BalanceAttainers
Don't know /refused
$100,000 andover
$70,000 -$99,999
$50,000 -$69,999
$30,000 -$49,999
Less than$30,000
%
Base: Total Sample (2806)indicates that segment has scored significantly higher than the rest of the sampleindicates that segment has scored significantly lower than the rest of the sample

48
January 2009ABHI SegmentationGfK bluemoon
English the main language spoken at home
D9 What is the main language spoken in your home?
93 9388
94 94 94
0
20
40
60
80
100
Total Avoiders Postponers Help Seekers Endeavourers BalanceAttainers
English
%
Base: Total Sample (2806)indicates that segment has scored significantly higher than the rest of the sampleindicates that segment has scored significantly lower than the rest of the sample

49
January 2009ABHI SegmentationGfK bluemoon
City/country
60 59 5565 62 58
40 41 4535 38 42
0
20
40
60
80
100
Total Avoiders Postponers Help Seekers Endeavourers BalanceAttainers
Country
City
%
Base: Total Sample (2806)indicates that segment has scored significantly higher than the rest of the sampleindicates that segment has scored significantly lower than the rest of the sample

50
January 2009ABHI SegmentationGfK bluemoon
Target groups
Total Avoiders Postponers HelpSeekers Endeavourers Balance
Attainersn= 2806 555 346 698 735 472
% % % % % %
18-24 15 17 17 13 16 11
25-49 with Children 35 31 33 37 39 33
25-49 without Children 21 23 21 25 19 13
50-65 29 29 30 24 25 42
45-65 41 41 38 37 36 54
indicates that segment has scored significantly higher than the rest of the sampleindicates that segment has scored significantly lower than the rest of the sample
51
January 2009ABHI SegmentationGfK bluemoon
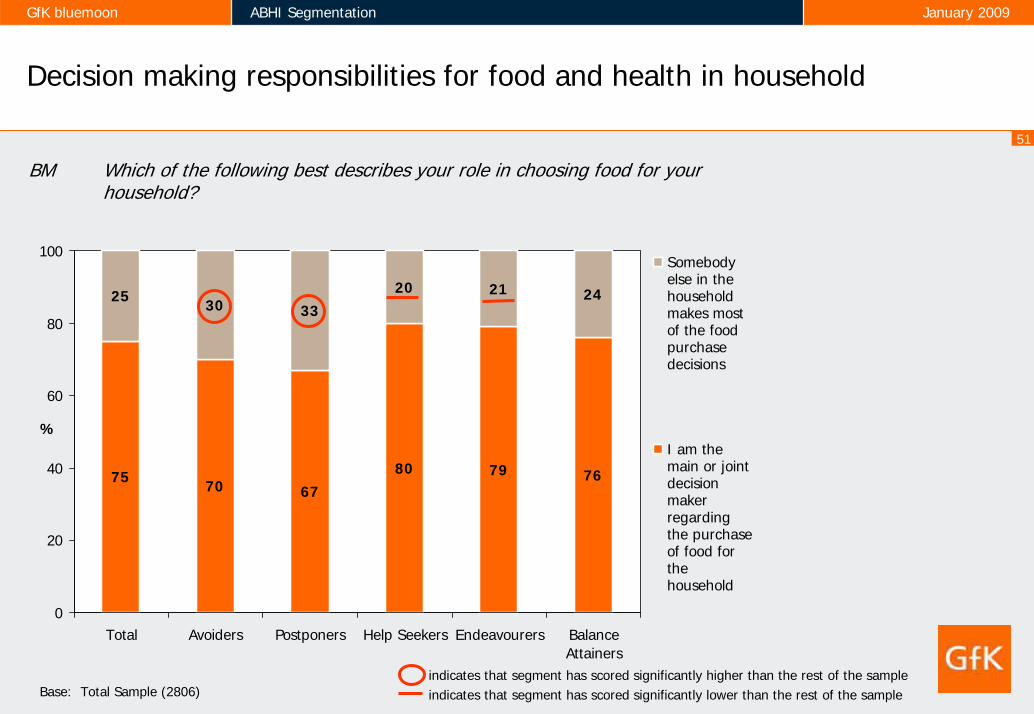
Decision making responsibilities for food and health in household
BM Which of the following best describes your role in choosing food for your household?
75 70 6780 79 76
25 30 3320 21 24
0
20
40
60
80
100
Total Avoiders Postponers Help Seekers Endeavourers BalanceAttainers
Somebodyelse in thehouseholdmakes mostof the foodpurchasedecisions
I am themain or jointdecisionmakerregardingthe purchaseof food forthehousehold
%
Base: Total Sample (2806)indicates that segment has scored significantly higher than the rest of the sampleindicates that segment has scored significantly lower than the rest of the sample

January 2009ABHI SegmentationGfK bluemoon
Nutrition

53
January 2009ABHI SegmentationGfK bluemoon
Serves of vegetables eaten a day
Q1 How many serves of vegetables do you usually eat each day? One serve is ½ cup of cooked vegetables or 1 cup of salad vegetables.
1 1 14 4 9 52 1
26 2931 32
21 20
2831
28 30
2724
2018 15 15
27
23
119 7 9
13
16
6 5 7 5 610
3 2 2 1 4 7
0
20
40
60
80
100
Total Avoiders Postponers Help Seekers Endeavourers BalanceAttainers
More than 5
5 serves
4 serves
3 serves
2 serves
1 serve
Less than 1
Don't eatvegetables
%
Base: Total Sample (2806)
MEAN 2.5 2.3 2.3 2.2 2.7 3.0
indicates that segment has scored significantly higher than the rest of the sampleindicates that segment has scored significantly lower than the rest of the sample

54
January 2009ABHI SegmentationGfK bluemoon
Perception of recommended serves of vegetables per day
Q2 To maintain good health, how many serves of vegetables do you think you should eat everyday?
10 13 12 10 8 10
1819 16 18 17 18
2119
18 2322 21
12 12
9
1213 13
31 2632
32 34 28
43 2
3 56
4 7 8
3 2 5
0
20
40
60
80
100
Total Avoiders Postponers Help Seekers Endeavourers BalanceAttainers
Don't know
More than 5
5 serves
4 serves
3 serves
2 serves
1 serve
%
Base: Total Sample (2806)
MEAN 3.5 3.3 3.4 3.5 3.7 3.5
indicates that segment has scored significantly higher than the rest of the sampleindicates that segment has scored significantly lower than the rest of the sample

55
January 2009ABHI SegmentationGfK bluemoon
Change in the quantity of vegetables eaten per day in the last 6 months
Q3 In the last six months, have you tried to change the amount of vegetables you eat?
3424
31
46 43
14
6576
68
52 57
85
1 1 2 1
0
20
40
60
80
100
Total Avoiders Postponers Help Seekers Endeavourers BalanceAttainers
Yes, tried todecreaseamount
No, haven'ttried tochange
Yes, tried toincreaseamount
%
Base: Total Sample (2806)indicates that segment has scored significantly higher than the rest of the sampleindicates that segment has scored significantly lower than the rest of the sample
56
January 2009ABHI SegmentationGfK bluemoon
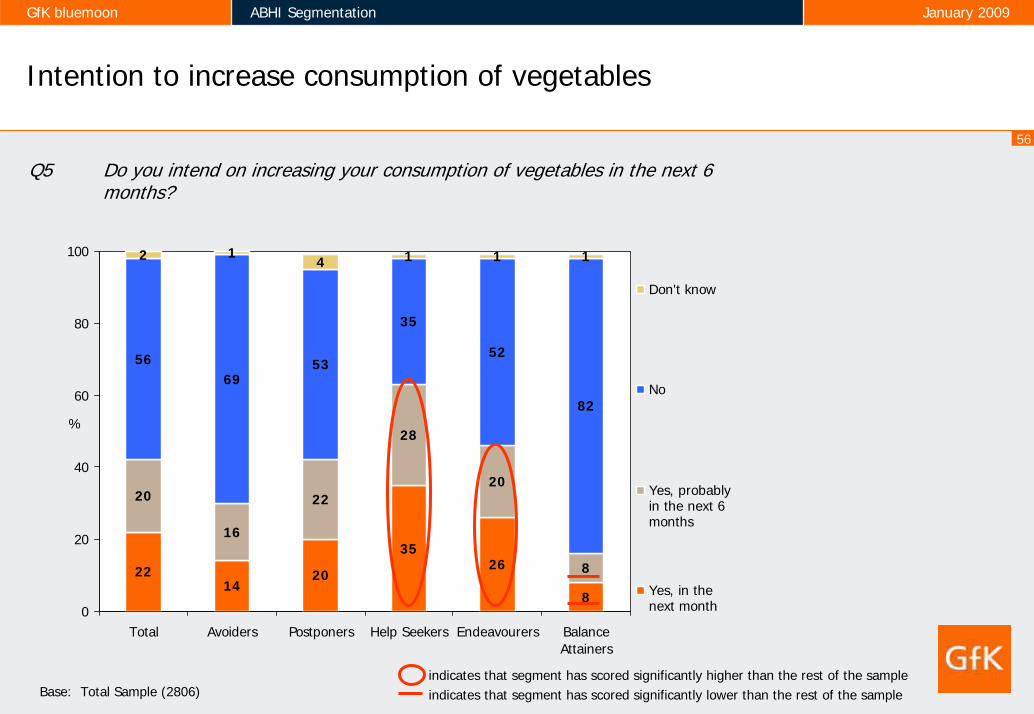
Intention to increase consumption of vegetables
Q5 Do you intend on increasing your consumption of vegetables in the next 6 months?
2214
20
3526
8
20
16
22
28
20
8
5669
53
35
52
82
2 14 1 1 1
0
20
40
60
80
100
Total Avoiders Postponers Help Seekers Endeavourers BalanceAttainers
Don't know
No
Yes, probablyin the next 6months
Yes, in thenext month
%
Base: Total Sample (2806)indicates that segment has scored significantly higher than the rest of the sampleindicates that segment has scored significantly lower than the rest of the sample

57
January 2009ABHI SegmentationGfK bluemoon
Contemplation status - vegetables
Contemplation status calculated from respondent’s self-reported activity and intentions to change
50
64
51
32
46
69
19
15
21
28
20
8
21
1419
34 24 6
10 7 9 710
17
0
20
40
60
80
100
Total Avoiders Postponers Help Seekers Endeavourers BalanceAttainers
Maintenance
Preparation
Contemplation
Pre-contemplation
%
Base: Total Sample (2806)indicates that segment has scored significantly higher than the rest of the sampleindicates that segment has scored significantly lower than the rest of the sample

58
January 2009ABHI SegmentationGfK bluemoon
Serves of fruit eaten per day
Q6 How many serves of fruit do you usually eat each day? A serve is 1 medium piece or 2 small pieces of fruit or 1 cup of diced fruit.
9 10 12 145 5
28 3134 31
23 22
3435
31 30
3734
26 20 17 2033 37
3 3 5 5 1 2
0
20
40
60
80
100
Total Avoiders Postponers Help Seekers Endeavourers BalanceAttainers
Don't eat fruitat all
More than 2serves
2 serves
1 serve
Less than 1
%
Base: Total Sample (2806)
MEAN 2.1 2 1.8 1.9 2.3 2.4
indicates that segment has scored significantly higher than the rest of the sampleindicates that segment has scored significantly lower than the rest of the sample

59
January 2009ABHI SegmentationGfK bluemoon
Perception of recommended serves of fruit per day
Q7 To maintain good health, how many serves of fruit do you think you should eat everyday?
MEAN 2.6 2.4 2.5 2.6 2.8 2.5
1 110 13 12 10
613
4144 41 42
39
41
4336 40 44
53 39
5 7 6 4 26
0
20
40
60
80
100
Total Avoiders Postponers Help Seekers Endeavourers BalanceAttainers
Don't know
More than 2serves
2 serves
1 serve
Less than 1
%
Base: Total Sample (2806)
indicates that segment has scored significantly higher than the rest of the sampleindicates that segment has scored significantly lower than the rest of the sample

60
January 2009ABHI SegmentationGfK bluemoon
Change in the quantity of vegetables eaten per day in the last 6 months
Q8 In the last six months, have you tried to change the amount of fruit that you eat?
2820
3039
33
15
6977
6858
64
84
3 2 2 3 3 1
0
20
40
60
80
100
Total Avoiders Postponers Help Seekers Endeavourers BalanceAttainers
Yes, tried todecreaseamount
No, haven'ttried tochange
Yes, tried toincreaseamount
%
Base: Total Sample (2806)indicates that segment has scored significantly higher than the rest of the sampleindicates that segment has scored significantly lower than the rest of the sample

61
January 2009ABHI SegmentationGfK bluemoon
Intention to increase consumption of fruit
Q10 Do you intend on increasing your consumption of fruit in the next six months?
2313
2132 29
13
17
15
24
24
16
8
58
69
5343
54
77
1 2 2 1 1 2
0
20
40
60
80
100
Total Avoiders Postponers Help Seekers Endeavourers BalanceAttainers
Don't know
No
Yes, probablyin the next 6months
Yes, in thenext month
%
Base: Total Sample (2806)indicates that segment has scored significantly higher than the rest of the sampleindicates that segment has scored significantly lower than the rest of the sample

62
January 2009ABHI SegmentationGfK bluemoon
Contemplation status - fruit
Contemplation status calculated from respondent’s self-reported activity and intentions to change
1931
2415 12
19
10
816
16
5
5
11
611
19
125
6055 48 50
71 71
0
20
40
60
80
100
Total Avoiders Postponers Help Seekers Endeavourers BalanceAttainers
Maintenance
Preparation
Contemplation
Pre-contemplation
%
Base: Total Sample (2806)indicates that segment has scored significantly higher than the rest of the sampleindicates that segment has scored significantly lower than the rest of the sample

63
January 2009ABHI SegmentationGfK bluemoon
Serves of fast food or snack food consumed each day
Q11 Approximately, how many items of fast food or snack foods do you have each day? By an item I mean a slice of cake, a soft drink, a packet of chips, serve of hot chips, small burger, a chocolate bar, slice of
pizza etc You should count large portions as 2 items.
12 12 11 7 1219
44 4238
38
49
50
29 2928 35
2722
10 1113
139 73 4
6 32 12 2 4 4 1 11 1
0
20
40
60
80
100
Total Avoiders Postponers Help Seekers Endeavourers BalanceAttainers
Don't know
More than 3
3 items
2 items
1 item
Less than 1
Don't eat fastfood
%
Base: Total Sample (2806)
MEAN 0.9 0.9 1.1 1.1 0.8 0.7
indicates that segment has scored significantly higher than the rest of the sampleindicates that segment has scored significantly lower than the rest of the sample

64
January 2009ABHI SegmentationGfK bluemoon
Decreased amount of fast/snack food eaten in last 6 months
Q12 In the last six months, have you tried to decrease the amount of fast food or snack foods that you eat?
4738
49
65
51
20
5362
51
35
49
80
0
20
40
60
80
100
Total Avoiders Postponers Help Seekers Endeavourers BalanceAttainers
No, haven'ttried tochange
Yes, tried todecreaseamount
%
Base: Total Sample (2806)indicates that segment has scored significantly higher than the rest of the sampleindicates that segment has scored significantly lower than the rest of the sample

65
January 2009ABHI SegmentationGfK bluemoon
Intention of decreasing fast/snack food consumption in next 6 months
Q14 Do you intend on decreasing your consumption of fast food or snack foods inthe next six months?
2514
21
45
28
6
15
13
21
18
15
7
60
71
58
37
57
87
2
0
20
40
60
80
100
Total Avoiders Postponers Help Seekers Endeavourers BalanceAttainers
Don't know
No
Yes, probablyin the next 6months
Yes, in thenext month
%
Base: Total Sample (2806)indicates that segment has scored significantly higher than the rest of the sampleindicates that segment has scored significantly lower than the rest of the sample

January 2009ABHI SegmentationGfK bluemoon
Physical activity

67
January 2009ABHI SegmentationGfK bluemoon
Perception of how many minutes of physical activity needed per day to maintain health
Q15 To maintain good health, how many minutes of moderate or vigorous activity do you think you should do everyday?
56 57 5459 56 51
24 2223
21 2527
16 15 1618 15 16
0
20
40
60
80
100
Total Avoiders Postponers Help Seekers Endeavourers BalanceAttainers
Incorrect LessThan 30 min
Incorrect Morethan 30
CorrectAmount
%
Base: Total Sample (2806)indicates that segment has scored significantly higher than the rest of the sampleindicates that segment has scored significantly lower than the rest of the sample

68
January 2009ABHI SegmentationGfK bluemoon
Number of times a week spent walking for 10 minutes+
Q16 In the last week, how many times have you walked continuously for at least 10 minutes for recreation, exercise or to get to or from places?
13 1118
19
1010
17 1715
19
1715
58 59 5247
67 65
2 1 4 1 1 2
0
20
40
60
80
100
Total Avoiders Postponers Help Seekers Endeavourers BalanceAttainers
Don't Know
More than 5
3-4 times
1-2 times
Not at all
%
Base: Total Sample (2806)indicates that segment has scored significantly higher than the rest of the sampleindicates that segment has scored significantly lower than the rest of the sample

69
January 2009ABHI SegmentationGfK bluemoon
Time spent walking last week
Q17 What do you estimate was the total time you spent walking in this way in the last week?
10 11 11 144 8
12 14 1716
88
2930 28
30
33 23
4643 38
38
5258
3 2 6 2 2 3
0
20
40
60
80
100
Total Avoiders Postponers Help Seekers Endeavourers BalanceAttainers
Don'tknow/Refused
150+ minutes
60-149 minutes
Less than 60minutes
None
%
Base: Total Sample (2806)indicates that segment has scored significantly higher than the rest of the sampleindicates that segment has scored significantly lower than the rest of the sample

70
January 2009ABHI SegmentationGfK bluemoon
Time spent doing vigorous physical exercise
Q19 What do you estimate was the total time you spent doing vigorous physicalactivity in the last week?
43 4553 52
35 31
10 9
13 13
96
22 22
15 19
27
24
25 23 17 15
2838
1 1 1 2
0
20
40
60
80
100
Total Avoiders Postponers Help Seekers Endeavourers BalanceAttainers
Don'tknow/Refused
150+ minutes
60-149 minutes
Less than 60minutes
None
%
Base: Total Sample (2806)indicates that segment has scored significantly higher than the rest of the sampleindicates that segment has scored significantly lower than the rest of the sample

71
January 2009ABHI SegmentationGfK bluemoon
Time spent doing moderate physical exercise
Q21 What do you estimate was the total time that you spent doing these activities in the last week?
65 6374 70
61 62
5 6
55
6 4
14 15
1013
1512
14 1411 10
17 20
1 2 1 1 1 2
0
20
40
60
80
100
Total Avoiders Postponers Help Seekers Endeavourers BalanceAttainers
Don'tknow/Refused
150+ minutes
60-149 minutes
Less than 60minutes
None
%
Base: Total Sample (2806)indicates that segment has scored significantly higher than the rest of the sampleindicates that segment has scored significantly lower than the rest of the sample
72
January 2009ABHI SegmentationGfK bluemoon
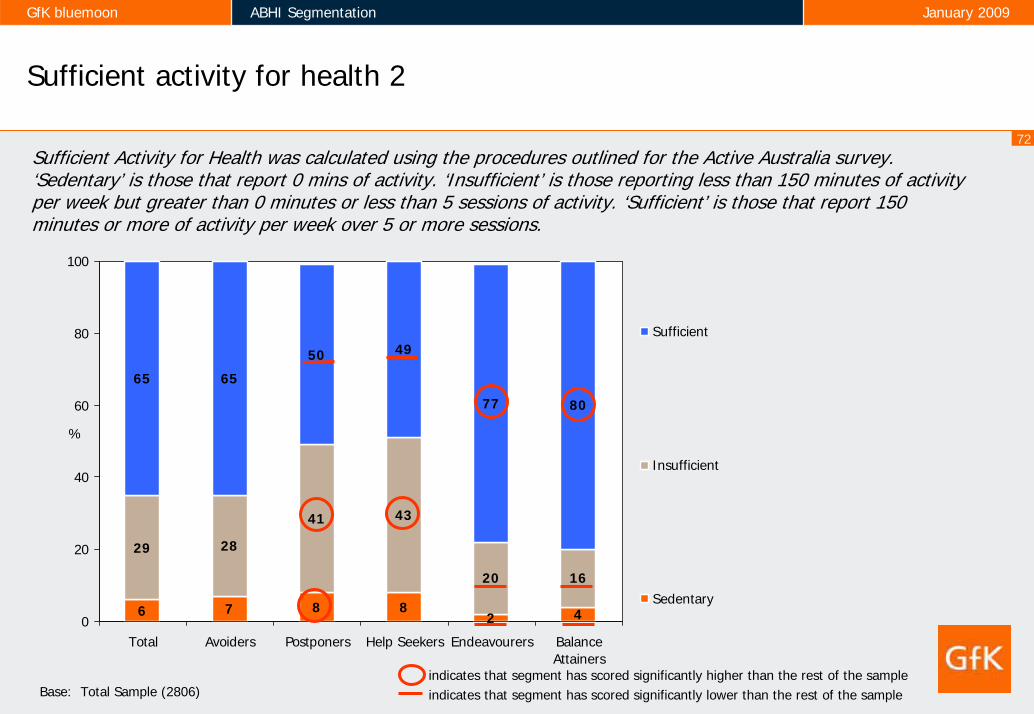
Sufficient activity for health 2
6 7 8 82 4
29 28
41 43
20 16
65 65
50 49
77 80
0
20
40
60
80
100
Total Avoiders Postponers Help Seekers Endeavourers BalanceAttainers
Sufficient
Insufficient
Sedentary
%
Base: Total Sample (2806)
Sufficient Activity for Health was calculated using the procedures outlined for the Active Australia survey. ‘Sedentary’ is those that report 0 mins of activity. ‘Insufficient’ is those reporting less than 150 minutes of activity per week but greater than 0 minutes or less than 5 sessions of activity. ‘Sufficient’ is those that report 150minutes or more of activity per week over 5 or more sessions.
indicates that segment has scored significantly higher than the rest of the sampleindicates that segment has scored significantly lower than the rest of the sample

73
January 2009ABHI SegmentationGfK bluemoon
Change in amount of physical activity done in last 6 months
Q22 In the past 6 months, have you tried to change the amount of moderate orvigorous activity that you do?
4839 41
60 63
22
5060 56
38 34
76
2 1 3 2 3 2
0
20
40
60
80
100
Total Avoiders Postponers Help Seekers Endeavourers BalanceAttainers
Yes, tried todecreaseamount
No, haven'ttried to change
Yes, tried toincreaseamount
%
Base: Total Sample (2806)indicates that segment has scored significantly higher than the rest of the sampleindicates that segment has scored significantly lower than the rest of the sample

74
January 2009ABHI SegmentationGfK bluemoon
Intention to increase amount of physical activity
Q24 Do you intend on increasing the amount of physical activity you do in the next six months? If yes, is that in the next month or probably sometime in the next 6 months?
3929 32
54 50
19
24
2430
30
25
11
3546
34
1525
69
1 1 5 1 1 1
0
20
40
60
80
100
Total Avoiders Postponers Help Seekers Endeavourers BalanceAttainers
Don't know
No
Yes, probablyin the next 6months
Yes, in thenext month
%
Base: Total Sample (2806)indicates that segment has scored significantly higher than the rest of the sampleindicates that segment has scored significantly lower than the rest of the sample

75
January 2009ABHI SegmentationGfK bluemoon
Contemplation status - physical activity
Contemplation status calculated from respondent’s self-reported activity and intentions to change
7 11 125 2
8
8 513
13
63
11 10
11 22
9 2
74 7464 60
8487
0
20
40
60
80
100
Total Avoiders Postponers Help Seekers Endeavourers BalanceAttainers
Maintenance
Preparation
Contemplation
Pre-contemplation
%
Base: Total Sample (2806)indicates that segment has scored significantly higher than the rest of the sampleindicates that segment has scored significantly lower than the rest of the sample

January 2009ABHI SegmentationGfK bluemoon
General health

77
January 2009ABHI SegmentationGfK bluemoon
Self-rating of overall health
Q26 In general would you say your health is …
114 3 3
12
31
3032
22 19
39
37
4244
4948
40
27
14 1620
21
8 44 5 5 91
0
20
40
60
80
100
Total Avoiders Postponers Help Seekers Endeavourers BalanceAttainers
Poor
Fair
Good
Very good
Excellent
%
Base: Total Sample (2806)
41 36 25 22 51 68Total excellent/
very good
indicates that segment has scored significantly higher than the rest of the sampleindicates that segment has scored significantly lower than the rest of the sample

78
January 2009ABHI SegmentationGfK bluemoon
Best indicator of good health – weight or waist measurement
Q25 In your opinion which of these is the best indicator of good health?
51 5259
48 4654
45 4237
49 51 38
4 6 4 3 38
0
20
40
60
80
100
Total Avoiders Postponers Help Seekers Endeavourers BalanceAttainers
Don't know
Measuringyour waist witha tapemeasure
Your weight asmeasured bythe scales
%
Base: Total Sample (2806)indicates that segment has scored significantly higher than the rest of the sampleindicates that segment has scored significantly lower than the rest of the sample

79
January 2009ABHI SegmentationGfK bluemoon
Satisfaction with current waist measurement
Q27 How satisfied are you with your current waist measurement?
2115 17
8
22
47
3436
38
24
38
3911 18 13
10
10
4
2425 23
36
24
79 5 822
51 1 1 2
0
20
40
60
80
100
Total Avoiders Postponers Help Seekers Endeavourers BalanceAttainers
Don't know
Verydissatisfied
Somewhatdissatisfied
Neithersatisfied nordissatisfied
Somewhatsatisfied
Very satisfied
%
Base: Total Sample (2806)
55 51 55 32 60 86Very / somewhat
satisfied
indicates that segment has scored significantly higher than the rest of the sampleindicates that segment has scored significantly lower than the rest of the sample

80
January 2009ABHI SegmentationGfK bluemoon
Measured waist in last 6 months
D15 Have you measured your waist in the last 6 months?
3328 30 32
41
29
0
20
40
60
80
100
Total Avoiders Postponers Help Seekers Endeavourers BalanceAttainers
Yes
%
Base: Total Sample (2806)indicates that segment has scored significantly higher than the rest of the sampleindicates that segment has scored significantly lower than the rest of the sample

81
January 2009ABHI SegmentationGfK bluemoon
Tried to reduce waist measurement in last 6 months
D16 Have you tried to reduce your waist measurement in the last 6 months?
48
3743
6259
27
0
20
40
60
80
100
Total Avoiders Postponers Help Seekers Endeavourers BalanceAttainers
%
Base: Total Sample (2806)indicates that segment has scored significantly higher than the rest of the sampleindicates that segment has scored significantly lower than the rest of the sample

82
January 2009ABHI SegmentationGfK bluemoon
Intention of measuring waist in next month
D18 Do you intend to measure your waist in the next month?
30
21
30
3936
18
0
20
40
60
80
100
Total Avoiders Postponers Help Seekers Endeavourers BalanceAttainers
Yes
%
Base: Total Sample (2806)indicates that segment has scored significantly higher than the rest of the sampleindicates that segment has scored significantly lower than the rest of the sample
83
January 2009ABHI SegmentationGfK bluemoon
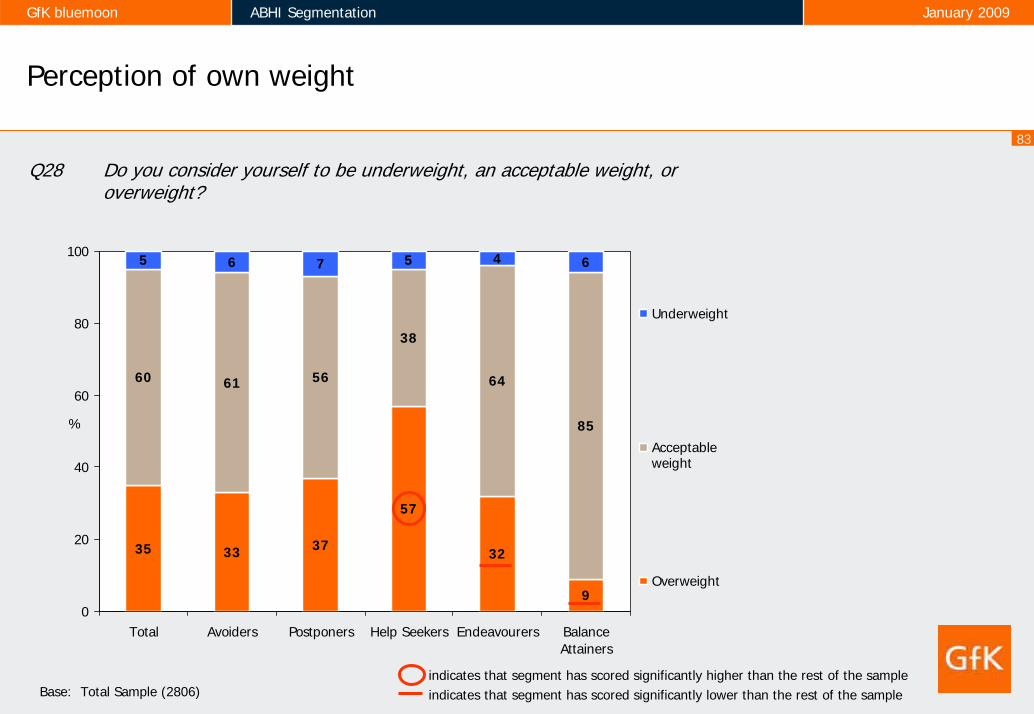
Perception of own weight
Q28 Do you consider yourself to be underweight, an acceptable weight, or overweight?
35 33 37
57
32
9
60 61 56
38
64
85
5 6 7 5 4 6
0
20
40
60
80
100
Total Avoiders Postponers Help Seekers Endeavourers BalanceAttainers
Underweight
Acceptableweight
Overweight
%
Base: Total Sample (2806)indicates that segment has scored significantly higher than the rest of the sampleindicates that segment has scored significantly lower than the rest of the sample

84
January 2009ABHI SegmentationGfK bluemoon
BMI
Body Mass Index calculated from respondent’s self-reported height and weight
3 3 4 2 2 2
40 37 3329
43
61
33 3731
32
35
30
17 16
19 29
12
57 713 7 7
3
0
20
40
60
80
100
Total Avoiders Postponers Help Seekers Endeavourers BalanceAttainers
Not established
30.0 and above
25.0-29.9Overweight
18.5-24.9Normal
Below 18.5Underweight
%
Base: Total Sample (2806)indicates that segment has scored significantly higher than the rest of the sampleindicates that segment has scored significantly lower than the rest of the sample
85
January 2009ABHI SegmentationGfK bluemoon
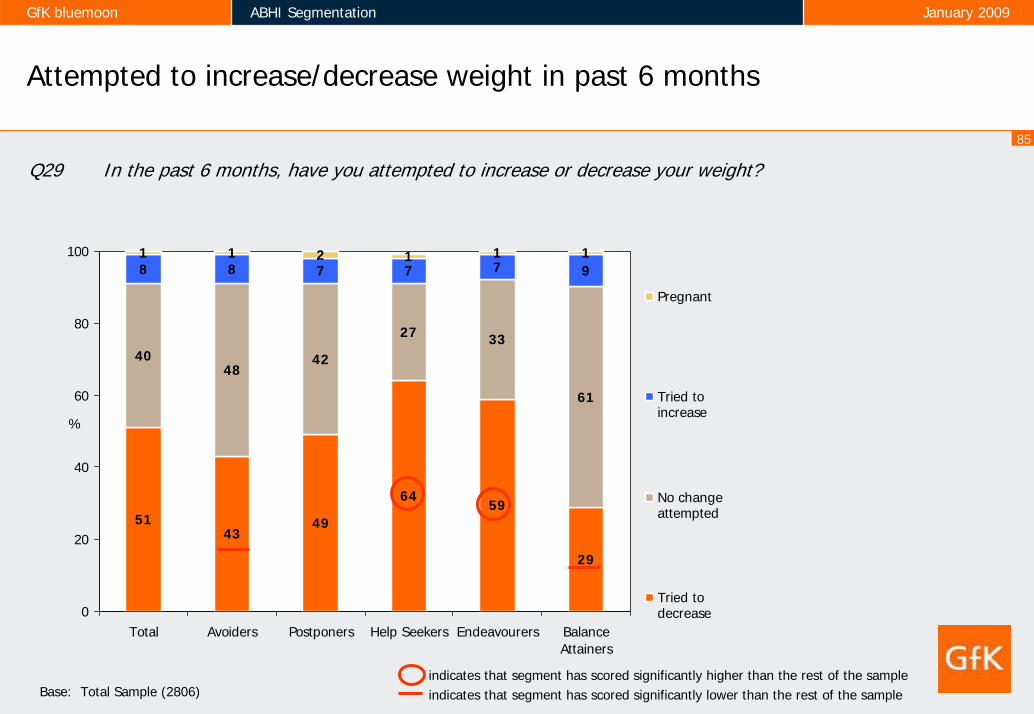
Attempted to increase/decrease weight in past 6 months
Q29 In the past 6 months, have you attempted to increase or decrease your weight?
5143
49
6459
29
4048
42
27 33
61
8 8 7 7 7 91 1 2 1 1 1
0
20
40
60
80
100
Total Avoiders Postponers Help Seekers Endeavourers BalanceAttainers
Pregnant
Tried toincrease
No changeattempted
Tried todecrease
%
Base: Total Sample (2806)indicates that segment has scored significantly higher than the rest of the sampleindicates that segment has scored significantly lower than the rest of the sample
86
January 2009ABHI SegmentationGfK bluemoon
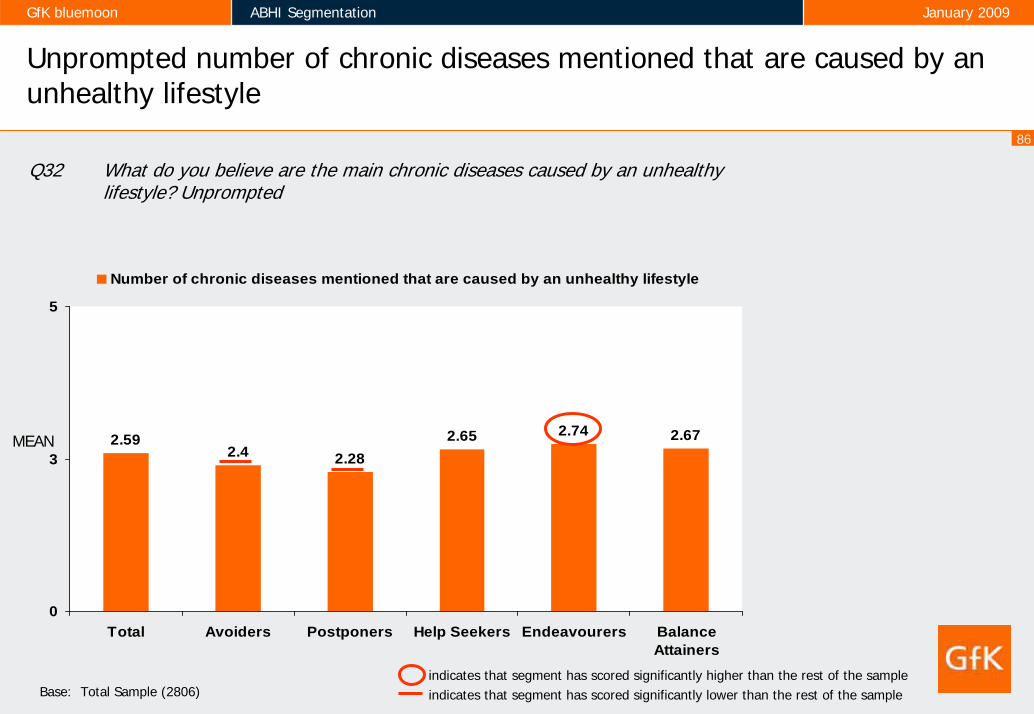
Unprompted number of chronic diseases mentioned that are caused by an unhealthy lifestyle
Q32 What do you believe are the main chronic diseases caused by an unhealthy lifestyle? Unprompted
2.592.4 2.28
2.65 2.74 2.67
0
3
5
Total Avoiders Postponers Help Seekers Endeavourers BalanceAttainers
Number of chronic diseases mentioned that are caused by an unhealthy lifestyle
MEAN
Base: Total Sample (2806)indicates that segment has scored significantly higher than the rest of the sampleindicates that segment has scored significantly lower than the rest of the sample

87
January 2009ABHI SegmentationGfK bluemoon
Looked for information on healthy lifestyles in last 6 months
Q38 Have you looked for information on healthy lifestyles in the last 6 months?
45
37 37
5357
31
0
20
40
60
80
100
Total Avoiders Postponers Help Seekers Endeavourers BalanceAttainers
Yes
%
Base: Total Sample (2806)indicates that segment has scored significantly higher than the rest of the sampleindicates that segment has scored significantly lower than the rest of the sample

88
January 2009ABHI SegmentationGfK bluemoon
Likely to seek information about healthier lifestyles in the next month
Q39 In the next month how likely are you to seek information about healthier lifestyles?
2414 19
31 33
13
25
19
33
3223
17
11
12
13
9
10
11
17
21
14
1317
17
24
33
22 14 16
42
0
20
40
60
80
100
Total Avoiders Postponers Help Seekers Endeavourers BalanceAttainers
Very unlikely
Somewhatunlikely
Neither likelynor unlikely
Somewhatlikely
Very likely
%
Base: Total Sample (2806)
49 33 52 63 56 30Very / somewhat likely
indicates that segment has scored significantly higher than the rest of the sampleindicates that segment has scored significantly lower than the rest of the sample

89
January 2009ABHI SegmentationGfK bluemoon
Seen advertising about being overweight, chronic disease and/or lifestyle
Q40 Thinking about advertising. In the last month have you seen, read or heard any advertising campaigns about lifestyle, being overweight and chronic disease?
71 69 72 73 7265
0
20
40
60
80
100
Total Avoiders Postponers Help Seekers Endeavourers BalanceAttainers
Yes
%
Base: Total Sample (2806)indicates that segment has scored significantly higher than the rest of the sampleindicates that segment has scored significantly lower than the rest of the sample
90
January 2009ABHI SegmentationGfK bluemoon
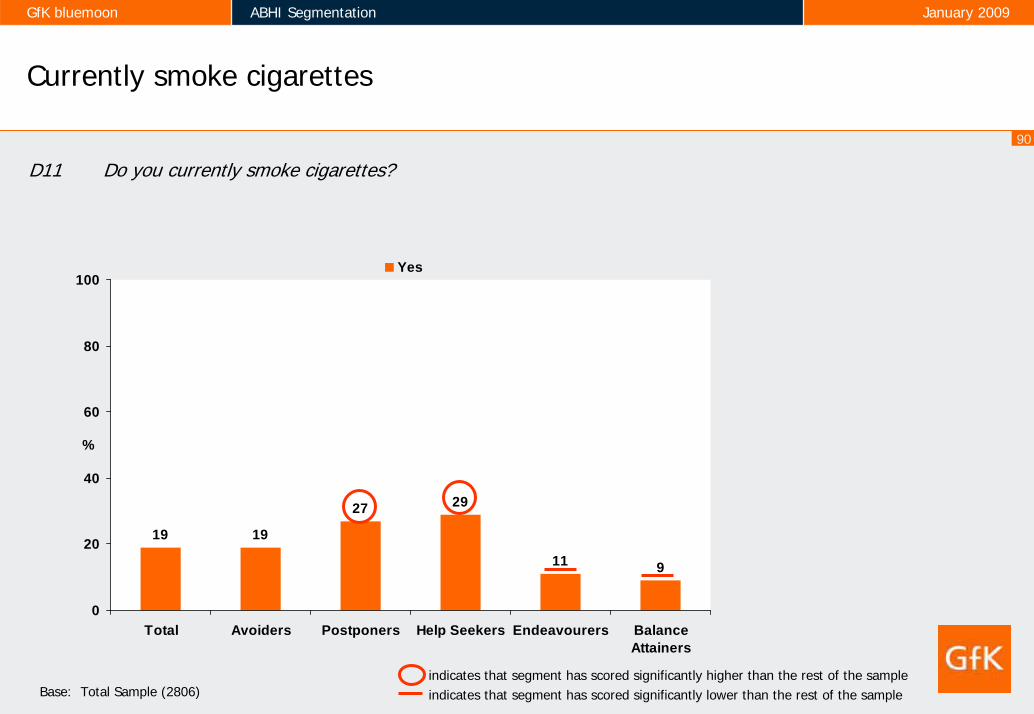
Currently smoke cigarettes
D11 Do you currently smoke cigarettes?
19 19
27 29
11 9
0
20
40
60
80
100
Total Avoiders Postponers Help Seekers Endeavourers BalanceAttainers
Yes
%
Base: Total Sample (2806)indicates that segment has scored significantly higher than the rest of the sampleindicates that segment has scored significantly lower than the rest of the sample

91
January 2009ABHI SegmentationGfK bluemoon
Have any long term health conditions
D12 Have you been told by a doctor or nurse that you currently have any of the following long-term health conditions?
3532
4045
28
20
0
20
40
60
80
100
Total Avoiders Postponers Help Seekers Endeavourers BalanceAttainers
Have a chronic health condition
%
Base: Total Sample (2806)indicates that segment has scored significantly higher than the rest of the sampleindicates that segment has scored significantly lower than the rest of the sample

January 2009ABHI SegmentationGfK bluemoon
Attitudes towards health

93
January 2009ABHI SegmentationGfK bluemoon
Attitudes towards health and chronic diseases
TotalSample Avoiders Postponers
HelpSeekers Endeavourers
BalanceAttainers
n= 2806 555 346 698 735 472
% % % % % %
A person's waist measurement is stronglyrelated to their chances of developing achronic disease
78 73 75 81 80 79
I am concerned that I will develop a chronicdisease 38 28 48 61 31 18
I have a high chance of developing a chronicdisease 32 22 53 55 17 14
Red indicates that segment has scored significantly lower than the rest of the sample.
Green indicates that segment has scored significantly higher than the rest of the sample.
94
January 2009ABHI SegmentationGfK bluemoon
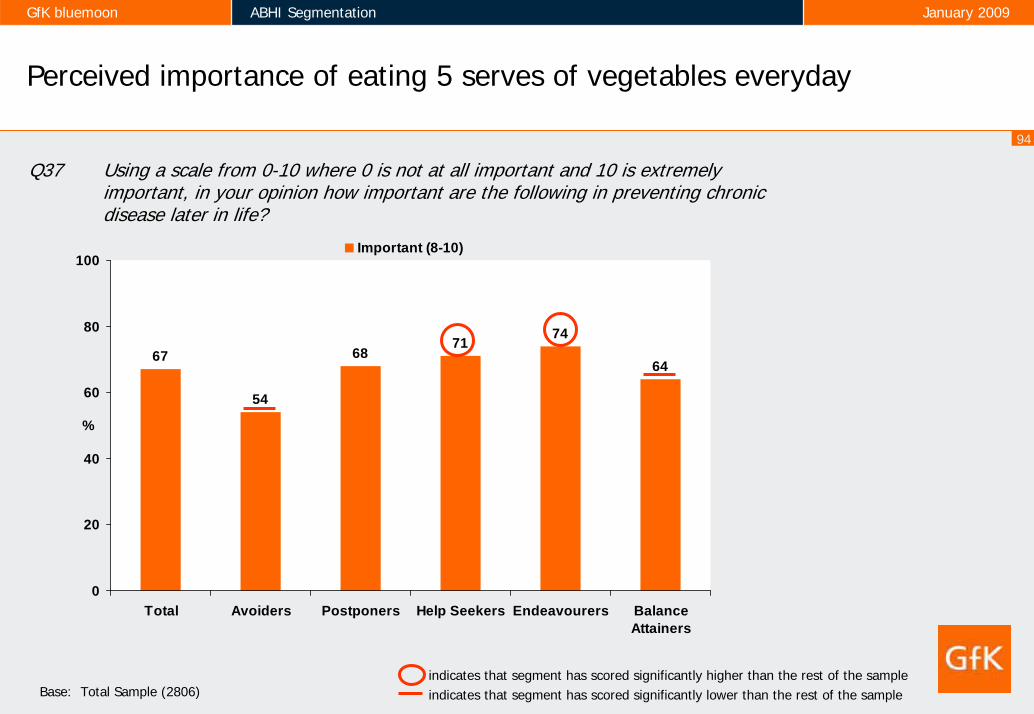
Perceived importance of eating 5 serves of vegetables everyday
67
54
6871 74
64
0
20
40
60
80
100
Total Avoiders Postponers Help Seekers Endeavourers BalanceAttainers
Important (8-10)
%
Q37 Using a scale from 0-10 where 0 is not at all important and 10 is extremely important, in your opinion how important are the following in preventing chronic disease later in life?
indicates that segment has scored significantly higher than the rest of the sampleindicates that segment has scored significantly lower than the rest of the sampleBase: Total Sample (2806)

95
January 2009ABHI SegmentationGfK bluemoon
Perceived importance of doing 30 minutes of physical activity everyday
80
6976
8588
77
0
20
40
60
80
100
Total Avoiders Postponers Help Seekers Endeavourers BalanceAttainers
Important (8-10)
%
Q37 Using a scale from 0-10 where 0 is not at all important and 10 is extremely important, in your opinion how important are the following in preventing chronic disease later in life?
indicates that segment has scored significantly higher than the rest of the sampleindicates that segment has scored significantly lower than the rest of the sampleBase: Total Sample (2806)

96
January 2009ABHI SegmentationGfK bluemoon
Perceived importance of maintaining a waist measurement of no more than recommended size
56
42
54 57
66
55
0
20
40
60
80
100
Total Avoiders Postponers Help Seekers Endeavourers BalanceAttainers
Important (8-10)
%
Q37 Using a scale from 0-10 where 0 is not at all important and 10 is extremely important, in your opinion how important are the following in preventing chronic disease later in life?
indicates that segment has scored significantly higher than the rest of the sampleindicates that segment has scored significantly lower than the rest of the sampleBase: Total Sample (2806)

97
January 2009ABHI SegmentationGfK bluemoon
Perceived importance of not smoking
9591 92
96 98 96
0
20
40
60
80
100
Total Avoiders Postponers Help Seekers Endeavourers BalanceAttainers
Important (8-10)
%
Q37 Using a scale from 0-10 where 0 is not at all important and 10 is extremely important, in your opinion how important are the following in preventing chronic disease later in life?
indicates that segment has scored significantly higher than the rest of the sampleindicates that segment has scored significantly lower than the rest of the sampleBase: Total Sample (2806)

98
January 2009ABHI SegmentationGfK bluemoon
Perceived importance maintaining a healthy weight
84
7579
89 88 86
0
20
40
60
80
100
Total Avoiders Postponers Help Seekers Endeavourers BalanceAttainers
Important (8-10)
%
Q37 Using a scale from 0-10 where 0 is not at all important and 10 is extremely important, in your opinion how important are the following in preventing chronic disease later in life?
indicates that segment has scored significantly higher than the rest of the sampleindicates that segment has scored significantly lower than the rest of the sampleBase: Total Sample (2806)

99
January 2009ABHI SegmentationGfK bluemoon
Perceived importance low consumption of saturated fats
77
66 67
8087
79
0
20
40
60
80
100
Total Avoiders Postponers Help Seekers Endeavourers BalanceAttainers
Important (8-10)
%
Q37 Using a scale from 0-10 where 0 is not at all important and 10 is extremely important, in your opinion how important are the following in preventing chronic disease later in life?
indicates that segment has scored significantly higher than the rest of the sampleindicates that segment has scored significantly lower than the rest of the sampleBase: Total Sample (2806)