Embed Size (px)
Citation preview
Abdulkareem, Lokman A. and Azzopardi, Barry J. and Hamid, Sarbast A, and Abdulkahdir, M. (2015) Characterization Of oil/ gas flow pattern in vertical pipes using electrical capacitance tomography. European Journal of Scientific Research, 130 (1). pp. 160-168. ISSN 1450-202X
Access from the University of Nottingham repository: http://eprints.nottingham.ac.uk/35550/1/Characterization%20of%20oil-gas%20flow%20pattern%20in%20vertical%20pipes%20using%20Electrical%20Capacitance%20Tomography.pdf
Copyright and reuse:
The Nottingham ePrints service makes this work by researchers of the University of Nottingham available open access under the following conditions.
This article is made available under the University of Nottingham End User licence and may be reused according to the conditions of the licence. For more details see: http://eprints.nottingham.ac.uk/end_user_agreement.pdf
A note on versions:
The version presented here may differ from the published version or from the version of record. If you wish to cite this item you are advised to consult the publisher’s version. Please see the repository url above for details on accessing the published version and note that access may require a subscription.
For more information, please contact [email protected]
Seediscussions,stats,andauthorprofilesforthispublicationat:https://www.researchgate.net/publication/283258850
CharacterizationOfOil/GasFlowPatternInVerticalPipesUsingElectricalCapacitanceTomography
ArticleinEuropeanJournalofScientificResearch·March2015
READS
96
1author:
LokmanAzizAbdulkareem
UniversityofZakho
49PUBLICATIONS170CITATIONS
SEEPROFILE
Allin-textreferencesunderlinedinbluearelinkedtopublicationsonResearchGate,
lettingyouaccessandreadthemimmediately.
Availablefrom:LokmanAzizAbdulkareem
Retrievedon:28July2016
European Journal of Scientific Research
ISSN 1450-216X / 1450-202X Vol. 130 No 1 March, 2015, pp.160 - 168
http://www.europeanjournalofscientificresearch.com
Characterization of Oil / Gas Flow Pattern in Vertical Pipes
using Electrical Capacitance Tomography
Lokman A Abdulkareem
Corresponding Author: Department of Petroleum Engineering
University of Zakho, Zakho city, P O Box 12, Northern Iraq
Email: [email protected]
Tel: 009647504570194
B.J. Azzopardi
Department of Chemical and Environmental Engineering
Faculty of Engineering, University of Nottingham
University Park, Nottingham NG7 2RD, U.K
Sarbast A Hamid
Duhok Polytechnic University, Zakho Technical Institute
Petroleum Department, Zakho City Northern Iraq
M Abdulkahdir
Department of Chemical Engineering
Federal University of Technology,PMB 65, Minna, Nigeria
Abstract
Electrical Capacitance Tomography provides the opportunity to visualize the
contents of a process of many applications such as pipeline and obtain information on the
flow configuration. Multiphase flow is an extremely complex field of fluid mechanics; the
characteristics of the operations of many equipment in different areas of industry such as
oil and power generation are determined by the nature of flow of two phase or multiphase.
In this study, a twin plane Electrical capacitance tomography (ECT) electrode was
designed, fabricated and used to image and characterize oil/gas flow in 67 mm pipe. The
experiments were carried out in inclinable facility in the Department of Chemical
Engineering at Nottingham University, UK. Conditions used are gas superficial velocities
of 0.05 to 5.52 m/s and liquid superficial velocities of 0 to 0.54 m/s. The cross-section
averaged void fraction and its variation in time were measured using electrical capacitance
tomography. Also, Probability Density Functions are demonstrated and the structure
velocity of flow is presented as well. In this project, Bubbly, slug, and churn flow
configurations was observed. In addition, high speed video images of flow were obtained
simultaneously and compared with tomographic images of the ECT system.
Keywords: Main subjects: Electrical Capacitance Tomography, Void Fraction,
Probability Density Function
Characterization of Oil / Gas Flow Pattern in Vertical Pipes using
Electrical Capacitance Tomography 161
1. Introduction Research in the field of multiphase flow is of high importance from engineering and economical point
of view to improve safety, reliability, sustainability, efficiency and significant decreasing maintenance
frequency of multiphase flow application; for example the petroleum and chemical industry Azzopardi
(2006). Hence, as stated, multiphase flow study has become a very important topic to industry. Most of
the work in this field began by using non-tomographic techniques in vertical flow. Identification of two
phase flow patterns have been studied by a number of researchers such as Wallis (1969), Spedding and
Kang (1982), Mishima and Ishii (1984), Hewitt and Hall-Taylor (1970), McQuillan and Whalley
(1985), Bilicki and Kersten (1985) and Azzopardi (2006).This has provided considerable amount of
knowledge about the behaviour of multiphase flow in these particular situations. However, no
complete description of the structure of two-phase flow has been achieved. The literature review
reveals that enormous amount of work has been done to predict the distribution of the phase about the
flow; but, few work has been reported regarding tomographic techniques, in past few years; some of
tomographic techniques and sensors such as x-ray tomography, magnetic imagine, ultrasonic system
electrical tomography etc. have been used to make graphical representations of cross-sectional flows
and have successfully developed into powerful instruments for study flow configurations, Gamio et al.
(2005); he showed that the ECT offers a non intrusive efficient technique for imagine mixtures of
electrically non conducting substances, going on further to state; it is the most promising application
for visualization of gas-liquid flows. Hasan et al (2007) showed that ECT can also show great
capability for visualization of two–phase liquid-liquid flows. More recently, Szalinsky et al. (2010)
have reported insightful detail of two-phase flow applying advanced instrumentation on different gas-
liquid mixtures, for vertical flow. Abdulahi et al. (2011) reported data for two-phase flow
characteristics at 10 degrees from both horizontal and vertical, while Abdulkareem at al. (2011)
reported data for inclined for the whole range of inclination angles. Also, recently L A Abdulkareem et
al (2013) has successfully used ECT for identification flow pattern in inclined risers. This paper brings
together insightful data for different two phase flow parameters, such as void faction, structure velocity
and frequency using tomographic technique; which is electrical capacitance tomography.
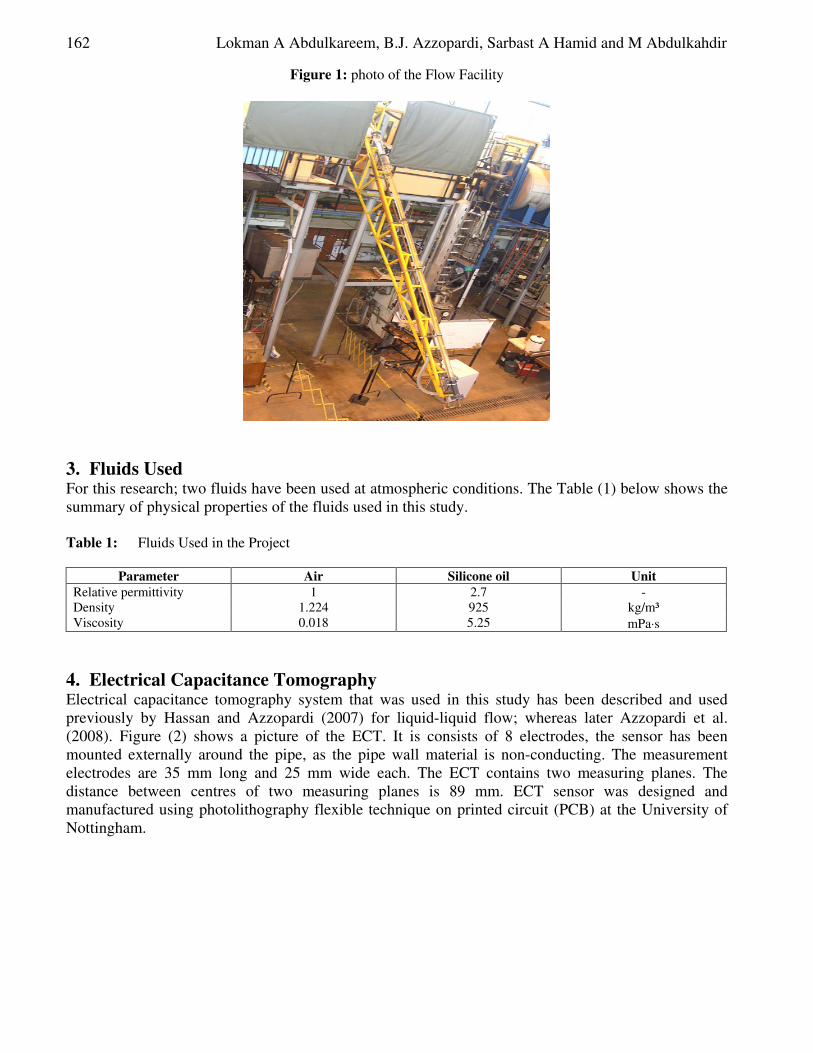
2. Flow Facility All experiments were conducted in inclinable facility at the University of Nottingham / UK.
Previously, many researchers in multiphase flow field have carried out their experiments and studies in
this facility L A Abdulkareem et al (2013), (2011), (2011), Geraci et al. (2007) and Hernandez Perez et
al. (2008), Thiele et al. (2008). Figure (1) shows the photo of the rig consists of an inclinable 6 m long
and 67 mm internal diameter. For this work the pipe was mounted vertically. The fluids used were air
and silicone oil. The liquid was taken from liquid storage tank, and air was taken from compressor. The
conditions and the range of the gas and liquid superficial velocity were selected very carefully in order
to produce bubbly, slug and churn flow patterns. The outlet of the pipe is connected to a cyclone
separator where air is released to atmosphere and the liquid is returned into the storage tank.
162 Lokman A Abdulkareem, B.J. Azzopardi, Sarbast A Hamid and M Abdulkahdir
Figure 1: photo of the Flow Facility
3. Fluids Used For this research; two fluids have been used at atmospheric conditions. The Table (1) below shows the
summary of physical properties of the fluids used in this study.
Table 1: Fluids Used in the Project
Parameter Air Silicone oil Unit
Relative permittivity 1 2.7 -
Density 1.224 925 kg/m³
Viscosity 0.018 5.25 mPa⋅s
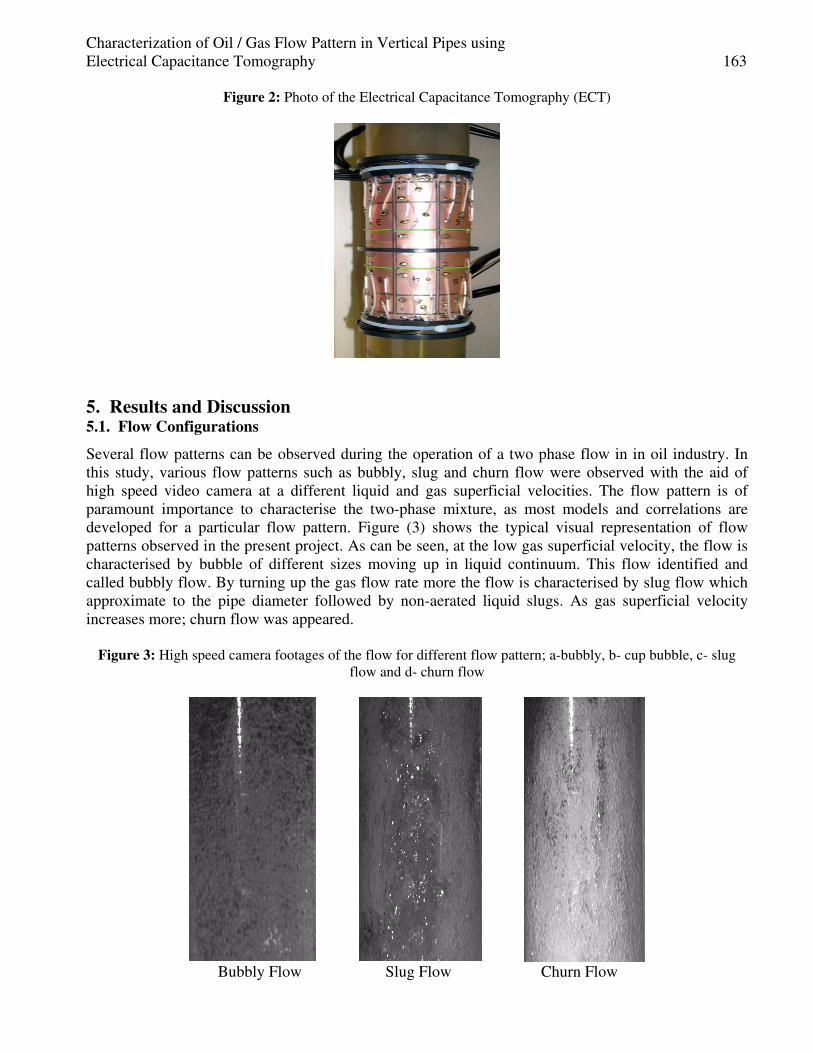
4. Electrical Capacitance Tomography Electrical capacitance tomography system that was used in this study has been described and used
previously by Hassan and Azzopardi (2007) for liquid-liquid flow; whereas later Azzopardi et al.
(2008). Figure (2) shows a picture of the ECT. It is consists of 8 electrodes, the sensor has been
mounted externally around the pipe, as the pipe wall material is non-conducting. The measurement
electrodes are 35 mm long and 25 mm wide each. The ECT contains two measuring planes. The
distance between centres of two measuring planes is 89 mm. ECT sensor was designed and
manufactured using photolithography flexible technique on printed circuit (PCB) at the University of
Nottingham.
Characterization of Oil / Gas Flow Pattern in Vertical Pipes using
Electrical Capacitance Tomography 163
Figure 2: Photo of the Electrical Capacitance Tomography (ECT)
5. Results and Discussion 5.1. Flow Configurations
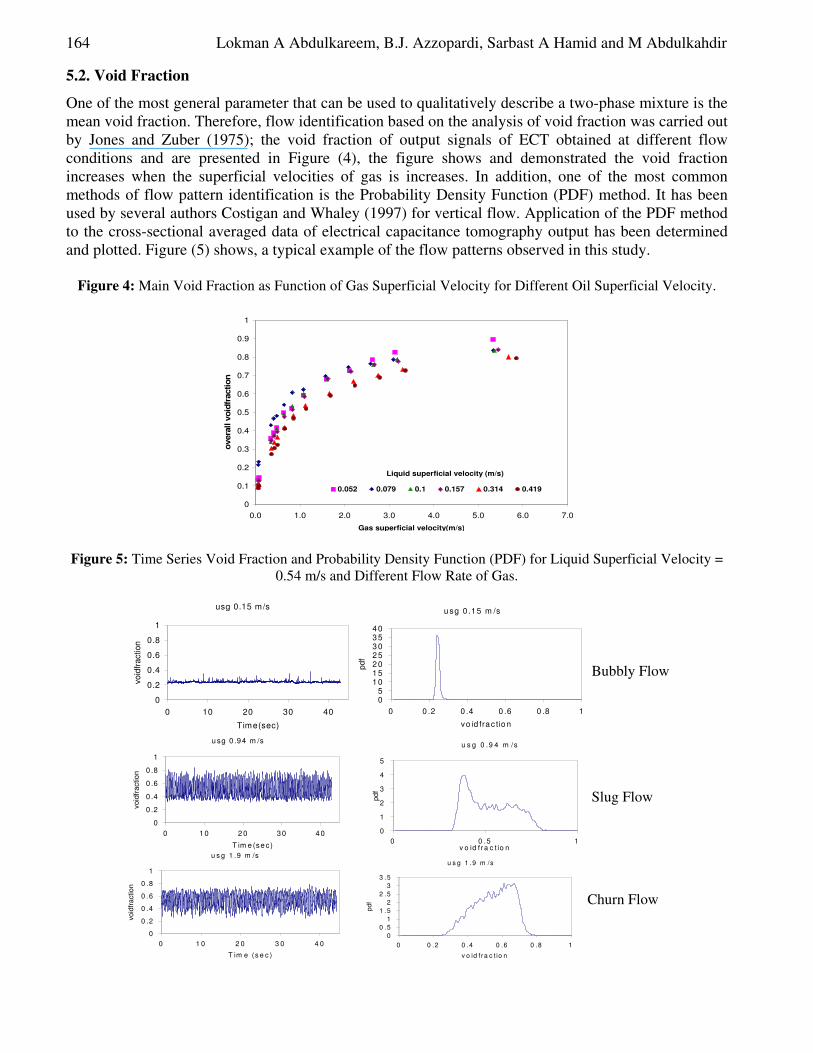
Several flow patterns can be observed during the operation of a two phase flow in in oil industry. In
this study, various flow patterns such as bubbly, slug and churn flow were observed with the aid of
high speed video camera at a different liquid and gas superficial velocities. The flow pattern is of
paramount importance to characterise the two-phase mixture, as most models and correlations are
developed for a particular flow pattern. Figure (3) shows the typical visual representation of flow
patterns observed in the present project. As can be seen, at the low gas superficial velocity, the flow is
characterised by bubble of different sizes moving up in liquid continuum. This flow identified and
called bubbly flow. By turning up the gas flow rate more the flow is characterised by slug flow which
approximate to the pipe diameter followed by non-aerated liquid slugs. As gas superficial velocity
increases more; churn flow was appeared.
Figure 3: High speed camera footages of the flow for different flow pattern; a-bubbly, b- cup bubble, c- slug
flow and d- churn flow
Bubbly Flow Slug Flow Churn Flow
164 Lokman A Abdulkareem, B.J. Azzopardi, Sarbast A Hamid and M Abdulkahdir
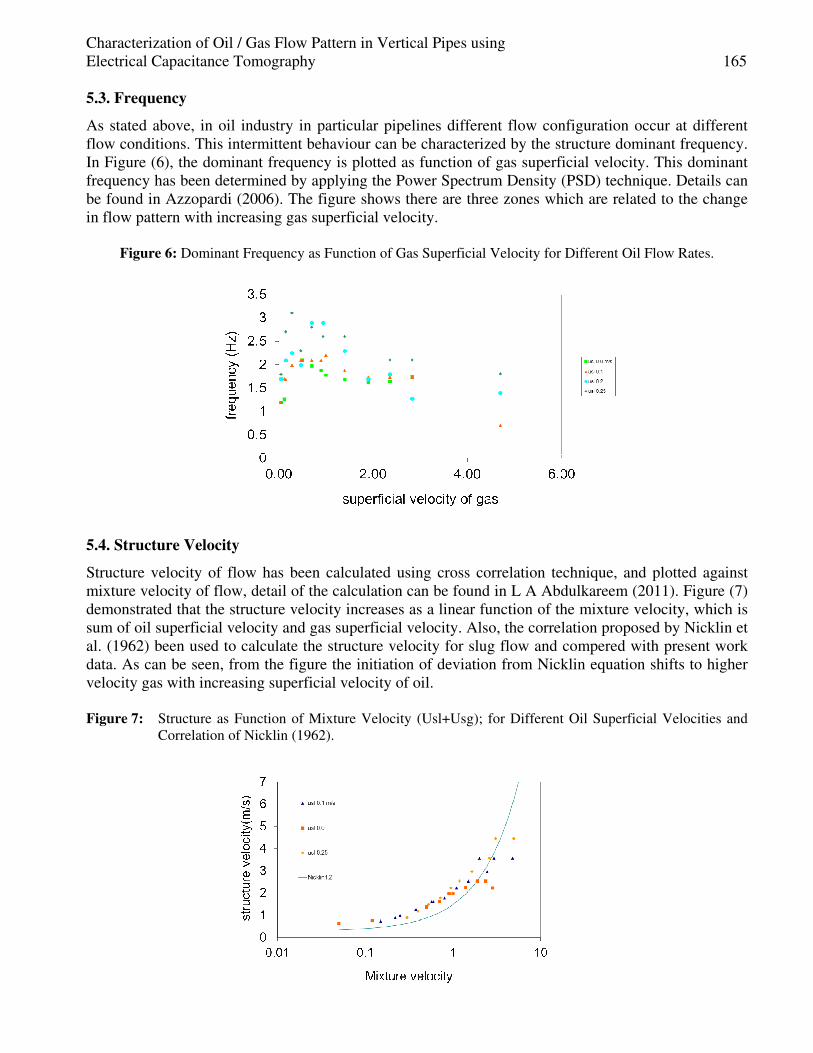
5.2. Void Fraction
One of the most general parameter that can be used to qualitatively describe a two-phase mixture is the
mean void fraction. Therefore, flow identification based on the analysis of void fraction was carried out
by Jones and Zuber (1975); the void fraction of output signals of ECT obtained at different flow
conditions and are presented in Figure (4), the figure shows and demonstrated the void fraction
increases when the superficial velocities of gas is increases. In addition, one of the most common
methods of flow pattern identification is the Probability Density Function (PDF) method. It has been
used by several authors Costigan and Whaley (1997) for vertical flow. Application of the PDF method
to the cross-sectional averaged data of electrical capacitance tomography output has been determined
and plotted. Figure (5) shows, a typical example of the flow patterns observed in this study.
Figure 4: Main Void Fraction as Function of Gas Superficial Velocity for Different Oil Superficial Velocity.
0
0.1
0.2
0.3
0.4
0.5
0.6
0.7
0.8
0.9
1
0.0 1.0 2.0 3.0 4.0 5.0 6.0 7.0
Gas superficial velocity(m/s)
overa
ll v
oid
fraction
0.052 0.079 0.1 0.157 0.314 0.419
Liquid superficial velocity (m/s)
Figure 5: Time Series Void Fraction and Probability Density Function (PDF) for Liquid Superficial Velocity =
0.54 m/s and Different Flow Rate of Gas.
u s g 1 .9 m /s
0
0 .5
1
1 .5
2
2 .5
3
3 .5
0 0 .2 0 .4 0 .6 0 .8 1
v o id f ra c t io n
u sg 0 .15 m /s
05
1 01 52 02 53 03 54 0
0 0 .2 0 .4 0 .6 0 .8 1
vo id frac tio n
pd
f
usg 0.15 m/s
0
0.2
0.4
0.6
0.8
1
0 10 20 30 40
Time(sec)
vo
idfr
action
u s g 1 .9 m /s
0
0 .2
0 .4
0 .6
0 .8
1
0 1 0 2 0 3 0 4 0
T im e (s e c )
vo
idfr
actio
n
u s g 0 .9 4 m /s
0
1
2
3
4
5
0 0 .5 1v o id f r a c t io n
pd
f
u sg 0 .94 m /s
0
0 .2
0 .4
0 .6
0 .8
1
0 1 0 2 0 30 40
T im e (sec )
void
fractio
n
Churn Flow
Slug Flow
Bubbly Flow
Characterization of Oil / Gas Flow Pattern in Vertical Pipes using
Electrical Capacitance Tomography 165
5.3. Frequency
As stated above, in oil industry in particular pipelines different flow configuration occur at different
flow conditions. This intermittent behaviour can be characterized by the structure dominant frequency.
In Figure (6), the dominant frequency is plotted as function of gas superficial velocity. This dominant
frequency has been determined by applying the Power Spectrum Density (PSD) technique. Details can
be found in Azzopardi (2006). The figure shows there are three zones which are related to the change
in flow pattern with increasing gas superficial velocity.
Figure 6: Dominant Frequency as Function of Gas Superficial Velocity for Different Oil Flow Rates.
5.4. Structure Velocity
Structure velocity of flow has been calculated using cross correlation technique, and plotted against
mixture velocity of flow, detail of the calculation can be found in L A Abdulkareem (2011). Figure (7)
demonstrated that the structure velocity increases as a linear function of the mixture velocity, which is
sum of oil superficial velocity and gas superficial velocity. Also, the correlation proposed by Nicklin et
al. (1962) been used to calculate the structure velocity for slug flow and compered with present work
data. As can be seen, from the figure the initiation of deviation from Nicklin equation shifts to higher
velocity gas with increasing superficial velocity of oil.
Figure 7: Structure as Function of Mixture Velocity (Usl+Usg); for Different Oil Superficial Velocities and
Correlation of Nicklin (1962).
166 Lokman A Abdulkareem, B.J. Azzopardi, Sarbast A Hamid and M Abdulkahdir
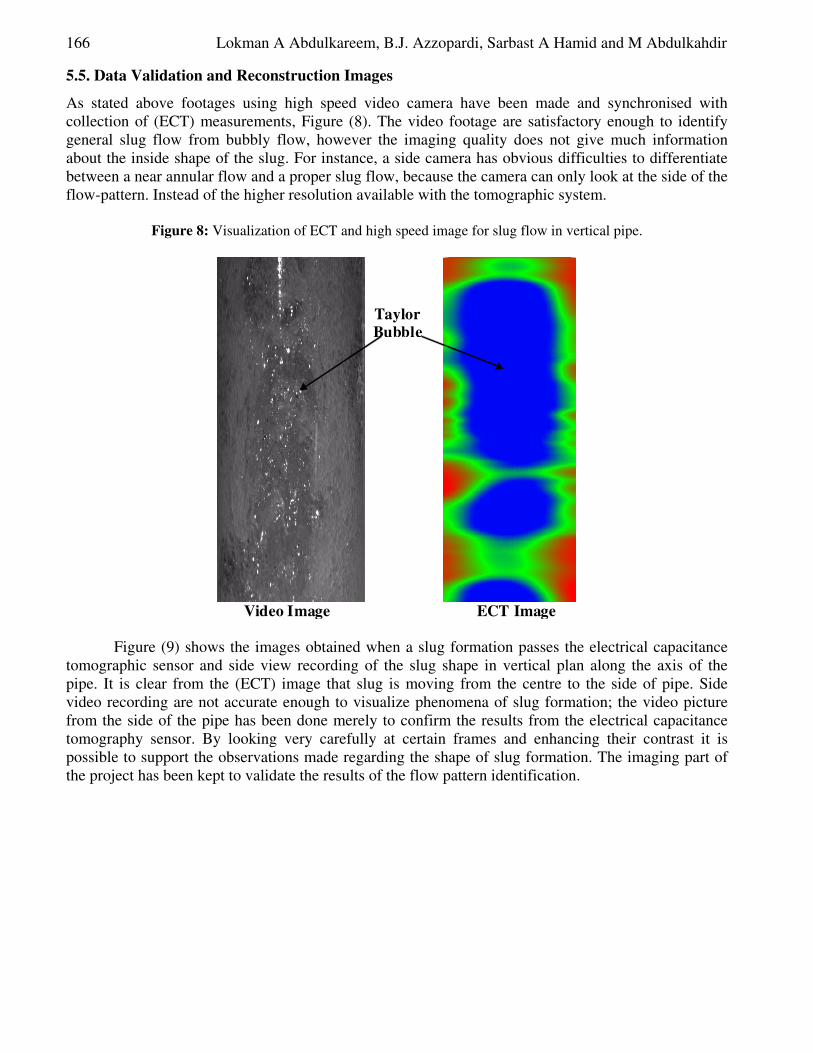
5.5. Data Validation and Reconstruction Images
As stated above footages using high speed video camera have been made and synchronised with
collection of (ECT) measurements, Figure (8). The video footage are satisfactory enough to identify
general slug flow from bubbly flow, however the imaging quality does not give much information
about the inside shape of the slug. For instance, a side camera has obvious difficulties to differentiate
between a near annular flow and a proper slug flow, because the camera can only look at the side of the
flow-pattern. Instead of the higher resolution available with the tomographic system.
Figure 8: Visualization of ECT and high speed image for slug flow in vertical pipe.
ECT Image Video Image
Taylor
Bubble
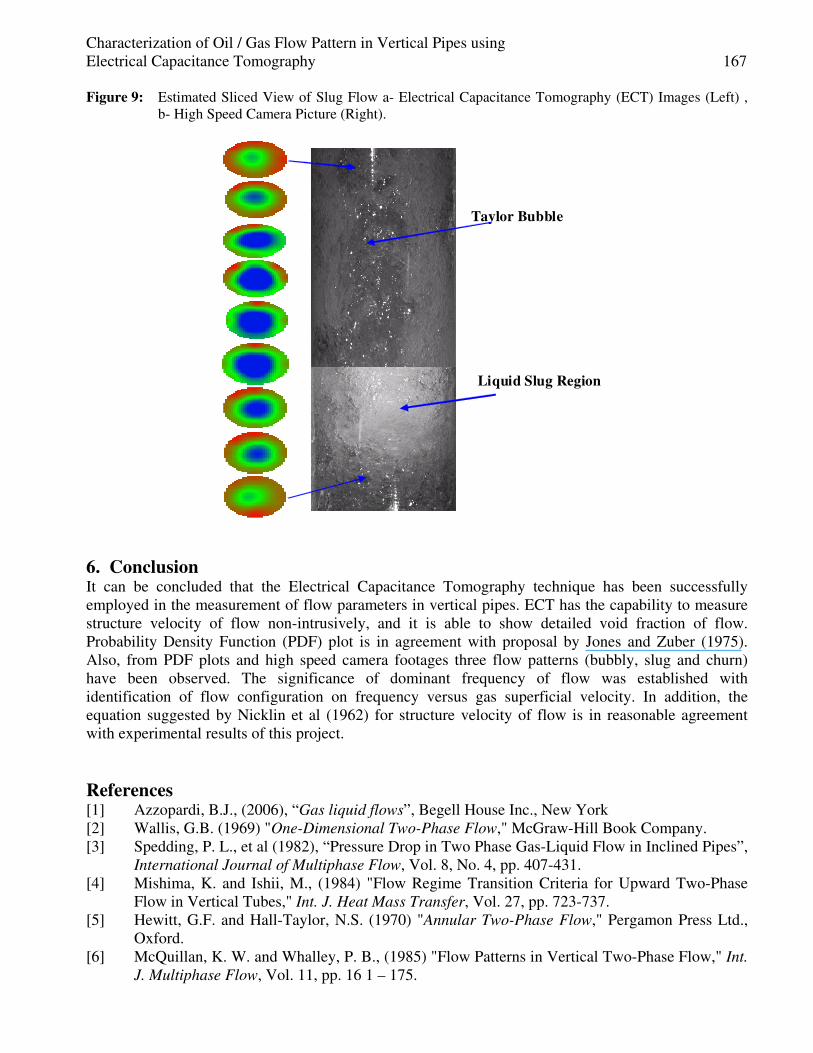
Figure (9) shows the images obtained when a slug formation passes the electrical capacitance
tomographic sensor and side view recording of the slug shape in vertical plan along the axis of the
pipe. It is clear from the (ECT) image that slug is moving from the centre to the side of pipe. Side
video recording are not accurate enough to visualize phenomena of slug formation; the video picture
from the side of the pipe has been done merely to confirm the results from the electrical capacitance
tomography sensor. By looking very carefully at certain frames and enhancing their contrast it is
possible to support the observations made regarding the shape of slug formation. The imaging part of
the project has been kept to validate the results of the flow pattern identification.
Characterization of Oil / Gas Flow Pattern in Vertical Pipes using
Electrical Capacitance Tomography 167
Figure 9: Estimated Sliced View of Slug Flow a- Electrical Capacitance Tomography (ECT) Images (Left) ,
b- High Speed Camera Picture (Right).
Liquid Slug Region
Taylor Bubble
6. Conclusion It can be concluded that the Electrical Capacitance Tomography technique has been successfully
employed in the measurement of flow parameters in vertical pipes. ECT has the capability to measure
structure velocity of flow non-intrusively, and it is able to show detailed void fraction of flow.
Probability Density Function (PDF) plot is in agreement with proposal by Jones and Zuber (1975).
Also, from PDF plots and high speed camera footages three flow patterns (bubbly, slug and churn)
have been observed. The significance of dominant frequency of flow was established with
identification of flow configuration on frequency versus gas superficial velocity. In addition, the
equation suggested by Nicklin et al (1962) for structure velocity of flow is in reasonable agreement
with experimental results of this project.
References [1] Azzopardi, B.J., (2006), “Gas liquid flows”, Begell House Inc., New York
[2] Wallis, G.B. (1969) "One-Dimensional Two-Phase Flow," McGraw-Hill Book Company.
[3] Spedding, P. L., et al (1982), “Pressure Drop in Two Phase Gas-Liquid Flow in Inclined Pipes”,
International Journal of Multiphase Flow, Vol. 8, No. 4, pp. 407-431.
[4] Mishima, K. and Ishii, M., (1984) "Flow Regime Transition Criteria for Upward Two-Phase
Flow in Vertical Tubes," Int. J. Heat Mass Transfer, Vol. 27, pp. 723-737.
[5] Hewitt, G.F. and Hall-Taylor, N.S. (1970) "Annular Two-Phase Flow," Pergamon Press Ltd.,
Oxford.
[6] McQuillan, K. W. and Whalley, P. B., (1985) "Flow Patterns in Vertical Two-Phase Flow," Int.
J. Multiphase Flow, Vol. 11, pp. 16 1 – 175.
168 Lokman A Abdulkareem, B.J. Azzopardi, Sarbast A Hamid and M Abdulkahdir
[7] Bilicki, Z. and Kerstin, J. (1985), “Transition Criteria for Two-Phase Flow Patterns in Vertical
Upward Flow”, International Journal of Multiphase Flow, Vol. 13, No. 3, pp. 283-294.
[8] Gamio, J. C., et al (2005), “Visualisation of Gas-Oil Two-Phase Flows in Pressurised Pipes
using Electrical Capacitance Tomography”, Flow Measurement and Instrumentation, Vol. 16,
pp. 129 134.
[9] Hasan, N.M. & Azzopardi, B.J. (2007) ‘Imaging stratifying liquid-liquid flow by capacitance
tomography’ Flow Meas. Instr. Vol. 18, 241-246.
[10] Szalinski, L, Abdulkareem, L.A., Da Silva, M.J., Thiele, S., Beyer, M., Lucas, D., Hernandez
Perez, V., Azzopardi, B.J., Hampel, U. (2010) ‘Comparative study of gas-oil and gas-water
two-phase flow in a vertical pipe’ Chem. Eng. Sci. Vol. 65, 3836-3848.
[11] Abdulahi, A., Abdulkareem, L. A., Sharaf, S., Abdulkadir, M., Hernandez Perez, V. &
Azzopardi, B.J. (2011) ‘investigating the effect of pipe inclination on two-phase gas-liquid
flows using advanced instrumentation, Proceedings of the ASME / JSME 8th Thermal
Engineering Joint conference, March 13-17, Honolulu, Hawaii, USA, AJTEC2011- 44239;
[12] L A Abdulkareem (2011), “Tomographic investigation of gas-oil Flow in Inclined riser”, Ph.D.
Thesis, The University of Nottingham, UK.
[13] L.A. Abdulkareem1 and B.J. Azzopardi2 A. Hunt (2013) ‘Tomographic Investigation of Gas-
Oil Flow in Inclined Pipes’ proceeding of 8th Intel Conf.on Multiphase Flow (ICMF 2013),
Jeju, Korea.
[14] Abdulkareem, L. A., Hernandez-Perez, V., Sharaf, S. and Azzopardi, B.J., (2011)
‘Characteristics of Air-Oil Slug Flow in Inclined Pipe Using Tomographic Techniques’
Proceedings of the ASME / JSME 8th Thermal Engineering Joint conference, March 13-17,
Honolulu, Hawaii, USA, AJTEC2011-44546.
[15] Geraci G., Azzopardi, B.J. & van Maanen H. R. E., (2007), ‘Effect of inclination on circumferential
film thickness variation in annular gas/liquid flow’ Chem. Eng. Sci. 62, 3032-3042.
[16] Hernandez Perez, V., (2008), “Gas-Liquid Two-Phase Flow in Inclined Pipes”, Ph.D. Thesis,
The University of Nottingham, UK.
[17] Thiele, S., et al (2008) “High-Resolution Oil-Gas Two-Phase Flow Measurement with a New
Capacitance Wire-Mesh Tomography” 5th International Symposium on Process Tomography
in Poland, Zakopane.
[18] B. J. Azzopardi, K. Jackson, J.P. Robinson, R. Kaji, M. Byars, A. Hunt, (2008) ‘Fluctuations in
dense phase pneumatic conveying of pulverised coal measured using electrical capacitance
tomography,Chemical Engineering Science, Vol. 63, pp 2548-2558.
[19] Jones, Jr. O. C. & Zuber, N., (1975), The interrelation between void fraction fluctuations and
flow pattern in two-phase flow. Int. J. Multiphase Flow, Vol. 2, 273-306.
[20] Costigan, G. & Whalley, P. B. (1997) ‘Slug flow regime identification from dynamic void fraction
measurements in vertical air-water flows’ Int. J. Multiphase Flow, Vol. 23, pp. 263-282.
[21] Nicklin, O. J., Wilkes, J. O. & Davidson, J. F. (1962) ‘Two-phase flow in vertical tubes’ Trans.
Inst. Chem. Engrs. Vol. 40, 61-68.