Embed Size (px)
Citation preview
HP GlancePlus User's Manual
(for MPE/iX Systems)
ABCDE
HP Part No. B1787-90001
Printed in U.S.A. 0492
Edition 2
E0492
Notice
Hewlett-Packard makes no warranty of any kind with regard to this material,including, but not limited to, the implied warranties of merchantability and�tness for a particular purpose. Hewlett-Packard shall not be liable for errorscontained herein or for incidental or consequential damages in connection withthe furnishing, performance, or use of this material.
Hewlett-Packard assumes no responsibility for the use or reliability of itssoftware on equipment that is not furnished by Hewlett-Packard.
c Copyright 1992, Hewlett-Packard Company.
This document contains proprietary information, which is protected bycopyright. All rights are reserved. No part of this document may bephotocopied, reproduced, or translated to another language without the priorwritten consent of Hewlett-Packard Company. The information contained inthis document is subject to change without notice.
Microsoft R , MS-DOS R , and WindowsTM are U.S. registered trademarks ofMicrosoft Corporation.
Hewlett-Packard CompanySWT/Software Technology Center8010 Foothills BoulevardRoseville, CA 95678 U.S.A.
Printing History
Updates are new editions or complete revisions of the manual.
A software code may be printed before the date; this indicates the version levelof the software product at the time the manual was issued. Many productupdates and �xes do not require manual changes and, conversely, manualcorrections may be done without accompanying product changes. Therefore, donot expect a one-to-one correspondence between product updates and manualupdates.
Edition 1 6/90 B1787-90001 E0690
Edition 2 4/92 B1787-90001 E0492
iii
Conventions
Capitalization Capitalized �rst letters signify HP GlancePluscommands, screen names, screen sections, function keys,company names, and product names.
Computer Font Computer font represents screen text, includingprompts and messages that appear on the screen, andcharacters or words that you are prompted to enter onthe screen.
Italics Italics are used to emphasize words, phrases, orcharacters in the text, or in syntax strings, to indicatevariables.
UPPERCASE Words in all uppercase (capitals) represent program�elds and system commands that should be enteredexactly as shown.
�Return� or �Enter� Depending on your keyboard, one or the otherrepresents the terminal key used to execute a command.
Notice MPE/iX, Multiprogramming Executive with Integrated POSIX,is the latest in a series of forward-compatible operating systemsfor the HP 3000 line of Hewlett-Packard computers.
MPE/iX is a superset of its direct predecessor MPE XL, andall programs written for MPE XL will run under MPE/iXwithout change. Also, you can continue to use MPE XL systemdocumentation, although it may not refer to features addedto the operating system to support POSIX (for example,hierarchical directories).
You may encounter references to MPE V, the operating systemfor HP 3000s that are not based on the PA-RISC architecture.MPE V software can be run on PA-RISC HP 3000s (series 900)in compatibility mode.
iv
Contents
1. IntroductionWhat HP GlancePlus Can Do For You . . . . . . . . . . . 1-1How You Can Use HP GlancePlus . . . . . . . . . . . . . 1-2Will You Need Other Performance Tools? . . . . . . . . . . 1-2How to Use This Manual . . . . . . . . . . . . . . . . . . 1-3
2. InstallationSystem Requirements . . . . . . . . . . . . . . . . . . . 2-1Terminal and PC Requirements . . . . . . . . . . . . . . . 2-1Installing HP GlancePlus . . . . . . . . . . . . . . . . . 2-2Group Capabilities . . . . . . . . . . . . . . . . . . . 2-2Group Access . . . . . . . . . . . . . . . . . . . . . . 2-2Installing the Program . . . . . . . . . . . . . . . . . . 2-2
3. Getting StartedOverview . . . . . . . . . . . . . . . . . . . . . . . . 3-1Running HP GlancePlus for MPE/iX . . . . . . . . . . . . 3-1Exiting HP GlancePlus . . . . . . . . . . . . . . . . . . 3-2More Than a Look|The HP GlancePlus Global Screen . . . . 3-2Reading the Screen Display . . . . . . . . . . . . . . . . 3-3Banner Line . . . . . . . . . . . . . . . . . . . . . . 3-3Global Bars . . . . . . . . . . . . . . . . . . . . . . 3-3CPU Bar . . . . . . . . . . . . . . . . . . . . . . 3-4Disc Bar . . . . . . . . . . . . . . . . . . . . . . . 3-5Memory Bar . . . . . . . . . . . . . . . . . . . . . 3-6Percentage Columns . . . . . . . . . . . . . . . . . . 3-7
Detail Display . . . . . . . . . . . . . . . . . . . . . 3-8HP GlancePlus Function Keys and Commands . . . . . . . . 3-9Online Expert Assistance for Understanding Performance Data . 3-12Help Facility (H) . . . . . . . . . . . . . . . . . . . . . 3-13
Contents-1
Printing a Screen . . . . . . . . . . . . . . . . . . . . . 3-14Setting Process Thresholds . . . . . . . . . . . . . . . . . 3-15
4. Commands: Additional InformationOverview . . . . . . . . . . . . . . . . . . . . . . . . 4-1Selecting Jobs, Sessions, and Processes (>, J, S, P, #) . . . . 4-1MPE Command (:) . . . . . . . . . . . . . . . . . . . 4-2Refresh Screen (R) . . . . . . . . . . . . . . . . . . . 4-2All Processes (A) . . . . . . . . . . . . . . . . . . . . 4-2Change Queue (Q) . . . . . . . . . . . . . . . . . . . 4-3List Users of a File (U) . . . . . . . . . . . . . . . . . 4-3Zero Averages (Z) . . . . . . . . . . . . . . . . . . . . 4-4Previous Display (<) . . . . . . . . . . . . . . . . . . 4-4Next Logical Display (>) . . . . . . . . . . . . . . . . 4-4Ninety-second Timeout on Command Prompts . . . . . . . 4-4
5. Screen Metrics and StatisticsGlobal Screen . . . . . . . . . . . . . . . . . . . . . . 5-2Interesting Processes . . . . . . . . . . . . . . . . . . 5-2Interesting Process Components . . . . . . . . . . . . . 5-4
Job/Session Screen . . . . . . . . . . . . . . . . . . . . 5-7Job/Session Bars and Summary Fields . . . . . . . . . . . 5-8Interesting Processes . . . . . . . . . . . . . . . . . . 5-10Interesting Process Components . . . . . . . . . . . . . 5-11
Process Screen . . . . . . . . . . . . . . . . . . . . . . 5-13Process Bars . . . . . . . . . . . . . . . . . . . . . . 5-14Process Summary Fields . . . . . . . . . . . . . . . . . 5-15Process State Bars . . . . . . . . . . . . . . . . . . . 5-16STATE (Components of Response Time) . . . . . . . . . 5-16LAST (Components of Response Time) . . . . . . . . . 5-17
Miscellaneous Process Information . . . . . . . . . . . . 5-17Process Screen Function Keys . . . . . . . . . . . . . . 5-19Setting Option Values (V) . . . . . . . . . . . . . . . . 5-19Simple File Display . . . . . . . . . . . . . . . . . . 5-21Detailed File Display . . . . . . . . . . . . . . . . . 5-21
Filter Selection Menu Variables . . . . . . . . . . . . . . . 5-26Filter Display Screen . . . . . . . . . . . . . . . . . . . 5-29Filter Bars . . . . . . . . . . . . . . . . . . . . . . . 5-30
Contents-2
CPU Bar . . . . . . . . . . . . . . . . . . . . . . 5-30Disc Bar . . . . . . . . . . . . . . . . . . . . . . . 5-30
Summary Fields . . . . . . . . . . . . . . . . . . . . 5-31Filter Processes . . . . . . . . . . . . . . . . . . . . . 5-32
Workload Screen . . . . . . . . . . . . . . . . . . . . . 5-34Interesting Applications . . . . . . . . . . . . . . . . . 5-34Interesting Application Fields . . . . . . . . . . . . . . 5-35Top CPU and Disc Consumer . . . . . . . . . . . . . . 5-36
CPU Detail Screen . . . . . . . . . . . . . . . . . . . . 5-37Type of Utilization . . . . . . . . . . . . . . . . . . . 5-38Queue Distribution . . . . . . . . . . . . . . . . . . . 5-39Miscellaneous Performance Metrics . . . . . . . . . . . . 5-39Top CPU Consumer . . . . . . . . . . . . . . . . . . . 5-43
Disc Detail Screen . . . . . . . . . . . . . . . . . . . . 5-44Individual Disc Utilization . . . . . . . . . . . . . . . . 5-45Summary Disc Utilization . . . . . . . . . . . . . . . . 5-46Top Disc Consumer . . . . . . . . . . . . . . . . . . . 5-46
Memory Detail Screen . . . . . . . . . . . . . . . . . . . 5-47Fault Types . . . . . . . . . . . . . . . . . . . . . . 5-48Miscellaneous . . . . . . . . . . . . . . . . . . . . . . 5-49
6. The Expert FacilityInvoking The Expert Facility . . . . . . . . . . . . . . . . 6-3What Does The Expert Facility Do? . . . . . . . . . . . . . 6-3Recommendations For Using The Expert Facility . . . . . . . 6-7Changing The Expert Facility's Rules . . . . . . . . . . . . 6-8
7. Customizing HP GlancePlusCustomizing Startup . . . . . . . . . . . . . . . . . . . 7-1Refresh Time . . . . . . . . . . . . . . . . . . . . . . 7-1Selecting the Initial Screen . . . . . . . . . . . . . . . . 7-1
Customizing GlancePlus Global Bars . . . . . . . . . . . . 7-2Global CPU Bar . . . . . . . . . . . . . . . . . . . . 7-2Global Memory Bar . . . . . . . . . . . . . . . . . . . 7-3
Customizing Con�guration . . . . . . . . . . . . . . . . . 7-4Interesting Process Thresholds . . . . . . . . . . . . . . . 7-7Display Control Parameters . . . . . . . . . . . . . . . . 7-11The Expert Parameters . . . . . . . . . . . . . . . . . . 7-13
Contents-3
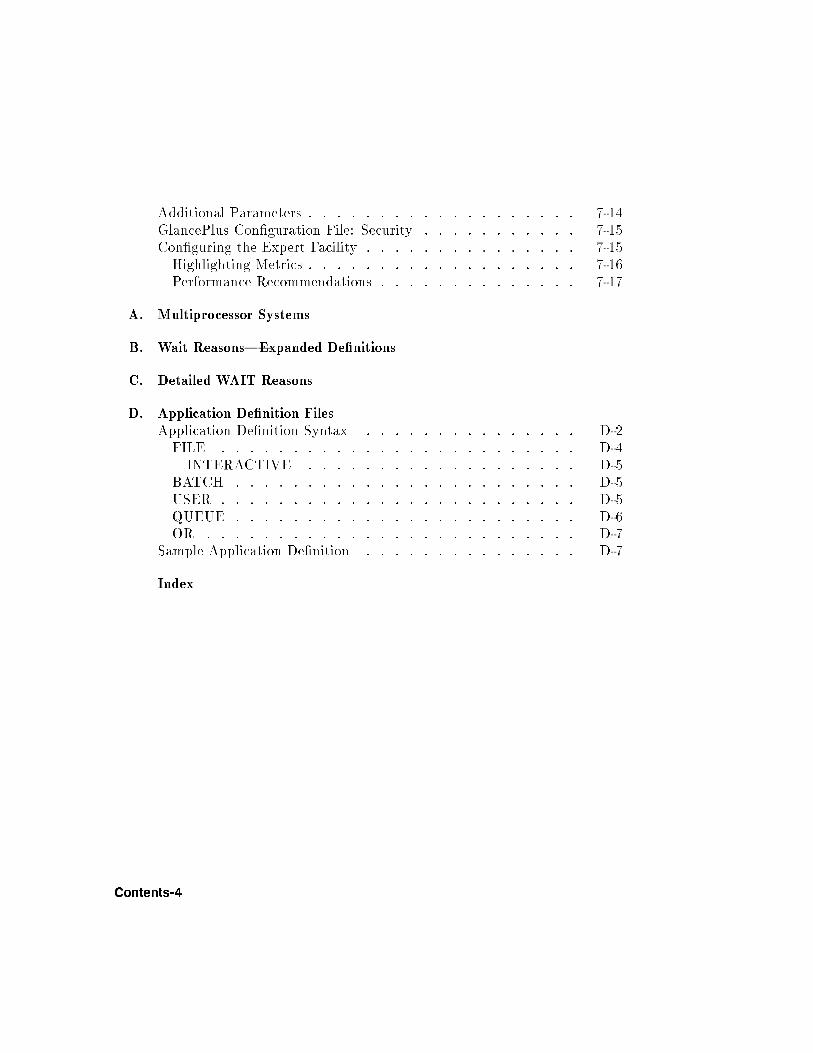
Additional Parameters . . . . . . . . . . . . . . . . . . . 7-14GlancePlus Con�guration File: Security . . . . . . . . . . . 7-15Con�guring the Expert Facility . . . . . . . . . . . . . . . 7-15Highlighting Metrics . . . . . . . . . . . . . . . . . . . 7-16Performance Recommendations . . . . . . . . . . . . . . 7-17
A. Multiprocessor Systems
B. Wait Reasons|Expanded De�nitions
C. Detailed WAIT Reasons
D. Application De�nition FilesApplication De�nition Syntax . . . . . . . . . . . . . . . D-2FILE . . . . . . . . . . . . . . . . . . . . . . . . . D-4INTERACTIVE . . . . . . . . . . . . . . . . . . . D-5
BATCH . . . . . . . . . . . . . . . . . . . . . . . . D-5USER . . . . . . . . . . . . . . . . . . . . . . . . . D-5QUEUE . . . . . . . . . . . . . . . . . . . . . . . . D-6OR . . . . . . . . . . . . . . . . . . . . . . . . . . D-7
Sample Application De�nition . . . . . . . . . . . . . . . D-7
Index
Contents-4
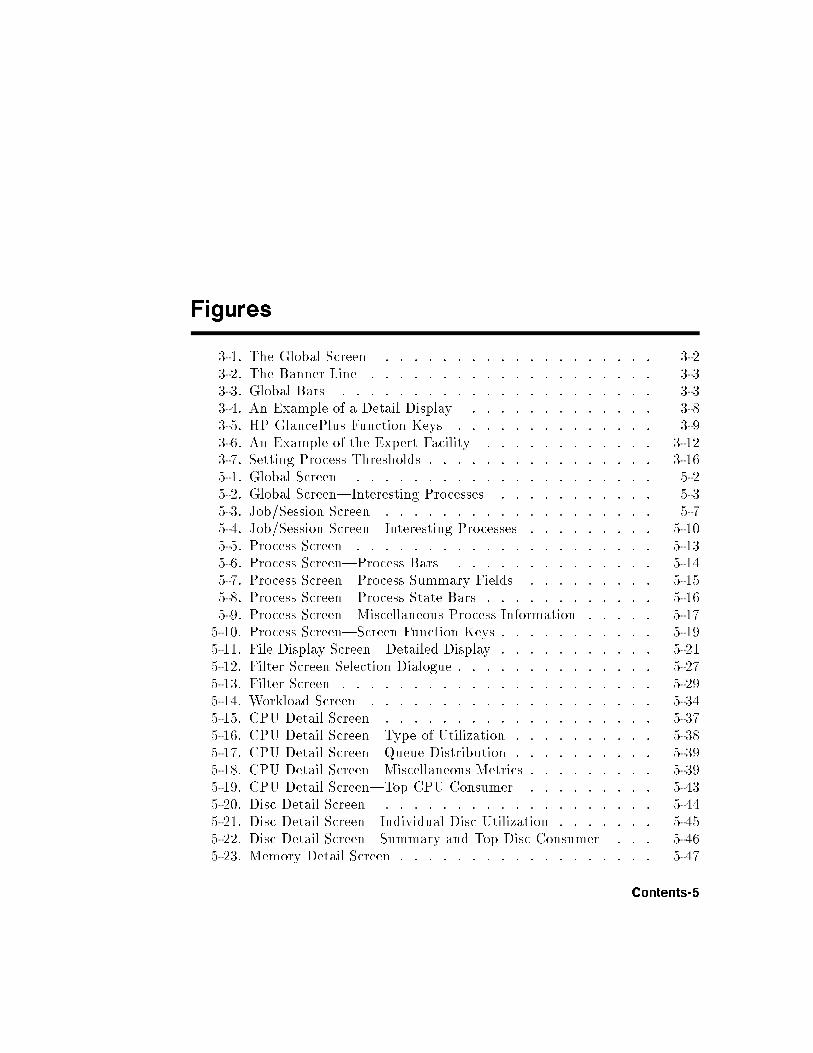
Figures
3-1. The Global Screen . . . . . . . . . . . . . . . . . . . 3-23-2. The Banner Line . . . . . . . . . . . . . . . . . . . . 3-33-3. Global Bars . . . . . . . . . . . . . . . . . . . . . . 3-33-4. An Example of a Detail Display . . . . . . . . . . . . . 3-83-5. HP GlancePlus Function Keys . . . . . . . . . . . . . . 3-93-6. An Example of the Expert Facility . . . . . . . . . . . . 3-123-7. Setting Process Thresholds . . . . . . . . . . . . . . . . 3-165-1. Global Screen . . . . . . . . . . . . . . . . . . . . . 5-25-2. Global Screen|Interesting Processes . . . . . . . . . . . 5-35-3. Job/Session Screen . . . . . . . . . . . . . . . . . . . 5-75-4. Job/Session Screen|Interesting Processes . . . . . . . . . 5-105-5. Process Screen . . . . . . . . . . . . . . . . . . . . . 5-135-6. Process Screen|Process Bars . . . . . . . . . . . . . . 5-145-7. Process Screen|Process Summary Fields . . . . . . . . . 5-155-8. Process Screen|Process State Bars . . . . . . . . . . . . 5-165-9. Process Screen|Miscellaneous Process Information . . . . . 5-175-10. Process Screen|Screen Function Keys . . . . . . . . . . . 5-195-11. File Display Screen|Detailed Display . . . . . . . . . . . 5-215-12. Filter Screen Selection Dialogue . . . . . . . . . . . . . . 5-275-13. Filter Screen . . . . . . . . . . . . . . . . . . . . . . 5-295-14. Workload Screen . . . . . . . . . . . . . . . . . . . . 5-345-15. CPU Detail Screen . . . . . . . . . . . . . . . . . . . 5-375-16. CPU Detail Screen|Type of Utilization . . . . . . . . . . 5-385-17. CPU Detail Screen|Queue Distribution . . . . . . . . . . 5-395-18. CPU Detail Screen|Miscellaneous Metrics . . . . . . . . . 5-395-19. CPU Detail Screen|Top CPU Consumer . . . . . . . . . 5-435-20. Disc Detail Screen . . . . . . . . . . . . . . . . . . . 5-445-21. Disc Detail Screen|Individual Disc Utilization . . . . . . . 5-455-22. Disc Detail Screen|Summary and Top Disc Consumer . . . 5-465-23. Memory Detail Screen . . . . . . . . . . . . . . . . . . 5-47
Contents-5
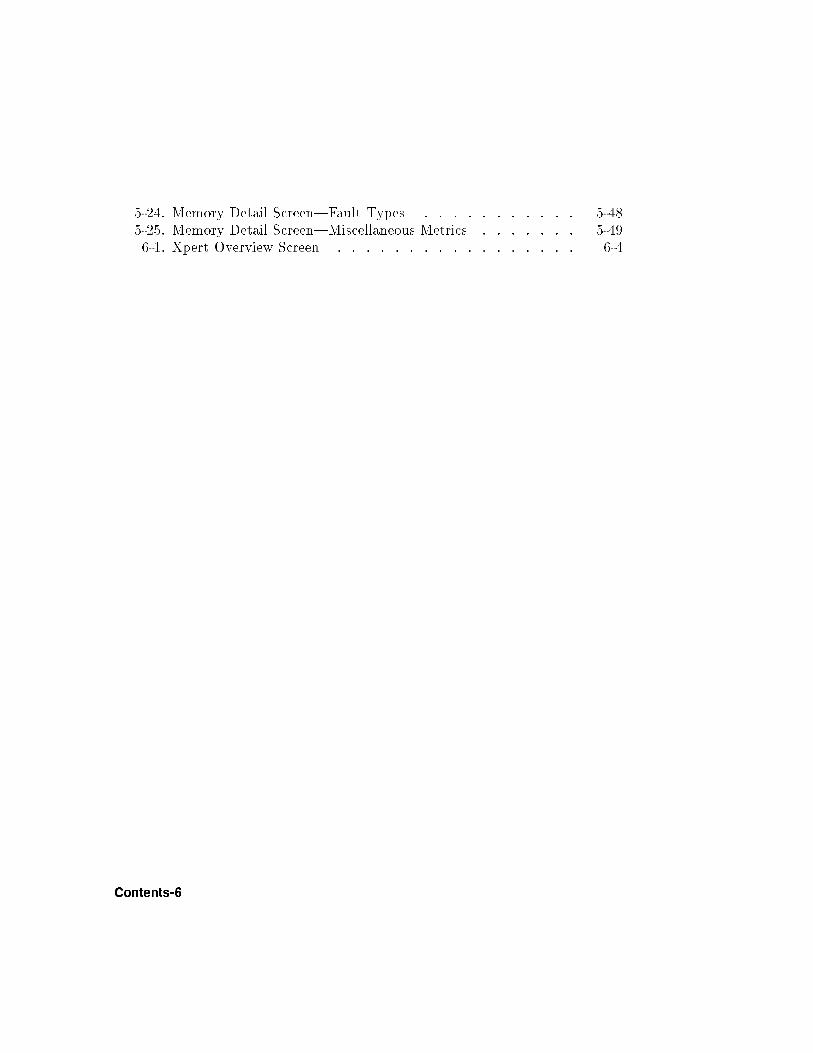
5-24. Memory Detail Screen|Fault Types . . . . . . . . . . . 5-485-25. Memory Detail Screen|Miscellaneous Metrics . . . . . . . 5-496-1. Xpert Overview Screen . . . . . . . . . . . . . . . . . 6-4
Contents-6
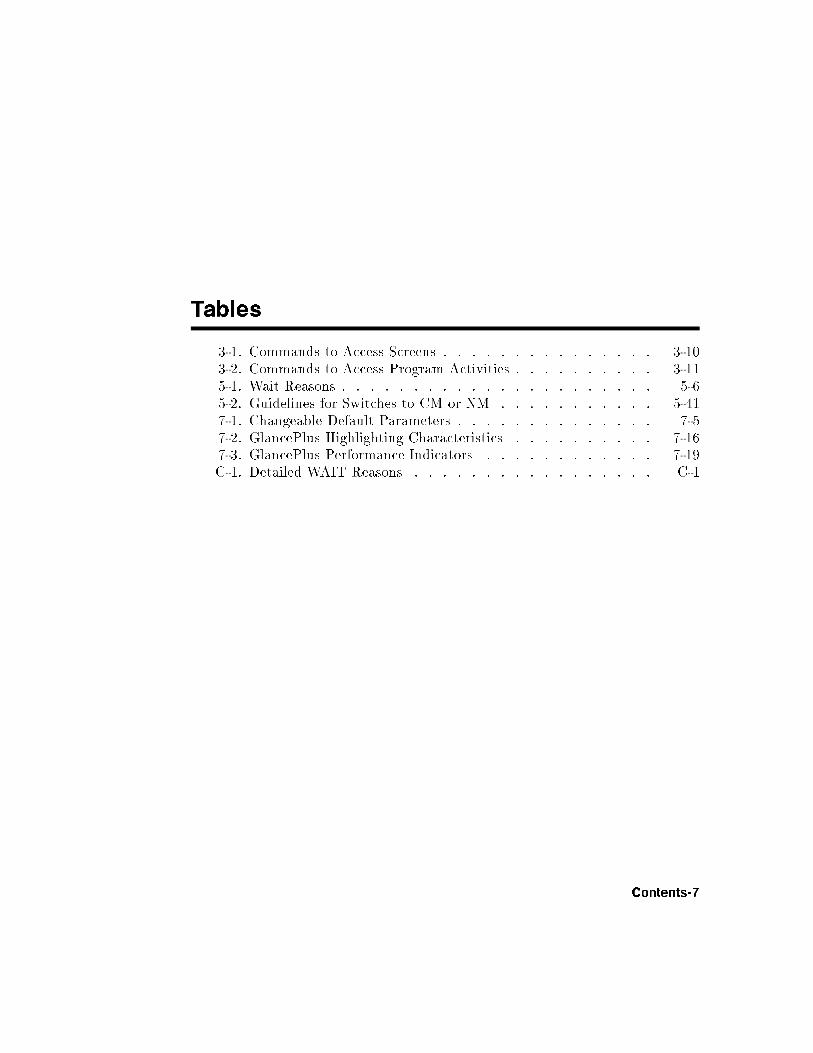
Tables
3-1. Commands to Access Screens . . . . . . . . . . . . . . . 3-103-2. Commands to Access Program Activities . . . . . . . . . . 3-115-1. Wait Reasons . . . . . . . . . . . . . . . . . . . . . . 5-65-2. Guidelines for Switches to CM or NM . . . . . . . . . . . 5-417-1. Changeable Default Parameters . . . . . . . . . . . . . . 7-57-2. GlancePlus Highlighting Characteristics . . . . . . . . . . 7-167-3. GlancePlus Performance Indicators . . . . . . . . . . . . 7-19C-1. Detailed WAIT Reasons . . . . . . . . . . . . . . . . . C-1
Contents-7

1
Introduction
HP GlancePlus for MPE/iX is an online diagnostic tool that you can use tomonitor system activity and troubleshoot system performance problems.
What HP GlancePlus Can Do For You
HP GlancePlus is easy to install, easy to run, and easy to use. You don't haveto spend time on complicated set-up procedures or training. Anyone can useHP GlancePlus e�ectively from day one.
HP GlancePlus is powerful. It gives you a complete picture, highlightingprocesses that are starved for resources and those using resources.
HP GlancePlus gives you expert assistance. It uses a comprehensive set ofrules developed by performance specialists to alert you whenever a possibleperformance problem arises.
HP GlancePlus is exible. You can customize the software to display andhighlight the data that is most important to you and your system. You won'thave to wade through unnecessary data when dealing with a problem. Forexample, you can easily set thresholds so the Global activity screen displaysonly processes that exceed your de�ned limits.
HP GlancePlus provides data at the level of detail you need. You can go fromdisplaying simple, graphical global data, to displaying technical data, todisplaying detailed process data. By letting you \zoom in" on the data youneed, you won't be overwhelmed with too much or too little data at one time.
HP GlancePlus provides an extensive online help facility developed byperformance experts . Any help you might need to use the product is right atyour �ngertips.
Introduction 1-1
How You Can Use HP GlancePlus
You can use HP GlancePlus:
As a diagnostic tool to identify immediate performance problems.
You can easily �nd out who or what is slowing your system and identifyparticular programs or applications that are CPU or I/O \hogs".
As a monitoring tool to learn about your system.
By routinely checking system activity you can document typical performancelevels and characterize typical system loads. This can make it much easier toidentify unusual performance or potential problems. Having this knowledgeof typical system performance can even help you avoid potential problemswith your systems.
Will You Need Other Performance Tools?
HP GlancePlus is only one member of a family of performance productso�ered by Hewlett-Packard. If you need to go beyond immediate performancemonitoring, you may wish to consider other members of this family:
HP GlancePlus Pak for MPE/iX combines GlancePlus with the ability to logdata for analysis by programs on the HP 3000 or by spreadsheet packages ona personal computer.
HP LaserRX/MPE logs data similar to HP GlancePlus Pak for MPE/iXbut also contains a powerful performance data analysis tool. It organizesand categorizes raw performance data into easy-to-use Microsoft R
WindowsTM-based graphs and charts that can be displayed on a PC. You usea highly e�cient hierarchical approach to analysis, looking at data from theglobal to detail level.
HP RXForecast/MPE forecasts future resource utilization based onactual past history. This tool helps you plan future resource requirementsand can help you avoid periods of insu�cient resources. (It requires HPLaserRX/MPE as a companion program.)
HP SPT/XL helps you optimize native mode programs.
1-2 Introduction
How to Use This Manual
This manual will help you get maximum value from HP GlancePlus.Depending on your needs and previous experience, you can consult thefollowing chapters for speci�c information:
Chapter 2 for information on installing HP GlancePlus.
Chapter 3 for information on the general features of the program.
Chapter 4 for additional information on commands.
Chapter 5 to learn about the statistics appearing on each screen.
Chapter 6 to �nd out about the Expert facility.
Chapter 7 for information on customizing HP GlancePlus.
The appendixes contain additional information, such as expanded de�nitions ofwait reasons.
HP GlancePlus also provides online help information as discussed in chapter 3.This online help information is context sensitive and can be accessed using the\H" command.
Introduction 1-3

2
Installation
System Requirements
HP GlancePlus for MPE/iX can be used on any HP 3000 PrecisionArchitecture system using the MPE/XL operating system, version 2.1 (orlater), or the MPE/iX operating system.
Terminal and PC Requirements
HP GlancePlus runs on the following terminals and personal computers:
HP Vectra personal computer (running HP-compatible terminal-emulationsoftware).HP 150 personal computer.HP 700/9x family.HP 239x family.HP 262x family.
Installation 2-1
Installing HP GlancePlus
Installing GlancePlus is a simple process. It involves placing the appropriate�les in a group with the necessary capabilities.
Group Capabilities
HP GlancePlus should be placed in a group that allows all system users easyaccess to the program. Normally this group is PUB.SYS.
The group must have the following capabilities:
Interactive access (IA).
Process handling (PH).
Extra data segments (DS).
Privileged mode (PM).
Group Access
A user must have read, lock, and execute access to the GlancePlus �lesbefore running it. Since GlancePlus is usually installed in PUB.SYS, all userstypically would have the required access.
Installing the Program
Usually, HP GlancePlus is installed automatically through the MPE/iXAUTOINST process.
To customize the use of GlancePlus, activate the GlancePlus UDC(user-de�ned command) �le as follows:
Move the user-de�ned command GLANCE from the GLANUDCX �le to thedesired UDC �le and activate it.
orActivate the HP GlancePlus UDC �le and type the following:
:SETCATALOG GLANUDCX
2-2 Installation
3
Getting Started
Overview
This chapter shows you how easy it is to use the HP GlancePlus program. Youwill learn how to run the program, display a screen, move to other screens, gethelp, print screens, exit the program, and use the single-letter commands toinvoke GlancePlus's various tasks.
Running HP GlancePlus for MPE/iX
To execute the program,
Type:
:GLANCEXL.PUB.SYS
If you have activated the HP GlancePlus UDC �le, type:
:GLANCE
When you become familiar with GlancePlus, you may want to customizethe GlancePlus startup procedure. Chapter 7 contains information oncustomizing the GlancePlus startup procedure.
Getting Started 3-1
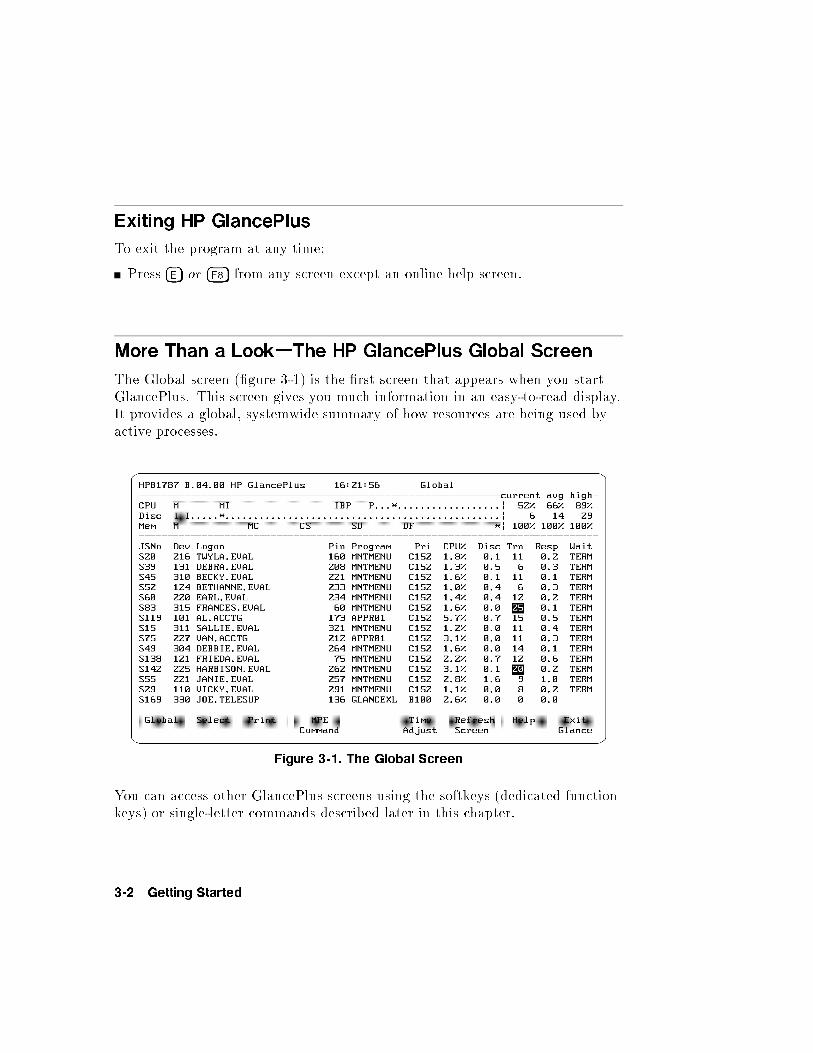
Exiting HP GlancePlus
To exit the program at any time:
Press �E� or �F8� from any screen except an online help screen.
More Than a Look|The HP GlancePlus Global Screen
The Global screen (�gure 3-1) is the �rst screen that appears when you startGlancePlus. This screen gives you much information in an easy-to-read display.It provides a global, systemwide summary of how resources are being used byactive processes.
Figure 3-1. The Global Screen
You can access other GlancePlus screens using the softkeys (dedicated functionkeys) or single-letter commands described later in this chapter.
3-2 Getting Started
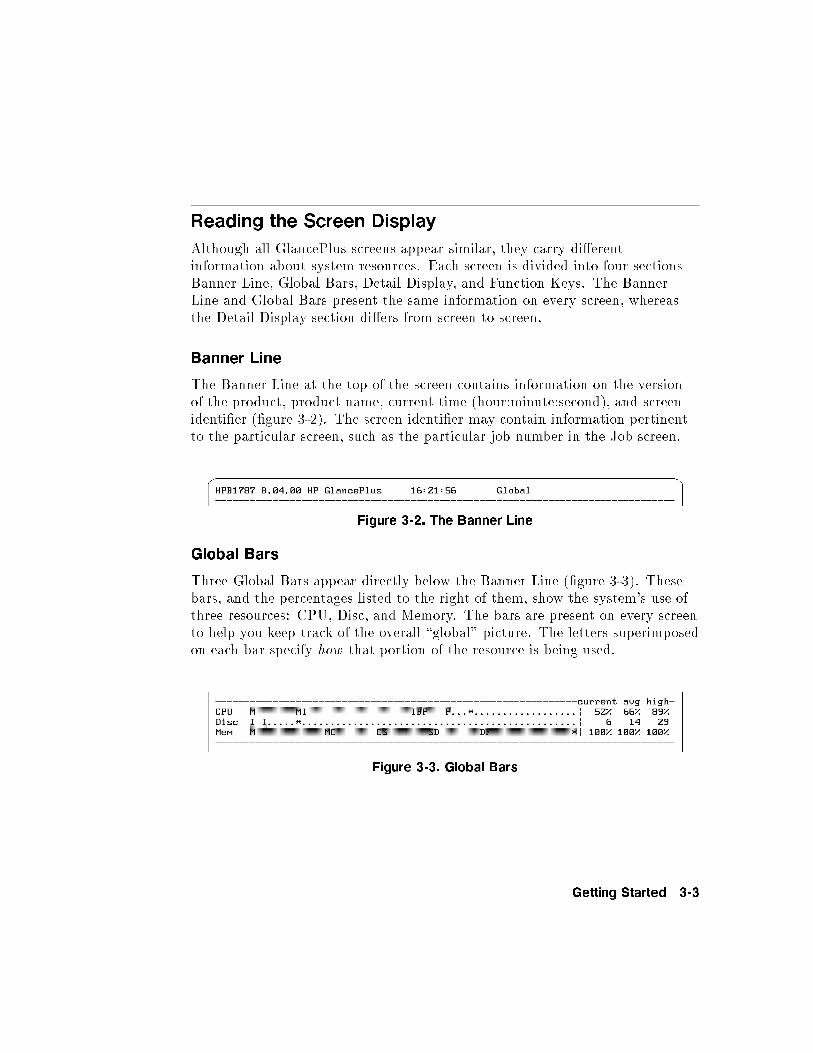
Reading the Screen Display
Although all GlancePlus screens appear similar, they carry di�erentinformation about system resources. Each screen is divided into four sections|Banner Line, Global Bars, Detail Display, and Function Keys. The BannerLine and Global Bars present the same information on every screen, whereasthe Detail Display section di�ers from screen to screen.
Banner Line
The Banner Line at the top of the screen contains information on the versionof the product, product name, current time (hour:minute:second), and screenidenti�er (�gure 3-2). The screen identi�er may contain information pertinentto the particular screen, such as the particular job number in the Job screen.
Figure 3-2. The Banner Line
Global Bars
Three Global Bars appear directly below the Banner Line (�gure 3-3). Thesebars, and the percentages listed to the right of them, show the system's use ofthree resources: CPU, Disc, and Memory. The bars are present on every screento help you keep track of the overall \global" picture. The letters superimposedon each bar specify how that portion of the resource is being used.
Figure 3-3. Global Bars
Getting Started 3-3
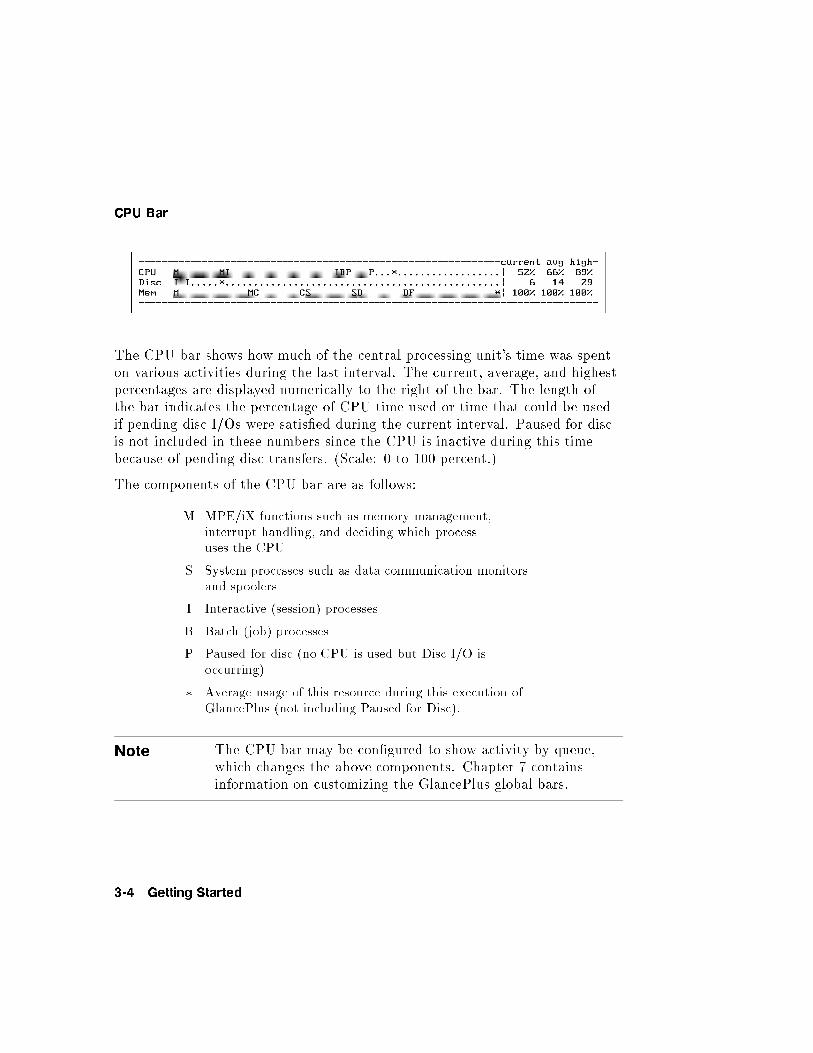
CPU Bar
The CPU bar shows how much of the central processing unit's time was spenton various activities during the last interval. The current, average, and highestpercentages are displayed numerically to the right of the bar. The length ofthe bar indicates the percentage of CPU time used or time that could be usedif pending disc I/Os were satis�ed during the current interval. Paused for discis not included in these numbers since the CPU is inactive during this timebecause of pending disc transfers. (Scale: 0 to 100 percent.)
The components of the CPU bar are as follows:
M MPE/iX functions such as memory management,interrupt handling, and deciding which processuses the CPU
S System processes such as data communication monitorsand spoolers
I Interactive (session) processes
B Batch (job) processes
P Paused for disc (no CPU is used but Disc I/O isoccurring)
� Average usage of this resource during this execution ofGlancePlus (not including Paused for Disc).
Note The CPU bar may be con�gured to show activity by queue,which changes the above components. Chapter 7 containsinformation on customizing the GlancePlus global bars.
3-4 Getting Started
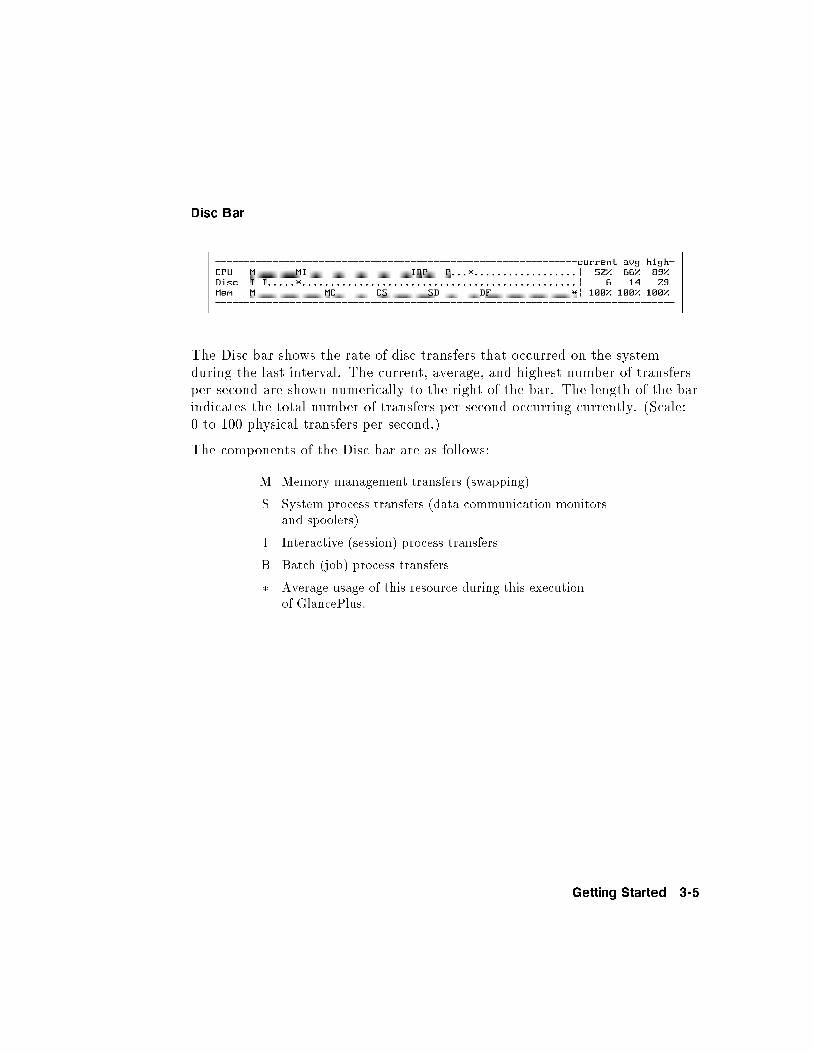
Disc Bar
The Disc bar shows the rate of disc transfers that occurred on the systemduring the last interval. The current, average, and highest number of transfersper second are shown numerically to the right of the bar. The length of the barindicates the total number of transfers per second occurring currently. (Scale:0 to 100 physical transfers per second.)
The components of the Disc bar are as follows:
M Memory management transfers (swapping)
S System process transfers (data communication monitorsand spoolers)
I Interactive (session) process transfers
B Batch (job) process transfers
� Average usage of this resource during this executionof GlancePlus.
Getting Started 3-5
Memory Bar
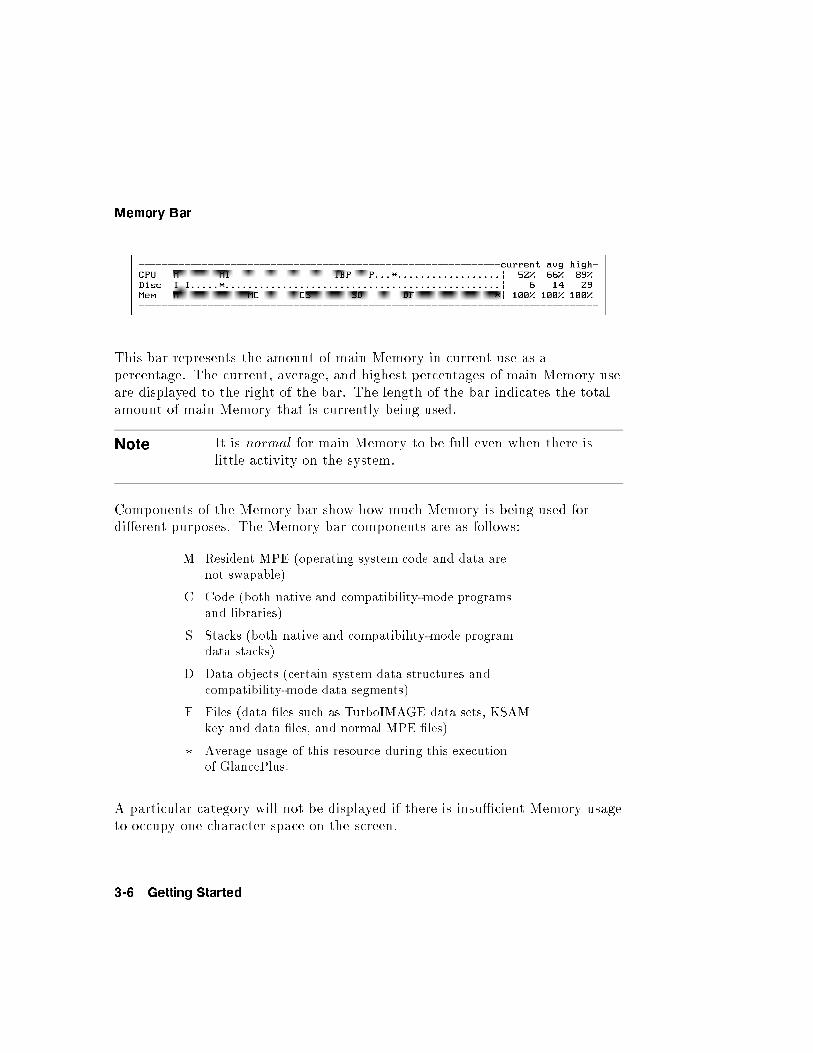
This bar represents the amount of main Memory in current use as apercentage. The current, average, and highest percentages of main Memory useare displayed to the right of the bar. The length of the bar indicates the totalamount of main Memory that is currently being used.
Note It is normal for main Memory to be full even when there islittle activity on the system.
Components of the Memory bar show how much Memory is being used fordi�erent purposes. The Memory bar components are as follows:
M Resident MPE (operating system code and data arenot swapable)
C Code (both native and compatibility-mode programsand libraries)
S Stacks (both native and compatibility-mode programdata stacks)
D Data objects (certain system data structures andcompatibility-mode data segments)
F Files (data �les such as TurboIMAGE data sets, KSAMkey and data �les, and normal MPE �les)
� Average usage of this resource during this executionof GlancePlus.
A particular category will not be displayed if there is insu�cient Memory usageto occupy one character space on the screen.
3-6 Getting Started
Note The Memory bar may be con�gured to show fault rates, whichchanges the above components. Chapter 7 contains informationon customizing the GlancePlus global bars.
Percentage Columns
The percentage columns at the right of the global bars (�gure 3-3) showcurrent, average, and highest use of each system resource. Current valuerepresents use for the current interval. Average is the mean value of all usagedata collected since the present monitoring session began. High value showsthe single highest usage amount of that resource during the monitoring session.
If you reset the statistics to zero with the Zero Averages command (�Z�), thecurrent value will still represent current usage for each interval, but subsequentaverage and high values will represent data collected since the resetting.
Note Upon entry to GlancePlus, the �rst global screen will showGLANCEXL using a high percentage of CPU. This is normalsince the program must take two data samples within a fewseconds of each other in order to display the �rst Global screen.At the default 30-second interval, CPU usage is typically lowand should cause no problems on your system. CPU overheadused by GlancePlus is proportional to the frequency of screenupdate and the number of processes on the system. You cancause excessive CPU overhead by pressing a key every fewseconds.
Getting Started 3-7
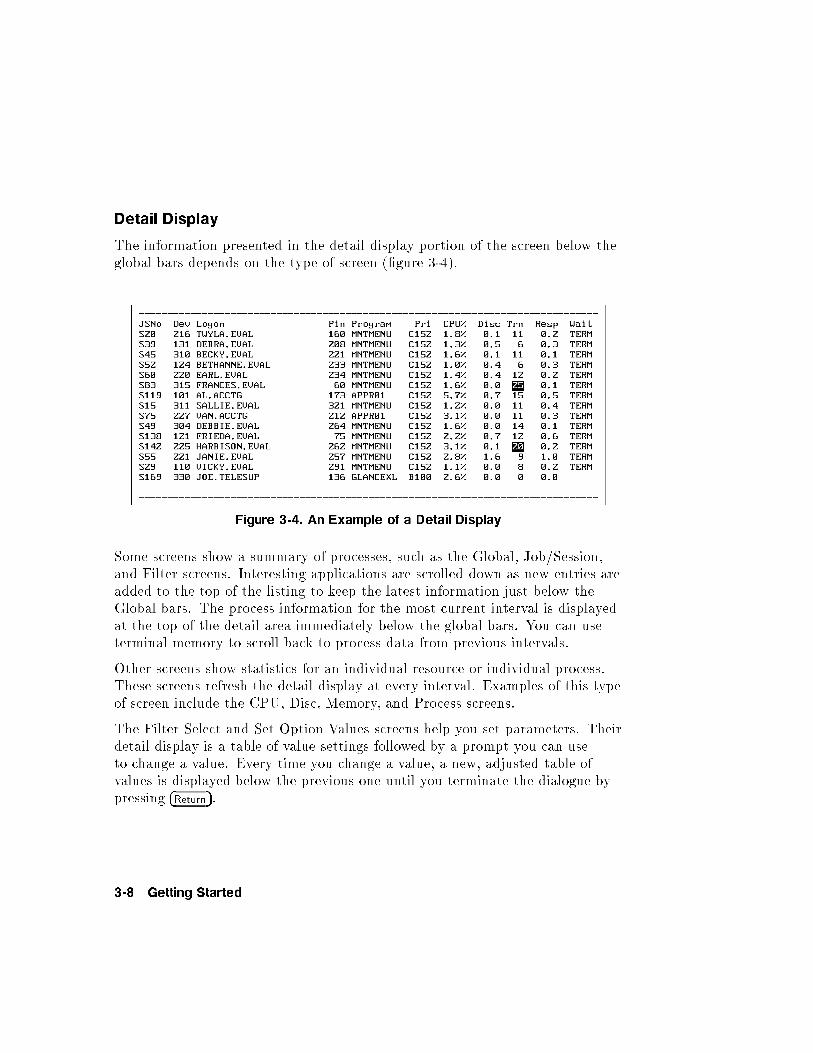
Detail Display
The information presented in the detail display portion of the screen below theglobal bars depends on the type of screen (�gure 3-4).
Figure 3-4. An Example of a Detail Display
Some screens show a summary of processes, such as the Global, Job/Session,and Filter screens. Interesting applications are scrolled down as new entries areadded to the top of the listing to keep the latest information just below theGlobal bars. The process information for the most current interval is displayedat the top of the detail area immediately below the global bars. You can useterminal memory to scroll back to process data from previous intervals.
Other screens show statistics for an individual resource or individual process.These screens refresh the detail display at every interval. Examples of this typeof screen include the CPU, Disc, Memory, and Process screens.
The Filter Select and Set Option Values screens help you set parameters. Theirdetail display is a table of value settings followed by a prompt you can useto change a value. Every time you change a value, a new, adjusted table ofvalues is displayed below the previous one until you terminate the dialogue bypressing �Return�.
3-8 Getting Started
On many systems, it could take several screens full of data to display allcurrently-running processes. Evaluating that much information could beconfusing. To avoid this, GlancePlus lets you limit the processes displayedto those that are interesting to you|processes that surpass predeterminedthreshold-usage values. Interesting processes either use a major portion of thesystem's resources or must wait exceptionally long to use them, and are theprocesses most likely to re ect an existing or potential problem. The procedurefor setting process thresholds is described at the end of this chapter.
The Global screen is the starting point for most performance analysis activity.Other GlancePlus screens are discussed individually in chapter 5.
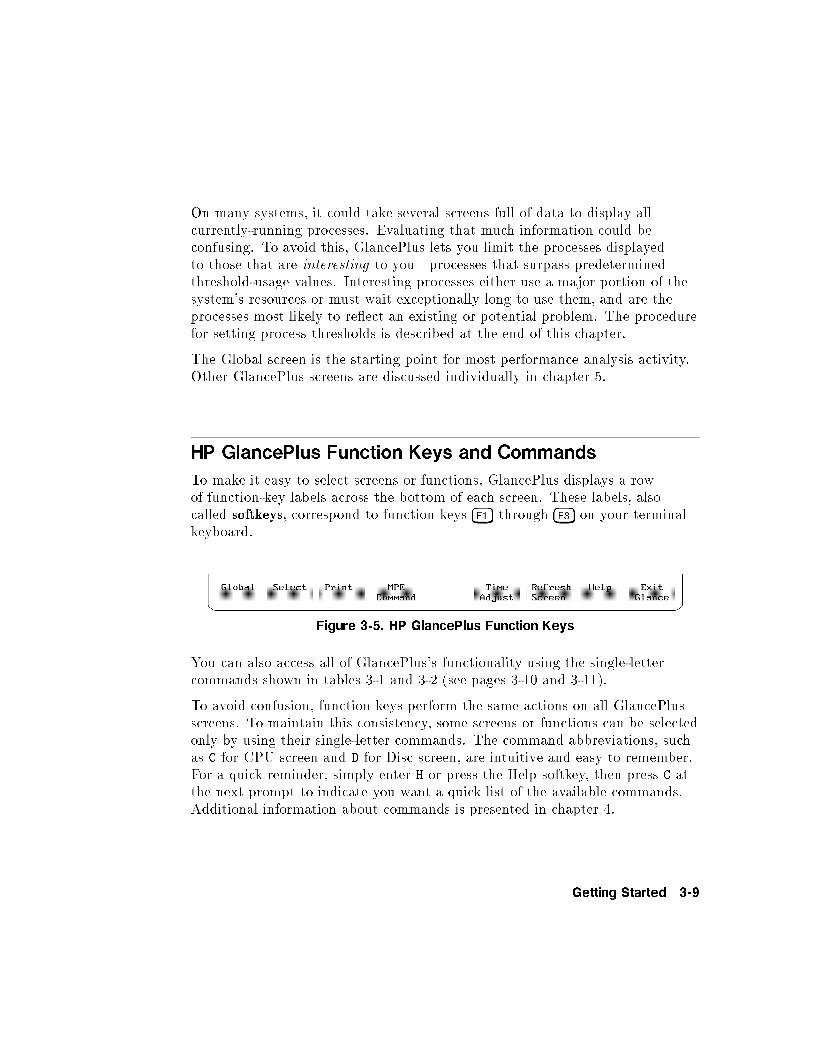
HP GlancePlus Function Keys and Commands
To make it easy to select screens or functions, GlancePlus displays a rowof function-key labels across the bottom of each screen. These labels, alsocalled softkeys, correspond to function keys �F1� through �F8� on your terminalkeyboard.
Figure 3-5. HP GlancePlus Function Keys
You can also access all of GlancePlus's functionality using the single-lettercommands shown in tables 3-1 and 3-2 (see pages 3-10 and 3-11).
To avoid confusion, function keys perform the same actions on all GlancePlusscreens. To maintain this consistency, some screens or functions can be selectedonly by using their single-letter commands. The command abbreviations, suchas C for CPU screen and D for Disc screen, are intuitive and easy to remember.For a quick reminder, simply enter H or press the Help softkey, then press C atthe next prompt to indicate you want a quick list of the available commands.Additional information about commands is presented in chapter 4.
Getting Started 3-9
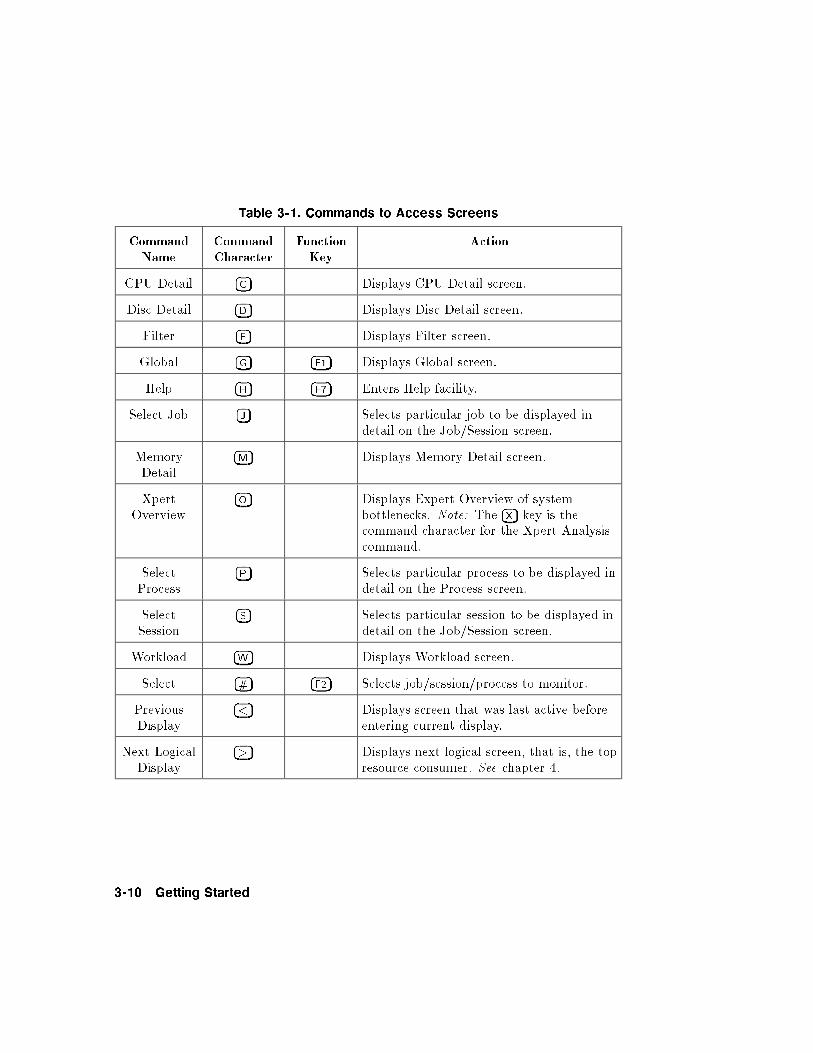
Table 3-1. Commands to Access Screens
CommandName
CommandCharacter
FunctionKey
Action
CPU Detail �C� Displays CPU Detail screen.
Disc Detail �D� Displays Disc Detail screen.
Filter �F� Displays Filter screen.
Global �G� �F1� Displays Global screen.
Help �H� �F7� Enters Help facility.
Select Job �J� Selects particular job to be displayed indetail on the Job/Session screen.
MemoryDetail
�M� Displays Memory Detail screen.
XpertOverview
�O� Displays Expert Overview of systembottlenecks. Note: The �X� key is thecommand character for the Xpert Analysiscommand.
SelectProcess
�P� Selects particular process to be displayed indetail on the Process screen.
SelectSession
�S� Selects particular session to be displayed indetail on the Job/Session screen.
Workload �W� Displays Workload screen.
Select �#� �F2� Selects job/session/process to monitor.
PreviousDisplay
�<� Displays screen that was last active beforeentering current display.
Next LogicalDisplay
�>� Displays next logical screen, that is, the topresource consumer. See chapter 4.
3-10 Getting Started
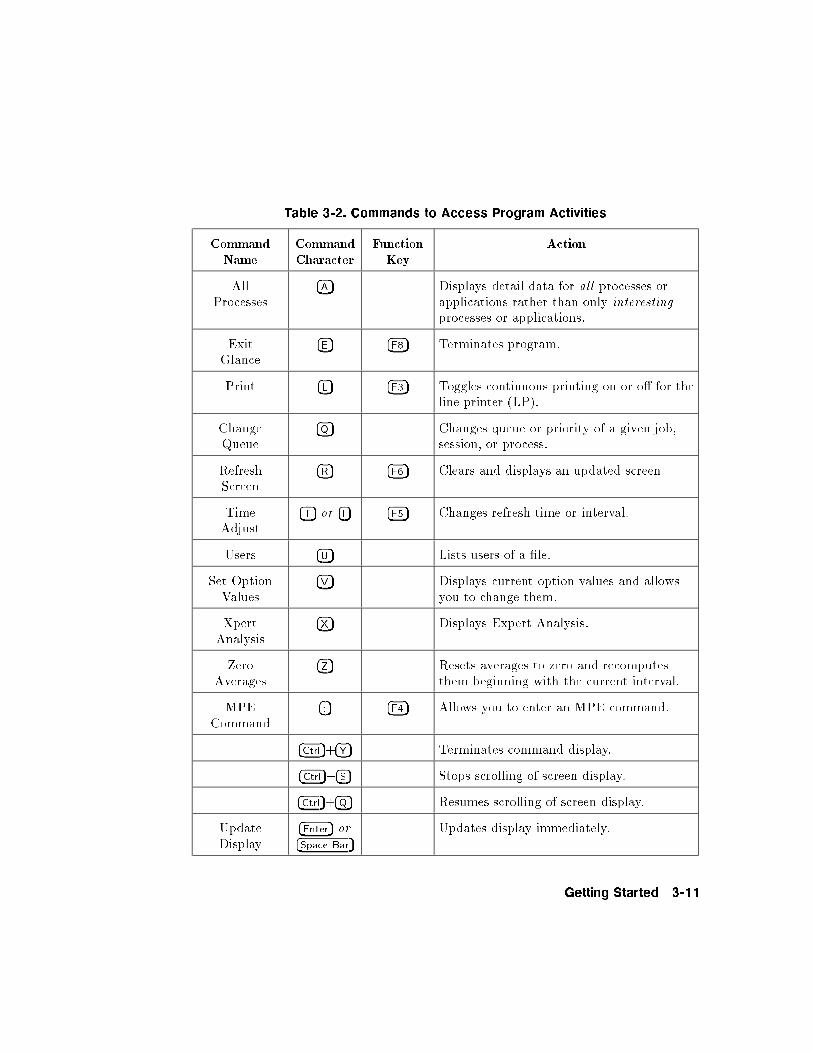
Table 3-2. Commands to Access Program Activities
CommandName
CommandCharacter
FunctionKey
Action
AllProcesses
�A� Displays detail data for all processes orapplications rather than only interestingprocesses or applications.
ExitGlance
�E� �F8� Terminates program.
Print �L� �F3� Toggles continuous printing on or o� for theline printer (LP).
ChangeQueue
�Q� Changes queue or priority of a given job,session, or process.
RefreshScreen
�R� �F6� Clears and displays an updated screen.
TimeAdjust
�T� or �I� �F5� Changes refresh time or interval.
Users �U� Lists users of a �le.
Set OptionValues
�V� Displays current option values and allowsyou to change them.
XpertAnalysis
�X� Displays Expert Analysis.
ZeroAverages
�Z� Resets averages to zero and recomputesthem beginning with the current interval.
MPECommand
�:� �F4� Allows you to enter an MPE command.
�Ctrl�+�Y� Terminates command display.
�Ctrl�+�S� Stops scrolling of screen display.
�Ctrl�+�Q� Resumes scrolling of screen display.
UpdateDisplay
�Enter� or�Space Bar�
Updates display immediately.
Getting Started 3-11
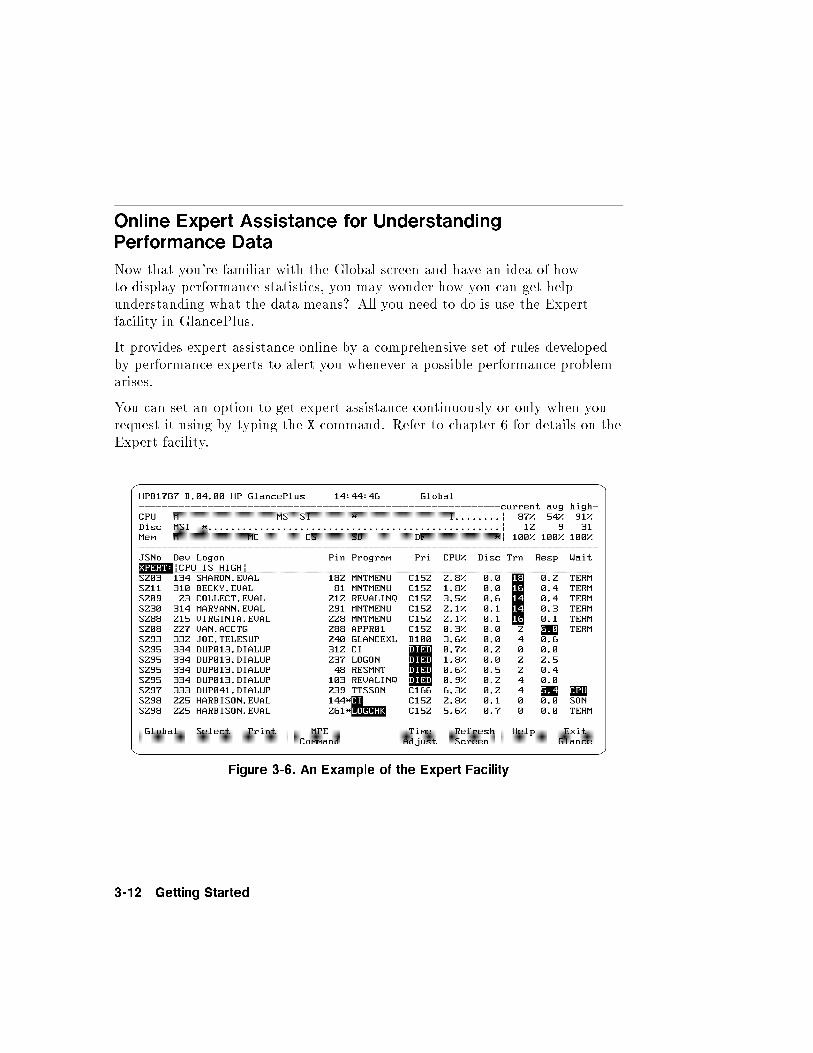
Online Expert Assistance for UnderstandingPerformance Data
Now that you're familiar with the Global screen and have an idea of howto display performance statistics, you may wonder how you can get helpunderstanding what the data means? All you need to do is use the Expertfacility in GlancePlus.
It provides expert assistance online by a comprehensive set of rules developedby performance experts to alert you whenever a possible performance problemarises.
You can set an option to get expert assistance continuously or only when yourequest it using by typing the X command. Refer to chapter 6 for details on theExpert facility.
Figure 3-6. An Example of the Expert Facility
3-12 Getting Started
Help Facility (H)
You can access the GlancePlus Help facility in three ways. Enter the Hcommand character, press the
NNNNNNNNNNNNNNHelp softkey, or enter a question mark (?). A
prompt will ask if you want to see a list of available commands, access helpspeci�c to the current screen, or access general help.
If you request a list of commands or help speci�c to the current screen, you willbe returned to GlancePlus when you �nish that topic and press �Return�.
Select general help if you want to get help on more than one topic. A menuwill be displayed, followed by a greater than (>) prompt. Then, you can enterany of the following:
Any menu item. For example, you can enter XPERT to �nd out about theGlancePlus Expert facility.
A menu item and a key word. For example, you can enter PROCESS,STATEto produce a listing of the codes that may appear in the process STATE bar.
Menu to display the Help facility menu.
Help to display the Help facility instructions.
Exit or E to terminate the Help Facility.
If you access Help and the softkey feature of GlancePlus is enabled, a base setof softkeys will be loaded. These base keys will allow you to move directly toHelp menus for the four most popular screens, or to access additional generalHelp commands. You can access the following:
�F1� Global screen Help.
�F2� Job screen Help.
�F3� Session screen Help.
�F4� Process screen Help.
�F5� GlancePlus commands.
�F6� Main Help menu.
�F7� Help (on Help).
�F8� Exit Help and return to GlancePlus processing.
Getting Started 3-13
If you press �Return� while in the Help Menu, Help displays information upto the next key word or command. For example, after you enter SESSION,Help displays the overall format of the Session screen and a list of key wordsassociated with it (CPU, DISC, TOTALS, PROCESS). If you press �Return�,Help displays the CPU topic for Session. If you press �Return� again (after theprompt), Help displays the Disc information for Session and so on. (This issimilar to turning pages in a manual.)
Printing a Screen
The Print facility provides a default formal designator for the print command|the �le is GLANCELP. The default device class is LP. Once enabled, the Printfacility prints each screen as it is updated.
To print, press:x�x�x�x�x�x�x�x�x�x�x�x�x�x�x�x�x�x�x�x�x�x�x�x�x�x�
Print *
The softkey changes to:x�x�x�x�x�x�x�x�x�x�x�x�x�x�x�x�x�x�x�x�x�x�x�x�x�x�
Print *
Enabled
And the following message appears:
Printing is now enabled
When printing is enabled, a hard copy will be printed each time the screenupdates and will continue to be printed if you select a new screen.
To disable the Print Facility, press:x�x�x�x�x�x�x�x�x�x�x�x�x�x�x�x�x�x�x�x�x�x�x�x�x�x�
Print *
Enabled
The following message appears:
Printing is now disabled
The spool �le is released to print.
3-14 Getting Started
To change the default device,
Use the MPE (:) command to enter a �le equation:
:FILE GLANCELP;DEV=[device]
The default option, CCTL, will print one screen per page.
To save paper by printing contiguously,
Add the NOCCTL option to the �le equation:
:FILE GLANCELP;DEV=LP;NOCCTL
Setting Process Thresholds
Once you are familiar with GlancePlus, you may want to customize the Globalscreen to focus attention on the data most important to you and your systemenvironment. For example, if a 4-second response time is acceptable anda 5-second response time is unacceptable, you would want to see processesreceiving 5-second or longer response times highlighted on the Global screen.Processes exceeding a given level or threshold, as in the example above, arecalled interesting .
A process can be interesting for these reasons:
It uses a large amount of system resources.
It must wait an exceptionally long time to use a system resource.
It is newly created.
It was terminated during the last interval.
These interesting processes are displayed on the Global screen. Some of theseinteresting processes might be highlighted. Highlighting is used to indicate aprocess that exceeds some higher threshold value. For example, you may wantall processes exceeding 1% of the CPU displayed and processes using morethan 10% of the CPU highlighted. On color monitors, highlighting is in color;otherwise, highlighted items are underlined.
The power of GlancePlus lies in its ability to focus your attention on thepertinent data. A good rule of thumb is to set your process thresholds so that
Getting Started 3-15
the number of interesting processes does not exceed the capacity of a singlescreen for an interval. You also want to set them appropriate to your systemenvironment.
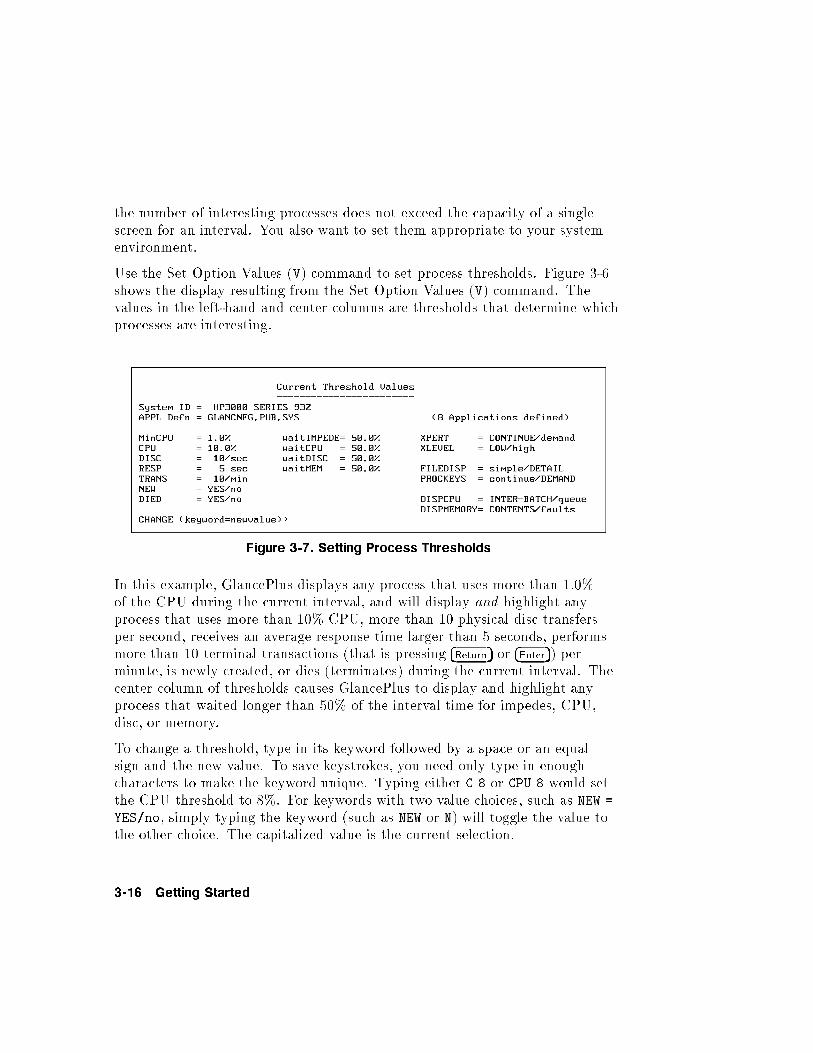
Use the Set Option Values (V) command to set process thresholds. Figure 3-6shows the display resulting from the Set Option Values (V) command. Thevalues in the left-hand and center columns are thresholds that determine whichprocesses are interesting.
Figure 3-7. Setting Process Thresholds
In this example, GlancePlus displays any process that uses more than 1.0%of the CPU during the current interval, and will display and highlight anyprocess that uses more than 10% CPU, more than 10 physical disc transfersper second, receives an average response time larger than 5 seconds, performsmore than 10 terminal transactions (that is pressing �Return� or �Enter�) perminute, is newly created, or dies (terminates) during the current interval. Thecenter column of thresholds causes GlancePlus to display and highlight anyprocess that waited longer than 50% of the interval time for impedes, CPU,disc, or memory.
To change a threshold, type in its keyword followed by a space or an equalsign and the new value. To save keystrokes, you need only type in enoughcharacters to make the keyword unique. Typing either C 8 or CPU 8 would setthe CPU threshold to 8%. For keywords with two value choices, such as NEW =
YES/no, simply typing the keyword (such as NEW or N) will toggle the value tothe other choice. The capitalized value is the current selection.
3-16 Getting Started
Di�erent situations will require di�erent thresholds, and every system isunique. It is worthwhile taking time to become familiar with the ProcessThresholds De�nition screen and to determine which thresholds provide youwith the best information on your system. Once you have determined theoptimal settings for your thresholds, you can have GlancePlus default to yourcustom values every time you run it (see chapter 7).
Getting Started 3-17

4
Commands: Additional Information
Overview
This chapter provides additional information to help you understand howcertain HP GlancePlus commands function.
Selecting Jobs, Sessions, and Processes (>, J, S, P, #)
There are three methods to select the job, session, or process you want tomonitor.
The �rst method uses the Next Logical Display command character (>) tozoom in, with a single keystroke, on the process that consumed the mostresource during the last interval. You cannot use it to select a job or session.For example, if you are displaying the Global or CPU Detail screen, thiscommand will take you to the Process screen of the highest CPU consumer. Ifyou are displaying the Filter screen, you will go to the Process screen of thehighest CPU consumer in the group of processes you are monitoring. If youare displaying the Disc Detail screen, you will go to the Process Screen of thehighest Disc Consumer. It provides you with a guided-analysis capability thatlets you quickly pinpoint and analyze the top resource consumer.
A second method uses the J, S, or P command character to select the job,session, or process to monitor. For example, if you enter an S, GlancePlus willprompt you for a session number. When you enter a valid session number, theSession screen will be displayed with information about the requested session.These three commands|J, S, and P|are mnemonic and require a singlekeystroke.
A third method uses the Select softkey or the # command character. Oncethe appropriate identi�er and its number are entered, the screen changes toshow the details of a single job, session, or process. Batch jobs and sessionsare identi�ed by the letter J or S followed by their job or session number
Commands: Additional Information 4-1
(Jnnnn or Snnnn). Processes are identi�ed by the letter P followed by a processidenti�cation number or PIN (Pnnn). This method has the advantage of beingavailable through a softkey. It also gives you the capability to select operatingsystem processes (those not attached to a job or session) by entering SYS whenprompted for a job, session, or process number.
If no process matching the selection criteria can be found, the user is returnedto the Global screen. For example, if you are monitoring a batch job thatterminates, GlancePlus returns to the Global screen automatically.
MPE Command (:)
Use this command to enter a single command to be executed by MPE. Thisincludes MPE, UDC, RUN, and implied RUN commands. The HP GlancePlusscreen is suspended until the command completes and you press �Return� or�Enter�.
Hint You can issue subsequent commands after a single commandis completed by simply entering a colon (:) in response tothe prompt: Press RETURN to continue (or Enter a GLANCE
command):.
Refresh Screen (R)
Use this command to clear the current display and redraw it with updatedinformation for the current interval. It is useful for solving the problem of acorrupted display by refreshing the display completely.
All Processes (A)
Use this command to produce a one-time screen display that lists all processesor applications, not just those that are interesting . It can be used with theGlobal, Job/Session, Workload, and Filter screens. Following the All Processesdisplay, the screen returns to its previous method of displaying only interestingprocesses.
4-2 Commands: Additional Information
Change Queue (Q)
Use this command, if you have su�cient capability, to change the queue of aspeci�c process or of all the processes associated with a speci�c job or session.A user with system manager (SM) capability can also change a process, or allthe processes belonging to a job or session, to or from the B subqueue (BS).At the Enter new queue . . . prompt, an SM user can enter a speci�c numberto set the priority at any number between 100 and 255, or enter B to set thepriority at 100.
The system manager can limit the use of this command to certain usercapabilities by modifying the GlancePlus con�guration �le. See chapter 7 forinformation about customizing GlancePlus.
The priority of a process (or process-related job/session) in a circular queueis placed initially at the base of the chosen queue and will vary within thequeue limits. The priority of a process in a linear queue remains constant.Furthermore, a linear queue process will not relinquish the CPU for processeswith lower priorities unless it must wait for another resource.
Caution Misuse of this command can degrade system operatinge�ciency signi�cantly.
List Users of a File (U)
Use this command to check the current �le users on the system. Press U toinitiate an on-screen request for the FILE.GROUP.ACCOUNT information fora particular MPE �le. Based on that information, all users of the speci�ed �leare listed by process identi�cation number (PIN), user logon, job or sessionnumber, and logical device number (Ldev). For example, this can be used toidentify all users of a program �le you want to replace.
Note MPE message �les are not supported because of the specialtype of control blocks that govern access to them.
Commands: Additional Information 4-3
Zero Averages (Z)
Use this command to reset the averages for CPU, Disc, and Memory to zeroand recompute them beginning with the current interval values. These averagesare shown on the screen in the column labeled avg and as an asterisk (�) in thehorizontal bars.
Previous Display (<)
Use this command to return immediately to the display that was last activebefore you entered the current display. For example, if you examine a jobon the Job screen then move to the Process screen for an in-depth look at aspeci�c process, you can use the Previous Display (<) command to return tothe Job screen.
Next Logical Display (>)
Use this command to move to the next logical display based on your currentdisplay. As discussed earlier in this chapter, the Next Display commandprovides a guided analysis capability you can use to zoom from the Global,CPU Detail, Disc Detail, or Filter screen to the Process Detail screen of thetop consumer of resources. You can also use it to zoom from the Workloadscreen to the Filter screen to examine the group of application programs thatconsumed the most CPU during the last interval. The Next Display commandis only valid when issued while one of the screens mentioned above is thecurrent screen.
Ninety-second Timeout on Command Prompts
Some commands issue a prompt and wait for your response. Examples arethe Set Option Values command and the MPE command. A ninety-secondtimeout is in e�ect for all GlancePlus prompts to insure that you do not getan excessive number of interesting processes due to a large time interval whenthe next screen is displayed. If you do not respond to a prompt in 90 seconds,GlancePlus will move you to the next screen or prompt.
There are two exceptions. When you are in the Help subsystem or in themidst of executing an MPE command, GlancePlus does not have control of theterminal. Therefore, it cannot initiate a time out. It is recommended that youlimit your time in these areas to a few minutes.
4-4 Commands: Additional Information
5
Screen Metrics and Statistics
HP GlancePlus for MPE/iX provides di�erent levels of performance analysis.You can use the statistics on the Global screen to monitor systemwide activity,or you can refer to the detailed data screens to focus on speci�c areas of systemusage.
This chapter describes the metrics and statistics presented on the detaileddata screens. The discussion for each screen focuses on the Screen Elementsdisplay|the detailed data area of the screen. The Screen Elements displaydi�ers for every GlancePlus screen.
The Banner line, and Global bars are the same for every detailed data screenand are discussed in chapter 3.
The following detailed data screens are described in this chapter.
Global screen.
Job/Session screen.
Process screen.
Filter screen.
Workload screen.
CPU Detail screen.
Disc Detail screen.
Memory Detail screen.
Screen Metrics and Statistics 5-1
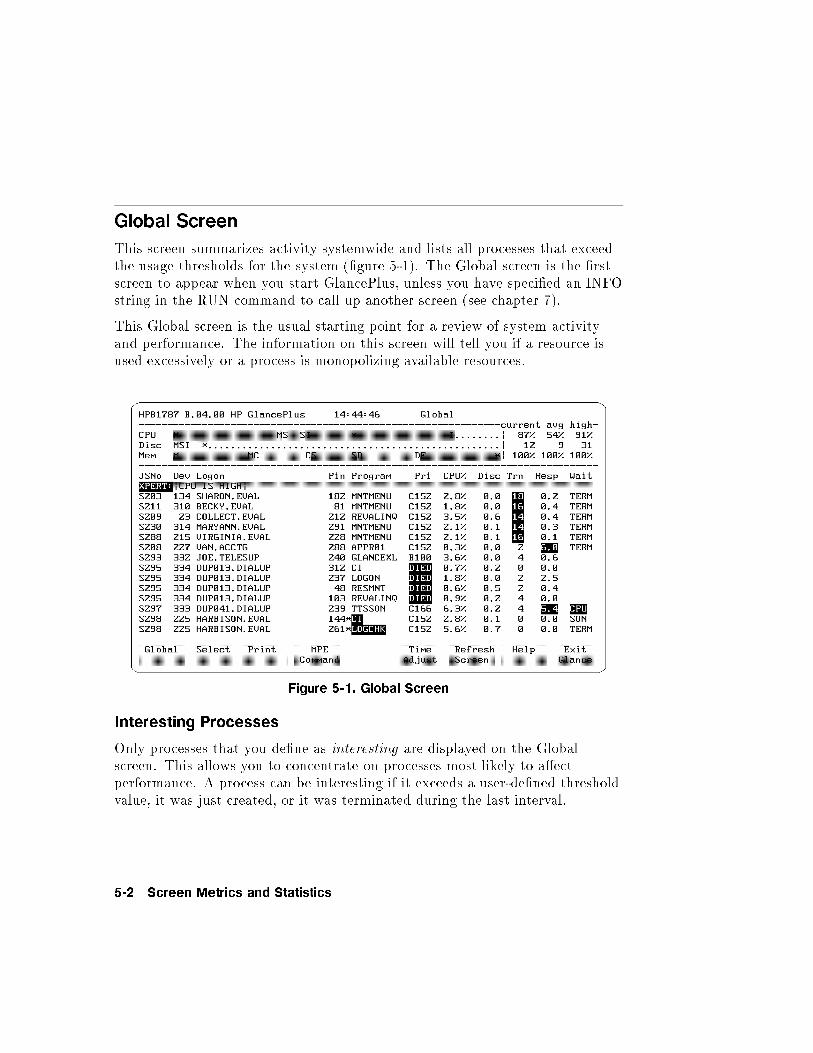
Global Screen
This screen summarizes activity systemwide and lists all processes that exceedthe usage thresholds for the system (�gure 5-1). The Global screen is the �rstscreen to appear when you start GlancePlus, unless you have speci�ed an INFOstring in the RUN command to call up another screen (see chapter 7).
This Global screen is the usual starting point for a review of system activityand performance. The information on this screen will tell you if a resource isused excessively or a process is monopolizing available resources.
Figure 5-1. Global Screen
Interesting Processes
Only processes that you de�ne as interesting are displayed on the Globalscreen. This allows you to concentrate on processes most likely to a�ectperformance. A process can be interesting if it exceeds a user-de�ned thresholdvalue, it was just created, or it was terminated during the last interval.
5-2 Screen Metrics and Statistics
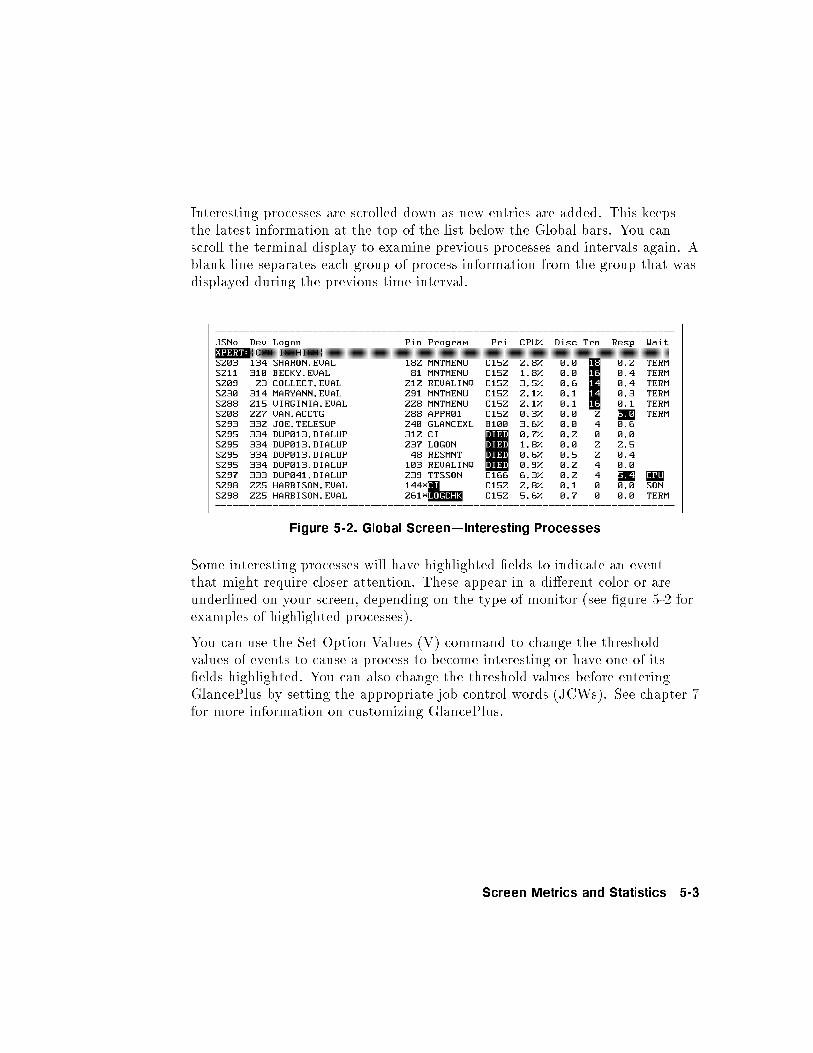
Interesting processes are scrolled down as new entries are added. This keepsthe latest information at the top of the list below the Global bars. You canscroll the terminal display to examine previous processes and intervals again. Ablank line separates each group of process information from the group that wasdisplayed during the previous time interval.
Figure 5-2. Global Screen|Interesting Processes
Some interesting processes will have highlighted �elds to indicate an eventthat might require closer attention. These appear in a di�erent color or areunderlined on your screen, depending on the type of monitor (see �gure 5-2 forexamples of highlighted processes).
You can use the Set Option Values (V) command to change the thresholdvalues of events to cause a process to become interesting or have one of its�elds highlighted. You can also change the threshold values before enteringGlancePlus by setting the appropriate job control words (JCWs). See chapter 7for more information on customizing GlancePlus.
Screen Metrics and Statistics 5-3
Interesting Process Components
Each interesting process occupies a single line on the Global screen. Thecomponents of interesting processes and any applicable reasons for highlightingare as follows:
JSNO JSNO is the job number (#Jnnnn), session number (#Snnnn)or process identi�cation number (#Pnnn) for the process.
DEV DEV is the logical device number for a job or session. If the jobor session is a system process, DEV is displayed as SYS.
LOGON LOGON is the �rst 22 characters of the logon string(jobsessionname,user.account).
PIN PIN is the process identi�cation number for the process.
PROGRAM PROGRAM refers to the name of the program being run. If theprogram is the MPE/iX Command Interpreter (CI), then this�eld displays a colon (:) followed by the �rst characters of thelast CI command issued. However, depending on your assignedcapabilities, the following might apply:
SM (System Manager) capability will show the last CIcommand for all users systemwide.
AM (Account Manager) capability will show the last CIcommand for all users within that account.
A user with neither SM nor AM capabilities will be shownonly his or her last CI command. All other CommandInterpreters will show CI as the program name.
The program name of a new process is highlighted, and anasterisk (�) is located between the PIN and PROGRAMcolumns.
A terminating process is represented by the word DIED,highlighted in the priority (PRI) �eld.
PRI PRI is the execution queue (where: A=AS, B=BS, C=CS,D=DS, E=ES) followed by the current execution prioritynumber of the process (1-255). If a process has just terminated,this �eld will contain the word DIED.
5-4 Screen Metrics and Statistics
CPU% CPU% is the percentage of the central processing unit used bythis process during the last interval.
The CPU �eld is highlighted if the process exceeds the CPUthreshold. The default is 10 percent of the CPU.
DISC DISC is the disc transfer rate (transfers per second) for thisprocess during the last interval.
The DISC �eld is highlighted if the process exceeds the disctransfer threshold. The default is 10 disc transfers per second.
TRN TRN is the rate per minute at which the �Return� or �Enter� keywas pressed during the last interval. Transactions with thinktimes less than 0. 2 second are not counted since they probablyrepresent hardware status replies. The number of transactions is0 for most batch jobs because generally they do not read fromterminals.
The TRN �eld is highlighted if the process exceeds the terminaltransaction threshold. The default is 10 transactions per minute.
RESP RESP is the average time from when the �Return� or �Enter� key ispressed until the computer is ready to accept more input. Thisincludes the time for the process to do all the work requested bythe user, write out all the characters in response to the request,and issue the next read to the terminal. This number is 0.0 ifthere were no transactions during the last interval.
The RESP �eld is highlighted if the response time exceeds theresponse time threshold. The default is 5.0 seconds.
WAIT WAIT is the reason a process was waiting at the end of the lastinterval.
For a list of WAIT reasons, see table 5-1 and appendix B, \WaitReasons|Expanded De�nitions."
Screen Metrics and Statistics 5-5
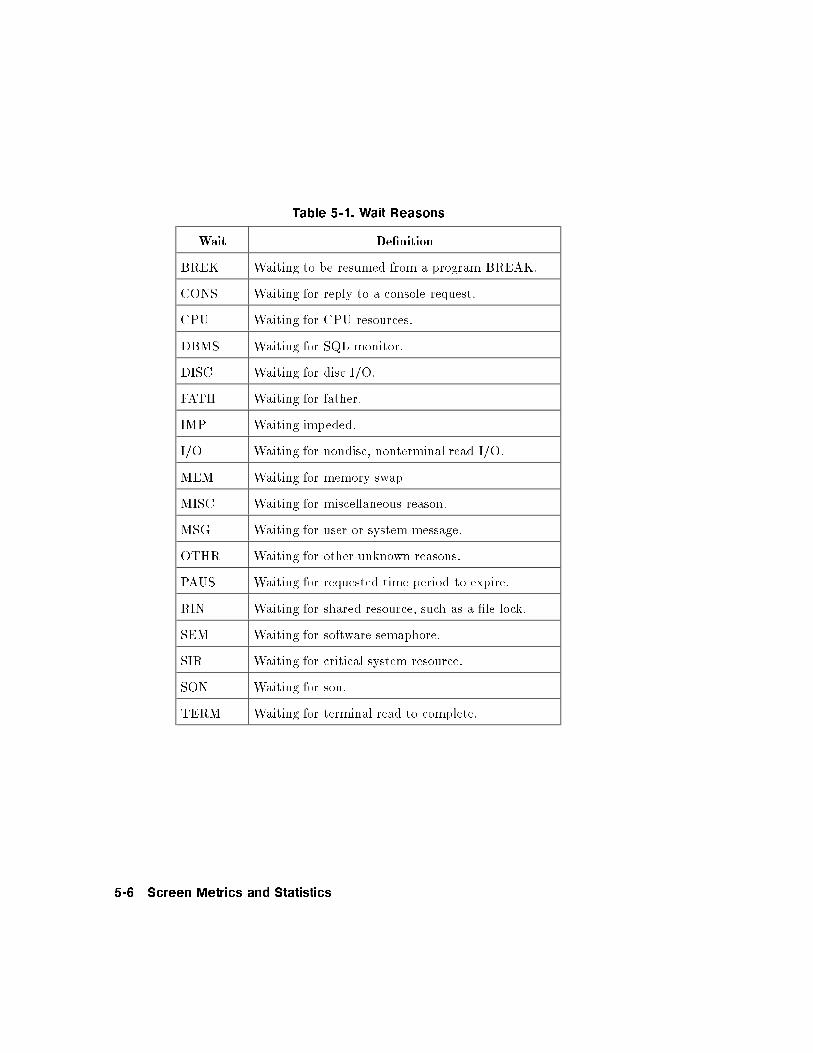
Table 5-1. Wait Reasons
Wait De�nition
BREK Waiting to be resumed from a program BREAK.
CONS Waiting for reply to a console request.
CPU Waiting for CPU resources.
DBMS Waiting for SQL monitor.
DISC Waiting for disc I/O.
FATH Waiting for father.
IMP Waiting impeded.
I/O Waiting for nondisc, nonterminal read I/O.
MEM Waiting for memory swap.
MISC Waiting for miscellaneous reason.
MSG Waiting for user or system message.
OTHR Waiting for other unknown reasons.
PAUS Waiting for requested time period to expire.
RIN Waiting for shared resource, such as a �le lock.
SEM Waiting for software semaphore.
SIR Waiting for critical system resource.
SON Waiting for son.
TERM Waiting for terminal read to complete.
5-6 Screen Metrics and Statistics
Job/Session Screen
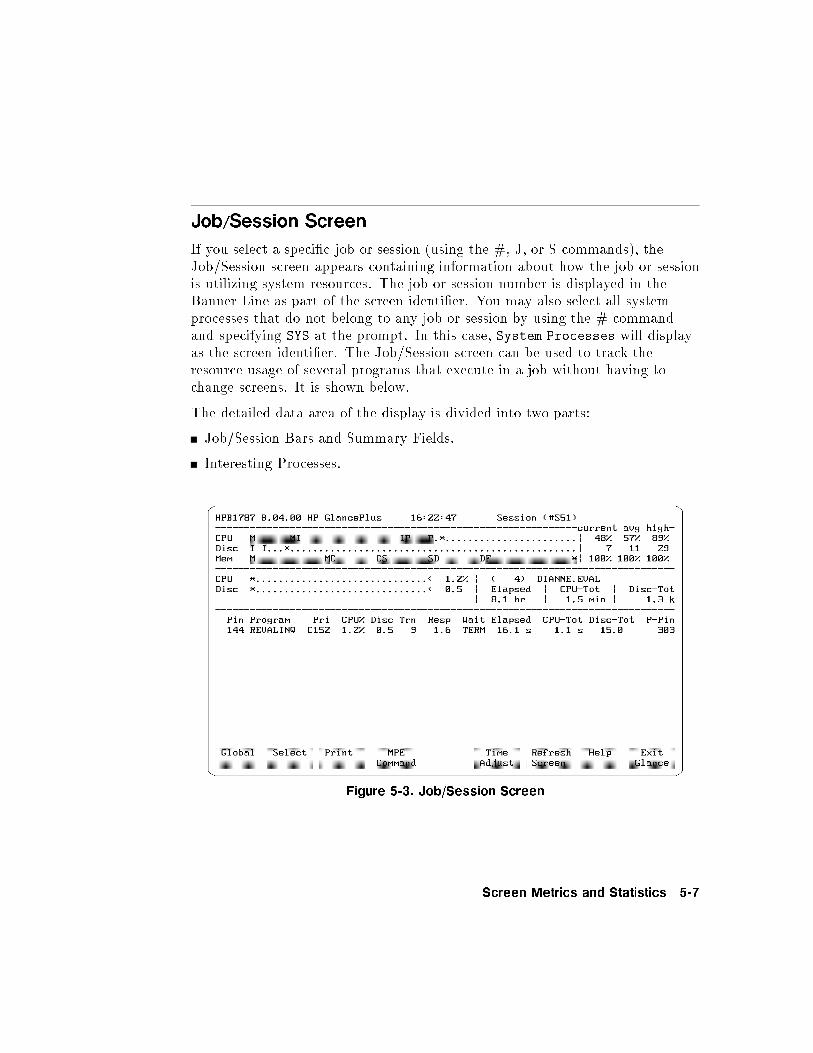
If you select a speci�c job or session (using the #, J, or S commands), theJob/Session screen appears containing information about how the job or sessionis utilizing system resources. The job or session number is displayed in theBanner Line as part of the screen identi�er. You may also select all systemprocesses that do not belong to any job or session by using the # commandand specifying SYS at the prompt. In this case, System Processes will displayas the screen identi�er. The Job/Session screen can be used to track theresource usage of several programs that execute in a job without having tochange screens. It is shown below.
The detailed data area of the display is divided into two parts:
Job/Session Bars and Summary Fields.
Interesting Processes.
Figure 5-3. Job/Session Screen
Screen Metrics and Statistics 5-7
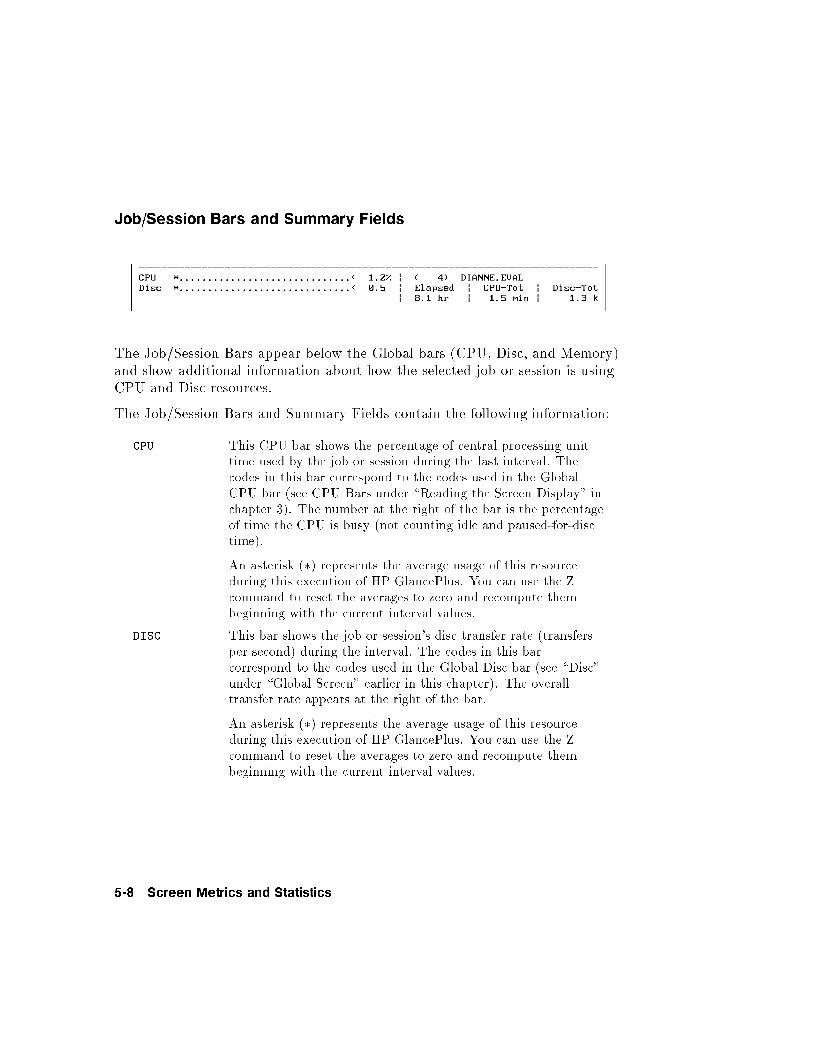
Job/Session Bars and Summary Fields
The Job/Session Bars appear below the Global bars (CPU, Disc, and Memory)and show additional information about how the selected job or session is usingCPU and Disc resources.
The Job/Session Bars and Summary Fields contain the following information:
CPU This CPU bar shows the percentage of central processing unittime used by the job or session during the last interval. Thecodes in this bar correspond to the codes used in the GlobalCPU bar (see CPU Bars under \Reading the Screen Display" inchapter 3). The number at the right of the bar is the percentageof time the CPU is busy (not counting idle and paused-for-disctime).
An asterisk (�) represents the average usage of this resourceduring this execution of HP GlancePlus. You can use the Zcommand to reset the averages to zero and recompute thembeginning with the current interval values.
DISC This bar shows the job or session's disc transfer rate (transfersper second) during the interval. The codes in this barcorrespond to the codes used in the Global Disc bar (see \Disc"under \Global Screen" earlier in this chapter). The overalltransfer rate appears at the right of the bar.
An asterisk (�) represents the average usage of this resourceduring this execution of HP GlancePlus. You can use the Zcommand to reset the averages to zero and recompute thembeginning with the current interval values.
5-8 Screen Metrics and Statistics
COUNT The count (in parentheses) is the number of processes associatedwith the current job or session. There are four processes shownin the previous example.
LOGON LOGON is the logon string (jobsessionname,user.account). Thelogon string in the previous example is \DIANNE.EVAL".
ELAPSED ELAPSED is the total clock time during which a job or sessionhas been logged on.
CPU-TOT CPU{TOT is the total amount of processor time used duringthe life of the job or session (see note).
DISC-TOT DISC{TOT is the total number of physical Disc transferscompleted during the life of the job or session (see note). Anumber followed by the letter K represents thousands oftransfers; a number followed by the letter M represents millionsof transfers.
Note Disc totals are not collected until either HP GlancePlus oranother performance tool enables the MPE measurementfacility to collect process data. This means that the DISC-TOTvalue will not include physical transfers that were completed bya process before the MPE measurement facility was enabled.
Upon entry to the Job/Session screen, CPU-TOT andDISC-TOT values represent CPU and disc totals for theprocesses, associated with the job or session, that are stillalive. To prevent these values from decrementing as processesterminate, HP GlancePlus maintains counters for the job orsession as long as it is monitored in the Job/Session screen.These counters are lost as soon as you enter another screen orselect a di�erent job or session.
Screen Metrics and Statistics 5-9
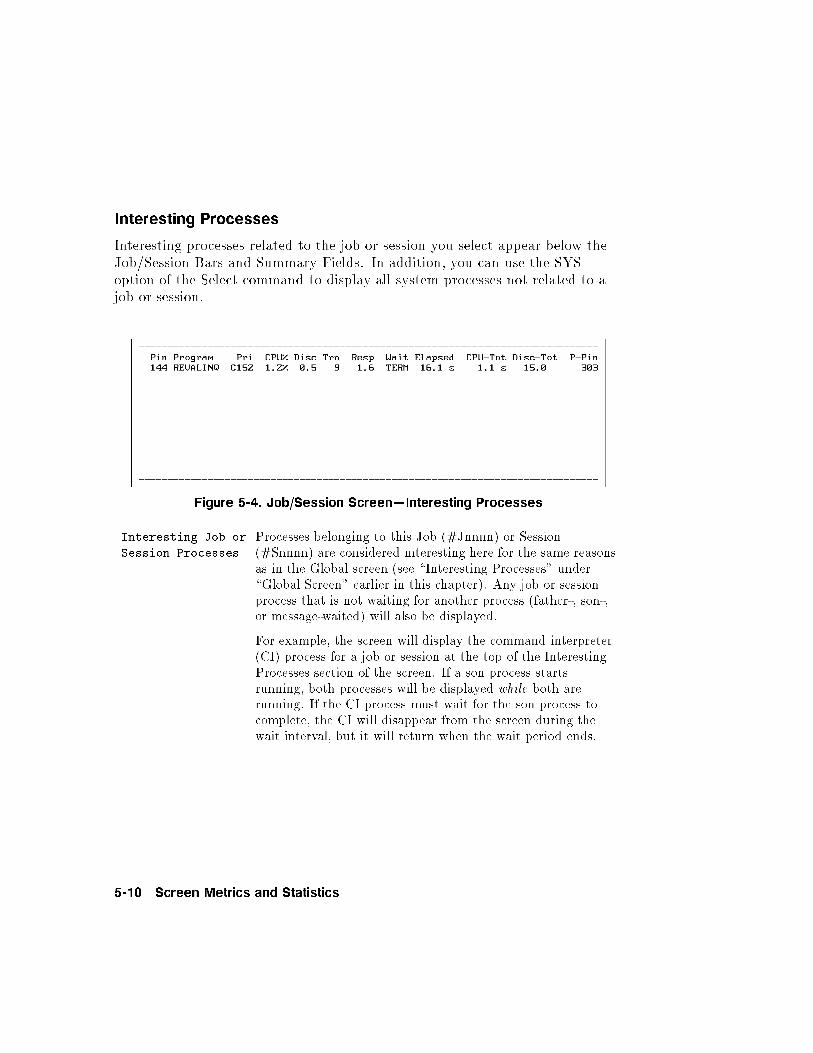
Interesting Processes
Interesting processes related to the job or session you select appear below theJob/Session Bars and Summary Fields. In addition, you can use the SYSoption of the Select command to display all system processes not related to ajob or session.
Figure 5-4. Job/Session Screen|Interesting Processes
Interesting Job or
Session Processes
Processes belonging to this Job (#Jnnnn) or Session(#Snnnn) are considered interesting here for the same reasonsas in the Global screen (see \Interesting Processes" under\Global Screen" earlier in this chapter). Any job or sessionprocess that is not waiting for another process (father-, son-,or message-waited) will also be displayed.
For example, the screen will display the command interpreter(CI) process for a job or session at the top of the InterestingProcesses section of the screen. If a son process startsrunning, both processes will be displayed while both arerunning. If the CI process must wait for the son process tocomplete, the CI will disappear from the screen during thewait interval, but it will return when the wait period ends.
5-10 Screen Metrics and Statistics
This allows you to see the most interesting part of a job orsession without having to manually track the process numbersas they are created and terminated.
You can see all processes belonging to the job or session byentering the A command.
Interesting System
Processes
Use the Select command's SYS option to display only systemprocesses that do not belong to a speci�c job or session. Sincethere are usually many of these processes left in di�erentwaiting states, system processes will only be displayed if theyare \interesting" (see \Interesting Processes" under \GlobalScreen" earlier in this chapter).
You can see all system processes by entering the A command.
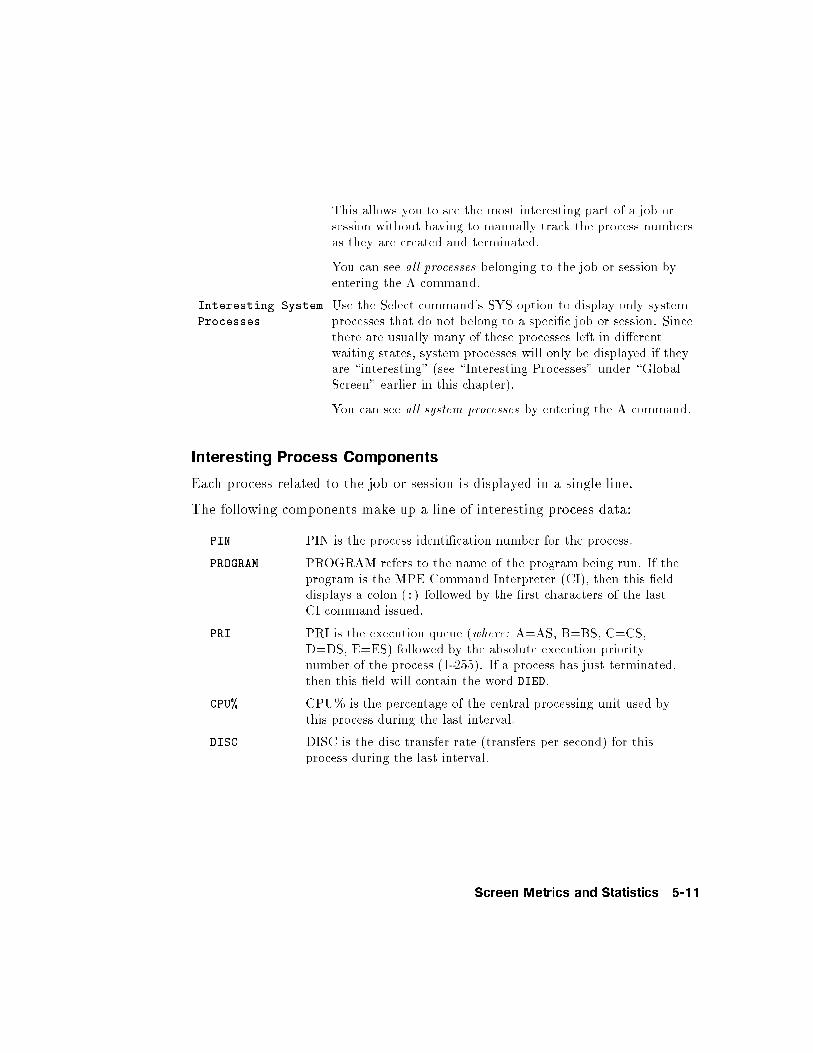
Interesting Process Components
Each process related to the job or session is displayed in a single line.
The following components make up a line of interesting process data:
PIN PIN is the process identi�cation number for the process.
PROGRAM PROGRAM refers to the name of the program being run. If theprogram is the MPE Command Interpreter (CI), then this �elddisplays a colon (:) followed by the �rst characters of the lastCI command issued.
PRI PRI is the execution queue (where: A=AS, B=BS, C=CS,D=DS, E=ES) followed by the absolute execution prioritynumber of the process (1-255). If a process has just terminated,then this �eld will contain the word DIED.
CPU% CPU% is the percentage of the central processing unit used bythis process during the last interval.
DISC DISC is the disc transfer rate (transfers per second) for thisprocess during the last interval.
Screen Metrics and Statistics 5-11
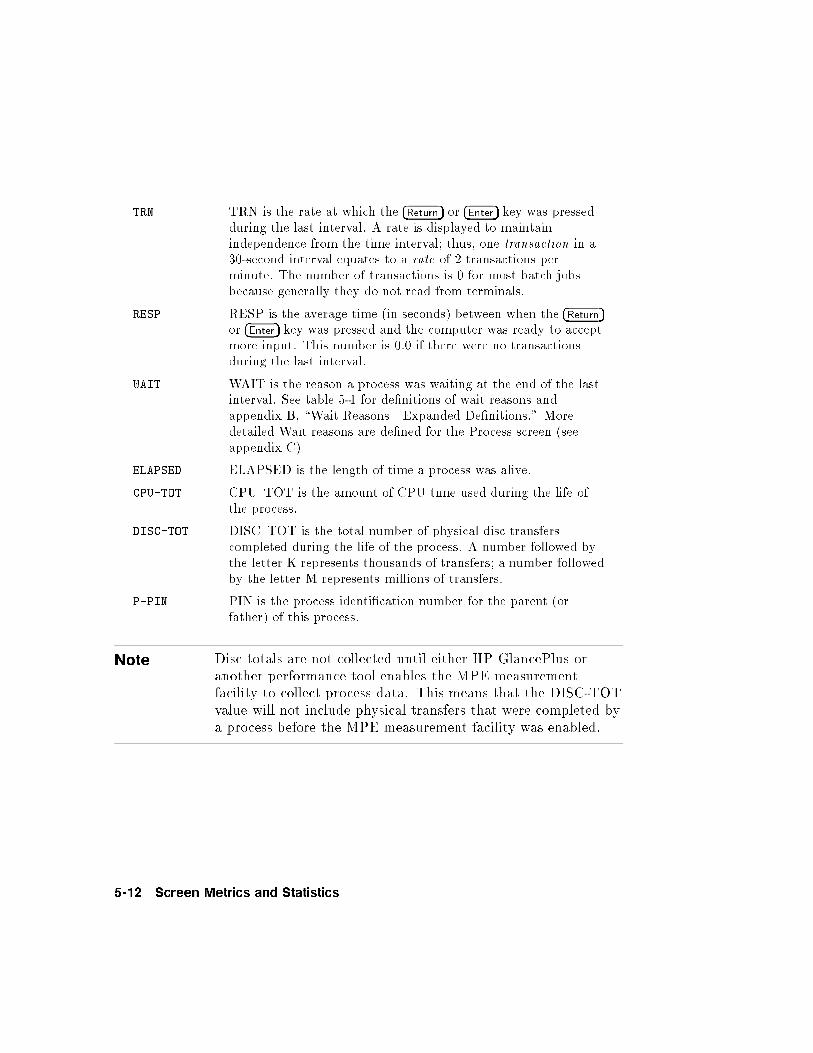
TRN TRN is the rate at which the �Return� or �Enter� key was pressedduring the last interval. A rate is displayed to maintainindependence from the time interval; thus, one transaction in a30-second interval equates to a rate of 2 transactions perminute. The number of transactions is 0 for most batch jobsbecause generally they do not read from terminals.
RESP RESP is the average time (in seconds) between when the �Return�or �Enter� key was pressed and the computer was ready to acceptmore input. This number is 0.0 if there were no transactionsduring the last interval.
WAIT WAIT is the reason a process was waiting at the end of the lastinterval. See table 5-1 for de�nitions of wait reasons andappendix B, \Wait Reasons|Expanded De�nitions." Moredetailed Wait reasons are de�ned for the Process screen (seeappendix C).
ELAPSED ELAPSED is the length of time a process was alive.
CPU-TOT CPU{TOT is the amount of CPU time used during the life ofthe process.
DISC-TOT DISC{TOT is the total number of physical disc transferscompleted during the life of the process. A number followed bythe letter K represents thousands of transfers; a number followedby the letter M represents millions of transfers.
P-PIN PIN is the process identi�cation number for the parent (orfather) of this process.
Note Disc totals are not collected until either HP GlancePlus oranother performance tool enables the MPE measurementfacility to collect process data. This means that the DISC-TOTvalue will not include physical transfers that were completed bya process before the MPE measurement facility was enabled.
5-12 Screen Metrics and Statistics
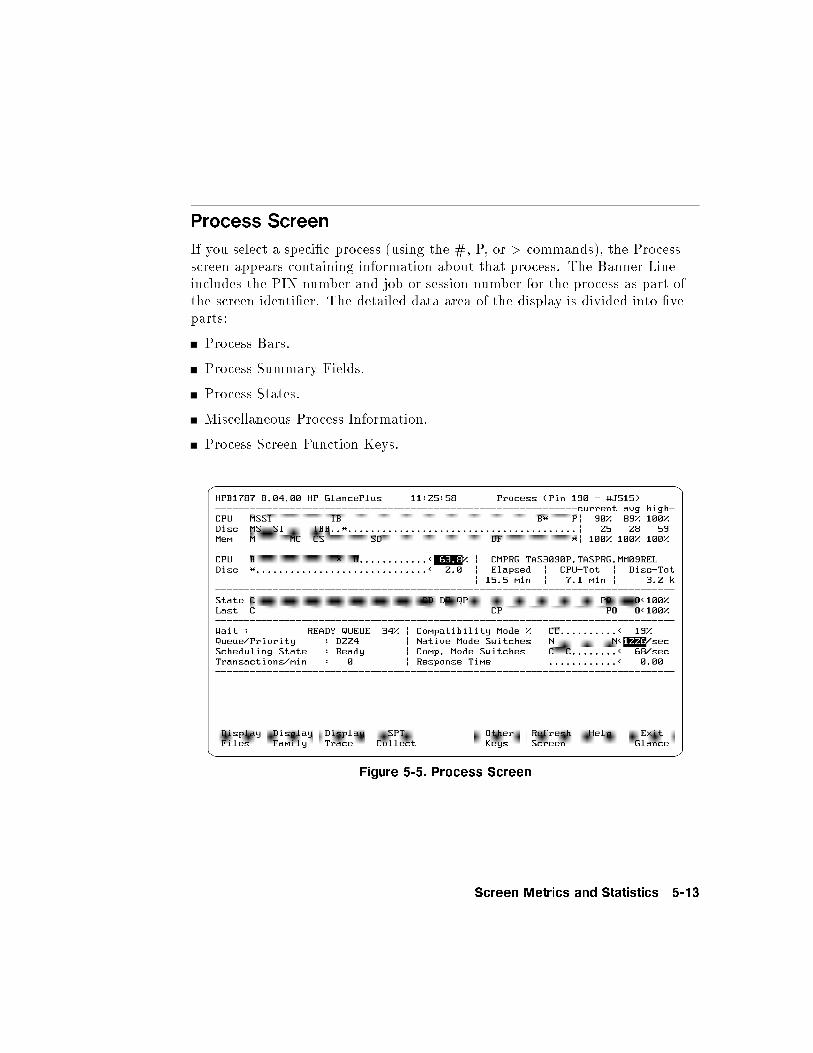
Process Screen
If you select a speci�c process (using the #, P, or > commands), the Processscreen appears containing information about that process. The Banner Lineincludes the PIN number and job or session number for the process as part ofthe screen identi�er. The detailed data area of the display is divided into �veparts:
Process Bars.
Process Summary Fields.
Process States.
Miscellaneous Process Information.
Process Screen Function Keys.
Figure 5-5. Process Screen
Screen Metrics and Statistics 5-13
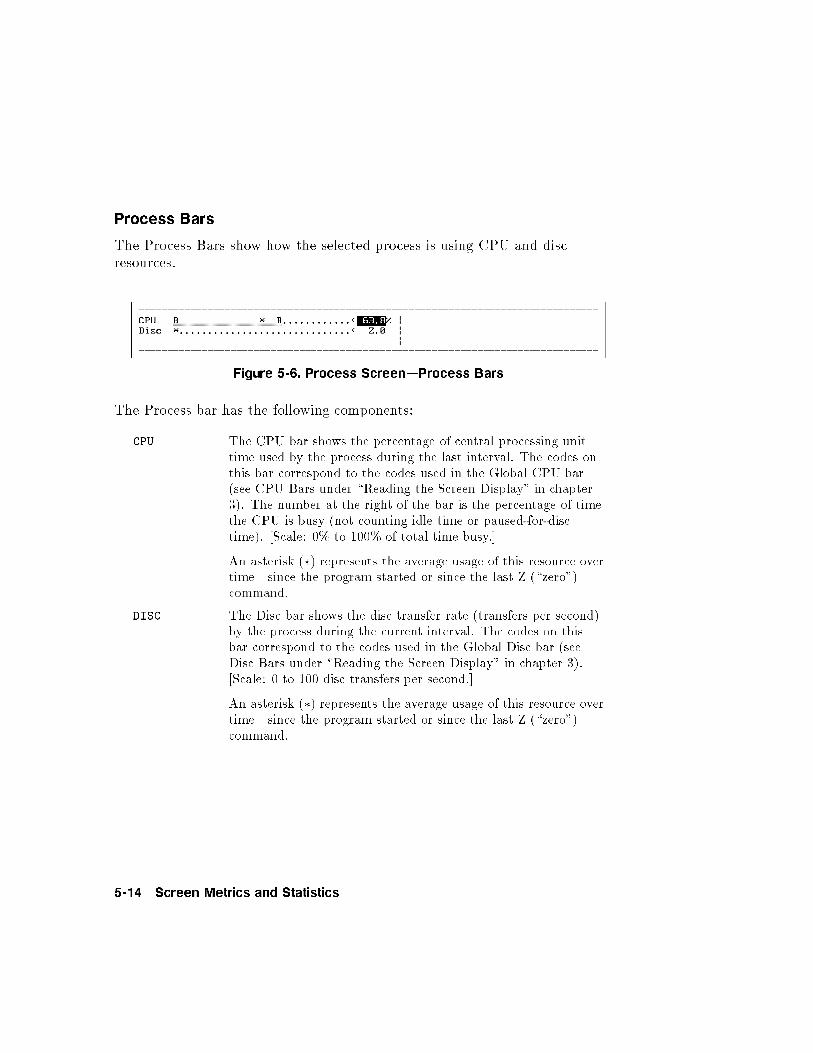
Process Bars
The Process Bars show how the selected process is using CPU and discresources.
Figure 5-6. Process Screen|Process Bars
The Process bar has the following components:
CPU The CPU bar shows the percentage of central processing unittime used by the process during the last interval. The codes onthis bar correspond to the codes used in the Global CPU bar(see CPU Bars under \Reading the Screen Display" in chapter3). The number at the right of the bar is the percentage of timethe CPU is busy (not counting idle time or paused-for-disctime). [Scale: 0% to 100% of total time busy.]
An asterisk (�) represents the average usage of this resource overtime|since the program started or since the last Z (\zero")command.
DISC The Disc bar shows the disc transfer rate (transfers per second)by the process during the current interval. The codes on thisbar correspond to the codes used in the Global Disc bar (seeDisc Bars under \Reading the Screen Display" in chapter 3).[Scale: 0 to 100 disc transfers per second.]
An asterisk (�) represents the average usage of this resource overtime|since the program started or since the last Z (\zero")command.
5-14 Screen Metrics and Statistics
Process Summary Fields
The Process Summary Fields at the right of the screen provide additionalinformation about the process.
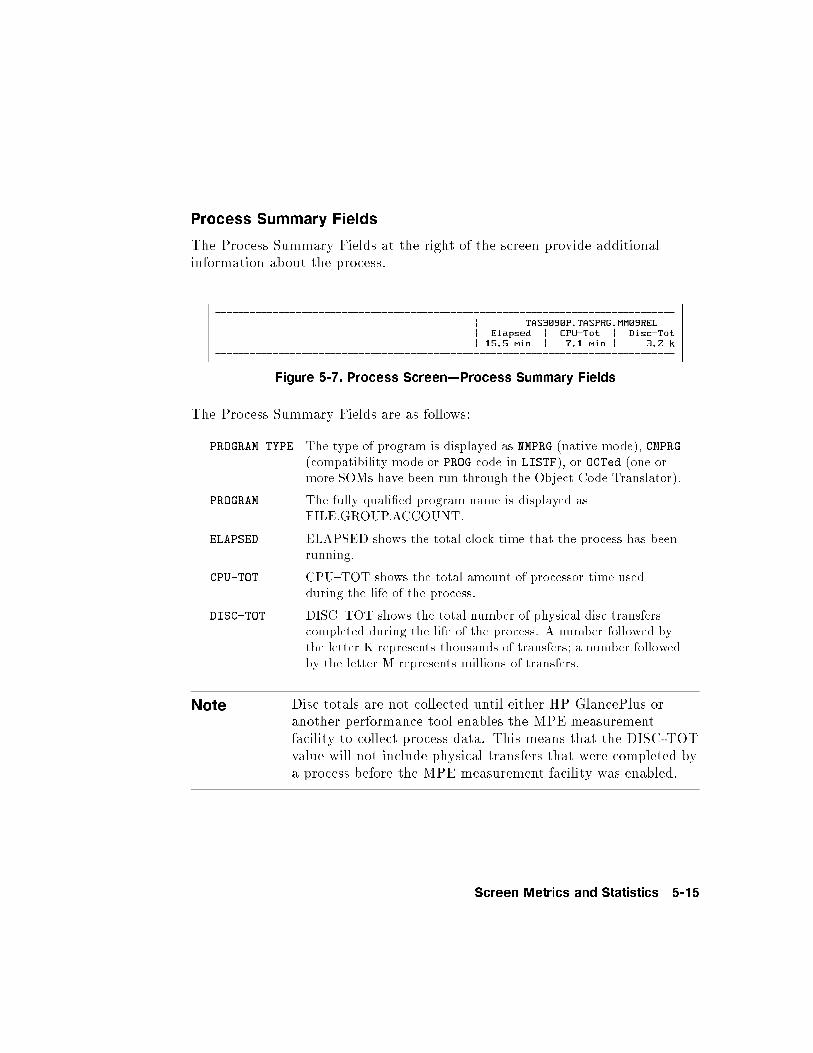
Figure 5-7. Process Screen|Process Summary Fields
The Process Summary Fields are as follows:
PROGRAM TYPE The type of program is displayed as NMPRG (native mode), CMPRG(compatibility mode or PROG code in LISTF), or OCTed (one ormore SOMs have been run through the Object Code Translator).
PROGRAM The fully quali�ed program name is displayed asFILE.GROUP.ACCOUNT.
ELAPSED ELAPSED shows the total clock time that the process has beenrunning.
CPU-TOT CPU{TOT shows the total amount of processor time usedduring the life of the process.
DISC-TOT DISC{TOT shows the total number of physical disc transferscompleted during the life of the process. A number followed bythe letter K represents thousands of transfers; a number followedby the letter M represents millions of transfers.
Note Disc totals are not collected until either HP GlancePlus oranother performance tool enables the MPE measurementfacility to collect process data. This means that the DISC-TOTvalue will not include physical transfers that were completed bya process before the MPE measurement facility was enabled.
Screen Metrics and Statistics 5-15
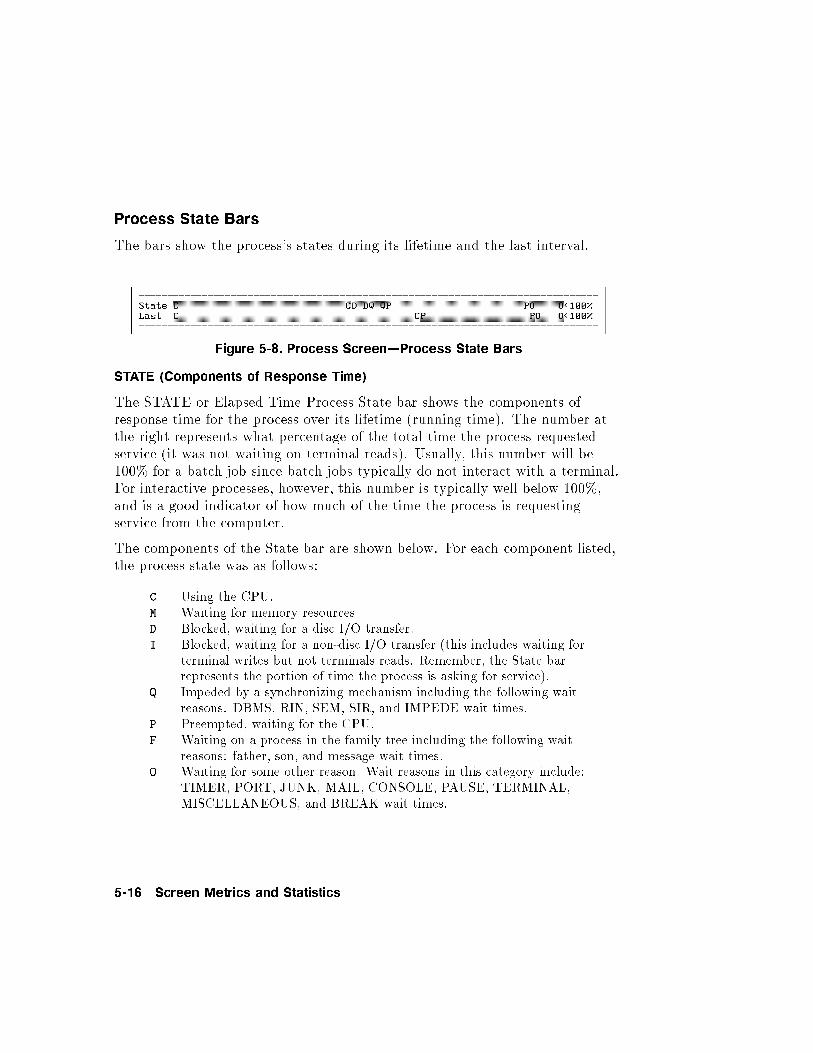
Process State Bars
The bars show the process's states during its lifetime and the last interval.
Figure 5-8. Process Screen|Process State Bars
STATE (Components of Response Time)
The STATE or Elapsed Time Process State bar shows the components ofresponse time for the process over its lifetime (running time). The number atthe right represents what percentage of the total time the process requestedservice (it was not waiting on terminal reads). Usually, this number will be100% for a batch job since batch jobs typically do not interact with a terminal.For interactive processes, however, this number is typically well below 100%,and is a good indicator of how much of the time the process is requestingservice from the computer.
The components of the State bar are shown below. For each component listed,the process state was as follows:
C Using the CPU.M Waiting for memory resources.D Blocked, waiting for a disc I/O transfer.I Blocked, waiting for a non-disc I/O transfer (this includes waiting for
terminal writes but not terminals reads. Remember, the State barrepresents the portion of time the process is asking for service).
Q Impeded by a synchronizing mechanism including the following waitreasons: DBMS, RIN, SEM, SIR, and IMPEDE wait times.
P Preempted, waiting for the CPU.F Waiting on a process in the family tree including the following wait
reasons: father, son, and message wait times.O Waiting for some other reason. Wait reasons in this category include:
TIMER, PORT, JUNK, MAIL, CONSOLE, PAUSE, TERMINAL,MISCELLANEOUS, and BREAK wait times.
5-16 Screen Metrics and Statistics
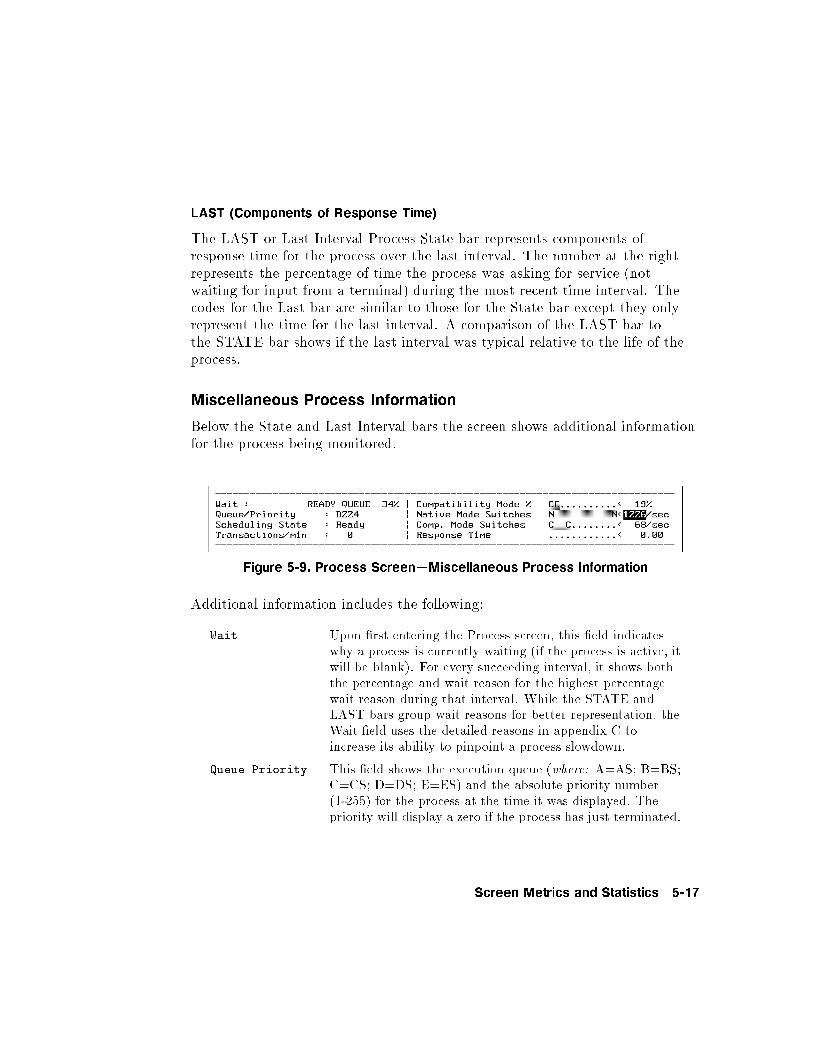
LAST (Components of Response Time)
The LAST or Last Interval Process State bar represents components ofresponse time for the process over the last interval. The number at the rightrepresents the percentage of time the process was asking for service (notwaiting for input from a terminal) during the most recent time interval. Thecodes for the Last bar are similar to those for the State bar except they onlyrepresent the time for the last interval. A comparison of the LAST bar tothe STATE bar shows if the last interval was typical relative to the life of theprocess.
Miscellaneous Process Information
Below the State and Last Interval bars the screen shows additional informationfor the process being monitored.
Figure 5-9. Process Screen|Miscellaneous Process Information
Additional information includes the following:
Wait Upon �rst entering the Process screen, this �eld indicateswhy a process is currently waiting (if the process is active, itwill be blank). For every succeeding interval, it shows boththe percentage and wait reason for the highest percentagewait reason during that interval. While the STATE andLAST bars group wait reasons for better representation, theWait �eld uses the detailed reasons in appendix C toincrease its ability to pinpoint a process slowdown.
Queue Priority This �eld shows the execution queue (where: A=AS; B=BS;C=CS; D=DS; E=ES) and the absolute priority number(1-255) for the process at the time it was displayed. Thepriority will display a zero if the process has just terminated.
Screen Metrics and Statistics 5-17
Scheduling State This �eld shows the state this process is in according to theMPE/iX Dispatcher. Valid states are: Executing, Ready,Short Wait, Long Wait, and Null.
Executing The process is using the CPU.
Ready The process is waiting its turn for the CPU.
Short Wait The process is waiting for disc I/O, such as acode page fault or �le page fault.
Long Wait The process is waiting for other I/O activitiessuch as a terminal read or terminal write. SIR,RIN, Parent Wait, and other semaphore-typewaits fall under this category.
Null Appears only if a process is being created or isdying.
Transactions/min This �eld shows the rate of terminal transactions(transactions per minute) completed during the last interval.
Compatibility
Mode
This �eld shows the percentage of CPU time the processspent in Compatibility Mode during the last interval.
Native Mode
Switches
This �eld shows the rate of Native Mode switches completed(switches per second from Native Mode to CompatibilityMode) during the last interval. [Bar Scale: 0 to 200 switchesper second. The number to the right of the bar shows theactual switch rate per second up to a maximum of 9,999.]
Comp. Mode
Switches
This �eld shows the rate of Compatibility Mode switchescompleted (switches per second from Compatibility Mode toNative Mode) during the last interval. [Bar Scale: 0 to 200switches per second. The number to the right of the barshows the actual switch rate per second up to a maximum of9,999.]
Response Time This �eld shows the average response time for the processduring the last interval. If no terminal transactions werecompleted, the response time value is zero. [Scale: 0.00 to60.00 seconds.]
5-18 Screen Metrics and Statistics
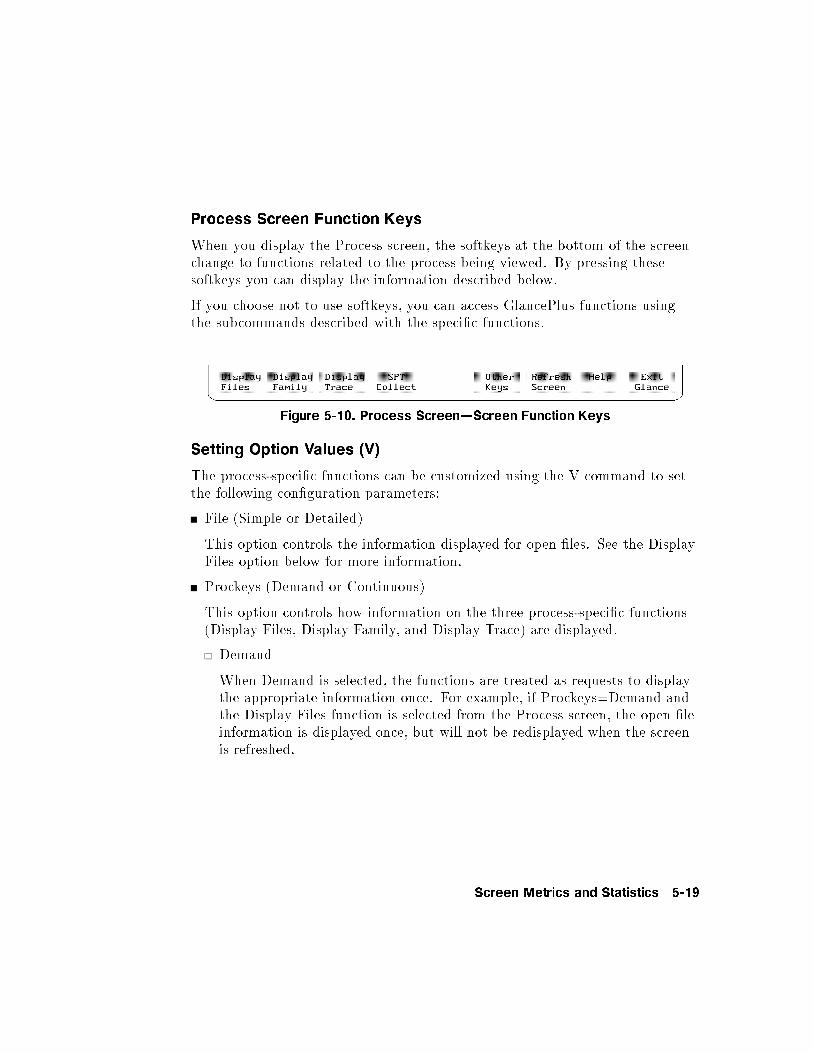
Process Screen Function Keys
When you display the Process screen, the softkeys at the bottom of the screenchange to functions related to the process being viewed. By pressing thesesoftkeys you can display the information described below.
If you choose not to use softkeys, you can access GlancePlus functions usingthe subcommands described with the speci�c functions.
Figure 5-10. Process Screen|Screen Function Keys
Setting Option Values (V)
The process-speci�c functions can be customized using the V command to setthe following con�guration parameters:
File (Simple or Detailed)
This option controls the information displayed for open �les. See the DisplayFiles option below for more information.
Prockeys (Demand or Continuous)
This option controls how information on the three process-speci�c functions(Display Files, Display Family, and Display Trace) are displayed.
Demand
When Demand is selected, the functions are treated as requests to displaythe appropriate information once. For example, if Prockeys=Demand andthe Display Files function is selected from the Process screen, the open �leinformation is displayed once, but will not be redisplayed when the screenis refreshed.
Screen Metrics and Statistics 5-19
Continuous
When Continuous is selected, the functions are treated as switchesenabling or disabling the continuous display of information. For example,if Prockeys=Continuous and the Display Files function key is selected fromthe Process screen, the open �le information is displayed, and redisplayedautomatically each time the screen is refreshed.
When a continuous-mode display is enabled, the Process State bars andMiscellaneous Process Information sections of the detail display aresuppressed to leave more room for the display just enabled. When thatdisplay is disabled, the Process State bars and Miscellaneous ProcessInformation are again included in the detail display.
Hint If you wish to see successive displays on the monitor forcomparison, set Prockeys = Demand, and press the DisplayFiles function key at the prompt Press RETURN to continue
(or enter a GLANCE command):. This is useful particularlyfor tracking the progress of the �le pointer in the �le display.It has the additional bene�t of not updating the rest of theprocess information; this can be very handy over a slow datacommunications link.
x�x�x�x�x�x�x�x�x�x�x�x�x�x�x�x�x�x�x�x�x�x�x�x�x�x�
Display
Files
Press the Display Files function key to see a list of open �les for the processbeing viewed. To display this data without using the function keys, press \1".(The \1" subcommand is only valid during the Process screen display.)
The Display Files function appears in two formats depending on how the Fileparameter is con�gured: File=simple or File=detailed. This parameter isset using the Set Option Values (V) command. The following formats occur:
5-20 Screen Metrics and Statistics
Simple File Display
If the File parameter is con�gured File=simple, the Simple File Displayformat occurs,
where:
Filename The �le name comprised of the �rst eight characters of theformal designator for the �le.
xxx% This �eld, following the �le name, indicates the progress of therecord pointer as compared with the end-of-�le pointer. Asample display might be:
DB01 /32% DB02 /45%
Detailed File Display
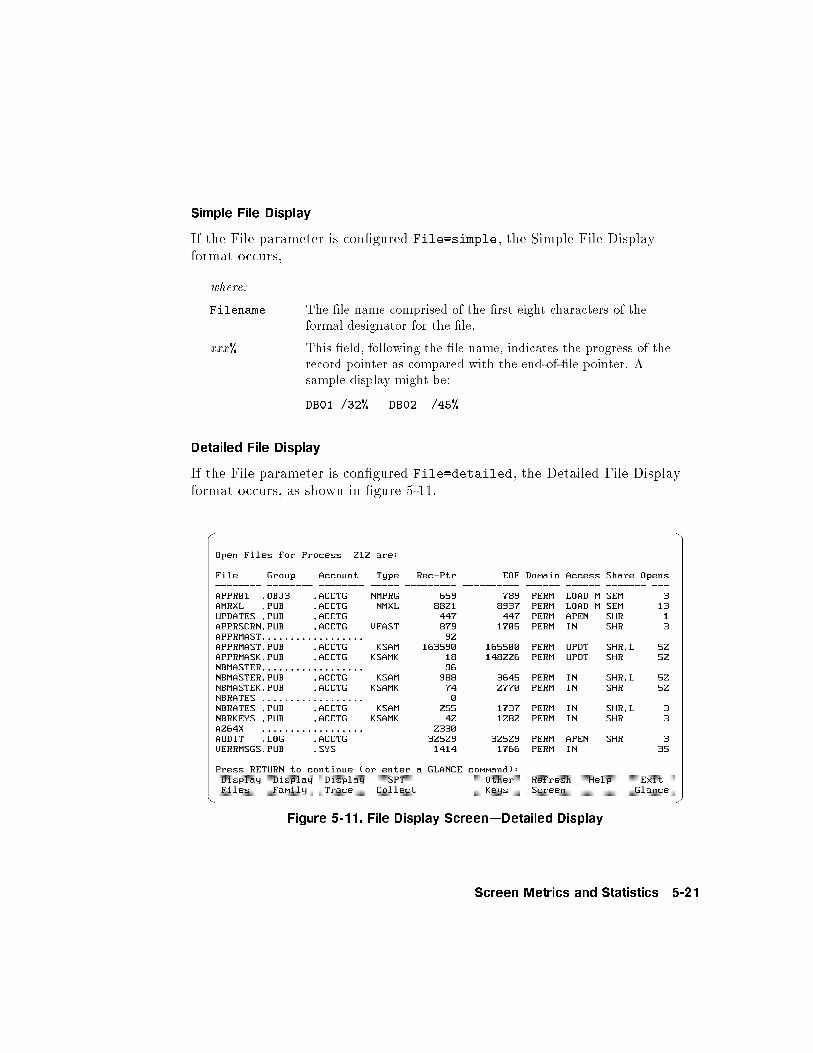
If the File parameter is con�gured File=detailed, the Detailed File Displayformat occurs, as shown in �gure 5-11.
Figure 5-11. File Display Screen|Detailed Display
Screen Metrics and Statistics 5-21
where:
File.Group.Account is the formal designator for the �le.
and
File The �le name or, if unnamed, a question mark (?).
Group The group name or, if unnamed, a series of dots (. . . . . . . . ).
Account The account name or, if unnamed, a series of dots (. . . . . . . . ).
Type File code mnemonic (as in LISTF,1 command)
or File code number (user-de�ned �le code)
or One of the following specially de�ned mnemonics:
RXRAW LaserRX raw log �le (�le code 1135).RXEXT LaserRX extracted log �le (�le code 1136).ROOT TurboIMAGE data base root �le (�le code -400).DSET TurboIMAGE data base data set (�le code -401).DBREM TurboIMAGE remote data base (�le code -402).DBILR TurboIMAGE ILR �le (�le code -404).PRIV Any other negative �le code.
or if the �le code is zero:
KSAM Foptions �le type = 1RIO Foptions �le type = 2KSAMX Foptions �le type = 3CIR Foptions �le type = 4SPOOL Foptions �le type = 5MSG Foptions �le type = 6
Rec-Pointer The current record pointer for the �le. (This usually points tothe last record accessed by the process.)
End-of-File The current end-of-�le value (disc �les only).
Domain The designation of the �le's condition. It may be:
NEW File is newly created, Foptions Domain = 0.PERM File is permanent, Foptions Domain = 1.TERM File is temporary, Foptions Domain = 2.OLD File is old permanent or temporary, Foptions
Domain = 3.
5-22 Screen Metrics and Statistics
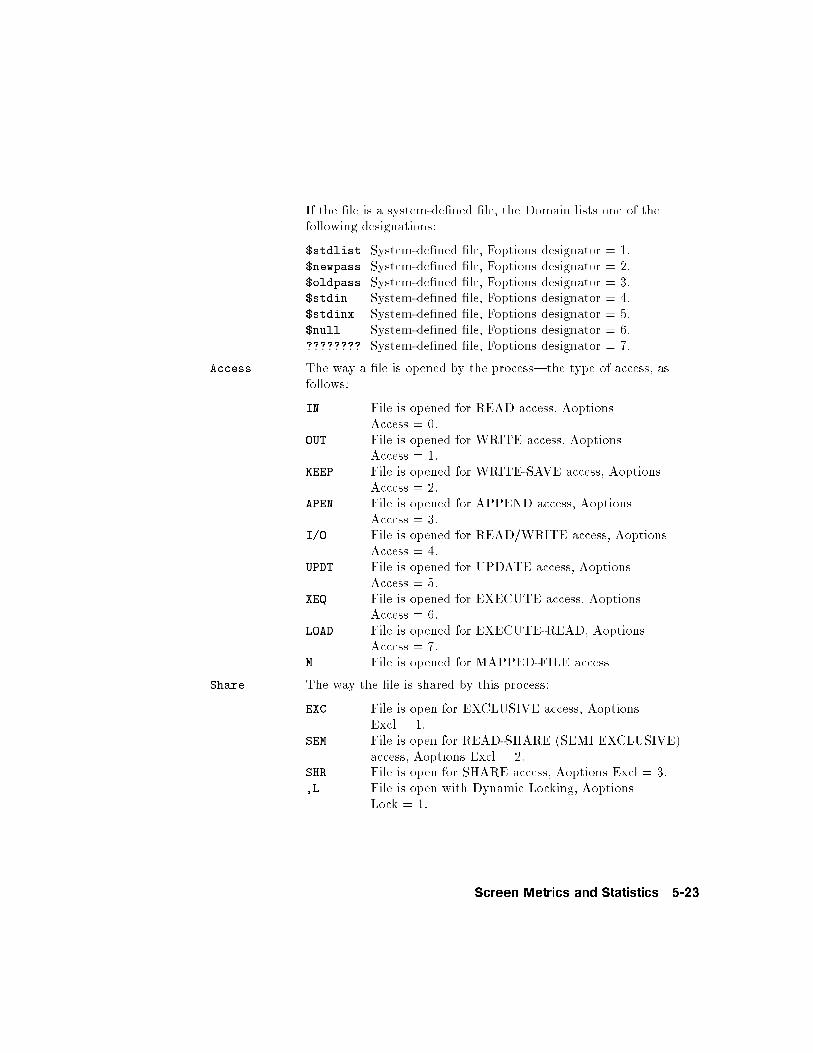
If the �le is a system-de�ned �le, the Domain lists one of thefollowing designations:
$stdlist System-de�ned �le, Foptions designator = 1.$newpass System-de�ned �le, Foptions designator = 2.$oldpass System-de�ned �le, Foptions designator = 3.$stdin System-de�ned �le, Foptions designator = 4.$stdinx System-de�ned �le, Foptions designator = 5.$null System-de�ned �le, Foptions designator = 6.???????? System-de�ned �le, Foptions designator = 7.
Access The way a �le is opened by the process|the type of access, asfollows:
IN File is opened for READ access, AoptionsAccess = 0.
OUT File is opened for WRITE access, AoptionsAccess = 1.
KEEP File is opened for WRITE-SAVE access, AoptionsAccess = 2.
APEN File is opened for APPEND access, AoptionsAccess = 3.
I/O File is opened for READ/WRITE access, AoptionsAccess = 4.
UPDT File is opened for UPDATE access, AoptionsAccess = 5.
XEQ File is opened for EXECUTE access, AoptionsAccess = 6.
LOAD File is opened for EXECUTE-READ, AoptionsAccess = 7.
M File is opened for MAPPED-FILE access
Share The way the �le is shared by this process:
EXC File is open for EXCLUSIVE access, AoptionsExcl = 1.
SEM File is open for READ-SHARE (SEMI EXCLUSIVE)access, Aoptions Excl = 2.
SHR File is open for SHARE access, Aoptions Excl = 3.,L File is open with Dynamic Locking, Aoptions
Lock = 1.
Screen Metrics and Statistics 5-23
Opens The number of times the �le has been opened.
TurboIMAGE data sets will have their record pointers and endof �les expressed as TurboIMAGE record numbers instead ofMPE �le blocks of media records.
See the MPE Intrinsics Manual under the FOPEN intrinsic for adetailed description of Foptions and Aoptions parameters.
x�x�x�x�x�x�x�x�x�x�x�x�x�x�x�x�x�x�x�x�x�x�x�x�x�x�
Display
Family
Press the Display Family function key to see the family tree for the processcurrently being viewed. To display the tree without using the function keys,press �2�. (The \2" subcommand is valid only during the Process screendisplay.)
If available, the parent process identi�cation number (PIN) is shown, followedby any and all children of the process. For each PIN displayed, the programbeing executed by the respective process is also presented.x�x�x�x�x�x�x�x�x�x�x�x�x�x�x�x�x�x�x�x�x�x�x�x�x�x�
Display
Trace
Pressing the Display Trace function key provides an HP Debug Procedure traceof the process being monitored. To display the trace without using the functionkeys, press �3�. (The \3" subcommand is valid only during the Process screendisplay.)
The �rst time you use the Display Trace key, a 5- to 30-second delay occurs.This is normal. Note, however, that a user will not be able to execute thiscommand without System Manager (SM) capability.
Consult the MPE XL System Debug Reference Manual for detailed informationon how to read a trace.
5-24 Screen Metrics and Statistics
x�x�x�x�x�x�x�x�x�x�x�x�x�x�x�x�x�x�x�x�x�x�x�x�x�x�
SPT
Collect
This function key allows you to use the HP SPT (Software Performance Tuner)product to create and run a program under HP GlancePlus for collectingmetrics on the process currently running. To display this process without usingfunction keys, press �4�. (The \4" subcommand is valid only during the Processscreen display.)
This command is optional and will operate only if the HP SPT product wasinstalled.
The data SPT collects about a process is placed in the default log �leSPTLOG. The default time for collecting process metrics via SPT is 5 minutes,but can be changed by using the job control word GLANCESPTTIME.Collection times between 1 and 60 minutes can be selected when using SPTfrom within GlancePlus. The �le SPTOUT is used for STDLIST messagescreated from the SPT process running under HP GlancePlus.
If desired, you can terminate a SPT process created by GlancePlus, by usingthe MPE command (:) and issuing the command SETVAR SPT_STOP TRUE. Theexistence of the SPT_STOP variable will cause the SPT process to terminate in15 to 30 seconds.
After creating and activating the SPT program, GlancePlus resumes normaloperation and its screens can be accessed.
Note HP GlancePlus limits SPT data collection to one active processat a time.
Screen Metrics and Statistics 5-25
Filter Selection Menu Variables
HP GlancePlus lets you de�ne any collection of programs, applications, or usersas a group and view them on the Filter Display screen. It combines the abilityto subset the Global screen's interesting processes to a group you wish to seewith the Job/Session screen's feature of summarizing their activity. You canpress the Filter command key (�F�) to see the current �lter values. You will beprompted to change them, or you can accept the current values by pressing�RETURN�.
Also, you can select whether to display information by program, user, orprede�ned application, and whether it must match one or all of those selectionsto become a part of the �lter group. You can select whether it should displayall processes matching your speci�cations or only those that exceed thresholdvalues. MPE wildcard attributes are accepted for the Program name and Userlogon.
To change a current �lter's value, type the key word for the �lter (shown inuppercase on the screen), then type the new value for that �lter.
Hints HP GlancePlus can recognize a key word by the minimumnumber of characters needed to identify it uniquely. In thiscase, since each key word is unique in the Filter Selectionmenu, the program can recognize a key word by the �rstletter of its name.
Multiple �lter commands can be entered by separating theindividual commands with semicolons (;).
Commands that have only two states|such as YES/no|canbe entered without a value to change to the opposite state.For example, if \use THRESHOLD values = YES/no" isYES, it can be changed to NO by entering the THRESHOLDcommand.
To remove a program name or user logon selection, enter thekey word without a value.
5-26 Screen Metrics and Statistics
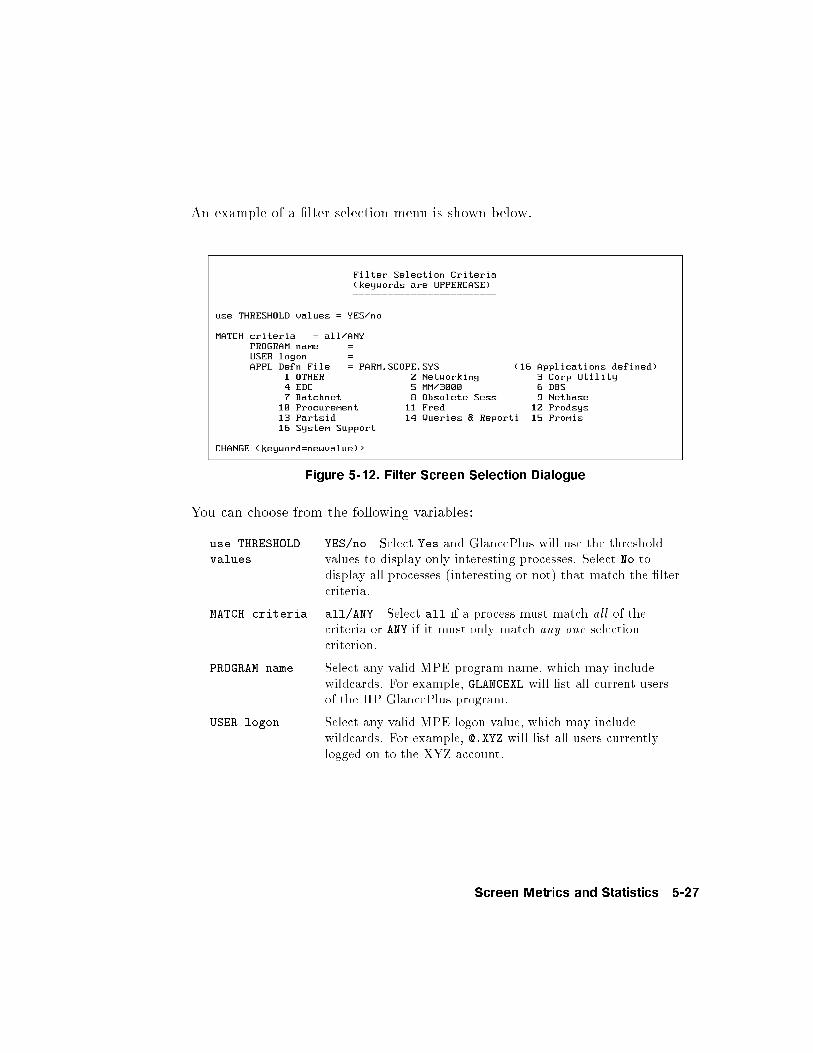
An example of a �lter selection menu is shown below.
Figure 5-12. Filter Screen Selection Dialogue
You can choose from the following variables:
use THRESHOLD
values
YES/no Select Yes and GlancePlus will use the thresholdvalues to display only interesting processes. Select No todisplay all processes (interesting or not) that match the �ltercriteria.
MATCH criteria all/ANY Select all if a process must match all of thecriteria or ANY if it must only match any one selectioncriterion.
PROGRAM name Select any valid MPE program name, which may includewildcards. For example, GLANCEXL will list all current usersof the HP GlancePlus program.
USER logon Select any valid MPE logon value, which may includewildcards. For example, @.XYZ will list all users currentlylogged on to the XYZ account.
Screen Metrics and Statistics 5-27
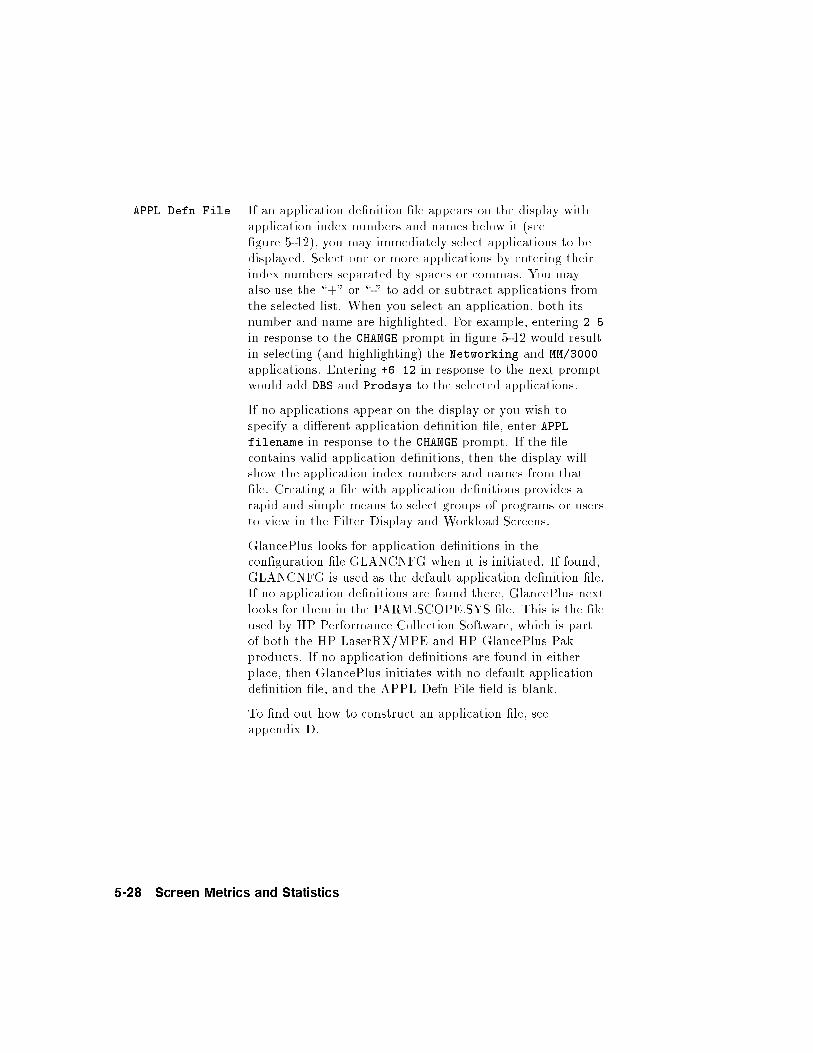
APPL Defn File If an application de�nition �le appears on the display withapplication index numbers and names below it (see�gure 5-12), you may immediately select applications to bedisplayed. Select one or more applications by entering theirindex numbers separated by spaces or commas. You mayalso use the \+" or \-" to add or subtract applications fromthe selected list. When you select an application, both itsnumber and name are highlighted. For example, entering 2 5
in response to the CHANGE prompt in �gure 5-12 would resultin selecting (and highlighting) the Networking and MM/3000
applications. Entering +6 12 in response to the next promptwould add DBS and Prodsys to the selected applications.
If no applications appear on the display or you wish tospecify a di�erent application de�nition �le, enter APPLfilename in response to the CHANGE prompt. If the �lecontains valid application de�nitions, then the display willshow the application index numbers and names from that�le. Creating a �le with application de�nitions provides arapid and simple means to select groups of programs or usersto view in the Filter Display and Workload Screens.
GlancePlus looks for application de�nitions in thecon�guration �le GLANCNFG when it is initiated. If found,GLANCNFG is used as the default application de�nition �le.If no application de�nitions are found there, GlancePlus nextlooks for them in the PARM.SCOPE.SYS �le. This is the �leused by HP Performance Collection Software, which is partof both the HP LaserRX/MPE and HP GlancePlus Pakproducts. If no application de�nitions are found in eitherplace, then GlancePlus initiates with no default applicationde�nition �le, and the APPL Defn File �eld is blank.
To �nd out how to construct an application �le, seeappendix D.
5-28 Screen Metrics and Statistics
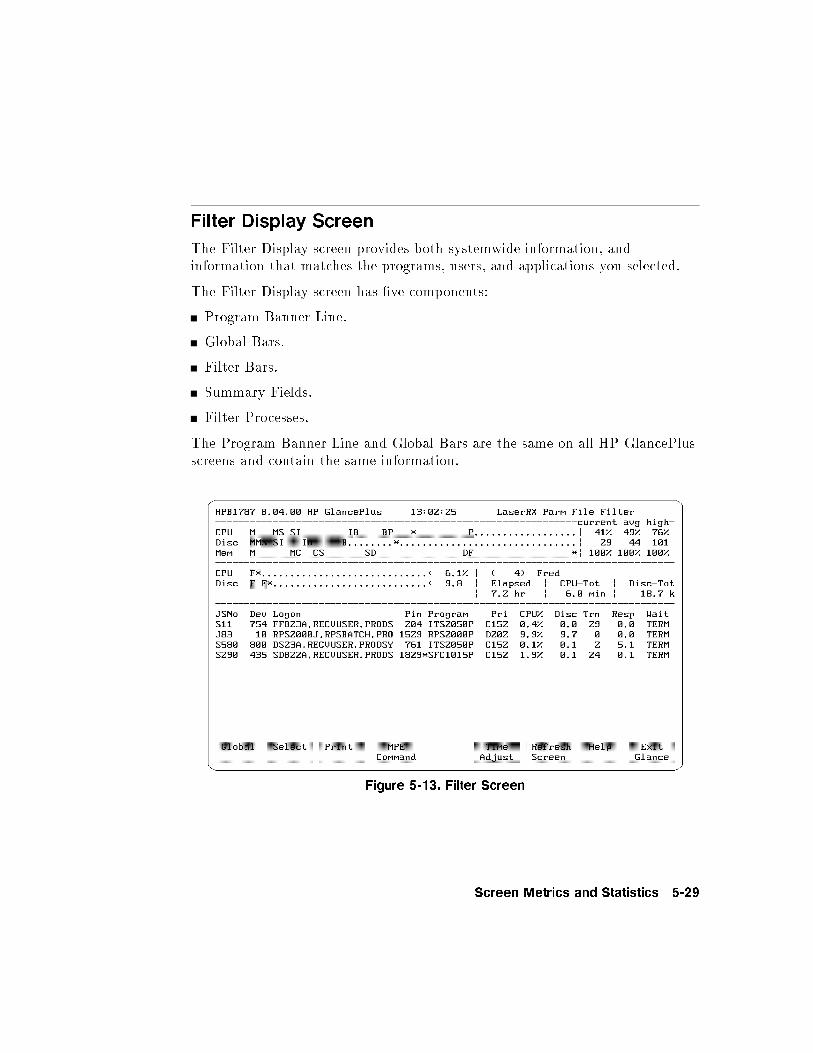
Filter Display Screen
The Filter Display screen provides both systemwide information, andinformation that matches the programs, users, and applications you selected.
The Filter Display screen has �ve components:
Program Banner Line.
Global Bars.
Filter Bars.
Summary Fields.
Filter Processes.
The Program Banner Line and Global Bars are the same on all HP GlancePlusscreens and contain the same information.
Figure 5-13. Filter Screen
Screen Metrics and Statistics 5-29
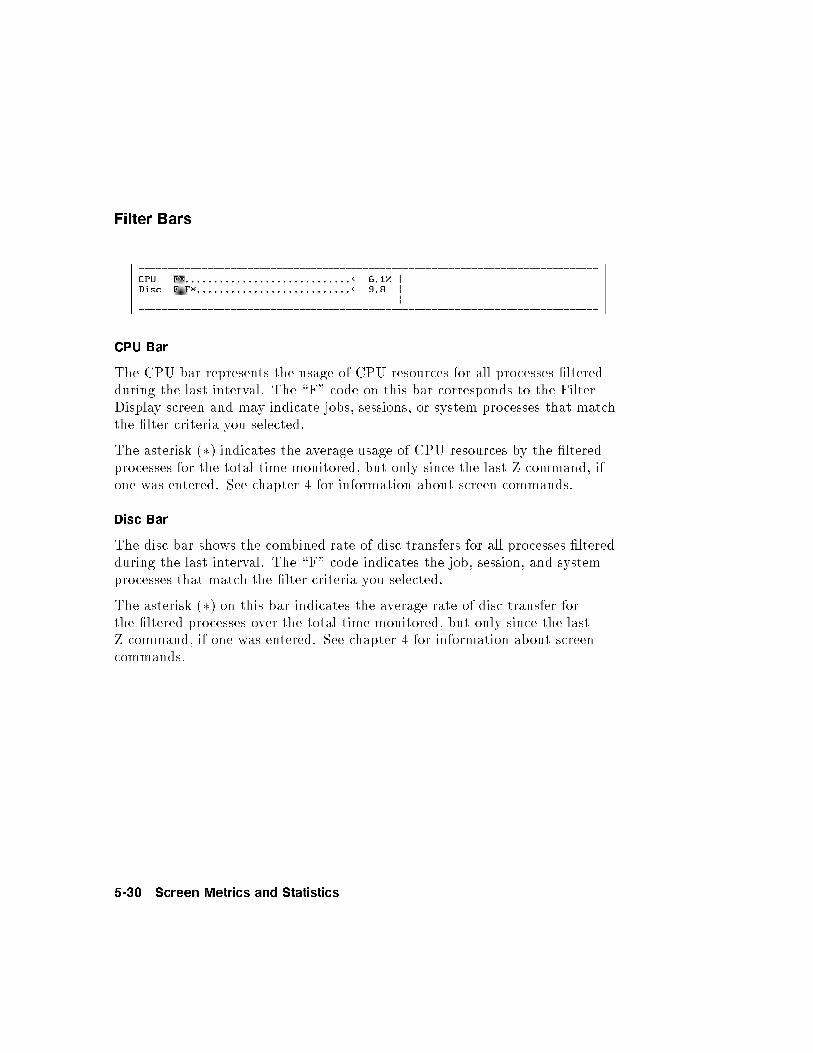
Filter Bars
CPU Bar
The CPU bar represents the usage of CPU resources for all processes �lteredduring the last interval. The \F" code on this bar corresponds to the FilterDisplay screen and may indicate jobs, sessions, or system processes that matchthe �lter criteria you selected.
The asterisk (�) indicates the average usage of CPU resources by the �lteredprocesses for the total time monitored, but only since the last Z command, ifone was entered. See chapter 4 for information about screen commands.
Disc Bar
The disc bar shows the combined rate of disc transfers for all processes �lteredduring the last interval. The \F" code indicates the job, session, and systemprocesses that match the �lter criteria you selected.
The asterisk (�) on this bar indicates the average rate of disc transfer forthe �ltered processes over the total time monitored, but only since the lastZ command, if one was entered. See chapter 4 for information about screencommands.
5-30 Screen Metrics and Statistics
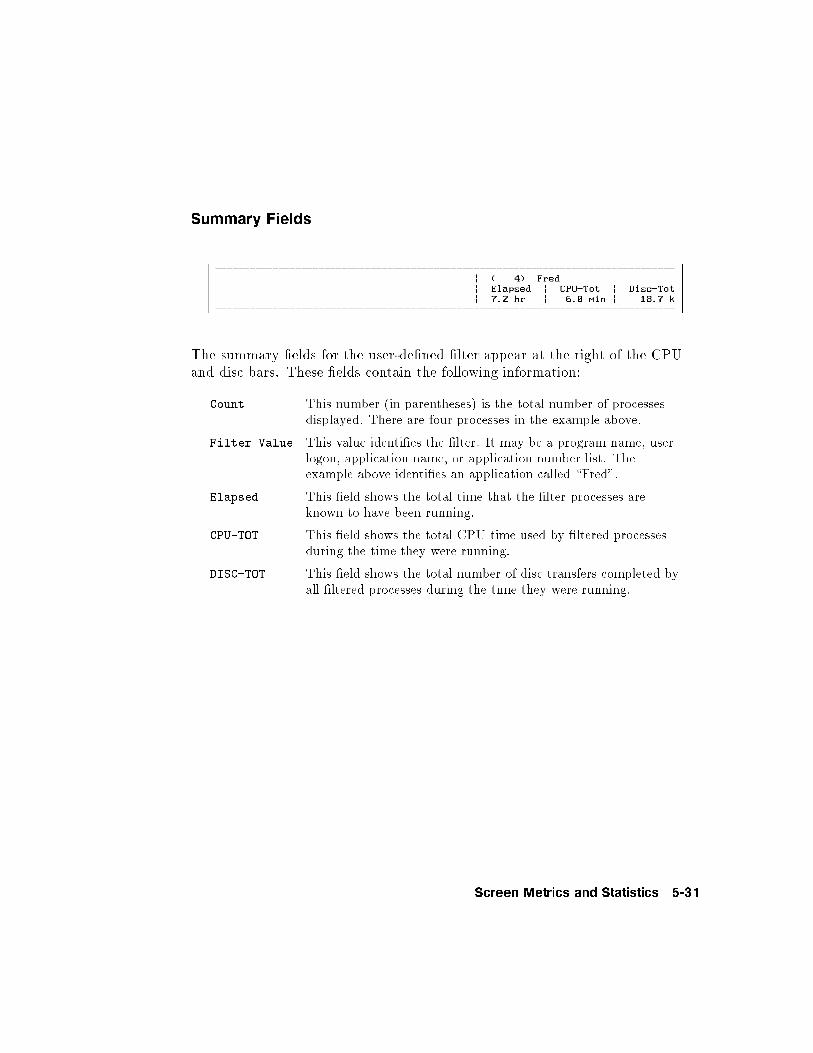
Summary Fields
The summary �elds for the user-de�ned �lter appear at the right of the CPUand disc bars. These �elds contain the following information:
Count This number (in parentheses) is the total number of processesdisplayed. There are four processes in the example above.
Filter Value This value identi�es the �lter. It may be a program name, userlogon, application name, or application number list. Theexample above identi�es an application called \Fred".
Elapsed This �eld shows the total time that the �lter processes areknown to have been running.
CPU-TOT This �eld shows the total CPU time used by �ltered processesduring the time they were running.
DISC-TOT This �eld shows the total number of disc transfers completed byall �ltered processes during the time they were running.
Screen Metrics and Statistics 5-31
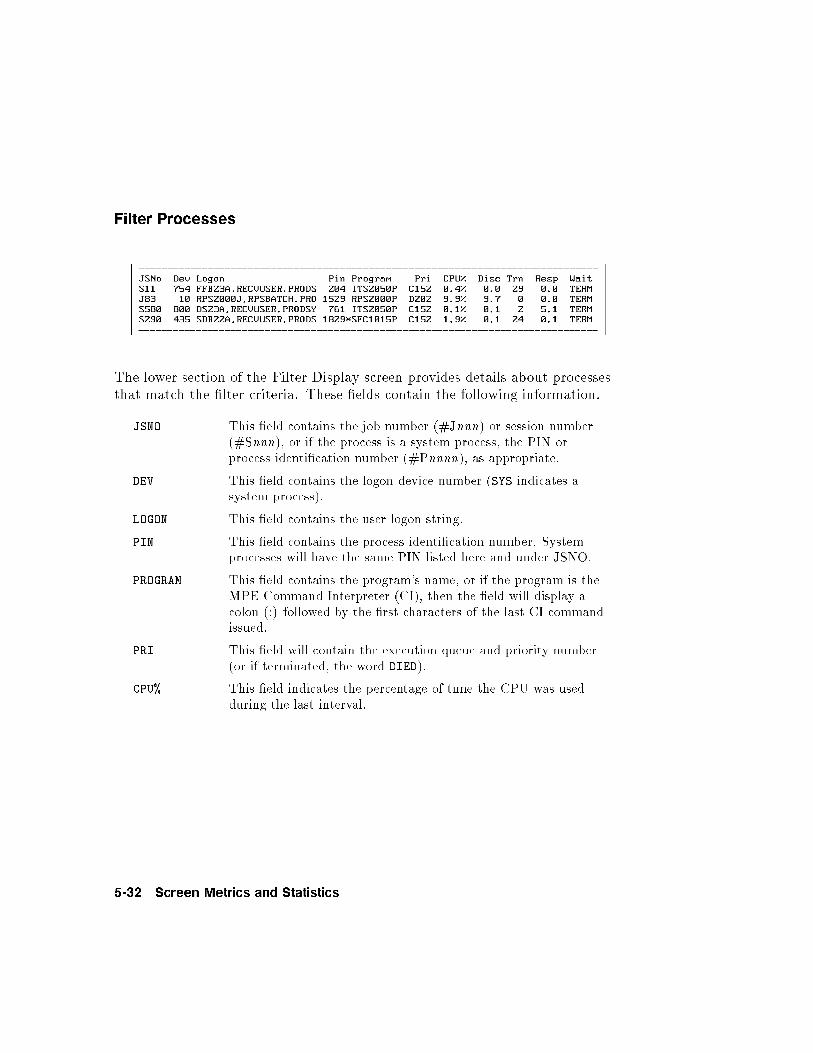
Filter Processes
The lower section of the Filter Display screen provides details about processesthat match the �lter criteria. These �elds contain the following information.
JSNO This �eld contains the job number (#Jnnn) or session number(#Snnn), or if the process is a system process, the PIN orprocess identi�cation number (#Pnnnn), as appropriate.
DEV This �eld contains the logon device number (SYS indicates asystem process).
LOGON This �eld contains the user logon string.
PIN This �eld contains the process identi�cation number. Systemprocesses will have the same PIN listed here and under JSNO.
PROGRAM This �eld contains the program's name, or if the program is theMPE Command Interpreter (CI), then the �eld will display acolon (:) followed by the �rst characters of the last CI commandissued.
PRI This �eld will contain the execution queue and priority number(or if terminated, the word DIED).
CPU% This �eld indicates the percentage of time the CPU was usedduring the last interval.
5-32 Screen Metrics and Statistics
DISC This �eld indicates the rate of physical disc transfers (numberper second) during the last interval.
TRN This �eld indicates the rate of terminal transactions (numberper minute) during the last interval.
RESP This �eld indicates the terminal response time (in seconds)during the last interval.
WAIT This �eld indicates the current resource for which the process iswaiting.
Screen Metrics and Statistics 5-33
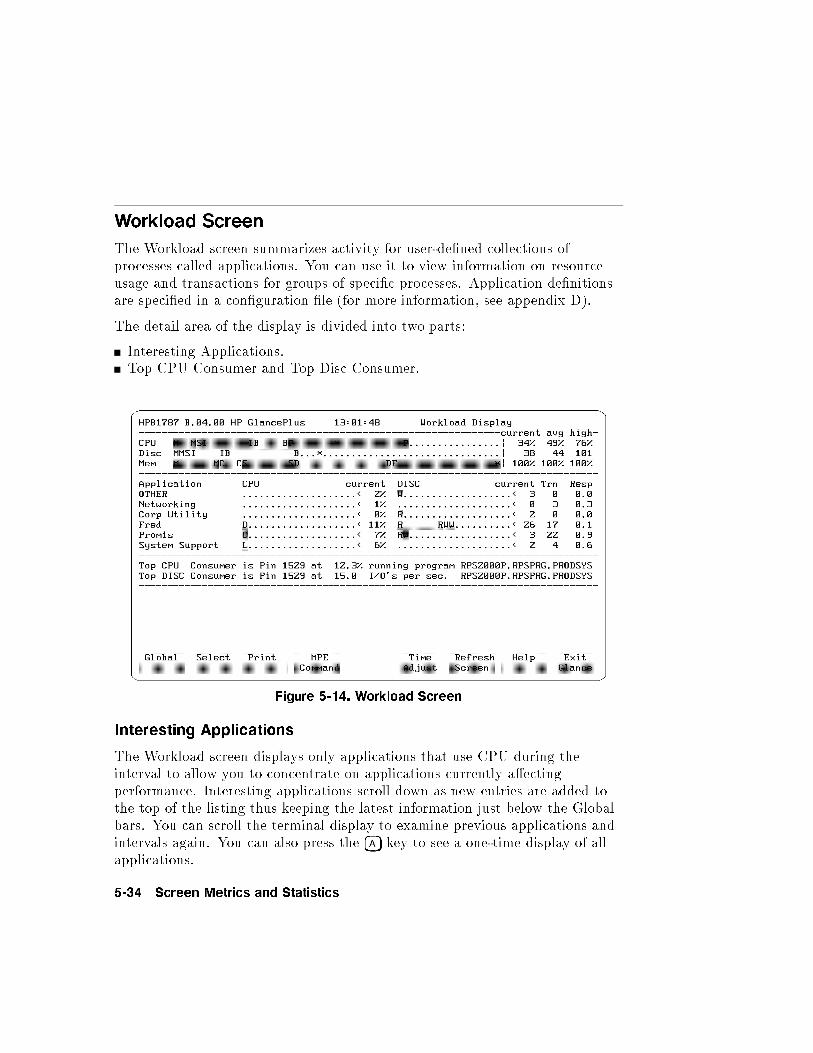
Workload Screen
The Workload screen summarizes activity for user-de�ned collections ofprocesses called applications. You can use it to view information on resourceusage and transactions for groups of speci�c processes. Application de�nitionsare speci�ed in a con�guration �le (for more information, see appendix D).
The detail area of the display is divided into two parts:
Interesting Applications.Top CPU Consumer and Top Disc Consumer.
Figure 5-14. Workload Screen
Interesting Applications
The Workload screen displays only applications that use CPU during theinterval to allow you to concentrate on applications currently a�ectingperformance. Interesting applications scroll down as new entries are added tothe top of the listing thus keeping the latest information just below the Globalbars. You can scroll the terminal display to examine previous applications andintervals again. You can also press the �A� key to see a one-time display of allapplications.
5-34 Screen Metrics and Statistics
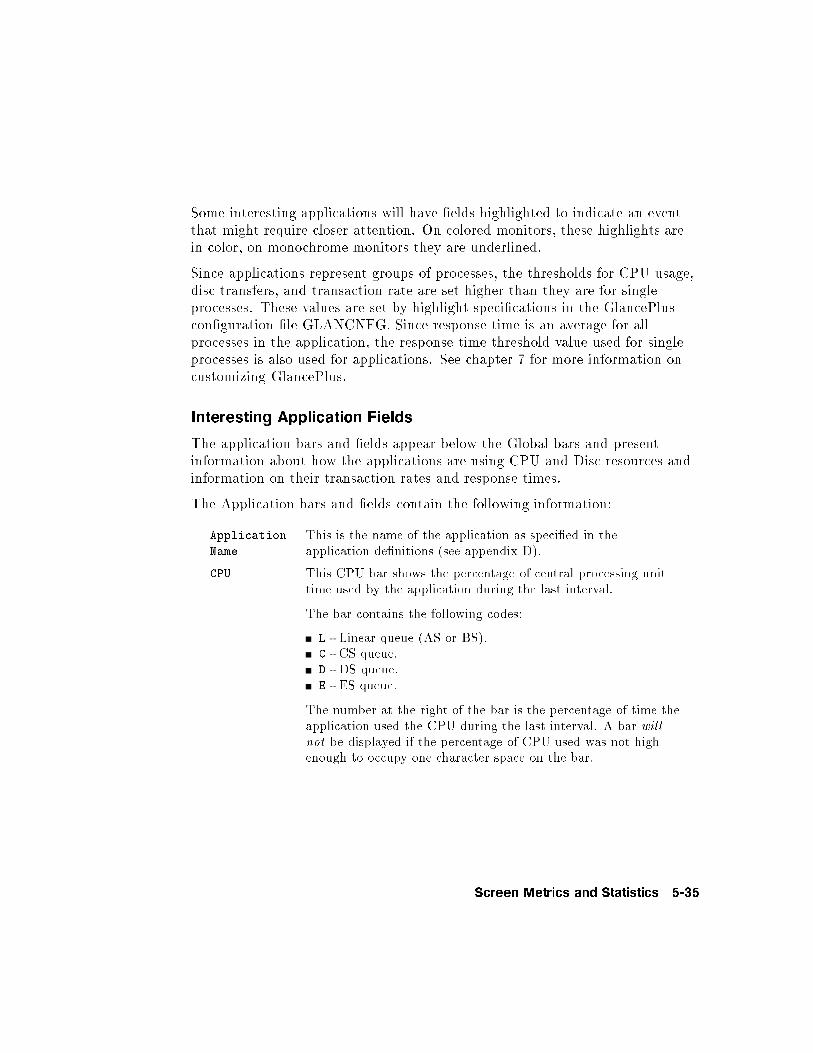
Some interesting applications will have �elds highlighted to indicate an eventthat might require closer attention. On colored monitors, these highlights arein color, on monochrome monitors they are underlined.
Since applications represent groups of processes, the thresholds for CPU usage,disc transfers, and transaction rate are set higher than they are for singleprocesses. These values are set by highlight speci�cations in the GlancePluscon�guration �le GLANCNFG. Since response time is an average for allprocesses in the application, the response time threshold value used for singleprocesses is also used for applications. See chapter 7 for more information oncustomizing GlancePlus.
Interesting Application Fields
The application bars and �elds appear below the Global bars and presentinformation about how the applications are using CPU and Disc resources andinformation on their transaction rates and response times.
The Application bars and �elds contain the following information:
Application
Name
This is the name of the application as speci�ed in theapplication de�nitions (see appendix D).
CPU This CPU bar shows the percentage of central processing unittime used by the application during the last interval.
The bar contains the following codes:
L - Linear queue (AS or BS).C - CS queue.D - DS queue.E - ES queue.
The number at the right of the bar is the percentage of time theapplication used the CPU during the last interval. A bar willnot be displayed if the percentage of CPU used was not highenough to occupy one character space on the bar.
Screen Metrics and Statistics 5-35
DISC This bar shows the application's disc transfer rate(transfers/second) during the interval.
The bar contains the following codes:
R - Disc reads.W - Disc writes.
The number at the right of the bar is the application's disctransfer rate during the interval.
TRN This �eld indicates the rate of terminal transactions(number/minute) during the last interval.
RESP This �eld indicates the average terminal response time (seconds)during the last interval.
Top CPU and Disc Consumer
GlancePlus names the processes that are consuming the most CPU resourcesand the most Disc resources on the two lines following the application bars andsummary �elds.
The top CPU consumer is identi�ed by its PIN (process identi�cation number),the percentage of CPU it used during the last interval, and the program nameor MPE/iX Command Interpreter (CI) command last issued. If an MPE/iXsystem process is the top consumer, it is identi�ed by the program name or bythe text: running program on behalf of MPE/iX.
The top Disc consumer is identi�ed in the same way as the top CPU consumerexcept that the rate of disc transfers (transfers/second) for the process duringthe last interval is displayed instead of CPU percentage. If no disc activityoccurred during the interval, the Top Disc Consumer line will not appear onthe screen.
Note If you do not have System Manager (SM) capability, you willsee the letters CI instead of the command string text when theprogram is a Command Interpreter.
5-36 Screen Metrics and Statistics
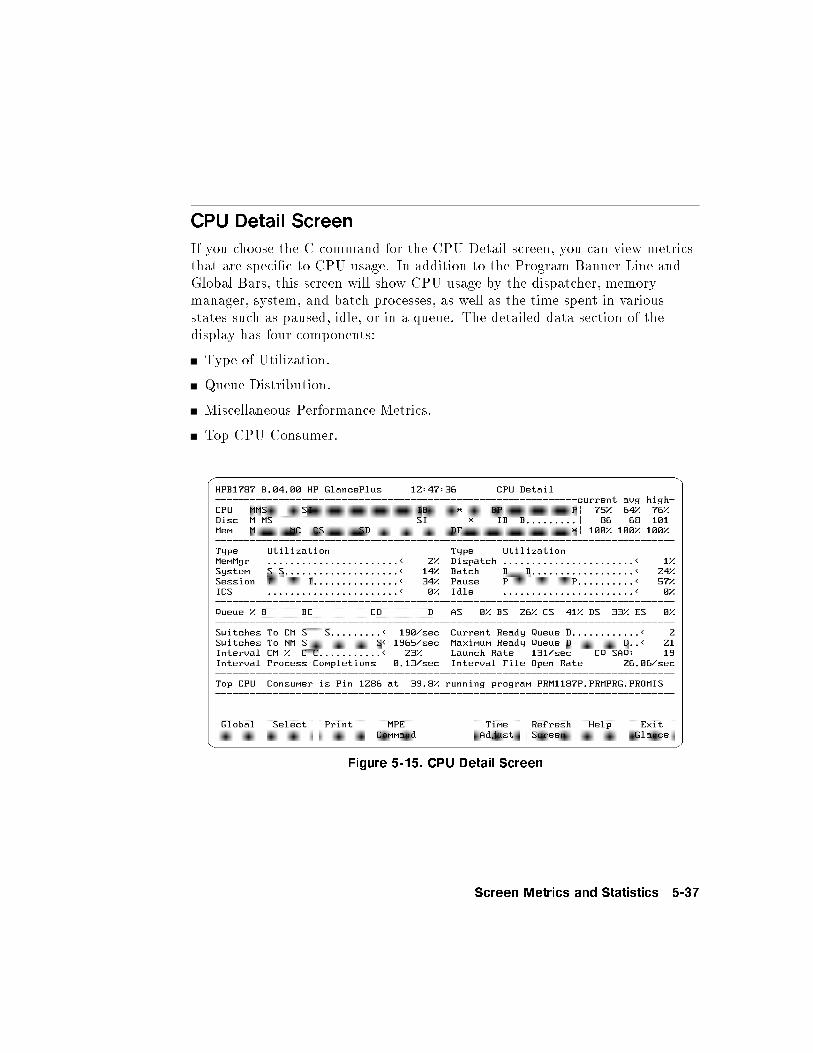
CPU Detail Screen
If you choose the C command for the CPU Detail screen, you can view metricsthat are speci�c to CPU usage. In addition to the Program Banner Line andGlobal Bars, this screen will show CPU usage by the dispatcher, memorymanager, system, and batch processes, as well as the time spent in variousstates such as paused, idle, or in a queue. The detailed data section of thedisplay has four components:
Type of Utilization.
Queue Distribution.
Miscellaneous Performance Metrics.
Top CPU Consumer.
Figure 5-15. CPU Detail Screen
Screen Metrics and Statistics 5-37
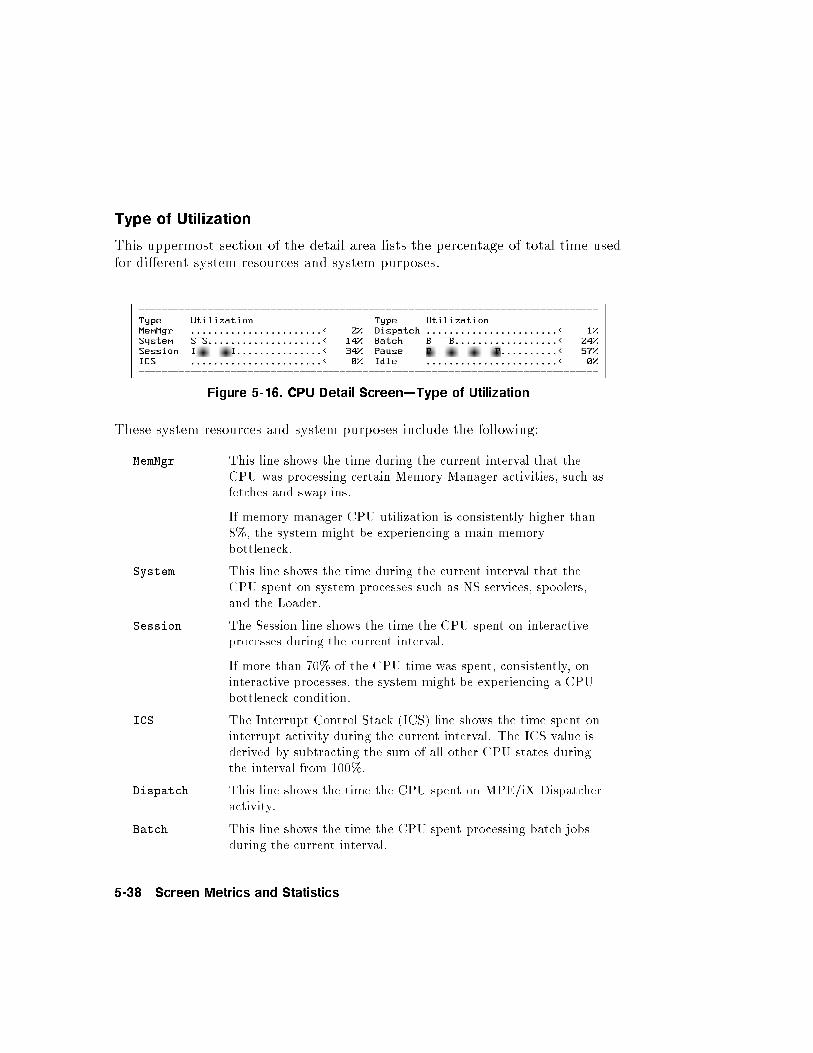
Type of Utilization
This uppermost section of the detail area lists the percentage of total time usedfor di�erent system resources and system purposes.
Figure 5-16. CPU Detail Screen|Type of Utilization
These system resources and system purposes include the following:
MemMgr This line shows the time during the current interval that theCPU was processing certain Memory Manager activities, such asfetches and swap ins.
If memory manager CPU utilization is consistently higher than8%, the system might be experiencing a main memorybottleneck.
System This line shows the time during the current interval that theCPU spent on system processes such as NS services, spoolers,and the Loader.
Session The Session line shows the time the CPU spent on interactiveprocesses during the current interval.
If more than 70% of the CPU time was spent, consistently, oninteractive processes, the system might be experiencing a CPUbottleneck condition.
ICS The Interrupt Control Stack (ICS) line shows the time spent oninterrupt activity during the current interval. The ICS value isderived by subtracting the sum of all other CPU states duringthe interval from 100%.
Dispatch This line shows the time the CPU spent on MPE/iX Dispatcheractivity.
Batch This line shows the time the CPU spent processing batch jobsduring the current interval.
5-38 Screen Metrics and Statistics
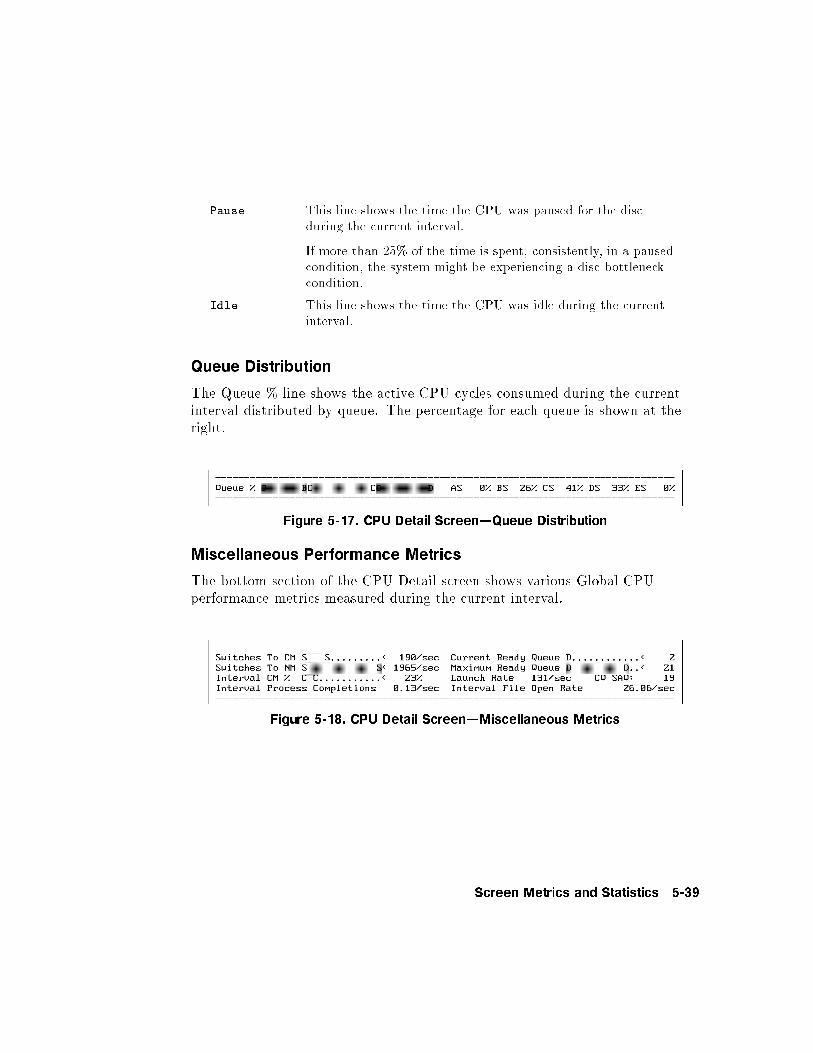
Pause This line shows the time the CPU was paused for the discduring the current interval.
If more than 25% of the time is spent, consistently, in a pausedcondition, the system might be experiencing a disc bottleneckcondition.
Idle This line shows the time the CPU was idle during the currentinterval.
Queue Distribution
The Queue % line shows the active CPU cycles consumed during the currentinterval distributed by queue. The percentage for each queue is shown at theright.
Figure 5-17. CPU Detail Screen|Queue Distribution
Miscellaneous Performance Metrics
The bottom section of the CPU Detail screen shows various Global CPUperformance metrics measured during the current interval.
Figure 5-18. CPU Detail Screen|Miscellaneous Metrics
Screen Metrics and Statistics 5-39
Switches to CM This shows the rate of switching from Native Mode toCompatibility Mode. [Bar Scale: 0 to 500 switches per second.The number to the right of the bar shows the actual switch rateper second up to a maximum of 9,999.]
Switches to NM This shows the rate of switching from Compatibility Mode toNative Mode. [Bar Scale: 0 to 500 switches per second. Thenumber to the right of the bar shows the actual switch rate persecond up to a maximum of 9,999.]
5-40 Screen Metrics and Statistics
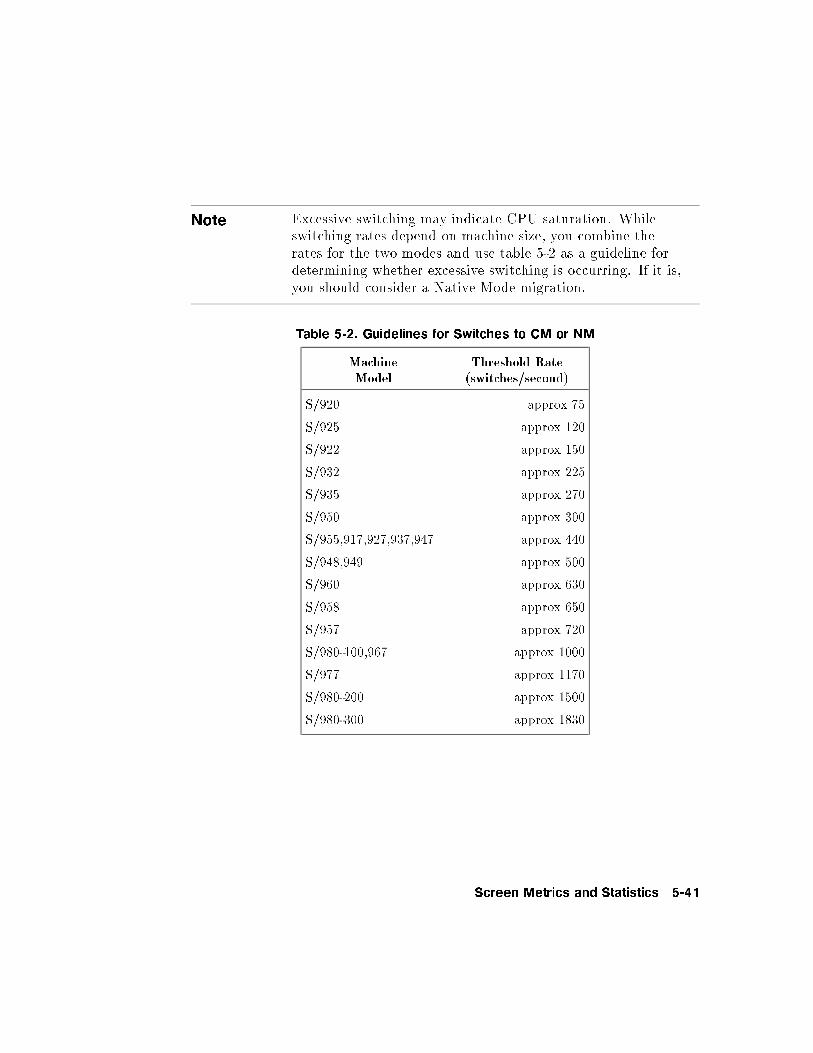
Note Excessive switching may indicate CPU saturation. Whileswitching rates depend on machine size, you combine therates for the two modes and use table 5-2 as a guideline fordetermining whether excessive switching is occurring. If it is,you should consider a Native Mode migration.
Table 5-2. Guidelines for Switches to CM or NM
MachineModel
Threshold Rate(switches/second)
S/920 approx 75
S/925 approx 120
S/922 approx 150
S/932 approx 225
S/935 approx 270
S/950 approx 300
S/955,917,927,937,947 approx 440
S/948,949 approx 500
S/960 approx 630
S/958 approx 650
S/957 approx 720
S/980-100,967 approx 1000
S/977 approx 1170
S/980-200 approx 1500
S/980-300 approx 1830
Screen Metrics and Statistics 5-41
Interval CM % This shows the percentage of time the CPU was in CompatibilityMode between switches.
Interval Process
Completions
This shows the rate of process completions for the current interval(number of processes completed per second).
This provides information about the workload characteristics ofthe machine. A high rate of process completions, for instance,may indicate a CPU bottleneck due to excessive or improperprocess handling. A sustained rate greater than 0.50 may beconsidered excessive.
Current
Ready Queue
This shows the number of processes waiting for the CPU. [Scale:0 to 25 processes.]
Maximum
Ready Queue
This shows the maximum number of processes waiting for theCPU since GlancePlus was started or since the MPE/iXMeasurement Interface was enabled. [Scale: 0 to 25 processes.]
Launch Rate This shows the rate of launches during the current time interval(number of launches per second). A launch occurs every time theMPE/iX Dispatcher gives a process control of the CPU.
CQ SAQ This is the System Average Quantum (SAQ) for the C queue(CQ). This value represents the current time limit (inmilliseconds) during which a process in C queue can retain use ofthe CPU. The SAQ value, which is recalculated continuously bythe dispatcher, must be a value between the minimum (MIN) andmaximum (MAX) parameters of the current CQ setting.
Interval
File Open Rate
This is the rate that �les are being opened during the currentinterval (number of �les opened per second). The File Open Ratecan be used to judge the workload characteristics of the system.A sustained rate greater than 35 �les opened per second mightindicate a CPU bottleneck condition or, possibly, poor applicationdesign.
5-42 Screen Metrics and Statistics
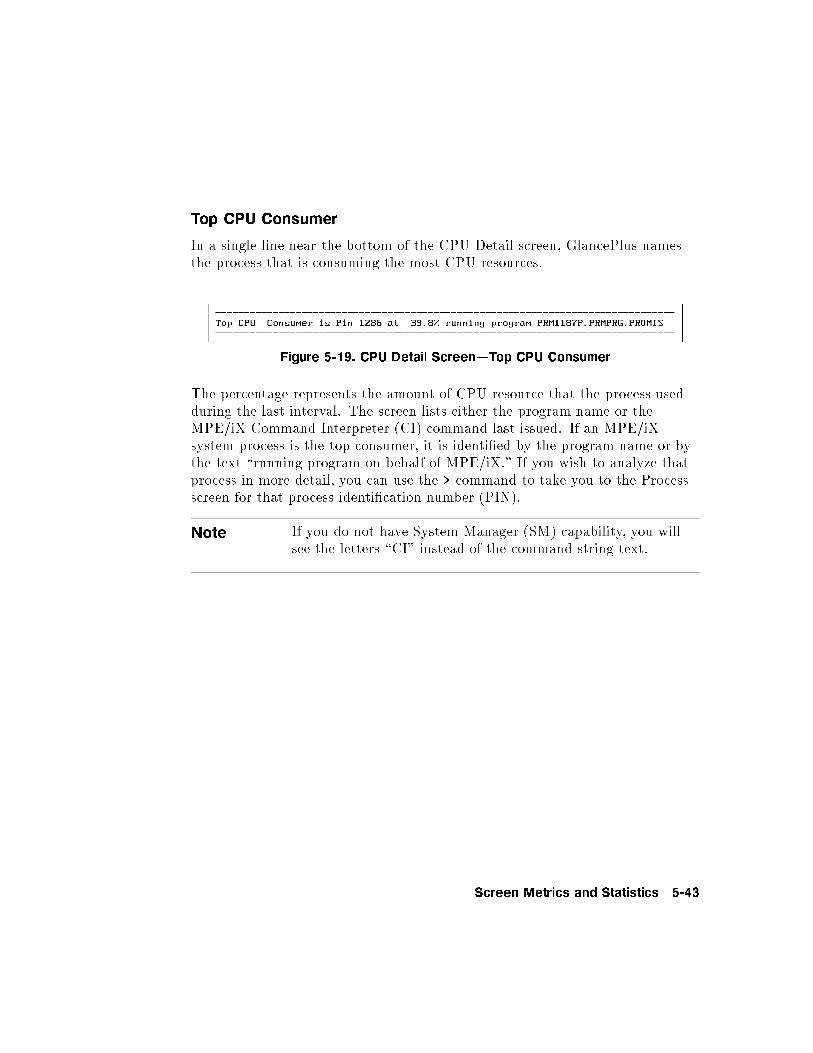
Top CPU Consumer
In a single line near the bottom of the CPU Detail screen, GlancePlus namesthe process that is consuming the most CPU resources.
Figure 5-19. CPU Detail Screen|Top CPU Consumer
The percentage represents the amount of CPU resource that the process usedduring the last interval. The screen lists either the program name or theMPE/iX Command Interpreter (CI) command last issued. If an MPE/iXsystem process is the top consumer, it is identi�ed by the program name or bythe text \running program on behalf of MPE/iX." If you wish to analyze thatprocess in more detail, you can use the > command to take you to the Processscreen for that process identi�cation number (PIN).
Note If you do not have System Manager (SM) capability, you willsee the letters \CI" instead of the command string text.
Screen Metrics and Statistics 5-43
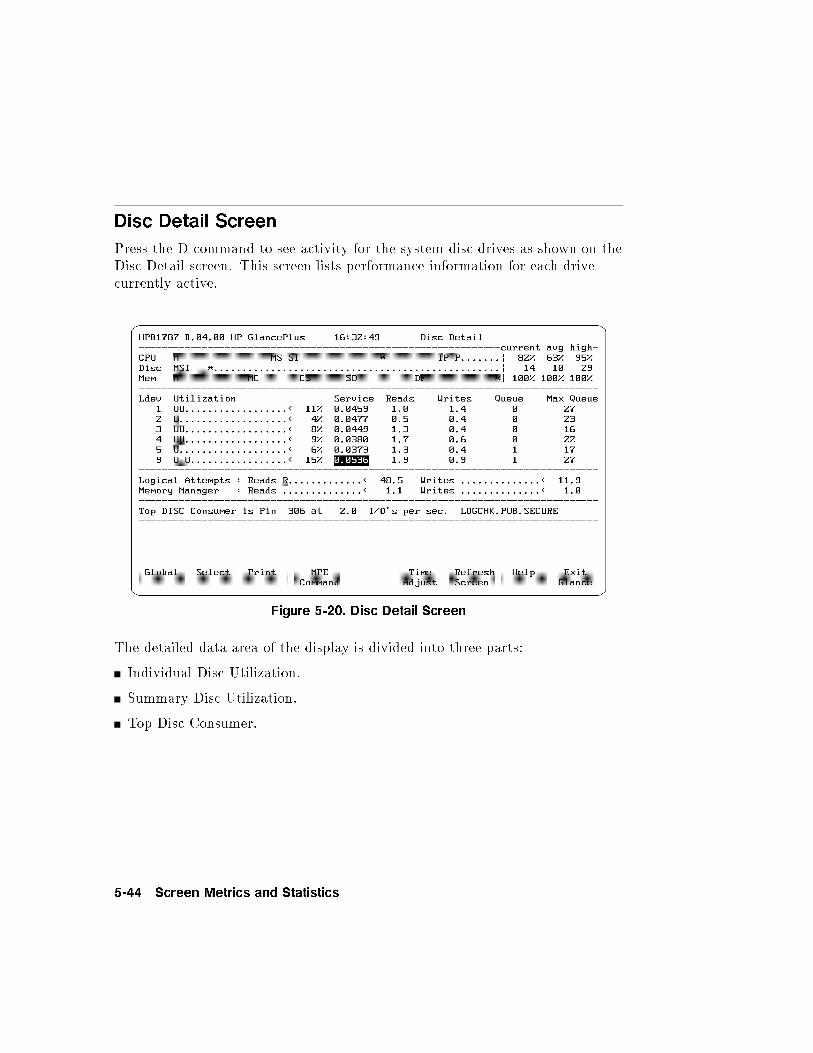
Disc Detail Screen
Press the D command to see activity for the system disc drives as shown on theDisc Detail screen. This screen lists performance information for each drivecurrently active.
Figure 5-20. Disc Detail Screen
The detailed data area of the display is divided into three parts:
Individual Disc Utilization.
Summary Disc Utilization.
Top Disc Consumer.
5-44 Screen Metrics and Statistics
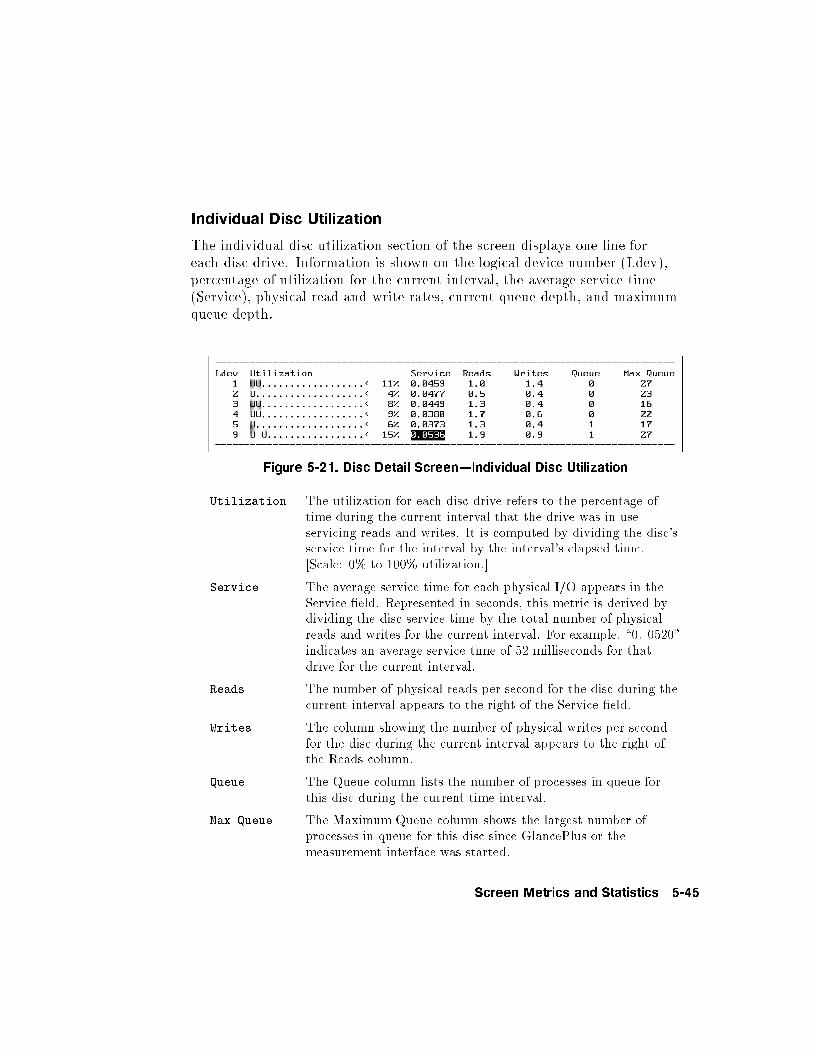
Individual Disc Utilization
The individual disc utilization section of the screen displays one line foreach disc drive. Information is shown on the logical device number (Ldev),percentage of utilization for the current interval, the average service time(Service), physical read and write rates, current queue depth, and maximumqueue depth.
Figure 5-21. Disc Detail Screen|Individual Disc Utilization
Utilization The utilization for each disc drive refers to the percentage oftime during the current interval that the drive was in useservicing reads and writes. It is computed by dividing the disc'sservice time for the interval by the interval's elapsed time.[Scale: 0% to 100% utilization.]
Service The average service time for each physical I/O appears in theService �eld. Represented in seconds, this metric is derived bydividing the disc service time by the total number of physicalreads and writes for the current interval. For example, \0. 0520"indicates an average service time of 52 milliseconds for thatdrive for the current interval.
Reads The number of physical reads per second for the disc during thecurrent interval appears to the right of the Service �eld.
Writes The column showing the number of physical writes per secondfor the disc during the current interval appears to the right ofthe Reads column.
Queue The Queue column lists the number of processes in queue forthis disc during the current time interval.
Max Queue The Maximum Queue column shows the largest number ofprocesses in queue for this disc since GlancePlus or themeasurement interface was started.
Screen Metrics and Statistics 5-45
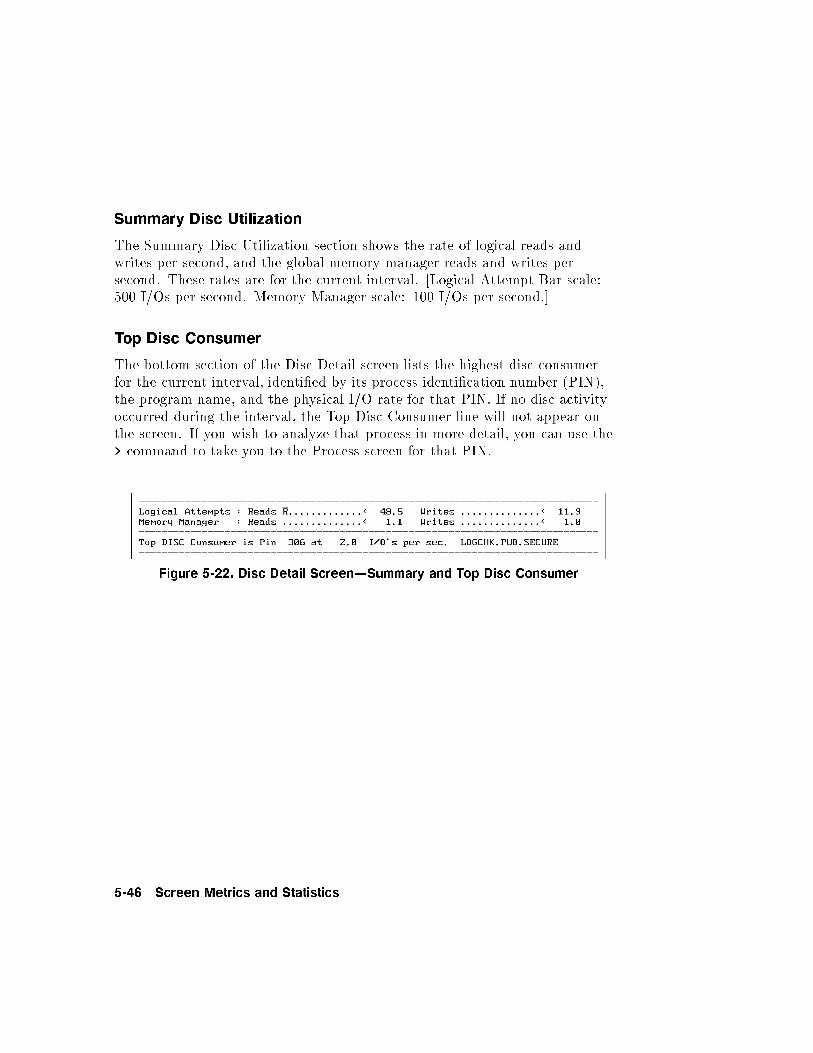
Summary Disc Utilization
The Summary Disc Utilization section shows the rate of logical reads andwrites per second, and the global memory manager reads and writes persecond. These rates are for the current interval. [Logical Attempt Bar scale:500 I/Os per second. Memory Manager scale: 100 I/Os per second.]
Top Disc Consumer
The bottom section of the Disc Detail screen lists the highest disc consumerfor the current interval, identi�ed by its process identi�cation number (PIN),the program name, and the physical I/O rate for that PIN. If no disc activityoccurred during the interval, the Top Disc Consumer line will not appear onthe screen. If you wish to analyze that process in more detail, you can use the> command to take you to the Process screen for that PIN.
Figure 5-22. Disc Detail Screen|Summary and Top Disc Consumer
5-46 Screen Metrics and Statistics
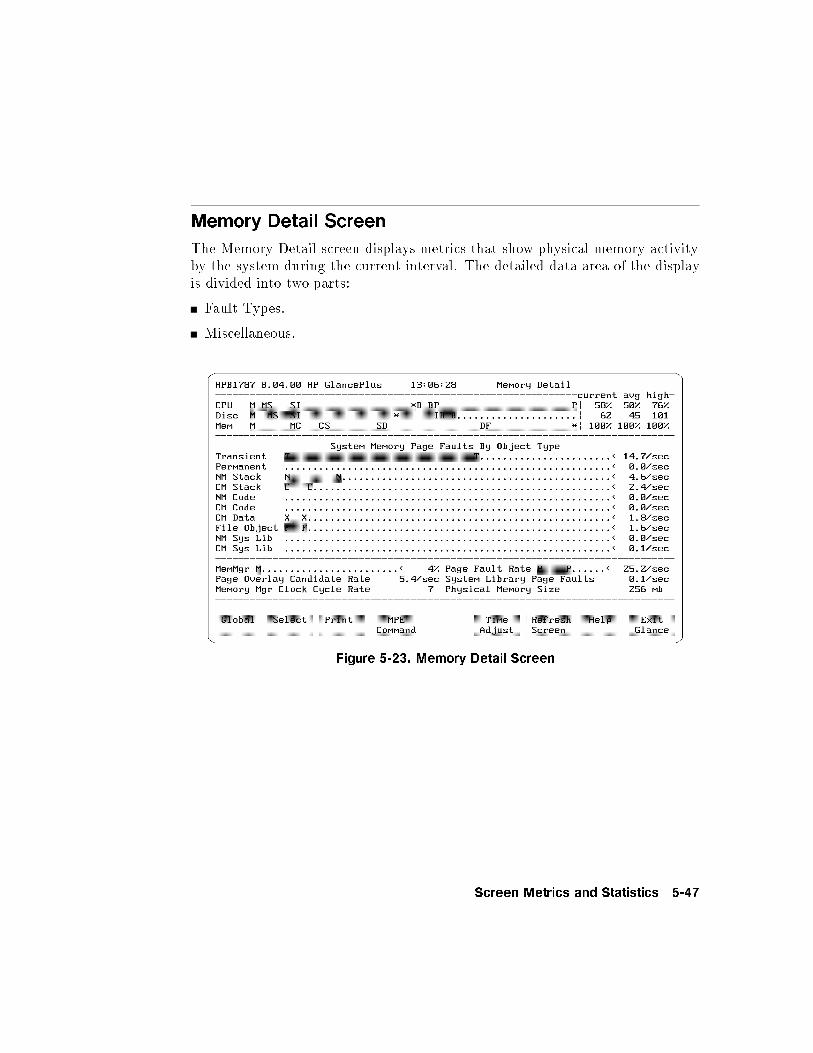
Memory Detail Screen
The Memory Detail screen displays metrics that show physical memory activityby the system during the current interval. The detailed data area of the displayis divided into two parts:
Fault Types.
Miscellaneous.
Figure 5-23. Memory Detail Screen
Screen Metrics and Statistics 5-47
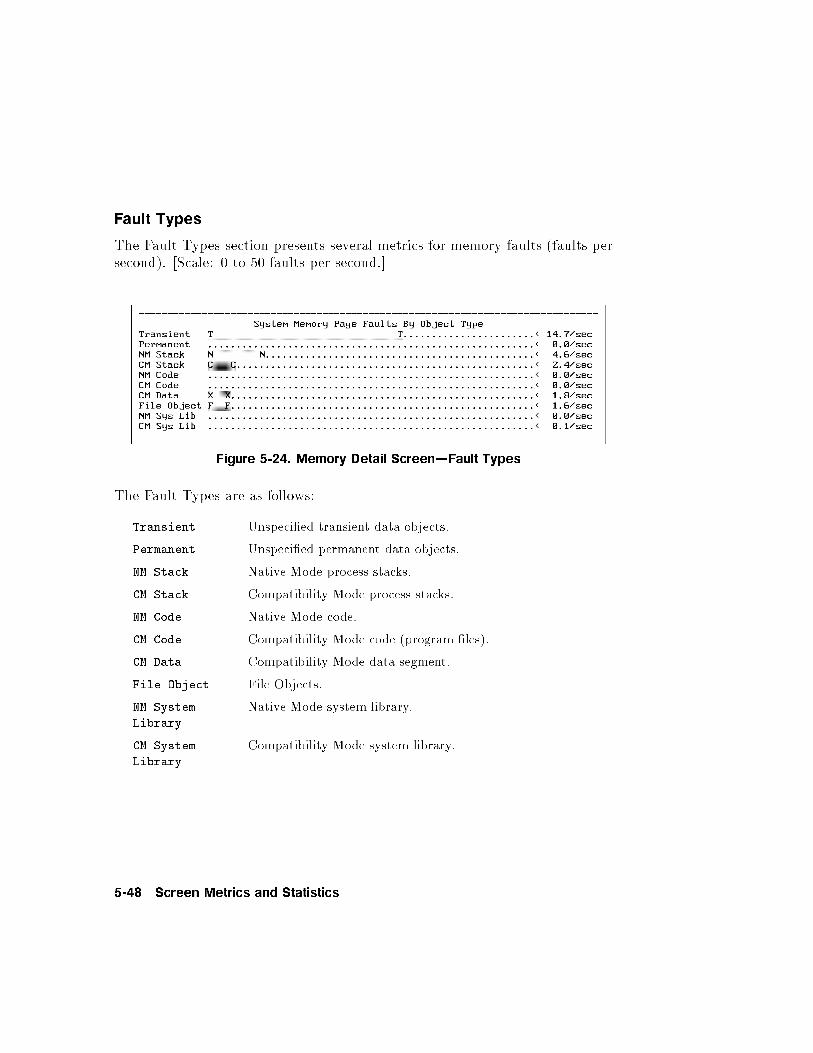
Fault Types
The Fault Types section presents several metrics for memory faults (faults persecond). [Scale: 0 to 50 faults per second.]
Figure 5-24. Memory Detail Screen|Fault Types
The Fault Types are as follows:
Transient Unspeci�ed transient data objects.
Permanent Unspeci�ed permanent data objects.
NM Stack Native Mode process stacks.
CM Stack Compatibility Mode process stacks.
NM Code Native Mode code.
CM Code Compatibility Mode code (program �les).
CM Data Compatibility Mode data segment.
File Object File Objects.
NM System
Library
Native Mode system library.
CM System
Library
Compatibility Mode system library.
5-48 Screen Metrics and Statistics
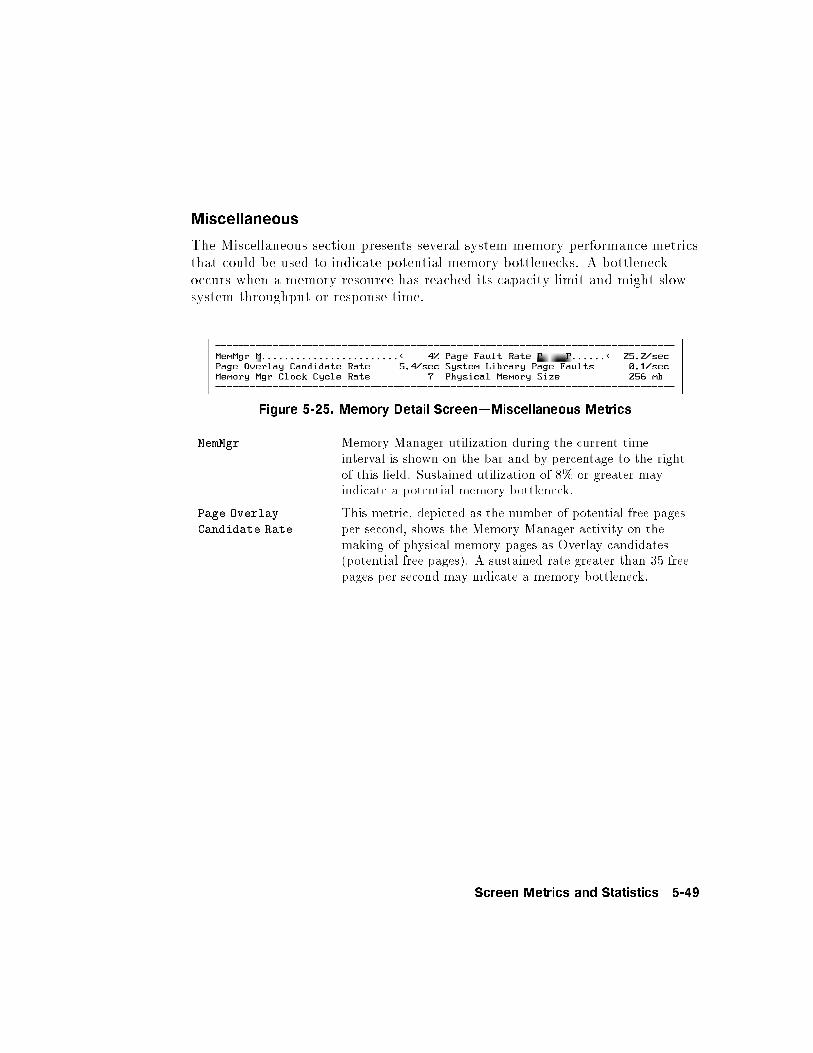
Miscellaneous
The Miscellaneous section presents several system memory performance metricsthat could be used to indicate potential memory bottlenecks. A bottleneckoccurs when a memory resource has reached its capacity limit and might slowsystem throughput or response time.
Figure 5-25. Memory Detail Screen|Miscellaneous Metrics
MemMgr Memory Manager utilization during the current timeinterval is shown on the bar and by percentage to the rightof this �eld. Sustained utilization of 8% or greater mayindicate a potential memory bottleneck.
Page Overlay
Candidate Rate
This metric, depicted as the number of potential free pagesper second, shows the Memory Manager activity on themaking of physical memory pages as Overlay candidates(potential free pages). A sustained rate greater than 35 freepages per second may indicate a memory bottleneck.
Screen Metrics and Statistics 5-49
Memory Mgr
Clock Cycle Rate
The bottom line of the Memory Detail screen shows thememory manager clock cycle rate.
The clock cycle rate is computed by dividing the number oftimes the memory manager has cycled through memory bythe elapsed time GlancePlus has been running. Unlike theother metrics on the screen, this one is relative to the runtime of GlancePlus rather than the current interval. Thisavoids the misrepresentation of reporting one clock cycleover four thirty-second intervals as a rate of 120 per secondduring one interval and 0 per second during the other three.It also means that you should be careful to let GlancePlusrun a few minutes before drawing any conclusions from thismetric.
A memory manager clock cycle rate of more than 25 perhour over ten minutes or more may indicate possiblememory pressure.
Page Fault Rate This �eld shows the sum of the Global System Page Faulttypes. The sum is expressed in page faults per second. Afault rate greater than 30 faults per second sustained overseveral intervals may indicate a potential bottleneck.
System Library
Page Faults
This metric shows the total Native Mode and CompatibilityMode system library faults. A sustained rate of greater than2 faults per second may indicate a memory bottleneckcondition.
Physical Memory
Size
This metric indicates the size of the machine's physicalmemory (in megabytes).
5-50 Screen Metrics and Statistics
6
The Expert Facility
To use a performance management tool e�ectively, you must be able to obtainproper measures of your system's performance, then separate the importantfrom the unimportant information. HP GlancePlus for MPE/iX helps you dothis in several ways.
Indicators. HP GlancePlus uses indicators that are carefully chosen andarranged to make the product easier to use. Where several indicators mightbe used to represent a system resource, only those that are clear, reliable,and easy to interpret are used. Indicators that require an in-depth knowledgeof the operating system or are unique to a particular operating system'stechnique are not used, if better alternatives are available. Reducing thenumber of redundant indicators makes it easier to notice when one exceedsits normal ranges.
Filtering. Intelligent �ltering of data helps you focus on what is important.For example, by showing only interesting processes, it is easier to identifyproblems than it would be if you had to scan through every process on thesystem. GlancePlus's ability to identify interesting processes|those that arestarved for a resource or those that are using resources excessively|make itpossible to see the forest without examining every tree.
Highlighting. Highlighting draws your attention to important indicators.Highlights might indicate why a process is interesting. For example, If aprocess was starved for a resource, the WAIT �eld is highlighted and thename of the resource needed is displayed.
Highlighting can also identify an indicator that exceeds a level that expertsconsider normal. For example, if you are displaying the CPU display andthe number of compatibility-mode switches is abnormally high for this sizeof system, this �eld is highlighted in the display. GlancePlus's highlightingprovides an \expert in your pocket" that can tell you when your system isout of line.
The Expert Facility 6-1
Note Highlighting works on all supported terminals and terminalemulators, but it works best on color terminals. Colorhighlights can provide additional information|red indicatesmore severe situations than blue or green. Terminals withoutcolor capability use underlining or inverse video to highlight anitem. Highlighting is not available on the printer output.
Guidelines. GlancePlus provides guidelines to help you understand anduse the data presented. Usually, all you have to do is type H or press �f7�to access online Help. Help can give you a list of commands and explainyour current display, in general terms. Help can also give you more detailedinformation.
After entering the general Help section, you can ask for details about eachmetric on your screen. The advice of many HP 3000 performance specialistshas been gathered and used to provide guidelines for understandingperformance data. By asking for GUIDELINES you can access this knowledgebase for information on what is considered \normal" for your systemand how to tell when your system might be experiencing problems. Thisinformation is always at your �ngertips when you need it.
Expert Facility. GlancePlus's Expert Facility helps you examine all thepertinent system performance indicators quickly and obtain a diagnosis.It can even recommend speci�c actions that might improve your system'sperformance. This facility is a true expert system utilizing advancedtechniques that enable this program to make the same decisions as might bemade by a human expert in HP 3000 computer system performance.
6-2 The Expert Facility
Invoking The Expert Facility
You can use the Expert facility in several ways:
It is always active and can guide you when �elds are highlighted on a speci�cGlancePlus display.
You can type X from any screen to request the Expert facility to diagnoseyour system. This diagnosis considers all available information, not just theinformation displayed on the screen.
You can enable the Expert facility to operate continuously. In continuousmode, the Expert facility examines your system each time the display isupdated. If it notices any performance problems it will add a single-linesummary to the screen indicating the area of the problem and its severity.The Expert facility will also notify you of any problems, regardless of thescreen you are viewing|the only exceptions are the Help, Option Values,and MPE Command screens.
What Does The Expert Facility Do?
The data displayed on each GlancePlus screen is examined by the Expertfacility, and any indicators that exceed the normal range for the size of systemare highlighted. Since the highlighting feature adds negligible overhead, it ispermanently enabled.
A global system analysis is performed based on data obtained from a singlesample. This can be a response to an on-demand request (you pressed the Xkey), or might occur automatically following each screen update, if the Expertfacility is in continuous mode. During global analysis, all pertinent systemwideperformance indicators are passed through a set of rules. These rules weredeveloped by top performance specialists working on the HP 3000. Therules were further re�ned through use on a variety of systems of all sizes andcon�gurations. The response to these rules establishes the degree of probabilitythat any particular performance situation (called a symptom) could be true.
If the analysis is performed on demand, any symptom that has a high enoughprobability of being true is listed along with the reasons (rules) why it isprobably the case, as in the following example:
The Expert Facility 6-3
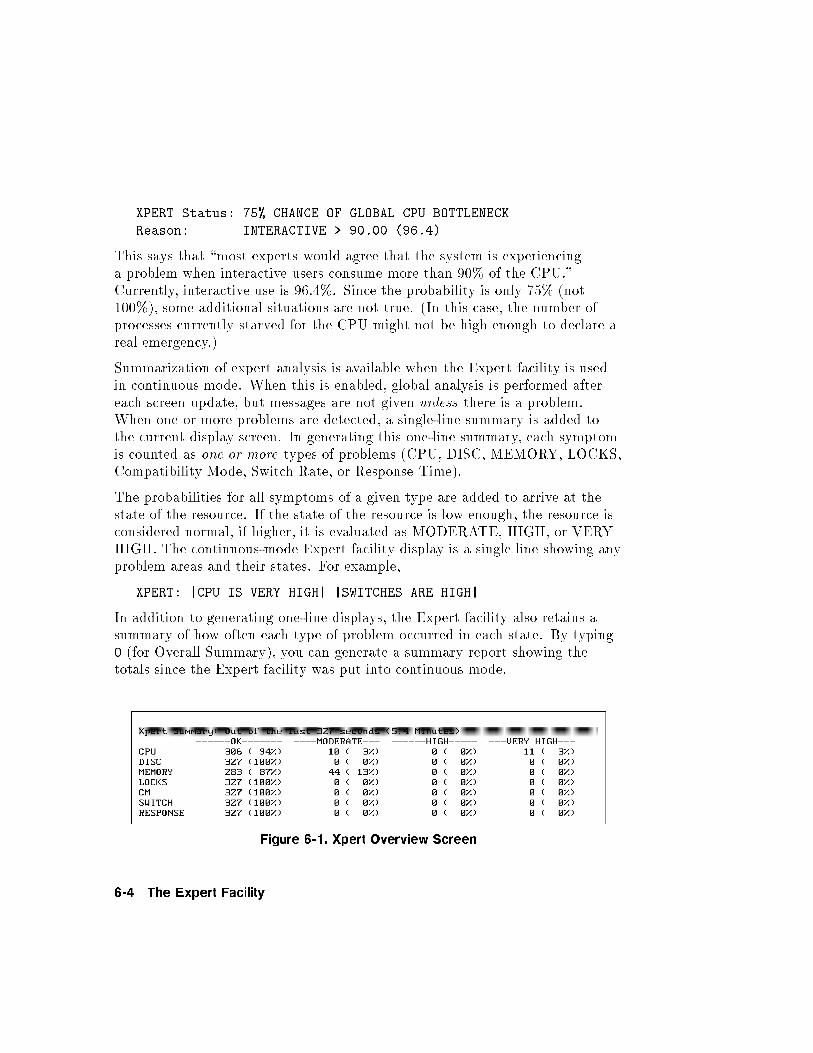
XPERT Status: 75% CHANCE OF GLOBAL CPU BOTTLENECK
Reason: INTERACTIVE > 90.00 (96.4)
This says that \most experts would agree that the system is experiencinga problem when interactive users consume more than 90% of the CPU."Currently, interactive use is 96.4%. Since the probability is only 75% (not100%), some additional situations are not true. (In this case, the number ofprocesses currently starved for the CPU might not be high enough to declare areal emergency.)
Summarization of expert analysis is available when the Expert facility is usedin continuous mode. When this is enabled, global analysis is performed aftereach screen update, but messages are not given unless there is a problem.When one or more problems are detected, a single-line summary is added tothe current display screen. In generating this one-line summary, each symptomis counted as one or more types of problems (CPU, DISC, MEMORY, LOCKS,Compatibility Mode, Switch Rate, or Response Time).
The probabilities for all symptoms of a given type are added to arrive at thestate of the resource. If the state of the resource is low enough, the resource isconsidered normal, if higher, it is evaluated as MODERATE, HIGH, or VERYHIGH. The continuous-mode Expert facility display is a single line showing anyproblem areas and their states. For example,
XPERT: |CPU IS VERY HIGH| |SWITCHES ARE HIGH|
In addition to generating one-line displays, the Expert facility also retains asummary of how often each type of problem occurred in each state. By typingO (for Overall Summary), you can generate a summary report showing thetotals since the Expert facility was put into continuous mode.
Figure 6-1. Xpert Overview Screen
6-4 The Expert Facility
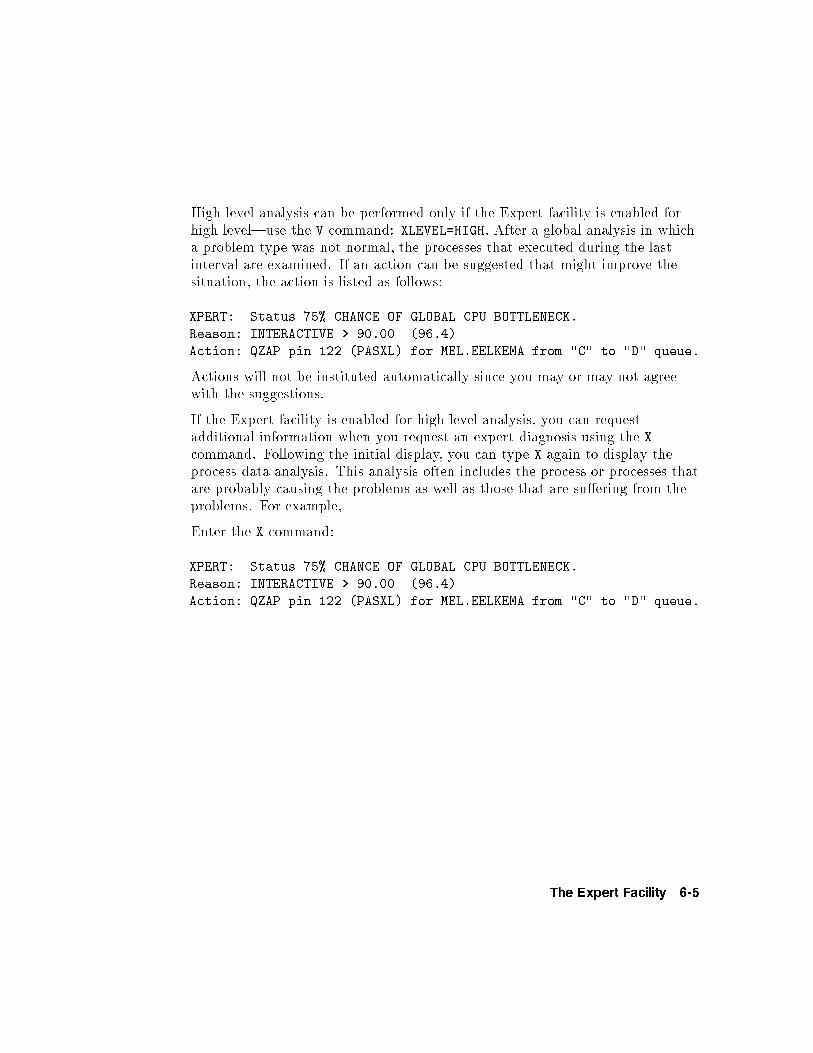
High level analysis can be performed only if the Expert facility is enabled forhigh level|use the V command: XLEVEL=HIGH. After a global analysis in whicha problem type was not normal, the processes that executed during the lastinterval are examined. If an action can be suggested that might improve thesituation, the action is listed as follows:
XPERT: Status 75% CHANCE OF GLOBAL CPU BOTTLENECK.
Reason: INTERACTIVE > 90.00 (96.4)
Action: QZAP pin 122 (PASXL) for MEL.EELKEMA from "C" to "D" queue.
Actions will not be instituted automatically since you may or may not agreewith the suggestions.
If the Expert facility is enabled for high level analysis, you can requestadditional information when you request an expert diagnosis using the Xcommand. Following the initial display, you can type X again to display theprocess data analysis. This analysis often includes the process or processes thatare probably causing the problems as well as those that are su�ering from theproblems. For example,
Enter the X command:
XPERT: Status 75% CHANCE OF GLOBAL CPU BOTTLENECK.
Reason: INTERACTIVE > 90.00 (96.4)
Action: QZAP pin 122 (PASXL) for MEL.EELKEMA from "C" to "D" queue.
The Expert Facility 6-5
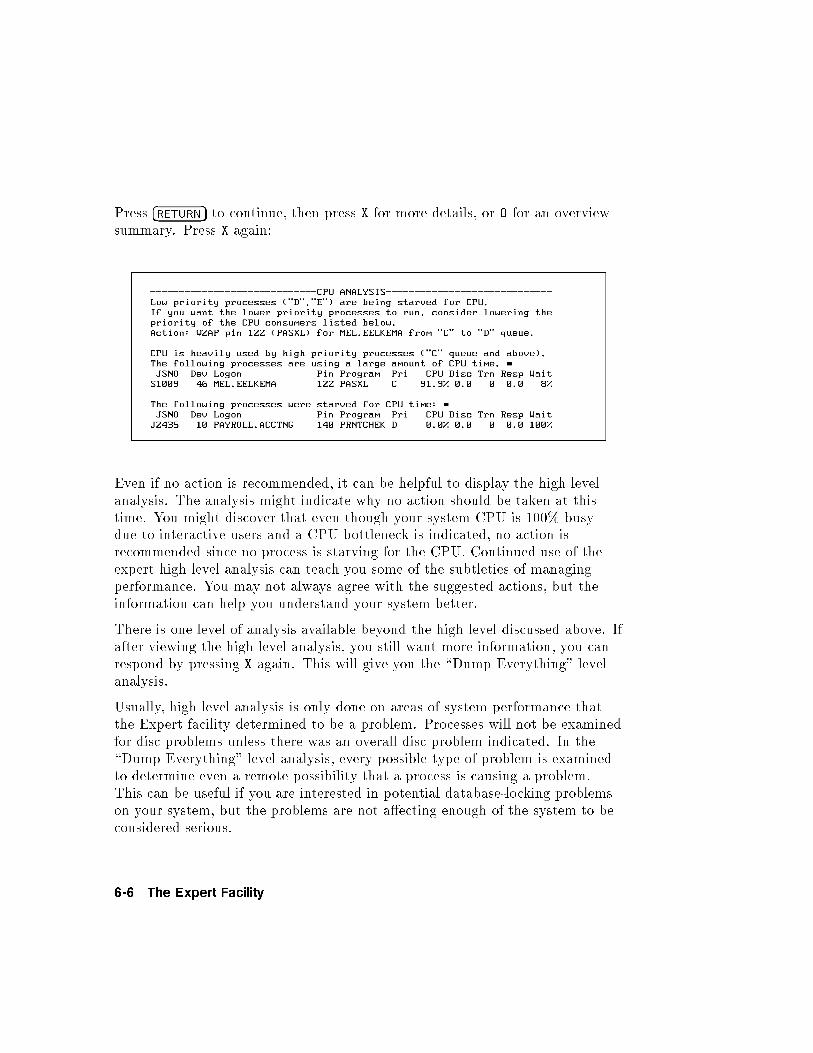
Press �RETURN� to continue, then press X for more details, or O for an overviewsummary. Press X again:
Even if no action is recommended, it can be helpful to display the high levelanalysis. The analysis might indicate why no action should be taken at thistime. You might discover that even though your system CPU is 100% busydue to interactive users and a CPU bottleneck is indicated, no action isrecommended since no process is starving for the CPU. Continued use of theexpert high level analysis can teach you some of the subtleties of managingperformance. You may not always agree with the suggested actions, but theinformation can help you understand your system better.
There is one level of analysis available beyond the high level discussed above. Ifafter viewing the high level analysis, you still want more information, you canrespond by pressing X again. This will give you the \Dump Everything" levelanalysis.
Usually, high level analysis is only done on areas of system performance thatthe Expert facility determined to be a problem. Processes will not be examinedfor disc problems unless there was an overall disc problem indicated. In the\Dump Everything" level analysis, every possible type of problem is examinedto determine even a remote possibility that a process is causing a problem.This can be useful if you are interested in potential database-locking problemson your system, but the problems are not a�ecting enough of the system to beconsidered serious.
6-6 The Expert Facility
Recommendations For Using The Expert Facility
Using the Expert facility will add a small amount of overhead to theGlancePlus program. On most systems this additional overhead is about 0.2%CPU; it should not cause any problems. On systems with many processes, theGlancePlus overhead might be higher. In this case, you can eliminate almostall the Expert facility's additional overhead by using the V command to setXLEVEL=LOW instead of HIGH. The high level analysis and suggested actionswill not be available to you with this setting. You can use XLEVEL=LOW as adefault and change it to HIGH only when you need more detailed information.See chapter 7 for details on how to select the default settings for GlancePlus.With XLEVEL=LOW and XPERT=DEMAND, the Expert facility adds no additionaloverhead. Press �X� to request an on-demand global analysis at any time.
Since the overhead of the Expert facility on most systems is negligible, youcan safely let it run in continuous mode. You may use XLEVEL=LOW andXPERT=CONTINUOUS to report any global problems and to accumulate theoverview summary information (for the O command). Using XLEVEL=HIGH
should not add signi�cant overhead on most systems. (You can see theoverhead by using GlancePlus to monitor itself under various settings on yoursystem).
Hint The frequency of screen updates is one factor that a�ectsGlancePlus's overhead most directly. If you set the updateinterval to its lowest setting (5 seconds), or press �Return� or�Enter� repeatedly to generate rapid updates, the CPU overheadcan become very high. If you want to collect long-termsummary information, set a longer update interval (60-90seconds) to lower the GlancePlus overhead substantially.
However in some cases, setting the update interval to longerthan 90 seconds might not reduce the GlancePlus overhead.To keep process information from \backing up" in themeasurement interface, information should be extracted every60-90 seconds. Failure to do so can result in missing andinaccurate data. To avoid this problem if you select an updateinterval longer than 90-seconds, GlancePlus extracts the processdata automatically once a minute to prevent backups.
The Expert Facility 6-7
Changing The Expert Facility's Rules
A situation might occur on your system that the Expert facility considersunusual but is normal for your system. Or, conversely, you might have asituation that the Expert facility does not detect, but one that you would liketo add to its list of symptoms. In such cases, see chapter 7 for information onchanging the GlancePlus default con�guration. Make changes to the Expertfacility carefully, since by doing so, you are assuming the role of an expert.
6-8 The Expert Facility
7
Customizing HP GlancePlus
As discussed in chapter 3, GlancePlus allows you to customize the startupprocedure.
Customizing Startup
HP GlancePlus for MPE/iX provides the following two startup parameterswhen you run the program.
Refresh Time
Once you execute HP GlancePlus, the screens are refreshed (updated) every 30seconds, by default.
You can specify a di�erent refresh time when you execute the program by usingthe ;PARM= option of the MPE RUN command. With this parameter you canspecify the number of seconds (5{3600) between screen updates.
Selecting the Initial Screen
GlancePlus displays the Global screen at startup, by default. You can directit to start with the Job/Session, Process, CPU Detail, Disc Detail, MemoryDetail, or Workload screen by specifying the appropriate GlancePlus commandin the ;INFO= option of the MPE RUN command. To select a job, session, orprocess to monitor, you must follow the command abbreviation for that screenwith a valid number.
Customizing HP GlancePlus 7-1
The following examples specify a refresh time of 60 seconds and the monitoringof job number 312:
Type: :RUN GLANCEXL.PUB.SYS;INFO="J312";PARM=60
If you activated the HP GlancePlus UDC �le, type: :GLANCE J312,60
The following examples specify that startup should proceed directly to theWorkload screen:
Type: :RUN GLANCEXL.PUB.SYS;INFO="W"
If you activated the HP GlancePlus UDC �le, type: :GLANCE W
Customizing GlancePlus Global Bars
As discussed in chapter 3, the Global CPU bar and the Global Memory barcan be con�gured di�erently. This will change the abbreviations and theircorresponding components in those bars.
For example, you can recon�gure the components of the Global CPU bar toshow activity by queue and the components of the Global Memory bar to showfault rates, as discussed below.
Global CPU Bar
Recon�guring Global CPU Bar to show activity by queue is useful when youuse a batch job to initiate processes that interact with terminal users. Thenormal \interactive/batch" representation would show these terminal users as\batch" since they were initiated as a batch job|this would not be as usefulas a queue representation. A queue representation might also be useful on asystem where interactive sessions and batch jobs routinely execute in queuesother than the normal CS queue for sessions and DS and ES queues for batch.
7-2 Customizing HP GlancePlus
The CPU bar has the following components:
DISPCPU = QUEUE
Code Meaning
M MPE processing (memory management, interrupts, ICS, etc.).
A Processes running in the A subqueue (system priority).
B Processes running in the B subqueue (high priority).
C Processes running in the C subqueue (normally interactive).
D Processes running in the D subqueue (normally batch priority).
E Processes running in the E subqueue (normally background).
P Paused for disc (no CPU used but disc I/O is occurring).
Blank CPU was idle (and no disc I/O was occurring).
Global Memory Bar
Con�guring the Global Memory bar to show page-fault rates rather thancontents might be useful on a system where memory is a bottleneck and pagefaults are used as key indicators to alert you of a problem.
The Memory bar has the following components:
DISPMEMORY=FAULTS (Page fault rate for di�erent object types)
Code Meaning
T Transient objects (program heaps, etc.).
P Permanent objects (not normally faulted).
S Data Stacks (NM + CM).
C Code (NM + CM).
D Data objects.
F Files.
L Library code (NM + CM).
Customizing HP GlancePlus 7-3
Customizing Configuration
HP GlancePlus for MPE/iX comes ready to use. Although it is con�gured witha selection of carefully tested defaults, you might want to change those settingsin certain situations. For example, if the interesting process thresholds causetoo many or too few processes to display on the Global screen, you might wantto adjust the thresholds to match the activity on your system.
You can change GlancePlus parameters in several ways. Some ways are localto a particular execution of GlancePlus, such as using the V (Option Values)command to change interesting process thresholds. Other ways carry forwardfrom one execution to another within the same job or session.
You can set job control words (JCWs) to have GlancePlus remember settingswithin the same job or session. You can also set a JCW using the V commandto allow you to run GlancePlus again from the same job or session using thosevalues. You can also set JCWs external to GlancePlus|for example, GLANCEuser-de�ned commands (UDCs) can start GlancePlus with speci�c values eachtime the UDC is used.
You can set the default GlancePlus parameter values for the entire system bychanging the GLANCNFG con�guration �le. If a �le named GLANCNFGalready exists in the same group and account as the GLANCEXL program,it will be examined for default parameters. You will be allowed to set someparameters only via the GLANCNFG �le (parameters such as controlling whichusers may execute the QZAP command).
The GLANCNFG �le contains additional information, such as the globalrules for the Expert facility and, sometimes, the de�nitions for user-de�nedapplications used by the Filter and Workload screens. (If you also ownthe HP LaserRX/MPE or HP GlancePlus Pak programs, applicationde�nitions will probably be found in the PARM.SCOPE.SYS �le.) See the HPPerformance Collection Software manual for more details.
7-4 Customizing HP GlancePlus
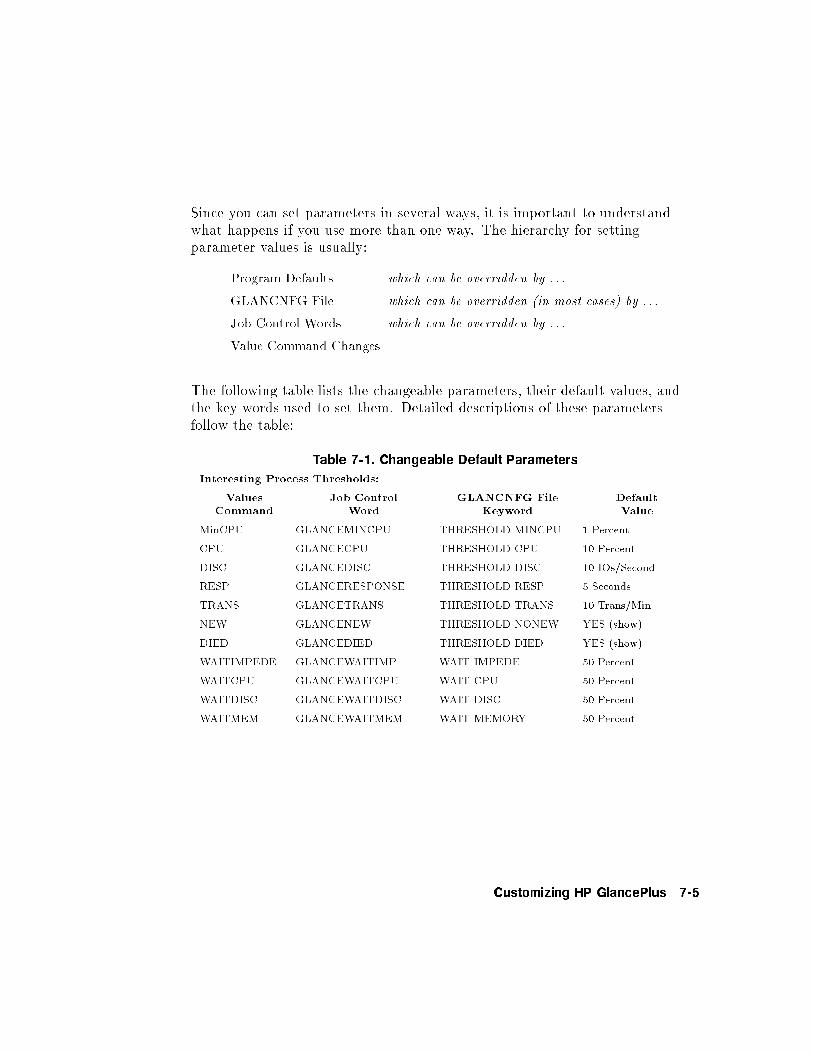
Since you can set parameters in several ways, it is important to understandwhat happens if you use more than one way. The hierarchy for settingparameter values is usually:
Program Defaults which can be overridden by . . .
GLANCNFG File which can be overridden (in most cases) by . . .
Job Control Words which can be overridden by . . .
Value Command Changes
The following table lists the changeable parameters, their default values, andthe key words used to set them. Detailed descriptions of these parametersfollow the table:
Table 7-1. Changeable Default Parameters
Interesting Process Thresholds:
Values
Command
Job Control
Word
GLANCNFG File
Keyword
Default
Value
MinCPU GLANCEMINCPU THRESHOLD MINCPU 1 Percent
CPU GLANCECPU THRESHOLD CPU 10 Percent
DISC GLANCEDISC THRESHOLD DISC 10 IOs/Second
RESP GLANCERESPONSE THRESHOLD RESP 5 Seconds
TRANS GLANCETRANS THRESHOLD TRANS 10 Trans/Min
NEW GLANCENEW THRESHOLD NONEW YES (show)
DIED GLANCEDIED THRESHOLD DIED YES (show)
WAITIMPEDE GLANCEWAITIMP WAIT IMPEDE 50 Percent
WAITCPU GLANCEWAITCPU WAIT CPU 50 Percent
WAITDISC GLANCEWAITDISC WAIT DISC 50 Percent
WAITMEM GLANCEWAITMEM WAIT MEMORY 50 Percent
Customizing HP GlancePlus 7-5
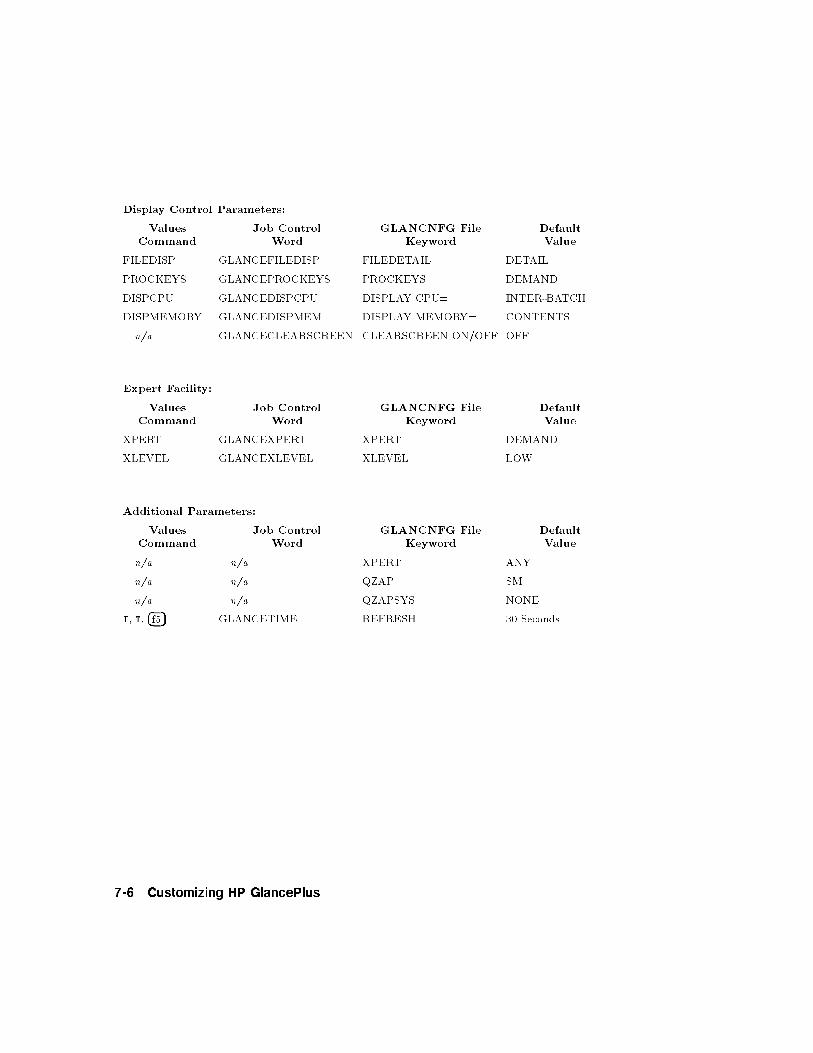
Display Control Parameters:
Values
Command
Job Control
Word
GLANCNFG File
Keyword
Default
Value
FILEDISP GLANCEFILEDISP FILEDETAIL DETAIL
PROCKEYS GLANCEPROCKEYS PROCKEYS DEMAND
DISPCPU GLANCEDISPCPU DISPLAY CPU= INTER-BATCH
DISPMEMORY GLANCEDISPMEM DISPLAY MEMORY= CONTENTS
n/a GLANCECLEARSCREEN CLEARSCREEN ON/OFF OFF
Expert Facility:
Values
Command
Job Control
Word
GLANCNFG File
Keyword
Default
Value
XPERT GLANCEXPERT XPERT DEMAND
XLEVEL GLANCEXLEVEL XLEVEL LOW
Additional Parameters:
Values
Command
Job Control
Word
GLANCNFG File
Keyword
Default
Value
n/a n/a XPERT ANY
n/a n/a QZAP SM
n/a n/a QZAPSYS NONE
I, T, �f5� GLANCETIME REFRESH 30 Seconds
7-6 Customizing HP GlancePlus
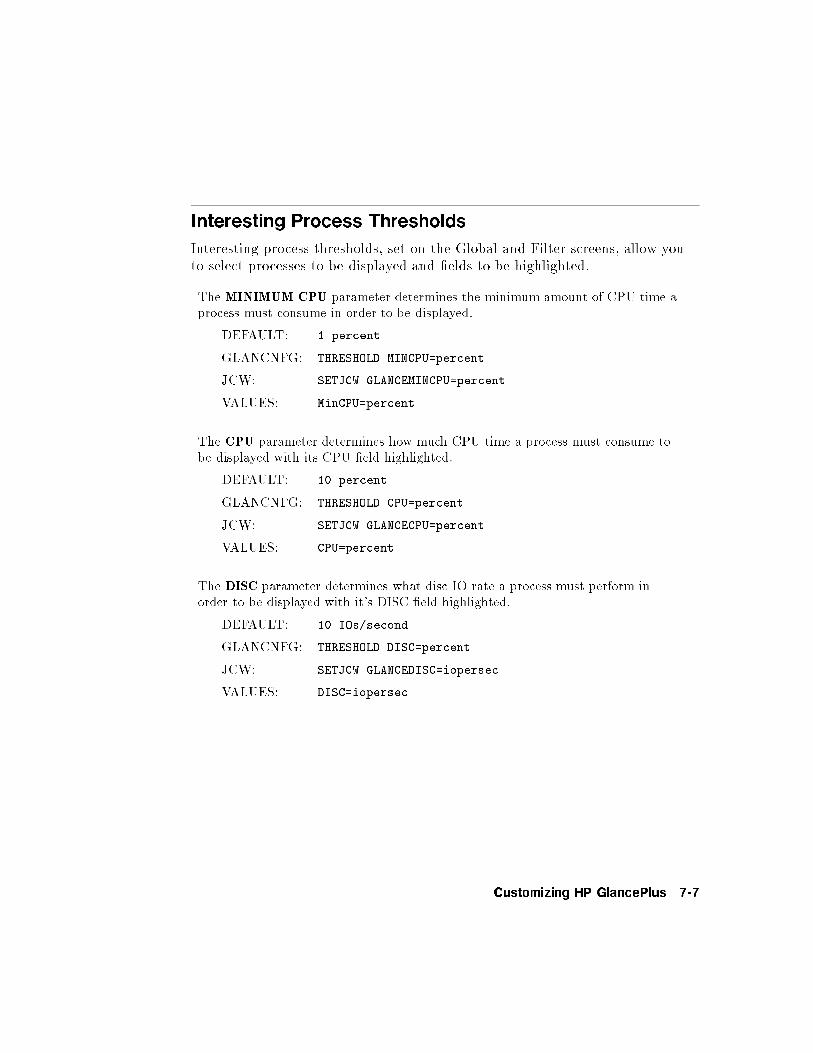
Interesting Process Thresholds
Interesting process thresholds, set on the Global and Filter screens, allow youto select processes to be displayed and �elds to be highlighted.
The MINIMUM CPU parameter determines the minimum amount of CPU time aprocess must consume in order to be displayed.
DEFAULT: 1 percent
GLANCNFG: THRESHOLD MINCPU=percent
JCW: SETJCW GLANCEMINCPU=percent
VALUES: MinCPU=percent
The CPU parameter determines how much CPU time a process must consume tobe displayed with its CPU �eld highlighted.
DEFAULT: 10 percent
GLANCNFG: THRESHOLD CPU=percent
JCW: SETJCW GLANCECPU=percent
VALUES: CPU=percent
The DISC parameter determines what disc IO rate a process must perform inorder to be displayed with it's DISC �eld highlighted.
DEFAULT: 10 IOs/second
GLANCNFG: THRESHOLD DISC=percent
JCW: SETJCW GLANCEDISC=iopersec
VALUES: DISC=iopersec
Customizing HP GlancePlus 7-7
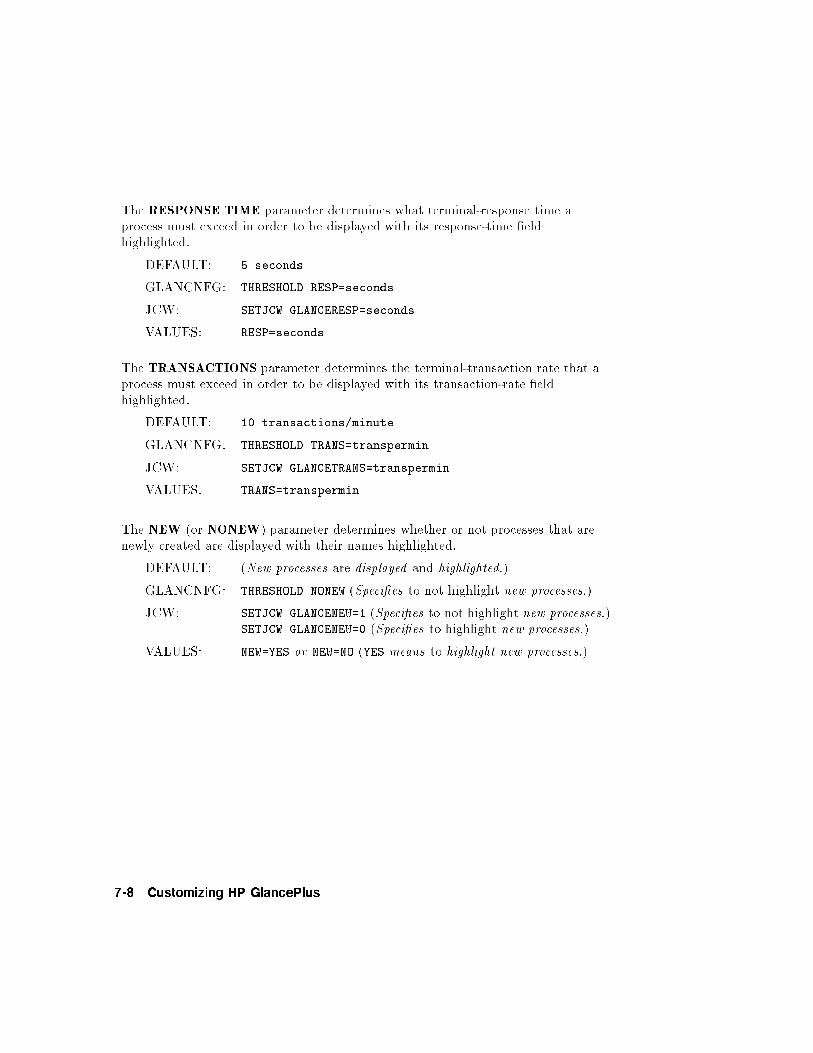
The RESPONSE TIME parameter determines what terminal-response time aprocess must exceed in order to be displayed with its response-time �eldhighlighted.
DEFAULT: 5 seconds
GLANCNFG: THRESHOLD RESP=seconds
JCW: SETJCW GLANCERESP=seconds
VALUES: RESP=seconds
The TRANSACTIONS parameter determines the terminal-transaction rate that aprocess must exceed in order to be displayed with its transaction-rate �eldhighlighted.
DEFAULT: 10 transactions/minute
GLANCNFG: THRESHOLD TRANS=transpermin
JCW: SETJCW GLANCETRANS=transpermin
VALUES: TRANS=transpermin
The NEW (or NONEW) parameter determines whether or not processes that arenewly created are displayed with their names highlighted.
DEFAULT: (New processes are displayed and highlighted.)
GLANCNFG: THRESHOLD NONEW (Speci�es to not highlight new processes.)
JCW: SETJCW GLANCENEW=1 (Speci�es to not highlight new processes.)SETJCW GLANCENEW=0 (Speci�es to highlight new processes.)
VALUES: NEW=YES or NEW=NO (YES means to highlight new processes.)
7-8 Customizing HP GlancePlus
The DIED (or NODIED) parameter determines whether or not processes thatterminate are displayed with the process priority �eld highlighted as DIED.
DEFAULT: (Terminated processes are displayed and highlighted.)
GLANCNFG: THRESHOLD NODIED (Speci�es to not highlight processes thatdied.)
JCW: SETJCW GLANCEDIED=1 (Speci�es to not highlight processes thatdied.)SETJCW GLANCEDIED=0 (Speci�es to highlight processes thatdied.)
VALUES: DIED=YES or DIED=NO (YES means to highlight processes thatdied.)
The WAIT ON IMPEDE parameter determines when a process should bedisplayed and its WAIT �eld highlighted due to excessive waiting on softwarelocks, latches, and other synchronization events.
DEFAULT: 50 percent
GLANCNFG: WAIT IMPEDE=percent
JCW: SETJCW GLANCEWAITIMP=percent
VALUES: WAITIMPEDE=percent
The WAIT ON CPU parameter determines when a process should be displayedand its WAIT �eld highlighted due to excessive waiting on access to the CPU.
DEFAULT: 50 percent
GLANCNFG: WAIT CPU=percent
JCW: SETJCW GLANCEWAITCPU=percent
VALUES: WAITCPU=percent
Customizing HP GlancePlus 7-9
The WAIT ON DISC parameter determines when a process should be displayedand its WAIT �eld highlighted due to excessive waiting on data transfers to orfrom disc drives.
DEFAULT: 50 percent
GLANCNFG: WAIT DISC=percent
JCW: SETJCW GLANCEWAITDISC=percent
VALUES: WAITDISC=percent
The WAIT ON MEMORY parameter determines when a process should bedisplayed and its WAIT �eld highlighted due to excessive waiting on mainmemory resources.
DEFAULT: 50 percent
GLANCNFG: WAIT MEMORY=percent
JCW: SETJCW GLANCEMEM=percent
VALUES: WAITMEM=percent
7-10 Customizing HP GlancePlus
Display Control Parameters
Display control parameters control the actions of various GlancePlus displayscreens.
The FILE DETAIL DISPLAY parameter determines whether the display of �lesopened by a process on the PROCESS screen is in detailed (one open �le per line)or simple (four �les per line) format.
DEFAULT: DETAIL
GLANCNFG: FILEDISP SIMPLE or FILEDISP DETAIL
JCW: SETJCW GLANCEFILEDISP=0 (for detailed) orSETJCW GLANCEFILEDISP=1 (for simple)
VALUES: FILEDISP=SIMPLE or FILEDISP=DETAIL
The PROCESS KEYS parameter determines whether or not the OPEN FILES andPROCESS FAMILY commands show only one display on the Process screen eachtime they are requested (on demand) or toggle between no display and continuousdisplay (continuous).
DEFAULT: DEMAND
GLANCNFG: PROCKEYS DEMAND or PROCKEYS CONTINUE
JCW: SETJCW GLANCEPROCKEYS=0 (for demand) orSETJCW GLANCEPROCKEYS=1(for continue)
VALUES: PROCKEYS=CONTINUE or PROCKEYS=DEMAND
Customizing HP GlancePlus 7-11
The CLEAR SCREEN parameter determines whether old display data is alwayserased before a new display begins (CLEARSCREEN ON) or whether some screensscroll previous process data down allowing the current data to be comparedagainst previous data.
DEFAULT: OFF
GLANCNFG: CLEARSCREEN ON or CLEARSCREEN OFF
JCW: SETJCW GLANCECLEARSCREEN=0 (for o� ) orSETJCW GLANCECLEARSCREEN=1 (for on)
VALUES: (This parameter cannot be changed using the VALUES command.
The DISPLAY CPU parameter determines what type of display is used for theGLOBAL CPU bar at the top of each screen. INTER-BATCH divides the CPU barby the type of processes using it (SYSTEM, INTERACTIVE, and BATCH), whileQUEUE divides the CPU bar based on the priority of the processes (A, B, C, D, E).
DEFAULT: INTER-BATCH
GLANCNFG: DISPLAY CPU=INTERBATCH or DISPLAY CPU=QUEUE
JCW: SETJCW GLANCEDISPCPU=0 (for inter-batch) orSETJCW GLANCEDOSPCPU=1 (for queue)
VALUES: DISPCPU=INTER-BATCH orDISPCPU=QUEUE
The DISPLAY MEMORY parameter determines what type of display is used forthe GLOBAL MEMORY bar at the top of each screen. CONTENTS displays howmuch of main memory is occupied by di�erent types of objects. FAULTS shows therate at which di�erent objects are being requested to be brought into mainmemory (faulted into memory).
DEFAULT: CONTENTS
GLANCNFG: DISPLAY MEMORY=CONTENTS orDISPLAY MEMORY=FAULTS
JCW: SETJCW GLANCEDISPMEM=0 (for contents) orSETJCW GLANCEDISPMEM=1 (for faults)
VALUES: DISPMEMORY=CONTENTS orDISPMEMORY=FAULTS
7-12 Customizing HP GlancePlus
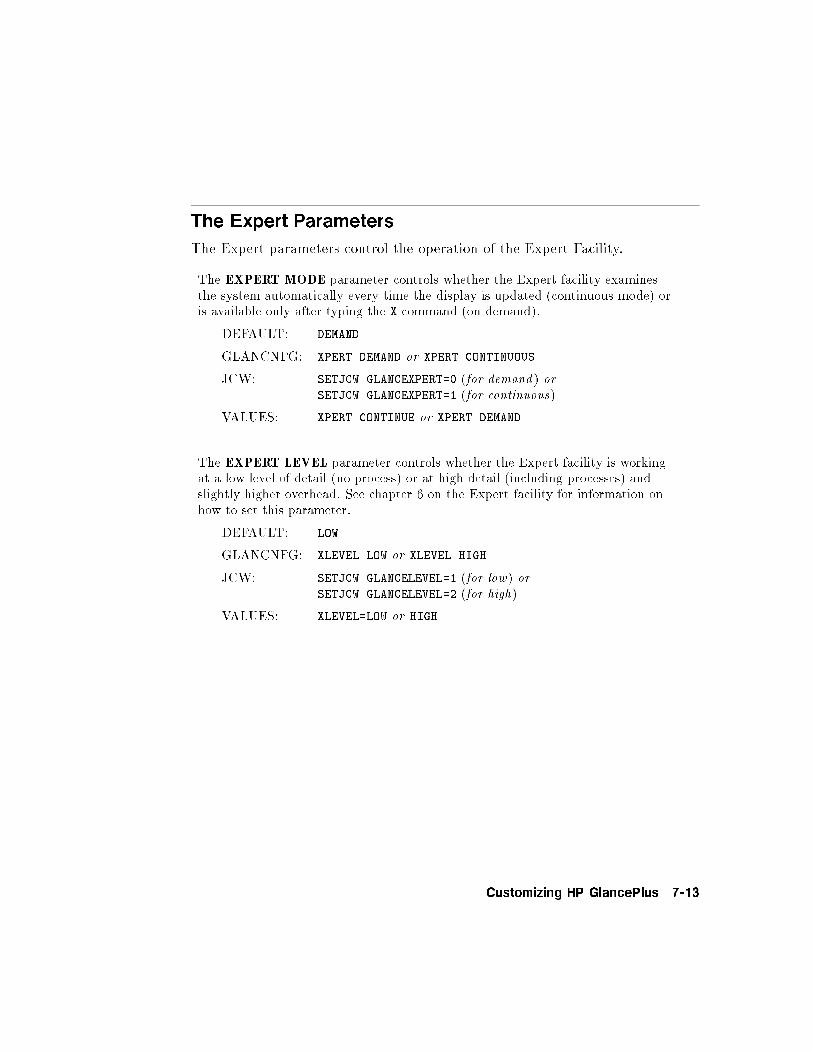
The Expert Parameters
The Expert parameters control the operation of the Expert Facility.
The EXPERT MODE parameter controls whether the Expert facility examinesthe system automatically every time the display is updated (continuous mode) oris available only after typing the X command (on demand).
DEFAULT: DEMAND
GLANCNFG: XPERT DEMAND or XPERT CONTINUOUS
JCW: SETJCW GLANCEXPERT=0 (for demand ) orSETJCW GLANCEXPERT=1 (for continuous)
VALUES: XPERT CONTINUE or XPERT DEMAND
The EXPERT LEVEL parameter controls whether the Expert facility is workingat a low level of detail (no process) or at high detail (including processes) andslightly higher overhead. See chapter 6 on the Expert facility for information onhow to set this parameter.
DEFAULT: LOW
GLANCNFG: XLEVEL LOW or XLEVEL HIGH
JCW: SETJCW GLANCELEVEL=1 (for low) orSETJCW GLANCELEVEL=2 (for high)
VALUES: XLEVEL=LOW or HIGH
Customizing HP GlancePlus 7-13
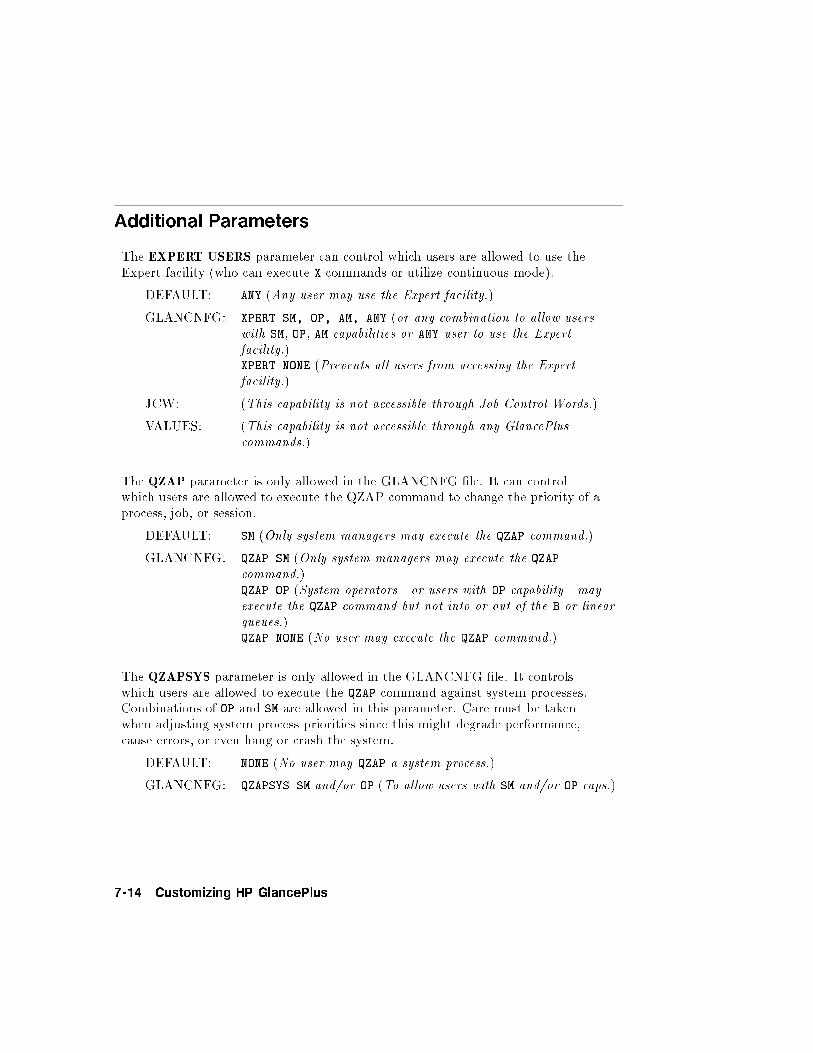
Additional Parameters
The EXPERT USERS parameter can control which users are allowed to use theExpert facility (who can execute X commands or utilize continuous mode).
DEFAULT: ANY (Any user may use the Expert facility.)
GLANCNFG: XPERT SM, OP, AM, ANY (or any combination to allow userswith SM, OP, AM capabilities or ANY user to use the Expertfacility.)XPERT NONE (Prevents all users from accessing the Expertfacility.)
JCW: (This capability is not accessible through Job Control Words.)
VALUES: (This capability is not accessible through any GlancePluscommands.)
The QZAP parameter is only allowed in the GLANCNFG �le. It can controlwhich users are allowed to execute the QZAP command to change the priority of aprocess, job, or session.
DEFAULT: SM (Only system managers may execute the QZAP command.)
GLANCNFG: QZAP SM (Only system managers may execute the QZAP
command.)QZAP OP (System operators|or users with OP capability|mayexecute the QZAP command but not into or out of the B or linearqueues.)QZAP NONE (No user may execute the QZAP command.)
The QZAPSYS parameter is only allowed in the GLANCNFG �le. It controlswhich users are allowed to execute the QZAP command against system processes.Combinations of OP and SM are allowed in this parameter. Care must be takenwhen adjusting system process priorities since this might degrade performance,cause errors, or even hang or crash the system.
DEFAULT: NONE (No user may QZAP a system process.)
GLANCNFG: QZAPSYS SM and/or OP (To allow users with SM and/or OP caps.)
7-14 Customizing HP GlancePlus
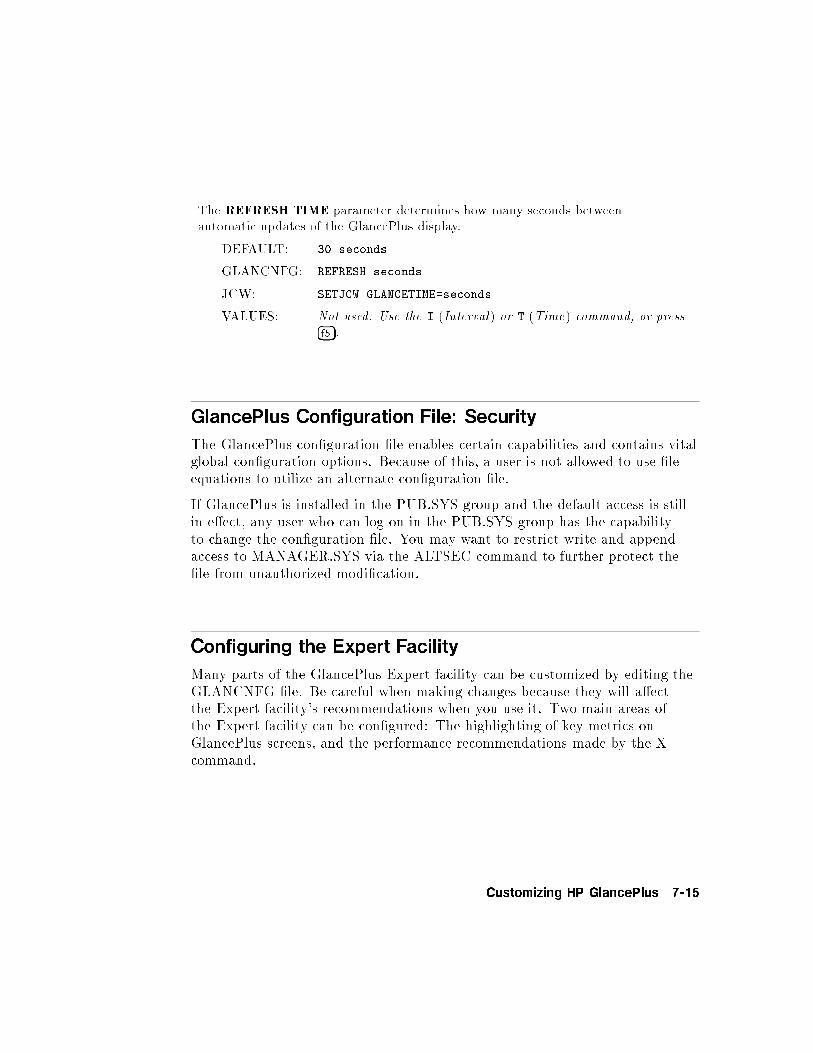
The REFRESH TIME parameter determines how many seconds betweenautomatic updates of the GlancePlus display.
DEFAULT: 30 seconds
GLANCNFG: REFRESH seconds
JCW: SETJCW GLANCETIME=seconds
VALUES: Not used. Use the I (Interval) or T (Time) command, or press�f5�.
GlancePlus Configuration File: Security
The GlancePlus con�guration �le enables certain capabilities and contains vitalglobal con�guration options. Because of this, a user is not allowed to use �leequations to utilize an alternate con�guration �le.
If GlancePlus is installed in the PUB.SYS group and the default access is stillin e�ect, any user who can log on in the PUB.SYS group has the capabilityto change the con�guration �le. You may want to restrict write and appendaccess to MANAGER.SYS via the ALTSEC command to further protect the�le from unauthorized modi�cation.
Configuring the Expert Facility
Many parts of the GlancePlus Expert facility can be customized by editing theGLANCNFG �le. Be careful when making changes because they will a�ectthe Expert facility's recommendations when you use it. Two main areas ofthe Expert facility can be con�gured: The highlighting of key metrics onGlancePlus screens, and the performance recommendations made by the Xcommand.
Customizing HP GlancePlus 7-15
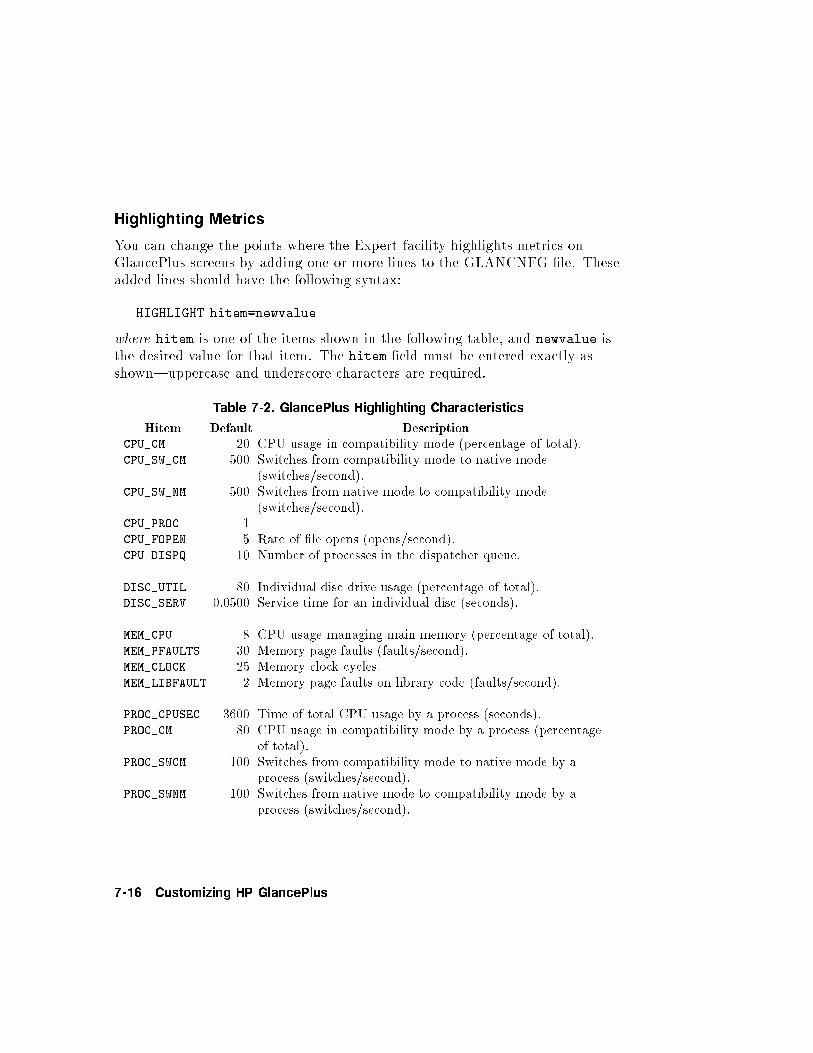
Highlighting Metrics
You can change the points where the Expert facility highlights metrics onGlancePlus screens by adding one or more lines to the GLANCNFG �le. Theseadded lines should have the following syntax:
HIGHLIGHT hitem=newvalue
where hitem is one of the items shown in the following table, and newvalue isthe desired value for that item. The hitem �eld must be entered exactly asshown|uppercase and underscore characters are required.
Table 7-2. GlancePlus Highlighting Characteristics
Hitem Default DescriptionCPU_CM 20 CPU usage in compatibility mode (percentage of total).CPU_SW_CM 500 Switches from compatibility mode to native mode
(switches/second).CPU_SW_NM 500 Switches from native mode to compatibility mode
(switches/second).CPU_PROC 1CPU_FOPEN 5 Rate of �le opens (opens/second).CPU_DISPQ 10 Number of processes in the dispatcher queue.
DISC_UTIL 80 Individual disc drive usage (percentage of total).DISC_SERV 0.0500 Service time for an individual disc (seconds).
MEM_CPU 8 CPU usage managing main memory (percentage of total).MEM_PFAULTS 30 Memory page faults (faults/second).MEM_CLOCK 25 Memory clock cycles.MEM_LIBFAULT 2 Memory page faults on library code (faults/second).
PROC_CPUSEC 3600 Time of total CPU usage by a process (seconds).PROC_CM 80 CPU usage in compatibility mode by a process (percentage
of total).PROC_SWCM 100 Switches from compatibility mode to native mode by a
process (switches/second).PROC_SWNM 100 Switches from native mode to compatibility mode by a
process (switches/second).
7-16 Customizing HP GlancePlus
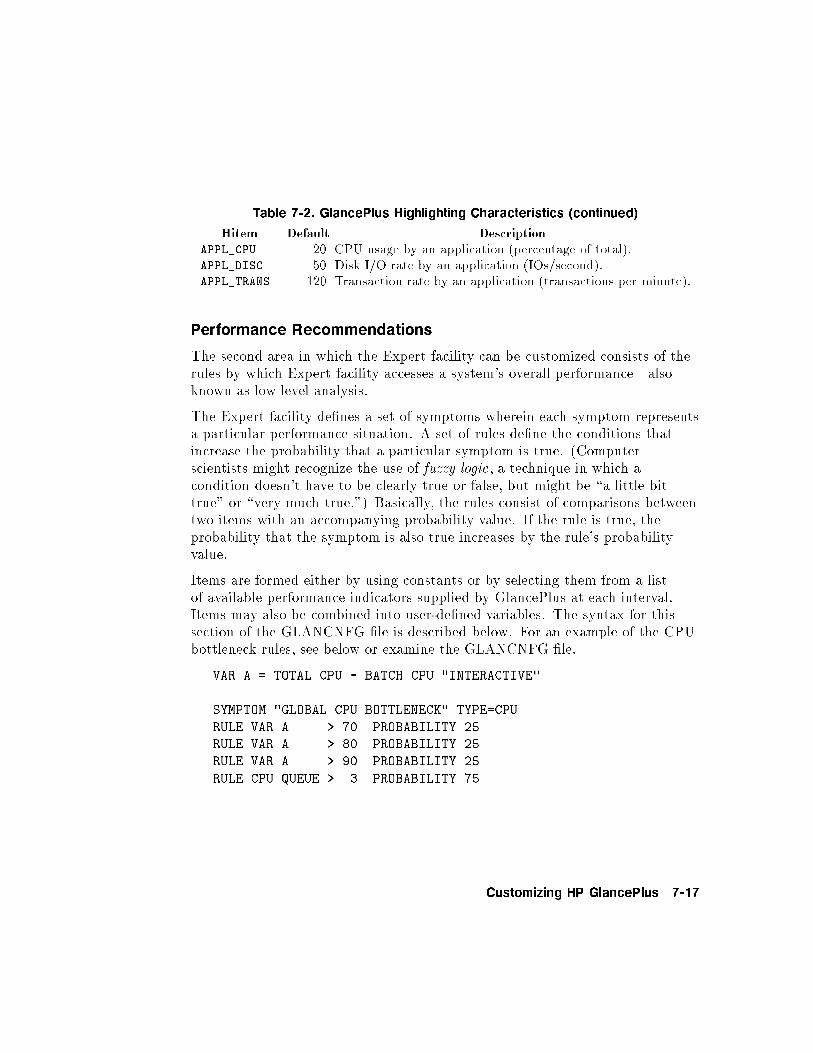
Table 7-2. GlancePlus Highlighting Characteristics (continued)
Hitem Default DescriptionAPPL_CPU 20 CPU usage by an application (percentage of total).APPL_DISC 50 Disk I/O rate by an application (IOs/second).APPL_TRANS 120 Transaction rate by an application (transactions per minute).
Performance Recommendations
The second area in which the Expert facility can be customized consists of therules by which Expert facility accesses a system's overall performance|alsoknown as low level analysis.
The Expert facility de�nes a set of symptoms wherein each symptom representsa particular performance situation. A set of rules de�ne the conditions thatincrease the probability that a particular symptom is true. (Computerscientists might recognize the use of fuzzy logic, a technique in which acondition doesn't have to be clearly true or false, but might be \a little bittrue" or \very much true.") Basically, the rules consist of comparisons betweentwo items with an accompanying probability value. If the rule is true, theprobability that the symptom is also true increases by the rule's probabilityvalue.
Items are formed either by using constants or by selecting them from a listof available performance indicators supplied by GlancePlus at each interval.Items may also be combined into user-de�ned variables. The syntax for thissection of the GLANCNFG �le is described below. For an example of the CPUbottleneck rules, see below or examine the GLANCNFG �le.
VAR A = TOTAL CPU - BATCH CPU "INTERACTIVE"
SYMPTOM "GLOBAL CPU BOTTLENECK" TYPE=CPU
RULE VAR A > 70 PROBABILITY 25RULE VAR A > 80 PROBABILITY 25
RULE VAR A > 90 PROBABILITY 25
RULE CPU QUEUE > 3 PROBABILITY 75
Customizing HP GlancePlus 7-17
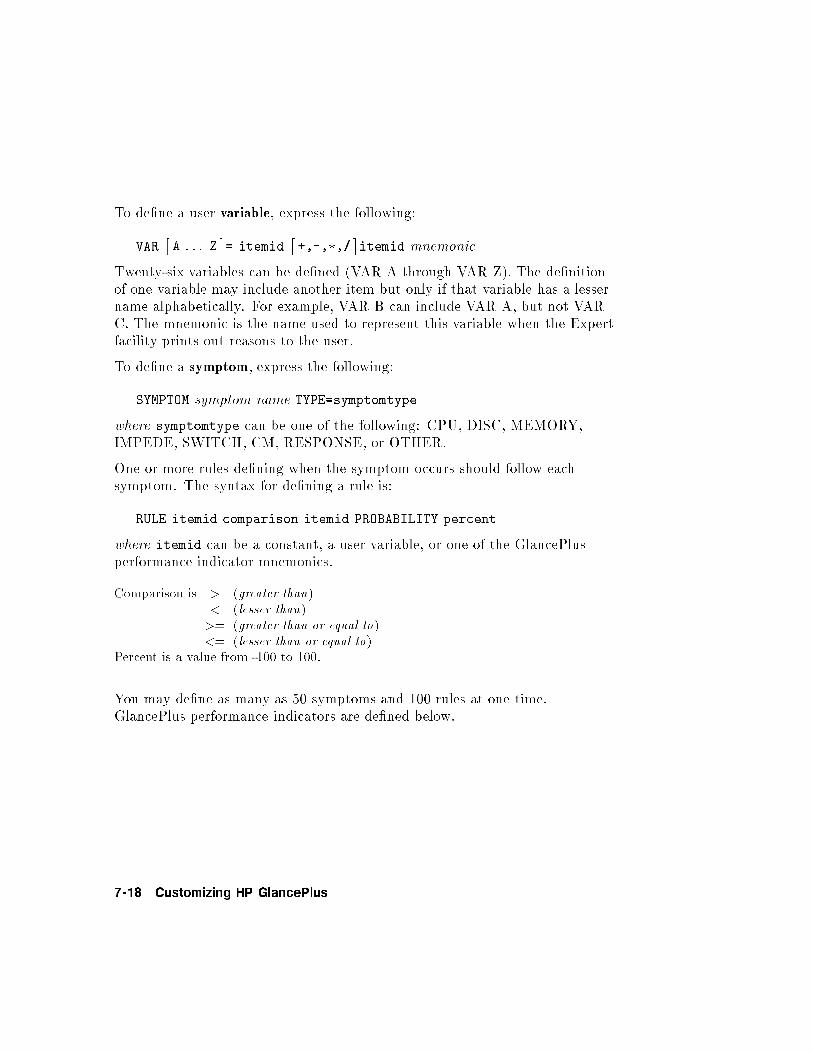
To de�ne a user variable, express the following:
VAR�A . . . Z
�= itemid
�+,-,�,/
�itemid mnemonic
Twenty-six variables can be de�ned (VAR A through VAR Z). The de�nitionof one variable may include another item but only if that variable has a lessername alphabetically. For example, VAR B can include VAR A, but not VARC. The mnemonic is the name used to represent this variable when the Expertfacility prints out reasons to the user.
To de�ne a symptom, express the following:
SYMPTOM symptom name TYPE=symptomtype
where symptomtype can be one of the following: CPU, DISC, MEMORY,IMPEDE, SWITCH, CM, RESPONSE, or OTHER.
One or more rules de�ning when the symptom occurs should follow eachsymptom. The syntax for de�ning a rule is:
RULE itemid comparison itemid PROBABILITY percent
where itemid can be a constant, a user variable, or one of the GlancePlusperformance indicator mnemonics.
Comparison is >
<
>=<=
(greater than)(lesser than)(greater than or equal to)(lesser than or equal to)
Percent is a value from -100 to 100.
You may de�ne as many as 50 symptoms and 100 rules at one time.GlancePlus performance indicators are de�ned below.
7-18 Customizing HP GlancePlus
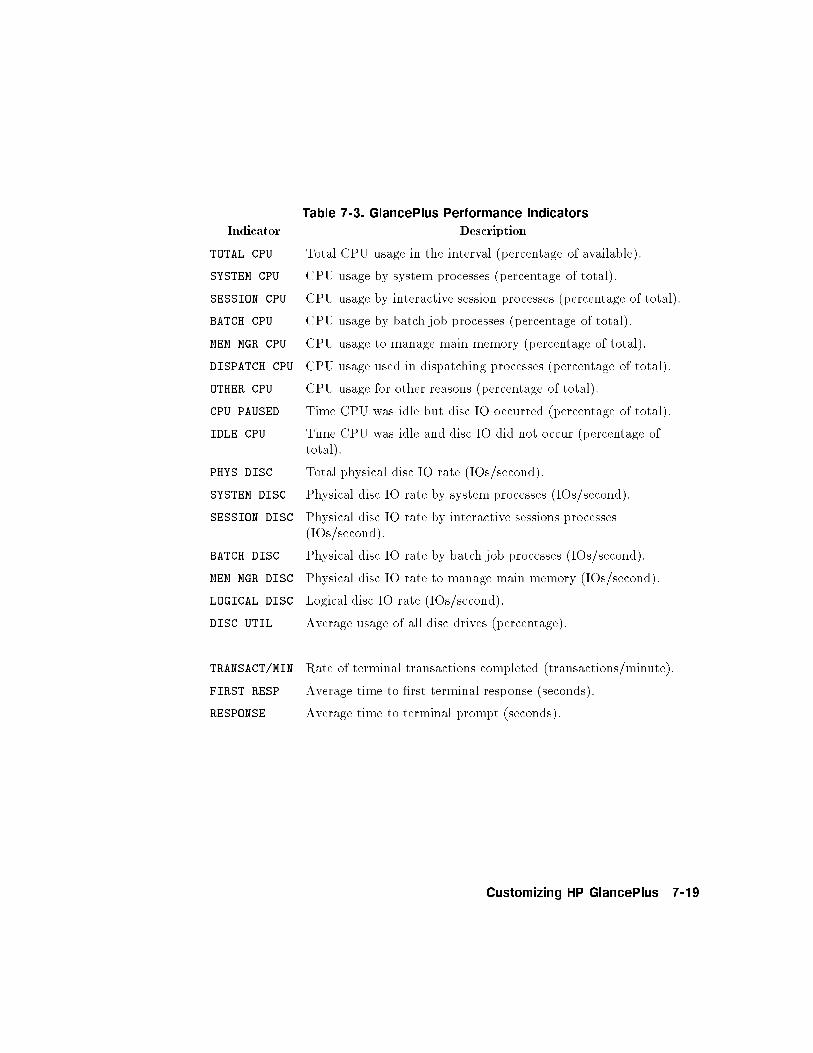
Table 7-3. GlancePlus Performance Indicators
Indicator Description
TOTAL CPU Total CPU usage in the interval (percentage of available).
SYSTEM CPU CPU usage by system processes (percentage of total).
SESSION CPU CPU usage by interactive session processes (percentage of total).
BATCH CPU CPU usage by batch job processes (percentage of total).
MEM MGR CPU CPU usage to manage main memory (percentage of total).
DISPATCH CPU CPU usage used in dispatching processes (percentage of total).
OTHER CPU CPU usage for other reasons (percentage of total).
CPU PAUSED Time CPU was idle but disc IO occurred (percentage of total).
IDLE CPU Time CPU was idle and disc IO did not occur (percentage oftotal).
PHYS DISC Total physical disc IO rate (IOs/second).
SYSTEM DISC Physical disc IO rate by system processes (IOs/second).
SESSION DISC Physical disc IO rate by interactive sessions processes(IOs/second).
BATCH DISC Physical disc IO rate by batch job processes (IOs/second).
MEM MGR DISC Physical disc IO rate to manage main memory (IOs/second).
LOGICAL DISC Logical disc IO rate (IOs/second).
DISC UTIL Average usage of all disc drives (percentage).
TRANSACT/MIN Rate of terminal transactions completed (transactions/minute).
FIRST RESP Average time to �rst terminal response (seconds).
RESPONSE Average time to terminal prompt (seconds).
Customizing HP GlancePlus 7-19
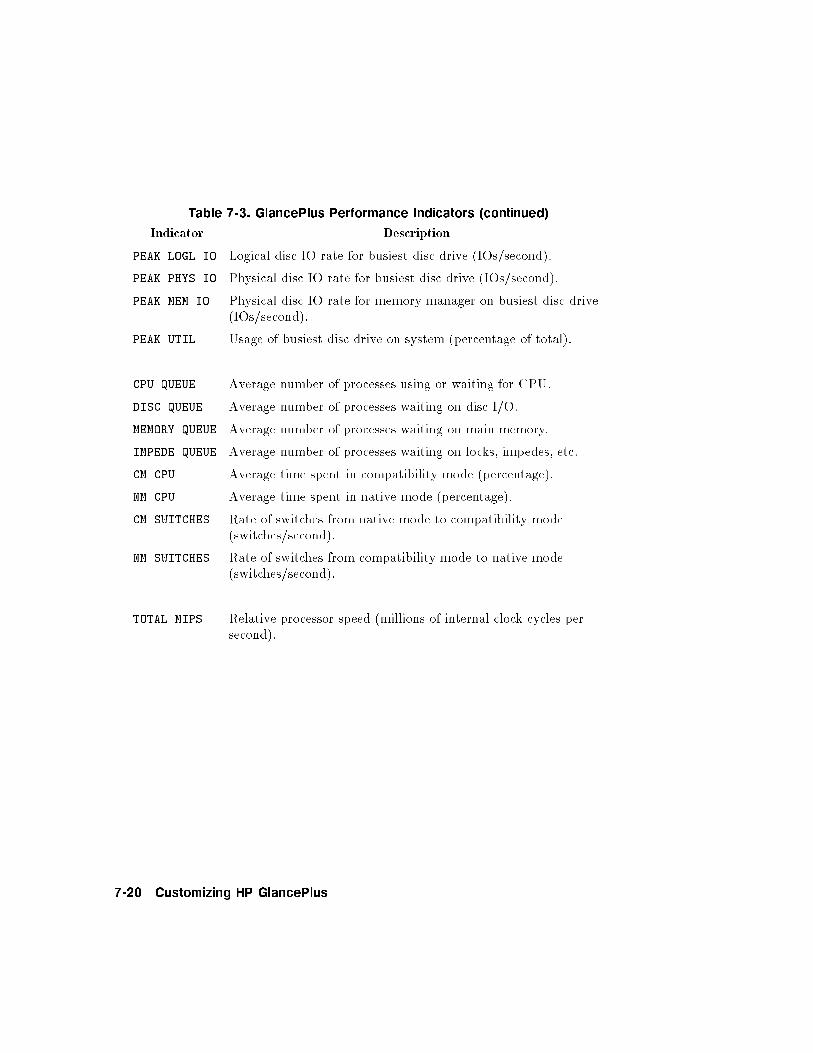
Table 7-3. GlancePlus Performance Indicators (continued)
Indicator Description
PEAK LOGL IO Logical disc IO rate for busiest disc drive (IOs/second).
PEAK PHYS IO Physical disc IO rate for busiest disc drive (IOs/second).
PEAK MEM IO Physical disc IO rate for memory manager on busiest disc drive(IOs/second).
PEAK UTIL Usage of busiest disc drive on system (percentage of total).
CPU QUEUE Average number of processes using or waiting for CPU.
DISC QUEUE Average number of processes waiting on disc I/O.
MEMORY QUEUE Average number of processes waiting on main memory.
IMPEDE QUEUE Average number of processes waiting on locks, impedes, etc.
CM CPU Average time spent in compatibility mode (percentage).
NM CPU Average time spent in native mode (percentage).
CM SWITCHES Rate of switches from native mode to compatibility mode(switches/second).
NM SWITCHES Rate of switches from compatibility mode to native mode(switches/second).
TOTAL MIPS Relative processor speed (millions of internal clock cycles persecond).
7-20 Customizing HP GlancePlus
A
Multiprocessor Systems
In addition to single-processor systems, MPE now supports multiprocessorsystems|systems that have more than one processor (CPU) board. Todetermine if you have a multiprocessor system, examine the banner line of theGlancePlus Global screen. If more than one processor is con�gured, the totalnumber of con�gured processors will be displayed in the area to the right ofthe word \Global." If this area is blank, your system has only one processorcon�gured.
The following is an overview of how GlancePlus presents CPU metrics on amultiprocessor system.
Global CPU bars and their associated percentages are presented relative to allprocessors on the system. Any process CPU metric is presented relative to asingle processor. For example, if a two- processor system has only one activeprocess that constantly consumes CPU, then the Interesting Process section ofthe Global screen will show 100% CPU for that process. The Global CPU barwill display 50% (100% divided by the number of processors). If that samesystem had two processes constantly consuming the CPU, then each processwould show 100% CPU and the Global CPU bar would display 100% (100%plus 100%, divided by the number of processors).
Screens that represent groups of processes (the Job, Session, Filter, andWorkload screens) present their data as follows: CPU bars and their associatedpercentages are displayed relative to all processors. CPU-seconds are displayedrelative to a single processor. For example, a Job screen showing a job withone process constantly using the CPU would display the JOB CPU bar at 50%(just like the Global bar). The CPU total-seconds would increment at the samerate as clock time. The process in this display would still show CPU usage at100% since it is displayed relative to a single processor.
These choices of design for presenting CPU usage represent tradeo�s. Itis useful to present process CPU usage relative to a single processor since
Multiprocessor Systems A-1
other MPE sources such as the system log �les, the REPORT command, theSHOWME command, and log-o� statistics also present CPU usage relativeto a single processor. It is advantageous to represent CPU-seconds on theJob, Session, and Filter screens relative to a single processor so they can becompared properly to other MPE sources. In addition, it is useful to scalethe CPU bars between 0 and 100% of the total processing power of thesystem, or relative to all processors. By doing this, 100% means that the totalCPU power of the system is utilized completely, regardless of the number ofprocessors utilized.
The tradeo� for these advantages is the need to be able to understand that it isreasonable for a two-processor system to have a Global CPU bar showing 100%usage and two processes in the interesting process section each using 100% (ofa single processor). The user must understand the di�erence between GlobalCPU bar and individual process presentations. Once this is understood, theuser need not consider the number of CPUs in use to easily understand howCPU-intensive each process is and how much total processing power is in use.
A-2 Multiprocessor Systems
B
Wait Reasons|Expanded Definitions
A process will be suspended if it cannot access a resource or it must wait foranother event to be completed. Although a process's wait reason can passthrough many di�erent states between refresh intervals, HP GlancePlus reportsthe state at the instant the process is displayed.
The following WAIT reasons occur for MPE/iX:
BREK IMP PAUS
CONS I/O RIN
CPU MEM SEM
DBMS MISC SIR
DISC MSG SON
FATH OTHR TERM
The speci�c WAIT REASONS can be de�ned as follows:
BREK The process is waiting to be resumed from a BREAK. For instance,if a user who is running a program presses the �Break� key and receivesthe colon (:) prompt, that process will show up in a BREK wait.
CONS The process is waiting for a reply from the console operator. Atypical example would be a STORE with an outstanding taperequest at the console.
Wait Reasons|Expanded Definitions B-1
CPU The process is waiting to use the central processing unit. On busysystems, higher priority processes can consume all of the availableCPU resources while lower priority processes must wait. The PRIcolumn displays the queue and priority number of a process. Onextremely busy systems, a low priority batch job (high PRI number)can remain in a CPU wait state while all available CPU resources areconsumed by higher priority processes (lower PRI number).
DBMS When SQL applications are running with multiple users, thedatabase monitor process (DBMON) will stay in the DBMS waitstate during periods of inactivity. This wait state is unique toMPE/iX SQL applications.
When TurboIMAGE applications request a lock, the process will besemaphore waited (SEM).
DISC The process is waiting for the completion of a read to a �le or writeto a �le. This does not include memory manager I/O, which isaccounted for in the MEM wait category. On MPE/iX systems,main memory is used to bu�er I/O requests; this greatly reduces theamount of time a process waits on DISC.
FATH The son process is waiting for its father to reawaken it. When oneprocess creates a second process, the �rst process is referred to as thefather and the second process as the son. The father process has thecapability of starting and stopping the son process.
IMP The process is impeded. This wait state is used for a variety ofreasons.
On MPE/iX systems, processes using databases make use of theDBMS wait state.
I/O The process is waiting for the completion of nondisc I/O, such asfrom magnetic tape. Disc I/O (DISC) and terminal I/O (TERM)have separate wait states and are not included in this category.
B-2 Wait Reasons|Expanded Definitions
MEM The process is waiting for library code, program code, data, or anycombination of the three to be brought into memory. Since it wouldbe wasteful for a large process to fully occupy main memory, theprocess is broken up into smaller pieces, referred to as pages. Asthese segments or pages of memory are needed, they are brought intomain memory from disc and the process must memory (MEM) wait.
It is normal to �nd a process in this state occasionally. Findinga single process in memory wait state repeatedly, however, canbe caused by poor locality|the process's logic is forcing it tocontinually branch to other segments or pages. Finding multipleprocesses in this state can indicate a lack of main memory. As thedemand for memory outstrips the supply, the operating system mustuse a process's main memory for other, higher priority processes.
MISC The process is waiting for an unspeci�ed wait state and isaccumulated under this general category. HP GlancePlus reportsseldom-used wait states in this category.
MSG The process is waiting to receive a message. To synchronize internaloperations, some operating system processes communicate bysending internal messages to one another. MPE message �le waits,RECEIVEMAIL intrinsic waits, and interprocess communication(IPC) waits are examples of user-generated message wait state.
OTHR The process is waiting for an unspeci�ed wait state called OTHR,which excludes all of the other wait states. OTHR appears as an (O)in the wait reasons and the wait-state bar in the Process display.
PAUS The application program calls the PAUSE intrinsic, which delays theprogram for a user-speci�ed length of time. The program is currentlywaiting for this time to elapse before continuing.
RIN Speci�c resources can be shared by a set of processes. MPE providesusers with a RIN (resource identi�cation number) facility to preventtwo processes from using a shared resource at the same time. Whenone process locks a speci�c RIN, a second process wanting to lock thesame RIN will wait. A RIN wait applies to both global and localRINs. RINs are also used to lock MPE/iX �les.
Wait Reasons|Expanded Definitions B-3
SEM The process is waiting for a software semaphore or ag other thanthose speci�ed by SIR and RIN wait categories.
SIR To maintain consistency, certain operating system functions areperformed serially by a single process. To enforce this access pattern,a software resource called a SIR is obtained before the criticalfunction is performed. SIRs are internally-used MPE resources andare not available to users directly.
SON The father process is waiting to be reawakened by its son process.When one process creates a second process, the �rst process isreferred to as the father and the second as the son. The fatherprocess has the capability of starting the son and continuing toprocess, or starting the son and waiting until it is reawakened by theson.
TERM The process is waiting for the completion of a terminal read.
B-4 Wait Reasons|Expanded Definitions
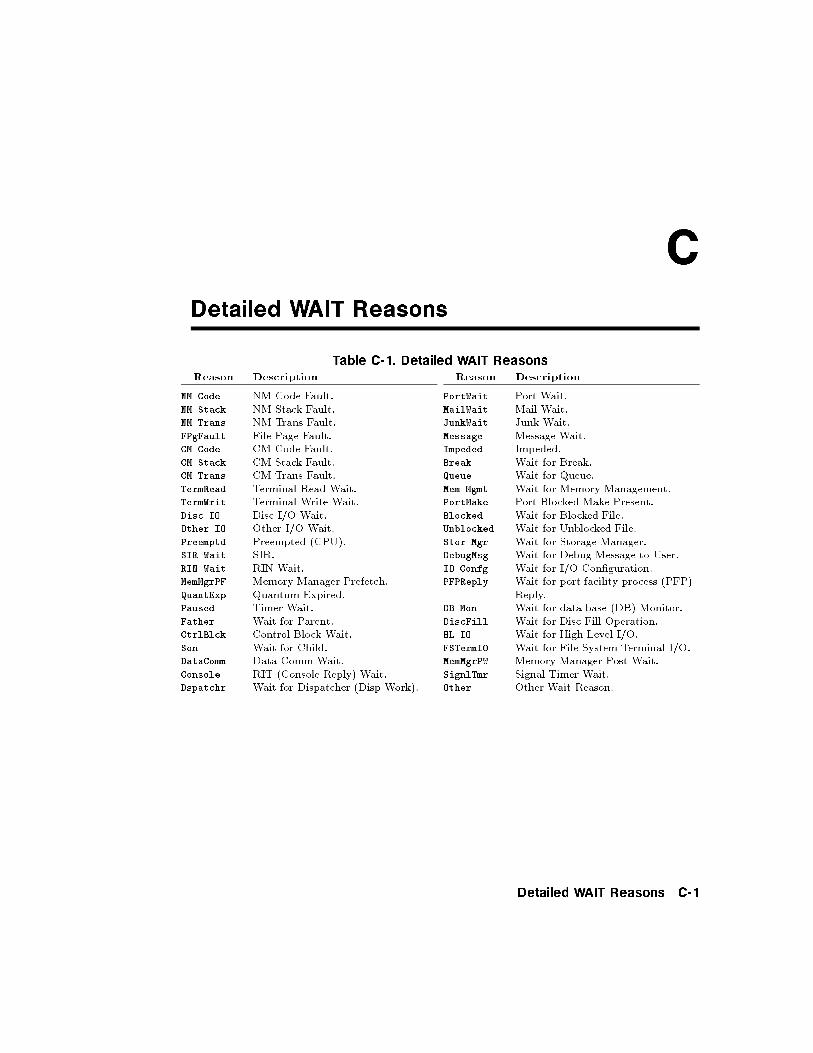
C
Detailed WAIT Reasons
Table C-1. Detailed WAIT Reasons
Reason Description
NM Code NM Code Fault.NM Stack NM Stack Fault.NM Trans NM Trans Fault.FPgFault File Page Fault.CM Code CM Code Fault.CM Stack CM Stack Fault.CM Trans CM Trans Fault.TermRead Terminal Read Wait.TermWrit Terminal Write Wait.Disc IO Disc I/O Wait.Other IO Other I/O Wait.Preemptd Preempted (CPU).SIR Wait SIR.RIN Wait RIN Wait.MemMgrPF Memory Manager Prefetch.QuantExp Quantum Expired.Paused Timer Wait.Father Wait for Parent.CtrlBlck Control Block Wait.Son Wait for Child.DataComm Data Comm Wait.Console RIT (Console Reply) Wait.Dspatchr Wait for Dispatcher (Disp Work).
Reason Description
PortWait Port Wait.MailWait Mail Wait.JunkWait Junk Wait.Message Message Wait.Impeded Impeded.Break Wait for Break.Queue Wait for Queue.Mem Mgmt Wait for Memory Management.PortMake Port Blocked Make Present.Blocked Wait for Blocked File.Unblocked Wait for Unblocked File.Stor Mgr Wait for Storage Manager.DebugMsg Wait for Debug Message to User.IO Confg Wait for I/O Con�guration.PFPReply Wait for port facility process (PFP)
Reply.DB Mon Wait for data base (DB) Monitor.DiscFill Wait for Disc Fill Operation.HL IO Wait for High Level I/O.FSTermIO Wait for File System Terminal I/O.MemMgrPW Memory Manager Post Wait.SignlTmr Signal Timer Wait.Other Other Wait Reason.
Detailed WAIT Reasons C-1

D
Application Definition Files
The GlancePlus Workload screen and appropriate Filter commands allow youto utilize user-de�ned applications. These are the same de�nitions as thoseused by the HP LaserRX/MPE and GlancePlus Pak for MPE/iX products.
You can use any one of the following as an application de�nition �le:
GlancePlus con�guration �le (GLANCNFG.PUB.SYS).
LaserRX or GlancePlus Pak Parm �le (PARM.SCOPE.SYS).
Any other �le that contains valid application de�nitions.
GlancePlus scans the GLANCNFG �le, automatically, every time it isexecuted. If application de�nitions are not found, it attempts to openPARM.SCOPE.SYS. If you want to use a �le other than the ones GlancePlusopens, select it by using the APPL keyword in the Filter or Value command.If no applications are de�ned in the GLANCNFG �le, you may �le equatePARM.SCOPE.SYS to an application de�nition �le of your choice beforestarting GlancePlus. Then it will begin with the desired application de�nitions.
Read access is usually required before a user is allowed to read a �lecontaining application de�nitions. Since the default access for ANY user toPARM.SCOPE.SYS is \execute only," GlancePlus will be able to read it aslong as it has execute access. Note that read access is required for GlancePlusto read GLANCNFG.
Application Definition Files D-1
Application Definition Syntax
The following information describes the syntax used to de�ne an applicationand gives several examples of application de�nitions.
APPLICATION�application name
FILE=��lename
�
INTERACTIVE=��lename
�
BATCH=��lename
�
USER=�job/session name,
��username.acctname
�,groupname
�
QUEUE�execution priority
�
OR
where:
The application name parameter identi�es an application that groups multipleprogram �les together and reports on their combined activities. The applicationname is a string of up to 20 characters identifying that application.
One or more application de�nitions should follow the APPLICATIONcommand. An application de�nition consists of combinations of FILE,INTERACTIVE, BATCH, USER, or QUEUE parameters.
The OR parameter is used to separate multiple de�nitions for the sameapplication.
All application de�nitions apply to the last APPLICATION command entered.
D-2 Application Definition Files
The parameters for application de�nitions fall into three categories:
File name: FILE
INTERACTIVE
BATCH
User logon: USER
Execution priority: QUEUE
If a parameter from a category is used in an application de�nition, a processwill not belong to that application unless a match for that category is made.
If no parameters in a category are used in an application de�nition, then aprocess does not have to match that category.
For example, there can be any number of FILE and USER parametersfollowing an APPLICATION directive, but if there is no QUEUE parameter,a process could belong to any queue and still belong to the application. Itwould have to match at least one of the FILE parameters and one of the USERparameters.
Or, as another example, if an application consisted of USER and QUEUEparameters but had no FILE, INTERACTIVE, or BATCH parameters, thenany program �le name could belong to the application as long as the user logonand execution queue matched one of the USER and QUEUE speci�cations.
Use the OR parameter when you want more than one application de�nition toapply to the same application.
You can de�ne up to 15 applications on MPE V and 31 applications onMPE/iX. GlancePlus prede�nes an application called OTHER that collects allprocesses not de�ned by APPLICATION directives in the application de�nition�le.
If a process �le is included in more than one application, it is logged in the �rstapplication in which it is de�ned.
APPLICATION=Order Processing
FILE=@[email protected],@[email protected],@[email protected]
APPLICATION=Office Products
[email protected],@.ELECTRON.OFICPROD
Application Definition Files D-3
Since @[email protected] is included in Order Processing, any programs [email protected] or @.ELECTRON.OFICPROD will be logged inthe Order Processing application, not in O�ce Products. However, if the orderof the applications is reversed, any programs in the groups FURNITUR andELECTRON in the OFICPROD account will be logged in the O�ce Productsapplication, not in Order Processing.
By default, no user applications are de�ned.
Note Since any process on the system can belong to only oneapplication, no process will be counted in more than oneapplication. The application de�nition �le is processed inthe order entered, and the �rst match of a program name,user logon, and queue will de�ne the application to which aparticular process belongs.
FILE
The FILE=�lename parameter speci�es which program �les belong to anapplication. It includes all interactive or batch executions of these programsand applies to the last APPLICATION directive issued. An error is generatedif no APPLICATION directive is found.
The �lename can be any of the following:
A simple, fully quali�ed MPE �le name. For example,
EDITOR.PUB.SYS
A generic �le name. For example,
VOODOO#.@.@
A partially-quali�ed �le name. For example,
SPOOK5
In this case, all groups and all accounts are assumed (SPOOK5.@.@).
Multiple �le names can be entered on the same line, separated by commas, orin separate FILE parameters.
D-4 Application Definition Files
INTERACTIVE
The INTERACTIVE=�lename parameter acts the same as the FILEparameter except it signi�es that only interactive executions of the program(sessions) are included in the application class.
BATCH
The BATCH=�lename parameter acts the same as the FILE parameter exceptit signi�es that only batch executions of a program (jobs) are included in theapplication class.
USER
The USER=[job/sessionname,]fusername.acctnameg[,group] parameteridenti�es the job or session, user, account, and group to be included in theapplication class.
job/session name,
The job/session name is an optional part of a user logon that can be usedfor identi�cation. If this parameter is included, it must be terminated by acomma. If this parameter is not supplied, all job/session names are matched.
username
The username speci�es the name of the user as de�ned by the MPEaccounting structure.
acctname
The accountname speci�es the name of the logon account as de�ned by theMPE accounting structure.
group
The groupname speci�es the logon group of a particular job or session. It isoptional, but if it is included, it must be preceded immediately by a comma.If this parameter is not supplied, all logon group names are matched.
Application Definition Files D-5
Note Since commas are allowed within the parameter string in theUSER parameter, they cannot be used to separate one logonstring from another. You must use another character (such as aspace) to separate parameters or use a separate USER line foreach logon.
QUEUE
Usually, the execution priority of a process is CS, DS, or ES. Special accountscan log on or run programs with ;PRI=BS, whereas privileged mode andsystem processes can place themselves in the AS or linear queues. (Linearqueue can be any priority you want, but it is not subject to the normal priorityadjustments of the MPE dispatcher.)
You can restrict processes in an application to those belonging to selectedexecution priority queues using the QUEUE [L,A,B,C,D,E] . . . parameter.More than one queue can be indicated. The following example speci�es anyprocess running in either the DS or ES queue:
QUEUE=D,E
Note The AS and BS queues are special cases of the linear executionqueue. If you specify QUEUE=L then processes executing asAS or BS priority are included. Specifying QUEUE=A,B is notthe same as specifying QUEUE=L since the linear queue canbe outside the range of the A and B queues.
A process with process-handling capabilities can change its execution queue asit runs. A process's execution priority can be altered also by an external tool,such as HP GlancePlus.
The process execution queue is sampled at the end of each 1-minute sampleinterval. If the process has changed queue, it can change applications. Allactivity for a process during the 1-minute sample interval is assumed to haveoccurred in the new queue and as such is attributed to the application thatmatches the process at the end of each 1-minute sample interval.
D-6 Application Definition Files
OR
Use the OR parameter to allow more than one application de�nition to applyto the same application. Within a single application de�nition, a process mustmatch at least one of each category of parameters. Parameters separated bythe OR parameter are treated as independent de�nitions. If a process matchesthe conditions for any de�nition, it will belong to the application, as in thefollowing example:
APPLICATION=CONSOLE
USER=OPERATOR.SYS
OR
USER=MANAGER.SYS
FILE=STORE.PUB.SYS,SYSDUMP.PUB.SYS
This de�nes an application (CONSOLE) that consists of any programsrun by the user OPERATOR.SYS plus two programs (STORE.PUB.SYS andSYSDUMP.PUB.SYS), if they are executed by the user MANAGER.SYS.
Sample Application Definition
The following is an example of how an application can be de�ned:
APPLICATION=Program Development
INTERACTIVE=EDITOR.PUB.SYS, QEDIT.@.@, VOODOO#, TDP
[email protected] @.@,TESTGROUP LABTEST,@.@
APPLICATION=Other Editors
FILE=EDITOR.PUB.SYS, QEDIT.@.@, VOODOO#, TDP
APPLICATION=Compilers
[email protected],FORTRAN.PUB.SYS,[email protected]
FILE=PASCAL.PUB.SYS, SPL.PUB.SYS, RPG.PUB.SYS
APPLICATION=HP Products
Application Definition Files D-7
The following is an example of how programs would be logged using thepreceding application de�nition �le:
Program User Logon Application
EDITOR.PUB.SYS GERRY.TEST Program Development
EDITOR.PUB.SYS SAM.SNEED Other Editors
HPSLATE.PUB.SYS SAM.SNEED HP Products
PASCAL.PUB.SYS GERRY.TEST Compilers
EDITOR.UTIL.SYS GERRY.TEST OTHER
If the HP Products application in the previous example was de�ned �rst, the�rst four examples would belong to it.
D-8 Application Definition Files
Index
A
aaa�#� key, 3-10, 4-1aaa�:� key, 3-10, 3-15, 4-2, 5-4, 5-11,
5-25aaa�<� key, 3-10, 4-4aaa�>� key, 3-10, 4-1, 4-4aaa�?� key, 3-13aa�A� key, 3-10, 4-2aa�C� key, 3-9, 3-10, 5-37aa�D� key, 3-9, 3-10aa�E� key, 3-2, 3-10aa�F� key, 3-10, 5-26aa�G� key, 3-10aa�H� key, 3-9, 3-10, 3-13, 6-2aa�I� key, 3-10aa�J� key, 3-10, 4-1aa�L� key, 3-10aa�M� key, 3-10aa�O� key, 3-10, 6-4aa�P� key, 3-10, 3-14, 4-1aa�Q� key, 3-10, 4-3aa�R� key, 3-10, 4-2aa�S� key, 3-10, 4-1aa�T� key, 3-10aa�U� key, 3-10, 4-3aa�V� key, 3-10, 3-16, 5-3, 5-19, 5-20,
6-5, 6-7, 7-4aa�W� key, 3-10aa�X� key, 3-10, 3-12, 6-3, 6-5aa�Z� key, 3-7, 3-10, 4-4a�Ctrl�+�Q� key, 3-10a�Ctrl�+�S� key, 3-10
a�Ctrl�+�Y� key, 3-10additional parameters, 7-6, 7-14All Processes command, 3-10, 4-2Aoptions, 5-21application de�nition �les, 5-27applications, interesting, 5-34bars, 5-35�elds, 5-35
a�Return� key, 3-10a�Space Bar� key, 3-10AUTOINST process, 2-2available commands, list, 3-9
B
banner line, 3-3BATCH parameter, D-5
C
capabilities, group, 2-2CCTL, 3-15changeable parameters, 7-5Change Queue command, 3-10, 4-3changing priorities, 4-3clear screen parameter, 7-12clock cycles, 7-16rate, 5-50
color-emphasized metrics, 5-3, 6-2, 7-16Command Interpreter, 5-4, 5-10, 5-11,
5-32, 5-36, 5-43Command List key, 3-9commands, 4-1{4aaa�#� key, 3-10, 4-1
Index-1
aaa�:� key, 3-10, 3-15, 4-2, 5-4, 5-11,5-25
aaa�<� key, 3-10, 4-4aaa�>� key, 3-10, 4-1, 4-4aaa�?� key, 3-13aa�A� key, 3-10, 4-2aa�C� key, 3-9, 3-10, 5-37aa�D� key, 3-9, 3-10aa�E� key, 3-2, 3-10aa�F� key, 3-10, 5-26aa�G� key, 3-10aa�H� key, 1-3, 3-9, 3-10, 3-13, 6-2aa�I� key, 3-10aa�J� key, 3-10, 4-1aa�L� key, 3-10aa�M� key, 3-10aa�O� key, 3-10, 6-4aa�P� key, 3-10, 3-14, 4-1aa�Q� key, 3-10, 4-3aa�R� key, 3-10, 4-2aa�S� key, 3-10, 4-1aa�T� key, 3-10aa�U� key, 3-10, 4-3aa�V� key, 3-10, 3-16, 5-3, 5-19, 5-20,
6-5, 6-7, 7-4aa�W� key, 3-10aa�X� key, 3-10, 3-12, 6-3, 6-5aa�Z� key, 3-7, 3-10, 4-4a�Ctrl�+�Q� key, 3-10a�Ctrl�+�S� key, 3-10a�Ctrl�+�Y� key, 3-10a�Enter� key, 3-10a�Expert Analysis� key, 3-12All Processes, 3-10, 4-2a�Space Bar� key, 3-10available, list, 3-9Change Queue, 3-10, 4-3CPU Detail, 3-9, 3-10, 5-37Disc Detail, 3-9, 3-10Exit Glance, 3-2, 3-10Expert, 6-3
Expert Analysis, 3-10, 3-12, 6-5Expert Overview, 3-10, 6-4Filter, 3-10, 5-26Global, 3-9, 3-10Help, 3-9, 3-10, 3-13, 6-2I/O by Phys Disc, 3-10list of available, 3-9List Users, 3-10, 4-3Memory Detail, 3-10MPE Command, 3-10, 3-15, 4-2, 5-4,
5-11, 5-25Next Logical Display, 3-10, 4-1, 4-4parameters, 3-1Previous Display, 3-10, 4-4Print, 3-10, 3-14Refresh Screen, 3-10, 4-2RUN, 3-1Select, 3-10, 4-1Select Job, 3-10, 4-1Select Process, 3-9, 3-10, 4-1Select Session, 3-10Set Option Values, 3-10, 3-16, 5-3,
5-19, 5-20, 6-5, 6-7, 7-4single-letter, 3-2, 3-10Time Adjust, 3-10Update Display, 3-10Users, 3-10, 4-3Workload, 3-10Xpert Analysis, 3-10, 3-12, 6-5Xpert Overview, 3-10, 6-4Zero Averages, 3-7, 3-10, 4-4
Commands Menu command, 3-10compatibility mode, 7-16componentsCPU bar, 3-4disc bar, 3-5memory bar, 3-6
con�guration parameters, 5-19con�guring Expert facility, 7-15continuous display, 5-20conventions, iv
Index-2
capitalization, ivcomputer font, iv�Enter�, ivitalics, iv�Return�, ivuppercase, iv
CPUoverhead, 3-7parameters, 7-7usage, 3-3
CPU bar, 3-4, 7-2components, 3-4
CPU Detail command, 3-9, 3-10, 5-37CPU Detail screen, 5-37{43miscellaneous performance metrics,
5-39queue distribution, 5-39top CPU consumer, 5-43type of utilization, 5-38
customizing GlancePlus�lter command, 5-26
D
data �ltering, 6-1default parameters, 7-5detail display, 3-3detailed WAIT reasons, C-1dialogue, �lter, 5-26died parameter, 7-9discparameter, 7-7usage, 3-3utilization, 5-45
disc bar components, 3-5Disc Detail command, 3-9, 3-10Disc Detail screen, 5-44{46individual disc utilization, 5-45summary disc utilization, 5-46top disc consumer, 5-46
dispatcher queue, 7-16display
continuous, 5-20on demand, 5-19
display control parameters, 7-11display control parametersl, 7-6display CPU parameter, 7-12display family, 5-19, 5-24display �les, 5-19, 5-20, 5-21display memory parameter, 7-12display trace, 5-19, 5-24
E
equipmenthardware, 2-1software, 2-1
Exit Glance command, 3-2, 3-10exit program, 3-2, 3-10Expert Analysis command, 3-10, 6-5Expert command, 6-3Expert facility, 6-2con�guring, 7-15invoking, 6-3parameters, 7-6, 7-13
expert mode parameter, 7-13Expert Overview command, 3-10, 6-4expert users parameter, 7-14
F
family display, 5-19, 5-24fault types, 5-48�le detail display parameter, 7-11�le display, 5-19, 5-20, 5-21�le opens, 5-21, 7-16rate, 5-42
FILE parameter, D-4�le parameters, 5-19�lterdialogue, 5-26processes, 5-32value, 5-31
Filter command, 3-10, 5-26Filter Display screen, 5-29{33
Index-3
�lter bars, 5-30�lter processes, 5-32Summary �elds, 5-31
�ltering, 6-1Filter screen�lter dialogue, 5-26variables, 5-26
Filter Select screen, 3-8Foptions, 5-21function keys, 3-3, 3-9command list, 3-9global, 3-9Process screen, 5-19select process, 3-9
functions, process-speci�c, 5-19fuzzy logic, 7-17
G
GlancePlus installation, 2-1GlancePlus Pak for MPE/iX, 1-2GLANCNFG �le, 5-27, 7-4, 7-16global bars, 3-3, 7-2Global command, 3-10Global key, 3-9Global screen, 3-9, 5-2{6color-emphasized metrics, 5-3highlighted metrics, 5-3interesting processes, 5-2, 5-3, 5-4underlined metrics, 5-3
groupaccess, 2-2capabilities, 2-2
guidelines, 6-2
H
hardware requirements, 2-1Help command, 3-9, 3-10, 3-13, 6-2Help facility, 3-13help, online, 1-3highlighted metrics, 5-3, 6-1, 6-2, 7-16hitem, 7-16
I
individual disc utilization, 5-45installationGlancePlus, 2-1group access, 2-2group capabilities, 2-2program �les, 2-2
INTERACTIVE parameter, D-5interesting applications, 5-34bars, 5-35�elds, 5-35
interesting processes, 3-8, 3-15, 5-2color-emphasized metrics, 5-3components, 5-4, 5-11Global screen, 5-4highlighted metrics, 5-3Job/Session screen, 5-10, 5-11thresholds, 7-5, 7-7underlined metrics, 5-3
Interesting Process Thresholds Optionsscreen, 3-15
Interrupt Control Stack, 5-38I/O by Physical Disc command, 3-10itemid, 7-18
J
job selection, 4-1Job/Session screen, 5-7{12interesting processes, 5-10job/session bars, 5-8summary �elds, 5-8
K
key words, 3-13
L
labels, 3-9LaserRX/MPE, 1-2, 5-27list commands key, 3-9List Users command, 4-3
Index-4
low level analysis, 7-17
M
memory bar, 7-2, 7-3components, 3-6
Memory Detail command, 3-10Memory Detail screen, 5-47{50fault types, 5-48miscellaneous, 5-49
memory usage, 3-3metricscolor-emphasized, 5-3, 6-2, 7-16highlighted, 6-1, 6-2, 7-16underlined, 6-2, 7-16
minimum CPU parameters, 7-7modecompatibility, 5-18, 7-3, 7-16native, 5-18, 7-3, 7-16
MPE Command, 3-10, 3-15, 4-2, 5-4,5-11, 5-25
multiprocessor systems, A-1
N
native mode, 7-16new parameter, 7-8Next Logical Display command, 3-10,
4-1, 4-4NOCCTL, 3-15
O
on demand display, 5-19online help, 1-3operating system software, 2-1OR parameter, D-7overhead, 3-7
P
page faults, 7-16rate, 5-50
parametersadditional, 7-6, 7-14
clear screen, 7-12CPU, 7-7default, changeable, 7-5died, 7-9disc, 7-7display control, 7-6, 7-11display CPU, 7-12display memory, 7-12Expert facility, 7-6, 7-13expert mode, 7-13expert users, 7-14�le detail display, 7-11hierarchy, 7-5minimum CPU, 7-7new, 7-8process keys, 7-11QZAP, 7-14QZAPSYS, 7-14refresh time, 7-15response time, 7-8RUN command, 7-1setting, 7-5transaction, 7-8wait on CPU, 7-9wait on disc, 7-10wait on impede, 7-9wait on memory, 7-10
PC requirements, 2-1performanceindicators, 6-1, 7-17other tools, 1-2recommendations, 7-17
Previous Display command, 3-10, 4-4Print command, 3-10, 3-14Print facility, 3-14process bars, 5-14components, 5-14
processescount, 5-8, 5-31, 5-35details, 3-8display, 3-3
Index-5
interesting, 3-8, 3-15, 5-2, 5-10, 7-5,7-7
selection, 4-1setting thresholds, 3-15statistics, 3-8thresholds, 7-5, 7-7
process keys parameter, 7-11Process screen, 5-13{25function keys, 5-19miscellaneous process information,
5-17process bars, 5-14process state bars, 5-16process summary �elds, 5-15
process-speci�c functions, 5-19Process Thresholds Options screen, 3-15prockeys parameter, 5-19productname, 3-3version, 3-3
program access, 2-2
Q
queue, 7-3changing, 4-3circular, 5-35circular, priority, 4-3linear, 5-35linear, priority, 4-3priority, 5-17, 5-35, 7-3
QUEUE parameter, D-6QZAP parameter, 7-14QZAPSYS parameter, 7-14
R
rate, �le open, 5-42Refresh Screen command, 3-10, 4-2refresh time, 7-1parameters, 7-15
requirementshardware, 2-1
software, 2-1resetting statistics, 3-7resource statistics, 3-8response timecomponents, 5-16parameter, 7-8
RESTORE, group capabilities, 2-2rules, de�ning, 7-19RUN command, 3-1parameters, 7-1
RXForecast/MPE, 1-2
S
scheduling state, 5-17screensCPU detail, 5-37disc detail, 5-44�lter display, 5-29�lter select, 3-8global, 3-9, 5-2{6Global, 3-2identi�er, 3-3job/session, 5-7memory detail, 5-47printing, 3-14process, 5-13process thresholds options, 3-15sections, 3-3selection, 7-1set option values, 3-8workload, 5-34
screen sectionsbanner line, 3-3detail display, 3-3, 3-8fault types, 5-48�lter bars, 5-30�lter processes, 5-32function keys, 3-3global bars, 3-3individual disc utilization, 5-45interesting applications, 5-35
Index-6
interesting processes, 5-2, 5-3, 5-10job/session bars, 5-8miscellaneous, 5-49miscellaneous performance metrics,
5-39miscellaneous process information,
5-17process bars, 5-14Process screen function keys, 5-19process state bars, 5-16process summary �elds, 5-15queue distribution, 5-39summary disc utilization, 5-46summary �elds, 5-8, 5-31top CPU consumer, 5-36, 5-43top disc consumer, 5-36, 5-46type of utilization, 5-38
Select command, 3-10, 4-1Select Job command, 3-10, 4-1Select Process command, 3-9, 3-10, 4-1Select Session command, 3-10, 4-1service time, 7-16session selection, 4-1Set Option Values command, 3-10, 3-16,
5-3, 5-19, 5-20, 6-5, 6-7, 7-4Set Option Values screen, 3-8setting parameters, 7-5single-letter commands, 3-2, 3-10softkeys, 3-9software, operating system, 2-1Software Performance Tuner (SPT), 1-2data collection, 5-25
starting GlancePlus, 3-1state bars, process, 5-16components, 5-16
statisticsprocess, 3-8resetting, 3-7resource, 3-8
summary disc utilization, 5-46summary �elds, 5-31
process screen, 5-15switches, 5-20, 7-16between modes, 5-18guidelines, 5-39, 5-41, 5-42
symptoms, 7-18de�ning, 7-19
SYS option, 5-10system processesdisplay (SYS), 5-10
T
terminal requirements, 2-1thresholds, 3-15{17setting, 3-15values, 5-27
timeCPU, 5-32current, 3-3elapsed, 5-16, 5-31response, 5-16, 5-18service, 5-45, 7-16total CPU, 5-31total disc, 5-31utilization, 5-45
Time Adjust command, 3-10Timeout on prompts , 4-4top consumerCPU, 5-34, 5-36, 5-43disc, 5-34, 5-36, 5-46
trace display, 5-19, 5-24transaction parameter, 7-8transactions, terminal, 5-17
U
UDC�les, 2-2processes, 5-34RUN command, 3-1
underlined metrics, 5-3, 6-2, 7-16Update Display command, 3-10usage
Index-7
CPU, 3-3disc, 3-3memory, 3-3
USER parameter, D-5Users command, 3-10, 4-3
V
variables�lter screen, 5-26user-de�ned, 7-17
W
wait on CPU parameter, 7-9wait on disc parameter, 7-10wait on impede parameter, 7-9wait on memory parameter, 7-10WAIT reasons, 5-17components, 5-6, 5-11detailed, C-1
expanded de�nitions, B-1WAIT statescomponents, 5-16
Workload command, 3-10Workload screen, 5-34{36interesting applications, 5-35top CPU consumer, 5-36top disc consumer, 5-36
X
Xpert Analysis command, 3-10, 3-12,6-5
Xpert facility, 6-2invoking, 6-3
Xpert Overview command, 3-10, 6-4
Z
Zero Averages command, 3-7, 3-10, 4-4
Index-8