Embed Size (px)
Citation preview
CAIT-UTC-003
ABC Deck Panel Testing
FINAL REPORT
September 2013
Submitted by:
Paul J. Barr
Associate Professor
Utah State University
4110 Old Main Hill
Logan, UT 84332
Marv W. Halling
Professor
Utah State University
4110 Old Main Hill
Logan, UT 84332
Zane Wells
Utah Department of Transportation
Submitted to:
Utah Department of Transportation
Russ Scovil
In cooperation with
Rutgers, The State University of New Jersey
And
Utah
Department of Transportation
And
U.S. Department of Transportation
Federal Highway Administration

Disclaimer Statement
The contents of this report reflect the views of the authors,
who are responsible for the facts and the accuracy of the
information presented herein. This document is disseminated
under the sponsorship of the Department of Transportation,
University Transportation Centers Program, in the interest of
information exchange. The U.S. Government assumes no liability for the contents or use thereof.
The Center for Advanced Infrastructure and Transportation (CAIT) is a Tier I UTC Consortium led by
Rutgers, The State University. Members of the consortium are the University of Delaware, Utah State
University, Columbia University, New Jersey Institute of Technology, Princeton University, University of
Texas at El Paso, University of Virginia and Virginia Polytechnic Institute. The Center is funded by the U.S.
Department of Transportation.
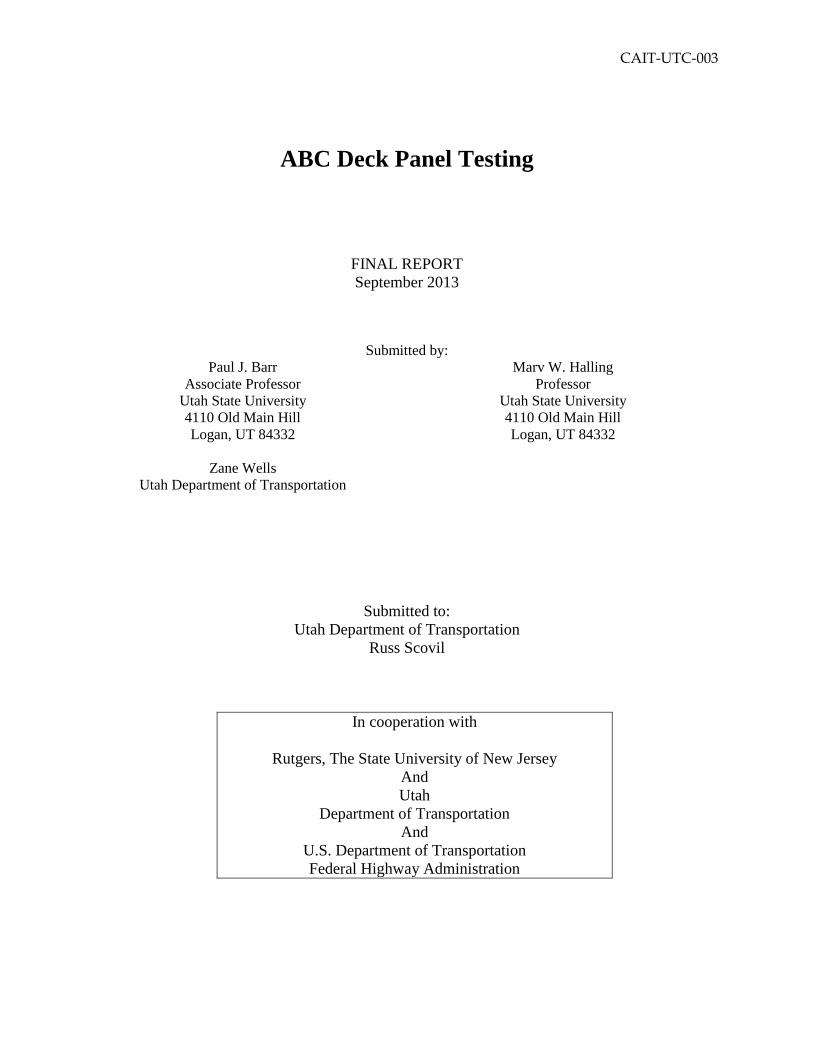
1. Report No.
CAIT-UTC-003
2. Government Accession No. 3. Recipient’s Catalog No.
4. Title and Subtitle
ABC Deck Panel Testing
5. Report Date
September 2013 6. Performing Organization Code
CAIT/Utah State
University
7. Author(s)
Paul J. Barr, Marv W. Halling, and Zane Wells
8. Performing Organization Report No.
CAIT-UTC-003
9. Performing Organization Name and Address
Utah State University
4110 Old Main Hill
Logan, UT 84332
10. Work Unit No.
11. Contract or Grant No.
DTRT12-G-UTC16
12. Sponsoring Agency Name and Address 13. Type of Report and Period Covered
Final Report
06/01/12 to 09/06/13
14. Sponsoring Agency Code
15. Supplementary Notes
U.S. Department of Transportation/Research and Innovative Technology Administration
1200 New Jersey Avenue, SE
Washington, DC 20590-0001
16. Abstract
Accelerated Bridge Construction techniques have resulted in innovative options that
save time and money during the construction of bridges. One such group of techniques
that has generated considerable interest is the usage of individual precast concrete
decks in place of cast-in-place bridge decks. Utilizing precast concrete decks allow for
offsite curing, thus eliminating long delays due to formwork and concrete curing time.
These precast concrete decks have inherent joints between the individual panels.
These joints are locations for potential leakage, which can lead to corrosion or
inadequate long-term performance. Post-tensioning the precast deck panels helps to
eliminate leakage; however, conventional longitudinal post-tensioning systems require
complete deck replacement in the event of a single faulty deck panel. A proposed
post-tensioned, curved strand connection that allows for a single panel replacement
will be studied for this research. The capacity of the proposed curved strand
connection will be investigated in order to compare its behavior to other systems that
are currently in use.
17. Key Words
Accelerated Bridge Construction, Precast,
Deck, Panels, Losses
18. Distribution Statement
19. Security Classification (of this report)
Unclassified 20. Security Classification (of this page)
Unclassified 21. No. of Pages
82 22. Price
Center for Advanced Infrastructure and Transportation
Rutgers, The State University of New Jersey
100 Brett Road
Piscataway, NJ 08854
Form DOT F 1700.7 (8-69)
T E C H NI C A L R E P OR T S T A NDA RD TI TLE P A G E

ABSTRACT
Accelerated Bridge Construction (ABC) techniques have resulted in innovative options
that save time and money during the construction of bridges. One such group of techniques
that has generated considerable interest is the usage of individual precast concrete members.
Utilizing precast concrete decks allows for offsite curing, thus eliminating long delays due to
formwork and concrete curing time. These precast concrete decks have inherent joints between
the individual panels. These joints are locations for potential leakage, which can lead to
corrosion or inadequate long-term performance. Post-tensioning the precast deck panels helps
to eliminate leakage; however, conventional longitudinal post-tensioning systems require
complete deck replacement in the event of a single faulty deck panel. A proposed post-
tensioned, curved-strand connection allows for a single panel to be replaced. The capacity of
the proposed curved-strand connection was investigated in order to compare its behavior to
other systems that are currently in use. Tests were performed in composite negative bending,
beam shear, and positive bending. The curved strand connection was found to behave similarly
to the standard post-tensioning system in positive bending and shear. The curved-strand
connection was found to be comparable to a standard post-tensioning system. The ultimate
capacity of the curved-strand connection in negative bending was found to be 97% of the
standard post-tensioning. Pre-stress losses were measured and predicted for the service life of
the connection and were found to be 6% at the 75-year service life of a bridge.
(72 pages)

CONTENTS
Page
ABSTRACT ................................................................................................................................... iii
PUBLIC ABSTRACT ....................................................................................................................... v
ACKNOWLEDGMENTS ................................................................................................................ vi
LIST OF TABLES ........................................................................................................................... ix
LIST OF FIGURES .......................................................................................................................... x
CHAPTER
I. INTRODUCTION ................................................................................................. 1
II. LITERATURE REVIEW ......................................................................................... 4
Introduction ................................................................................................. 4
Joint Considerations .................................................................................... 4
Small-Scale Testing ...................................................................................... 5
Accelerated Bridge Deck Performance ........................................................ 7
Full-Scale Testing ......................................................................................... 9
Shear Testing ............................................................................................. 10
Pre-Stress Losses ....................................................................................... 11
III. RESEARCH AND TESTING ................................................................................ 13

Small-Scale Specimen Test Details ............................................................ 13
Small-Scale Test Results ............................................................................. 19
Pre-Stress Losses ....................................................................................... 27
Comparison with AASHTO LRFD Specifications ......................................... 28
Full-Scale Experimental Test Setup ........................................................... 32
Full-Scale Experimental Results ................................................................. 36
Full-Scale Comparison to AASHTO LRFD Specifications............................. 39
Finite-Element Model Analysis .................................................................. 41
IV. CONCLUSIONS ................................................................................................. 45
REFERENCES .............................................................................................................................. 48
APPENDICES .............................................................................................................................. 50
APPENDIX A. Test Setup and Specimen Construction .................................................. 51
APPENDIX B. Recorded Data ......................................................................................... 70

LIST OF TABLES
Table Page
1 Zeta Values ..................................................................................................................... 20
LIST OF FIGURES
Figure Page
1 Small Specimen Details. ................................................................................................... 14
2 Small Scale Test Setup. .................................................................................................... 19
3 Applied Moment vs. Deflection. ....................................................................................... 21
4 Applied Load vs. Load in the Strand. ............................................................................. 255
5 Load vs. Deflection Shear Specimen. ............................................................................. 266
6 Shear Failure (Test Specimen and ANSYS Models). ..................................................... 277
7 Pre-Stress Loss vs. Time. .................................................................................................. 29
8 Layout of Full-Scale Specimen Prior to Grouting. ......................................................... 355
9 Full-Scale Testing Setup. ................................................................................................ 377
10 Load vs. Deflection Under Load. .................................................................................... 388
11 Full-Scale Joint (Physical and FEM Model). .................................................................. 400
12 Small Specimens Prior to Concrete Placement. .............................................................. 522
13 Full-Scale Specimen Rebar and Pocket Layout. ............................................................. 533
14 Placing Concrete in Shear Specimen. ............................................................................. 544
15 Aggregate Exposed in Joint for Grouting. ...................................................................... 555
16 Joint Prior to Grouting and Grouted. .............................................................................. 555
17 Post-Tensioning Bearing Plate and Connection.............................................................. 566
18 Load Cell on Curved Strand Connection. ....................................................................... 577
19 Post-Tensioning. ............................................................................................................. 588
20 Placement of Precast Panels on Steel I-Girders. ............................................................. 588
21 Shear Studs After Welding. .............................................................................................. 59
22 Small Scale Test Setup. .................................................................................................. 600
23 Flexural Failure of Small Scale Specimen. ..................................................................... 611
24 Shear Test Setup. ............................................................................................................ 611
25 Shear Reactions. .............................................................................................................. 622
26 Shear Crack Propagating Along Joint. ............................................................................ 633
27 Full Scale Loading. ......................................................................................................... 644
28 Uplift Restraint Beam. .................................................................................................... 644
29 Full Scale Test Setup. ..................................................................................................... 655
30 Cracking Along Joint. ..................................................................................................... 666
31 Joint Opening. ................................................................................................................. 677
32 Flexural Cracking of Deck Panel Away from Joint. ......................................................... 68
33 Strand Load vs. Time. ....................................................................................................... 71
34 Applied Shear Load vs. Load in Pre-Stresssing Strand. ................................................... 72
35 Externally Applied Moment vs. Rotation at Joint............................................................. 73
36 Externally Applied Moment vs. Joint Opening. ............................................................... 74

CHAPTER I
INTRODUCTION
The American Society of Civil Engineers (ASCE) in 2009 released their report card on the
infrastructure of the United States of America. Overall the nation’s infrastructure received a D
grade which points to an outdated infrastructure that is in need of innovative solutions to place
the nations’ highways in acceptable condition. Bridges received one of the higher grades, a C,
due to a large percent of them being structurally deficient or functionally obsolete (ASCE 2009).
One innovative technique that is being explored for bridge construction and replacement has
been Accelerated Bridge Construction (ABC).
ABC encourages the use of bridge replacement and construction techniques that
minimally affect traffic flows. The Utah Department of Transportation (UDOT) has used several
different ABC techniques to reduce the traffic delays associated with a growing infrastructure
demand. Some of these techniques have involved building the bridge off site and moving it into
place with a Self Propelled Modular Transporter (SPMT). This technique requires substantial
upfront investments for SPMT, though the traffic delay can be minimized to days instead of
months. UDOT has used SPMT bridge construction for several years, and in that time span has
developed specifications for use of the SPMT. The SPMTs are a cost beneficial alternative when
large traffic disruptions are problematic, and there is a site nearby to build the bridge section.
Another technique used by ABC is the use of precast members that can be quickly
constructed on site. Various DOTs have used precast concrete girders and deck panels to
expedite the construction process. Precast concrete deck panels are a good alternative to cast-

2
in-place (CIP) concrete decks because they cure off site and then are placed on the bridge fully
cured. These deck panels are typically positioned adjacent to one another and the joints
between the panels are filled with grout. The CIP decks are continuous and monolithic, whereas
the precast panels have a joint between panels which have been found to be prone to cracking.
By adding post-tensioning through the joint the cracking can be minimized. While the rest of
the panels are problem free post-tensioning increases the strength and the serviceability of the
decks, it creates a problem when an individual panel is required to be removed. Utah State
University (USU) has done several studies on the use of a curved bolt connection to strengthen
the panel connection. This research examines the use of a pre-stressing strand in the place of
previously tested threaded rods for the post-tensioning medium. In addition to capacity testing,
pre-stress losses across the joint were also monitored.
This research has focused on the behavior of a 72” curve strand connection. The
research was done in four parts. A small-scale study was performed to determine flexural
strength of the connection. The results were then compared to the behavior of a straight post-
tensioned connection. One of the small-scale specimens was selected to study pre-stress losses
in the 72” connection. Losses were measured for 60 days and then extrapolated out across the
life of the deck. A full depth full width specimen was constructed to be tested in shear. The
shear behavior of the joint could then be compared to a standard DOT post-tensioning
connection. A full-scale model was constructed and tested to determine the behavior of the
connection in negative bending. A finite-element model (FEM) was also constructed, tested and
then compared to the physical models.
The research showed that the 72” curve bolt behaved similarly to a standard post-
tensioning connection in use by DOT’s. The small-scale curved-strand connection was tested in

3
flexure, and was found to have an ultimate capacity of 31 k-ft., this value was similar to previous
research that was conducted at USU. Pre-stress losses were measured on a small-scale flexure
specimen. The measured pre-stress loss values were compared to predicted values in the
American Association of State Highway and Transportation Officials (AASHTO) Load and
Resistance and Factor Design (LRFD) Specifications. The measured losses were used to calculate
future losses using a linear regression analysis. The extrapolated losses at 75 years was found to
be 6%. This was 26% of the value predicted using the AASHTO LRFD Specifications. A shear test
was performed on a 12 ft. wide small-scale specimen. The shear strength of the panel was
approximately 157.4 k, or 31.5 k per connection. A full-scale composite specimen was tested in
a negative moment region. The test specimen consisted of two pre-cast deck panels placed on
two steel I-girders made composite through shear studs. An external negative moment was
induced using a beam with an overhang test setup. The capacity of the system in negative
bending was found to be 500 k. This value compared very well with the values predicted by the
AASHTO LRFD Specification.

4
CHAPTER II
LITERATURE REVIEW
Introduction
The use of precast concrete deck panels has been utilized for many years. This
construction technique has helped to decrease the overall construction time of many projects.
Initially these decks have performed well in the field, however, over time joint leaking has been
found to be a problem. Several researchers have investigated the causes of the leaking, and
worked to mitigate any problems found. The body of research has varied from preparing the
joint for grouting, shear keyway shape, post-tensioning the joint, and many other topics.
Joint Considerations
In the mid 1990’s, several research programs investigated joint design and preparation.
Issa et al. (1995) undertook an aggressive research program focusing on the field behavior of
precast concrete decks throughout the United States. The research began with identifying use
of precast concrete decks throughout the nations DOT’s. After a survey was completed by the
DOT’s, several bridges were chosen to perform field investigations on. The joints that were
post-tensioned were found to behave better than those that were not. Several different joints
shapes were looked at, and the post-tensioned joints were best. The 03200 Waterbury Bridge in
Connecticut has variable stress on each joint. This variation in stress is due to the differing loads
5
on each panel. The pre-stressing stresses were chosen to keep the joint in compression to
effectively seal the deck from any water that might penetrate the joints. Le Blanc (2006) built
upon Issa’s research during design of the West Sandusky Bridge in Findlay, Ohio. During the
design, a Finite-Element Analysis was performed to determine the tensile stresses that would be
encountered during the life of the bridge. The loads applied varied from gravity loads to creep
and shrinkage of the concrete. Shrinkage was found to induce the greatest tensile stresses in
the deck, and from those calculated stresses, a pre-stressing load was calculated to keep the
deck in compression under any loading conditions. In addition to the externally applied loads
that cause joint separation and subsequent leaking, leaking can occur to due poor joint
preparation (Swenty 2009). Joint preparation was found to be important to get a strong bond
between the grout shear key and the concrete decks. Proper preparation of the joint required
that the joint be cleaned prior to grouting. After cleaning the joint and immediately prior to
grouting, the joint was required to be exposed to water in order to keep the concrete from
drawing water out of the grout as the grout cured.
Small-Scale Testing
The curved bolt connection is an option to be able to post-tension the joint, while
allowing for the removal of a damaged panel from the middle of the deck if required. The
initial idea for the connection was their use in tunnel liners to seal them together. Previous
research done at USU was performed in two phases on the curved bolt. The first phase of
testing consisted of small-scale concrete panels tested in flexure. Porter et al. (2010) performed
testing at USU on several connection types. The connections that were tested were a welded

6
stud and standard post-tensioned connection. The third standard connection used by UDOT is a
connection developed and tested at the University of Nebraska-Lincoln, and is known as the
NUDECK connection (Badie and Tadros 2008). The remaining two connections that were tested
was the curve bolt connection previously mentioned, as well as a variation of the welded stud
connection using embedded rebar instead of shear studs. All connection types were tested to
determine their flexural and shear capacity. The purpose of the testing was to find the cracking
and ultimate capacities of the connections. From the collected data, recommendations for
further research and improvements were presented.
The first connection that was tested by Porter et al. (2010) was a welded stud
connection. The welded stud connection is a standard connection for UDOT, and consists of two
plates that are cast into the deck via shear studs. The joint configuration used was a female-
female joint. After the panels are placed on the bridge super structure, a backer rod is placed
between them and welded in place. After welding the studs together, the joint is grouted. No
post-tensioning is provided for this connection. A variation of this connection was also tested.
For this second connection type, rebar was used instead of shear studs to anchor the plates into
the precast decks. The post-tensioning connection consisted of external post-tensioning via four
rods on the outside of the specimen. Two variations of the curve bolt were also tested; one had
a 36-inch rod, and the other a 24-inch rod. They were placed in conduit that was cast into the
deck. After grouting the joint the curved bolts were tightened until 300 psi of compression
stress was applied along the joint. The bolts strains were monitored to determine the force in
the bolt, and thus the stress along the joint. All connections except for the two curved bolts
were tested in flexure and shear. The curve bolt connections were tested only in flexure. The
flexure specimens were full depth 8.75 inches deep panels. The specimens were 18 inches wide
to account for the tributary area of the connection in a full-scale bridge deck. The specimens

7
were six feet long after grouting the two halves together. The flexure decks were tested with a
four point loading scheme resulting in a pure moment region. The specimen was placed on two
supports to create a simply supported beam. Then the two loads were placed at equidistant
points from each support. This loading created a region over the joint that had a constant
moment and zero shear. The specimens were loaded monotonically until failure. During the
testing, cracking was monitored and recorded, as well as deflection via an LVDT. Each
connection type was tested three times, on three different specimens. The average capacities
were then computed. The 24-inch curve bolt was relatively weak in comparison to the post-
tensioned connection. This connection cracked at 38% of the load required to crack the post-
tensioned connection. Its ultimate capacity was 70% of the ultimate capacity of the post-
tensioned connection. The researchers also tested a 36-inch curve bolt. This 36-inch curve bolt
cracked at 76% of the post-tensioned connection cracking load, and it was 20% stronger than
the standard post-tension connection. The researchers concluded that the longer curve bolts
acted more similar to a fully post-tensioned system in comparison to the shorter ones.
Therefore they could be an effective alternative to standard post-tensioning connection.
Accelerate Bridge Deck Performance
UDOT has invested considerable amounts of time and money into ABC over the years.
As a result UDOT has been able to determine problems with different aspects of ABC. Through
the problems encountered with their ABC experience UDOT has been able to develop their
specifications to improve their use of ABC. In 2010 UDOT performed a study on the experiences
that they had with ABC. The purpose of the study was to determine how ABC has performed in

8
the past, evaluate the causes why something performed poorly, determine the life span of the
bridges, and determine any necessary changes to the ABC Specifications and the future direction
of any UDOT programs in order to better the ABC program. The study investigated several
aspects in the study. The welded stud connection that was previously tested at USU was
evaluated on several bridges. It was found that it was performing well. The joints with this
connection were leaking and behaving like hinges instead of making the bridge decks
continuous. UDOT estimated a 15 year service life span for bridge decks with this connection
type. The causes behind the weaknesses were attributed to not enough flexural capacity of the
connection. The standard post-tensioning system was also investigated. UDOT concluded that
the standard longitudinal post-tensioning of the system was behaving the best. They estimated
a 75-year life span for the decks that were post-tensioned. Leaking was not found to be a
problem for these connection systems. The causes behind the joint not leaking were attributed
to the joints being in compression. Several other bridge systems were also evaluated. Concrete
closure pours were leaking, possibly due to shrinkage of the closure pour concrete. The bridges
that were built off site and moved into place (using either SPMT or a sliding system) were also
investigated. The bridges that were built on supports that had the pick points for the SPMT
different than the in service supports, experienced significant cracking. While those built and
picked at similar support points had experienced virtually no cracking. These bridge types have
an estimated life span of 40 to 75 years (Utah Department of Transportation 2010). See also
Hewes and Priestly (2002), Holombo et al. (1998), Joen and Park (1990), MacRae and Priestley
(1994), Matsumoto and Ma (2005), and Matsumoto et al. (2001).

9
Full-Scale Testing
As a follow up study USU performed additional research on the curved bolt connection.
Roberts (2011) performed full-scale testing of precast bridge decks on two connection types.
The first was the standard longitudinal post-tensioning connection, while the second was a 36-
inch curved bolt connection. The 36-inch connection was selected because it performed better
than the 24-inch curve bolt in the Porter et al. (2010) research. The purpose of the research was
to compare the curve bolt connection to the standard post-tensioning rod connection on full-
scale specimens. Two types of specimens for each connection were constructed at USU. A full
depth flexural specimen was built for each member. The precast panels were placed on
W21x122 steel sections in order to maintain the location of the neutral axis out of the concrete
deck. The testing was done in negative bending to quantify the tensile capacity of the
connections. The other specimen type was a full depth specimen that was only long enough for
the curve bolts. These panels were tested in shear directly over the joint.
Both connections were built to standard DOT specifications. The curved bolt connection
used the identical geometry as the post-tensioned system. After placement the joints were
grouted with Masterflow 928 non-shrink grout. This was the same grout used by Porter et al.
(2010) to grout their connections. The specimens were post-tensioned to 300 psi across the
joint, and then grouted to the girders via shear studs. A load was placed on the bridge deck
panels at the overhanging edge to create a negative moment over the joint. Loading was done
in small increments up to the point that the top of the decks cracked. After cracking loading
steps were increased. Deflections were monitored throughout the entire test, and used to
identify elastic/plastic behavior. The curve bolt and post-tensioning systems were tested
10
similarly. The standard post-tensioning system cracked at almost twice the loading that was
required to crack the curve bolt, even though the yield and plastic loads were over 80% of the
loads required for the standard post-tensioning system. It was concluded based on the test
results that the curve bolt connection could be used as an acceptable alternative to standard
post-tensioning currently used by various DOTs. The curve bolt performed well in the testing
process, and it was observed that it allowed for a composite failure of the deck. The standard
post-tensioning also performed well and held the deck together throughout the test, however
numerous shear studs were found to have broken off during the test, which indicated a non-
composite failure mechanism.
Shear Testing
Roberts (2011) also compared the curve bolt connection to the standard post-tensioning
system. The specimens used in these tests had the same depth and width as those used in the
flexural testing. The differences were that the decks were not placed on girders, and they were
shorter in the longitudinal direction, only being long enough to accommodate the curve bolts.
The panels were placed on supports and a load was placed transversely at a distance equal to
the depth d to the side of the joint. This allowed for the joint to be loaded in constant shear.
The curve bolt was found to have only 30% of the capacity of the post-tension system. This was
stronger than the calculated values for shear, leading the researcher to conclude that the
strength was sufficient for the loads in accordance to the AASHTO LRFD Specifications (2010).
Kim and Park (2002) investigated at the capacity of precast pre-stressed concrete deck
panels. Using Mohr’s-Circle, a required shear force for failure was calculated. The Mohr’s-Circle

11
approach took the pre-stressing force and increased the rupture strength of the concrete. Using
this approach and multiplying the shear stress by the failure plane area resulted in a shear force
to crack and ultimately fail the specimens. The specimens were loaded so that the joint was
subjected to pure shear, with little or no flexure. The calculated cracking and failure loads were
then compared to the measured shear values. This technique led to good results in comparison
to the measured values. Kim and Park were able to demonstrate that the increase in pre-
stressing force increased the shear capacity of the system.
Pre-stress Losses
Pre-stressing (whether pre-tensioning or post-tensioning) has been used for many years
to increase the strength and service performance of concrete elements. Despite the benefits of
pre-stressing concrete, are some problems that can occur if not designed properly. One of the
biggest issues is accurately accounting for the pre-stress losses. Pre-stress losses occur for
several reasons, but all the reasons lead to the initial pre-stressing force being reduced as a
function of time. Elastic shortening losses occurs when a system is pre-tensioned, and is of very
little concern with post-tensioned systems. Shrinkage also is not a big concern for pre-cast,
post-tensioned systems, this is because most concrete members are cast off site and are
allowed to fully cure before post-tensioning is applied. Creep is an issue with the post-
tensioning due to compressive loads being applied to concrete and sustaining the loads over a
long period of time. Relaxation in the strands is another item to consider. Slippage in the post-
tensioning tendon end anchorage systems are also important to examine. When using a jack
the strands may slip as they are released from the jack. This could potentially be even a large

12
concern as the bridge deck specimens are relatively short. Another possible source of pre-stress
losses is any friction that might be encountered between the strands and the ducts (McCormack
and Nelson 2006).

13
CHAPTER III
RESEARCH AND TESTING
Small-Scale Specimen Test Details
In order to investigate the performance of a proposed precast deck panel, curved-strand
connection, six precast panels were constructed at the Systems, Materials, and Structural Health
Monitoring (SMASH) Lab at Utah State University (USU). The panels were constructed and
designed in accordance to standard AASHTO specifications, including typical rebar layout, deck
thickness, and concrete strengths. Three small-scale specimens were constructed with the
proposed curved-strand detail. As shown in Figure 1, these specimens were 0.86 x 2.5 m (34 x
98 in.). In order to investigate the performance of the curved-strand panels in comparison with
standard post-tensioned panels, two standard post-tensioned specimens were also constructed
using the same dimensions as the three curved-strand specimens. These post-tensioned panels
used a single straight post-tensioning rod to post-tension the system. The sixth specimen was
constructed for shear testing. This shear specimen was a 3.66 m (12 ft.) long section of deck
joint, and 2.44 m (8 ft.) in the direction of travel to allow for placement of the curved-strand
pockets (see Appendix A).
The small-scale panels were designed in accordance to the AASHTO LRFD Specifications
(2010) which specifies that the maximum center-to-center spacing of the post-tensioning was
not to exceed 4 times the total composite deck thickness. With a deck thickness equal to 220
mm (8.75 in.) a total width equal to 860 mm (34 in.) was selected. The panel length was
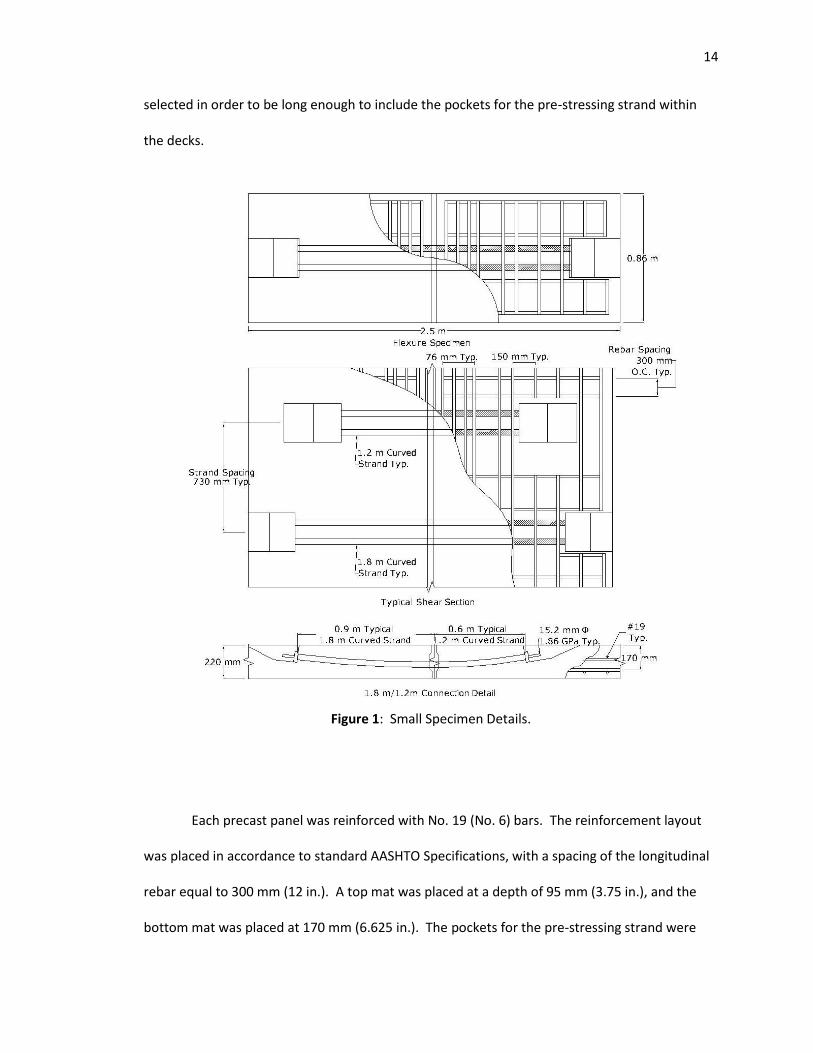
14
selected in order to be long enough to include the pockets for the pre-stressing strand within
the decks.
Figure 1: Small Specimen Details.
Each precast panel was reinforced with No. 19 (No. 6) bars. The reinforcement layout
was placed in accordance to standard AASHTO Specifications, with a spacing of the longitudinal
rebar equal to 300 mm (12 in.). A top mat was placed at a depth of 95 mm (3.75 in.), and the
bottom mat was placed at 170 mm (6.625 in.). The pockets for the pre-stressing strand were
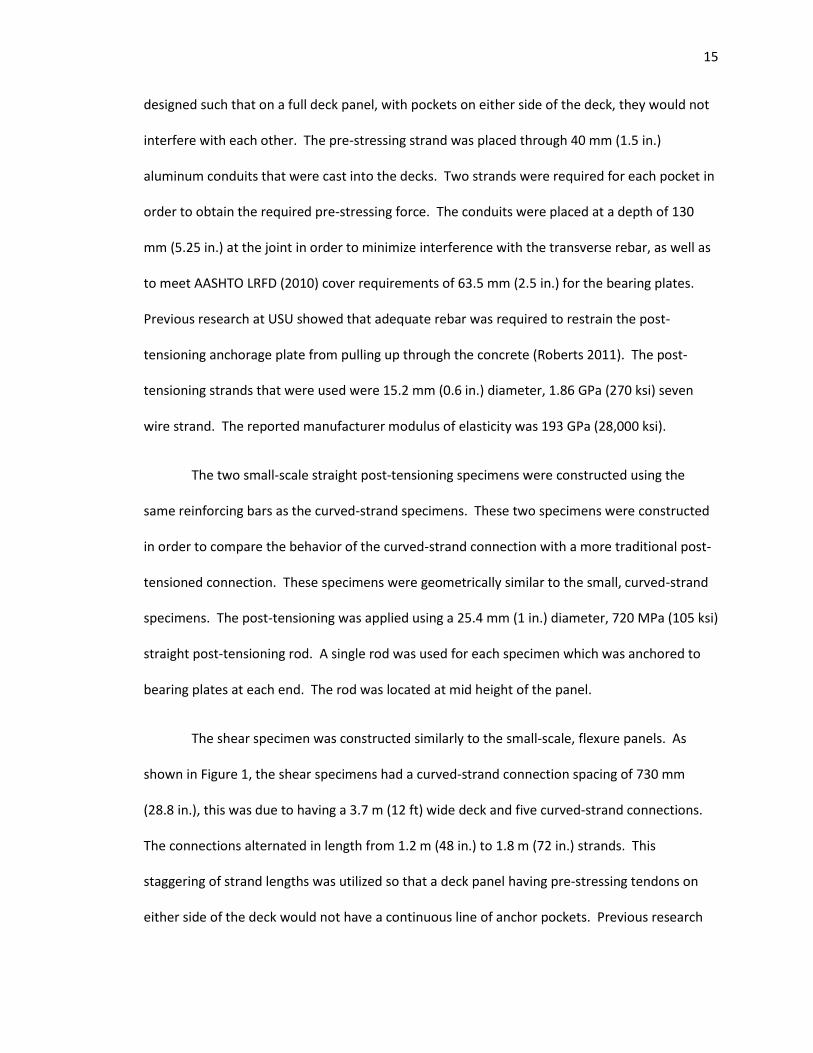
15
designed such that on a full deck panel, with pockets on either side of the deck, they would not
interfere with each other. The pre-stressing strand was placed through 40 mm (1.5 in.)
aluminum conduits that were cast into the decks. Two strands were required for each pocket in
order to obtain the required pre-stressing force. The conduits were placed at a depth of 130
mm (5.25 in.) at the joint in order to minimize interference with the transverse rebar, as well as
to meet AASHTO LRFD (2010) cover requirements of 63.5 mm (2.5 in.) for the bearing plates.
Previous research at USU showed that adequate rebar was required to restrain the post-
tensioning anchorage plate from pulling up through the concrete (Roberts 2011). The post-
tensioning strands that were used were 15.2 mm (0.6 in.) diameter, 1.86 GPa (270 ksi) seven
wire strand. The reported manufacturer modulus of elasticity was 193 GPa (28,000 ksi).
The two small-scale straight post-tensioning specimens were constructed using the
same reinforcing bars as the curved-strand specimens. These two specimens were constructed
in order to compare the behavior of the curved-strand connection with a more traditional post-
tensioned connection. These specimens were geometrically similar to the small, curved-strand
specimens. The post-tensioning was applied using a 25.4 mm (1 in.) diameter, 720 MPa (105 ksi)
straight post-tensioning rod. A single rod was used for each specimen which was anchored to
bearing plates at each end. The rod was located at mid height of the panel.
The shear specimen was constructed similarly to the small-scale, flexure panels. As
shown in Figure 1, the shear specimens had a curved-strand connection spacing of 730 mm
(28.8 in.), this was due to having a 3.7 m (12 ft) wide deck and five curved-strand connections.
The connections alternated in length from 1.2 m (48 in.) to 1.8 m (72 in.) strands. This
staggering of strand lengths was utilized so that a deck panel having pre-stressing tendons on
either side of the deck would not have a continuous line of anchor pockets. Previous research

16
showed that longer curved-strands behaved better than shorter curved-strands (Porter 2010).
Therefore the longest tendons possible were selected, the limiting factor being the pockets on
the opposite side of the decks. Another benefit that could be realized from utilizing the longer
tendons would be a reduction in seating losses, as the anchorage losses for a short strand are
larger than those in a longer strand.
The specified concrete compressive strength for all panels was 27.6 MPa (4000 psi) at 28
days. Concrete cylinders were made at the time of casting and were tested in accordance with
ASTM Standards at 28 days. The actual concrete compressive strength was found to be 34.7
MPa (5040 psi). The experimentally obtained modulus of elasticity was measured to be 35.2
GPa (5100 ksi). The mild reinforcement that was used in all specimens had a yield stress of 410
MPa (60 ksi). The Modulus of Elasticity was assumed to be 200 GPa (29,000 ksi).
After the concrete specimens attained the required compressive strength, they were
moved into place and grouted together using Masterflow 928 grout. The pre-stressing strands
were then post-tensioned to their required force. The AASHTO LRFD Specifications (2010)
requires that a force sufficient to supply 1.7 MPa (250 psi) of stress be distributed across the
joint face. The maximum spacing was chosen to be the effective width for each strand. With
two strands per pocket, the required load in each strand was 165 kN (37.2 kips). To verify the
actual load in the strands, a load cell was placed at the ends of a select number of strands. The
strands were jacked in two stages. First the strands were stressed to a line pressure of 13.8 MPa
(2000 psi) to set the chuck wedge on the dead end. The load was then removed and the tendon
was again stressed to 120% of the required load; and the chuck wedge was then seated. This
overstressing was applied to compensate for the estimated seating and elastic shortening
losses. The straight post-tensioned specimens were stressed by tightening a nut on the end of

17
the rod. The load and strain in the rod was measured to verify that the appropriate post-
tensioning load was obtained.

18
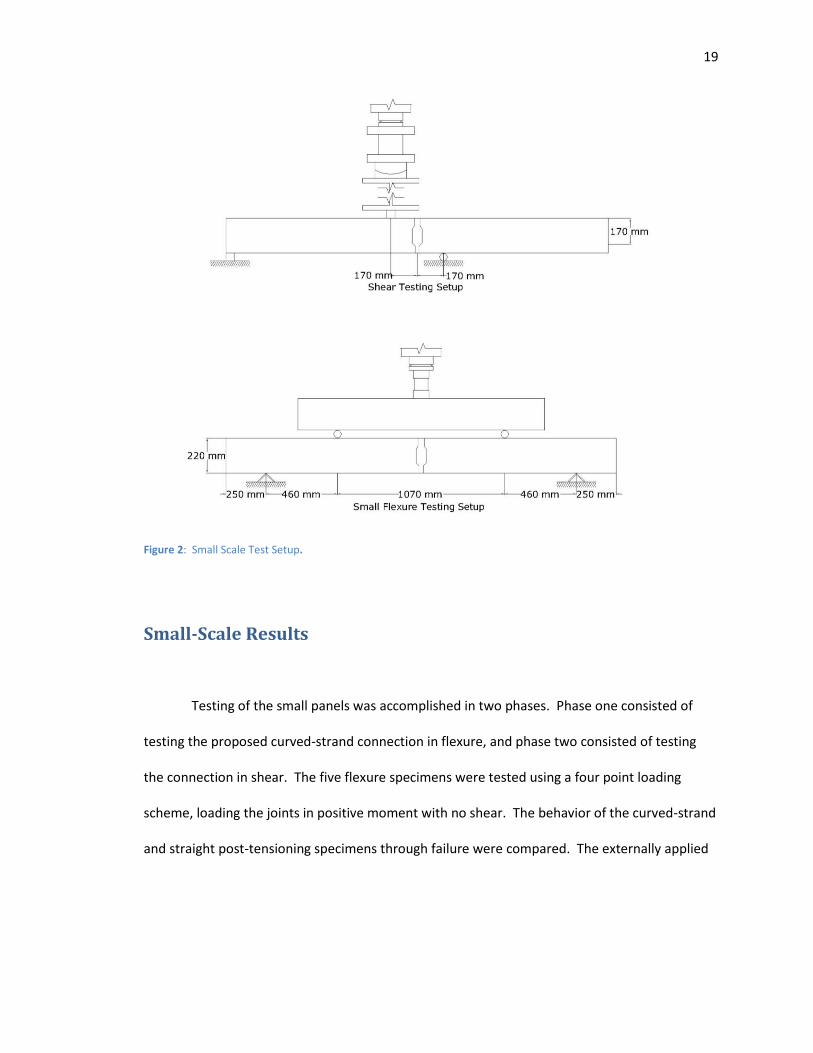
Figure 2 shows the test set up for the flexure and shear specimens. The three curved
bolt and two post tension specimens were tested through failure using a four point loading
scheme. The four point loading scheme was selected to produce a region of pure moment and
zero shear over the joint of the test specimen. During each of the tests, loads and
corresponding deflections were measured during testing. Load cells that were used during the
pre-stressing operation were also monitored to help identify cracking. Loading of the panels
was accomplished using a single hydraulic ram centered on a spreader beam. To avoid a shear
failure and induce a flexural failure, the panels were set on the testing frame with 250 mm (10
in.) of overhang, and 460 mm (18 in.) between the reactions of the spreader beam. For the
shear testing, the panel was set on its supports to induce a shear failure. A line load was placed
at a distance d from the joint centerline. A reaction support was placed at a distance d, 170 mm
(6.63 in.) on the opposite side of the joint. This loading and support scheme created a high
shear region coupled with minimal moment. The load and deflection relationship along with the
strand force were also monitored throughout the shear testing.
19
Figure 2: Small Scale Test Setup.
Small-Scale Results
Testing of the small panels was accomplished in two phases. Phase one consisted of
testing the proposed curved-strand connection in flexure, and phase two consisted of testing
the connection in shear. The five flexure specimens were tested using a four point loading
scheme, loading the joints in positive moment with no shear. The behavior of the curved-strand
and straight post-tensioning specimens through failure were compared. The externally applied

20
loads and loads in the post-tensioning strands were monitored and used to quantify the cracking
and ultimate capacity of the members.
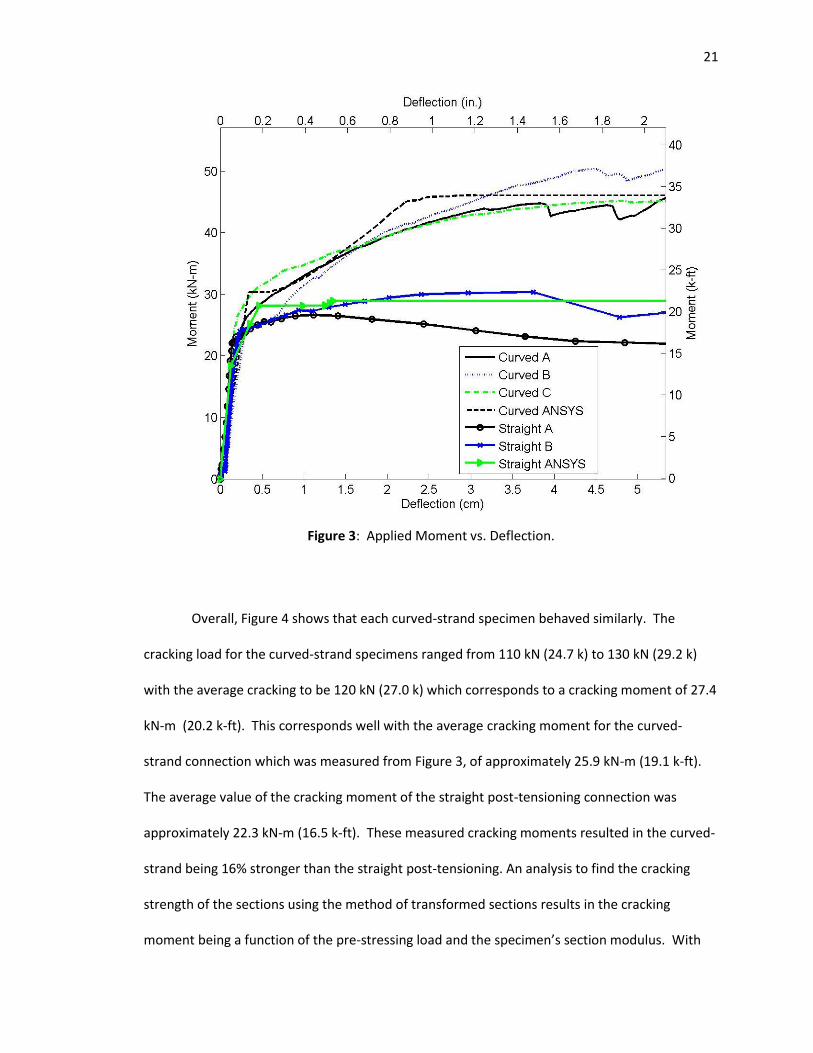
Figure 3 shows the externally applied moment and the corresponding deflection
relationships that were measured during testing of the five, small-scale, flexure tests. Figure 3
shows the initial behavior for each specimen is similar in terms of stiffness. The cracking load
was verified using the load in the strands. After cracking, the straight post tensioned specimens
demonstrated nearly plastic behavior until the ultimate moment was obtained. The curved-
strand specimens obtained a larger externally applied moment. The curved-strand specimens
also showed a very distinct inelastic region.
Figure 4 shows the relationship that was measured between the externally applied load
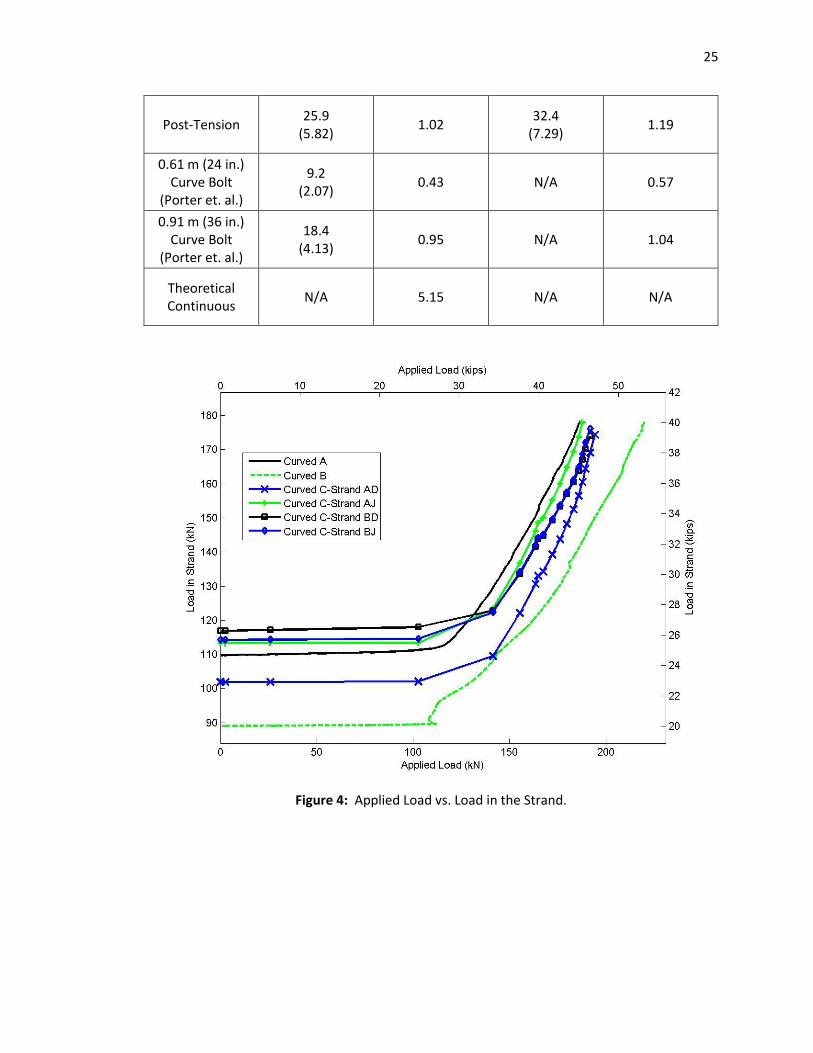
and the measured load in the strand. The Curved C specimen had a load cell placed on each of
the two strands at the dead and jacking ends. Strand AD signifies Strand A on the Dead end.
Strand AJ is strand A on the Jacking end and Strand BD and BJ are named similarly. It can be
seen from the figure that the load in the strand is initially nearly constant. After the post-
tensioning stress in the joint is overcome, the section cracks. At this point, the force in the
strand increases as it is required to carry the tensile force.
21
Figure 3: Applied Moment vs. Deflection.
Overall, Figure 4 shows that each curved-strand specimen behaved similarly. The
cracking load for the curved-strand specimens ranged from 110 kN (24.7 k) to 130 kN (29.2 k)
with the average cracking to be 120 kN (27.0 k) which corresponds to a cracking moment of 27.4
kN-m (20.2 k-ft). This corresponds well with the average cracking moment for the curved-
strand connection which was measured from Figure 3, of approximately 25.9 kN-m (19.1 k-ft).
The average value of the cracking moment of the straight post-tensioning connection was
approximately 22.3 kN-m (16.5 k-ft). These measured cracking moments resulted in the curved-
strand being 16% stronger than the straight post-tensioning. An analysis to find the cracking
strength of the sections using the method of transformed sections results in the cracking
moment being a function of the pre-stressing load and the specimen’s section modulus. With

22
these two values being constant, a constant cracking moment is calculated. Likewise, until
cracking occurs the measured deflections are similar, this can be attributed to deflection being a
function of boundary conditions and the flexural rigidity of the test specimen.
Immediately after cracking of the curved-strand specimen occurs, the system flexural
stiffness is reduced as more of the applied load is resisted by the post-tensioning strands. At an
average load of 42 kN-m (31.0 k-ft), the system began to behave plastically as can be seen from
the deflection increasing while there was little increase in the external load. The ultimate
capacity of the system was defined when no additional external load could be maintained or
when the concrete crushed. The ultimate capacity of the proposed curved-strand connection
was approximately 45.4 kN-m (33.5 k-ft). The ultimate capacity of the straight post-tensioned
connection was found to be 27.1 kN-m (20 k-ft), which was equal to 60% of the ultimate
capacity of the proposed curved strand connection. Overall the ultimate capacity of the curved-
strand specimens was found to be greater than that of the straight post-tensioned system
(Figure 3). This can mainly be attributed to the greater strength and area of the curved-strand
tendon. A non-dimensional value was derived and applied to each of the test specimens in
order to non-dimensionally compare the ultimate capacities of the test specimens using:
𝜁 =10 ∗ 𝑀𝑜𝑚𝑒𝑛𝑡𝐽𝑜𝑖𝑛𝑡
𝐴𝑠𝑓𝑦𝑏 1.
where 𝑀𝑜𝑚𝑒𝑛𝑡𝐽𝑜𝑖𝑛𝑡 is measured in kN-mm (k-in.). 𝐴𝑠 is the area of the tensile reinforcement
that crosses the joint in mm2 (in.2). The 𝑓𝑦 that was used was the stress in the steel in GPa (ksi).
The width of the member was reported as 𝑏 in mm (in.). The factor 10 was applied so that the
ultimate capacity of the 1.8 m (72 in.) curved-strand connection was approximately equal to
one.

23
Table 1 presents the average normalized ultimate capacities of the proposed curved-
strand connection, standard post-tensioned connection, and for comparison the average
normalized ultimate capacities of a 0.61 m (24 in.) and 0.91 m (36 in.) curved bolt connection
tested by Porter et al. (2010). All connection capacities were compared to a theoretical
continuous concrete beam. The theoretical continuous concrete beam that was used in the
calculations had geometric and reinforcement properties similar to the actual beams tested.
The beam was 18 in. wide and 8.75 in. thick. Reinforcement was provided with four #6 bars
with a top cover of 2.75 in., and four #6 longitudinal bars with 1 in. of bottom cover. The
theoretical ultimate capacity was calculated using a conventional Whitney stress block analysis
(Porter et al. 2010). The cracking capacities of the specimens were compared using the
experimentally obtained cracking moments, and dividing them by the width of the test
specimens.
By comparing the capacities of the test panels for this research to previous research it
can be seen that the longer curved-strand connections have a larger cracking capacity than the
curved bolt connection tested by Porter et al. (2010) under service loads. By also presenting the
results using the non-dimensional zeta value, the ultimate behavior of Porter and others’ (2010)
specimens could be compared to the curved-strand connection. The ultimate capacity of the
proposed 1.8 m (72 in.) curved-strand was 20% of the ultimate capacity of the theoretical
continuous panel. The ultimate capacity of the straight post-tensioned connection was found
to be non-dimensionally equivalent to that of the proposed curved-strand connection. The
cracking capacity of the proposed 1.8 m (72 in.) curved-strand connection was 22% greater than
that of the straight post-tensioned connection. The 1.8 m (72 in.) curved-strand connection
behaved similarly to the 0.91 m (36 in.) curved bolt connection tested by Porter et al. (2010),
with an ultimate capacity equal to 107% of the capacity of the 0.91 m (36 in.) curved bolt. The
24
cracking capacity was found to increase as the post-tensioning employed approached a straight
tendon.
However, it was observed that the 1.8 m (72 in.) curved strand connection had a
cracking capacity higher than the straight post-tensioning connection. This was attributed to
the increase in the pre-stressing steel area and strength of the curved strand connection.
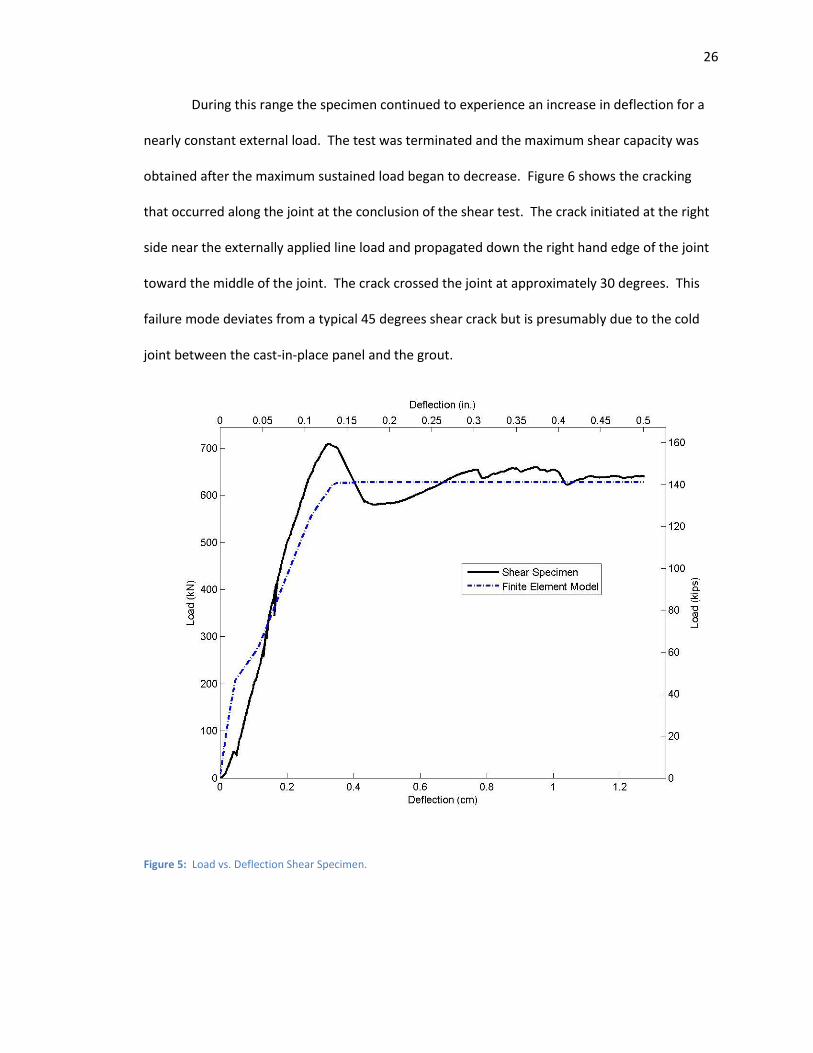
The small-scale shear testing was accomplished by applying a line load near the joint.
From the applied loads and measured deflections, a shear capacity of the connection was
obtained. Figure 5 shows the measured relationship between the externally applied load and
the corresponding deflection for the shear specimen. From this figure it can be seen that the
specimen showed a distinctive elastic range followed by a nearly plastic range. The specimen
was found to crack at approximately 700 kN (157.4 k). After the specimen cracked the capacity
decreases to 631 kN (142 k) as the panels slipped in the joint.
The ultimate shear capacity of the system was found to be approximately 172.2 kN/m
(11.8 k/ft). The ultimate shear capacity of the system was calculated using the AASHTO LRFD
Specifications to be 169.3 kN/m (11.6 k/ft.). The calculated capacity predicts the measured
capacity of the system. Afterwards, the external load was resisted by bearing and friction along
the shear key and dowel behavior of the strand, at which point the capacity slightly increased.
Table 1: Zeta Values
Connection Unit Cracking Moment, kN-m/m (K-ft/ft)
Ultimate ζ
FEM Unit Cracking
Moment, kN-m/m (K-ft/ft)
FEM Ultimate ζ
1.8 m (72 in.) Curved-strand
(Average)
31.7 (7.13)
1.02 32.5
(7.30) 1.02
25
Post-Tension 25.9
(5.82) 1.02
32.4 (7.29)
1.19
0.61 m (24 in.) Curve Bolt
(Porter et. al.)
9.2 (2.07)
0.43 N/A 0.57
0.91 m (36 in.) Curve Bolt
(Porter et. al.)
18.4 (4.13)
0.95 N/A 1.04
Theoretical Continuous
N/A 5.15 N/A N/A
Figure 4: Applied Load vs. Load in the Strand.
26
During this range the specimen continued to experience an increase in deflection for a
nearly constant external load. The test was terminated and the maximum shear capacity was
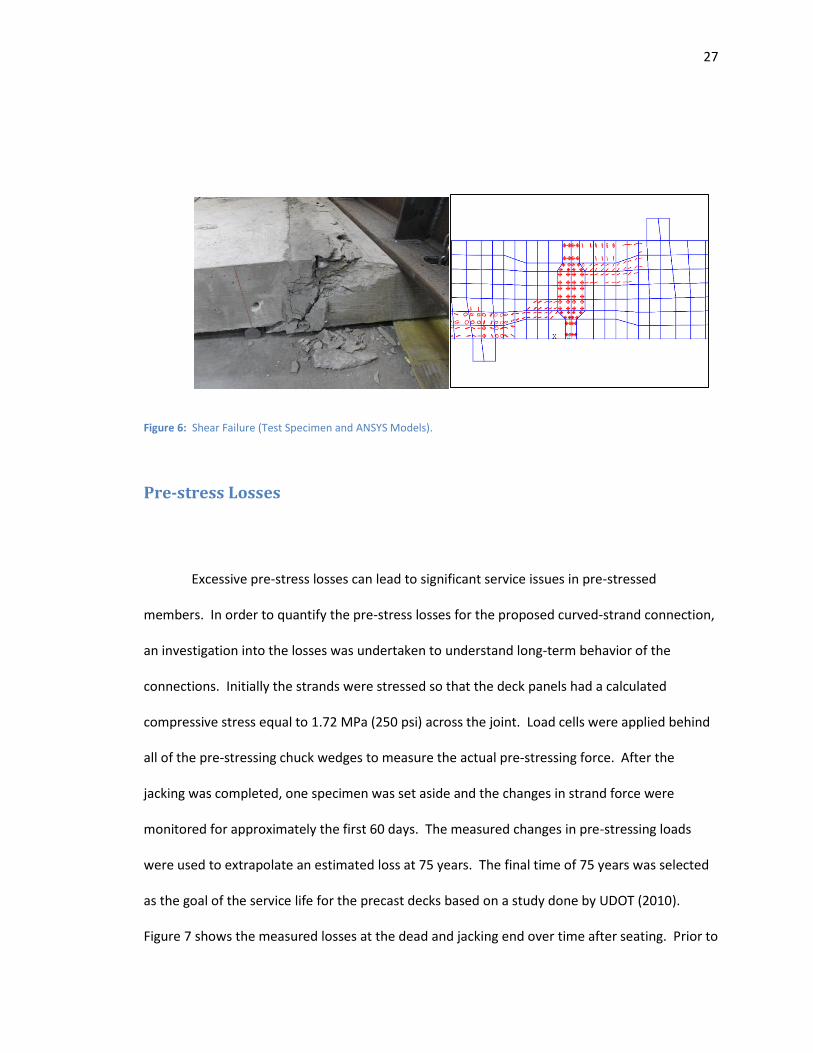
obtained after the maximum sustained load began to decrease. Figure 6 shows the cracking
that occurred along the joint at the conclusion of the shear test. The crack initiated at the right
side near the externally applied line load and propagated down the right hand edge of the joint
toward the middle of the joint. The crack crossed the joint at approximately 30 degrees. This
failure mode deviates from a typical 45 degrees shear crack but is presumably due to the cold
joint between the cast-in-place panel and the grout.
Figure 5: Load vs. Deflection Shear Specimen.
27
Figure 6: Shear Failure (Test Specimen and ANSYS Models).
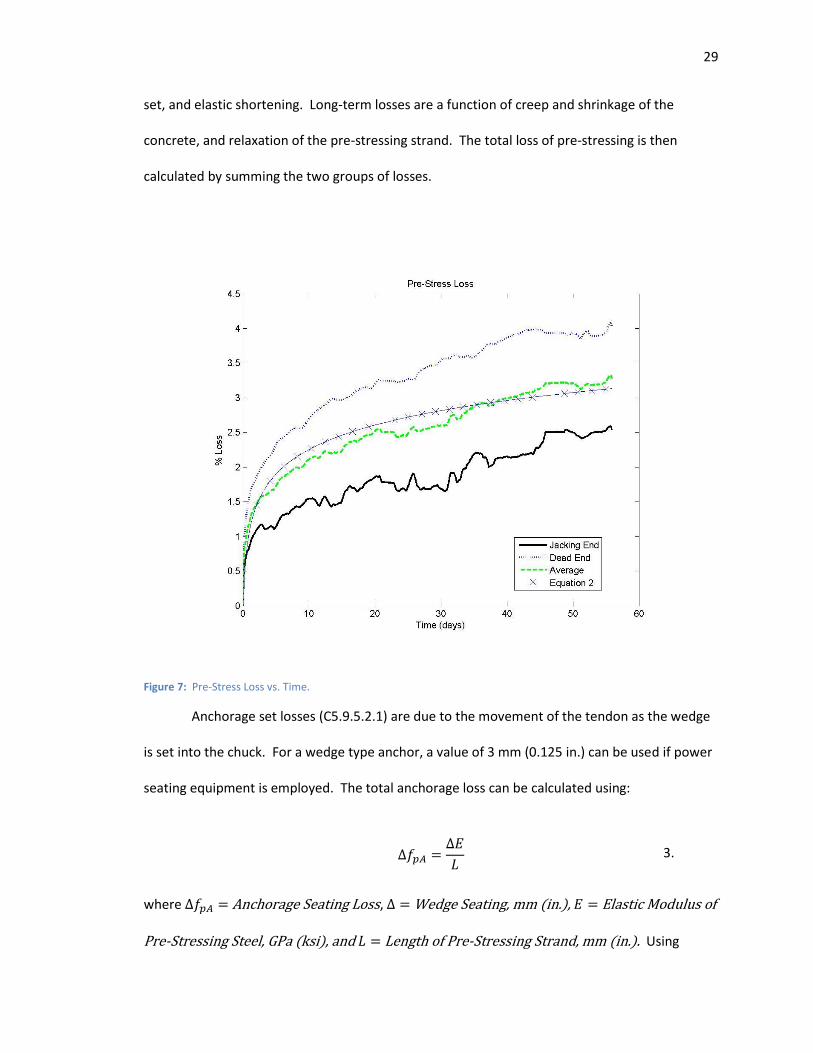
Pre-stress Losses
Excessive pre-stress losses can lead to significant service issues in pre-stressed
members. In order to quantify the pre-stress losses for the proposed curved-strand connection,
an investigation into the losses was undertaken to understand long-term behavior of the
connections. Initially the strands were stressed so that the deck panels had a calculated
compressive stress equal to 1.72 MPa (250 psi) across the joint. Load cells were applied behind
all of the pre-stressing chuck wedges to measure the actual pre-stressing force. After the
jacking was completed, one specimen was set aside and the changes in strand force were
monitored for approximately the first 60 days. The measured changes in pre-stressing loads
were used to extrapolate an estimated loss at 75 years. The final time of 75 years was selected
as the goal of the service life for the precast decks based on a study done by UDOT (2010).
Figure 7 shows the measured losses at the dead and jacking end over time after seating. Prior to

28
jacking, seating and elastic shortening losses were compensated for by overstressing the strand
by 20% based on measured losses from the initial panel. A regression curve analysis was on the
changes in strand stress performed and a natural log was fit to the average change in strand
force data and is presented as Equation 2. The equation was found to have a coefficient of
correlation of 0.97 in comparison to the average measured losses.
∆𝑓𝐿𝑇 = 0.5164 ∗ ln(𝑡) + 0.9933 2.
where t = Time in Days and ∆𝑓𝐿𝑇 = Percentage Loss. Using Equation 2 to predict the long-
term, pre-stress total losses resulted in a value of 6% at 75 years (27394 days). These long-term
losses are lower than the typical long-term losses for pre-stressed girders, but are presumably a
result of the relative low stress and reduced shrinkage loss from the delayed stressing of the
precast member. An estimate of the friction losses was obtained by subtracting the strand force
at the dead end of the strand from the strand force at the jacking end. Figure 7 shows that the
difference in force between the dead and jacking ends remains relatively constant over time.
The difference between the dead and the jacking end was found to be approximately 2%.
Because the joint is half of the distance between the jacking and dead ends, the friction loss at
the joint, assuming a linear friction loss, can be estimated to be half of the loss between the two
ends, or 1%.
Comparison with AASHTO LRFD Specifications
The measured strand losses were compared to those recommended in the AASHTO
LRFD Specifications (2010). In general, pre-stress losses can be broken into two different
categories, instantaneous and long-term. Instantaneous losses consist of friction, anchorage
29
set, and elastic shortening. Long-term losses are a function of creep and shrinkage of the
concrete, and relaxation of the pre-stressing strand. The total loss of pre-stressing is then
calculated by summing the two groups of losses.
Figure 7: Pre-Stress Loss vs. Time.
Anchorage set losses (C5.9.5.2.1) are due to the movement of the tendon as the wedge
is set into the chuck. For a wedge type anchor, a value of 3 mm (0.125 in.) can be used if power
seating equipment is employed. The total anchorage loss can be calculated using:
Δ𝑓𝑝𝐴 =
Δ𝐸
𝐿 3.
where Δ𝑓𝑝𝐴 = Anchorage Seating Loss, Δ = Wedge Seating, mm (in.), 𝐸 = Elastic Modulus of
Pre-Stressing Steel, GPa (ksi), and 𝐿 = Length of Pre-Stressing Strand, mm (in.). Using

30
Equation 3 a value of the anchorage loss ( Δ𝑓𝑝𝐴) of 335 MPa (48.6 ksi) was calculated. With an
initial pre-stressing stress of 1.19 GPa (173 ksi) this equates to a calculated anchorage loss of
28.1%.
Friction loss is the reduction in strand force caused by the friction between the post-
tensioning strand and the ducts. Equation 4 is provided in the AASHTO LRFD Specifications to
estimate this loss:
Δ𝑓pF = (1 − e−(Kx+μα))
4.
where 𝛥𝑓𝑝𝐹 = 𝐹𝑟𝑖𝑐𝑡𝑖𝑜𝑛 𝑙𝑜𝑠𝑠, 𝐾 = 𝑊𝑜𝑏𝑏𝑙𝑒 𝐹𝑟𝑖𝑐𝑡𝑖𝑜𝑛 𝐶𝑜𝑒𝑓𝑓𝑖𝑐𝑖𝑒𝑛𝑡, 𝑥 = Length of Pre-
Stressing Tendon from Jacking End to Point in Consideration (ft), μ = Coefficient of Friction,
and α = 𝑆𝑢𝑚 of Absolute Value of Angular Change in Pre-Stressing Steel Path.
Equation 4 resulted in a calculated loss of 5%, or 55.6 MPa (8 ksi). Comparing this calculated
value to the measured difference (2%) between the two strand ends (Figure 7), shows that the
AASHTO recommendation was conservative for this connection detail.
The third type of instantaneous loss that should be accounted for in design is loss due to
elastic shortening. This loss is caused by the panel shortening under the compressive load, thus
reducing the overall tendon length and therefore strand stress:
Δ𝑓𝑝𝐸𝑆 =
𝑁 − 1
2𝑁
𝐸𝑝
𝐸𝑐𝑖𝑓𝑐𝑔𝑝
5.
where Δ𝑓𝑝𝐸𝑆 = Elastic Shortening Loss, 𝑁 = Number of Identical Pre-Stressing Tendons,
𝐸𝑝 = Modulus of Elasticity of Pre-Stressing Tendon, GPa (ksi), 𝐸𝑐𝑖 = Modulus of Elasticity of
Concrete at Transfer, GPa, (ksi), and 𝑓𝑐𝑔𝑝 = Sum of Concrete Stresses at Center of Gravity of
Pre-Stressing Tendon due to Pre-Stressing Force After Jacking and Self-Weight of the

31
Member, MPa (ksi). Using the previously presented values for Ep and Eci, and the required joint
compressive stress of 1.73 MPa (0.25 ksi), the elastic shortening loss (Δ𝑓𝑝𝐸𝑆) is calculated to be
3.41 MPa (0.5 ksi), which is equal to 0.3% loss.
The total instantaneous losses were calculated to be the sum of the anchorage set
losses, friction losses, and elastic shortening losses, which was equal to 33.4%. The
experimentally measured instantaneous losses were 13%. Therefore the AASHTO LRFD
Specifications were found to be equal to 2.6 times the measured instantaneous losses. These
losses were accounted for by overstressing the specimens by 20% during jacking.
Time-dependant losses can be calculated according to the AASHTO LRFD Specifications
(2010) in two ways. A lump sum loss can be used to predict future loss, or a more refined
estimate of loss may be employed. The lump sum method was used in this research to compare
predicted creep, shrinkage, and relaxation losses with measured values. Using the lump sum
method resulted in an average calculated loss of 136 MPa (19.8 ksi), or 11.4%:
Δ𝑓pLT = 10fpiAps
Agγhγst + 12γhγst + ΔfpR 6.
where Δ𝑓pLT = Long Term Losses, fpi = Pre-Stressing Steel Stress Immediately Prior to
Transfer, Aps = Area of Pre-Stressing Steel, Ag = Gross Area of Concrete, γh = Correction
Factor for Relative Ambient Humidity, and γst = Correction Factor for Specified Concrete
Strength at Time of Pre-Stress.
By using the lump sum method, and summing the short term losses with the long-term
losses, a final loss is found to be 534 MPa (77.5 ksi), or 44.8%. However, the anchorage seating
losses can be ignored due to the overstressing of the strands during construction; therefore the
anchorage seating loss was zero. By removing the seating losses from the equation, a calculated

32
loss value of 196 MPa (28.4 ksi) was obtained. This is equal to 16.4% after 75 years, which is 2.7
times more than the measured values. It was therefore concluded that the procedures in the
AASHTO LRFD Specifications (2010) to calculate pre-stress losses are overly conservative when
applied to this connection detail.
Full-Scale Experimental Test Setup
Based on the positive results on the small-scale specimens, an investigation into the
curved-strands connection behavior for negative moment was also performed. In order to test
the connections in negative bending, a full-scale, test specimen was constructed. After casting
and subsequent curing, the full-scale, precast deck specimens were placed on wide flange steel
sections. The precast deck specimens were made continuous with the steel I-girders through
the use of welded shear studs. A negative moment region was created by fixing one end of the
specimen, placing a reaction beneath joint at midspan, and pushing down on the opposite end.
The specimen was instrumented to measure the applied load and deflections at various
locations.
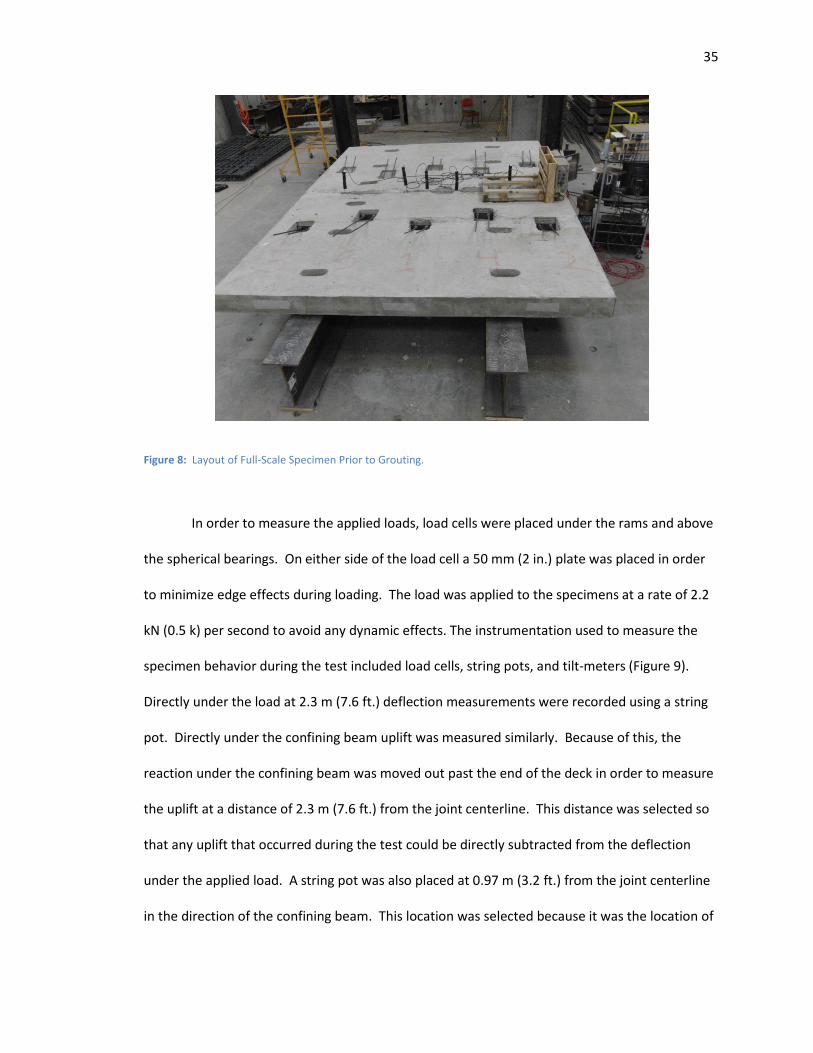
The concrete decks used for the full-scale testing were 3.66 m (12 ft.) wide by 2.44 m (8
ft.) long, with an overall depth of 222 mm (8.75 in.). Shear pockets were cast into the deck
panels in order to accommodate the shear studs. Each panel had three shear pockets per
girder, for a total of six in each deck panel. One pocket was placed at the center of the deck,
while the other two pockets were placed at 85 cm (33.5 in.) on either side of the center pocket.
The concrete used for the panels was the same as the small-scale specimens and had a specified
28-day strength of 27.6 MPa (4000 psi). The actual concrete compressive strength was

33
measured to be 34.7 MPa (5040 psi). The experimentally measured modulus of elasticity was
found to be 35.2 GPa (5100 ksi). The rebar layout was identical to the layout used in the small-
scale specimens (see Figure 1) and is typical of standard AASHTO deck reinforcement layouts.
The mild reinforcement had a specified yield strength of 410 MPa (60 ksi). The post-tensioning
strands that were used were the same strands used in the small-scale specimens. They were a
15.2 mm (0.6 in.) diameter, 1.86 GPa (270 ksi) seven wire strand. The connections alternated in
length from 1.2 m (48 in.) to 1.8 m (72 in.). Figure 8 shows the alternating strand layout along
the length of the deck.
The girders used for the full-scale specimen were W530x300 (W21x122). The girders
had a manufacturer specified yield strength of 340 MPa (50 ksi). The girder section size was
chosen in order to maintain the elastic and plastic neutral axes of the specimen below the
concrete deck throughout the load test. The location of the elastic neutral axis was determined
using the method of transformed sections, and summation of internal forces for the plastic
neutral axis. In order to mitigate lateral torsional buckling of the girders during testing,
stiffeners were welded onto the web of the girders. The stiffeners were made of A36 plate steel
with a specified yield strength of 250 MPa (36 ksi). They were 16 mm (0.625 in.) thick, 130 mm
(5 in.) wide, and 500 mm (19 ¾ in.) long. The stiffeners were placed at the point of loading as
well as at the two reaction points.
The girders were placed at 1.8 m (6 ft.) on center. After the concrete reached its 28 day
design compressive strength, the panels were placed onto the girders. The joint was then
grouted with Masterflow 928 grout. After the grout cured, the pre-stressing strands were
placed in the ducts and stressed. The 1.8 m (72 in.) strands were jacked beginning in the middle
of the deck and subsequently the outside strands. Finally, the two 1.2 m (48 in.) strands were

34
stressed. Stressing in this order was done in order to create an even distribution of pressure
over the entire joint surface. After the strand stressing, shear studs were welded onto the
girders in the panel shear pockets. The shear studs that were used were 150 mm (6 in.) long
with a 22 mm (7/8 in.) diameter. Each shear pocket had three shear studs placed in them. The
pockets and the haunch were then grouted.
The full-scale specimen was designed to be tested in negative bending. Figure 9 shows
the various dimensions of the test set-up used to induce the negative moment across the joint.
The specimen was supported as a beam with an overhang which puts the entire deck in a
negative moment region, with the maximum moment occurring at the joint. The load was
applied to the overhanging end of the deck at a distance of 2.3 m (7.6 ft.) from the center of the
joint. The load was applied using two hydraulic rams, one ram being centered over each girder
line.
One support was placed at the center of the joint, while the other support was placed at
the edge of the concrete deck opposite of the applied load. In order to restrain against uplift at
this support, a restraining beam was placed over the decks and then bolted through the strong
floor. The restraining beam was placed at 2.3 m (7.6 ft.) from the center of the joint. In order to
reduce the bearing stresses on the deck, a 300 mm (12 in.) wide plate was placed on the decks
beneath the loads. Spherical bearings were used to keep the load vertical applied to the
specimen during testing.
35
Figure 8: Layout of Full-Scale Specimen Prior to Grouting.
In order to measure the applied loads, load cells were placed under the rams and above
the spherical bearings. On either side of the load cell a 50 mm (2 in.) plate was placed in order
to minimize edge effects during loading. The load was applied to the specimens at a rate of 2.2
kN (0.5 k) per second to avoid any dynamic effects. The instrumentation used to measure the
specimen behavior during the test included load cells, string pots, and tilt-meters (Figure 9).
Directly under the load at 2.3 m (7.6 ft.) deflection measurements were recorded using a string
pot. Directly under the confining beam uplift was measured similarly. Because of this, the
reaction under the confining beam was moved out past the end of the deck in order to measure
the uplift at a distance of 2.3 m (7.6 ft.) from the joint centerline. This distance was selected so
that any uplift that occurred during the test could be directly subtracted from the deflection
under the applied load. A string pot was also placed at 0.97 m (3.2 ft.) from the joint centerline
in the direction of the confining beam. This location was selected because it was the location of

36
maximum positive deflection between the supports. A tilt-meter was placed on each girder at
the joint centerline. The tilt-meter was placed at the middle reaction to measure the maximum
rotation at the joint, and develop an experimental moment curvature diagram. Three strain
gages were placed on the web of the girders at 100 mm (4 in.) from the middle stiffener. The
strain gages were placed at 110 mm (4.3 in.), 270 mm (10.7 in.), and 450 mm (17.7 in.) from the
bottom of the bottom flange in order to monitor the location of the neutral axis during testing.
Full-Scale Experimental Results
The full-scale specimen was instrumented in order to monitor the external and reaction
loads during testing. Instruments were also applied to measure deflection along the length of
the specimen and strains at various locations throughout the precast concrete deck. The data
measured during testing quantified the behavior of the specimen prior to failure. From the
recorded behavior during testing, the capacity of the system was obtained (Appendix B).

37
Figure 9: Full-Scale Testing Setup.
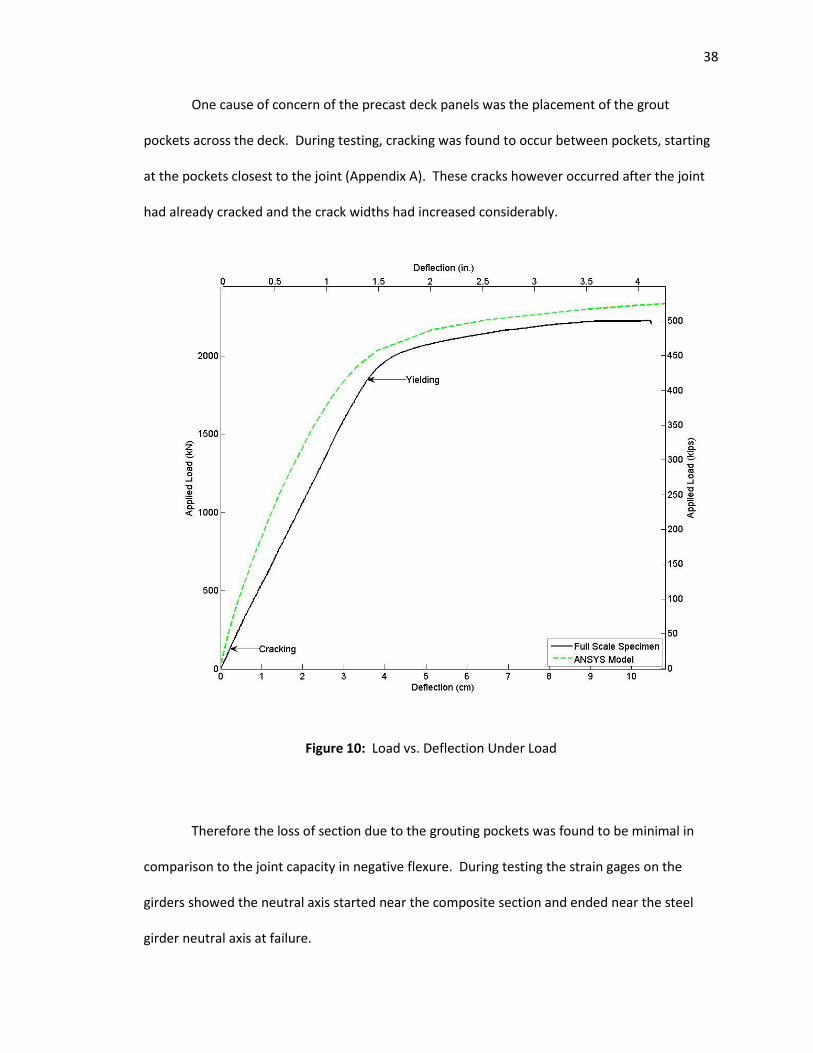
Figure 10 shows the relationship between the externally applied load and the
corresponding deflection that was measured during the test. The deflection that is presented in
Figure 10 was the measured deflection directly under the applied loads. Two string pots were
used to measure the deflection at this location, and the resulting values were then averaged.
The external load was applied using two 2220 kN (500 k) hydraulic rams, with each ram
positioned directly over an individual girder. The individual recorded applied loads were then
combined to obtain the total applied load. Figure 10 shows that the precast concrete deck of
the specimen was observed to crack at an externally applied load of 150 kN (34 k) which is equal
to an applied moment of 350 kN-m (260 k-ft.). This cracking is indicated by the slight change in
the slope of the load versus deflection plot. The stiffness of the system changes only slightly
after cracking occurs. This is due to the concrete adding little stiffness to the overall system.
After deck cracking occurred, the system continued to behave elastically as the steel girders
were loaded in the elastic range. The steel girder continued to resist the external load elastically
until it began to yield at an externally applied load of 1890 kN (425 k) which is equal to an
applied load of 4340 kN-m (3200 k-ft.).
The system reached its ultimate capacity at an externally applied load of 2200 kN (500
k), which is equal to an applied moment of 5150 kN-m (3800 k-ft.), where the specimen
experienced increasing deflections with no increase in external load. Previous research (Roberts
2011) showed that the ultimate capacity of a full-scale standard post-tensioned deck had an
ultimate capacity of 2290 kN (515 k). Thus, the proposed curved-strand connection behaved
comparably to a standard post-tensioning system.
38
One cause of concern of the precast deck panels was the placement of the grout
pockets across the deck. During testing, cracking was found to occur between pockets, starting
at the pockets closest to the joint (Appendix A). These cracks however occurred after the joint
had already cracked and the crack widths had increased considerably.
Figure 10: Load vs. Deflection Under Load
Therefore the loss of section due to the grouting pockets was found to be minimal in
comparison to the joint capacity in negative flexure. During testing the strain gages on the
girders showed the neutral axis started near the composite section and ended near the steel
girder neutral axis at failure.

39
Figure 11 shows the joint condition at the failure load. The joint was observed to crack
as the cracking capacity was exceeded. The shear key was observed to separate from the
precast deck panel on the restrained side of the test specimen. The concrete deck was not
observed to crack near the joint. The joint opening was measured to be 6.5 mm (0.26 in.) as the
steel section began to yield. When the ultimate capacity was initially reached the crack was
measured to be 17.5 mm (0.69 in.). At failure the steel girders showed some initial signs of web
buckling and flange yielding over the support.
Full-Scale Comparison to AASHTO LRFD Specifications
The AASHTO LRFD Specifications (2010) were used to calculate load levels that
theoretically would induce specific specimen behavior. Three different loading magnitudes
were of interest in the study, cracking, steel yielding, and the ultimate capacity. After testing
the calculated specimen behavior was compared to the experimentally measured values. This
comparison was then used to determine the accuracy of the code methodologies in predicting
the observed behavior.
In order to calculate the cracking and yield loads of the specimens the transformed
section properties were calculated. A uniform compressive stress of 1.72 MPa (0.25 ksi) due to
the pre-stressing strand was applied across the joint width. Using these values and Euler-
Bernoulli beam theory, the cracking moment was then obtained. The cracking moment was
found to be 470 kN-m (350 k-ft.), which is equal to an externally applied load of 200 kN (45.9 k)
for the testing configuration.

40
Figure 11: Full-Scale Joint (Physical and FEM Model).
The observed cracking moment was 25% less than the calculated value. This may be attributed
to the cold joint not being monolithic concrete across the joint.
After the section cracks, the resisting force was transferred to the pre-stressing steel
and the steel girders. The moment of inertia of the system was also reduced with the loss of the
concrete section. Yielding in the steel flanges and in the pre-stressing steel was checked, and
the yield moment in the bottom flange was found to control. The yield moment for the cracked
section was found to be 3860 kN-m (2850 k-ft.), which corresponds to an applied load equal to
1680 kN (377 k). The calculated yield value was found to be 11% less than the measured value.
The ultimate capacity of the system was also obtained using the procedure set forth in
the AASHTO LRFD Specifications (2010). The recommended method has three steps; the first is
to identify the region on the beam where the plastic neutral axis is located, after which the
exact location is calculated. Finally the moment capacity is calculated by summing moments
about the neutral axis. Using this method the ultimate capacity of the system was found to be
4950 kN-m (3650 k-ft.). This ultimate moment is equal to an applied load of 2150 kN (483 k). As

41
a result the specifications predict an ultimate capacity that was 4% less than the measured
ultimate capacity.
Finite-Element Model Analysis
Finite-element models were created for the small and large-scale specimens using
ANSYS. ANSYS was selected because of its ability to model cracking and crushing of a brittle
material (concrete), as well as elasto-plastic behavior of a ductile material (steel girder and pre-
stressing strand). The finite-element models had the same geometry as the physical specimens,
and the material properties applied in ANSYS were selected to match the measured material
properties. The elements used in the model were chosen to replicate the behavior that was
observed during testing. After the models were created and their attributes assigned, it was
then meshed. After meshing, a solution routine was performed which defined the boundary
conditions and the applied loads. From the results of the finite-element model analyses, a
comparison was performed with the measured data recorded during the specimen testing.
The concrete and grout for the small-scale models were modeled using SOLID65
elements. The SOLID65 element was selected because of its cracking and crushing
characteristics. The concrete properties were assigned to have a compressive strength equal to
the measured values and a rupture strength equal to 3.86 MPa (0.56 ksi). The shear transfer for
a closed crack was set at 30% and the shear transfer for the open crack was set at 15%.
Reinforcement in the concrete was modeled using a smeared reinforcement ratio of 0.0119 in
the longitudinal direction, and 0.021 in the transverse to replicate actual values. The grout was
assigned a specified compressive strength and a rupture strength equal to 2.82 MPa (0.41 ksi).
42
The concrete and grout volumes were modeled separately and connected using contact and
target elements. Contact and target elements work together to connect two solids at a single
node. TARGE170 was assigned to the grout, while CONTA173 was applied to the concrete. A
fkn value of 0.01 was applied. This value is a factor indicating the amount of normal stress that
is transferred between the elements. The pre-stressing strand was modeled using LINK8
elements. The LINK8 element has two nodes, one on either end of the element. The element is
only capable of transferring load in an axial direction. Material properties of these elements
were assigned based on specified values from the manufacturer. The elements were assigned a
cross-sectional area of 140 mm2 (0.215 in2). The initial pre-stressing load was induced by
applying an initial strain in the LINK8 elements.
The full-scale negative flexure specimen was modeled using the same values for the
concrete and grout. In addition, the pre-stressing strand was modeled similarly. The girders
were modeled using SOLID45 elements. SOLID45 elements were selected because of their
ability to exhibit elastic and plastic behavior of a ductile material. The stress-strain relationship
was defined using a bi-linear isotropic curve. An initial elastic modulus equal to 200 GPa (29,000
ksi) was applied, until yielding occurred at 50 ksi. The connection between the steel I-girders
and the precast concrete deck was enforced using TARGE170 and CONTA173. The shear studs
were modeled using COMBIN39 elements, which is a two node spring with a user defined load
versus deflection relationship. A fkn value of 0.0015 was used for the normal stress transfer,
and 0.05 was used for the fkt value. The fkt value is a measure of the amount of sliding stress
that is transferred between the CONTA173 and TARGE170 elements.
After the models were created and material properties assigned, the individual
elements were meshed and boundary conditions were applied. The elements in the models

43
were meshed to have an approximate size of 50 mm (2 in.). Loads were applied by using the
ultimate loads measured during the physical testing, and the analysis was performed with a
total time of 100 to avoid any dynamic effect. The target loads were 245 kN (55 k) for the small
flexure panels, 890 kN (200 k) for the shear panel, and 2450 kN (550 k) for the full-scale model.
Figure 3 shows the externally applied moment and the corresponding deflection curve
from the finite-element model along with the experimental results from the small-scale flexural
testing. The figure shows that a good correlation between the physical model and the ANSYS
model existed. Cracking is observed to occur on the curved strand finite-element model at
approximately 30 kN-m (22.1 k-ft.). The ANSYS model cracked within 9.5 % of the cracking value
as the physical models. The ANSYS model accurately predicts the stiffness of the post crack
behavior through the ultimate capacity. The ultimate capacity of the curved strand ANSYS
model was 46.1 kN-m (34.0 k-ft.) which is within 9.8% of the value measured during the
experimental testing. The straight post-tensioned model was modeled similarly to the curved
strand model. It was found to have a cracking capacity of approximately 28.0 kN-m (20.6 k-ft.).
The ANSYS model cracked within 25% of the cracking value of the physical models. The ultimate
capacity of the straight post-tensioned ANSYS model was found to be approximately 28.8 kN-m
(21.3 k-ft.). The ultimate capacity of the straight post-tensioned ANSYS model was within 3% of
the measured value from the physical models.
Figure 5 presents the external force and corresponding displacement computed by
ANSYS for the shear panel. Overall, the ANSYS model behaved in a similar manner as the tested
specimen. The ANSYS model predicted a cracking load of 623 kN (140 k), which is within 1.2% of
the cracking load measured during the experimental testing. After cracking occurred the ANSYS
model did not support any additional load as it continued to deflect. As a result, the ANSYS

44
cracking load also corresponds to the ultimate capacity which was also the general behavior of
the experimental test specimen. The ANSYS model accurately predicted the cracking pattern
that occurred in the experimental test as can be seen in Figure 6. The model shows cracking
occurring from the loading point and moving towards the joint. Horizontal cracking was
predicted under the load moving away from the joint. This was also observed in the actual
testing of the specimens.
Figure 10 presents the load versus deflection results for the finite-element model for the
full-scale specimen. The initial stiffness of the model is 16% greater than the stiffness of the test
specimen. This increased stiffness is attributed to the SOLID elements deforming rather than
bending, in an occurrence commonly known as locking. The ANSYS model predicted a yield
capacity of 1870 kN (420 k), which is 99% of the yield capacity that was measured. The ANSYS
model has an ultimate capacity of approximately 2300 kN (520 k). This was 4.5% larger than the
measured value. The full-scale finite-element model predicted the behavior and capacities that
were measured in the field to an acceptable degree of accuracy. Figure 11 shows the modeled
joint at the ultimate capacity of the system. The joint is seen to be in tension as the ultimate
capacity is reached. This corresponds to the joint opening observed during testing. The model
also showed the initial stages of web buckling which was also observed on the test specimen.

45
CHAPTER IV
CONCLUSIONS
The need for efficient bridge replacement techniques has led to innovative solutions to
reduce bridge construction time. One of those replacement techniques that has been
successfully used is the implementation of precast concrete deck panels. Despite the many
benefits of precast concrete deck panels, long-term service can be an issue due to the inherent
joints. These joints have been found to leak unless post-tensioning is used to effectively seal the
joints. However, standard post-tensioning used to seal the joints typically inhibits the rapid
replacement of a single deck panel. The proposed curve strand connection investigated in this
research works to mitigate the time delay in the replacement of a single precast concrete deck
panel, while retaining post-tensioning benefits of sealing the joint against leakage. The
proposed curved-strand connection was tested using small-scale specimens in flexure and shear
in addition to full-scale testing in negative bending. The behavior of the proposed curved-strand
connection was then compared to the performance of other connection types and the capacity
in accordance to the AASTHO LRFD Specifications. The proposed curved-strand connection was
found to behave comparable in strength to the standard post-tension connections. Pre-stress
losses were also measured and compared to the predicted values. The proposed curved-strand
connection was found to exhibit an acceptable level of pre-stress losses. The following
conclusions were based on the data gathered during testing:
1. The ultimate capacity of the proposed curved stand connection was found to be
approximately equal to the standard post-tensioning. The curved-strand connection
had an ultimate capacity of 42 kN-m (31.0 k-ft.), with a cracking capacity of

46
approximately 25.9 kN-m (19.1 k-ft.) which corresponds to approximately 116% and
100% of the respective values for the standard post-tensioned connection.
2. Pre-stress losses were measured by monitoring strand force on a panel connection
over time. During the pre-stressing of the member, anchorage and friction losses
were measured via load cells. After jacking, changes in strand forces were
monitored for a period of approximately 60 days. Using the measured changes in
the strand force, the amount of pre-stress loss was calculated. A regression curve
analysis was performed and the results were used to predict the long-term loss of
the proposed curved-strand connection. These long-term losses were predicted to
be approximately 6% at 75 years. These measured losses were found to be less than
the predicted values from the AASHTO LRFD Specifications.
3. A beam shear test was performed across a 3.7 m (12 ft.) section of joint via a line
load. The test specimen was found to have a cracking capacity of 191.4 kN/m (13.1
k/ft.). At cracking the system reached its full shear capacity. After cracking
occurred the resistance to shear was greatly reduced, and the pre-stressing steel
resisted the shearing force via dowel action. The test specimen was found to have
an ultimate capacity of 172.2 kN-m (11.8 k/ft.).
4. A full-scale, composite section was constructed to observe the behavior of the
proposed curved-strand connection subjected to negative bending moments. The
test involved placing precast concrete deck panels on steel I-girders. The curved-
strand connection was found to have an ultimate capacity of 2200 kN (500 k). This
value was 3.5% larger than the calculated value obtained using the AASHTO LRFD
Specifications.

47
5. Finite-element models were developed using ANSYS for the small-scale and full-
scale test specimens. The models were developed using elements that most closely
reflected the measured material properties. The ANSYS models accurately
predicted the behavior that was measured during testing. The ANSYS model
predicted the ultimate capacity of the small-scale flexure specimen to be 46.1 kN-m
(34 k-ft), which is equal to 109% of the measured value. The shear model accurately
predicted the cracking patterns observed around the joint during shear testing. The
ANSYS shear model had an ultimate capacity of 623 kN (140 k) which was 98% of the
measured capacity of the shear system.
48
REFERENCES
American Association of State Highway and Transportation Officials (AASHTO). (2010).
“AASHTO LRFD bridge design manual.” Washington, DC.
American Society of Civil Engineers (ASCE). (2009). “2009 Report Card for America’s
Infrastructure.” Washington, DC.
Badie, S.S. and Tadros, M.K. (2008). “Full-depth precast concrete bridge deck systems.”
National Research Program Report 584., Transportation Research Board., Washington,
D.C.
Hewes, J. and Priestley, M.J. (2002). “Seismic design and performance of precast concrete
segmental bridge columns.” Report SSRP-2001/25. Univ. of California at San Diego, La
Jolla, CA.
Holombo, J., Priestly, N., and Seible, F. (1998). “Longitudinal seismic response of precst spliced
girder bridges.” Report No. SSRP-98/05, Univ. of California at San Diego, La Jolla, CA.
Issa, M.A., Yousif, A.A., Issa, M.A., Kaspar, I.I., amd Khayyat, S.Y. (1995). “Field performance of
full depth precast concrete panels in bridge deck reconstruction.” PCI., 40(3), 82-108.
Joen, P.H. and Park, R. (1990). “Simulated seismic load tests on precast concrete piles and pile-
pile cap connections.” PCI., 35(6), 42-61.
Kim, Y. and Park, J. (2002). “Shear strength of grout type transverse joint.” KCI Concrete., 14(1),
8-14.
LeBlanc, N.D. (2006). “Design and construction of a full-width, full-depth precast concrete deck
slab on steel girder bridge.” 7th International Conference on Short and Medium Span
Bridges, Canadian Society for Civil Engineering., Montreal, QC.
MacRae, G.A. and Priestley, M.J. (1994). “Precast post-tensioned ungrouted concrete beam-
column subassemblage tests.” Report No. SSRP 94/10. Univ. of California at San Diego,
La Jolla, CA.
Matsumoto, E.E. and Ma, J. (2005). “Precast concrete bridge systems and details for seismic
regions.” 2005 Transportation Research Board Conference Proceedings, TRB, National
Research Council., Washington, DC.
Matsumoto, E.E., Waggoner, M.C., Sumen, G., Kreger, M.E., Wood, S.L., and Breen, J.E. (2001).
“Development of a Precast Bent Cap System.” Research Report 1748-2, The Univ. of
Texas at Austin., Austin, TX.
McCormack, J.C. and Nelson, J.K. (2006). “Design of reinforced concrete ACI 318-05 code
edition, 7th edition.” John Wiley & Sons Inc., Hoboken, NJ.

49
Porter, S., Julander, J.L., Halling, M.W., Barr, P.J., and Boyle, H. (2010). “Laboratory testing and
finite-element modeling of precast bridge deck panel transverse connections.” Report
No. UT-10.14, Utah State Univ., Logan, UT.
Roberts, K.S. (2011). “Performance of transverse post-tensioned joints subjected to negative
bending and shear stresses on full scale, full-depth, precast concrete bridge deck
systems.” M.S. thesis, Utah State Univ., Logan, UT.
Swenty, M. K. (2009). “The investigation of transverse joints and grouts on full depth concrete
bridge deck panels.” Ph.D. dissertation, Virginia Polytechnic Institute and State Univ.,
Blacksburg, VA.
Utah Department of Transportation (UDOT). (2010). “Performance of accelerated bridge
construction projects in Utah as of June 2010.” Utah Department of Transportation.,
Salt Lake City, UT.
Xiao, Y. (2003). “Experimental studies on precast prestressed concrete pile to CIP concrete pile-
cap connections.” PCI ., 48(6), 82-91.

50
APPENDICES

51
APPENDIX A. Test Setup and Specimen Construction
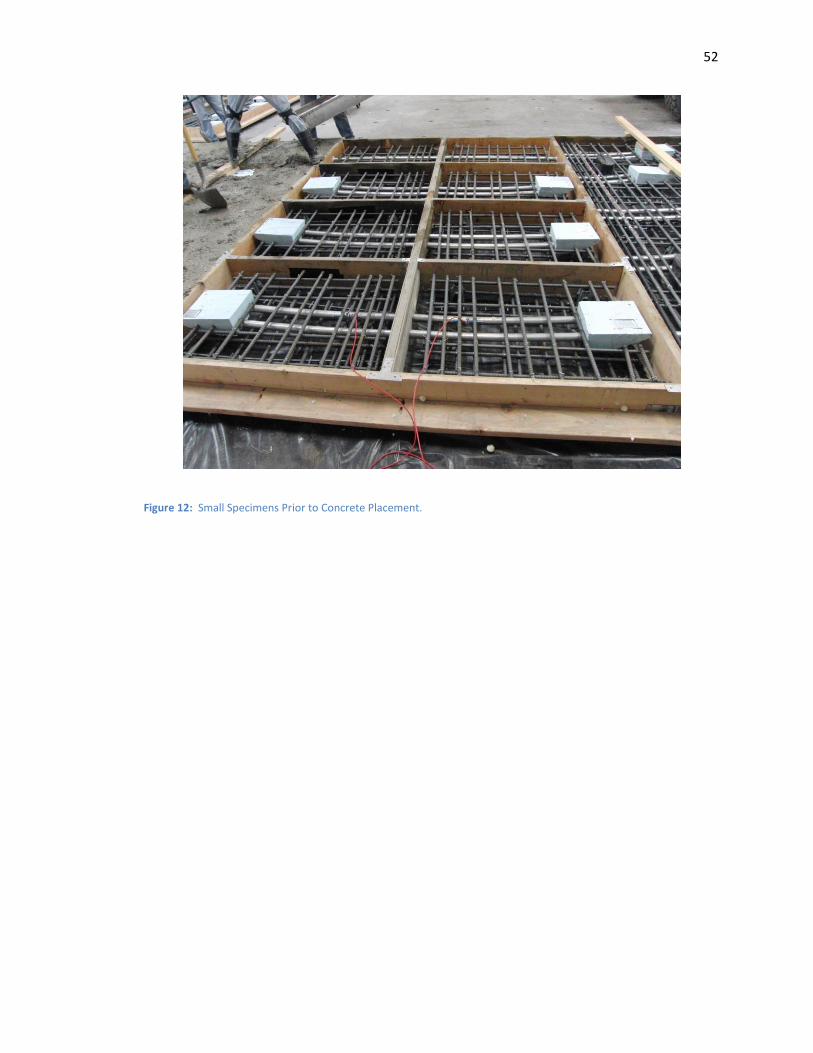
52
Figure 12: Small Specimens Prior to Concrete Placement.
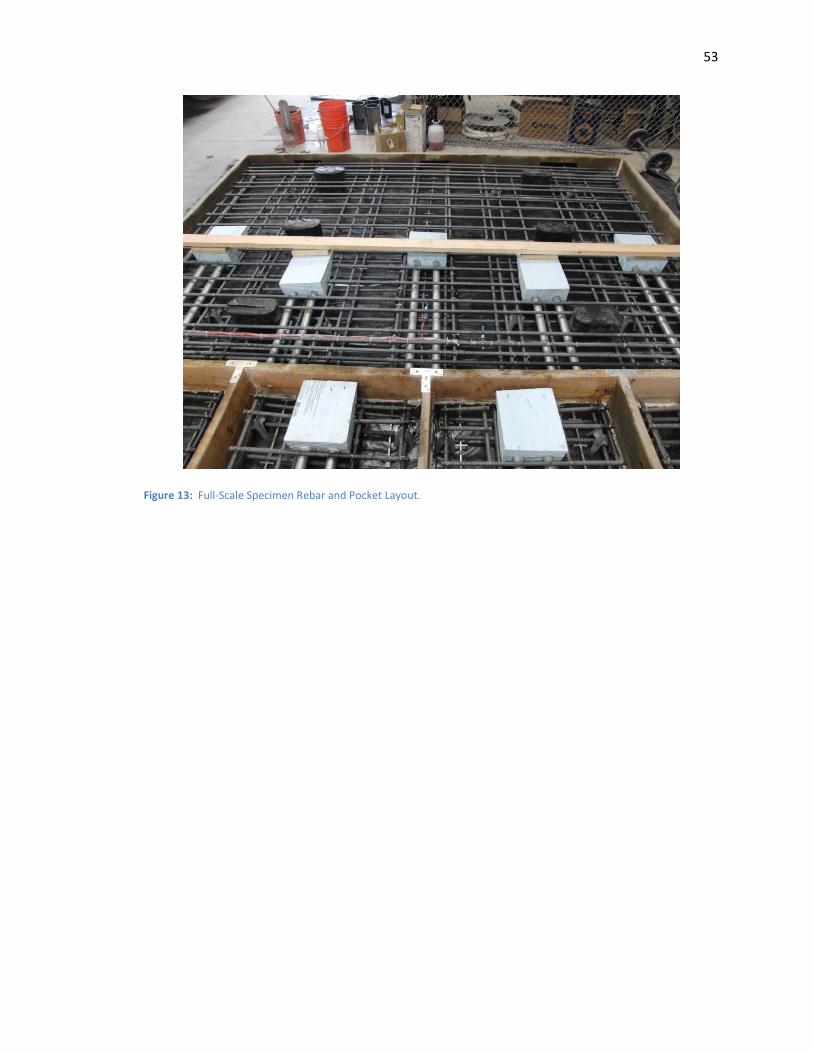
53
Figure 13: Full-Scale Specimen Rebar and Pocket Layout.
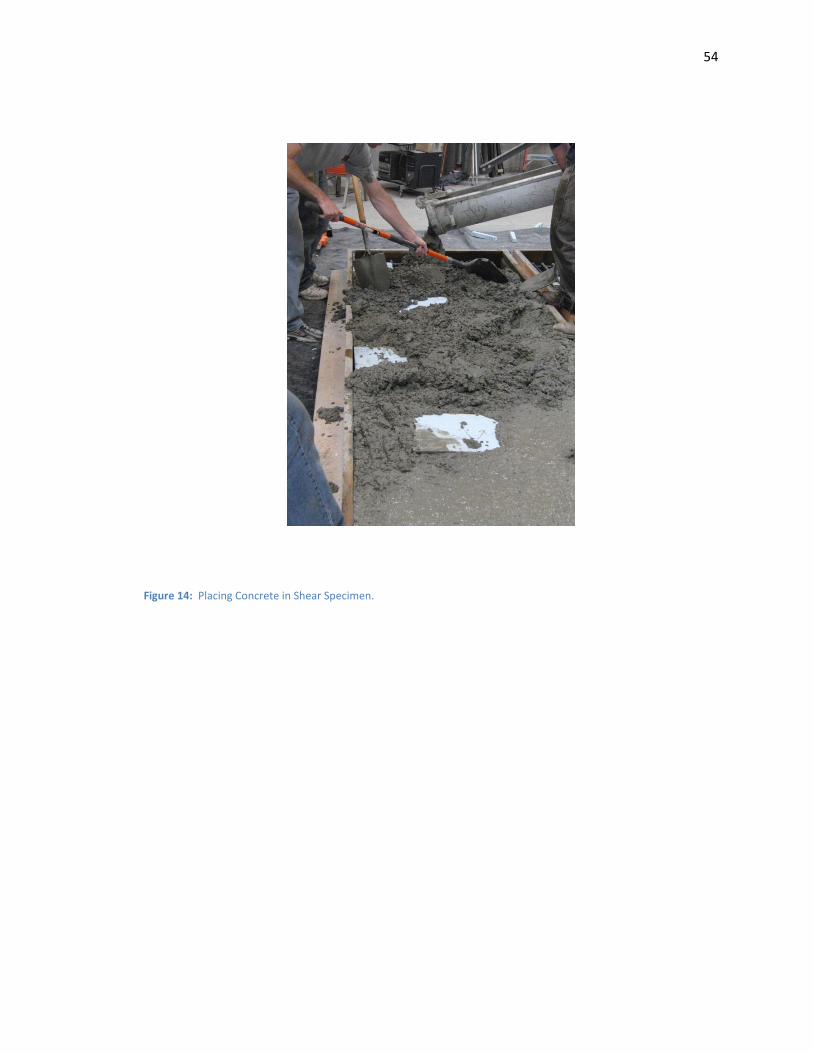
54
Figure 14: Placing Concrete in Shear Specimen.
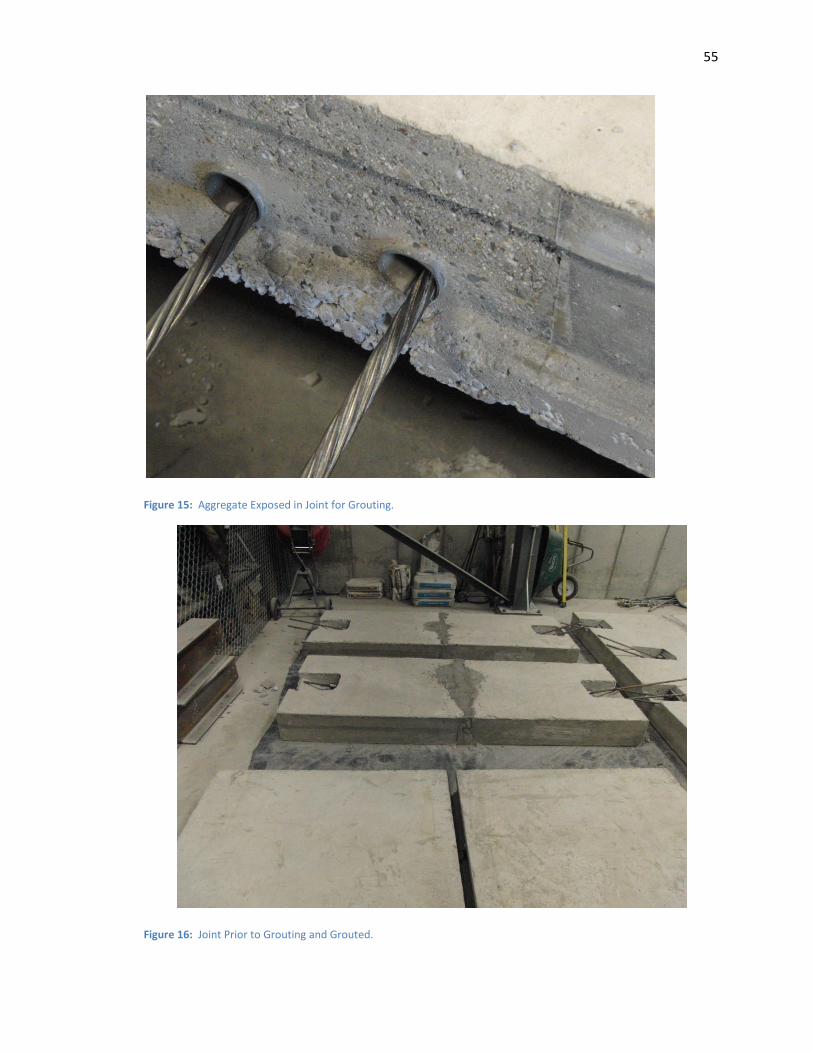
55
Figure 15: Aggregate Exposed in Joint for Grouting.
Figure 16: Joint Prior to Grouting and Grouted.
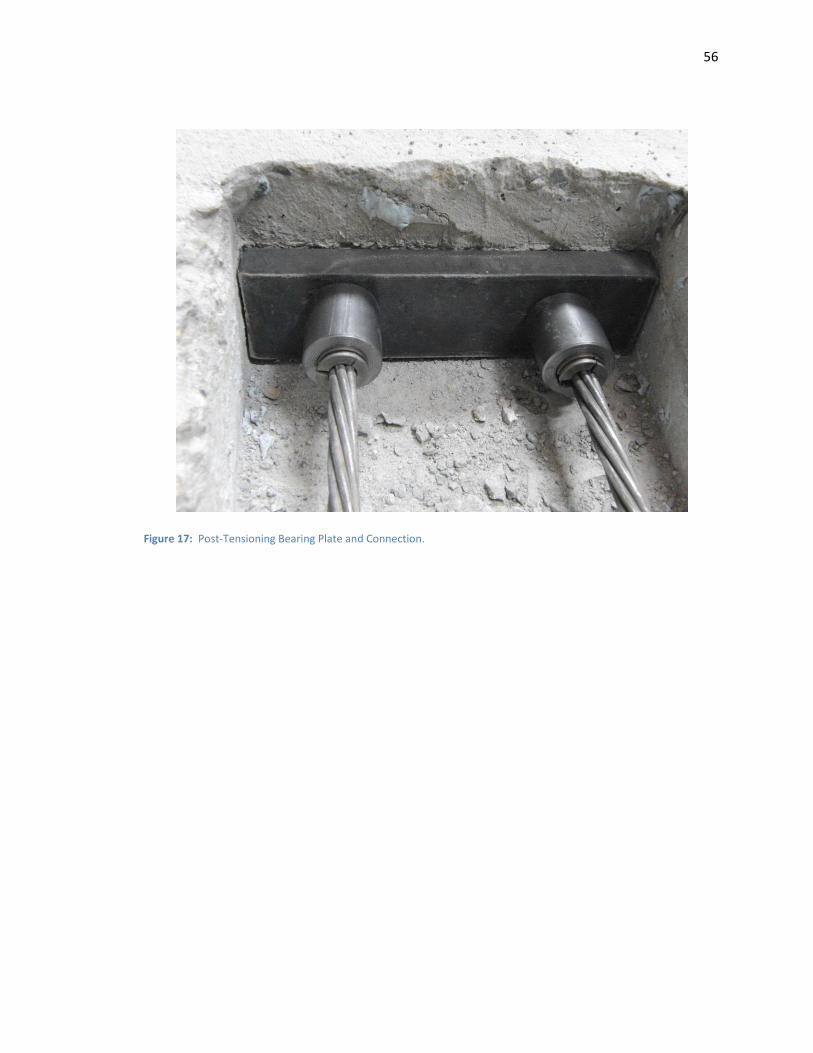
56
Figure 17: Post-Tensioning Bearing Plate and Connection.
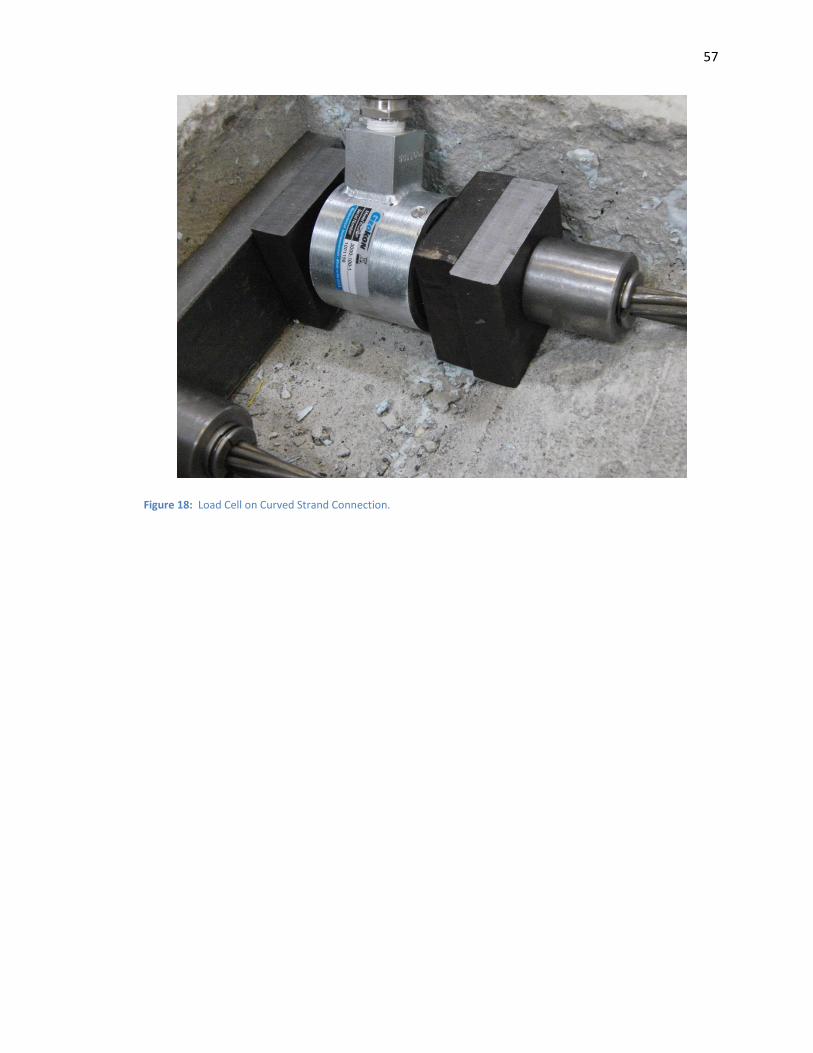
57
Figure 18: Load Cell on Curved Strand Connection.
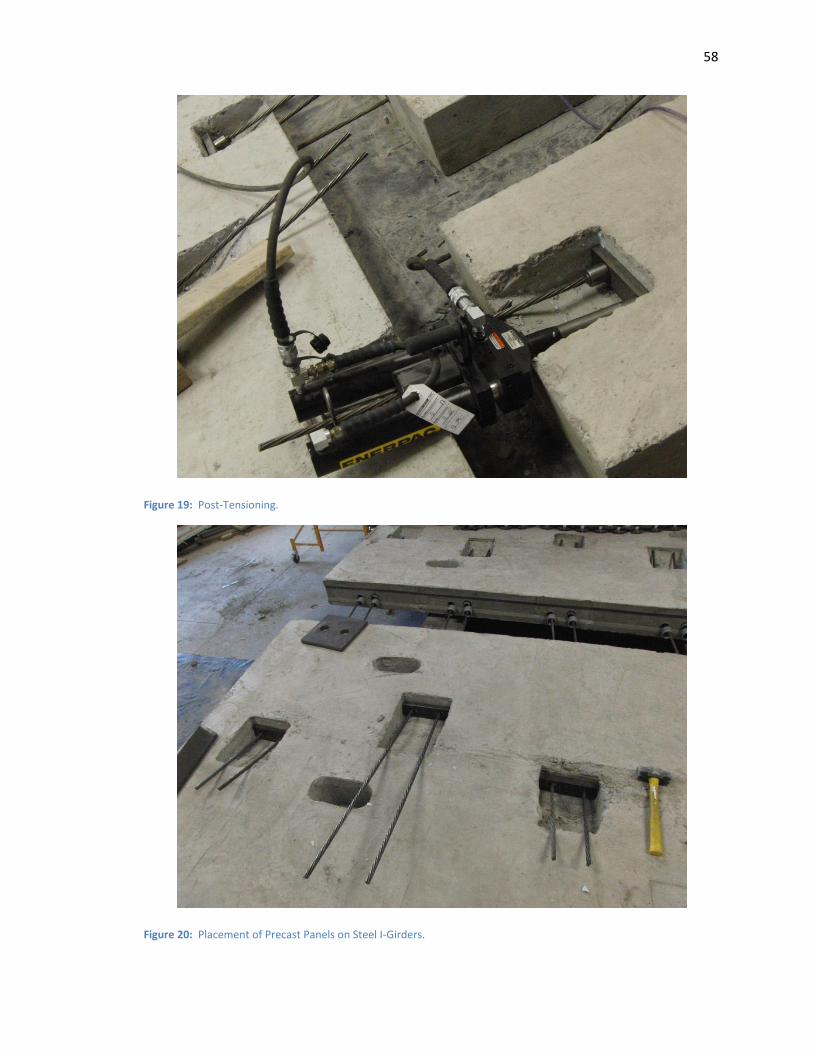
58
Figure 19: Post-Tensioning.
Figure 20: Placement of Precast Panels on Steel I-Girders.
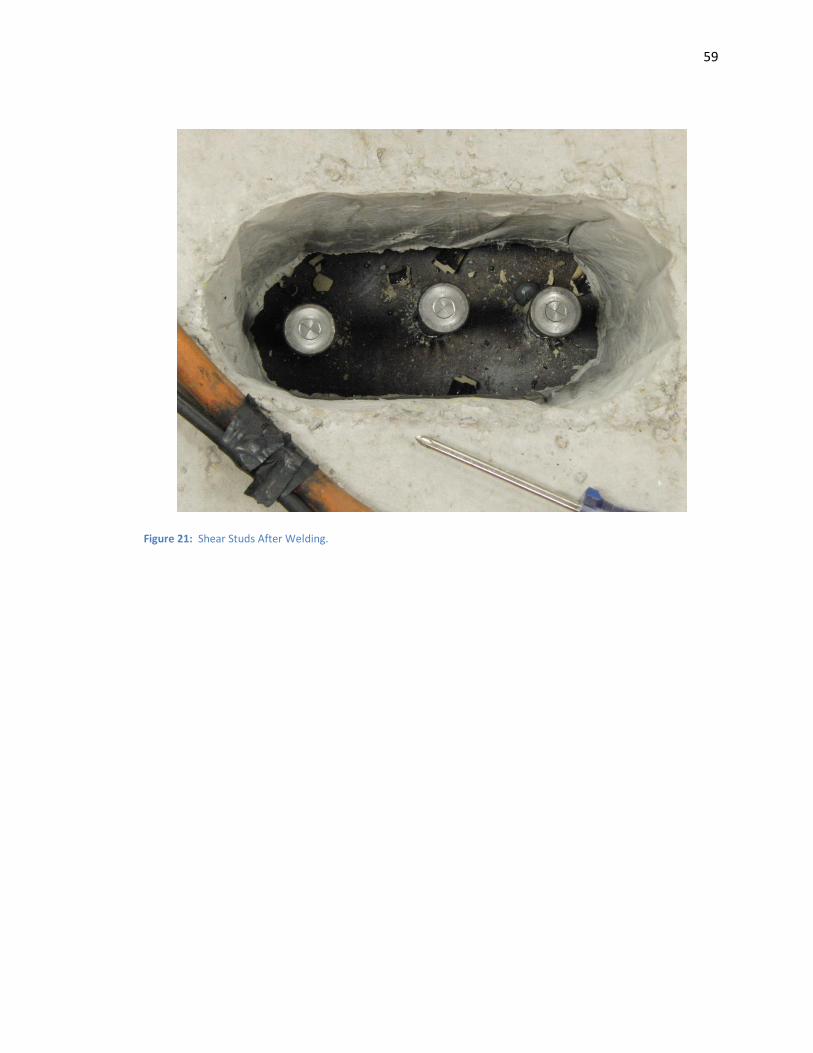
59
Figure 21: Shear Studs After Welding.
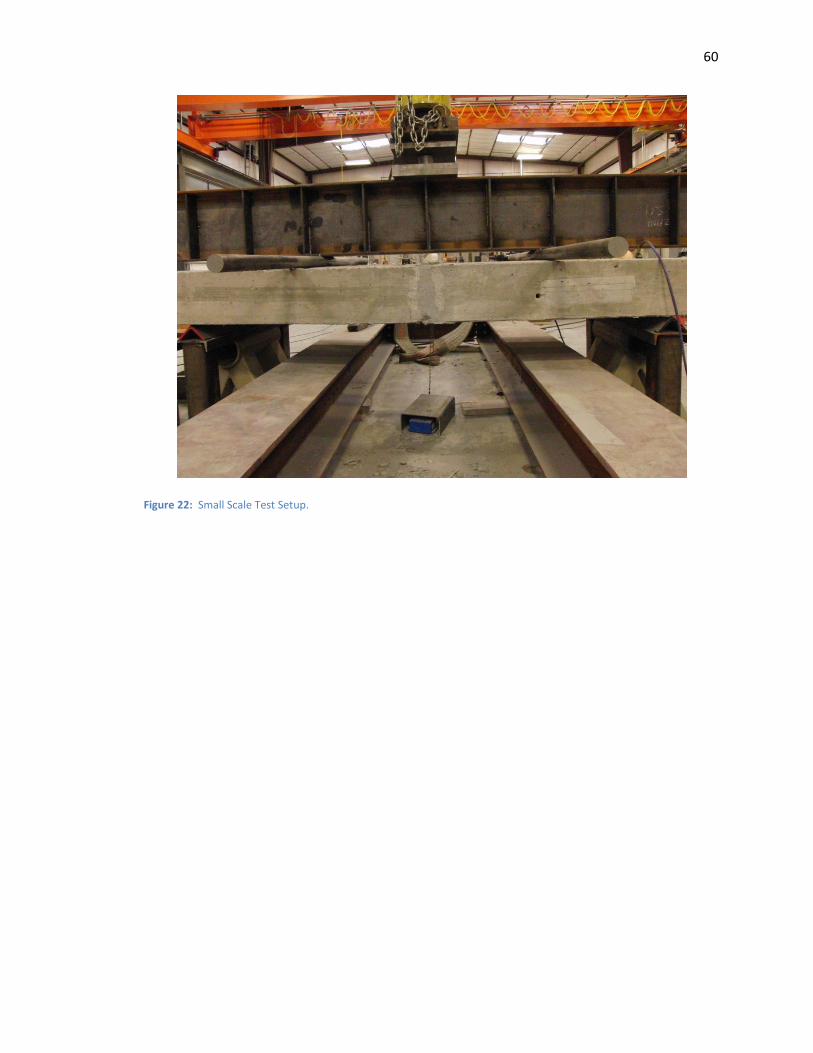
60
Figure 22: Small Scale Test Setup.
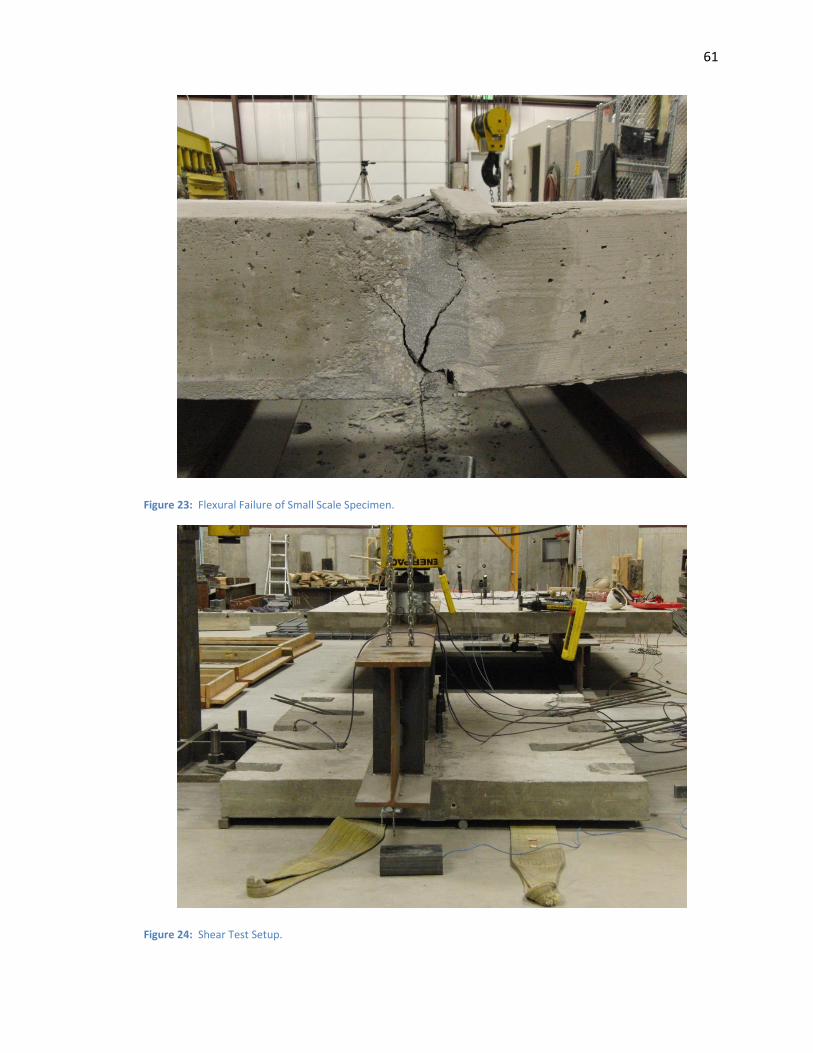
61
Figure 23: Flexural Failure of Small Scale Specimen.
Figure 24: Shear Test Setup.
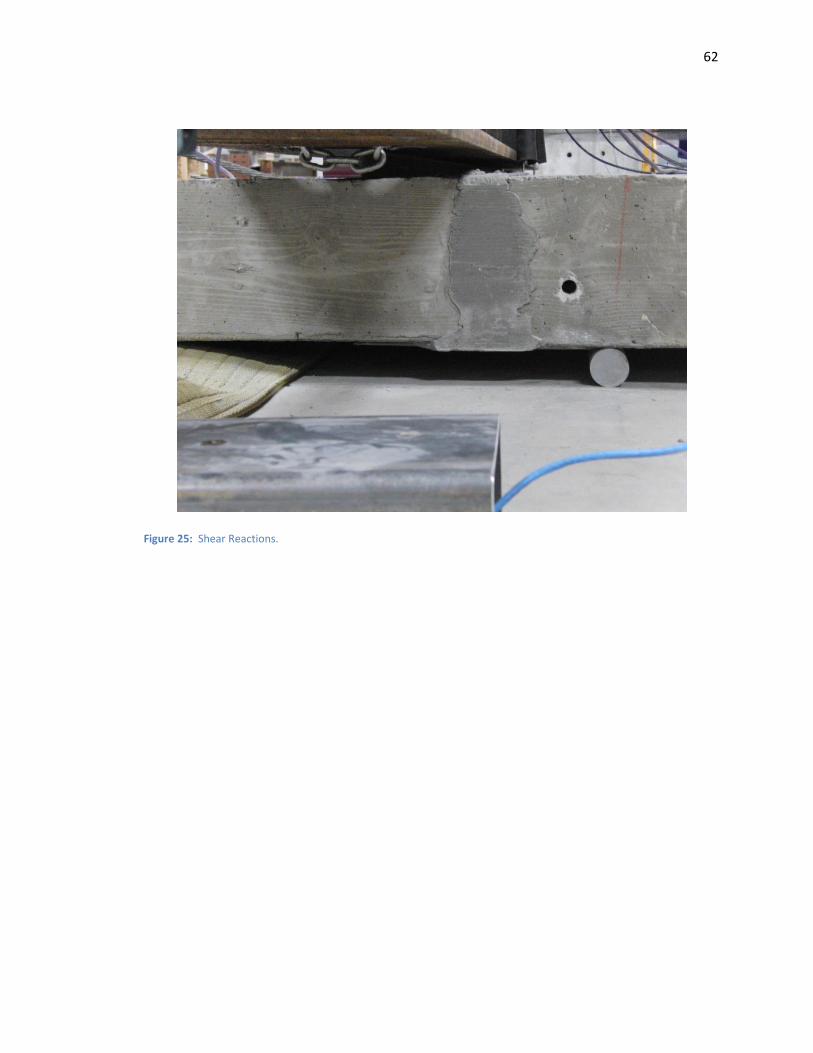
62
Figure 25: Shear Reactions.
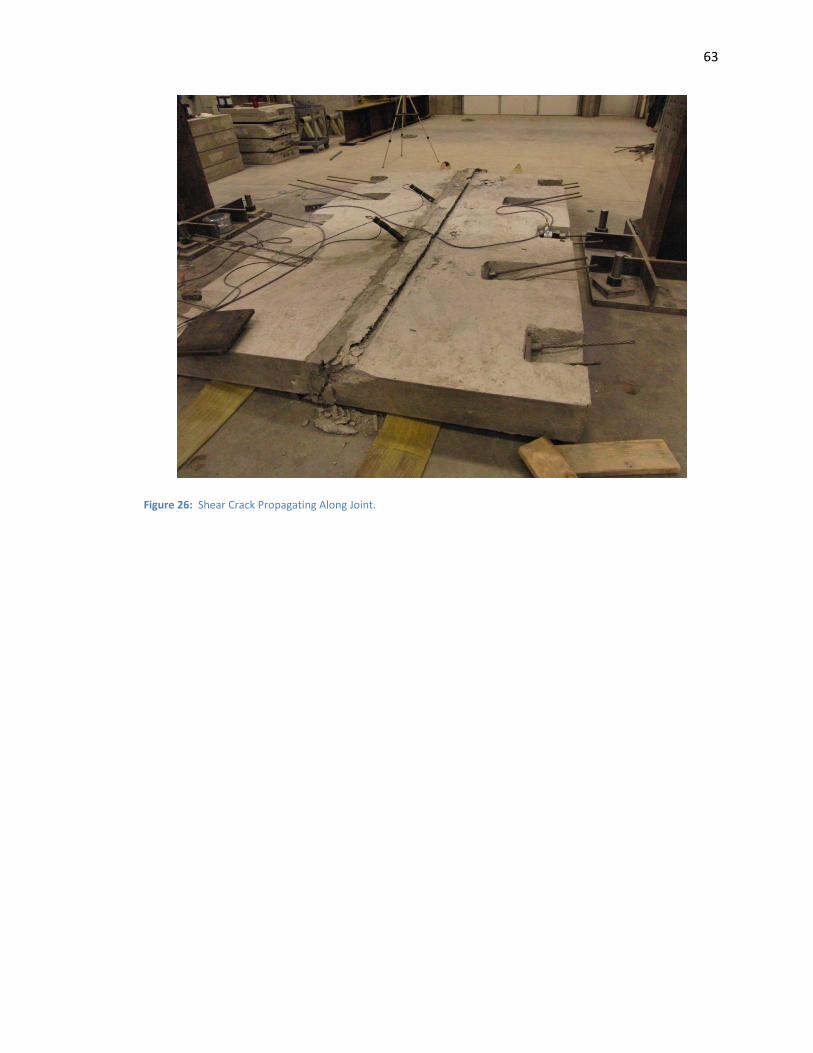
63
Figure 26: Shear Crack Propagating Along Joint.
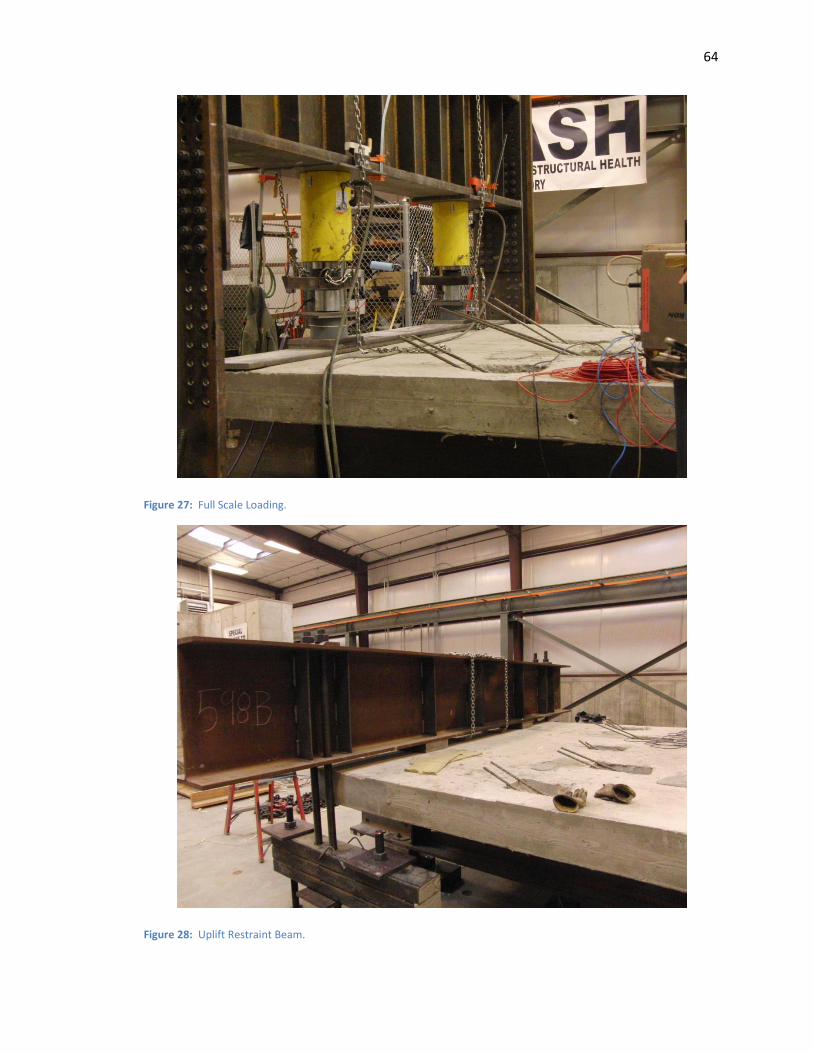
64
Figure 27: Full Scale Loading.
Figure 28: Uplift Restraint Beam.
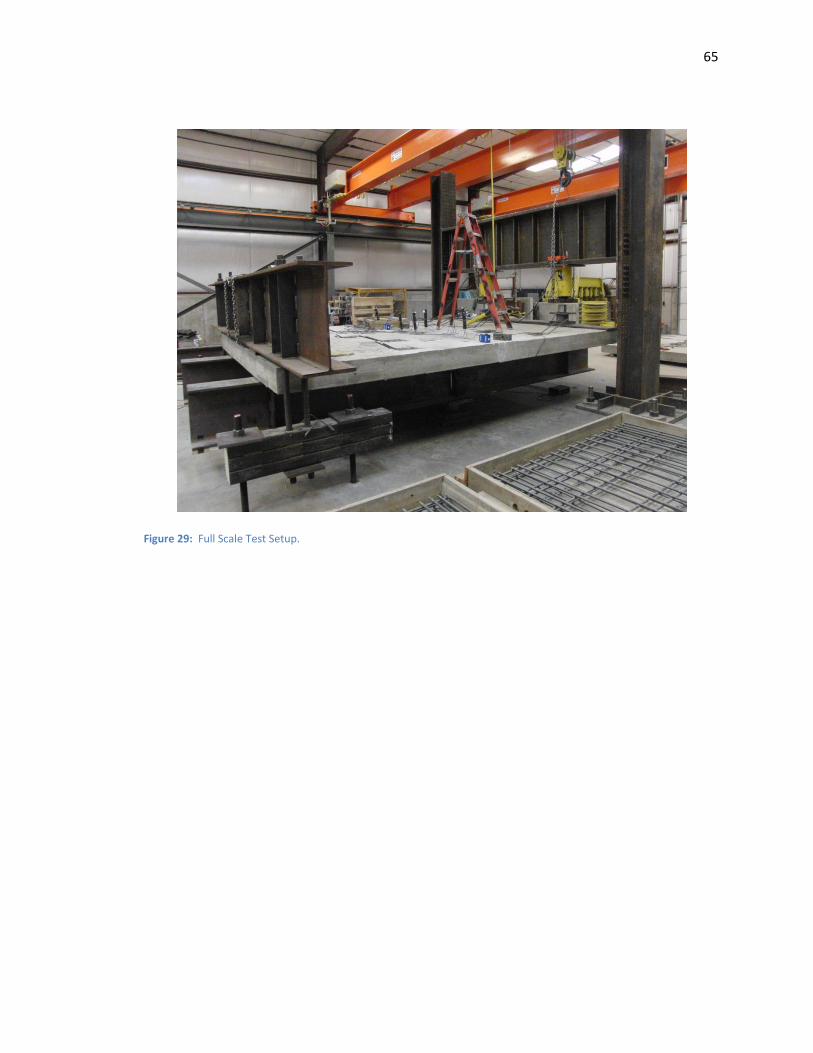
65
Figure 29: Full Scale Test Setup.
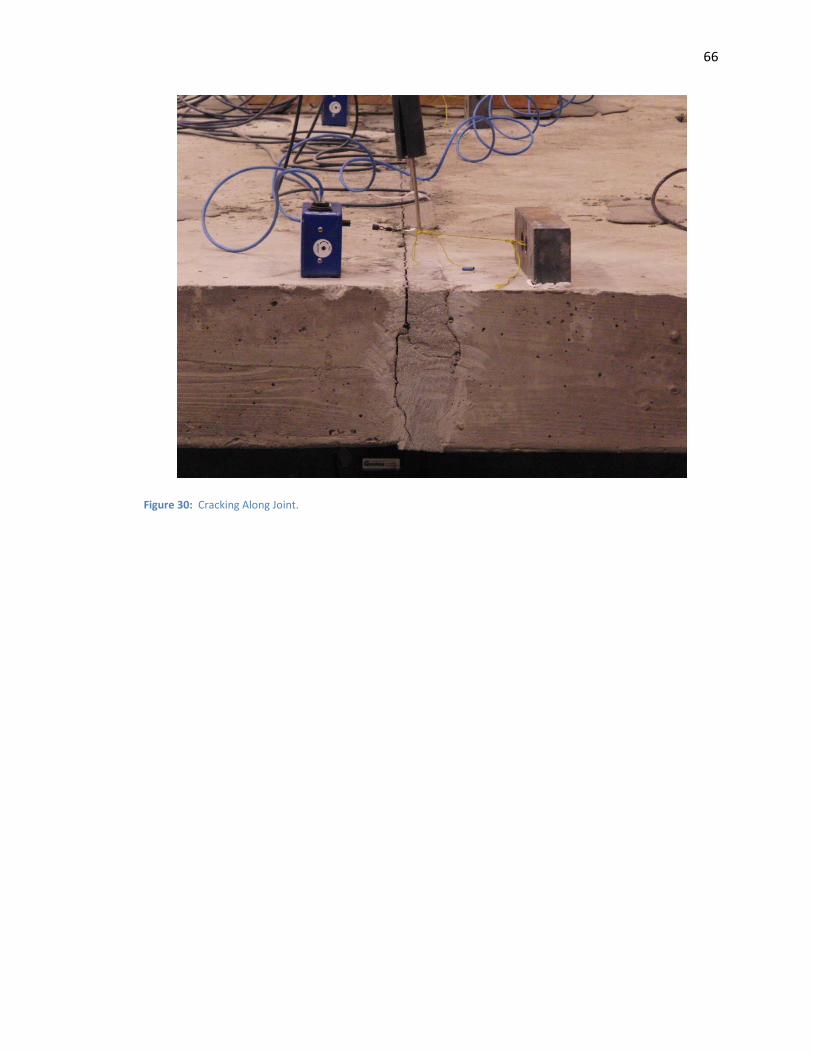
66
Figure 30: Cracking Along Joint.
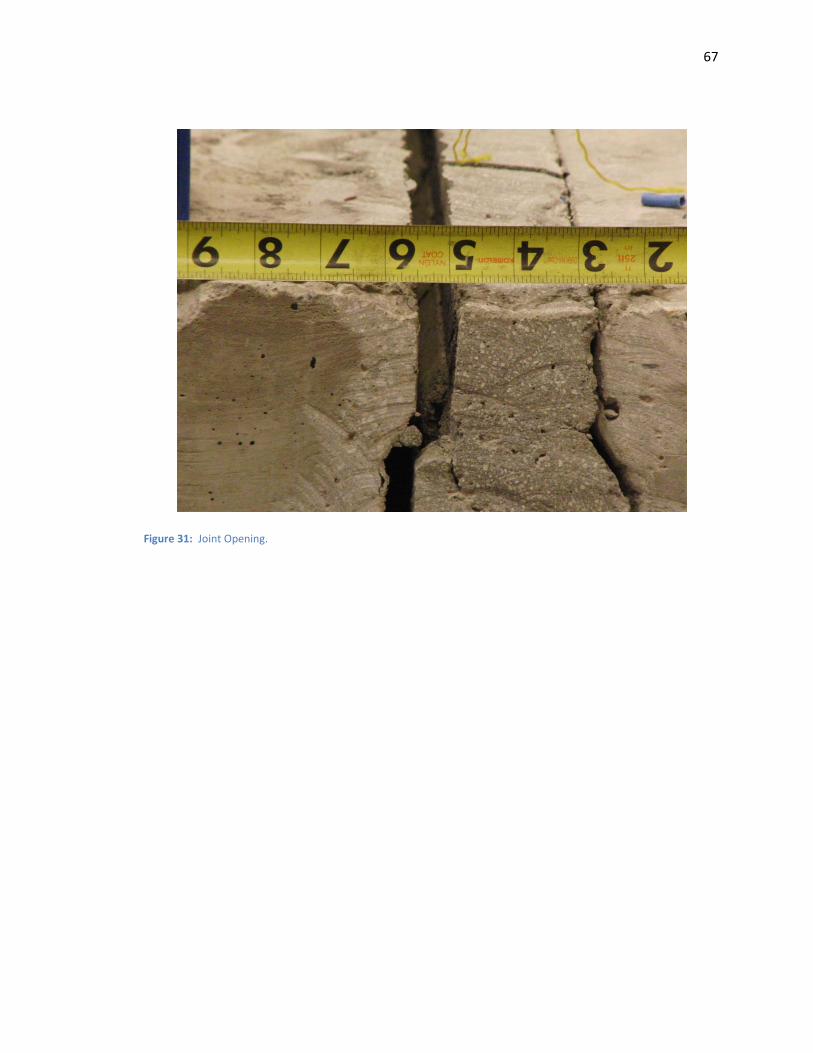
67
Figure 31: Joint Opening.
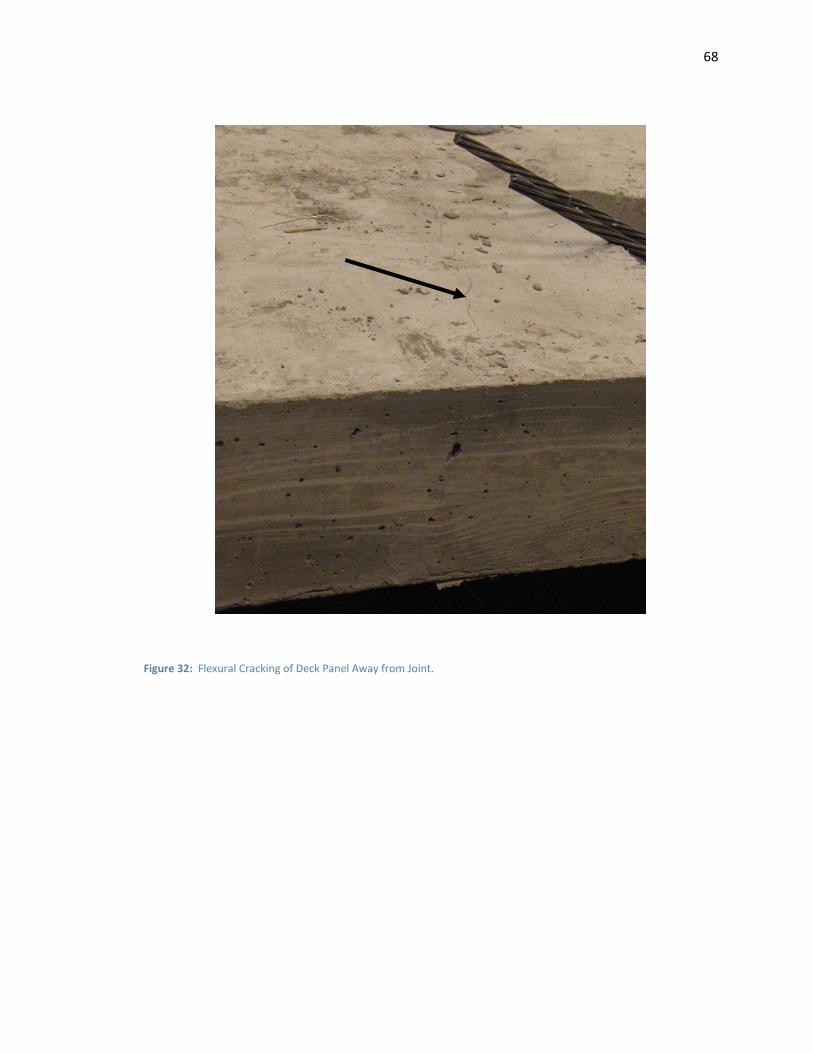
68
Figure 32: Flexural Cracking of Deck Panel Away from Joint.

69
APPENDIX B. Recorded Data
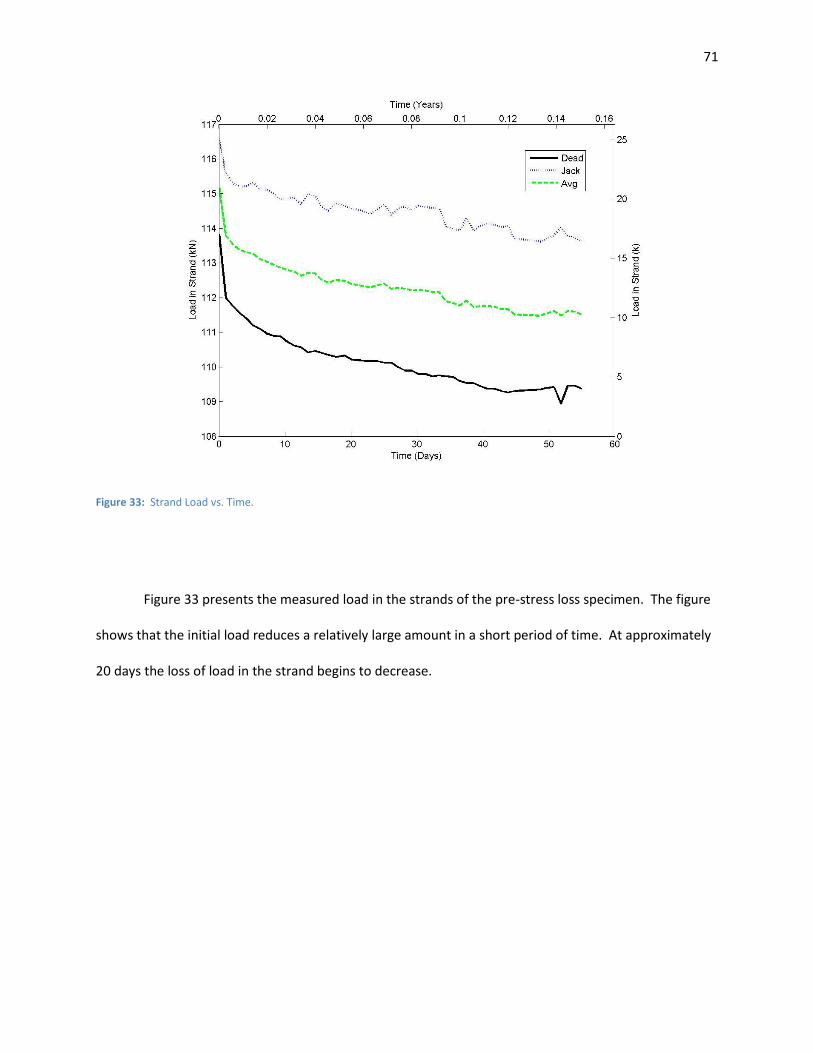
71
Figure 33: Strand Load vs. Time.
Figure 33 presents the measured load in the strands of the pre-stress loss specimen. The figure
shows that the initial load reduces a relatively large amount in a short period of time. At approximately
20 days the loss of load in the strand begins to decrease.
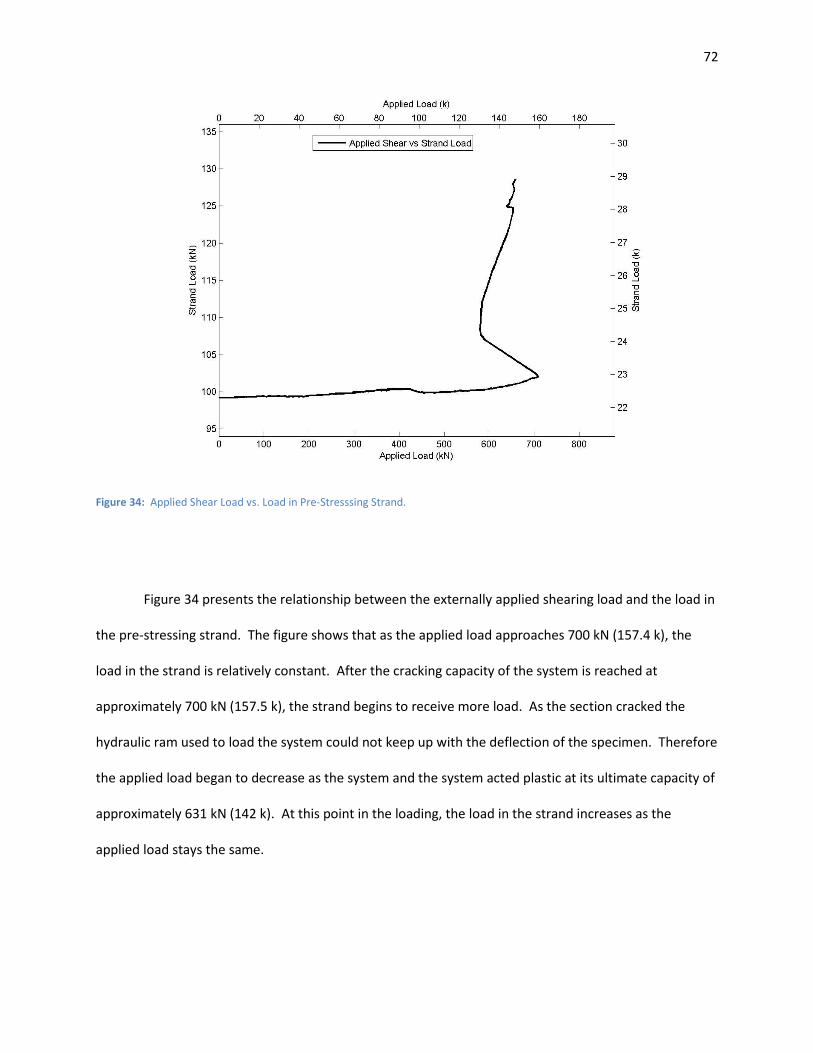
72
Figure 34: Applied Shear Load vs. Load in Pre-Stresssing Strand.
Figure 34 presents the relationship between the externally applied shearing load and the load in
the pre-stressing strand. The figure shows that as the applied load approaches 700 kN (157.4 k), the
load in the strand is relatively constant. After the cracking capacity of the system is reached at
approximately 700 kN (157.5 k), the strand begins to receive more load. As the section cracked the
hydraulic ram used to load the system could not keep up with the deflection of the specimen. Therefore
the applied load began to decrease as the system and the system acted plastic at its ultimate capacity of
approximately 631 kN (142 k). At this point in the loading, the load in the strand increases as the
applied load stays the same.
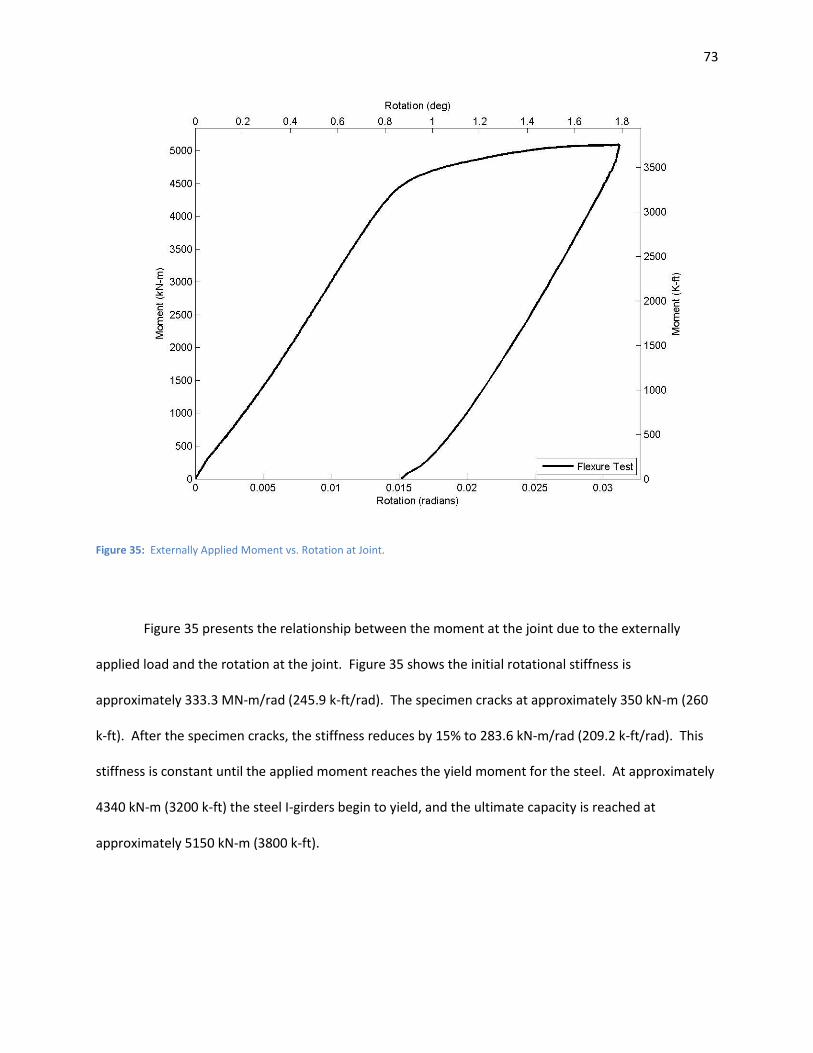
73
Figure 35: Externally Applied Moment vs. Rotation at Joint.
Figure 35 presents the relationship between the moment at the joint due to the externally
applied load and the rotation at the joint. Figure 35 shows the initial rotational stiffness is
approximately 333.3 MN-m/rad (245.9 k-ft/rad). The specimen cracks at approximately 350 kN-m (260
k-ft). After the specimen cracks, the stiffness reduces by 15% to 283.6 kN-m/rad (209.2 k-ft/rad). This
stiffness is constant until the applied moment reaches the yield moment for the steel. At approximately
4340 kN-m (3200 k-ft) the steel I-girders begin to yield, and the ultimate capacity is reached at
approximately 5150 kN-m (3800 k-ft).
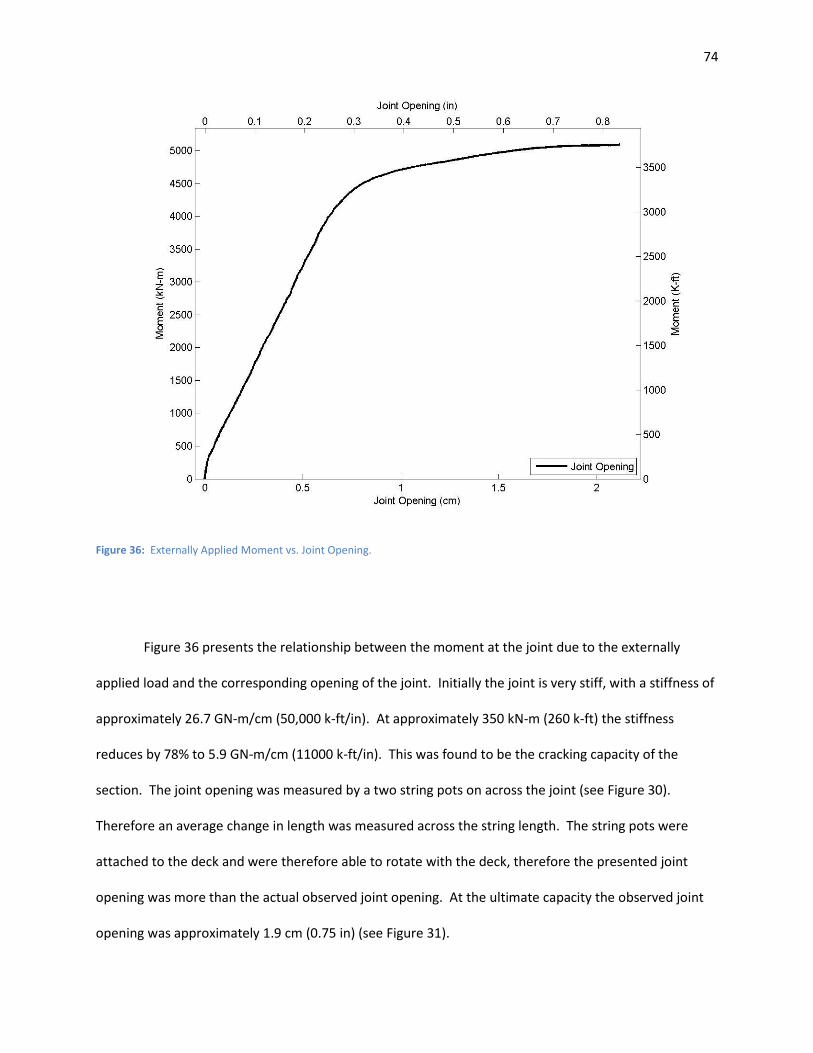
74
Figure 36: Externally Applied Moment vs. Joint Opening.
Figure 36 presents the relationship between the moment at the joint due to the externally
applied load and the corresponding opening of the joint. Initially the joint is very stiff, with a stiffness of
approximately 26.7 GN-m/cm (50,000 k-ft/in). At approximately 350 kN-m (260 k-ft) the stiffness
reduces by 78% to 5.9 GN-m/cm (11000 k-ft/in). This was found to be the cracking capacity of the
section. The joint opening was measured by a two string pots on across the joint (see Figure 30).
Therefore an average change in length was measured across the string length. The string pots were
attached to the deck and were therefore able to rotate with the deck, therefore the presented joint
opening was more than the actual observed joint opening. At the ultimate capacity the observed joint
opening was approximately 1.9 cm (0.75 in) (see Figure 31).