Embed Size (px)
Citation preview

Subject to final edit and design
Pakistan low carbon analysis:Waste sector
Omar UsmaniSeton StiebertNatalie Harms
Lachlan Cameron
December 2015

ContentsAbbreviations.............................................................................................................32.1 Introduction.........................................................................................................42.2 Waste Sector: Background..................................................................................4
2.2.1 Sector Context............................................................................................42.2.2 Structure....................................................................................................9
2.3 Development Priorities of Pakistan....................................................................102.4 Reference Case..................................................................................................10
2.4.1 Methodology.............................................................................................112.4.2 Data and Assumptions..............................................................................112.4.3 Greenhouse Gas Emissions Reference Case .........................................11
2.5 Low Carbon scencario analysis..........................................................................112.5.1 Choice of Abatement Options...................................................................112.5.2 Calculation of Abatement Potentials........................................................122.5.3 Investment Costs......................................................................................122.5.4 Data Availability and Uncertainties..........................................................12
2.6 Low Carbon Development Options....................................................................132.6.1 Context.....................................................................................................132.6.2 Scenarios..................................................................................................142.6.3 Mitigation Potentials................................................................................152.6.4 Costs.........................................................................................................162.6.5 Development Benefits...............................................................................172.6.6 Climate Resilience Impacts......................................................................17
2.7 Potential Policy Measures and Instruments......................................................172.7.1 Financial incentives..................................................................................172.7.2 Awareness/education................................................................................182.7.3 Measure 3.................................................................................................18
2.8 Conclusions........................................................................................................18Annex 1 – Factsheets...............................................................................................19References...............................................................................................................20Endnotes..................................................................................................................22
1IISD.org Title of Document: Sub-title

2IISD.org Title of Document: Sub-title
ABBREVIATIONSBAU Business-as-usualGDP Gross Domestic ProductMSW Municipal Solid WasteGWP Global Warming Potential
CER Certified Emission Reduction
CDM Clean Development Mechanism
NAMA Nationally Appropriate Mitigation Action
REDD Reducing Emissions from Deforestation and Forest Degradation
SWDS Solid Waste Disposal Sites
PPP Public-Private Partnership
3IISD.org Title of Document: Sub-title

2.1 INTRODUCTIONThis chapter is part of a larger analysis of low-carbon development options in Pakistan, whichcovers a variety of mitigation sectors. The holistic, sectoral analysis aims to inform Pakistani policy makers and provides the evidence base for prioritizing low-carbon development options and developing proposals for Nationally Appropriate Mitigation Actions (NAMAs) and REDD+(Reducing Emissions from Deforestation and Forest actionsDegradation) actions.The analysis includes a preliminary greenhouse gas (GHG) emissions inventory andreference case projecting GHG emissions to 2030 for the entire Pakistani economy and bysector. The analysis then demonstrates how low-carbon development options can bend downemissions from the proposed reference case in each sector. Recognizing Pakistan’sdevelopment priorities and plans, the analysis also considers how the various options cancontribute to sustainable development. The overall work concludes with the identification ofpriority actions to enable low-carbon development.This chapter analyses low-carbon development options for electricity and fossil fuel energy demand in the waste sector in Pakistanand is one of seven sectoral chapters developed as part of the overall low-carbon scenarioanalysis.
2.2 WASTE SECTOR: BACKGROUND
In most developed and developing countries with increasing population, prosperity and urbanization, it remains a major challenge for municipalities to collect, recycle, treat and dispose of increasing quantities of solid waste and wastewater. A cornerstone of sustainable development is the establishment of affordable, effective and truly sustainable waste management practices. It must be further emphasized that multiple public health, safety and environmental benefits accrue from effective waste management practices which concurrently reduce GHG emissions and improve the quality of life, promote public health, prevent water and soil contamination, conserve natural resources and provide renewable energy benefits.
4IISD.org Title of Document: Sub-title

The major GHG emissions from the waste sector are landfill CH4 and, secondarily, wastewater CH4 and N2O. In addition, the incineration of fossil carbon results in minor emissions of CO2. ((Bogner, 2007), page 588)(Bognor et al. (2007, p588).
2.2.1 Sector Context
Municipal Solid Waste: Municipal solid waste comes from the residential and commercial sector, and typically includes elements such as food waste, garden and park waste, paper and cardboard, wood, textiles, nappies, rubber and leather, plastics, metal, glass (and pottery and china), as well as other elements such as ash, dirt, dust, soil, or electronic waste. This section first explains what emissions are associated to the management of municipal solid waste, and then explained how it is stored or disposed of.
Municipal solid waste produces a number of greenhouse gasses: CH4, CO2, NMVOCs, N2O, NOx, CO, but only methane (CH4) and carbon dioxide (CO2) are considered in this work. This is because nitrous oxide (N2O) emissions are negligible, and because non-methane volatile organic compounds (NMVOCs), nitrogen oxides (NOx) and carbon monoxide (CO) fall outside of the scope of this work: Their monitoring is performed under other guidelines/conventions than the IPCC and there is less clarity on how exactly they should be treated. This is however a necessary point of attention that should be addressed in future work, as such gasses can contribute significantly to the greenhouse effect. (IPCC, 2006)
Methane (CH4) and carbon dioxide (CO2) come from the organic material (for example glucose) present in the waste is digested (basically, eaten) by microorganisms (bacteria or fungi). There are essentially two types of processes: Aerobic digestion and anaerobic digestion. The difference between the two is the source of oxygen that is available for the microorganisms.
Aerobic digestion uses gaseous oxygen present in the air. In terms of greenhouse gasses, it only produces CO2. It also produces compost (which is used as a soil conditioner, i.e. to improve the soil’s physical quantities, most notably its nutrition for plants) and heat.
Anaerobic digestion uses non-gaseous oxygen (for example oxygen present in the waste (organic material) itself). In terms of greenhouse gasses, it only produces both CO2 and CH4. It also produces a soil conditioner (digestate), and trace levels of hydrogen sulphide.
(Wikipedia, 2012)
5IISD.org Title of Document: Sub-title
Note that while (CO2) is mentioned here, its net emissions are actually accounted for under the AFOLU (Agriculture, Forestry and Other Land Use sector (IPCC,2006).
The IPCC guidelines have four categories for the treatment of municipal solid waste:
[1)] Solid Waste Disposal Sites (SWDS): This corresponds to sending waste to sites and storing it there. The proportion of anaerobic reactions is called the Methane Correction Factor (MCF). Managed anaerobic sites (meaning that they have at least one of the following: cover material, mechanical compacting, levelling of the waste) only have anaerobic reactions and have an MCF of 1. Managed semi-aerobic sites use systems to place the waste and introduce air into layers (for example with a gas ventilation system, or permeable cover material) have an MCF of 0.5, or 50% of anaerobic reactions. The MCF of unmanaged systems will depend on their depth, since shallower systems have a bigger proportion of their waste (the surface) exposed to the ambient air than deep systems. The IPCC gives an MCF factor of 0.8 (80% anaerobic reactions) for deep systems (>5m) and an MCF factor of 0.4 (40% anaerobic reactions) for shallow systems (<5m). We assume that 70% of the collected waste is disposed in unmanaged shallow landfills, while the remaining 30% goes to unmanaged deep landfills. The management of waste dumping sites is still in its early phases in Pakistan (PAK-EPA, 2005) and most dump sites lack the facilities they would need to be managed. There has, however been some progress with the building of waste management infrastructure that can enable practices that would reduce emissions, for example in Lahore (DAWN, 2014), (ESMAP, 2010), (DAWN, 2016).
1)[2)] Biological treatment: This includes composting and managed anaerobic digestion (where methane is recovered). Composting mostly has aerobic reactions, but also has some anaerobic ones. Note that composting also produces amounts of methane and nitrous oxide if not properly managed, but the amounts produced are typically small.
2)[3)] Incineration and open burning: Waste can be burned, either to produce energy (in which case it belongs to the energy sector) or not (in which case it belongs to the waste sector). There are three greenhouse gasses that are produced:
a. CO2, which contrary to the case for digestion belongs to the waste sectorb. CH4, which is a result of incomplete combustionc. N20, which appears at low combustion temperatures (500-950 °C).
3)[4)] Unspecified: This includes recycling as well as waste that does not belong to any of the above categories. It is often waste that is not brought for treatment or disposal at a site. As such, it mostly decomposes aerobically and does not produce any methane. As mentioned above, CO2 emissions from decomposition do not belong to the waste sector, so this category does not add to emissions from the waste sector.
The key to determine emissions is to know the proportions of each system. Incineration of waste does not seem to occur significantly in Pakistan, and composting is also apparently very small, and the unspecified category does not contribute to the waste sector. This means that (almost) all the emissions come from the proportion of waste that is sent to SWDSs. The baseline model assumes that 50% of MSW goes to SWDSs, based on the fact that solid waste collection by government owned and operated services in Pakistan’s cities averages 50% of
6IISD.org Title of Document: Sub-title

waste quantities generated (compared to 75% needed to keep cities relatively clean). This amount is larger in cities such as Lahore (where 76% was collected in 2011 (Masood, 2011) ) than in rural areas, with variations from 0% in low-income rural areas up to 90% in high-income urban areas. (PAK-EPA, 2015)(PAK-EPA) (PAK-EPA, 2005)
Industrial Solid waste
While industrial solid waste has some common elements with Municipal Solid Waste (such as paper from office activities, and food from catering), it is very different from MSW, both in terms of the type of components that are present and in terms of the proportions of each component. It includes the results of industrial activity, which vary strongly from industry to industry. Some of that waste is hazardous and cannot be treated together with MSW, while the non-hazardous part (food and paper, for example) can be handled together with MSW. Unfortunately, no data was available for industrial solid waste, so it does not feature in this work. This is could be considered as a possibility for future work.
Wastewater
To understand emissions from the treatment of wastewater, it is useful to divide them by source and resulting type of emissions. There are essentially two categories.
The first type is, as for solid waste, organic matter. Microorganisms digest it and produce methane (CH4) in anaerobic reaction (when no gaseous oxygen is available) and carbon dioxide (CO2) in both anaerobic and aerobic reactions. As explained above, the latter gas does not count towards emissions from the waste sector. The main parameters that come in play to determine the amount of CH4
that is emitted are the following:i. The amount of organic matter that can be digested by microorganisms. This can be given by
two quantities: Biochemical Oxygen Demand (BOD) or Chemical Oxygen Demand (COD). BOD measures the level of biodegradable organic matter. COD is less specific, as it measures everything that can be chemically oxidized. The difference is important for this work, because BOD data is available for domestic wastewater, while COD data is available for industrial wastewater. As such, the data below makes the distinction between domestic and industrial wastewater. This can be useful for designing policies applying to either sector.
ii. The temperature of the wastewater. Methanogens (microorganisms that digest organic matter into methane (and other things) become active at 15°C. Below that temperature, the organic matter undergoes sedimentation (they will accumulate at the bottom of the water).
7IISD.org Title of Document: Sub-title
[iii.] The type of treatment system. This will determine if anaerobic reactions occur or not. Mixing (i.e., water not being stagnant) or aeration of the water reduces the likelihood of anaerobic reactions to occur. Shallow lagoons have few anaerobic reactions, while deeper ones (>2-3m) have many of such reactions. Closed, underground sewers do not produce emissions, while open sewers do, especially when stagnant or overloaded.
(IPCC, 2006)The other type of source is nitrogen components, such as urea, nitrate, and protein, which can be degraded into nitrous oxide (N20). These components come from human waste. Their amount is related to the amount of food (protein) consumed by people. The manner in which the wastewater is treated strongly influences the occurrence of such processes. The process is the most likely to release significant of nitrous oxide is the discharge of wastewater into rivers, lakes, and estuaries. They can also occur in wastewater treatment plants (but in smaller amounts). (IPCC, 2006)
Wastewater in Pakistan is essentially untreated and discharged directly to a sewer system, a natural drain or water body, a nearby field or an internal septic tank, without provisions for reuse for agricultural or municipal uses (it is however used directly for irrigation for its added value as a fertilizer). Treatment only occurs in Islamabad and Karachi, and for very small amounts between 1-8% of urban wastewater are treated, depending amongst others on the capacity at which existing installations are working). More facilities were built, but they are either under-loaded or abandoned, as they lack associated sewerage networks. The existing facility are only primary treatment ones, where gross, suspended and floating solids are removed by mechanical means (a screening trap in the water). Secondary treatment, where microbes consume some of the organic matter, and tertiary treatments chemicals and specific equipment are used to produce > 99% impurity-free water for drinking are essentially absent. Industrial wastewater is also essentially untreated, with a few exceptions, mostly for export industries that feel pressure for international customers and the fertilizer industry. The main reason for this is the lack of incentives for industries to treat their wastewater.(Zia, 2012) (World Bank Group, 2015)
Emissions per source type
The four types of categories of waste emissions are shown in Figure 1. It is interesting to note that the ranking of these categories is projected to change quite dramatically. Industrial wastewater is projected to go from being the lowest emitter to being the highest emitter.
8IISD.org Title of Document: Sub-title

last place to first position, while solid waste is expected to be overtaken by sewage.
2013201420152016201720182019202020212022202320242025202620272028202920300
2000000
4000000
6000000
8000000
10000000
12000000
14000000
Baseline emissions from the waste sector
Human Sewage
Industrial Wastewater
Domestic Wastewater
Solid Waste
Mill
ion
tonn
es C
O2e
Figure 1: Baseline emissions in the waste sector
2.2.2 Structure
The main entity taking care of waste issues at the national level is the Environment Protection Agency (PAK-EPA), which used to be a part of the (former) Ministry of Environment, but is now an agency on its own at the moment.
The waste relevant parts of the Pakistan Environmental Protection Act of 1997, which establishes (PAK-EPA, 2015)(PAK-EPA) (National Assembly of Pakistan,1997) states that the PAK-EPA shall:
Assist the local councils, local authorities, Government Agencies and other persons to implement schemes for the proper disposal of wastes so as to ensure compliance with the standards established by it.
9IISD.org Title of Document: Sub-title

Take samples of any materials, products, articles or substances or of the effluents, wastes or air pollutants being discharged or emitted or of air, water or land in the vicinity of the discharge or emission.
Prohibit emissions or discharge of any effluent or waste or air pollutant or noise in an amount, concentration or level which is in excess of the National Environmental Quality Standards.
Prohibit the import of hazardous waste
The actual management of waste occurs at the municipal level. They spend a considerable portion of their budgets on solid waste management, but receive limited tax revenue in return, in insufficient amounts to meet their operation and maintenance costs. This is one of the main reasons why they cannot afford the latest techniques and equipment that would make solid waste management a profitable and environmentally friendly enterprise. (PAK-EPA, 2005)
2.3 DEVELOPMENT PRIORITIES OF PAKISTANThe main documents setting powers, objectives, and functions for the government to act on waste matters are the Pakistan Environmental Protection Act (PEPA) of 1997 (PAK-EPA, 2015)(PAK-EPA) (National Assembly of Pakistan, 1997), and the National Environment Policy of 2005 (Ministry of Environment, 2005). These powers, objectives, and functions include the following:
Enforcing quality standards and monitoring and reporting systems Introducing a discharge licensing system for the industry Make installation of wastewater treatment plants an integral part of all sewage schemes Devise an implement a National Sanitation Policy (Ministry of Environment, 2006) that:
o Provides a broad framework and policy guidelines to enhance and support sanitation coverage.
o Primarily focusses on the safe disposal of excreta from dwelling units and work places by using sanitary latrines and includes the creation of an open defecation free environment along with the safe disposal of liquid wastes, together with the promotion of health and hygiene practices in the country.
o Meet the Millennium Development Goals of dividing the number of people without sustainable access to improved sanitation by half in 2015, reaching 100% access to improved sanitation by 2025.
o Initiate research and pilot projects for developing sustainable models for the safe disposal of liquid, solid, municipal, industrial, and agricultural waste.
o Establishes a National Sanitation Policy Implementation Committee comprising representatives of the public and private sector, as well as Civil Society Organisations.
Devising and implementing master plans for treatment of municipal and industrial wastewater in urban and rural areas.
10IISD.org Title of Document: Sub-title

Develop strategies for the integrated management of waste at national, provincial, and local levels
Encourage reduction, reduction, and reuse of waste
2.4 REFERENCE CASE
2.4.1 Methodology
2.4.2 Data and Assumptions
2.4.3 Greenhouse Gas Emissions Reference Case
2.5 LOW CARBON SCENCARIO ANALYSISThe low-carbon scenario analysis consists of identifying low-carbon development options,and calculating the mitigation potential against the reference case. The resulting wedgeanalysis demonstrates the emission reduction potential by low-carbon technology in thesector.
11IISD.org Title of Document: Sub-title
Data and uncertainties for mitigation analysis
Data availability was not really a concern, at least not in supplementary ways to establishing the baseline. This is related to our relatively straightforward approach.
There are two sources of uncertainty, namely:1. The time variation of the baseline emission factor: Contrary to other sources of emissions,
the decomposition of solid waste has an emissions factor that changes with time, since already decomposed matter will produce a different amount of CH4, compared to freshly deposited matter. The change in the emission factor is about 3% between 2013 and 2030. We chose to deal with this by using the 2013-2030 average of emissions factor as our reference emission factor.
2. The waste composition: The composition of the waste will strongly influence its baseline emission factor, as well as the emission factor of compost. The baseline factor is taken care of in the baseline, and relies on (relatively solid) waste composition data. For the emission factor of compost, we took the value recommended by the IPCC. This can change quite a bit. We took the recommended value of 4 g CH4/kg waste treated. The range of this factor is 0.03-8 g CH4/kg waste treated. The guidelines do not provide a detailed link to waste composition, so a more accurate assessment could not be made, but it should be a reasonable approximation. (IPCC, 2006)

2.5.1 Choice of Abatement Options
Two options were chosen, both in the Municipal Solid Waste (MSW) sector, namely composting MSW and landfill gas utilisation (the recovery (and combustion) of methane from landfill gas). No options were made for wastewater.
The reason why no wastewater options have been considered is that they are very unlikely to occur. There is essentially no wastewater treatment infrastructure present. The priority is to build some kind of infrastructure, not to extract some value or reduce emissions out of it. This is in contrast with MSW, which has some revenue streams such as scavenging to recover elements that can be resold or reused. Even if these revenues might sometimes be small and insufficient, they are a possible driver for the implementation of new processes and technology. The benefits of emission reduction or a better environment (which have economic counterparts) can then act as a catalyser. This kind of situation is not likely to occur in the coming years in Pakistan for wastewater (but could in principle, thanks to the possible extraction of fertilizers from wastewater).
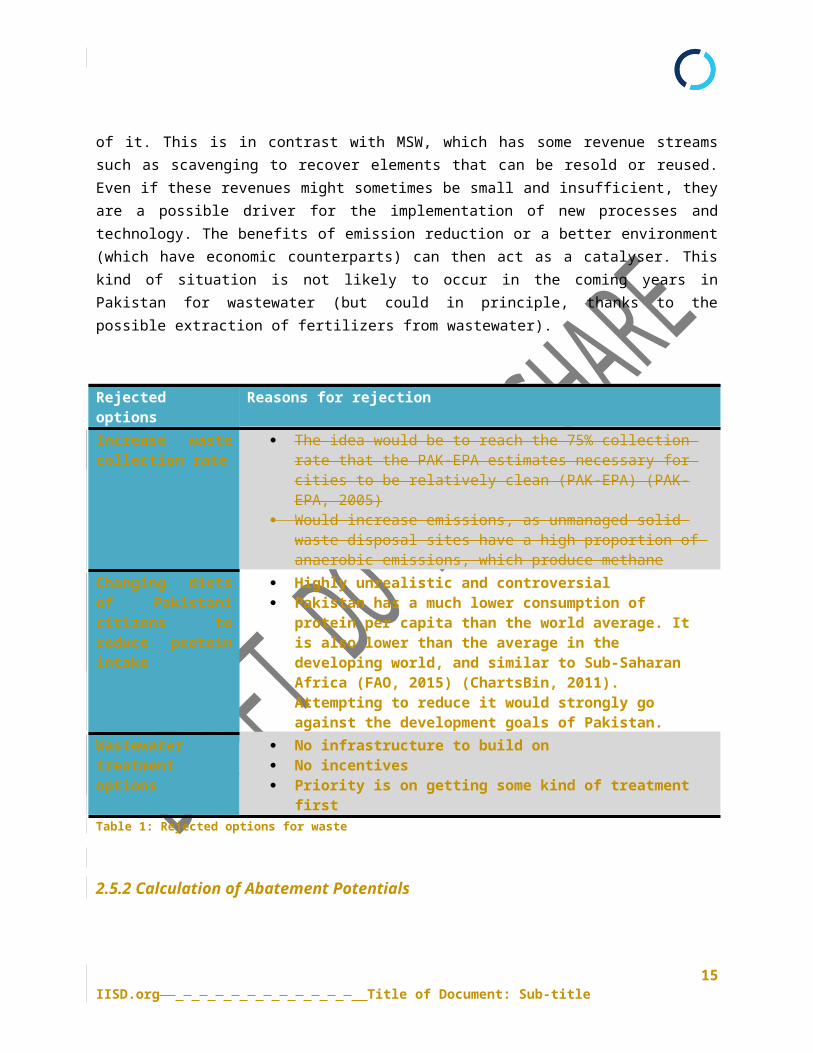
Rejected options
Reasons for rejection
Increase waste collection rate
The idea would be to reach the 75% collection rate that the PAK-EPA estimates necessary for cities to be relatively clean (PAK-EPA) (PAK-EPA, 2005)
Would increase emissions, as unmanaged solid waste disposal sites have a high proportion of anaerobic emissions, which produce methane
Changing diets of Pakistani citizens to reduce protein intake
Highly unrealistic and controversial Pakistan has a much lower consumption of protein per capita than
the world average. It is also lower than the average in the developing world, and similar to Sub-Saharan Africa (FAO, 2015) (ChartsBin, 2011). Attempting to reduce it would strongly go against the development goals of Pakistan.
Wastewater treatment options
No infrastructure to build on No incentives Priority is on getting some kind of treatment first
Table 1: Rejected options for waste
2.5.2 Calculation of Abatement Potentials
12IISD.org Title of Document: Sub-title
The calculation of abatement for the options considered here is relatively straightforward. We assume that each option shifts a certain percentage of the collected solid waste from its current path (where it has a given emissions factor) and brings it towards the treatment at hand (e.g. compost landfill gas utilisation). This volume, multiplied by the difference in emission factors gives us the emission savings. We also chose to build up the volumes linearly between a start and an end year for lack of a more appropriate approach at this stage (2016 is the first year where an option is active, 2030 is when it reaches its selected potential, for both options).
2.5.3 Investment Costs
The costs of the options were based on a literature search of existing projects and studies with a focus on projects that take into account the characteristics of Pakistan (for example planned or existing projects). These costs were scaled up according to the projected volumes. As such, these are investment costs only, and do not include any analysis of the economic value of side products generated (compost and heat, essentially). These would need to be balanced against operational costs to see if the operation of the facilities would be profitable. We did not perform such a full analysis of this, as there was a lack of detailed available information about both the value of the benefits of compost and heat on the market and operational costs in Pakistan.
2.5.4 Data Availability and Uncertainties
Data availability was not really a concern, at least not in supplementary ways to establishing the baseline. This is related to our relatively straightforward approach.
There are two sources of uncertainty, namely:[1.] The time variation of the baseline emission factor: Contrary to other sources of emissions, the
decomposition of solid waste has an emissions factor that changes with time, since already decomposed matter will produce a different amount of CH4, compared to freshly deposited matter. The change in the emission factor is about 3% between 2013 and 2030. We chose to deal with this by using the 2013-2030 average of emissions factor as our reference emission factor.
[2.] The waste composition: The composition of the waste will strongly influence its baseline emission factor, as well as the emission factor of compost. The baseline factor is taken care of in the baseline, and relies on (relatively solid) waste composition data. For the emission factor of compost, we took the value recommended by the IPCC. This can change quite a bit. We took the recommended value of 4 g CH4/kg waste treated. The range of this factor is 0.03-8 g CH4/kg
13IISD.org Title of Document: Sub-title

waste treated. The guidelines do not provide a detailed link to waste composition, so a more accurate assessment could not be made, but it should be a reasonable approximation. (IPCC, 2006)
2.6 LOW CARBON DEVELOPMENT OPTIONS
2.6.1 ContextLandfill gas utilisation
This option is about collecting landfill gas (a mix of CH4 and CO2). The most common way to do this involves drilling vertical wells in the waste and connecting those wellheads to lateral piping that transports the gas to a collection header using a blower or vacuum induction system. Horizontal wells are also possible, as combinations of both. As the warm gas travels to the collection system, water condensates and needs to be removed. A blower pulls the gas from the collection wells into the collection header and conveys the gas to downstream treatment and energy recovery systems. Flaring systems are also needed for safety reasons (in case too much gas is suddenly produced, for example). The gas can then be treated (removing excess moisture, particulates, and other impurities). The costs of that processing depend on the gas purity requirements of the end use applications, which can be electricity generation, or direct use as a fuel for heating. (US EPA, 2015) (Masood F. , 2013)
The most important element is to have a managed sanitary landfill. This is needed to even consider collecting landfill gas. The first such installation in Pakistan started operations in April 2016 on the Lakhodair site in Lahore. (DAWN, 2016) There also needs to be a proper, large-scale waste collection system in place. As mentioned in Section 2.2.1 Sector Context, there is some collection going on, especially in cities, but it is still globally too low (50% on average, while at least 75% would be needed to keep cities clean to a minimum). Some cities (such as Lahore, at 76%) fare better than others. The reason for this need is to ensure sufficient end product (natural gas for heat and/or electricity) to cover operational expenses and recoup the investment cost.
Compost
14IISD.org Title of Document: Sub-title
This option is about composting collected municipal solid waste in facilities connected to landfills, such as the facility built in the MehmoodMahmood Booti dumpsite in Lahore (ESMAP, 2010), not about composting in households to reduce the amount of waste (Masood, 2011) . While the latter would have some clear benefits (reduction of amounts of processed waste, no need to build large facilities), it would not be easy to implement, as not all households would have the possibility or the willingness to do it (for example in apartments). An intermediary solution could be to incite households to sort food waste from the rest, in order for separate waste streams to be collected. This would enhance the quality of the compost produced by central processing facilities. Note that such a scenario would also change the emission factors for the production of compost. The abatement potential presented below is based on a scenario where unsorted waste is composted (which is reflected in the assumed emission factors). A potential extension of this work could be to have a scenario where a portion of food waste is collected separately after households separate their waste.
Similarly to landfill gas, composting would require proper processing installations and a large enough stream of waste to produce enough compost and offer fertilizer to the market in amounts large enough to cover operational costs and recoup investments.
In addition to the Mahmood Booti site in Lahore mentioned above, a few pilots have started/are being considered the cities of Islamabad/Rawalpindi, Karachi and Mardan. They are however much smaller than the Lahore facility mention above: 2-10 tonnes per day for a facility that started operating in Islamabad in September 2015 versus 1000 tonnes per day at the Mahmood Booti site. (UN Habitat, 2015)(Un Habitat, 2015)
2.6.2 Scenarios
Landfill gas utilisation
The volume of methane that is avoided is determined by the product of two parameters: How much waste goes to facilities that recover methane, and what percentage of the methane emitted at these facilities is recovered.
15IISD.org Title of Document: Sub-title

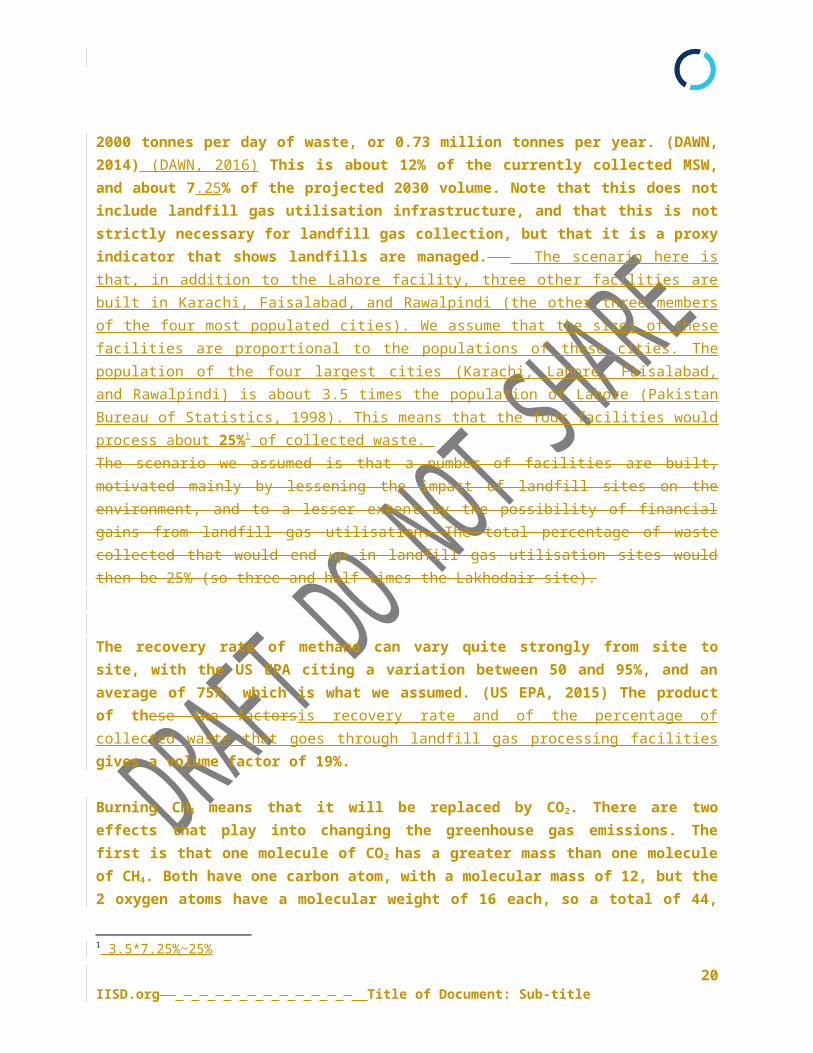
The volume that goes through landfill gas utilisation facilities is directly related to the amount of such facilities, and to their individual capacities. Pakistan’s first sanitary landfill (Lakhodair dump site in Lahore), for which basic infrastructure has been completedhas started operating is expected to be able to process about 2000 tonnes per day of waste, or 0.73 million tonnes per year. (DAWN, 2014) (DAWN, 2016) This is about 12% of the currently collected MSW, and about 7.25% of the projected 2030 volume. Note that this does not include landfill gas utilisation infrastructure, and that this is not strictly necessary for landfill gas collection, but that it is a proxy indicator that shows landfills are managed. The scenario here is that, in addition to the Lahore facility, three other facilities are built in Karachi, Faisalabad, and Rawalpindi (the other three members of the four most populated cities). We assume that the sizes of these facilities are proportional to the populations of these cities. The population of the four largest cities (Karachi, Lahore, Faisalabad, and Rawalpindi) is about 3.5 times the population of Lahore (Pakistan Bureau of Statistics, 1998). This means that the four facilities would process about 25%1 of collected waste. The scenario we assumed is that a number of facilities are built, motivated mainly by lessening the impact of landfill sites on the environment, and to a lesser extent by the possibility of financial gains from landfill gas utilisation. The total percentage of waste collected that would end up in landfill gas utilisation sites would then be 25% (so three and half times the Lakhodair site).
The recovery rate of methane can vary quite strongly from site to site, with the US EPA citing a variation between 50 and 95%, and an average of 75%, which is what we assumed. (US EPA, 2015) The product of these two factorsis recovery rate and of the percentage of collected waste that goes through landfill gas processing facilities gives a volume factor of 19%.
Burning CH4 means that it will be replaced by CO2. There are two effects that play into changing the greenhouse gas emissions. The first is that one molecule of CO2 has a greater mass than one molecule of CH4. Both have one carbon atom, with a molecular mass of 12, but the 2 oxygen atoms have a molecular weight of 16 each, so a total of 44, versus 16 for CH4
(each hydrogen atom has a molecular mass of 1). The second is the fact that CH4 has a larger global warming potential than CO2. The value of this Global Warming Potential (GWP) factor depends on the time horizon we look at. For a 100-year time horizon, the GWP of CH4 is 21 times the one of
1 3.5*7.25%~25%
16IISD.org Title of Document: Sub-title

CO2. This means that the emissions factor of this option is 44/ (21*16) = 0.13 times the baseline emission factor.Compost
The MehmoodMahmood Booti Lahore facility is expected to reach a processing volume of up to 1’500 tonnes per day, which is about 550’000 tonnes per year, or a bit less than 10% of the currently collected waste in Pakistan and about 5% of the expected volume of collected waste in 2030.Here, we assume a similar scenario to the landfill gas scenario, namely that the four largest cities get an installation similar to Mahmood Booti, proportional to their population. Together, these four installations (which include Mahmood Booti) represent about 3.5 times the capacity of Mahmood Booti, or a volume factor of 19%2. This scenario assumes that another facility similar to the Lahore one is built and that the percentage of collected waste that is composted in 2030 is 10% (that is, the same as the Lahore facility is expected to achieve based on current waste volumes). This 10% of waste is for both the Lahore facility and this new facility (or a grouping of smaller ones). This figure is a bit lower than for the landfill gas utilisation option, as a focus on making more landfills sanitary (and hence look at landfill gas recovery options) is more likely, as such sites would local environment contamination and would therefore be prioritised compared to composting facilities.
The emission factor given by the IPCC is 4g CH4/kg wet waste, compared to 13.95 g CH4/kg wet waste in the baseline. The 4g CH4/kg needs to be corrected by a factor that takes into account the removal of inert waste in the composting process. The proportion of inert waste is 58%, so the percentage of waste that will be composted (and for which the factor 4g CH4/kg applies) is 42%, leading to a factor of 1.68g CH4/kg (on a total mass basis, i.e., the same as the basis for the 13.95 g CH4/kg wet waste factor). Note that the factor in the baseline changes with time (it increases by about 3% between 2013 and 2030), so we took an average of the factor across the 2013-2030 period. This change reflects the fact the change in composition of the waste due to decomposition of the accumulated waste. This means that the emission factor of composting is 12% of the emission factor of the baseline (unmanaged landfills).
2.6.3 Mitigation Potentials Figure 2 and Error: Reference source not found show the potential savings for each option. The two options are relatively close in size, with landfill
2 There is no need to introduce a recover rate, as compost is processed differently from landfill gas.
17IISD.org Title of Document: Sub-title

gas utilisation being a bit higher, due to higher assumed volumes (with relatively similar emission factors).
A few caveats should be taken: First, these options are quite ambitious and would require other motivations (such as reduced local pollution) to be enacted. Second, they were considered individually. In practice, it might be an either/or choice for economic reasons (capital and resources available for such matters are limited). In case both are used, there should be an assessment of the overlap between the two, as they might happen at the same facilities. In that case, the savings would not be additive: One option would remove (most of) the methane the other option would not be able to remove anymore.
20132014
20152016
20172018
20192020
20212022
20232024
20252026
20272028
20292030
0
2000000
4000000
6000000
8000000
10000000
12000000
14000000
Waste baseline and savings
CompostRemainderBaseline
mill
ion
tonn
es C
O2e
Figure 2: Waste sector baseline and savings
18IISD.org Title of Document: Sub-titleTable 2: 2025 and 2030 waste sector savings

2.6.4 CostsLandfill gas utilisation
To estimate the costs, we simply scale up the costs of the Lakhodair facility in Lahore in the same way we scaled up the volumes treated: We assume that the other three cities in the top four of Pakistani cities by population (Karachi, Faisalabad, and Rawalpindi) also build similar facilities, proportional to their populations. As seen above, the population of the top four cities is about 3.5 times the population of Lahore (see 2.6.2 Scenarios). The Lakhodair facility cost PKR 7 billion, or about USD 70 million (DAWN, 2014). This means that the total investment costs for the four facilities (Karachi, Lahore, Faisalabad, and Rawalpindi) would be about USD 245 million.The first costs to consider are the costs to build the collection system. The Lakhodair in Karachi is 11 acres (1 acre= 4046.856 square meters) (DAWN, 2014). The scenario above assumes that 25% of the 2030 collected waste is processed in landfill gas utilisation properties (Lakhodair would be about 7.25%), so the scenario would mean that landfill gas utilisation facilities would need to process 11*25/7.25~38 acres. The US EPA guidelines mention a typical capital cost of 25’500 USD (2013 dollars) per acre. (US EPA, 2015) Scaled to the required surface, that would mean investment costs of 0.96 million USD.
The US EPA provides a number of examples of investment costs for a 3MW facility (excluding the collection facilities). They vary between 5 and 8 million USD. The also provide a table that relates the gas flow (in cubic feet per minute (cfm)) to the engine size, with about 2.5 kW/cfm. They also mention that a 40 acre system produces about 600 cfm. Our scenario assumes a similar surface (38 acres3), so this means that we would need 600*2.5=1’500 kW in total power (from several turbines), or about half the
3 Based on the same growth as above and the fact that The Lakhodair in Karachi is 11 acres (1 acre= 4046.856 square meters) (DAWN, 2014)
19IISD.org Title of Document: Sub-title
2025 savings (million tonnes CO2e)
2025 savings (% of baseline)
2030 savings (million tonnes CO2e)
2030 savings (% of baseline)
Compost 0.2038 2.023.8% 0.5026 2.104.0%Landfill gas utilisation
0.33 3.253% 0.49 3.889%
3MW they use for economic assessments. This means that the costs for electricity generation would be about 2.5-4 million USD. This is highly simplified, but gives an indication of investment costs. Directly using the gas for heating highly depends on the length of the pipelines required for the gas, but appears to be about half the costs for electricity, for similarly-sized projects. An actual assessment would highly depend on the circumstances of the project and would require specific calculations. (USEPA, 2015)
Compost
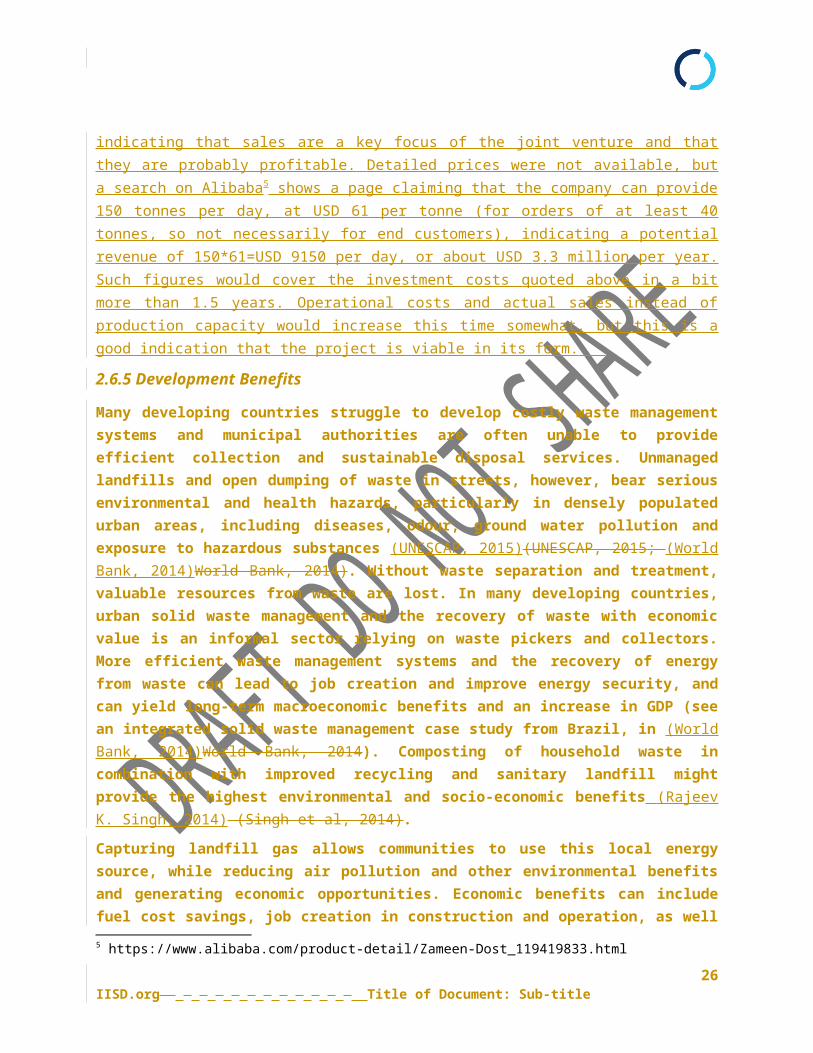
Here, we again scale up the costs of the Lahore in the same way we scaled up the volumes treated. The investment costs of the Lahore facility are 5.52 million USD (ESMAP, 2010). This means that the total investment costs for the four facilities (Karachi, Lahore, Faisalabad, and Rawalpindi) would be about USD 19 million. The price of building a new facility of similar capacity (or several totalling the same capacity) would need to take into account inflation. A rough estimate of having such an installation being built about 10 years after the Lahore with an inflation rate of 4% (a bit lower than the 5% estimated projections of the IMF (IMF, 2015)) would mean that the new facility would cost about 50% more, or 8.28 million USD, for a total of 13.8 million USD. While costs of operation were not available, the Lahore case contains a number of interesting pieces of information that indicate that composting has a good business case and can be self-sufficient. The Lahore project is actually a public-private partnership (PPP) between Saif Holdings Limited (SHL), one of the largest industrial conglomerates in the country, and the City District Government of Lahore (CDGL). (The World Bank Group, 2016) This joint venture is called Lahore Compost Limited and sells the compost as a fertilizer under the name of Zameen Dost, with strong marketing efforts4, indicating that sales are a key focus of the joint venture and that they are probably profitable. Detailed prices were not available, but a search on Alibaba5 shows a page claiming that the company can provide 150 tonnes per day, at USD 61 per tonne (for orders of at least 40 tonnes, so not necessarily for end customers), indicating a potential revenue of 150*61=USD 9150 per day, or about USD 3.3 million per year. Such figures would cover the investment costs quoted above in a bit more than 1.5 years. Operational costs and actual sales instead of production capacity would increase this time somewhat, but this is a good indication that the project is viable in its form.
4 Some elements do not contain organic matter and would not increase compost yield anyway5 In some cases there can be no benefits and separation at a central facility can be better regardless of issues of getting households to properly sort their waste, as was discussed in the previous paragraph
20IISD.org Title of Document: Sub-title

2.6.5 Development Benefits
Many developing countries struggle to develop costly waste management systems and municipal authorities are often unable to provide efficient collection and sustainable disposal services. Unmanaged landfills and open dumping of waste in streets, however, bear serious environmental and health hazards, particularly in densely populated urban areas, including diseases, odour, ground water pollution and exposure to hazardous substances (UNESCAP, 2015)(UNESCAP, 2015; (World Bank, 2014)World Bank, 2014). Without waste separation and treatment, valuable resources from waste are lost. In many developing countries, urban solid waste management and the recovery of waste with economic value is an informal sector relying on waste pickers and collectors. More efficient waste management systems and the recovery of energy from waste can lead to job creation and improve energy security, and can yield long-term macroeconomic benefits and an increase in GDP (see an integrated solid waste management case study from Brazil, in (World Bank, 2014)World Bank, 2014). Composting of household waste in combination with improved recycling and sanitary landfill might provide the highest environmental and socio-economic benefits (Rajeev K. Singh, 2014) (Singh et al, 2014).
Capturing landfill gas allows communities to use this local energy source, while reducing air pollution and other environmental benefits and generating economic opportunities. Economic benefits can include fuel cost savings, job creation in construction and operation, as well as improved economic development near landfills. Environmental and social benefits include safer landfills with reduced odours and air pollution. Moreover, waste resources can be captured to provide access to a reliable local fuel source that may displace fossil fuel use for landfill operations, for electricity production or heating. (US EPA, 2008)(US EPA, 2008; (US EPA,2006)US EPA, 2010)
The high percentage of organic waste in municipal solid waste streams presents a considerable opportunity of turning waste in a valorised resource (UNESCAP, 2015) (UNESCAP, 2015). Composting can have important environmental and agricultural benefits when applied to the soil, increasing nutrients and moisture, improving plant quality and soil structure (UNESCAP, 2013)(UNESCAP, 2013). Using compost reduces the
21IISD.org Title of Document: Sub-title

need for chemical fertilizer, while increasing crop yields, hence reducing farmers’ expenses and benefitting both the environment and food security (UNESCAP, 2015)(UNESCAP, 2015). Recycling of organic waste in a decentralised and pro-poor manner can provide important livelihood opportunities for rural communities by creating formal job opportunities at better working conditions, reduce the spread of vectors, diseases and odours and improve hygiene, reducing cost of landfilling and improving crop yields through organic fertilizer (UNESCAP, 2013)(UNESCAP, 2013). Experience from community-led waste management projects show that composting systems can empower communities and women in particular, who often make up the largest group of waste pickers and benefit from better working conditions, a formal income, and better health (UNFCCC,2005)(UNFCCC, 2010).
Experience from decentralised and integrated resource recovery centres (IRRCs) show that “every ton of CO2e reduced composting projects in developing countries can generate co-benefits in a range between USD 93.82 and USD 184.21 [excluding benefits] related to public health arising from avoided pollution and spread of diseases” (UNESCAP,2015):23(UNESCAP, 2015: 23). These social, economic and environmental benefits include job creation and additional income for waste pickers employed in compost plants, many of which are women; municipal cost savings related to avoided landfilling; savings in chemical fertilizer use (25% reduction), savings in fertilizer subsidies, and increased crop yields (ibid: 25). The first Pakistani IRRC promoted by the United Nations Economic and Social Commission for Asia and the Pacific (UNESCAP) was launched in September 2015 in Islamabad and will undoubtedly generate similar co-benefits (see Table 3Figure XX).
Highly positivePositive
Climate EconomicSocial Environment
22IISD.org Title of Document: Sub-title

Abat
emen
t pot
entia
l (2
020
ktCO
2)Ab
atem
ent c
ost (
2020
U
SD/t
CO2)
Clim
ate
resil
ienc
e
GDP
/ m
acro
econ
omic
im
pact
(pro
ducti
vity
)En
ergy
secu
rity
End-
user
impa
ct (c
ost
savi
ngs)
Empl
oym
ent
Wor
king
cond
ition
s
Heal
th
Gend
er e
qual
ity
Redu
ced
air p
ollu
tion
Was
te st
ream
(w
ater
/so
lid)
Landfill gasCollecting landfill gas for energy use by drilling vertical wells
*
CompostComposting collected municipal solid waste in facilities connected to landfillsTable 3: Co-benefits of waste options
2.6.6 Climate Resilience ImpactsThe main element to consider for these options to be safe from the impact of climate change is that the facilities they are located at should not be in (future) flood zones.
2.7 POTENTIAL POLICY MEASURES AND INSTRUMENTS
Figure 3: Elements needed for successful landfill gas or compost projects
The two selected options are relatively similar in terms of what they need and of how they can be organised. Their requirements can essentially be placed into three categories, as illustrated in Figure 3. First, they to secure a supply of waste through sorting and collecting. Second, they need to finance their infrastructure, namely sanitary landfills and their supporting infrastructure such as sorting installations and gas pipelines for distribution. Third, they need to conquer the market to generate revenue to support their operational costs and recover the investment in infrastructure. This mix of roles and focusses means that one
23IISD.org Title of Document: Sub-title

interesting possibility to organise the chosen options is to create public-private partnerships (PPPs) in the form of joint ventures such as Lahore Compost Limited, as already discussed in Section 2.6.4 Costs. Having such a partnership would increase the chances of raising the capital necessary to finance the infrastructure. It would also allow the parties to focus on the elements they can deliver best. Securing the supply requires a large-scale, sustained effort that needs to reach millions of households for many years, which makes local governmental organisations a good fit as a task leader. In contrast, the market for products (fertilizer, heat, electricity) requires competing against many established players and requires a certain degree of reactivity and flexibility. As such, private companies are a good fit to take the lead. Both these leading roles can be supplemented by a supporting role from the other party: Private parties can also participate in awareness efforts (for example by emphasising the origin of their products) and government institutions help set up the right market conditions for the generated products.
2.7.1 Secure supply
To secure a steady and large volume of supply, one needs to ensure that the collection rates of municipal solid waste increase from their current levels. This involve both actions from households and companies that should throw their waste into proper collection facilities, as well as from collecting organisations that need to collect the waste and deliver it at processing facilities. Financial actions can be to allow different tipping fees (i.e. the fee that the waste producer pays to the waste management company). This would make it financially interesting to bring waste to compost or landfill gas treatment facilities. (UNESCAP, 2015)
For compost, the waste also needs to be sorted: Recyclable elements such as glass, metals, plastics and (clean) paper are valuable on their own and should not be composted6. This separation can either happen at the household level (with separate bins for waste), or in a central facility. The choice between sorting at a household level or centrally is not a straightforward one and depends on the local situation. Some of the elements to take into account are the composition off the waste (share of recyclable elements and of elements suitable for compost), the level of knowledge and willingness to comply of households, as well as the collection network configuration (density of possible sorting hubs, for example). (Richard, 1996) In the case where sorting at the household level is chosen, then some actions around awareness need to be taken. Households need to know that they are
6 There is no need to introduce a recover rate, as compost is processed differently from landfill gas.
24IISD.org Title of Document: Sub-title

expected to separate waste, they need to know how to separate waste (which things go into which bins), they need convenient ways to sort their waste (accessible bins that are regularly emptied to avoid situations where people cannot deposit paper because the bins for paper are already full), and they need to be shown the benefits of separating waste (lower fees for them, a better local environment, attractive products generated). The degree of effort needed and chances of success are a key element to decide where the separation needs to take place (see above). If this effort is too large compared to the benefits of sorting at the collection point7, then separation should happen at a central facility.
These elements (awareness, knowledge, convenience of infrastructure, and willingness to cooperate) need to be present anyway in order to increase collection rates, but they each have lower thresholds for simple collection than for sorting at the collection point. As for collecting organisations (which also include individuals making a living of collecting waste), they can be financially incentivised to deliver waste to the compost or landfill gas by getting more interesting prices than other options they might have. These interesting prices would be supported by the end products that bring in the revenue (fertiliser, heat, electricity). Awareness programs and information campaigns can be help the proposed options both at the operator and at the citizen levels. At the operator level, efforts should focus on awareness of the possible options and their benefits, as well as the sharing of best practices between operators. At the citizen level, they can focus on waste separation, with a focus on separating waste from food from other waste through information campaigns and providing citizens with the means to separate waste (separate collection and installing separate bins). This would provide waste that can deliver better-quality compost and landfill gas, making the proposed options more interesting from an economic point of view.
2.7.2 Finance infrastructure
As previously mentioned, they key missing element for the options mentioned here is to have proper waste management, namely sanitary landfills. The key challenge here is to secure relatively large amounts of investments, as each facility would need to have a relatively large scale to be profitable.
Having a proper assessment of the amount of waste that will be collected is an important aspect to decide on the size of the treatment facility, as a too large facility would require importing waste from other locations, while a too small facility would fail to capture all the potential value of the waste stream an might not be profitable. (Richard, 1996)
7 Based on the same growth as above and the fact that The Lakhodair in Karachi is 11 acres (1 acre= 4046.856 square meters) (DAWN, 2014)
25IISD.org Title of Document: Sub-title
The key solution to this issue is to ensure that the value of these facilities is clear, especially in terms of potential revenues. Having a good potential business case in place will help bring various partners (private sector, but also possibly international players) on board to build the necessary infrastructure.
2.7.3 Conquer market
One of the identified causes for the failure of compost plants is the lack of attention given to marketing the end product (UNESCAP, 2013). As was explained in Section 2.6.4 Costs, Lahore Compost Limited actually made considerable marketing efforts. This is a good indication that partnering with private companies can help solve some of the issues landfill gas and compost installations might face to produce a profit. Such a partnership ensures that the end products (fertilizer, heat, electricity) benefit from all the tools (marketing, flexibility in pricing) as their widespread competition does. Public entities also have a role here: They can ensure that the generated products enter the market with favourable conditions. Concretely, this can mean the creation of feed-in tariffs, i.e. a requirement for utilities to purchase the electricity produced at the site, with long-term contracts that reflect the production costs for electricity from waste. Setting these tariffs at the right (UNESCAP, 2015)
A specific decision that needs to be made for compost is regulating its quality. This will balance the amount of contaminants that are allowed in the compost (and the associated environmental impact) versus an increased yield, since setting higher quality standards would mean rejecting more of the collected waste, thereby reducing revenue. This decision needs to take into account characteristics such as the waste composition, the business case for the compost facilities, and the possibility of taking mitigation measures (such as recycling and removing toxic products form the waste stream) (Richard, 1996) This decision about quality can also be turned into an advantage for compost-based fertilisers, as federal and local government entities could introduce standards, quotas, or procurement criteria (i.e. they would require that sustainable fertilisers are used for products they purchase) for sustainable fertilisers such as compost-based ones.
2.7.1 Financial incentives
Both options could receive g Certified Emission Reductions (CERs) certificates under the Clean Development Mechanism (CDM). One important point is that to qualify for CERs, projects must demonstrate that they would not proceed without CERs. This means that laws mandating the capture of landfill gas or composting would disqualify projects from this source of income. China has successfully applied for CERs for the capture of landfill gas, but new regulations about landfill gas capture and flaring raise questions about the eligibility of future projects.
26IISD.org Title of Document: Sub-title

Other financial incentives include tax relief instruments for operators that start the projects in question, and favourable market conditions (feed-in tariffs, purchase obligations from utilities, selection criteria in government tenders, etc.).(IEA, 2009)2.7.2 Awareness/education
Awareness programs and information campaigns can be help the proposed options both at the operator and at the citizen levels. At the operator level, efforts should focus on awareness of the possible options and their benefits, as well as the sharing of best practices between operators. At the citizen level, they can focus on waste separation, with a focus on separating waste from food from other waste through information campaigns and providing citizens with the means to separate waste (separate collection and installing separate bins). This would provide waste that can deliver better-quality compost and landfill gas, making the proposed options more interesting from an economic point of view.
2.8 CONCLUSIONSComposting waste and reclaiming landfill gas have the potential to save about 0.75 million tonnes CO2e per year by 2030. This potential can only be reached with a great effort that would represent a dramatic change of what waste management is in Pakistan. This is particularly challenging, given the lack of current waste management in Pakistan. For this reason, it is important not to consider the options solely as ways of reducing greenhouse gas emissions. Rather, they should be viewed as an extra benefit of an effort that would bring a better environment to Pakistani citizen, with great health benefits some good side economic benefits brought by compost and landfill gas.
27IISD.org Title of Document: Sub-title

ANNEX 1 – FACTSHEETSFactsheet 1
Factsheet 2
Factsheet 3
28IISD.org Title of Document: Sub-title

REFERENCESBogner, J. M. (2007). Waste Management, In Climate Change 2007:
Mitigation. Contribution of Working Group III to the Fourth Assessment Report of the Intergovernmental Panel on Climate Change. Retrieved April 26, 2016, from IPCC: https://www.ipcc.ch/pdf/assessment-report/ar4/wg3/ar4-wg3-chapter10.pdf
ChartsBin. (2011). Daily Protein Intake Per Capita. Retrieved November 19, 2015, from http://chartsbin.com/view/1155
DAWN. (2014, January 13). Infrastructure for first sanitary landfill complete. Retrieved November 24, 2015, from DAWN.com: http://www.dawn.com/news/1080229
DAWN. (2016, April 19). First sanitary landfill site operational in Lahore. Retrieved April 27, 2016, from http://www.dawn.com/news/1253061/first-sanitary-landfill-site-operational-in-lahore
ESMAP. (2010, April). Good practices in city energy efficiency Lahore, Pakistan- Solid Waste Composting. Retrieved November 24, 2015, from https://www.esmap.org/sites/esmap.org/files/CSLahore_Pakistan_final_042910.pdf
FAO. (2015). Food balance sheets by country. Retrieved November 19, 2015, from http://faostat3.fao.org/browse/FB/FBS/E
IEA. (2009, January). Turning a Liability into an Asset: the Importance of Policy in Fostering Landfill Gas Use Worldwide. Retrieved December 2, 2015, from https://www.iea.org/publications/freepublications/publication/landfill.pdf
IMF. (2015, March). Pakistan inflation data. Retrieved November 24, 2015, from https://www.imf.org/external/pubs/ft/weo/2015/01/weodata/weorept.aspx?sy=2006&ey=2020&scsm=1&ssd=1&sort=country&ds=.&br=1&pr1.x=49&pr1.y=15&c=564&s=PCPI%2CPCPIPCH%2CPCPIE%2CPCPIEPCH&grp=0&a=#download
IPCC. (2006). 2006 IPCC Guidelines for National Greenhouse Gas Inventories Volume 5 Waste. Retrieved November 17, 2015, from http://www.ipcc-nggip.iges.or.jp/public/2006gl/vol5.html
Masood, F. (2013, June 12). Solid Wastes Use as an Alternate Energy Source in Pakistan. Retrieved December 1, 2015, from
29IISD.org Title of Document: Sub-title

https://www.theseus.fi/xmlui/bitstream/handle/10024/63342/farhan%20masood%20thesis.pdf?sequence=1
Masood, S. H. (2011, January). Evaluation of Kitchen Waste Composting and its Comparison with Compost Prepared from Municipal Solid Waste. Retrieved November 24, 2015, from Pak. J. Engg. & Appl. Sci. Vol. 8: http://www.uet.edu.pk/research/researchinfo/8-RJ-JULY-2011/8-Art-4.pdf
Ministry of Environment. (2005). National Environment Policy. Retrieved November 25, 2015, from http://environment.gov.pk/NEP/Policy.pdf
Ministry of Environment. (2006, September). National Sanitation Policy. Retrieved November 25, 2015, from http://www.environment.gov.pk/NEP/SanitationPolicy.pdf
National Assembly of Pakistan. (1997, September 3). Pakistan Environmental Protection Act. Retrieved November 24, 2015, from https://www.elaw.org/system/files/Law-PEPA-1997.pdf
PAK-EPA. (2005, June). (Draft) Guideline for Solid Waste Management. Retrieved November 24, 2015, from http://environment.gov.pk/EA-GLines/SWMGLinesDraft.pdf
PAK-EPA. (n.d.). Brief on Solid Waste Management in Pakistan. Retrieved November 17, 2015, from Pakistan EPA: http://environment.gov.pk/PRO_PDF/PositionPaper/Brief-SWM-%20Pak.pdf
Pakistan Bureau of Statistics. (1998). Population size and growth of major cities. Retrieved April 26, 2016, from http://www.pbs.gov.pk/sites/default/files//tables/POPULATION%20SIZE%20AND%20GROWTH%20OF%20MAJOR%20CITIES.pdf
Rajeev K. Singh, H. Y. (2014, November 4). Potential Benefits Of Introducing Integrated Solid Waste Management Approach In Developing Countries: A Case Study In Kathmandu City. Retrieved April 28, 2016, from Journal of Sustainable Development Vol 7 No 6: http://ccsenet.org/journal/index.php/jsd/article/download/40131/22987
Richard, E. Z. (n.d.). MUNICIPAL SOLID WASTE COMPOSTING: ISSUES IN POLICY & REGULATION. Retrieved April 28, 2016, from Cornell Waste Management Institute: http://compost.css.cornell.edu/MSWFactSheets/FS6MSW.pdf
The World Bank Group. (2016). Pakistan, Islamic Republic of: Lahore Composting (Danish Carbon Fund) . Retrieved April 27, 2016, from https://wbcarbonfinance.org/Router.cfm?Page=Projport&ProjID=43057
Un Habitat. (2015, September 17). Media Briefing and Inauguration Ceremony of Pakistan’s First IRRC in Islamabad. Retrieved April 28,
30IISD.org Title of Document: Sub-title
2016, from Un Habitat: http://www.unhabitat.org.pk/home/media-briefing-and-inauguration-ceremony-of-pakistans-first-irrc-in-islamabad/
UN Habitat. (2015, January 6). Setting-up an Integrated Resource Recovery Center in Islamabad’s Sector G-15. Retrieved April 28, 2016, from http://www.unhabitat.org.pk/home/wp-content/uploads/2015/01/06-Setting-up-an-Integrated-Resource-Recovery-Center-in-Islamabad%E2%80%99s-Sector-G-15.pdf
UNESCAP. (2013, October 11). Decentralized and Integrated Resource Recovery Centers in Developing Countries: Lessons Learnt from Asia-Pacific. Retrieved April 28, 2016, from http://www.unescap.org/sites/default/files/Paper_ESCAP%20paper%20on%20IRRC%20ISWA%20Congress.pdf
UNESCAP. (2015). Valuing the sustainable development co-benefits of climate change mitigation actions: The case of the waste sector and recommendations for the design of nationally appropriate mitigation actions (NAMAs). Retrieved April 28, 2016, from http://www.unescap.org/sites/default/files/Valuing%20the%20Sustainable%20Dev%20Co-Benefits%20%28Final%29.pdf
UNFCCC. (2005, December 9). Project Design Document for Composting of Organic Waste in Dhaka. Retrieved April 28, 2016, from Project 0169 : Composting of Organic Waste in Dhaka : https://cdm.unfccc.int/filestorage/3/Q/B/3QBI7J8O3ZD1UQYIIIDO71F0WAB6G0/BGD0402_PDD_WWR_v17_0%20final.pdf?t=UWd8bzZjZzJwfDDNI2Hoz2mzr1L50IhSrQOY
US EPA. (2006, February). Landfill Gas: Creating green energy in your community. Retrieved April 28, 2016, from http://nepis.epa.gov/Adobe/PDF/60000DEQ.pdf
US EPA. (2008, December). Landfill Gas Energy Fueling the Economy and a Sustainable Energy Future While Improving the Environment. Retrieved April 28, 2016, from http://nepis.epa.gov/Exe/ZyPDF.cgi/P1003UGQ.PDF?Dockey=P1003UGQ.PDF
US EPA. (2015, February). LFG Energy Project Development Handbook. Retrieved November 30, 2015, from http://www3.epa.gov/lmop/documents/pdfs/pdf_full.pdf
Wikipedia. (2012, September 8). Comparison of anaerobic and aerobic digestion. Retrieved November 17, 2015, from Wikipedia: https://en.wikipedia.org/wiki/Comparison_of_anaerobic_and_aerobic_digestion
World Bank. (2014, June 1). Climate-smart development : adding up the benefits of actions that help build prosperity, end poverty and combat
31IISD.org Title of Document: Sub-title
climate change . Retrieved April 28, 2016, from http://www-wds.worldbank.org/external/default/WDSContentServer/WDSP/IB/2014/06/20/000456286_20140620100846/Rendered/PDF/889080WP0v10RE0Smart0Development0Ma.pdf
World Bank Group. (2015). Introduction to Wastewater Treatment Processes. Retrieved November 27, 2015, from http://water.worldbank.org/shw-resource-guide/infrastructure/menu-technical-options/wastewater-treatment
Zia, G. M. (2012). Wastewater Production, Treatment and Use in Pakistan. Retrieved November 27, 2015, from http://www.ais.unwater.org/ais/pluginfile.php/232/mod_page/content/134/pakistan_murtaza_finalcountryreport2012.pdf
The World Bank,. 2014. Climate-Smart Development. Adding Up The Benefits Of Actions That Help Build Prosperity, End Poverty And Combat Climate Change. Washington DC: The World Bank.
United Nations Economic and Social Commission for Asia and the Pacific (UNESCAP),. 2015. Valuing The Sustainable Development Co-Benefits Of Climate Change Mitigation Actions The Case Of The Waste Sector And Recommendations For The Design Of Nationally Appropriate Mitigation Actions (Namas). Bangkok.
United Nations Economic and Social Commission for Asia and the Pacific (UNESCAP),. 2013. Decentralized And Integrated Resource Recovery Centers In Developing Countries: Lessons Learnt From Asia-Pacific. Paper Presented At The 2013 ISWA Congress, 7-11 October 2013. Vienna.
Singh, Rajeev K., Helmut Yabar, Takeshi Mizunoya, Yoshiro Higano, and Randeep Rakwal. 2014. "Potential Benefits Of Introducing Integrated Solid Waste Management Approach In Developing Countries: A Case Study In Kathmandu City". Journal Of Sustainable Development 7 (6): 70-83.
United States Environmental Protection Agency (US EPA),. 2010. Landfill Gas Energy Fueling The Economy And A Sustainable Energy Future While Improving The Environment. Washington DC.
United States Environmental Protection Agency (US EPA),. 2008. Landfill Gas Energy. Creating Green Energy In Your Community. Washington DC.
32IISD.org Title of Document: Sub-title

ENDNOTES
33IISD.org Title of Document: Sub-title
Emphasis TextIs places here

© 2015 International Institute for Sustainable Development Published by the International Institute for Sustainable Development.
The International Institute for Sustainable Development (IISD) is one of the world’s leading centres of research and innovation. The Institute provides practical solutions to the growing challenges and opportunities of integrating environmental and social priorities with economic development. We report on international negotiations and share knowledge gained through collaborative projects, resulting in more rigorous research, stronger global networks, and better engagement among researchers, citizens, businesses and policy-makers.
IISD is registered as a charitable organization in Canada and has 501(c)(3) status in the United States. IISD receives core operating support from the Government of Canada, provided through the International Development Research Centre (IDRC) and from the Province of Manitoba. The Institute receives project funding from numerous governments inside and outside Canada, United Nations agencies, foundations, the private sector, and individuals.