Embed Size (px)
Citation preview


SSFP Market Survey Report 2
Abbreviation, Acronyms and Definitions
ANC Antenatal Care
BBS Bangladesh Bureau of Statistics
BCC Behavioral Change Communication
BDT Bangladesh Taka (Currency)
CBSG Capacity Building Service Group
Customer Household received any service by visiting SS clinic in last two years preceding
the survey
EmOC Emergency Obstetric Care
ESP Essential Service Package
FGD Focus Group Discussion
H/C Poor Hard Core Poor
HH Household
HIES Household Income Expenditure Survey
HQ Head Quarter
HR Human Resource
HSC Higher Secondary Certificate
IMCI Integrated Management of Childhood Illness
LCC Limited Curative Care
MBBS Bachelor of Medicine and Bachelor of Surgery
MCWC Mother and Child Welfare Center
MIS Management Information System
MOCAT Modified Organizational Capacity Assessment Tool
MRP Maximum Retail Price
N/A Not Applicable
NGO Non Government Organization
NGO Type NGO managing less than 6 clinics is termed as Small NGO, managing between 6
and 14 clinics is termed as Medium NGO and managing more than 14 clinics is
termed as Big NGO
NSDP NGO Service Delivery Program
OD Organization Development
OT Operations Theatre
PNC Postnatal Care
PNGO Partner Non Government Organization
PoP Card Special facility card distributed to the Poorest of the Poor by NSDP in the clinic
catchments area
RH Reproductive Health
Regular
Customer
HH visited SS clinic during the six month proceeding to the survey with sickness
(visits for Family planning and immunization services are not included)
SP Service Promoter
SPO Service Promotion Officer
SSFP Smiling Sun Franchise Program
TA Technical Assistance
TV Television
UHC Upazila Health Complex
UHFWC Union Health and Family Welfare Centre
USAID United States Agency for International Development
WTP Willingness to Pay

SSFP Market Survey Report 3
Key Information from the Market Survey
Key Information from HH Survey Variable Rural Urban Overall
No. of HH Surveyed 720 900 1620
Population covered 3420 4208 7628
HH size 4.75 4.68 4.71
Sex Ratio1 98 103 101
% of Under five population 10.5 10.1 10.3
% of Females of reproductive age 51.9 57.0 54.7
% of Population (20 – 39) age group
Female 31.1 35.5 33.5
Male 27.6 32.4 30.2
% of population fell sick (at least once) in last six months 46.1 49.8 48.2
% of HH received SS service - Customer 50.01 51.0 50.6
% of PoP card holder among the customers 11.4 17.4 14.8
% of customer visited SS clinic in last six months 19.2 18.8
% of customer visited SS clinic in last six months with
LCC/general sickness
62.9 53.4
% of customer visited SS clinic in last six months for
maternal diseases
7.9 20.5
% of customer choose Pharmacy as treatment source in last
six months
36.9 31.0
% of customer visited Pharmacy as treatment source in last
six months
50.8 33.5
% of customer choose qualified doctor as treatment source
in last six months
15.1 20.8
% of customer visited qualified doctor as treatment source
in last six months
18.9 29.0
% of HH below lower poverty line 27.2 17.8
% of HH below upper poverty line 37.9 24.6
% of Rich2 HH 19.2 21.6
% of Non Customer aware about SS logo 89.4 87.3
% of Respondent read newspaper regularly 5.4 12.8
% of Respondent listen radio regularly 5.1 4.8
% of Respondent watch TV regularly 40.5 67.8
Average treatment cost per HH in last six months in BDT
Customer 724 1030 866
Non
Customer 729 1539 1101
1 Sex ratio is the number of males per 100 females 2 HH monthly income BDT 10000+ (rural), BDT 15000+ (urban)

SSFP Market Survey Report 4
Variable Rural Urban
% of Market share for LCC/general sickness 10.7 9
% of Market share for Maternal Health 35.1 48.4
% of Market Share for Gastric/Abdominal
problem
16.3 11
Willingness to pay is highest EmOC
Lab Test
Most appealing features of SS clinic Behavior
Affordability
Weakest aspect of SS clinic Service Range
Skill of service provider
Key Information from Clinic Survey
Rural Urban Comprehensive
Daily Customer Flow 41 55 87
Average Annual Operation Cost (BDT million) 1.7 1.4 3.3
Fixed Cost in percent 67 86 80
Cost recovery in percent 22 32 44
Average number of staff per clinic 17.5 14.6 26.6
Key Information from NGO Survey
Small NGO Medium NGO Big NGO
Dependency of SSFP in percent 36 40 26
Program over head in percent 16.2 13.2 10.4

SSFP Market Survey Report 5
Acknowledgement
Capacity Building Service Group (CBSG) carried out the market survey of Smiling Sun Franchise Program under
the direction of Bill Kedrock, Chemonics’ Business Planning Specialist who had been very instrumental from the
designing the tool to the analysis of the survey results. This survey report is the result of a co-operative and
mutually supportive exercise among CBSG, Chemonics, SFFP, and the partners NGOs.
CBSG takes the pleasure to thank the staff of SSFP, Chemonics International and the partner NGOs but in
particular to Mr. James Griffin, Director, International Health Group, Chemonics Inc, USA and Project Director,
SSFP for conceptualizing the survey and providing technical input during the design stage of the survey. Special
thanks are due to the staffs of SSFP for their input in survey tool finalization. Mr. Jalaluddin Khan, Franchise
Manager, SSFP Dr. Umme Salma Jahan Meena, deserve special appreciation for investing their valuable
personal time into this survey design.
Mr. Juan Carlos Negrette, Chief of Party, SSFP has been very instrumental in taking the painstaking job of
reviewing the preliminary findings and providing some every insightful comment which have contributed
enormously in shaping this report.
Special thanks are due to partner NGOs staffs for their support during fieldwork. We gratefully acknowledge their
contribution to make this survey a success. It was refreshing to meet each one of them personally.
Finally, while acknowledging the valuable inputs of all the above, CBSG owns the data, analysis and conclusions
reached from the surveys and believe them to be a sound response to the information available. However, CBSG
recognizes that the findings, analysis, and conclusion including any errors and omissions contained within this
report are of its own.

SSFP Market Survey Report 6
Table of Content
1 Introduction ................................................................................................................. 12
2 Methodology ............................................................................................................... 15 2.1 Sampling .................................................................................................................................................15 2.2 Coverage .................................................................................................................................................16 2.3 Organization of the Report ......................................................................................................................16
3 Findings of Household Survey and Focus Group Discussions with Households ....... 17 3.1 Background Characteristics of Household Heads and Household Members ..........................................17 3.2 Level of Use of Media and Type of Media Used by the Respondents ....................................................25 3.3 Disease Profile, Source of Healthcare, and Reasons for Choosing Provider ..........................................27 3.4 Cost of Healthcare Incurred and Willingness to Pay for Healthcare. .....................................................30 3.5 Knowledge, Attitude and Perception about Services of SS Clinics ........................................................32 3.6 Market Size and Regular Customer ........................................................................................................36
4 Findings of the Clinic Survey ..................................................................................... 38 4.1 Background of SS Clinic .........................................................................................................................38 4.2 Utilization of Clinic Services ..................................................................................................................39 4.3 Human Resource .....................................................................................................................................44 4.4 Clinic Operating Cost ..............................................................................................................................46 4.5 Clinic Revenue ........................................................................................................................................48 4.6 Physical Condition of Clinics..................................................................................................................50 4.7 Local Level Awareness Development and Market Promotion ...............................................................52 4.8 Health Mart Feasibility ...........................................................................................................................53 4.9 Smiling Sun Clinic: Competition Scenario .............................................................................................54
5 Findings of the NGO Survey ...................................................................................... 56 5.1 General Profile of SSFP Partner NGOs ..................................................................................................56 5.2 Human Resources and their management ...............................................................................................57 5.3 Financial Management of NGOs ............................................................................................................59 5.4 Analysis of Bridge Grant Budget ............................................................................................................61 5.5 Organizational Development and Change ..............................................................................................63
6 Key Findings and Implications ................................................................................... 66 6.1 Key Findings ...........................................................................................................................................66 6.2 Policy and Program Implications of the Market Survey .........................................................................72
Annexes to the report: Annex A: Selected tables from HH survey
Annex-B: Selected tables from Clinic survey
Annex-C: Selected tables from NGO survey
Annex-D: Implication of the survey findings for SSFP business plan
Annex-E: Poverty estimation for economic categorization
Annex-F: Additional information on pricing, willingness to pay and media habits
Annex-G: Data collection instruments of the survey

SSFP Market Survey Report 7
Executive Summary
The Smiling Sun Franchise Program aims to maintain and expand the availability of sustainable NGO health
services and products in a way that reduces reliance on USAID funding for recurrent costs; and to expand the
availability of key family planning and health products and services to the poor, thereby continuing to achieve the
population and health targets of the Government of Bangladesh and USAID. USAID/Bangladesh has determined
that a franchise program built around the current NSDP network would allow for the sharing of costs associated
with marketing among all the clinics and provide a system to cross-subsidize services for the poor and rural
communities. Thus NSDP program have transformed in a new program called Smiling Sun Franchise Program
(SSFP). The new program wants to translate the vision into a working strategy through preparing a sound and
reality based business plan. The purpose of the present study is to provide the empirical basis for formulating an
appropriate business plan. The broad issues under the study were: how to further increase of services, to increase
economic efficiency, and enhance financial sustainability of the clinics.
The specific objectives of the study were:
To assess demand for services of clinics under the program as at present and potential for increasing
demand among all socio-economic groups of population in the catchment areas.
To assess how user changes can be raised and identify the differentiation of packages of service needs.
To assess capacity of the clients, deliver services and quality of services delivered.
To examine the input and cost structure of the clinics and assess the potential for reducing per unit cost of
services.
To assess the system of management and governance of clinics and NGOs.
The Market Survey adopted a combination of social and statistical research methodologies to collect maximum
possible amount of information and exhume the facts in details about the realities. Methods adopted in this survey
were HH Survey, FGDs, Clinic Survey, Competitors Mapping, and NGO Survey.
Major Findings of the HH Survey
Characteristics of households: In the rural areas the proportion of hard-core poor households is as high as 27
percent, the proportion of absolute poor is 11 percent, and that of the rich is 20 percent. The proportion of
customers is higher in the lower income groups than in the upper groups in both rural and urban areas. However,
customers of SS clinics exist in all income groups in both rural and urban areas. The average monthly income of
the rich households is about twelve fold higher than that of the poorest households in the urban areas.
Media habit: Television is the main media used by the households in both rural and urban areas, but the
proportion of regular TV watchers is much higher in the urban areas. The proportion of customers watching TV is
almost same as that of non-customers. For most of the TV watchers in both groups in both areas, the favourite TV
watching time is 8-10 pm. The most preferred TV channel is BTV. The proportion of respondents listening to
radio and reading newspaper is miserably low in both areas.
Disease profile of population: About 80 percent of the people who were sick during the six months before the
survey suffered from three diseases: general sickness, water born diseases, and gastric. The proportion of people
suffering from general sickness was 61 percent, and the proportion was higher in the lower age groups, in both
areas. The incidence of general sickness was higher in the customer group than in the non-customer group, and it
was the most prevalent condition in all income groups for both areas. No discernible relationship is found
between income group and disease type; the patients of all diseases are considerably found in all income groups.
Choice of providers: Pharmacy is the main source of healthcare for the people of both groups in both areas. Even
among the customer households, 37 percent in rural areas and 31 percent in urban areas received healthcare from
the pharmacies. In the rural areas, SS clinics are the second most important source of healthcare and doctors are
the third important source for the customers. To the non-customers in the rural areas, doctors, govt. providers and
indigenous providers are the main sources of healthcare. In the urban areas, doctor is second most important
source and SS clinic is the third most important source for the customers, while to the non-customers doctor and
govt. providers are the most important sources of care, next only to pharmacy.

SSFP Market Survey Report 8
Level of satisfaction with care: The majority of households, which received care from the SS clinics or from
private doctors, were satisfied with care, but the majority of those using healthcare from govt. facilities,
pharmacy, and private clinics were not satisfied.
Healthcare expenditure and willingness to pay: The average amount of healthcare expenditure during the six
months was BDT 866 for all households which purchased health care in the rural areas and it was BDT 1101 in
the urban areas. The amount is not low given the average income of rural people. Thus, demand for healthcare
considerably exists in both areas.
Majority of the respondents expressed their willingness to pay more than 25 percent of current prices as additional
charges for almost all types of services in both groups in both areas, if the quality of services improves. Price
elasticity of demand is considerably high for almost all services and in both areas. But WTP did not considerably
vary by income or education or media habit.
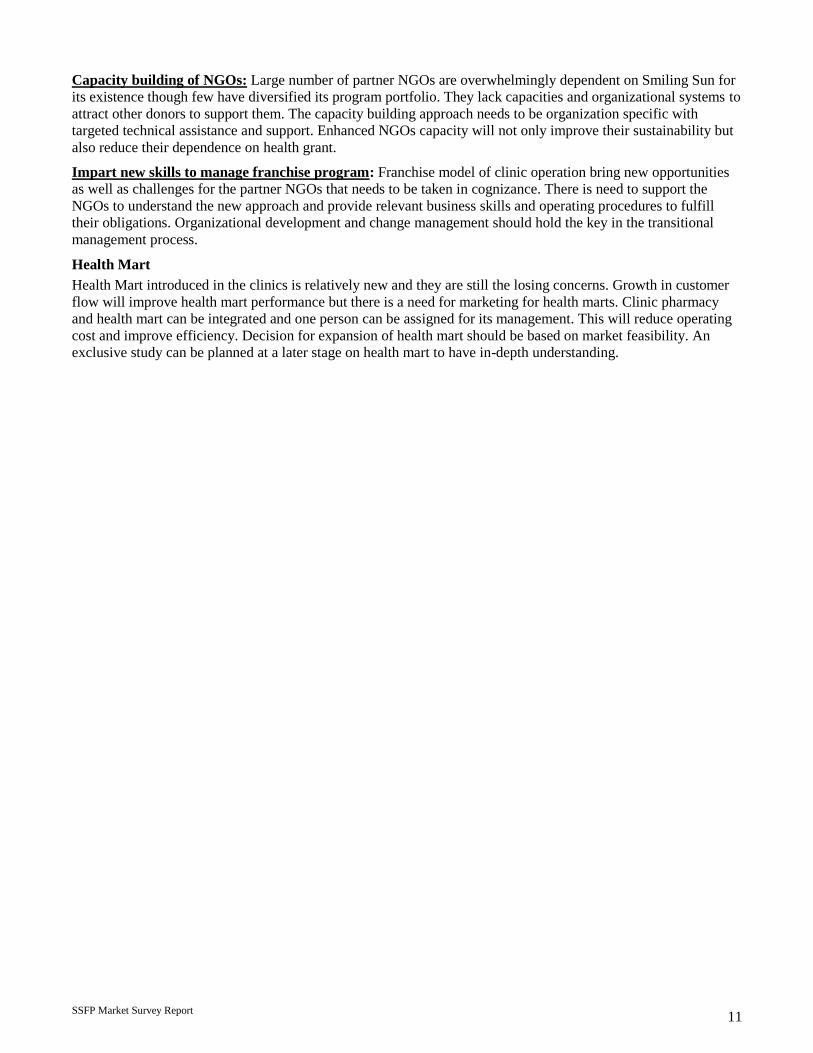
Knowledge, awareness and perception about SS clinics: The overwhelmingly majority of customers in both
areas know that the SS clinics provide child healthcare, maternal healthcare, and FP service. But the proportion of
customers who know that the clinics deliver some other services as well is low in both areas. The main sources of
information about the clinics were signboard at the clinic, billboard and the clinic staff in both areas. In the urban
areas a large number of respondents heard about the SS clinics from advertisement and drama in television, as
well.
Distinguishing features of SS clinic have been reception and advice is good, female doctors are available, poor
people can take free treatment, and behavior of doctors is good. About 90 percent of non- customers in both areas
are familiar with the SS clinics. But, interestingly, they do not use healthcare from the SS clinics for variety of
reasons that includes validity of options, lack of awareness on service availability and price.
Market size and regular customer: The SS clinics at present have only a share of 0.62 percent of the total health
care market in the catchment areas. The market share of the urban clinics is marginally higher (0.72). The
comprehensive clinics cover a larger portion of the market (1.60). Although about fifty percent of total
households under survey ever received healthcare from the SS clinics, regular customers – those who received
healthcare for their recent illness – constitute only 19 percent of the customers, or only about 10 percent of the
total population in the catchment areas.
Among those who received maternal healthcare from different sources, the proportion of women receiving care
from the SS clinics is quite high – 35 percent in the rural areas and 48 percent in the urban areas. The same is
partly true for the treatment of general sickness: among those who sought treatment for general sickness, the
proportion of the people who received the care from the clinics is considerably high, about 10 percent in both
rural and urban clinic areas.
Key Findings of the Clinic Survey
Service utilization: Capacity utilization at the Smiling Sun clinic system remains low which can be attributed to
limited service range, lack of qualified service providers, high competition from government facilities and local
pharmacies, and lack of sufficient demand for healthcare. Limited scope for drug prescription in the rural clinics
has also resulted in low customer demand for services. Customer flow is extremely low in the afternoon causing
significant downtime for service providers. Similarly, utilization of laboratory facilities remains low as clinic
customers are the only recipients of lab services with few exceptions. No effort was made to market lab services
widely.
General sickness (LCC) brings the highest proportion of customers in all types of Smiling Sun clinics, which is
followed by maternal health in the urban area and family planning for the rural clinics. Demand for family
planning services is relatively low in urban clinics.
Human resource: The staff pattern, especially the number of staff in various categories, varies between the types
of clinics. Average staff in comprehensive, urban and rural clinics was 26.6, 14.6 and 17.5 respectively. Staff turn
over was highest (65 percent) among the medical officers followed by that among clinic manager with medical
background. Paramedics were more stable with lower turnover.

SSFP Market Survey Report 9
Smiling Sun clinic staff had good access to training opportunities in the past but a significant amount of training
outcomes was lost due to high turnover. Existing service providers did not received adequate training on IMCI
and safe delivery, which have high market demand.
Clinic operating cost and revenue: Annual operating cost of comprehensive, urban and rural static clinics were
BDT 3.3, BDT 1.4 and BDT 1.7 million, respectively. Fixed operating costs of comprehensive, urban and rural
static clinics were 80%, 86% and 67% respectively. Cost recovery rate in comprehensive, urban and rural static
clinics was 44%, 32% and 22% respectively. About 50% of clinic earnings come from sale of services. 20% of
incomes of comprehensive clinics come from EmOC packages. Pathology was the 2nd most important earner for
urban clinic after service sales. One satellite session earns on average BDT 208 and BDT 490 in urban and rural
settings, respectively.
Physical condition and equipment needs more than half of the rural and urban clinics expressed the need for
installing Ultrasonogram and safe delivery facilities while the comprehensive clinics need ECG machine and
improved lab facilities. Clinic staff considers that the new equipments will have positive impact on clinic income.
Local level awareness development and market promotion: Smiling Sun clinics have a standard menu of local
level market promotion though all are not effective. Community level campaign and home visit are perceived as
the most effective methods for local level service marketing. Service promoters, who are responsible for local
level market promotion, lack adequate training and budgetary allocations to effectively conduct local level
promotional activities effectively. Same people and same approach cause monotony among the local people and
that results in low impact.
Health mart performance: Monthly sales volume in the health marts remains low with significant variations
among the clinics. Sales volume in the urban clinics was twice as much as rural clinics. Profit margin on sales was
estimated at around 10%. Profit on low sales volume does not cover the fixed operating cost, resulting in
operating loss in both urban and rural setting though loss is higher in the rural area.
Smiling Sun clinic: competition scenario
Govt. health facilities, private clinics and doctor’s chambers are the main competitors for SS clinics. All Smiling
Sun clinics have one or more competitors within three KM; in urban areas, 70% of the survey clinics have
competitors within 1 KM, while in rural areas 27% of clinics have competitors within 1 KM radius.
Govt. health service facilities are better on cost, service range, and service providers. On the other hand private
clinic have advantage in service providers and service range but cost is well above Smiling Sun clinic. NGO
service provider does not pose any serious competition to the Smiling Sun clinics.
Key Findings of the NGO Survey
Smiling Sun partners’ forms a heterogenious community NGOs as they vary in terms of size, institutional skills
and sustainability. However, one thing that makes them homogenous is their mission and competence. They are
considered as the most competent local NGOs in the field of health in Bangladesh and Smiling Sun constitute the
single largest program component for all the partner NGOs.
Average number of staff supported by Smiling Sun program at the NGO level varies by NGO types. On average
big NGOs have 13 staff (professional and support) at the HQs level. Medium and small NGOs have relatively less
number of staff. A large part of the staffs are responsible for monitoring, quality control and MIS.
14% of program expenditure is incurred at the NGO HQs. Of that amount personnel cost comprises more than
60%.
During the NSDP, standard system was inducted to the NGOs for financial and personnel management which the
NGOs have followed only for Smiling Sun program. These systems were not used for other activities of the
organization. The need for consistent use of standard organization wide financial management systems and
procedures remains an institutional gap for most of the NGOs.
NGOs lack some core skills like financial management, business management skills, marketing which are seemed
to be very essential for integral to the franchise management and NGO sustainability. Clinic level financial
management is very weak.

SSFP Market Survey Report 10
NGO management acknowledges the need for significant change in the management style and operating
procedures to implement the franchising program. Some of them also ventilated their concerns and reservation in
the new approach. Changing the “old mindset” by itself would be a major task for the SSFP.
Policy and Program Implications of the Market Survey
Increase number of customers and volume of income
Possible measures for increasing flow of customers would be to enhance service range leveraging on existing
LCC and maternal health service portfolio. Improving service providers’ profile and skill becomes a prerequisite
to expand the spectrum of service range. Training of paramedics on safe delivery, IMCI, etc. will enable them to
deliver better services. Besides, rural clinics capacity to prescribe more drugs needs to be ensured by training the
paramedics and or inducting a qualified doctor in the rural clinics even for part time. Similarly, in the urban
clinics, provision of specialist doctors in the afternoon will increase customer flow. Improved lab facilities will
have positive impact on customer flow if doctors are posted. Effective local level marketing supplemented by
national level brand building will complement to these activities for increasing customer flow.
Increase flow of customer of higher income group while maintaining current customers
Possible measures: Clinic will need to reposition its services with some distinction. Urban clinic can introduce
“SPECIALITY CLINIC” in the afternoon with a range of specialty service packages including Gynecology,
General Medicine etc. with strong back up support of diagnostic and Ultrasonogram facilities. Existing
comprehensive clinic can be introduced with the specialty clinic concept that can be replicated further based on
results. Repositioning strategy will be backed up by appropriate community based and mass media campaign.
Rationalizing clinic operating cost
Possible measures: Service promoters’ salary cost should not be considered as recurring cost (in the long run) as
this staff can be phased out over time with the completion of local level marketing, which needs to be time bound.
Again in the rural clinics, clinic manager and office assistant practically do the similar job. Simple automation
such as computerized accounting and information system can easily abolish position of office assistant leading to
considerable cost cut. Fees paid to non-clinic staff, particularly to the depot holder, is a variable cost and thus can
be controlled in a planned manner, meaning that the depot holder cost should be phased out gradually.
Staff and overhead rationalization at the NGO level
Possible measures: Shifting common functions such as monitoring and quality control to a third party
organization (may be the franchisor). In other words, HO based staffing pattern and level should be reconfigured
with a zero based approach and eliminate overheads, which can be effective if complemented by the franchisor
organization. HO staffing needs to be configured based on the number of clinics the NGO operates so as to
maintain a relatively standard overhead for each clinic.
Utilization of non-peak hour clinic time:
Increasing utilization of non-peak hours: Many customers are willing to come during non-peak hours provided
doctors are available and good service quality is ensured. In the rural area, part time doctors can be
employed/hired during the non-peak hour while in the urban area specialist doctors (gynecologist or other
discipline) can be hired during the same hour. This will improve service profile and clinic image, and thus
increase customer flow.
Firm up Smiling Sun brand image
Possible measures: Smiling Sun will need to formulate a policy on clinic signboard and use of logo in order to
avoid multiple identities. Communication strategy should maintain a balance in promoting clinic services and
should be contextually appropriate for urban and rural areas, population group etc. Depot holders need to be
reoriented to the extent possible so that they can as work as health promoters and not just as family planning
agents. Redefine the catchments area in the context of provision of health services. Service promotion activities
need to be extended beyond the boundaries of existing catchments areas.
SSFP Market Survey Report 11
Capacity building of NGOs: Large number of partner NGOs are overwhelmingly dependent on Smiling Sun for
its existence though few have diversified its program portfolio. They lack capacities and organizational systems to
attract other donors to support them. The capacity building approach needs to be organization specific with
targeted technical assistance and support. Enhanced NGOs capacity will not only improve their sustainability but
also reduce their dependence on health grant.
Impart new skills to manage franchise program: Franchise model of clinic operation bring new opportunities
as well as challenges for the partner NGOs that needs to be taken in cognizance. There is need to support the
NGOs to understand the new approach and provide relevant business skills and operating procedures to fulfill
their obligations. Organizational development and change management should hold the key in the transitional
management process.
Health Mart
Health Mart introduced in the clinics is relatively new and they are still the losing concerns. Growth in customer
flow will improve health mart performance but there is a need for marketing for health marts. Clinic pharmacy
and health mart can be integrated and one person can be assigned for its management. This will reduce operating
cost and improve efficiency. Decision for expansion of health mart should be based on market feasibility. An
exclusive study can be planned at a later stage on health mart to have in-depth understanding.

SSFP Market Survey Report 12
1 INTRODUCTION
Over the last three decades the health and population sector of Bangladesh has achieved remarkable progress in
many respects. The contraceptive prevalence rate has increased from 8% in 1975 to 58% in 2006. Fertility has
declined from 6.3 children per woman in early 1970s to 3.4 in early 1990s, and 3 in 2004. The growth rate of
population has declined from 3.5% in 1975 to 1.7% in 2006. The rates of immunization have increased to a high
level, so much so that some observers maintain that Bangladesh ha s achieved a miracle insofar as child
immunization is concerned. Maternal mortality rate has also declined, albeit at a slow pace. A number of
communicable diseases have been eliminated. A large infrastructure of health facilities has emerged, and a vast
army of manpower has been employed in the sector. As a result of all these, the life expectancy at birth of
population has increased from 27 in early 1970s to 63 years, and health status of the population has increased to a
substantial extent.
Despite these achievements, the sector faces a number of challenges. The population growth rate has to be
reduced further. Between 2005 and 2010, an additional 4-5 million couples have to be covered by the Family
Planning Program. While majority of women want no more children, only 7.2 % are using permanent long term
contraceptive methods, and among them only 5.8% use voluntary sterilization. The reliance on temporary
methods has made Family Planning Program relatively costly, dependent on highly intensive logistics, and
troubled by high method discontinuation and switching rates. The under5 mortality is still 88 per thousand live
birth. The neonatal deaths account for half of all under5 deaths. Maternal mortality is still high. Less than 5% of
pregnant women receive all three types of maternal care. 90% of births still occur at home and over 85% take
place without a skilled birth attendant. On the other hand, a large numbers of households in the remote areas and a
considerable number of poor and disadvantaged people still remain uncovered by modern health services; and
inequity in rising. The prevalence of non-communicable disease is increasing and a number of new communicable
diseases emerging. Quality of care, at least in the perception of clinics, is low. Most importantly, the financing
gap in the sector is widening, threatening sustainability of its performances and progress.
All these achievements and challenges adumbrate that the health and population sector of Bangladesh has already
achieved a lot, but it has to achieve a lot more in the near future.
Bangladesh health service system is characterized by large network of public sector health facilities, private for
profit facilities, and NGO facilities. NGOs represent a growing and increasingly high quality source of health care
for the government’s essential package of services, called Essential Service Delivery (ESD), which includes
provision of family planning services, antenatal care, childhood immunization, and other curative care and
treatment. The Ministry of Health and Family Welfare (MOHFW) of Bangladesh and donors realize that NGOs
can play an important role in assisting the government to fill in the gaps in the government’s service coverage.
The GOB has expanded its contracting with NGOs to deliver health services in areas which the government does
not have the capacity to serve.
USAID’s support for the development of NGO health services over the past three decades has created many
organizations that have the requisite technical and organizational skills to provide high quality health services, but
have limited financial sustainability. Through the NGO Service Delivery Program (NSDP), health services are
available to approximately 20 million people, or about 19 percent of the total population of Bangladesh.
The NGO Service Delivery Program (NSDP) evolved from several precursor programs initiated by the GOB (the
Health, Nutrition and Population Sector Program-HNPSP) and by USAID (the Rural Service Delivery Project and
the Urban Family Health Partnership). The goal of NSDP was to “enable Bangladeshi NGOs to become
technically and managerially self-sufficient in the provision of essential health services and to maximize NGO
access to non-USAID funding for essential service delivery.” NSDP was awarded as a Cooperative Agreement to
Pathfinder International in 2002 with a total budget of $60 million from USAID and a cost share of $2.24 million
from non-U.S. Government sources for the time period FY 2002-FY 2006. NSDP’s end date was September 30,
2007.
NSDP had four objectives:
expand the range and improve the quality of ESD packages;
increase the use of ESD packages, especially by the poor;

SSFP Market Survey Report 13
increase the capacity of NGOs to sustain clinic and community-based service provision, institutionally
and financially; and
influence the GOB policy to expand the role of NGOs as providers of the ESD package.
Results from the MEASURE surveys conclude that NGO service delivery has had an appreciable impact that
varies between urban and rural areas, between socio-economic groups, and between different services.
In 1997, the Office of Population, Health and Nutrition of USAID, Bangladesh recognized the importance of
measuring its service delivery impacts and initiated the Smiling Sun logo as the symbol of USAID funded NGO
clinics and services. About 90 percent of women in both NSDP and non-NSDP urban areas reported that they
have seen the Smiling Sun logo. Over 70 percent of women in rural NSDP areas reported that they have seen the
Smiling Sun logo, while in non-NSDP areas, it is over 45 percent. The Smiling Sun logo has become a powerful
marker for affordable, quality health services in Bangladesh.
NSDP’s end date had been extended one year from September 30, 2006 to September 30, 2007 to facilitate
USAID’s development of the follow-on program, and to provide additional time for NSDP to achieve targets and
graduate NGOs. An evaluation of the NSDP program was conducted in March 2006. The report mentioned the
following lessons to be learned:
Graduating NGOs from USAID dependence must be explicit from the beginning.
NGOs must increase their linkages with communities and services at the village level to increase their ability to
address key maternal, newborn, and neonatal health problems as well as reduce deaths due to acute respiratory
illness (ARI).
Clinic-level marketing efforts need to emphasize the availability of permanent and long-term family planning
methods to ensure that cost-effective contraception is available to those who choose these methods.
NGOs can greatly improve cost recovery and operating efficiency if given greater flexibility to use program
income for operating costs, reducing overhead costs, and by better management of drug funds. Furthermore,
NGOs need to increase the volume of services, undertake clinic level marketing, expand curative care for services
in demand by clients, and expand programs intended to identify and subsidize care for the poorest clients.
The challenge is to set up a mechanism for the clinics to recover greater costs, achieve more operational
efficiency, and increase client loads while still providing services to a segment of the poor population. Current
private expenditure on health is about 75 percent of the total health expenditure, and 85 percent of private
expenditure is out-of-pocket. Additional mechanisms to enhance cross-subsidization of clinics and services are
needed to enable urban clinics (with better cost recovery potential) to offset or subsidize rural clinics (with lower
cost recovery ability). Abandoning NGOs before they are financially more stable, however, could jeopardize the
considerable achievements these organizations have made to date. At this time, without subsidies for recurrent
costs, most NGOs would probably cease to provide health services or disappear within a few months.
Smiling Sun, the logo of current NSDP clinics is widely recognized for affordable, high-quality care. This
network of NGO services provides a potential nascent franchise operation. The development of a franchise will
ensure that the Smiling Sun network is managed by a Bangladeshi institution that will not depend on an external
project/funding for its survival. The current network of 317 clinics is large, covering urban and rural sites, and
there is excess capacity to allow for a growth in volume of services, especially in the area of curative care. While
the idea of social franchising is new in Bangladesh, there is a long history of managing health services in the
NGO sector, and certainly the capacity to quickly learn the skills needed to manage a social franchising operation.
Systems are already in place through NSDP to conduct monitoring for service quality.
The Smiling Sun Franchise Program aims to maintain and expand the availability of sustainable NGO health
services and products in a way that reduces reliance on USAID funding for recurrent costs; and to expand the
availability of key family planning and health products and services to the poor, thereby continuing to achieve the
population and health targets of the Government of Bangladesh and USAID. USAID/Bangladesh has determined
that a franchise program built around the current NSDP network would allow for the sharing of costs associated
with marketing among all the clinics and provide a system to cross-subsidize services for the poor and rural
communities.

SSFP Market Survey Report 14
Now Chemonics has replaced NSDP. It has been assigned with the tasks of carrying on with the activities for
implementing the Smiling Sun Franchise Program- SSFP and in order to do so successfully. Chemonics intends to
prepare a business plan for the program. The purpose of the present study is to provide the empirical basis for
formulating an appropriate business plan. The broad issues under the study were: how to further increase of
services, to increase economic efficiency, and enhance financial sustainability of the clinics.
The specific objectives of the study were:
To assess demand for services of clinics under the program as at present and potential for increasing
demand among all socio-economic groups of population in the catchment areas;
To assess how user changes can be raised and identify the differentiation of packages of service needs;
To assess capacity of the clients, deliver services and quality of services delivered;
To examine the input and cost structure of the clinics and assess the potential for reducing per unit cost of
services;
To assess the system of management and governance of clinics and NGOs.

SSFP Market Survey Report 15
2 METHODOLOGY
The Market Survey adopted a combination of social and statistical research methodologies to collect maximum
possible amount of information and exhume the facts in details about the realities. Thus, it has drawn upon both
qualitative and quantitative research approaches. Specifically speaking, the research included HH Survey, FGDs
at HH level, Clinic Survey and Competitors Mapping, and NGO Survey.
2.1 Sampling
A simple, straightforward and scientific sampling procedure has been followed to determine a representative
sample size for the Market Survey. Cluster sampling technique is used when "natural" groupings are evident in an
universe. It is often used in marketing research. In this technique, the total population is divided into a number of
groups (or clusters) and a sample of the groups is selected. Cluster sampling reduces administrative and travel
cost and thus saves time of collection. With relatively higher number of primary sampling units, it provides higher
precision of data quality.
Two-stage cluster sampling technique has been used in this research. The clinic settings and its catchments
(cluster) population characteristics in either rural or urban areas can be considered homogenous. Within the
clusters population (HH) characteristics are heterogeneous.
The primary focus of the study is the household and, therefore, sample size determination for the HH survey has
been a crucial task in the sampling procedure. The following formula is widely used in market research,
development and social studies for determining the sample size for a known population size.
pqzNd
Npqzn
2
2/1
2
2
2/1
)1(
*
where, N= population size : = 20,836,234 (Source Smiling Sun service statistics)
p = .50 (it is assumed that 50% of the household in the SS clinic catchments have access to SS clinic services )
q = 1-p
d = precision level of the proportion
z = 1.96, for 5% level of significance
Therefore,
p =.50
q =.50
d =.05
Equating this formula, we get a figure of 384 sample households that should be minimally chosen for the survey.
The market survey is intended to represent all 318 clinic sites in different geographical locations. Therefore, to
address the design effect of sampling the sample household size 384 is multiplied by 2, gives a size of 768 HH.
The Smiling Sun clinics operate in both rural and urban settings. The HH characteristics are different in rural and
urban areas. The survey would generate two sets of data for urban and rural areas. The cluster sampling also
suggests including maximum number of sample from within cluster (catchments area) and minimum number of
sample clusters. Therefore, the market survey considered 18-clinic catchments area for the household survey. And
from each cluster, 90 successive households were chosen for HH survey interview. In that, the total sample units
for HH survey were 1620 households. The following presents the coverage and distribution of sample units for
different types of surveys in the market survey.

SSFP Market Survey Report 16
2.2 Coverage
Household Survey:
Two-stage cluster sampling technique was followed for the HH survey
Conducted in 18 clinic sites. Of them 8 are rural and 10 are urban. 4 comprehensive and 14 Static clinic
sites
90 HH from each cluster were interviewed using a pre-tested questionnaire
HH head or wives of the HH head were the respondent
Focus Group Discussion (FGD):
Same clinic sites of HH survey but in less number of clinics – 10 clinics
Six urban and 4 rural sites
6 comprehensive and 4 static clinic sites
In all 40 FGDs, proportionately conducted with male and female HH heads taking account poor, non-
poor, customer and non customer
Clinic Survey and Competitors Mapping:
Conducted in 18 clinics of HH survey sites plus another 7 to cover more comprehensive and urban clinics.
In all conducted in 25 clinics covering 23 NGOs. Of them 14 were urban and 11 were rural. And 6
Comprehensive and 19 Static
Competitors mapping conducted in all 25 clinic sites
NGO Survey
Covered all partners NGOs (30 NGOs) of SSFP
2.3 Organization of the Report
This report presents the findings and analysis of Market Survey in seven broad sections in addition to an
executive summary in the up front. Section one contains background information as well as main objectives of the
survey; Section two describes the brief methodology including the sampling and coverage of the survey; Section
three presents the findings and analysis of household survey and FGDs with them; Section four presents the Clinic
Survey findings and analysis; Section five presents the NGO survey findings and analysis; Section six presents
the key findings and policy implications of the market survey. Besides, a number of annexes are attached to this
report, from where analysis, conclusions and implications were drawn.

SSFP Market Survey Report 17
3 FINDINGS OF HOUSEHOLD SURVEY AND FOCUS GROUP DISCUSSIONS WITH
HOUSEHOLDS
One of the major objectives of the study was to assess the level of demand for healthcare in general and that from
SS clinics in particular, in the catchments areas of the clinics, to assess the potential for increasing demand there,
and to identify the socio-economic groups of people which can pay higher amount of fees/charges for services of
the clinics and the factors which can increase the number of clients and generate larger volume of revenue for the
clinics. In order to gather the relevant information for achieving this objective of the study a household survey
was conducted which covered 720 households in the rural areas and 900 households in the urban areas, all in the
catchment areas of the SS clinics. Information was collected through direct interview with the household heads or
their representatives, using structured questionnaires. The structured questionnaires, while very useful for
collecting quantitative information and inevitably needed for obtaining an evidence-based scenario for a large
sample, can not in most cases address the issues in the required details and, more importantly, can not fully
capture the process in operation and the behavioral aspects. The study aimed at generating a set of quantitative
data as well as to exhume certain facts related to the process of the household economy and behaviour of the
households. Considering the limitation of the quantitative survey in collecting the data on the process and
behaviour variables, the study conducted as many as 40 Focus Group Discussions (FGDs) with selected
households (as well as other groups of respondents) in SS clinic catchments areas. The FGDs were expected to
complement the findings of the households survey and the combined findings were expected to give a relatively
comprehensive picture of characteristics and behaviors of the households.
This section presents the findings of the household survey and the focus group discussions with households. The
section has been organized as follows: Sub section 3.1 will describe the background characteristics of the
households, which include demographic, social, and economic characteristics of household members. Subsection
3.2 will discuss the media habits of households. Subsection 3.3 will analyze the disease profile and healthcare
seeking behavior of households. This subsection will assess the level of need and demand for healthcare as at
present. Subsection 3.4 will describe the cost of healthcare incurred and willingness to pay for healthcare.
Subsection 3.5 will assess the level of, knowledge, attitude and perception of the households about the SS clinics.
This subsection also discuss about the quality of services of the SS clinics as perceived by the respondents. And
Subsection 3.6 describes the market size and regular customers’ features. Tables described in this section are
presented in the Annex-A.
3.1 Background Characteristics of Household Heads and Household Members
In the cases of some variables, such as education, land ownership, occupation and employment, the characteristics
of household head greatly determine the behavior of a household in a traditional peasant-subsistence economy.
But as society develops and the economy is gradually modernized, the increasing numbers of women get higher
level of education and are employed outside home. As a result of this, the wives in increasing number of
households become capable to influence decision-making and behavior of the household, and, in practice, they
influence. In this type of situation, analysis of household behavior requires information on the characteristics of
wives as well. Lastly, some characteristics such as age, disease, and use of healthcare always pertain to the
individual members of households and these characteristics of all members affect behavior of the households.
Considering all these, we shall discuss the characteristics separately for the household heads, wives of male heads,
and all household members. Moreover, we shall present the findings for the households, which are customers, and
for those, which are not customers of SS clinics at present in order to find whether and how the two groups
considerably differ from each other. This subsection is based on the data of only the household survey.

SSFP Market Survey Report 18
3.1.1 Background Characteristics of Household Heads
Table A1.13 displays the percentage distribution of household heads by age and gender, for both customer and
non- customer groups, in the rural areas under survey. Of 720 rural households under survey, 361 (or 50 percent)
were customers and 359 (approximately 50 percent) were non-customers. Among all household heads, 90 percent
are males and remaining 10 percent females, clearly showing that the vast majority of household heads are males,
which is the usual scenario in the rural society of Bangladesh. Among the non-customer households, the
proportion of female household heads is slightly higher (11
percent) than that among the customer households (7
percent). Nonetheless, the males are the heads in most rural
households. Most of the household heads are aged between
20 and 60 years, only a handful of heads being in age group
of 60+ years. The proportion of customer household heads,
both males and females, is highest in the 20-39 years age-
group, followed by that in the 40-49 years group. The
proportion of non-customer household heads is highest in
40-49 years age group
Table A.1.2 shows the percentage distribution of household
heads by age and gender in the urban areas under survey. In
the urban areas the customer households constitute 51
percent and the non-customer households 49 percent of 900
households surveyed. In the customer group 9 percent of
household heads and in the non-customer group 10 percent
are females. The heads of most households, irrespective of
gender and customer -non-customer group, are concentrated
in the three age-groups, between 20 and 60 years, and the
highest proportion is in the 20-39 group except for the
female non-customers heads.
In the rural areas the overwhelming majority of household heads are currently married, as shown in Table A 1.3.
However, in both customer and non-customer groups, a high proportion of female household heads are widow,
the proportion being higher in the non- customer group. The marital status of the household heads in the urban
areas is almost same with that in the rural areas, as shown in Table A 1.4: the overwhelming majority of male
household heads in both customer and non-customer groups are currently married, but more than fifty percent of
female heads are widow in both groups there. In the urban areas, the proportion of female household heads who
are separated or divorced is also considerably high in both groups, but higher in the non-customer group.
Table A 1.5 shows that in the rural areas under survey, majority of household heads, both among males and
females and both in customer and non-customer groups, do not have any education, which is usual in a
Bangladeshi village. The proportion of female household heads without any education is higher than that of male
heads in both groups, but it is much higher in the non-customer group. The proportion of household heads, both
males and females, who have primary and secondary level of education is higher and the proportion of heads who
received higher than HSC level education is lower in the customer group than in the non-customer group. The
table indicates, not very strongly though, that the relationship between use of healthcare from SS clinics and
education level of households is inverted U-shaped: use of healthcare from SS clinic increases as education of
household heads increases upto a level (HSC), but then it falls as education of heads further increases.
3 Tables described in this section are presented in the Annex-A.
Around 50 percent HH visited the Smiling
Sun clinic at least once in the last two years
– who are termed here as “customer”;
No discernible variation between customer
and non-customer in gender and age of
household heads;
The majority of the customers HH heads are
without education – higher education
groups also come but in less number;
No significant variation between the
customer and non-customer groups in
respect of age, gender, education, and
occupation of household heads;
In the rural areas the 27 percent HH are
hard-core poor, 11 percent are poor and 20
percent rich;
Customers of SS clinics exist in all income
groups in both rural and urban areas;
Proportion of customers is higher in the
lower income groups than in the upper
groups in both rural and urban areas.

SSFP Market Survey Report 19
Figure A1: Educational status of the household heads in rural and urban areas
0
10
20
30
40
50
60
No edn Primary level Sec. level HSC level Grad & +
Rural Urban
In the urban areas, as Table A 1.6 shows majority of male household heads are educated, having at least primary
level of education, in both customer and non –customer groups, but the proportion of male heads who have some
education is higher in the non-customer group, indicating that use of healthcare from the clinics is less among the
households where the male heads are more educated. Even in the urban areas, majority of female household heads
do not have any education in both customer and non-customer groups, but the proportion of uneducated female
heads is much higher in the customer group. The finding has a negative implication, as it was there for the male
heads: the households with educated females use health-care from the clinics less in the urban areas, i.e., they
prefer alternative sources of healthcare.
Table A 1.7 exhibits the main occupations of the households, for both customer and non-customer groups, in the
rural areas. The main occupations of the male household heads, in both customer and non-customer groups, are:
small business, non-agricultural day labor, farmer, agricultural laborer, rickshaw-puller, and salaried job. The
main occupations of female HH heads, in both groups, are housewife, maidservant, and non-agricultural day
labor. The proportion of male household heads in the customer group is higher in such occupation as small
business, non-agricultural day laborer, and rickshaw-puller, while it is lower in the occupations such as salaried
employment, farmer, and big business. The finding suggests, again not quite strongly, that the male household
heads in the occupations such as small business, laborer, and rickshaw-puller prefer the SS clinics more, as
compared to the male household heads in farmer and salaried job occupations.
In the urban areas, as Table A 1.8 shows, the main occupations of male household heads, in both groups, are:
salaried employment, small business, non-agricultural labor, rickshaw-puller, and big business. The proportion of
male household heads who receive healthcare from the SS clinics is higher in small business, non-agricultural
day-laborer and rickshaw-puller occupations and lower in salaried employment and big business, than the
proportion of those who do not receive. The female household heads are engaged mostly as housewives, maid
servants, or non-agricultural day-laborer, and the proportion of them receiving healthcare from the SS clinics is
higher in the maid servant and day laborer occupations, but substantially lower in housewife occupation.
3.1.2 Background Characteristics of Wives (of male household heads)
The characteristics of wives, especially their education and occupation, sometimes greatly influence the decision-
making in the households. This is particularly true for choosing the type of healthcare and the providers of
healthcare for the household members. Therefore, an analysis of the characteristics of wives is needed along with
the analysis of the characteristics of the husbands in order to identify the factors affecting decision-making and
behaviour of households.
Table A 1.9 shows that most of the wives are concentrated in the two age groups, 20-39 years and 40-49 years, in
both customer and non-customer groups and in both rural and urban areas. This is quite naturally so. Ages of
wives are usually highly correlated with the ages of husbands. We have already found that most of the male
household heads age between 20 and 50 years. So do the wives of them.
We find in Table A 1.10 that majority of wives in both customer and non-customer groups are uneducated, but the
proportion is higher in the customer group. In the rural areas, the proportion of wives in the households receiving
healthcare from the SS clinics is lower in the uneducated group and higher in the educated groups than that in the

SSFP Market Survey Report 20
households which do not receive care from the clinics. This indicates that increase in the educational status of the
wives increases use of healthcare by the households from the SS clinics. In the urban areas, as shown in the same
table, majority of wives have at least some level of education. The proportion of households with uneducated
wives, which receive healthcare from the clinics, is same as that which, with also uneducated wives, do not
receive care from the clinics. The proportion of households which receive healthcare from the SS clinics is higher
than that which do not in the category of wives who have primary level education. But in the category of wives
with higher level of education (than the primary level), the proportion of households receiving healthcare from the
clinics is lower than that which do not receive. The finding indicates the inverted U-shaped relation between
education level of wives and use of healthcare from the clinics. Use of healthcare from the clinics by the
households increases as education of wives increases upto the primary level, thereafter it declines.
Figure A2: Educational status of the housewives of customers and non customers
0
10
20
30
40
50
No edn Primary level Sec. level HSC level Grad & +
Customer Non-customer
The occupation of the overwhelming majority of wives in both customer and non-customer groups is housewifery
in both rural and urban areas, as Table A 1.11 displays. The next two important occupations are non-agricultural
day-labour and maid servant. A considerable proportion of household head’s wives of all the major occupations
receive healthcare from SS clinics in both rural and urban areas, and as such, no discernible relationship between
wife’s occupation and use of care from the SS clinics emerges from the table.
3.1.3 Background Characteristics of Population (household members)
A household survey has some distinguishing features: the unit of analysis in it varies by variables. Some variables
such as age and gender are specific to the persons and, hence, the unit of analysis is the household member. The
variables which are closely related to the decision-making in the household, the unit of analysis is mainly the
household head and/or his/her spouse. Choice of healthcare provider, healthcare expenditure, choice of
educational institutions for children, etc. fall into this category of variables. On the other hand, the entire
household is the unit of analysis for such variables as landholding, income, source of water, and type of house,
which are specific to the household. The characteristics of all the units of analysis are to be examined in order to
identify the factors determining the behavior of households. We have already discussed the characteristics of
household heads and wives. We shall now describe the major characteristics of all household members, to be
followed by discussion on the characteristics of the households in the next subsection.

SSFP Market Survey Report 21
Figure A3: Population pyramid of the surveyed population by age and sex
The survey covered 3420 individuals (in 720 households) in the rural areas and 4208 persons (in 900 households)
in the urban areas, the average size of household being 4.75 in the rural areas and 4.68 in the urban areas. Table A
1.12 shows the percentage distribution of survey population by age and gender, for both customer and non-
customer groups, in the rural areas. The male-female ratio is 50 : 50 for all population in the rural areas. The
customer households have 1778 people and male-female ratio is 49 : 51 for this group, while the non-customer
households have 1642 persons and the male-female ratio is 50 : 50. The proportion of Under-5 children is 10
percent, and among them the proportion of female children is higher, in the rural areas. The proportion of children
is much higher in the customer group than in the non-customer group, implying the possibility that the customer
households have greater need for child healthcare. Majority of the people are concentrated in the two age group,
5-14 years and 20-39 years, in the rural areas as a whole, as well as in the two groups of households. In the
customer group, the proportion females is higher than that of males in the 0-4 years, 20-39 years, and 60+ years
age-groups, and lower in other age-groups. In the non-customer group, the proportion of females is higher in the
0-4 years, 20-39 years, and 40-49 years age groups. A high proportion of people, both males and females, are
there in the group of 5-14 years in both customer and non-customer groups. The proportion of old-age people also
is considerably high in both groups.
The pattern of age distribution of population in the urban areas is almost same as that in the rural areas. As table A
1.13 shows, majority of the people are in the two age-groups: 5-14 years and 20-39 years in the urban areas as a
whole, as well as in the two individual groups (customer and non-customer). The male-female ratio is more or
less same in these age groups in both groups of households. The under-5 children constitute 10 percent of urban
people (under survey), and the proportion is much higher in the customer households. The proportion of
adolescents is 10 percent, and it is same for both males and females, in both customer and non-customer groups.
The proportion of aged people is higher in the non-customer group.
In the rural areas the married people account for 45 percent of all people and the proportion is marginally higher
in the customer group, as shown in Table A 1.14. A considerably high proportion of females is widow in both
groups. The scenario is almost same in the urban areas. As Table A 1.15 shows, 45 percent of people are married
in the urban areas and the proportion is exactly same in both customer and non-customer groups. As in the rural
areas, the proportion of widow is considerably high in the urban areas, and the proportion is higher in the non-
customer group.
Table A 1.16 and A 1.17 show that the percentage distribution of population by level of education in the rural and
the urban areas, respectively. In the rural areas, about 30 percent of people (aged over 6 years) are uneducated.
The proportion of uneducated people is lower in the customer group than in the non-customer group, and higher
among the females than among the males in each group. The proportion of people who received primary level of
Male Female
8 6 4 2 0 2 4 6 8
0-4
5-9
10-14
15-19
20-24
25-29
30-34
35-39
40-44
45-49
50-54
55-59
60-64
65-69
70+
Age
(ye
ars)
Percent

SSFP Market Survey Report 22
education is higher in the customer group than in the non-customer group. But the proportion of people who have
secondary level of education is higher in the non-customer group than in the customer group. However, the
proportion of people who have primary or secondary level of education is lower among the females than among
the males in each group. The pattern is similar in the urban areas. The proportion of uneducated people is lower in
the urban areas than in the rural areas. In the urban areas, the proportion of uneducated persons is higher in the
customer group than in the non-customer group, and among the females than among the males in each group. The
proportion of persons who obtained higher level education is quite high in the urban areas, as compared to that in
the rural areas. However, neither in the rural areas nor in the urban areas discernible difference is found to exist
between the customers’ and the non-customers’ households in respect of education level.
3.1.4 Background Characteristics of Households
This subsection discusses the characteristics, which are specific to the entire household, and not to any member of
the household. Economic status, income level, landholding, type of house, type of latrine, etc. are such
characteristics.
Figure A4: Economic categorization of the surveyed households
27.2
17.8
10.7
6.6
22.2
30.7
20.723.3
19.221.6
0
5
10
15
20
25
30
35
HardCore
Poor
Poor L.middle U.middle Rich
Rural
Urban
Figure A4 shows the income distribution of households in both rural and urban areas under survey. In the rural
areas, the proportion of hard-core poor households is as high as 27 percent4. Another 11 percent of households
there are absolute poor. The proportion of rich households also is considerably high – about one-fifth. The
incidence of poverty is higher among the customer households than among the non-customer households, and the
proportion of upper-middle and rich households is higher among the non-customer households. However,
customers of SS clinics exist in high proportion in all income groups, although the proportions appear to be higher
in the three lower income groups and lower in the upper two income groups. The proportions of the hardcore as
well as the absolute poor households are much lower in the urban areas than that in the rural areas. As in the rural
areas, the proportion of customers is higher in the lower income groups than in the upper groups in the urban
areas. As exhibited in Table A 1.19, the income distribution is found highly inequitable in both areas. In the rural
areas, the lowest 20 percent of households have only 7 percent of total income, while the top-most 20 percent get
47 percent of income. The average monthly income of rich households is seven-fold higher than that of poor
households, in the rural areas. Inequity of income distribution is still higher in the urban areas than in the rural
areas. In the urban areas, lowest 20 percent of households get 5 percent of total income and the uppermost 20
percent get 58 percent of income. The average monthly income of the rich households is about twelve fold higher
than that of poorest households in the urban areas. The average monthly income of an urban household (BDT
13,678) is much higher than the same of a rural household (BDT 7367).
4 Details procedure for poverty estimation is presented in Annex E.

SSFP Market Survey Report 23
Figure A5: Quintile specific average monthly income of surveyed HH in rural and urban areas
0
5000
10000
15000
20000
25000
30000
35000
40000
45000
1st Quintile 2nd Quintile 3rd Quintile 4th Quintile 5th Quintile
Rural
Urban
Distribution of land also is highly inequitable in both rural and urban areas, as shown in Table A 1.20. In the rural
areas, 73 percent of the households own less than 0.50 acres of land, and the landlessness or near-landlessness is
higher in the customer group than in the non-customer group. Only a few households own more than 2.50 acres of
land. If the amount of 2.50 acres is assumed to be the amount which is needed to maintain a household, then the
vast majority of households are poor in terms of landownership. But the proportion of poor as shown in Table A
1.18 much less than what distribution of landholding indicates. This suggests that a large number of households in
the rural areas have resorted to off-farm activities for survival and could thus still maintain themselves above the
poverty level. The landlessness is more acute for the urban households and quite naturally so. It is worth noting
that landlessness is higher for the customers of the SS clinics in both rural and urban areas. The table clearly
suggests that a considerable proportion of households in every land group, upper and lower, avail of the services
of SS clinics in both rural and urban areas, but the landless/ near-landless households avail of it in greater
proportion.
In the rural areas more than 88 percent of households own house for living; 4 percent are living in rented-in
houses, and 8 percent live in the houses built on others’ land. In the urban areas, 44 percent of households live in
owned house, 48 percent in rented house, and 8 percent in slums /squatters (table not shown).
Table A 1.21 shows that in the rural areas the majority of households, in both customer and non-customer groups,
have houses made of CI sheet (tin) and considerably high number of them have thatched houses. However, even
in the rural areas, a high proportion of households own semi-pucca or pucca houses. In the urban areas, the
proportion of households which have tin-shed house is highest, although it is lower there than in the rural areas.
Even in the urban areas, the proportion of households with thatched houses is considerably high. The number of
semi-pucca or pucca houses is much higher in the urban areas. However in both areas, the proportion of
households which receive healthcare from the SS clinics is considerably high in all types of houses, whether
thatched or pucca.
Table A 1.22 shows the percentage distribution of households by ownership of durable assets. The proportion of
households that own relatively valuable assets is considerable higher in the urban areas than in the rural areas. But
surprisingly, the proportion of households owning valuable assets is much higher in the customer group than in
the non-customer group in both areas.

SSFP Market Survey Report 24
Figure A6: Bar chart showing latrine owning status of the surveyed HH in percent
0
10
20
30
40
50
Sanitary Water Sealed Pit latrine Open/Hanging
Rural
Urban
With regard to latrine using status of the surveyed household, about 50% HH in the urban areas and 19% in the
rural areas use sanitary latrine, on the contrary, about 7% of urban and 29% of rural HH use open/hanging latrine.
It was also observed that the rate of hanging/open latrine use is higher among the HH of lower income group. As
far as, drinking water is concerned, cent percent HH in rural areas use Tube well water, while in the urban areas,
people use either piped or tube well water. It has also been found that about 15 % of urban HH drink water after
purification.

SSFP Market Survey Report 25
3.2 Level of Use of Media and Type of Media Used by the Respondents
The development scholars hold, based on empirical evidence from different societies, that the level of use of
media and certain types of media and media programs can significantly change attitude and behavior of the
people, and they suggest that, like advertising in the private sector, mass media campaign in the public sector can
be very useful for orienting and motivating the people to conduct the activities which benefit them more. Use of
mass media is specially useful and very cost-effective for increasing use of particular types and brands of
healthcare. Performances of the Health and Population Sector of Bangladesh itself in certain areas (FP, maternal
health, child health, etc) provide ample evidence to this view. Given this, it appears that the potential effectiveness
of the media campaign for the SS franchise program is high. What is needed at the initial stage of program
implementation is to design an appropriate and realistic media strategy so as to enhance its effectiveness. The
present survey collected data on the current media behavior of the people so that the program planners can
formulate the needed media strategies using the primary information on the realities about the households in the
catchment areas of the program.
Table A 2.1 shows that television is the main media used by the households in both rural and urban areas. In both
areas a high proportion of the people regularly watch TV, but the proportion is much higher in the urban areas. In
both areas the proportion of people listening to radio and reading newspapers is very low.
Table A 2.2 shows the percentage distribution of TV watcher in both areas by frequency of watching in a week.
There is no considerable difference between customers and
non-customers in any area in the frequency of TV watching.
In the urban areas, the majority of the TV watchers, both
customers and non-customers, watch TV every day and
some of them watch once or even less in a week. In the
rural areas, the proportion of respondents regularly
watching TV is quite high in both customer and non-
customer households, although as not high as in the urban areas. The main findings of the table are: a high
proportion of respondents in both rural and urban areas regularly watch TV, and since the proportion of customers
watching TV is almost same as that of non-customers, TV watching does not seem to have influenced the
watchers, at least to any considerable extent, to use healthcare from the SS clinics.
The most favorite TV programs to the respondents, in both areas and in both customer and non-customer groups
of households in each area, are the entertainment program, followed by news (Table A 2.3). Any campaign that
aims to change the habit of the people as regards to use of healthcare through TV has to mostly use these two
types of TV program. For most of the TV watchers in the rural and the urban areas and in both customer and non-
customer groups, the favorite TV watching time is 8-10 pm. The proportion of respondents who said that they
watch TV between 5 pm and 8 pm is also high in both areas for both groups. Nonetheless, any TV program
designed for the franchise campaign should preferably be conducted between 8 pm and 10 pm (Table A 2.4). The
most preferred TV channel for the people in both areas and for both groups is BTV. More than 90 percent of the
TV watchers in the rural areas and more than 70 percent in the urban areas watch BTV. The next most preferred
channels are ATN and channel i in the rural areas and ATN, channel i and NTV in the urban areas (Table A 2.5).
Hence, the program can consider only four TV channels – BTV, ATN, Channel i, and NTV, but should prefer
BTV for conducting any TV campaign.
As already found in Table A 2.1 and as Table A 2.6 shows in details the proportion of respondents listening to
radio is extremely low in both customer and non-customer groups in both rural and urban areas. The proportion is
likely to decline further as access to TV increases. Hence, radio should not be the media to be used by the
franchise program to launch any campaign. Anyway, the vast majority of radio listeners in both groups in all areas
listen to the Dhaka center. The proportion of respondents listening to Khulna center also is considerably high in
all areas (Table A 2.7). As in the case of TV the overwhelming majority of the radio listeners like the
entertainment programmes and news cast through the radio (Table A 2.8) and the afternoon and the evening hours
(from 1 pm to 10 pm) are the preferred time for radio listening (Table A 2.9).
The proportion of respondents who regularly read newspaper is miserably low at present in all areas and in both
groups in each area (Table A 2.10). However, it is expected that the proportion of newspaper readers will rise as
socio-economic development increases and, hence, the potential usefulness of newspapers as the media for any
Television is the main media used by the
households in both rural and urban areas;
listening to radio and reading newspaper is
miserably low in both areas.

SSFP Market Survey Report 26
franchise campaign is high. At present, the vast majority of readers read only the first and the last page of
newspaper. This is true in both household groups in both areas. However, the proportion of those who read the
health page is also considerably high in all areas (Table A 2.11).
Leisure time of the respondents, for watching TV or listening to radio, starts after 2 pm. As Table A 2.12 shows,
the proportion of respondents whose leisure time is between 4 pm and 6 pm is highest in all areas. The proportion
of respondents mentioning their leisure time as between 6 pm and 9 pm or between 2 pm and 4 pm is also quite
high. Therefore, any health campaign through TV or radio for the people in the target areas should be launched in
the afternoon and evening hours, preferably between 4 pm and 6 pm.

SSFP Market Survey Report 27
3.3 Disease Profile, Source of Healthcare, and Reasons for Choosing Provider
Use of healthcare mainly depends on the disease profile of the people, preference pattern of the clients about the
providers of healthcare, and the behavior of clients for demanding healthcare. This subsection discuses these
aspects of the use of healthcare so as to assess the present as well as the potential level of healthcare and identify
the factors, which affect the use of healthcare at the SS clinics.
The subsection uses information obtained from the
household survey as well as FGDs. The diagram below
shows the incidence of disease during the last six months
before the survey in the rural and urban areas. In the rural
areas 46.1 percent of the population suffered at least once,
in the urban areas, the proportion was a bit higher (49.8
percent).
Table A 3.1 shows the disease profile of the survey
population by age in the rural areas. About 80 percent of the
people who were sick during the six months preceding the
survey suffered only from three conditions: general
sickness, water-born diseases, and gastric. The proportion
of people suffering from general sickness was highest – 61
percent, followed by that from water born diseases (8.6
percent). The proportion of people who suffered from
general sickness was very high in all age-groups, but higher
in the lower age groups than in the higher age- groups. The
same is true for the water born diseases, and respiratory
problem. The proportion of sick people was higher in the
relatively old age groups for gastric, eye problem and
complex diseases, but the total number of cases of these diseases was low. The disease pattern in the urban areas
was similar to that rural areas. As shown in Table A 3.2, in the urban areas more than 80 percent of the sick
people suffered from four conditions: general sickness, water born diseases, gastric and complex diseases, and
among them, general sickness alone had 61 percent of cases. Most of the patients were concentrated in four age-
group: 0-4, 5-14, 20-39, and 40-49 years. General sickness was prevalent almost in all age groups. Apart from
general sickness, the most prevalent conditions were water born diseases and respiratory problem for children,
and gastric and reproductive health complications in the 20-39 and 40-49 years age-groups, in the urban area.
Table A 3.3 shows percentage distribution of sick people by disease and income group of households in the rural
areas (for both customer and non- customer groups). The disease profile of the people in both customer and non-
customer groups is more or less same, except that the prevalence of general sickness was higher in the customer
group than in the non-customer group. General sickness was the most prevalent condition in all income groups, in
both customer and non-customer groups of households. No discernible relationship is found between income
group and disease type; the patients of all diseases are considerably found in all income groups. Thus, no disease
was found specific to any income group; or in other words, disease did not depend on income level of households.
The picture regarding the relationship between income group and disease in the urban areas is more or less same
as that in the rural areas, as shown in Table A 3.4.
High prevalence of diseases: general
sickness, water born diseases, and gastric
and abdominal; 61 percent was general
sickness; No significant relationship is found between
income group and disease type;
Pharmacy is the main source of healthcare
for the people;
In the rural areas, SS clinics are the second
most important source of healthcare and
doctors are the third important source for
the customers;
High quality of services, low cost, and low
waiting time are the main reasons for the
customers to choose the SS clinics; Low cost, less waiting time, short distance
from home and large size of facility, etc. are
the main reasons for choosing other
facilities.

SSFP Market Survey Report 28
Figure A7: Incidence of illness among the HH members in last six months
53.9
46.1
50.249.8
42
44
46
48
50
52
54
Rural Urban
Yes
No
Pharmacy is the main source of healthcare for the people in both groups in both areas. As Table A 3.5 shows,
even among the customer households, 37 percent in rural areas and 31 percent in urban areas received health
services from the pharmacies. The proportion of people receiving healthcare from pharmacy was still higher in the
non-customer group. In the rural areas, SS clinics are the second most important source of healthcare to the
customers and doctors are the third important source. To the non-customers in the rural areas, doctors,
government providers, and indigenous providers are the other main sources of healthcare, than pharmacy. In the
urban areas, the second most important source is doctor and the third most important source is SS clinics for the
customers. To the non-customers in the urban areas, doctors and government providers are the most important
sources of care, next to pharmacy of course. The proportion of people not receiving any treatment is also not
insignificant in any group in any area, and the proportion is quite high in the non-customer group in the urban
areas. Even in the urban areas, some people still use healthcare from the indigenous providers.
The reasons for choosing a particular provider are same for both customers and non-customers. In the rural areas,
as Table A 3.6 shows, the main reasons cited by the customer households for choosing SS clinics as source of
healthcare are quality of service, low cost and low waiting time. The main reasons for choosing government
facilities, as cited by both customer and non-customer households, are larger facilities and good quality of service.
For both customer and non-customer households in the rural areas, the main reasons behind selecting private
clinics and MBBS doctors were service facilities and quality of service and that for choosing pharmacies and
indigenous providers are low cost of service, less waiting time, and short distance between the facility and
residence. The main reasons for choosing providers by the households in the urban areas, as shown in Table A
3.7, are exactly the same as that in the rural areas. For majority of households, in both customer and non-customer
groups, in the rural areas, pharmacies are the nearest facilities, located mostly within 2 km from their residence.
Short distance may be an important reason for choosing pharmacies as providers. The same is true also for the
households in the urban areas; the households have the tendency to receive healthcare from the nearest facilities.
However, in the urban areas high proportion of customers said that the SS clinic is located close to their house and
they go to the clinics for healthcare when needed.
Tables A 3.8 and A 3.9 show the percentage distribution of households by source of healthcare and income group.
The most important finding of the two tables is that the proportion of households choosing a source of healthcare
does not considerably vary by income group of households. The major sources of healthcare for the customer
households in both rural and urban areas are pharmacy, SS clinic, doctors, and government facilities, and the
proportion of households which receive healthcare from these sources is high in all income groups. The main

SSFP Market Survey Report 29
sources of care for the non-customer households are pharmacy, doctors and government facilities, and the
proportion of households, again, is high in all income groups, in both rural and urban areas. The implication of the
finding is that even the rich households can choose SS clinics or pharmacy or government facilities (or even
indigenous providers), and even the poor households can visit private doctors or clinics. In other words, the SS
clinics have potential clients in all income groups in both rural and urban areas.
The findings regarding relationship between education level of household heads and type of provider chosen is
more or less same as that between income group and provider. Tables A 3.10 and A 3.11 show that the proportion
of households choosing a major source of care is high in all education groups, i.e., choice of provider did not
considerably vary by education of household heads. These tables also strongly indicate that SS clinics have
potential clients in all education groups in both rural and urban areas.
Table A 3.12 shows that the most preferred source of care for the customers in the rural areas is the SS clinic, and
it is quite evidently so, because the customer household are already receiving care from the SS clinics. The other
NGO clinics and homeopathic doctors also are the most preferred providers to a high proportion of customers of
SS clinics. The most preferred providers to the non-customer households in the rural areas are private clinics
(with beds), government facilities, and pharmacy. The pattern of choice is similar in the urban areas. The
proportion of customers who mentioned SS clinics as the first choice as source of care is highest (almost cent
percent), followed by that mentioning homeopathy or other NGO clinics. The proportion of non-customers whose
first choice is indigenous healers is highest, followed by that whose first choice is private clinics or private
doctors. As shown in Table A 3.13, the most important criteria for choosing a provider are good behavior of
providers, good reception, less cost, and less waiting time for customers, and better equipments, better service
quality, and less waiting time for the non-customers in both rural and urban areas.
Table A 3.14 and A 3.15 show the level of satisfaction of the households with healthcare from different sources in
the rural and urban areas, respectively. In both rural and urban areas, the vast majority of customers who received
care from the SS clinics were highly satisfied or satisfied and the majority of households (respondents) who
received care from private doctors were also highly satisfied or satisfied with care, but the majority of those using
healthcare from government facilities and pharmacy were not satisfied. In both areas the majority of non-
customers who received care from private clinics and pharmacy were not satisfied but the majority of those who
received care from private doctors and government facilities were satisfied with care.
The main reasons for not taking healthcare, cited by both customer and non-customer groups in both rural and
urban areas, were inability to bear the costs of healthcare and the diseases being perceived as very minor (shown
in the Table A 3.16).

SSFP Market Survey Report 30
3.4 Cost of Healthcare Incurred and Willingness to Pay for Healthcare.
Formulation of an appropriate business plan for an Organization requires prior knowledge about the level and the
elasticity’s of demand for its services. But it is difficult to estimate the demand function for healthcare for a
number of reasons. The demand function can be derived in a competitive and organized market situation. The
market of healthcare is highly unorganized in that there are heterogeneous providers and there is marked product
differentiation. Demand function appertain to that situation where the consumers pay the market prices for
commodities/services. In the health sector a large number of consumers do not have to pay any price or they pay
lower level than the market price. Quality of services in the health sector widely differs from facility to facility,
from unit to unit within a facility, and sometimes from customer to customer. Furthermore, there is asymmetry of
information between the providers and the consumers.
Despite all these peculiarities of the healthcare market, some assessment of demand is needed for planning and
management. This subsection presents an indicative assessment of demand for healthcare in the survey areas by
way of estimating the costs of care actually incurred and assessing the willingness to pay (WTP) of the
respondents for healthcare.
Table A 4.1 shows the amount of expenditure incurred by
the households on healthcare during the six months before
the survey, by disease and income group, in the rural
areas. The average amount of healthcare expenditure was
Tk 866.10 for all households which purchased health care
in the rural areas. Given the average monthly income of
the rural people, the average amount of healthcare
expenditure is not low. Importantly, the households are
found in all income groups, including the hard-core poor,
which spent money for health care, and the average
amount of expenditure is considerably high for all types
of disease. Usually, two major determinants of healthcare
expenditure are type of disease (severity and duration)
and income level of households.
Figure A8: Average cost (in BDT) of treatment
incurred per HH in last six months
0
500
1000
1500
2000
Rural Urban
Customer Non Customer Overall
The table shows that the hard core poor households spent more than did the rich for two conditions, respiratory
problem and eye problem, and they spent almost as high an amount as that by the rich for complex diseases.
However, for most diseases the poor spent less, and the average amount of expenditure (column mean) increased
The average amount of healthcare
expenditure for most recent sickness was
BDT 866 and BDT 1100 for rural and urban
HH respectively;
Income elasticity of demand for health
services is quite high;
Majority of the respondents expressed their
willingness to pay more than 25 percent of
current prices as additional charges for
almost all types of services;
Specific services EmOC, lab/diagnostic
services are willing to pay up to 50%;.
Price elasticity of demand is considerably
high for almost all services and in both
areas;
WTP did not considerably vary by income or
education or media habit.

SSFP Market Survey Report 31
as income level rose, and the amount spent by the rich is several times higher than that by the poor. This indicates
that income elasticity of demand for healthcare, especially among the upper-income groups, is quite high. That the
hard-core poor spent more than did the poor and lower-middle households for many diseases simply points to the
reality that the hard-core poor suffer from the poverty afflicted diseases more and, hence, have to spend more.
Combining the two findings that the hard-core poor spent more than did the poor and the lower-middle
households and that average expenditure fast increased with increase in income for the upper-income households,
it can be said that the relationship between income and healthcare expenditure was U-shaped in the rural areas: as
income increased, it first declined and then quickly increased.
In the urban areas, as shown in Table A 4.2, the average healthcare expenditure was BDT 1100.73, which is much
higher than its counterpart in the rural areas. As in the rural areas, households in all income groups incurred
healthcare expenditure during the six months preceding the survey, and they spent for all types of diseases. The
hardcore poor households spent higher amount of money than did the rich for gastric. But for other diseases
expenditure increased as income rose, showing a high-income elasticity of demand.
The findings of the two tables suggest the following:
Both in the rural and the urban areas, people spend a large amount of money for healthcare, and, thus,
demand for healthcare considerably exists in both areas;
Even the hard-core poor and the poor spend large amount of money for healthcare and sometimes they
spend more than do the rich;
Income elasticity of demand is quite high;
The hard-core poor suffer from the diseases more than do other income groups, and they need to spend a
high amount on health care, as compared to their income level.
The survey asked questions on the willingness to pay higher charges for healthcare, so as to get a tentative
assessment of the price elasticity of demand for healthcare and judge the possible effects of raising prices on the
amount of use of health care. On willingness to pay (WTP), information were collected using the contingent
valuation approach in the following way: First, each respondent was informed about the prices of the services,
currently charged by the clinics. This was done using a list of current prices of services as charged in the
respective clinics. (Table A 4.2.1 shows the range of prices for different services of SS clinics compiling the
figures from such lists). Second, the respondent was then informed that the following services of SS clinics cost
much more than what you pay. At present the development partners are giving huge amount of subsidy. But the
clinic cannot run for long using external help, and the external agencies may not also continue with this support.
In such a situation the service recipients must share the cost to keep the clinics running. Otherwise, the clinics
may have to discontinue to provide the services at some point in time. Then, the respondent was asked: how much
price he or she is willing to pay for each service, if he or she receives services as expected. Finally, the
interviewer calculated the difference between what the respondent was willing to pay and the actual price of
service, obtained the percentage value, and then encircled the appropriate option in the questionnaire.
Tables A 4.3 and A 4.4 show the percentage distribution of respondents by type of services and level of WTP in
the rural and the urban areas, respectively. The majority of the respondents expressed their willingness to pay
more than 25 percent of current prices as additional charges for almost all types of services, in both groups and in
both areas, if quality of services improves. The proportion of respondents willing to pay more than 50 percent of
current prices as additional prices was also substantially high in all areas and for all services except LCC.
Furthermore, in all areas, the proportion of respondents willing to pay more than 50 percent of current prices is
very high for laboratory tests and EmOC.
The tables also show that price elasticity of demand is considerably high for almost all services and in all areas.
The proportion of households willing to pay increases as the rate of charge falls, in all areas.
Attempts were made to find the relationship between education level of household heads and their WTP. But no
clear relationship between the two emerged. The proportion of households willing to pay higher prices is high in
all education groups in both rural and urban areas. Similarly, media habits was also not found as a factor to have
significant effect on WTP.

SSFP Market Survey Report 32
3.5 Knowledge, Attitude and Perception about Services of SS Clinics
The level of knowledge and attitude about the SS clinics are likely to shape the demand behavior of the
households for service from the clinics to a great extent. This subsection analyses the level of knowledge, attitude,
and perception about the services of the SS clinics among the respondents. The analysis is based on the
information gathered from both the household survey and the FGDs.
The household survey data have shown, as presented in Table A
5.1, the overwhelmingly majority of customers in both areas
know that the SS clinics provide child healthcare, maternal
healthcare, and FP service. But the proportion of customers who
know that the clinics deliver some other services as well is low
in both areas. The main sources of information about the clinics
are signboard at the clinic, billboard, and the clinic staff in both
areas. In the urban areas a large number of respondents heard
about the SS clinics from advertisement and drama in
television, as well (Table A 5.2).
Figure A9: Perception about SS clinic service quality by the
non customers
Very good
1%
No idea/Don't
Know
46%
Poor
3%
Good
29%
Average
21%
It appeared from the FGDs that most of the poor participants (in FGDs) learnt about the SS clinics from drama
and advertisement in TV, health workers of SS clinics, signboards of SS clinics, and neighbors. Most of the non-
poor participants learnt about the SS clinics from signboards, health workers of the clinics, drama and
advertisement in TV, and neighbors.
3.5.1 Smiling Sun Brand Familiarity:
Smiling Sun Logo is quite familiar to a good number of customer as well as non-customer who relate this logo
with health facilities in general; and maternal and child health services in particular. But some participants could
not describe the logo meaningfully. They belong to both customer and non-customer.
Smiling Sun is mostly familiarized through TV drama, signboard and home visits. Non-customer with higher
income group mostly informed through TV drama - “Enechi Surjer Hashi”. Poor customer and non-customer are
primarily informed through sigh board (including billboard, posters) and home visit by staff and depot holders.
Amongst the prominent health service brand and names, FGD participant predominately mentioned “Green
Umbrella”. Even many of them identify Smiling Sun brand as Green Umbrella. Other prominent brand in health
More than 90% respondent are familiar with
Smiling Sun logo;
The overwhelmingly majority of customers
in both rural and urban know that the SS
clinics provide child healthcare, maternal
healthcare, and FP service;
The main sources of information about the
clinics were signboard at the clinic,
billboard and the clinic staff in both areas;
In the urban areas a large number of
respondents heard about the SS clinics from
advertisement and drama in television, as
well.
SSFP Market Survey Report 33
service provider mentioned in the FGD includes “Lab Aid”, Ibna Sina”, “Medinova” and “Merie Stopes”.
Participants acknowledged that TV advertisement with unique messages had let them remember these brands and
names. Some aspects and messages of those advertisements made a colossal impact on the minds of the
participants. Two of them were “ Amar desher sonar chelera ache na” – a quote form the Lab Aid TV
advertisement and “25% discount on all dialogistic test services” – from Ibne Sina TV ad.
The FGDs reveal that most of the poor as well as non- poor people perceive SS clinic is a centre of poor people
for taking health services at free of charge. It carries an image of maternal (including FP service) and child health
service. A few of FGD participants mentioned that SS clinic provide free services for tuberculosis patients.
In the FGDs, the participants mentioned a large number of reasons for choosing SS clinics as source of healthcare.
Most of the people both poor and non- poor said that the main reasons are:
Treatment cost is comparatively cheap;
SS clinic is nearer to their residence. Communication is easy;
Female doctors / paramedic exist and they behave in a friendly manner;
Medicine is available and free treatment available for poor and tuberculosis patients;
They explain in details about the medicine;
No need of specialist doctor for minor treatment of sick children;
Figure A10: Perception about cost of services of SS clinic by the non customers.
High cost
9%
Don’t know
61%
Low cost
11%
Average cost
/affordable
19%
The household survey data also shows that the majority of the customers in both areas also know about at least
one other source of care than the SS clinic. In the rural areas, the vast majority of the customers know about the
government upazila health complex as a source of healthcare, and the proportion of respondents who know about
the UHFWC and private clinic is also high there. In the urban areas the vast majority of customers know about the
private clinics and a high proportion of them know about the district hospital / MCH center (Table A 5.3)
The non –customer households also have knowledge about the SS clinic and its competitors in the areas. About 90
percent of non- customers in both areas are familiar with the SS clinics. But, interestingly, they do not use
healthcare from the SS clinics. The possible reasons for not using by them are: first, the vast majority of the non-
customers are also aware of the existence of other institutional and non-institutional facilities in the areas (as
shown in Tables A 5.4 and A 5.5); second, most of them do not know or do not have good impression about the
quality of services of SS clinics (Table A 5.6); and third, most of them do not have clear idea about the costs of
healthcare at the SS clinics (Table A 5.7).

SSFP Market Survey Report 34
In the FGDs, the non-customers who do not use healthcare from the SS clinics- cited several reasons for not using
services from the SS clinics. The reasons mentioned by them are categorized as follows:
Statement from FGDs with poor HH Statement from FGDs with non-poor HH
Absence of good and specialist
doctors;
Treatment of all diseases are not
available;
Diagnostic test facilities are not
available;
Not open all day / all time in a week.
Only limited medicine is available;
No inpatient facility;
Some times wrong treatment is
provided;
Present doctors are not skilled enough.
Absence of specialist and good
doctors;
Not open 24 hours;
Treatment for all diseases is not
available;
No arrangement of ECG and ultra-
sonogram;
All medicine is not available;
Doctors for all diseases are not
available;
SS clinic is for poor people;
Participants from rural areas feel that
as they are paying money, it is better to
take services from a private MBBS
doctors than from a paramedic of SS
clinic.
The FGDs revealed that the main reasons for selecting other providers than SS clinics are:
Most of them said that the treatment expenses are comparatively high in SS clinic;
For lack of advertisement they are not known about SS clinic;
They can take minor treatments from the pharmacy in lower cost;
Doctors of other health care centers are much experienced than SS clinic;
In other clinics all types of test arrangements are available;
In other clinics patient can get admission;
They can take treatment in low cost from government hospital and other health care centers;
Doctors are available all times in other clinics.
As shown in Table A 5.8, majority of the customers in the rural areas of SS clinics are satisfied with almost all
indicators of quality of services, but more with waiting room, toilet facilities, reception, privacy and behavior of
staff, and level of cost. In the urban areas, the vast majority of customers are satisfied with all quality indications
except the waiting time. The proportion of customers satisfied with each indicator varies within a very narrow
range by income group in both rural and urban areas (Table A 5.9 and A 5.10). Thus, the quality indicators are
perceived more or less equally by all income group in both areas. Similarly, the proportion of customers satisfied
with each quality indicator does not considerably vary by education level of respondents in any area (Table A
5.11 and A 5.12). In both rural and urban areas, the proportion of customers who attach importance on behavior of
providers as quality indicator is highest, followed by that attaching greatest importance on convenient location,
and on low cost of service (Table A 5.13 and A 5.14).

SSFP Market Survey Report 35
3.5.2 Suggestions of FGD Participants for Improving Performances of SS Clinics
The participants in the FGDs suggest several measures for improvement of performance of the SS clinics.
Strategies for SS clinic- so that it can attract more people and generate more income:
Provide care by specialist doctors (male and female) for all types of diseases;
Keep the clinics open for 24 hours;
Arrange delivery care and adequate laboratory facility in the SS clinic;
Extend the market promotional activities.
Recommendations for improving the quality of services:
Arrange the BCC training for the service providers;
Provide in-patient care;
Extend market promotional activities (sign and bill boards at strategic points, extend promotional
activities beyond catchment area, campaign for male patients, courtyard meeting, poster and TV
advertisement);
Include local people in the clinic management.

SSFP Market Survey Report 36
3.6 Market Size and Regular Customer
The ultimate objective of the study was to gather some information, which are crucially needed for preparing
evidence – based business plan for the SS clinic
system. Knowledge about the current and the
potential market size, behavior and preference
pattern of the regular customer of the SS clinics can
provide a niche factor for the Smiling Sun clinic to
focus its services.
The average market share of the SS clinics has been
defined here as the proportion of annual revenue
earned by the clinics to the entire healthcare market
in the catchments areas of the clinics:
Market share = Annual revenue of clinics X 100
Per capita health care expenditure X population in the catchment areas
The table below shows market share separately for rural, urban, and comprehensive clinics. The SS clinics at
present have only a share of 0.62 percent of the total health care market in the catchment areas. The computed
value of share shows that the rural clinics (ordinary) cover at present only a negligible portion of the market, and
that they have the potential to raise the share manifold. The market share of the urban (ordinary) clinics is
marginally higher (0.72). The comprehensive clinics cover a larger portion of the market (1.60). Nevertheless, all
types of clinics have to dramatically expand the market for their services.
Table A 6.1: Market share of SS clinics
Indicators / Issues Clinic Type
Rural Urban Comprehensive
No. of clinic 7 7 4
HH expenditure on health (BDT) 2478120 3595692 1882620
Surveyed population 2907 2997 1724
Per capita health expenditure (BDT) 852.47 1,199.76 1,092.01
Clinic income (BDT) 3233281 4317490 7438883
Catchment population 607462 474268 425767
Health market size in BDT 517840981 569009561 464940528
Market share 0.62 0.76 1.60
Although about fifty percent of total households under survey ever received healthcare from the SS clinics, the
regular customers – those who received healthcare for their recent illness – constitute only 19 percent of the
customers, or only about 10 percent of the total population in the catchment areas. The proportion of regular
customers is, thus, low at present. The proportion has to rapidly increase to establish a solid customer base. The
first targeted customers should be all regular or most of the ever – customers. But since they have already visited
the SS clinics at some points in time to receive health care, it will be relatively easy to motivate them to
completely switch over to the SS clinics. The irregular customers usually go to the other sources of care when
needed. Increasing number of non – customers should be converted into the regular customers of the SS clinics as
well. The process needs to be tuned to the process for building loyal customers.
Table A 6.2 demonstrates the major characteristics of the regular customer population. The vast majority of
regular customers in both rural and urban areas are the middle – aged females. A significantly high proportion of
them are without any education in both areas, although the proportions with the primary and the secondary levels
of education are not very low, indicating that the potential regular customers can be from any education group.
The regular customers are spread over all income groups, including the poor and the rich, in all areas. However,
among the regular customers in the rural areas, the proportion of lower middle income group people is highest,
About 10% of the population receive services
from SS clinics;
People spend about 3-5% of their expenses on
health care (out of pocket);
The rural SS clinics have a estimated share of
0.62 percent of the health care market in the
catchment area;
The market share of the urban (ordinary)
clinics is marginally higher (0.72);
The comprehensive clinics cover a larger
portion of the market (1.60).

SSFP Market Survey Report 37
followed by that of the hard – core poor, while in the urban areas the proportion of the middle income group is,
again, highest, but it is followed by the proportion of upper middle group of people. The majority of them sought
treatment for general sickness in both areas. High quality of services and low cost are the two main reasons for
them to receive health care from the SS clinics.
Table A 6.2: Major characteristics of regular customers (population) of SS clinics
Characteristics Rural regular customer Urban regular customer
Gender 71 percent females 77 percent females
Age 38 percent between 20 and 39 years,
another 39 percent below 15 years.
46 percent in 20 – 39 years’ age group
and 23 percent in 0 – 4 years.
Education
36 percent with no education, 23
percent with primary level education
and 15 percent with secondary level of
education.
30 percent with no education, 21 percent
with primary level education and 21
percent with secondary education.
Income group
21 percent hardcore poor
16.4 percent poor
34 percent lower middle group
18 Percent upper – middle
18 percent rich
19 percent hardcore poor
11 percent poor
37 percent lower – middle
20 percent upper – middle
13 percent rich
Main reason for choosing
SS clinic
54 percent said service quality
40 percent said low cost
54 percent said service quality
38 percent said low cost
Media habits
36 percent regularly watch television
and watch mostly BTV
6 percent listen to radio everyday
6 percent read newspapers regularly
51 percent regularly watch television
and watch BTV as well as Channel i,
ATN and NTV
4 percent read newspapers regularly
Smiling Sun brand has made some good impact in certain area of health services. In the survey areas, we found
that Smiling Sun brand is relatively strong market penetration in maternal healthcares and general sickness.
Among those who received maternal healthcare from different sources during the last six months, the proportion
of people receiving care from the SS clinics is quite high – 35 percent in the rural areas and 48 percent in the
urban areas. This indicates that a high proportion of people seeking maternal healthcare chose the SS clinics and
not any other provider, seemingly because they considered the quality of this healthcare of the SS clinics is better
than that of the alternative sources available to them. The same is partly true for the treatment of general sickness:
among those who sought treatment for general sickness, the proportion of the people who received the care from
the clinics is considerably high, about 10 percent in both rural and urban clinic areas. The disease wise market
share in provided in the following table.
Table A 6.3: Disease specific market share: SS clinic versus other service providers
Disease Rural Urban
n SS clinic Others n SS clinic Others
General Sickness /LCC 963 10.7 89.3 1276 9.0 91.0
Water born diseases 136 5.1 94.9 164 9.1 90.9
Respiratory problem 71 7.0 93.0 67 14.9 85.1
Skin diseases 64 7.8 92.2 99 4.0 96.0
Gastric and Abdominal 129 16.3 83.7 146 11.0 89.0
Maternal 37 35.1 64.9 91 48.4 51.6
Eye Problem 27 3.7 96.3 33 .0 100.0
Complex diseases 104 6.7 93.3 162 4.9 95.1
Surgery cases 31 6.5 93.5 35 2.9 97.1
Others 16 .0 100.0 22 9.1 90.9
SSFP Market Survey Report 38
4 FINDINGS OF THE CLINIC SURVEY
4.1 Background of SS Clinic
A major objective of the market survey was to assess effectiveness as well as efficiency of the Smiling Sun clinic
systems. The specific objectives were to assess the level of service utilization of the Smiling Sun clinic systems,
human resource profile, and their training needs, the need for improving physical condition of the clinics,
financial conditions of the clinic systems vis-à-vis the competitive environment. In order to derive information for
all these, a clinic survey was conducted that covered 25 Smiling Sun clinics representing various types and
locations.
25 static and comprehensive clinics were selected in the urban and rural settings. The Smiling Sun clinics were
categorized into three types: “Rural static clinic”, “Urban static clinic”, and “Comprehensive clinic”. Among the
25 studied clinics 10 were rural static clinics, 9 were urban static clinic, and 6 were comprehensive clinic (5 urban
and 1 rural). Besides, the survey also gathered information from 25 satellite clinics (one from each static clinic
randomly selected) to assess customer flow and income.
Smiling Sun clinics operate in a competitive market where there are other service providers both in public and
private sectors operate and provide similar range of services. In order to assess the level of competition that the
Smiling Sun clinic system face, a separate survey was conducted. The survey was conducted in the same locations
where the clinic survey was conducted; thus, it covered catchment areas of 25 Smiling Sun clinics.
During the NSDP, Smiling Sun clinic system introduced health mart within the complex of same clinics to
diversify income opportunity. Clinic survey also gathered information from the health mart about its sales,
product profile, operating cost and profit. The survey found that out of 25 static clinics, 11 clinics are now
operating health mart and the health mart survey was limited to these 11 clinics only.
This section provides the findings of the clinic survey and the discussions with clinic staff, other service providers
and key informants. The section has been organized as follows: sub section 4.2 will describe utilization of clinic
services which include customer flow and services, service providers’ capacity utilization, lab facilities etc.
Subsection 4.3 will describe human resources, which include staffing, turnover, staff profile and their
development needs. Subsection 4.4 will describe clinic-operating cost, which includes fixed cost and variable cost
of clinics, cost recovery, cost structures, etc. Subsection 4.5 will describe clinic revenue by sources, and income
of static as well as satellite clinics. Subsection 4.6 will describe the physical condition of clinics, which include
infrastructure and condition of the clinics and their needs for development. Subsection 4.7 will describe local
level awareness raising approaches and their relative effectiveness. Sub section 4.8 will describe health mart
feasibility, which includes sales, product details, operating costs, profit and loss status. Subsection 4.9 will
describe the competitive environment of the Smiling Sun clinic, which includes the profile of the competitors,
strengths and weakness of the competitors, and so on.

SSFP Market Survey Report 39
4.2 Utilization of Clinic Services
Smiling Sun service delivery system provides health care services through its clinic network with static clinics at
the centre and satellite service delivery sessions at the community level (which are held at fixed satellite spots).
Both the urban and rural set ups are providing similar nomenclature of services with the difference that the static
clinics in the urban set ups are managed by doctors and paramedics, while the rural set ups are primarily managed
by paramedics alone. Therefore, different level of service providers along with infrastructure and equipment
facilities in the clinic types have made Smiling Sun clinic
system similar, with differences degree of service range.
That is to say, Smiling Sun clinic system offers different
level of services within ESP.
4.2.1 Customer Flow at Static Clinic
Presently Smiling Sun clinic system operates three types of
clinics. There is a degree of service differentiation in
different clinic types. A comprehensive clinic provides the
highest range of services while a rural clinic provides only
the ESP. There is a correlation between the service range
and customer flow: the number of customers is higher at
those clinics that provide larger package of services.
The service statistics of customer flow information for the
static clinics from November 2006 to October 2007 was
gathered to gauge the level of customer flow and their
pattern for three different types of clinics. Yearly customer
flow is averaged on a day basis to assess the degree of
utilization of clinic facilities. The service statistics revealed
that average daily customer flow at a rural, urban and
comprehensive clinic was 41, 55 and 87 respectively.
Customer flow was seen to be related to numbers of services, as the average customer flow at a comprehensive
clinic is more than twice a rural clinic and 60 percent higher than that at an urban clinic.
Similarly, urban clinic receives more customers than does the rural clinic but significantly less than does the
comprehensive clinic. This needs to be read in the context that urban and comprehensive clinics are managed by
doctors and comprehensive clinic provides better range of services including EmOC and improved lab facilities.
In order to assess capacity utilization, it is necessary to estimate the service capacity of the Smiling clinics. As of
now no such estimate is available to set the service capacity standard for the various types of Smiling Sun clinics
and this survey also did not made any attempt to estimate that. Cost structure and staff utilization conducted in
2005 by NSDP estimated that service providers (doctors and paramedic) spent about one third of their time for
direct service delivery; remaining time was calculated as non-patient contact time and down time. The same study
also revealed that nearly 87% of customers received services during the peak hour from 9.00 am to 1.00 pm.
During the present survey we observed hardly any customer before 10.00 am and after 2.00 PM, particularly, in
the rural area. This suggests that a good amount of unutilized capacity exits at the Smiling Sun clinic system.
Average daily customer flow in
comprehensive, urban and rural clinics was
87, 55 and 41, respectively; customer flow
per session at urban and rural satellite
clinics was found 52 and 69, respectively;
Customer flow varied significantly in
comprehensive and urban clinics; however,
customer flow at the rural clinics remained
consistent over the year;
Highest proportion of customers (more than
30%) visited static clinics for LCC services;
The proportion of customers who received
FP services was 23 percent at the rural
clinics, 7% at the comprehensive clinics and
12% at urban clinic;
Estimated minimum un- utilization at the
Smiling Sun clinic systems was found 30%
or more;
Limited scope of drug prescription in the
rural clinics has also resulted in low
customer demand for services.

SSFP Market Survey Report 40
4.2.2 Clinic Capacity Utilization
For a firm, optimum capacity is defined as the level of output, which corresponds to the lowest point of the
average cost curve5. But to accurately estimate the optimum level, cross-section data are needed for a pretty
longtime (so as to ascertain the trend of costs over time). Collection of these data remained outside the scope of
the present study. Given this constraint, attempts were made here to assess the minimum amount of unutilized
capacity, which exists in the clinics at present, using the following measure:
Minimum amount
of utilizing
capacity
Daily client flow at
the best performing
clinic
-
Average daily
client flow of
similar clinics
= X 100
Daily client flow at the best performing clinic
Based on the above measure, we used best service performance based on a full year service statistics of customer
flow as a tentative measure to set standard as far as clinic capacity is concerned. Following table shows the
tentative capacity standard of Smiling Sun clinics and the comparison made between the best performance6 and
the average daily service delivery to arrive at the measure to estimate the level of unutilized capacity. Smiling Sun
clinic therefore can absorb additional customer load with the existing set up and facilities by enhancing demand
and improving management efficiency.
Following table drawn from the service statistics reveals that among same categories of clinic, wide variations
exist. According to the best performer, Smiling Sun clinic system has a minimum of 30% or more unutilized
capacity. These figures correspond to the earlier study findings of 30% downtime for the service providers.
Nonetheless, best performing clinic might still be running below capacity. A time series data for few years can
effectively establish capacity standard for various clinics under the Smiling Sun brand. Best performance of rural
clinic is way below than that of other clinics and difference between the best performance and least performance
was also low in comparison to that of other clinic types. This suggests that there are structural issues embedded
within the format of whole rural clinic system.
Table B 1: Illustration of capacity utilization for various clinic types7
Clinic Types No. of clinic Best performance Least
performance
Average Service
delivery
Minimum
unutilized
capacity
Comprehensive
Clinic 6 142 72 87 38%
Urban Clinic 9 88 42 55 37%
Rural Clinic 10 58 32 41 29%
Low performance of rural clinic is consistent and embedded with the contextual reality. With existing set up and
service range, increased customer flow has been constrained by the low service demand from the customers.
The survey also analyzed the customer flow based on various health services. Figure B1 revealed that highest
percentage of customers who came to clinics was for LCC services. The proportion of customers receiving LCC
was 40 percent in rural clinics, 31 percent in urban clinics and 33 percent in comprehensive clinics. In respect of
the amount of use, LCC was followed by child health in the urban and comprehensive clinics, but for rural clinics
it was family planning. In the comprehensive clinics, only 7% customers came for family planning services, while
the proportion was 23% in the rural clinics. Interestingly customer flow for maternal health such as ANC/PNC,
5 See Annex-D for a detailed theoretical analysis on the financial sustainability issues of the SS clinics. 6 Best performance is calculated based on the highest number of customers served in a particular clinic over a full year period
divided by 296 days that clinic was functional. Similarly least performance is calculated based on the lowest number of
customers served in a particular clinic over a full year period divided by 296 days that clinic was functional. 7 Daily customer flow performance is calculated based on 296 working days of clinic between November 2006 and October
2007.

SSFP Market Survey Report 41
EmOC was much higher in urban and comprehensive clinics than that for family planning. Interestingly referral
was almost non-existent in all types of clinics.
Figure B1: Percentage distribution of customer flow for various health services in urban clinics
0 5 10 15 20 25 30 35 40 45
Child Health
Maternal Health
Family Planning
LCC
EmOC
Referral
RTI/STI
Others
Comprehensive clinic Urban clinic Rural clinic
Monthly customer flow data over the last one year as presented below shows a drop of customer flow in the later
part of the year. Customer flow in the rural clinic found to more consistent than the other clinic types. Customer
flow in the comprehensive clinic fell dramatically in the later part of the year. It is difficult to assume any
seasonality with just using one year of data. The gradual fall in customer flow might be attributed to the fact that
the NSDP program cycle was closing during that period.
Figure B2: Daily average customer flow for health services in three types of SS clinic from November 2006
to October 2007.
0
20
40
60
80
100
120
140
Nov Dec Jan Feb Mar Apr May Jun Jul Aug Sep Oct Total
Urban Rural Comprehensive
4.2.3 Customer Flow in Satellite Clinics
Smiling Sun clinic systems run thousands of satellite all year round at the clinic catchment areas. Rural clinics
operate more satellite clinic than the urban satellite to cover wide spread areas. A large number of the rural
satellites are situated in the hard to reach areas. Rural satellite sessions are usually held monthly, while urban
satellites are held weekly with few exceptions.
The survey made an attempt to assess performance of the satellite clinics in terms of customer flow and income.
One satellite was selected randomly from each of the 25 sample clinics. We had collected data of one-year
customer flow to gauge the customer flow at satellite clinics. Those data were analyzed by rural and urban
consideration recognizing the fact that service range for the satellites are quite similar across region and clinic
types.

SSFP Market Survey Report 42
Figure B3: Average customer flow in a satellite session from November 2006 to October 2007
Average customer flow in Satellite clinic
0
20
40
60
80
100
Nov Dec Jan Feb Mar Apr May Jun Jul Aug Sept Oct
Urban
Rural
Pattern of customer flow in the satellite clinics were found to be just opposite of the same of the static clinic.
Rural satellite clinics attracted more customer than the urban satellite clinics. Discussions with the customers as
well as clinic staff explained this that rural people preferred to go to the nearby satellites than to travel a long way
to the static clinics, particularly when services were similar. Except at few cases, difference in service between the
static and the satellite clinics is minimum at the rural areas where as in the urban areas satellite clinic provides the
basic services but higher level services including doctor’s services are available in the static clinic.
Based on one full year customer data the survey revealed that average daily customer flow in rural static clinic
was only 41 while it was 69 for a satellite session. Therefore, more customers are visiting satellite clinic than the
static clinic in the rural area, which raises issues of efficiency of the static clinic. The situation is little better in the
urban areas where on average 55 customers received services from the static clinic as against a daily average of
52 customers in one satellite spot.
LCC and family planning were found to be the main services used by the customers in both urban and rural
satellite clinics. In the urban satellite highest proportion of customers (25 percent) took service for family
planning, more specifically, injectables, followed by LCC and child health (both at 23%). On the contrary in the
rural satellite clinics, LCC was the most commonly used service (by 37 percent), followed by FP, specially
injectable (by 31 percent). Services related to child health were found to be lower in the rural satellite than in the
urban satellites.
Following figures provides detail analysis of the health service pattern in the urban as well as rural satellite
clinics.
Figure B4: Health services pattern in urban satellites
Child Health
23%
Maternal Health
19%
FP
25%
LCC
23%
RTI/STI
8%
Others
2%

SSFP Market Survey Report 43
Figure B5: Health services patter in rural satellites
Child Health
13%
M aternal Health
15%
Family Planning
31%
LCC
37%
Others
1%
RTI/STI
3%
4.2.4 Service Provider’s Time Utilization
At the clinics, the doctor and the paramedic are main service providers and counselors assist in dispensing clinic
services. In this survey, attempts were made to gauge as to how many customers a service provider serves on a
typical day. It was found that in a typical day a doctor serves more than 20 customers in all comprehensive clinics
while in only 50% urban clinics a doctor serves more than 20 customers. In other 50% urban clinics a doctor
serves less than 20 customers in a day.
Similarly, paramedics also provide services in all types of clinics. There is a policy limits on the paramedics that
compels them to prescribe only a limited number of drugs. This policy is discouraging the customers from
receiving services from the paramedics. It was found that in a typical day, in 80% of the rural clinics, a paramedic
serves more than 20 customers; while in 60% of the urban and the comprehensive clinics, a paramedic serves
more than 20 customers. Observation of the clinics revealed that service providers have a considerable amount of
downtime particularly in the afternoon.
4.2.5 Waiting Time
Waiting time is seen as an important indicator of service quality. Smiling Sun clinic system generally ensures
speedy delivery of services. As household data showed, around 60% of customers in the rural areas and more than
45% of customers in the urban areas were satisfied with the service delivery speed. Clinic observation data show
that in about 80% of the rural and urban static clinics maintain a customer waiting time is less than half an hour.
Waiting time is relatively longer in the comprehensive clinics where customers are to wait approximately 45
minutes for service delivery. Customer waiting time was nowhere found more than 45 minutes in the 25 surveyed
clinics.
4.2.6 Laboratory Facilities
Laboratory facilities were found available at 21 clinics out of the 25 clinics surveyed. In most cases, utilization of
lab facilities remains low. About half of the labs are conducting less than 10 examinations a day. Lab utilization is
better in the comprehensive clinics and very low in the rural
clinics. Annex table B 2 provides the number of lab tests
conducted in the clinic on a typical day.
The clinic customers generally use laboratory facilities.
Rarely non-customers come to the lab to get tests done.
Public awareness of the lab facilities was found to be low in
the HH survey. This was substantiated by the fact that clinic
management hardly made any promotional activities around
the lab facilities. Income from labs found to be good even in the context of low utilization rate. If the utilization
improves, this can be a real income earner for the clinics.
About of half of the existing pathological lab
are conducting less than 10 tests in a typical
day;
Service providers have considerable
downtime particularly in the afternoon for
lack of customer.

SSFP Market Survey Report 44
4.3 Human Resource
Smiling Sun clinics operate in three different models, each with own staffing pattern. Each clinic is staffed with a
clinic manager and a number of service providers and support staff. At the clinic level as many as 14 different
positions were found. Rural clinics have 13 positions. The medical officer position exists in the comprehensive
and the urban clinic. Clinic managers in the urban and rural clinics are service providers as well, but in the rural
clinics managers are general management staff.
Staffing size and levels considerably vary in the urban as well as comprehensive clinics. On average a
comprehensive clinics have 26.6 staff while an urban and rural clinic on average have 14.6 and 17.5 staff. Among
the staff in the comprehensive clinics 63% are directly involved in service delivery8, the proportion is 55% and
49% at the urban and the rural clinics respectively. The rest of the staff are involved in overhead activities
including clinic management and support services. However, service providers also spend a good amount of time
in overhead activities as mentioned earlier. Average staffing pattern by clinic types is provided in the Annex table
B 3.
4.3.1 Service Length and Turnover
Service length provides an indication of staff stability at the
clinic level. Average service length of service providers is
lower than that of non-service providers. Annex table B 3.1
shows that staff service length is higher in the rural clinics
than in the other two clinic types. Among the service
providers, service length is relatively low for professional
doctors, some of whom are clinic managers as well. Rural
clinic manager’s service length is higher than the same of
urban and comprehensive clinic managers.
Smiling Sun clinics suffer problem with the staff turnover
over the years. Among the various categories of professional staff, paramedics were the most stable though
annualized turnover rate in the last one year was 11% (n=126). On the other hand doctors’ turnover was very high
at 65% (n= 27) Clinic managers of comprehensive and urban clinic who themselves are also doctors had high
turnover rate. Turnover of rural clinic manager was relatively low. Among the various clinic types, turnover rate
was found to be higher at the comprehensive clinic for all types of positions. On the other hand turnover problem
in the rural clinic was least in the last year.
8 Direct service delivery staff are: Doctor, Paramedic, Counselor, Clinic Aide and Lab Technician
Staffing pattern is different for three types of
clinics. Average size of staff in
comprehensive, urban and rural clinics was
26.6, 14.6 and 17.5, respectively;
Staff turn over was highest among the
medical officers (65%), followed by clinic
manager with medical background;
Paramedic position is relatively stable with
low turnover;
IMCI and safe delivery are the most sought
training programs by the service providers.

SSFP Market Survey Report 45
Figure B6: Position wise turnover rate by clinic types
0
10
20
30
40
50
60
70
80
Clinic
Manager
Medical
Officer
Paramedic SPO SP Lab
technician
Office
Assistant
Overall Urban Clinic Rural Clinic Compre. Clinic
4.3.2 Staff Skills and Development Needs
Clinic staff used to have opportunities for professional development training for many years including the NSDP
period. In fact most of the staff currently working in the clinics received training from NDSP, besides other
sources. High attrition rate of staff drained out lot of training skills from the Smiling Sun clinic systems. The
training provided in the past focused on the job skills of service providers in particular but also to some extent on
the non-service providers.
Service providers: Doctors and paramedics are the main service providers in the Smiling Sun clinic system.
Therefore, the professional skill development trainings on important issues were imparted to them. In the context
of clinic service mix, a degree of training is necessary for doctors as well as paramedic to ensure good quality
services. Training profile suggests that some critically important training were not imparted to all staff. Besides,
high attrition rate particularly among the doctors had drained out considerable number of trained doctors, which
cause new training needs for the current set of doctors.
During NSDP many of the paramedics received training on some core skill areas including clinic management,
ORH, IMCI facility, child survival intervention (CSI), FPCSC, safe delivery etc. However, there are still many
more who need to be trained on these issues. Major training needs for the service providers are:
Integrated Management of Childhood Illness- IMCI facility;
Safe Delivery/EmOC;
Norplant;
Clinic Management Training;
STI/RTI and HIV/AIDS;
Child Survival Intervention;
Other Reproductive Health (ANC/PNC).
Training expectation varies significantly in urban and rural clinics. Paramedics based in urban clinics expressed
their need for training inputs on IMCI, STI/RTI, ORH while paramedic from rural clinics emphasize on need for
safe delivery training. Annex table B 5 shows the training needs of the service providers derived from 25 clinics
surveyed.
Clinic Manager (Rural): Rural clinic managers mostly had masters degree in general education. They are
responsible for clinic management but do not provide services. In the past some of them received training on BCC
and service promotion, quality monitoring, and financial management. Results of training need assessment
showed that some clinic managers still need training on quality monitoring, financial and logistics management,
and BCC.

SSFP Market Survey Report 46
Service Promoters: They are mostly graduates in general education. There were 70 service promoters in the 25
clinics surveyed. It was found that only 22 of them received training on BCC and service promotion. However, 11
of them received training on IMCI. During the survey 29 service promoters expressed their need for BCC and
service promotion training while 10 of them demanded for IMCI training.
Lab Technician: The survey found 15 lab technicians were working in the clinics under the survey. 4 of them
received training on laboratory diagnosis. During the survey, only 3 of the remaining 11 lab technicians had
expressed need for this training.
Office Assistant: They are primarily the administrative staff based at the clinic levels. We found 15 office
assistants working at the surveyed clinics. 5 of them received training on finance, admin and logistics
management while another 7 had expressed need for such training. Some managers from rural clinics had also
expressed the need for this training.
Detail information of training received by the clinic staff as well as perceived training need by clinic staff
positions are available in Annex table B 4 and table B 5 respectively.
4.4 Clinic Operating Cost
Clinic operation incurs different of costs that vary between clinic types. Comprehensive clinic incurs more than
twice the cost of operating a rural or an urban clinic does. However, operating cost of urban and rural clinic is
quite similar. The structure of cost various substantially
among the clinic types.
4.4.1 Cost Structure
The service statistics show that operating a
comprehensive clinic costs around BDT 3.3 million per
annum while annual operating cost of urban and rural
clinic was around 1.4 and 1.7 million, respectively.
However there is wide variation in cost structure. Fixed
cost accounts for a bulk of the total cost in all cases. Fixed
cost is highest in the urban clinics and lowest in the rural
clinics. Figure B7 shows that fixed cost of urban clinic
was as high as 86%, while it was 80% for comprehensive
clinics and 67% in rural clinics.
Figure B7: Cost structure and cost recovery at various clinic types
86
67
80
-
20
40
60
80
100
Urban Rural Comprehensive
Fixed Cost Ratio
Variable Cost Ratio
Cost Recovery
Annual operating cost of comprehensive,
urban and rural static clinics were BDT 3.3,
BDT 1.4 and BDT 1.7 million, respectively;
Fixed operating cost of comprehensive, urban
and rural static clinics were 80%, 86% and
67%, respectively;
Cost recovery rate in comprehensive, urban
and rural static clinics were 44%, 32% and
22% respectively;
More than 70% of the fixed cost incurred for
personnel which was as high as 87% in rural
clinics;
About 50% of the salary expenses in the rural
clinic are paid to non-service providers; in
comprehensive clinic it was about 27%;
Fees (for depot holders, consultants etc)
constitute the highest proportion of variable
costs.

SSFP Market Survey Report 47
4.4.2 Fixed Cost Analysis
Detail analysis of fixed cost suggests that salary and benefits account for most part of the fixed cost though slight
variations were observed among the clinic types. At the sample rural clinics average salary cost accounted for
more than 86% of the clinic fixed cost, which was 82% at the urban clinics and 70% at the comprehensive clinics.
Other than salary and benefits the major fixed costs were purchased services and office rent. Details of clinic
fixed cost are provided in Annex table B 6.
As far as salary costs are concerned the survey revealed that in the comprehensive clinics 73% of the total salary
were paid to the service providers while in the rural clinic only 51% of total salary are paid to the service
providers. In urban clinics service provider got 66% of the salaries. This suggests that salary expenditure is
incurred mostly for the service providers in comprehensive and urban clinics, while in the rural clinics salaries of
service providers and non-service providers are almost equal.
Annex table B 7 and B 8 provides further insights into the salary cost structure. Salary of paramedics constitutes
the highest salary expense, followed by that of service promoters. Clinic manager, though only one position in
each clinic, accounts for about 10% of the salary bill.
4.4.3 Variable Cost Analysis
It was observed earlier that proportion of variable cost is lower in the urban and the comprehensive clinics than in
the rural clinics. Main reason for this was that in the rural clinics travel and fee cost are much higher than in the
other two clinic types. Rural clinics operate satellite centers in hard-to-reach areas, which requires high amount of
travel cost, but it is much less in the urban areas. In the cost category, fees consists of professional fees paid to
specialist doctors on the one hand and the remuneration provided to the depot holders on the other. In the rural
clinics fees are paid to the DHs but in the urban areas this amount is paid to the specialist doctors. Actual amount
spent for service promotion and marketing is negligible if we consider that large sections of catchment population
are unaware of Smiling Sun clinic and its service range. Details of variable costs are available in Annex table B 9.

SSFP Market Survey Report 48
4.5 Clinic Revenue
Smiling Sun clinics earn income by selling its services to the customers though a significant part of the services
that goes to the PoP cardholder or popularly known as LA population does not fetch any income. Average earning
does not differ very much by clinic types, but comprehensive clinics’ earning surpasses the earning of other clinic
types by wide margin. Average annual earning of urban and rural clinics was close to BDT 400,000 while
comprehensive clinics on average earned BDT 1.6 million in the last one year. Cost of operating a comprehensive
clinic was twice as much as that of other clinics, but it earned four times more than did other clinic types.
More than 50% of revenue came from
service charges in all clinic types. More than
20% income of the comprehensive clinic
came from EmOC, which was very
negligible in other clinics. Earning from
pathological tests was quite high, even
though this services were not available in
some urban and many rural clinics. After
service charges, sales of family planning
commodities bring highest income for the
rural clinics. See Annex table B 10 for detail
income.
Figure B8: Clinic category wise income proportion
- 10 20 30 40 50 60 70 80 90 100
Registration
Service Charges
Pathological
Medicine Sale
FP Commodities
EmOC Packages
Other Commodity Sale
Local Donations
Other Income
Total (Av. Tk.)
Urban Rural Comprehensive
The survey collected detailed breakdown of service charges to show the relative demand for services. The
breakdown of service charge income exhibits that the demand for services varies significantly among the clinic
types. In the rural clinics as mush as 60% of service charge earning came from family planning services while this
service bring insignificant income for urban clinic in general and for comprehensive clinics in particular. Service
charge revenue from LCC related services is low in rural and comprehensive clinics but quite high in the urban
clinics. Most of the service charge earning for comprehensive clinic came from maternal health including EmOC
services. Following figure shows more details.
Average earning of urban and rural static clinics are almost
same (BDT400, 000) while a comprehensive clinic earns four
times more;
About 50% of clinic earnings come from selling services;
20% income of comprehensive clinic comes from EmOC
packages;
Proportion of earning from family planning related services and
sales are significant in rural clinics, but it was quite
insignificant for other types of clinics;
Pathology was the 2nd most important earner for urban clinic
after service sales;
A satellite session earns on average Tk 208 and BDT 490 in
urban and rural settings, respectively.

SSFP Market Survey Report 49
Figure B9: Proportion of service charge earning for various services by clinic types
-
20
40
60
80
100
Child Health Maternal Health FP LCC EmOC
Urban Rural Comprehensive
4.5.1 Income of Satellite Clinic
Like static clinics satellite clinics also sell services. The market survey gathered annual income data of one
particular satellite clinic for each of the 25 surveyed clinics. Wide variations were found in the earnings among
the satellite clinics both in the urban and rural areas. Annual earning of satellite clinics ranged from BDT 3,000 to
as high as BDT 100,000. To avoid the extreme cases, we used a more conservative estimate to calculate the
average annual earning of satellite clinics, which is provided below.
It was observed that in the urban area, satellites are mostly held on a weekly basis whereas in the rural area they
are held on a monthly basis with some exceptions. Satellites with higher frequencies were tended to have higher
income. Urban satellite earns more than the rural satellite in absolute terms, although rural satellites earn much
more than twice (BDT 490) of urban satellites per session.

SSFP Market Survey Report 50
4.6 Physical Condition of Clinics
Clinics’ physical conditions refer to infrastructures and equipment facilities of the clinics, which include
ownership and condition of the buildings and facilities for the customers and the service providers.
Infrastructure facilities: The survey found that most of the clinics are developed on rented facilities, which do
not suit the purpose of clinics in most cases. However, five clinics out of the 25 sample clinics were actually built
on own property. Physical facilities and clinical arrangements are much better in the own buildings than in the
rented buildings. 19 clinics are based on concrete foundation; the remaining 6 were tin-shed buildings, mostly in
the rural areas. Within the limited maneuverability, Smiling Sun clinics have arranged required establishments
and facilities as needed.
Waiting room: 17 out of 25 clinics were found to
have well arranged waiting room which are adequate
for the customers. Others have one or more
limitations in terms of space, lighting, ventilation
and so on. Common waiting room for male and
female is an issue, though the numbers of male
visitor is quite low.
Toilet facilities: In 15 clinics we found that there is
no separate toilets for males and females. The
problem was found more acute in the urban and the
comprehensive clinics where nearly all the clinics
have common toilet. Lack of space and inadequate
toilet facilities were the key reasons for arranging common toilet. Situation was much better in the rural clinics.
Privacy: All clinics do not have necessary infrastructure and building layout to provide adequate privacy to
customers. Privacy issues were found to be adequately addressed in 19 clinics. In other 6 clinics, privacy remains
an issue that needs to be sorted out. No significant difference was found among the types of clinics.
Operation theatre: Except three (1 in urban and 2 in rural clinics), all the surveyed clinics have one or the other
forms of operation theatre. Some OT has full operation facilities such a cesarean section and other are equipped
for IUD etc. Only 3 OT theatres were found to be well equipped to perform the necessary procedures. 17 others
were found to be moderately equipped to perform the procedures while the remaining two were poorly equipped.
Moderately equipped OT either lacks required physical infrastructure or equipment or both.
4.6.1 Infrastructure and Equipment Needs
The immediate need for infrastructure and equipment was analyzed in this survey. Detail discussions were held
with the respective clinic staff to identify the needs and reason. Clinic management has mentioned the needs with
the perspective of increased earning and clinic sustainability. It was expected that the new infrastructure and
equipment will enhance customer flow and thereby income
to the clinics. Ultrasonography and lab facilities were given
the highest priorities as required equipments, where as
construction of buildings got the over all emphasis from the
clinic staff.
Equipment needs are different for different clinic types.
Comprehensive clinics are already equipped with
Ultrasonogram, EmOC unit and ambulances. Improvement
of lab facilities and other diagnostic tools such as ECG
machine are priority need for the comprehensive clinics. On
the other hand rural clinics have very limited equipments. More than half of the rural clinics opted for
Ultrasonography (80%), safe delivery unit and comprehensive lab facilities as they consider this equipment will
enhance service range as well as income for the clinics. A professional doctor will be necessary for rural clinic to
use this equipment. Like rural clinics, more than half of the urban clinics have need for Ultrasonogram.
Comprehensive laboratory and EmOC unit were second in priority on the list of equipment needs. Urban clinics
20% of clinics are built on own building, mostly in
rural areas. The rest are on rented premises;
Waiting room in 70% clinics are good, about half of
the waiting room in comprehensive clinics were
inadequate in space and facilities;
60% of clinics have common toilet, 70% of rural
clinics have separate toilet facilities for male and
female;
More than half of the rural and urban clinics
express their need for Ultrasonogram and safe
delivery facilities; comprehensive clinics need ECG
machine and improved lab facilities.
Comprehensive clinic: ECG machine,
extended lab facilities and building
construction;
Urban Clinics: EmOC facilities,
Ultrasonogram, lab facilities;
Rural Clinics: Safe delivery, lab facilities,
improvising OT facilities, upgrades
pharmacies.

SSFP Market Survey Report 51
already have doctors who can operate these equipments but they need some training. Clinic type wise
infrastructure and equipment need are provided in Annex table B 11.
Smiling Sun clinic have a pharmacy with a limited stock of medicine in terms of volume and types. In most cases,
clinic needs to prescribe medicines that are not available in the pharmacy. Clinic staff express the need for
extension of medicine item in the pharmacy stock.

SSFP Market Survey Report 52
4.7 Local Level Awareness Development and Market Promotion
The clinics have been conducting awareness rising activities to promote health and family planning services. The
service promotion officers as well as the service promoters are responsible for local level service promotion
activities. Local level service promotion activities primarily operate within the catchment areas. Clinic
management resorts to various methods of communication and promotional activities, which were adopted by
NSDP the smiling, sun clinic system for local level awareness and service promotion. Besides, clinic managers
plan innovation and opportunistic measures to disseminate clinic information and health awareness to the local
public through involvement in local sports, cultural activities, debate competition, etc.
The clinic staffs were asked to assess the relative effectiveness of the local level promotional events and rank the
top three methods. The self-assessment shows that community level campaign such as cultural events, film show,
courtyard meeting with female and bazar meeting9 with male work best for local level service promotion,
followed by home visit and signboard/billboard. Results of the HH survey as well as the focus group discussions
fully substantiate the opinion of the clinic staff. There was some difference between urban and rural setting in
service promotion. Community level campaign is more
effective in the urban areas while home visit was said to be
more effective in the rural areas.
It was observed that local level service promotion is very
much limited to in and around the satellite clinic spot.
Catchment area in the rural area is quite spread and
dispersed. Very little awareness activities are done outside
the satellite catchment areas. Among the various services,
family planning and immunization get preference in the promotional activities, which is why most of the local
people recognize the Smiling Sun clinic system fundamentally as service facility for family planning and children
immunization centre.
FGD participants expressed their dissatisfaction over the promotional activities of the clinics. Service promoters
received very little training in communication and service promotion. Survey findings show that most of the
service promoters hardly received any training in their service life. Besides, there was very little allocation of
money for promotional activities. In the bridge grant, only 1% of the clinic budget was allocated for local level
marketing and BCC. Analysis of last year’s clinic expenditure reveals that actual expenditure incurred for local
level service marketing remains in the range from 1.5 % to 2.5%. On average only an amount of BDT 37,000 was
spent last year in the rural clinics for marketing, although rural clinic covers as high as 36 sq kilometer catchment
areas. On the other hand, about 21% of the clinic level salary costs were incurred by the service promoters.
Conditions of urban and comprehensive clinics were found similar in this respect.
Issue and challenges for clinic:
Smiling Sun clinics are functioning under some constraints that have significant implications for their
performances. Clinic staff expressed their confidence that if those issues were addressed with necessary corrective
measures, Smiling Sun clinics would have much improved performance and income. Some issues are common
and endemic for all types of clinics, such as inadequate quality of service providers (particularly doctors), lack of
equipments, and inadequate training of staff, etc. Low salary and wage was also considered as an issue for the
staff who consider it low in relation to others.
9 Bazar meeting is a informal discussion session with the people coming at a market place. In the rural area, male are most
available at market place in the afternoon when such meeting can take place.
Community level campaign and home visits
are perceived as the most effective methods
for local level service marketing;
Service promoters lack competence to
enhance promotion;
Budget allocation for local level service
promotion remains low.

SSFP Market Survey Report 53
4.8 Health Mart Feasibility
During the NSDP program cycle, Smiling Sun clinics had introduced health mart as a sustainability strategy to
augment income. Clinic survey strived to observe the existing health marts and to assess the feasibility of the
health mart idea for clinic sustainability. It was found that, out of 25 clinics surveyed, only 11 clinics are currently
operating health marts, 5 in the urban clinics and the rest 6 in the rural clinics. Performance level varies widely
between the urban and rural health marts. Urban health marts are performing better than that in the rural areas,
though not adequate in financial terms. Daily average sales
were about BDT1000 and BDT 600 at urban and rural
health marts, respectively. Average sales in the urban health
mart were 60% higher than that in the rural health marts,
but the amount of fixed cost for operating a health mart was
almost similar. It is worth mentioning that some fixed cost
items such as space and utilities were not included in the
calculations.
Based on the last six-month financial performance, it revealed that urban health marts made just enough profit to
pay for the salaries of the staff (here mentioned as fixed cost). Gross profit of the rural clinics remained far below
the fixed cost, and thus they made net loss.
Figure B10: Financial performance of existing health mart
-5000
5000
15000
25000
35000
Monthly Sales Gross Profit Fixed Cost Net Profit
Urban
Rural
The above figure gives the average sales but wide discrepancies were noticed between the health marts of the
urban and the rural areas. In the urban health marts the monthly average sales ranged from as high as BDT 48,900
to as low as only BDT 3925. Like wise, in the rural health mart monthly average ranged from BDT 60,000 to as
low as BDT 2028. The differences are indeed quite significant and thus the average figures needs to be treated
carefully. From sales and gross profit figures, it was estimated that the profit margin on sales was around 10%.
Price at the health mart is competitive in comparison to local market. Most of the items are sold based on MRP,
but some commodities such as cooking oil and food items are sold at a lower than market price.
Discussions with the clinic staff reveal that there was no market survey done before setting up the health mart.
Besides there were some practical issues emerges during the discussions which include: Customer flow in the
clinics is not enough, clinic locations are away from the market place, health mart can not offer credit sale that is
quite usual in local market place, and there is limited promotion done on health mart.
The health mart issues were discussed at the FGDs with community people, both males and females. It appeared
from the discussions that only a few participants had actually bought some commodities from the health marts.
The items bought include soap, baby food, snacks, cosmetics and household consumables like sugar, ghee, etc.
They find the price reasonable, and the locations convenient in that they can buy while coming to clinic for health
services. But most of them had never bought anything from the health mart. Many of them appreciated the idea of
health mart. Detail of items according to sales turnover is provided in Annex B 12.
Monthly sales of health marts were around
BDT 30,000 and BDT 16,000 in the urban
and the rural area, respectively;
Profit margin or mark up on sales was
around 10%;
Operating loss was observed in both areas,
though higher in rural areas.

SSFP Market Survey Report 54
4.9 Smiling Sun Clinic: Competition Scenario
Smiling Sun clinics operate in a competitive environment. Key competitors include government health facilities,
private clinics, doctors, pharmacy and local health service providers. These providers’ deliver similar services as
that of the Smiling Sun clinic. Each Smiling Sun clinic has a mandated service area called catchment area where it
offers its services. However, except for family planning servings, it can serve population of other areas as well. In
order to map the level of competition, the survey strived to gauge the composition and the relative strengths of
other service providers operating within the catchment areas.
Pharmacies and local doctors are very active in all areas, but
more in the rural areas.
The size of catchment area widely varies between urban and
rural clinics. Average size of catchment area for the urban
clinic was found to be around 7 square kilometers, whereas
it was 39 square kilometers for the rural clinics. The survey
found that an array of service providers exists within the
catchment areas, which are providing similar service. Table
B 13 describes the number of various types of competitors
operative within the catchment areas of Smiling Sun clinics
both in the urban and rural areas.
Table B 13: Average number of major competitors of SS clinic by type
Competitors Type Urban
(Average per SS
clinic)
Rural
(Average per
SS clinic )
Overall
(Average per
SS clinic)
Govt. Hospitals and Clinic 2.4 3.0 2.7
Private Clinic 4.8 3.5 4.2
NGO Health service Centre 1.7 1.2 1.5
Private Practitioners 16.8 9.5 13.6
No. of Pharmacies 86.4 71.8 80.0
No. of other service providers 23.1 53.0 36.3
Level of competition from all providers is not same. The survey team studied the most important competitors to
better understand the intensity of the nature and depth of competition. Five most important competitors were
identified from each clinic catchment area for further study.
Proximity to the customers was a key advantage for the Smiling Sun clinics. However, the study revealed that in
most cases there are other providers operating close by. The study revealed that about 10 clinics out of 14 have
competitor(s) operating within 1 KM in the urban areas, while in the rural areas, 3 out of 11 clinics face
competition from others within 1 KM. The survey further reveals that all the 25 studied clinics have competitors
operating within three KM.
Smiling Sun clinics lack adequate qualified doctor as compared to the govt. facilities and the private clinics and
this has been rated as a weakness of Smiling Sun clinic vis-à-vis its competitor. Number and quality of doctors are
directly related with service range. The mapping exercises revealed that some major competitors have well
qualified doctors either full time or part time. Government health facilities within the catchment area not only
have the best quality doctors but also have doctors with different specialties. Private clinics have also doctors but
on most occasions it hires doctors on a part time basis. Like private clinics, most of the NGO clinics under survey
were also found to have part time or full time doctors. It may worth mentioning that Smiling Sun clinics based in
only the urban areas have doctors, but in most rural clinics no doctors is available. Annex table B 14 provides the
details of availability of doctors in various health facilities in the catchment area.
Smiling Sun clinics are well recognized as low cost quality health service provider. But they face serious
competition on the cost ground. Government hospitals and clinics provide similar services as well as selected
medicines free of cost. All family planning services and materials can be found free of cost at the government
facilities though quality and providers’ behavior are not perceived as good. On the other hand, private clinics
All Smiling Sun clinics have one or more
competitors each within three KM; in urban
areas, 70% clinics have competitors within
1 KM while in rural area 27% clinics have
competitors within the radius of 1 KM;
Govt. service providers have competitive
advantage in cost and number of service
providers; while private clinic have
advantage in service providers and range of
services but cost is higher.

SSFP Market Survey Report 55
provide better services but at a high cost. Therefore on the cost ground, government facilities are in a more
advantageous position whereas private clinics are better equipped with service range and quality. NGO service
providers are not as good as Smiling Sun clinics but found to be relatively inexpensive.
Government health facilities are still the main service providers for the poor in general and the female (MCH) in
particular. Relatively richer segments of the population usually go to the private clinics and doctors chambers.
Like Smiling Sun clinics, in other NGO clinic poor and disadvantaged are their main customers.

SSFP Market Survey Report 56
5 FINDINGS OF THE NGO SURVEY
5.1 General Profile of SSFP Partner NGOs
Most of the PNGOs were set up around 80s. Since then Bangladesh has experienced a phenomenal growth of
NGOs. In that context, except few, SSFP partner NGOs as a community experienced less growth. They are not-
for-profit organization registered under relevant laws. Besides, all of them are also registered with governmental
agencies including NGO Affairs Bureau, Directorate of Health and Family Planning, Department of Social
Services.
Mission and programs: SSFP partner NGOs are fundamentally recognized as development organization with a
mission of improving the quality of lives of the poor. During the NSDP program cycle most of the PNGOs were
provided with assistance to develop mission statements. Health has been the predominant focus of PNGOs though
some diversity in program portfolio is fund in some NGOs. A number of PNGOs such as PSTC has gone a long
way to diversify its program portfolio that includes community development, income generation, education,
environment etc. Some others are implementing small-scale
social development, education and micro credit program.
Yet others are at the stage of developing new programs as
part of diversification. However, health remains to be the
major program for all PNGOs.
Smiling Sun remains the major source of funding for most
of these partner NGOs. For some NGOs SSFP is the only
funding source; for others SSFP is the major source; yet for
others SSFP is the single largest source of external funding.
In other words, SSFP contributes to the major funding of
these NGOs.
NGO governance: With respect to NGO governance, it was observed that PNGOs have Executive Committee to
govern the organization and committee members are unpaid volunteers. They primarily contribute to the policy
and oversight functions. The survey found that some Executive Committees are very strong and vibrant and play
instrumental role in the NGOs. However, in most cases EC are generally ornamental.
NGO structure: All PNGOs have organizational structure. Relatively larger NGOs structured their organization
following the corporate model. They have clear line of demarcation between the governing body and the
management. Executive Director or its equivalent helms the responsibility to execute the programs and project
with the support of a group of professionals. Organizational functions are clearly divided among divisions and
units. Coordination and reporting processes are clearly spelled out in the organogram. However, organizational
structure in mid level and small NGOs are not so organized. Governing body and management positions overlaps
and thus creates confusions in reporting system.
Core competency: All PNGOs have evolved with the health and family planning program. Therefore, health and
FP have been their core area of expertise. Partners NGOs have gathered considerable skills in implementing
Essential Service Packages (ESP) under USAID supported health program. This group of NGOs has been
associated with the largest health program outside the government delivery mechanism for long and thus
considered as the most skillful local NGOs in Bangladesh as far as health program is concerned. Still today, most
of these NGOs regardless of their size and maturity, health and family planning constitute major part of their
activities. Besides smiling sun, a good number of NGO, mostly big and medium sized, are also implementing
health program with support from other Government project and donors.
Core functional skills of these NGOs primarily based in community mobilization and awareness building, ESP
related service delivery and management – all within the premise of health and family planning.
Smiling Sun partner NGOs are among the
most competent local NGOs in the field of
health in Bangladesh;
Smiling Sunconstitute the single largest
program component for all the partner
NGOs;
Some NGOs have very vibrant and pro-
active governing body but in most others
governing body are rather ornamental.

SSFP Market Survey Report 57
5.2 Human Resources and their management
SSFP supports NGOs for clinic operation as well as head office expenditure which is related to clinic operation.
Each partner has number of staff positions based at PNGO level to provide administrative as well as
programmatic support to the SS clinics. As many as 13 professional and 4 support staff positions are created for
the HQ level staffing in the NGOs. There is no unified staffing pattern. Number of clinics operated by the NGOs
is the key determinant for the staffing levels.
The service statistics reveal that more than half of the HQs staff of the partner NGOs is supported by Smiling Sun
program. For mid and small NGOs this ratio is even higher meaning that most of the NGOs are significantly
dependent on the Smiling Sun program support for existence. Except for the big NGOs almost the entire senior
management staff are part of the smiling program team though there are many non-paid volunteers, mostly belong
to the board, make significant contribution to the NGOs.
A Project Director, who is supported by a range of program
and administrative staff, heads the SS program in each
NGO. Besides PD, more than 50% PNGO has a project
manager who performs similar responsibility. The program
staff are mainly responsible for supporting the clinic
operations while the admin staff helps the clinic
management in accounting, fund management, logistics and
reporting. NGO level staff positions are included in Annex
table C 1.
Monitoring and MIS related professional constitutes the
largest proportion of program staff based at the NGO HQs.
As many as 26 monitoring officers and 23 MIS offices are
currently working for various partner NGOs under the SS
program. They are primarily responsible for program quality and information management.
5.2.1 Staff Rationalization at NGO Level
The issues of staff level at the HQs were discussed with the NGO leaders. Apparently, there is an understanding
that the staff can be retrenched at the HQs for management positions only if the clinics are strengthened in, for
example, accounts keeping and reporting. Executive Director from a big NGO expressed his feeling that currently
there is more staff placed at the HQs than it actually requires. He, however, mentioned that NGO would require
appointing competent Project Directors with good remuneration to successfully implement the franchise program.
In response to the enquiry about clinic monitoring and MIS functions currently done by the NGO HQs, clinic
management expressed that this functions are necessary for clinic quality. However, they expressed that this
functions can be done by another agency (such as SSFP) in lieu of the NGOs.
5.2.2 Cost of Staffing
Partner NGOs incur about 60 percent of headquarter expenses to pay the salary and benefits to the staff under the
SS program. All partner NGOs has a number of common position that include the PD, Manager – Finance and
Admin and some support staff. Other positions varied among the NGOs.
The salary analysis suggests that PD and Finance Manager’s salary account a significant part of HQ staff cost and
more so for the mid and small NGOs. Significant salary variations exist among the partners for the same
positions. Generally salary level of big NGOs is higher than mid and small NGOs. Annex table C 2 shows the
average salary10 for each position and the proportion of salary cost that different types of NGOs are incurring for
various positions at the HQs level.
5.2.3 Human Resource Management Practices
Human resource management provides for personnel management policy, recruitment systems, performance
management and appraisal system and so on. These systems ensure improved performance and organizational
10 Salary includes both salary and benefits
More than 50% HQs based staff are
supported by SSFP grant;
On average big NGOs have 13 staff at the
HQs level. Medium and small NGOs have 7
and 4 respectivel;.
219 staff is currently working at the PNGO
level of them 30 Project Director, 19 Project
Manager, 30 Finance Manager, 26
Monitoring Officers and 23 MIS staff;
Most PNGOs do not have HR policies. They
follow NSDP prescribed procedures but
only for Smiling Sun project.

SSFP Market Survey Report 58
effectiveness. Thus the NGO survey looked at the existing systems of management to assess its current strengths
and to look for opportunities for further development.
The study revealed that a large number of NGOs do not have established management systems in place though
NSDP introduced some procedures for staff management issues like recruitments and annual appraisal. The staff
job description and annual performance appraisal system for the project staff as introduced by NSDP are being
followed with a degree of variation. The systems will need some improvisation in the changed context for long-
term sustainability of the NGOs. Job description and performance appraisal format will need major modification
due to the change in program design and implementation context.
The survey revealed that only half of the partner NGOs complied with the recruitment procedures set up by
NSDP. Majority of the small NGOs either don’t have put the NSDP system in place or follow the system
inconsistently. Similar practices prevail also in the big and mid level NGOs though at a lesser extent.
Notwithstanding this, good practices were noticed in a number of organizations that have introduced standard
human resource system across projects and programs, majority of them being big NGOs.
Except them, majority of the partner NGOs lack human resource management policy and tools for organizational
wide practices. At the project level, they do have some standard guides and tools made available from NSDP but
those lack the flexibility to meet the need of individual NGOs. This is causing inconsistency in organizational
management for the NGOs that are implementing multiple projects.

SSFP Market Survey Report 59
5.3 Financial Management of NGOs
The NGO survey made an attempt to take account of the financial systems and procedures the partners are
following, including the level of institutionalization in running the business of the organization. Generally most of
the partners NGO do have systems for accounting, budgeting, financial reporting and inventory management,
since such systems are required for NGOs to be eligible for SS funding. Indeed NSDP had provided the NGOs
with a standard financial management system regardless of
size and maturity of the NGOs. Partner NGOs are following
the system mostly for the Smiling Sun program. However, the
survey revealed that all NGOs are not fully complying the
existing financial systems. More importantly, they tend to use
different systems for their other work though some NGOs have
well developed organizational systems that are put in use for
all purposes. The need for consistent use of standard
organization wide financial management systems and
procedures remains a gap for most of the NGOs.
5.3.1 Audit Standards and Practices
NGOs generally need two types of audit i.e. annual statutory
audit and the project specific audit. The survey revealed that
all the NGOs conduct annual Smiling Sun project audit as it required them for the project funding, only 19 of
them do conduct organizational audit meaning that more than 33% PNGOs do not have organizational audit. Even
among the NGOs that conduct organizational audit, only half of them follow the Smiling Sun audit standard,
which call for not only certifying the accounts but also reporting on the management of finance. Financial
discrepancies found in audit were settled for Smiling Sun project in a systematic process but no such mechanism
was found in most of PNGOs for organizational audit.
Majority of the small PNGOs do not conduct organizational audit. Among the 12 mid level NGOs, 3 do not have
organizational audit, and majority of them did not follow appropriate audit standard as set by NSDP. Even among
the big NGOs, more than half either did not conduct organizational audit or did not follow audit standards.
5.3.2 Accounting Systems and Reporting
With few exceptions most of the partner NGOs maintain manual accounting. Only four NGOs reported to use
computerized accounting system. The survey revealed that accounting system is quite centralized at the NGO
level. Rural clinics maintain books of accounts at the clinic level but the reports are analyzed and compiled at the
NGO level. On the other hand, urban clinics do not maintain books of accounts at the clinic level. HQs maintain
all books of accounting of urban clinics. While rural clinics have some idea of expenditures and revenues, urban
clinic management does not have any idea of clinic costs and revenues. Sharing of financial information takes
place at the HO level coordination meeting but that remains very general and less analytical.
NGOs as well as rural clinics prepared financial statements based on standard format that is primarily required for
donor reporting. Except few instances analytical reporting for financial management and decision-making are
nearly absent. Cost analysis, cash flow, profit and loss statements are rarely prepared at the NGO level let alone at
the clinic site. Financial analysis is important for improving financial management and sustainability strategy.
5.3.3 Source of NGO Revenues
In the previous section, it was mentioned that the NGOs are striving to diversify the funding sources for
sustainability with some success. Following figure depicts the funding structure as in last year. It suggests that
NGOs have on the whole gone a long way to reduce its reliance on the Smiling Sun and increased NGO
sustainability. A good number of NGOs have successfully developed an unrestricted organizational fund to
finance its program and activities, even though SS remains the single largest funding source for all the partners.
Mid and small NGOs are relatively more dependent on SS fund while big NGOs are relatively less dependent on
Smiling Sun. However, there was big difference between the PNGOs. For example, Smiling Sun is the biggest
project of PSTC but it contributes only 17% of its annual expenditure. Even among the mid and small NGOs,
some are entirely dependent on Smiling Sun funding for the existence but some others have significant revenue
More than 35% fund of PNGOs comes from
Smiling Sun program. For some partners, it
is almost cent percent;
Most partner NGOs follow NSDP
introduced financial and audit guidelines for
the Smiling Sun program;
Almost all the NGOs maintain accounts
manually; there is little financial
management at the clinic level;
Pricing for clinic services are set arbitrarily
and varies between clinic even of under the
same NGO.

SSFP Market Survey Report 60
from other sources. Micro credit was found as important area of work where NGOs are funding from internal
accruals as well as PKSF.
Figure C1: Funding pattern of partner NGOs by various sources
-
5
10
15
20
25
30
35
40
45
Big NGOs Mid Level
NGOs
Small NGOs Total
Govt. Projects
SSFP
National Donors
International
Ow n fund
5.3.4 Utilization Plan of Program Income
NGOs were asked about their preferred head of expenditure for utilization of program income earned from clinic
operation. They mentioned four areas: expand health service facilities, NGO's sustainability, enhance staff salary,
and develop fixed assets for clinics. Vast majority preferred to spend the program income for expanding health
services while two-thirds mentioned NGOs sustainability and develop fixed assets like building for the clinics.
Only half of the NGOs are interested to use part of the program income for increase staff salary. In other words,
NGOs are more interested to use program income for long-term organizational benefits.
5.3.5 Pricing and Procurement
There is no standard pricing in place among the PNGOs. Pricing of clinic services are set at the clinic level based
on arbitrary method. Clinic management conducts informal market survey of local service prices (primarily
private players) and set a price that are competitive. Generally, SS clinic service prices range from 25% to 75% of
the private services but much above the government services. In comparison with NGO service price, SS pricing
is either similar or slightly high. A particular NGO is charging different price in different clinics. Economic
condition of the local people is a key determinant for setting price.
Like pricing there is no standard procurement practices for the NGOs. Procurement takes place both at the NGO
and the clinic level. Clinic supplies, office supplies and medicines are procured at the clinic level. On the other
hand, bulk and high value procurements are done at the NGO headquarters. NSDP had linked the NGOs with a
number of pharmaceutical companies for medicine procurement, which the NGOs used for medicine purchase.
Some clinics even place direct order to the concern company, who supplies the medicine to the respective clinics.
When convenient, high value procurements such as refrigerator are also procured at the clinic level. Convenience
and cost are two major factors in deciding procurement processes.
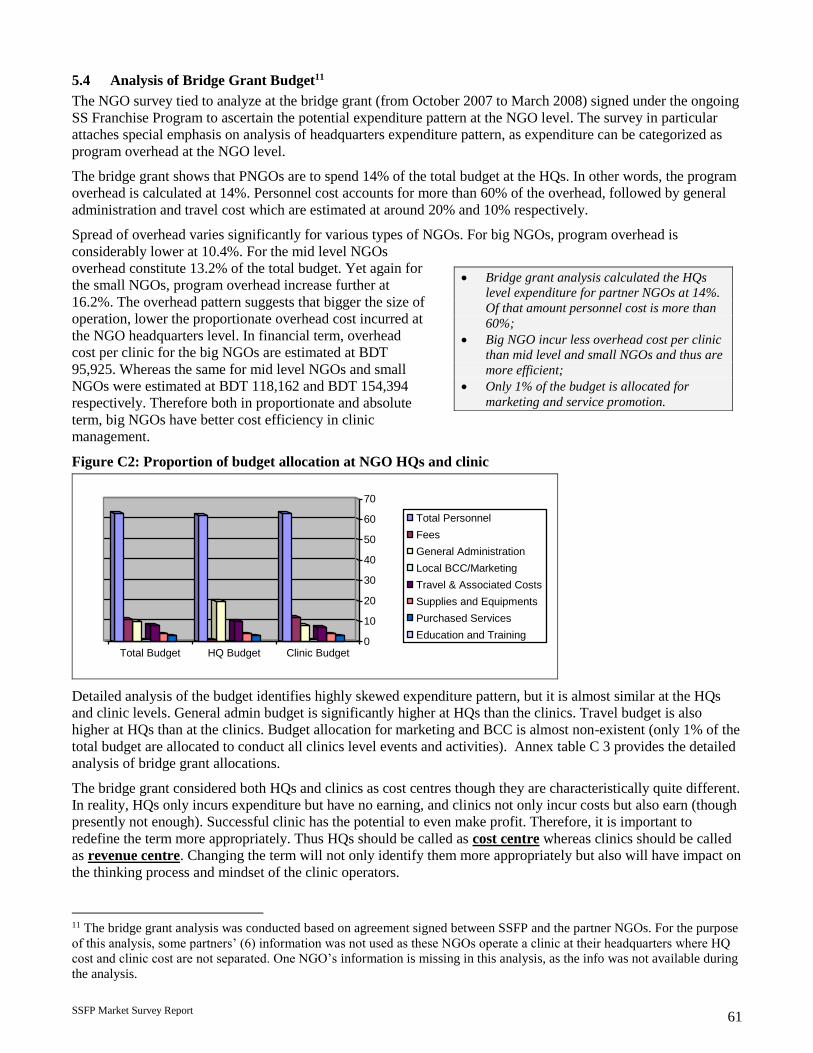
SSFP Market Survey Report 61
5.4 Analysis of Bridge Grant Budget11
The NGO survey tied to analyze at the bridge grant (from October 2007 to March 2008) signed under the ongoing
SS Franchise Program to ascertain the potential expenditure pattern at the NGO level. The survey in particular
attaches special emphasis on analysis of headquarters expenditure pattern, as expenditure can be categorized as
program overhead at the NGO level.
The bridge grant shows that PNGOs are to spend 14% of the total budget at the HQs. In other words, the program
overhead is calculated at 14%. Personnel cost accounts for more than 60% of the overhead, followed by general
administration and travel cost which are estimated at around 20% and 10% respectively.
Spread of overhead varies significantly for various types of NGOs. For big NGOs, program overhead is
considerably lower at 10.4%. For the mid level NGOs
overhead constitute 13.2% of the total budget. Yet again for
the small NGOs, program overhead increase further at
16.2%. The overhead pattern suggests that bigger the size of
operation, lower the proportionate overhead cost incurred at
the NGO headquarters level. In financial term, overhead
cost per clinic for the big NGOs are estimated at BDT
95,925. Whereas the same for mid level NGOs and small
NGOs were estimated at BDT 118,162 and BDT 154,394
respectively. Therefore both in proportionate and absolute
term, big NGOs have better cost efficiency in clinic
management.
Figure C2: Proportion of budget allocation at NGO HQs and clinic
0
10
20
30
40
50
60
70
Total Budget HQ Budget Clinic Budget
Total Personnel
Fees
General Administration
Local BCC/Marketing
Travel & Associated Costs
Supplies and Equipments
Purchased Services
Education and Training
Detailed analysis of the budget identifies highly skewed expenditure pattern, but it is almost similar at the HQs
and clinic levels. General admin budget is significantly higher at HQs than the clinics. Travel budget is also
higher at HQs than at the clinics. Budget allocation for marketing and BCC is almost non-existent (only 1% of the
total budget are allocated to conduct all clinics level events and activities). Annex table C 3 provides the detailed
analysis of bridge grant allocations.
The bridge grant considered both HQs and clinics as cost centres though they are characteristically quite different.
In reality, HQs only incurs expenditure but have no earning, and clinics not only incur costs but also earn (though
presently not enough). Successful clinic has the potential to even make profit. Therefore, it is important to
redefine the term more appropriately. Thus HQs should be called as cost centre whereas clinics should be called
as revenue centre. Changing the term will not only identify them more appropriately but also will have impact on
the thinking process and mindset of the clinic operators.
11 The bridge grant analysis was conducted based on agreement signed between SSFP and the partner NGOs. For the purpose
of this analysis, some partners’ (6) information was not used as these NGOs operate a clinic at their headquarters where HQ
cost and clinic cost are not separated. One NGO’s information is missing in this analysis, as the info was not available during
the analysis.
Bridge grant analysis calculated the HQs
level expenditure for partner NGOs at 14%.
Of that amount personnel cost is more than
60%;
Big NGO incur less overhead cost per clinic
than mid level and small NGOs and thus are
more efficient;
Only 1% of the budget is allocated for
marketing and service promotion.

SSFP Market Survey Report 62
Each NGO has provided an anticipated revenue income during the six-month bridge grant period, which is
calculated at 22% of the overall budget. However, at the clinic level the project cost recovery was estimated at
26%. This estimate seems to be very much consistent with the findings of the 25 clinics’ earnings in this market
survey. According to the financial performance of the last one-year, rural clinics had around 22% cost recovery
while the urban clinics earned around 30% of its expenditure and the comprehensive clinics earned more than
40%.

SSFP Market Survey Report 63
5.5 Organizational Development and Change
Smiling Sun Franchise Program not only builds on the previous NSDP program but also brings new dimension
and strategies in concept and implementation. The franchise approach and associated strategies call for a
paradigm shift in terms of how NGOs can be more effective and efficient in its business processes, structures and
implementation methods. The need for understanding new approach vis-à-vis structuring the organization
accordingly was highlighted in various discussions with the NGO leaderships.
Many people recalled the MOCAT process that NSDP had initiated with a promise to build NGO sustainability.
Many people appreciated the process expressed their concerns that the process was not followed up with targeted
technical assistance inputs to the NGOs.
A good number of NGO leaders and executive directors expressed the need for organizational development of the
Smiling Sun partner NGOs to successful implementation of
the franchise model. They shared enthusiasm as well as
concerns on the new program approach. Discussion
revealed the need for developing shared understanding
among the NGO partners to assimilate into the new
program process. Understanding, appreciating and
accepting franchise model with its associated implications
by the NGOs seem to be the early challenges – a devolution
from traditional health programming to a new business
model.
The survey team had conducted a structured discussion with
the NGO leadership and staff about what support are
needed for the NGOs to be successful for sustainable NGO development vis-à-vis franchise development. The
discussion reveals that the need for support is different for different NGOs. Results of discussions are presented in
the following table.
Organizational development support is most
needed in:
Develop understanding on franchise
approach;
Strategic planning;
HR policy development and develop strategy
for staff retention;
Organizational capacity assessment (OCA);
Computerized financial management;
Service promotion guideline.

SSFP Market Survey Report 64
Table C 4: Organizational development (OD) needs of the NGOs
Areas of OD Specific Needs for Improvement for various partners
Organizational Policy (HRM, Financial
Manual, Strategic Plan)
Develop strategic plan – Most partners of all types
Revise and improve HR policy – Big and mid level NGOs
Develop staff appraisal systems – Big NGOs
Organizational capacity assessment
Formulate capacity assessment tools for organization assessment -
Big and mid level NGOs
Identify TA areas & provide support for improvement - Big and
mid level NGOs
Monitoring system of the organization Develop organizational monitoring plan – Big and mid NGOs
Improvised MIS system – Big NGOs
NGO governance
Develop understanding and role of the EC members – Mid NGOs
Training /orientation to EC members for sustainable development
of the organization – Small NGOs
Human resource management Develop strategy for retention of staff – Most partners of all types
Marketing and promotion Service promotion policy / guideline development – Most partners
of all types
Financial management
Computerized Financial management system at clinic as well as
NGO level – Most partners of all types
Integrated audit – Big NGOs
Fund raising Project development and grant proposal writing – Mid and small
NGOs
5.5.1 Training Needs of NGO and Project Management
Human resource is a key asset to the organization and their development is integral to organizational
development. In order to right skilling the NGO core management and the NGO based program staff, a detailed
training need assessment exercise was conducted with facilitation support from the survey professional. The
detailed training needs for NGO staff and the NGO based project staff are available in the Annex table C 5 and C
6 respectively.
5.5.2 Training Need for the NGO Core Management
NGO core management consists of EC members who volunteer their time for NGO management, Executive
Director and the other senior management staff of the NGOs. NGO management people find that they need to
develop skills in the following area for successful implementation of the franchise program.
Marketing and service promotion;
Strategic and business planning;
Financial and logistics management;
Cost analysis and pricing;
Business management skills.
5.5.3 Training Need for HQs based SS Project Staff
The survey also looked at the training need of the SS project staff employed at the NGO level. Their main
responsibility includes providing implementation support at the clinic level, ensuring program quality, preparing

SSFP Market Survey Report 65
reports, financial management and coordination and so on. In other words, this team is responsible for the
effective and efficient implementation of the Smiling Sun program for the respective NGOs. Their training needs
are also analyzed considering their role, existing skill profile, as well as skill needed to effectively implement the
franchise program. Following trainings are the most demanded from the HQs based Smiling Sun project staff.
Financial and logistics management;
MIS and computer training;
Cost analysis/costing and pricing;
Monitoring and evaluation.
5.5.4 MOCAT and Beyond
NSDP had introduced the MOCAT process as part of a long-term strategy for NGO sustainability. The result of
three cycles of MOCAT exercises held in 2003, 2004 and 2005 suggests that it helped the NGOs toward a greater
degree of maturity and development. However, the results of the latest MOCAT exercise suggest that the NGOs
still need to go a long way to develop adequate institutional and programmatic competency necessary for
sustainability (NGOs collectively scored 2.21 against the possible highest score of 4.00). In 2005 MOCAT results,
NGOs were strongest in the programmatic pillar but weaker in the institutional and financial pillars. This suggests
that institutional and financial capacity development should be a priority area as far as NGO sustainability is
concerned.
In the past, MOCAT process was not followed up with targeted and NGO specific technical assistance, which is
ideally the logical step forward for organizational development. Most of the NGOs shared their discontent with
the MOCAT process because of the absence of the follow up assistance, except for few training programs. The
need for targeted and NGO specific capacity development came out quite strongly in the NGO survey within the
context of new program approach, which calls for improved organizational skills and business attitudes.
Organizational development and change management requires strong stewardship from within and skillful
facilitation from competent OD experts. On the other hand, the MOCAT tool and processes can be further
modified and adapted to the need of franchise development. All in all the partner NGOs needs long term
organization- specific OD support from SSFP in order to be effective in the franchise model of health program
implementation on the one hand, and to improve organizational effectiveness for their long term sustainability on
the other.

SSFP Market Survey Report 66
6 KEY FINDINGS AND IMPLICATIONS
This section presents the main findings of the market survey and the implications thereof.
6.1 Key Findings
Characteristics of household heads
In both rural and urban areas, the proportion of customer households is almost 50 percent, about 90 percent of
household heads are males, mostly in the ages between 20 and 50 years, and there is no discernable variation
between customer and non-customer in gender and age of household heads. The overwhelming male household
heads in both customer and non-customer groups are currently married, but more than 50 percent of female heads
are widow. The majority of the household heads are without education, although customers of the SS clinics are
found also in the higher education groups in both rural and urban areas. The main occupations of the male
household heads in both customer and non-customer groups are: small business, non-agricultural day laborer,
farmer, agricultural laborer, and rickshaw puller in the rural areas, while the main occupations are salaried
employment, small business, and non-agricultural day laborer in the urban areas.
On the whole, it can be said that there is no significant variation between the customer and non-customer groups
in respect of age, gender, education, and occupation of household heads. In other words, no particular
characteristics of the household heads is a major factor to determine household’s choice of healthcare provider.
This also indicates that any household, irrespective of any characteristic of the head, is the potential customer of
SS clinic.
Characteristics of households
In the rural areas the proportion of hard core poor households is as high 27 percent, the proportion of absolute
poor is 11 percent, and that of the rich is 20 percent. The incidence of poverty is higher among the customer
households and the proportion of rich households is higher among the non-customer households. The proportion
of poor is much lower in the urban areas than in the rural areas. The proportion of customers is higher in the lower
income groups than in the upper groups in both rural and urban areas. However, customers of SS clinics exist in
all income groups in both rural and urban areas. The average monthly income of the rich households is about
twelve fold higher than that of the poorest households in the urban areas. The average monthly income of an
urban household (BDT 13678) is much higher than the same of a rural household (BDT 7367).
Media habit
Television is the main media used by the households in both rural and urban areas, but the proportion of regular
TV watchers is much higher in the urban areas. The proportion of customers watching TV is almost same as that
of non-customers and, hence, TV watching does not seem to have considerably influenced the watchers to use
healthcare from the SS clinics. The most TV programmes are the entertainment programmes and news. Any
campaign that aims to change the habit of the people as regards use of healthcare through TV has to mostly use
these two types of TV program. For most of the TV watchers in both groups in both areas, the favorite TV
watching time is 8-10 pm. Therefore, any TV program, to be designed for the franchise campaign, should
preferably be conducted between 8 pm and 10 pm. The most preferred TV channel is BTV. The proportion of
respondents listening to radio and reading newspaper is miserably low in both areas. For most of the respondents
leisure time is between 4 pm and 6 pm. Therefore, any health campaign through TV and radio should be
launched in the afternoon hours.
Disease profile of population
About 80 percent of the people who were sick during the six months before the survey suffered from three
diseases: general sickness, water born diseases, and gastric. The proportion of people suffering from general
sickness was 61 percent, and the proportion was higher in the lower age groups, in both areas. The prevalence of
general sickness was higher in the customer group than in the non-customer group, and it was the most prevalent
condition in all income groups for both areas. No discernible relationship is found between income group and
disease type; the patients of all diseases are considerably found in all income groups. Thus no disease was found
specific to any income group; or in other words, disease did not depend on income level of households.

SSFP Market Survey Report 67
Choice of providers
Pharmacy is the main source of healthcare for the people of both groups in both areas. Even among the customer
households, 37 percent in rural areas and 31 percent in urban areas received healthcare from the pharmacies. The
proportion of people receiving healthcare from pharmacy was higher in the non-customer group. In the rural
areas, SS clinics are the second most important source of healthcare and doctors are the third important source for
the customers. To the non-customers in the rural areas, doctors, govt. providers and indigenous providers are the
main sources of healthcare. In the urban areas, doctor is second most important source and SS clinic is the third
most important source for the customers, while to the non-customers doctor and govt. providers are the most
important sources of care, next only to pharmacy.
Reasons for choosing providers
High quality of services, low cost, and low waiting time are the main reasons for the customers to choose the SS
clinics. Low cost, less waiting time, short distance from home and large size of facility, etc. are the main reasons
for choosing other facilities.
The proportion of households choosing a source of healthcare did not considerably vary by income group of
households. The implication of the finding is that even the rich households can choose SS clinics or pharmacy or
government facilities (or even indigenous providers), and even the poor households can visit private doctors or
clinics. In other words, the SS clinics have potential clients in all income groups in both rural and urban areas.
Similarly, choice of provider did not considerably vary by education level of household heads or their spouses,
indicating that SS clinics have potential clients in all education groups in both areas.
Level of satisfaction with care
The majority of households, which received care from the SS clinics or from private doctors, were satisfied with
care, but the majority of those using healthcare from govt. facilities, pharmacy, and private clinics were not
satisfied.
Healthcare expenditure and willingness to pay
The average amount of healthcare expenditure during the six months was BDT 866 for all households which
purchased health care in the rural areas and it was BDT 1100 in the urban areas. The amount is not low given the
average income of rural people. Thus, demand for healthcare considerably exists in both areas. Even the hard-core
poor and the poor spent large amount of money for healthcare, and sometimes they spent more than did the rich.
Income elasticity of demand is quite high. Majority of the respondents expressed their willingness to pay more
than 25 percent of current prices as additional charges for almost all types of services in both groups in both areas,
if the quality of services improves. The proportion of respondents willing to pay more than 50 percent of current
prices as additional prices was also very high in all areas. Price elasticity of demand is considerably high for
almost all services and in both areas. But WTP did not considerably vary by income or education or media habit.
Knowledge, awareness and perception about SS clinics
The overwhelmingly majority of customers in both areas know that the SS clinics provide child healthcare,
maternal healthcare, and FP service. But the proportion of customers who know that the clinics deliver some other
services as well is low in both areas. The main sources of information about the clinics were signboard at the
clinic, billboard and the clinic staff in both areas. In the urban areas a large number of respondents heard about the
SS clinics from advertisement and drama in television, as well.
Most of the FGD participants mentioned that the SS clinic have a number of distinguishing features, such as,
reception and advice is good, female doctors are available, poor people can take free treatment, and behavior of
doctors is good. The household survey shows that the majority of the customers in both areas also know about at
least one other source of care than the SS clinic. About 90 percent of non- customers in both areas are familiar
with the SS clinics. But, interestingly, they do not use healthcare from the SS clinics. The possible reasons for not
using care from the SS clinics by them are: first, the vast majority of the non-customers are also aware of the
existence of other institutional and non-institutional facilities in the areas; second, most of them do not know or
do not have good impression about the quality of services of SS clinics; and third, most of them do not have clear
idea about the costs of healthcare at the SS clinics. The FGDs revealed that the non-customers who do not use

SSFP Market Survey Report 68
healthcare from the SS clinics cited the following reasons for not using so; absence of good and specialist doctors,
treatment of all diseases are not available, no arrangements of tests, not open all day / all time in a week, all
needed medicine is not available, no inpatient facility.
Suggestions of people for improvement of clinic preferences
FGD participants suggested the following measures for improving the quality of services of the SS clinics: to
arrange the BCC training for the service provider, to enhance the lab. test facilities with modern equipments and
materials for better diagnosis, to provide delivery care with bed facility, OT facility and caesar facility, to provide
inpatient care, to extend market promotional activities (to increase number of sign boards, to increase visit in the
expanded areas by service promoters, to increase group meetings, postering and TV advertisement as Marie
Stopes does).
Market size and regular customer
The SS clinics at present have only a share of 0.62 percent of the total health care market in the catchment areas.
The computed value of share shows that the rural clinics cover at present only a negligible portion of the market,
and that they have the potential to raise the share manifold. The market share of the urban clinics is marginally
higher (0.72). The comprehensive clinics cover a larger portion of the market (1.60). Nevertheless, all types of
clinics have to dramatically expand the market for their services.
Although about fifty percent of total households under survey ever received healthcare from the SS clinics, the
regular customers – those who received healthcare for their recent illness – constitute only 19 percent of the
customers, or only about 10 percent of the total population in the catchment areas. The proportion of regular
customers is, thus, quite low at present.
In the survey areas, we found that SS market penetration is relatively strong for maternal healthcares and general
sickness. Among those who received maternal healthcare from different sources during the last six months, the
proportion of people receiving care from the SS clinics is quite high – 35 percent in the rural areas and 48 percent
in the urban areas. This indicates that a high proportion of people seeking maternal healthcare chose the SS clinics
and not any other provider, seemingly because they considered the quality of this healthcare of the SS clinics is
better than that of the alternative sources available to them. The same is partly true for the treatment of general
sickness: among those who sought treatment for general sickness, the proportion of the people who received the
care from the clinics is considerably high, about 10 percent in both rural and urban clinic areas.

SSFP Market Survey Report 69
Key Findings of the Clinic Survey
Service utilization: Capacity utilization at the Smiling Sun clinic system remains low which can be attributed to
limited service range, lack of qualified service providers, high competition from government facilities and local
pharmacies, and lack of sufficient demand for healthcare. Limited scope for drug prescription in the rural clinics
has also resulted in low customer demand for services.
Customer flow is extremely low in the afternoon causing significant downtime for service providers. Similarly,
utilization of laboratory facilities remains low as clinic customers are the only recipients of lab services with few
exceptions. No effort was made to market lab services widely. Lab facilities have high potential to contribute to
revenue – it already earns more than 10% of clinic income even with sub-optimum utilization. Overall during
non-pick hour (afternoon), clinic capacity utilization remains substantially low.
The difference in customer flow between the static clinic and the satellite sessions suggests that more customers
are going to satellite than to the static clinic in the rural areas, while in the urban areas static clinic receives little
bit more customer than satellite clinic. Lack of service differentiation and distance found to be the main reasons
which are discouraging rural customers to go to the static clinics.
General sickness (LCC) brings the highest proportion of customers in all types of Smiling Sun clinics, which is
followed by maternal health in the urban area and family planning for the rural clinics. Demand for family
planning services is relatively low in urban clinics.
Human resource: The staff pattern, especially the number of staff in various categories, varies between the types
of clinics. Average staff in comprehensive, urban and rural clinics was 26.6, 14.6 and 17.5 respectively. Staff turn
over was highest (65 percent) among the medical officers followed by that among clinic manager with medical
background. Paramedics were more stable with lower turnover.
Smiling Sun clinic staff had good access to training opportunities in the past but a significant amount of training
outcomes was lost due to high turnover. Existing service providers did not received adequate training on IMCI
and safe delivery, which have high market demand.
Clinic operating cost and revenue: Annual operating cost of comprehensive, urban and rural static clinics were
BDT 3.3, BDT 1.4 and BDT 1.7 million, respectively. Fixed operating costs of comprehensive, urban and rural
static clinics were 80%, 86% and 67% respectively. More than 70% of fixed cost was incurred for personnel,
which was as high as 87% in rural clinics. About 50% of the salary expenses in the rural clinic are paid to non-
service providers; in comprehensive clinic the proportion was about 27%.
Cost recovery rate in comprehensive, urban and rural static clinics was 44%, 32% and 22% respectively. About
50% of clinic earnings come from sale of services. 20% of incomes of comprehensive clinics come from EmOC
packages. Rural clinics earn 20% from FP commodity sales, but the proportion is negligible in other clinics.
Pathology was the 2nd most important earner for urban clinic after service sales. One satellite session earns on
average Tk 208 and BDT 490 in urban and rural settings, respectively.
Physical condition and equipment needs: Only few clinics are built on own land, most of the clinics are located
in rented house. Toilet facilities are predominantly common for male and female in urban setting but that of in the
rural clinics are most mostly separate for male and female.
More than half of the rural and urban clinics expressed the need for installing Ultrasonogram and safe delivery
facilities while the comprehensive clinics need ECG machine and improved lab facilities. Clinic staff considers
that the new equipments will have positive impact on clinic income.
Local level awareness development and market promotion: Smiling Sun clinics have a standard menu of local
level market promotion though all are not effective. Community level campaign and home visit are perceived as
the most effective methods for local level service marketing.
Service promoters, who are responsible for local level market promotion, lack adequate training and budgetary
allocations to effectively conduct local level promotional activities effectively. Same people and same approach
cause monotony among the local people and that results in low impact.

SSFP Market Survey Report 70
Health mart performance
Monthly sales volume in the health marts remains low with significant variations among the clinics. Sales volume
in the urban clinics was twice as much as rural clinics. Profit margin on sales was estimated at around 10%. Soap
and detergent, cosmetics, and refreshment items like drinks and crackers are the most sold items of the health
marts. Some variation was observed in the merchandise sold in urban and rural settings.
Profit on low sales volume does not cover the fixed operating cost, resulting in operating loss in both urban and
rural setting though loss is higher in the rural area. Staff salary cost constitutes the fixed operating cost.
Smiling Sun clinic: competition scenario
Pharmacies and local doctors, though are not part of the organized health service providers are very active in all
areas but more intense in the rural areas. Besides them, there are organized health service providers such as govt.
health facilities, private clinics and doctor’s chambers, who can be considered as competitors for SS clinics. All
Smiling Sun clinics have one or more competitors within three KM; in urban areas, 70% of the survey clinics
have competitors within 1 KM, while in rural areas 27% of clinics have competitors within 1 KM radius.
Govt. health service facilities are better on cost, service range, and service providers. On the other hand private
clinic have advantage in service providers and service range but cost is well above Smiling Sun clinic. NGO
service provider does not pose any serious competition to the Smiling Sun clinics.

SSFP Market Survey Report 71
Key Findings of the NGO Survey
Smiling Sun partners forms a heterogenious commuinty NGOs as they vary in terms of size, instituional skills and
sustainability. However, one thing that makes them homogenous is their mission and competence. They are
condisered as the most competent local NGOs in the field of health in Banglabesh and Smiling Sunconstitute the
single largest program component for all the partner NGOs.
Average nuber of staff supported by Smiling Sun program at the NGO level varies by NGO types. On average big
NGOs have 13 staff (professional and support) at the HQs level. Medium and small NGOs have relatively less
number of staff. A large part of the staff are responsible for monitoring, quaity control and MIS.
14% of program expenditure are incurred at the NGO HQs. Of that amount personnel cost comprises more than
60%.
During the NSDP, standard system was inducted to the NGOs for financial and personnel management which the
NGOs have followed only for Smiling Sun program. These systems were not used for other activities of the
organization. The need for consistent use of standard organization wide financial management systems and
procedures remains a gap for most of the NGOs.
NGOs lack some core skills like financial management, business management skills, marketing which are seemed
to be very essential for integral to the franchise management and NGO sustainability. Clinic level financial
management is very weak.
NSDP introduced MOCAT process for NGO capacity building. However, the process was not supported with
targeted technical support to the partner NGOs.
NGO management acknowledges the need for significant change in the management style and operating
procedures to implement the franchising program. Some of them also ventilated their concerns and reservation in
the new approach. Changing the “old mindset” by itself would be a major task for the SSFP.

SSFP Market Survey Report 72
6.2 Policy and Program Implications of the Market Survey
There are a number of issues having policy implications emerging from the market survey. The key implications
are presented as follows:
Increase number of customers and volume of income:
Customer flow in the Smiling Sun clinics is generally low which is causing high downtime for the service
providers as well as high cost of services. Therefore, increased flow of customers will reduce both service
provider’s downtime and service cost.
Possible measures for increasing flow of customers would be to enhance service range leveraging on existing
LCC and maternal health service portfolio. Improving service providers’ profile and skill becomes a prerequisite
to expand the spectrum of service range. Training of paramedics on safe delivery, IMCI, etc. will enable them to
deliver better services. Besides, rural clinics capacity to prescribe more drugs needs to be ensured by training the
paramedics and or inducting a qualified doctor in the rural clinics even for part time. Similarly, in the urban
clinics, provision of specialist doctors in the afternoon will increase customer flow. Improved lab facilities will
have positive impact on customer flow if doctors are posted. Effective local level marketing supplemented by
national level brand building will complement to these activities for increasing customer flow.
Increase flow of customer of higher income group while maintaining current customers
Currently regular healthcare customers are mostly the poor and lower middle class income group. Clinic needs to
attract higher income group with attractive service package so that a premium price can be charged and cross-
subsidization can effectively be put in place.
Possible measures include: Clinic will need to reposition its services with some distinction. Urban clinic can
introduce “SPECIALITY CLINIC” in the afternoon with a range of specialty service packages including
gynecology, general medicine etc. with strong back up support of diagnostic and Ultrasonogram facilities.
Existing comprehensive clinic can be introduced with the specialty clinic concept that can be replicated further
based on results. Repositioning strategy will be backed up by appropriate community based and mass media
campaign.
Rationalizing clinic operating cost:
There is a big gap between revenue and cost of Smiling Sun clinic making it an unsustainable undertaking in the
long run. The gap can be reduced through better allocation of resources to optimize clinic operation. While in the
short term, much may not be done in terms of cost reduction but there are ways of rationalizing clinic-operating
cost to achieve a better balance in revenue and expenditure.
Possible measures for rationalizing clinic operating cost: The operation cost structure of the SS clinics shows
high fixed cost, and personnel cost constitutes the highest proportion of fixed cost. Non-service providers receive
a major part of the salary bill where significant saving can be made overtime. Service promoters’ salary cost
should not be considered as recurring cost (in the long run) as this staff can be phased out over time with the
completion of local level marketing, which needs to be time bound. Again in the rural clinics, clinic manager and
office assistant practically do the similar job. Simple automation such as computerized accounting and
information system can easily abolish position of office assistant leading to considerable cost cut.
Fees paid to non-clinic staff, particularly to the depot holder, constitute a large expenditure in rural clinics. This is
a variable cost and thus can be controlled in a planned manner, meaning that the depot holder cost should be
phased out gradually.
Staff and overhead rationalization at the NGO level: HO based staff at the NGOs contains a major part of
program overhead which can be reduced by shifting common functions such as monitoring and quality control to
a third party organization (may be the franchisor). In other words, HO based staffing pattern and level should be
reconfigured with a zero based approach and eliminate overheads, which can be effective if complemented by the
franchisor organization. HO staffing needs to be configured based on the number of clinics the NGO operates so
as to maintain a relatively standard overhead for each clinic.

SSFP Market Survey Report 73
Utilization of non-peak hour clinic time:
Utilization of clinic services and facilities are low in general but more so in the non-peak hour. Better use of non-
peak hours will significantly improve the overall clinic performances.
Increasing utilization of non-peak hours: Many customers are willing to come during non-peak hours provided
doctors are available and good service quality is ensured. In the rural area, part time doctors can be
employed/hired during the non-peak hour while in the urban area specialist doctors (gynecologist or other
discipline) can be hired during the same hour. This will improve service profile and clinic image, and thus
increase customer flow.
Similarly, there is a need to promote lab services in the locality. Smiling Sun clinics can make effective linkages
with local doctors and private clinics through developing business relationships.
Firm up Smiling Sun brand image
While Smiling Sun is similar in the community, there is a lack of common identity and perception on service
range among the people – more so to non-customer. Clinic brand is also sometimes blurred with NGO name,
location name, other brand name (Green Umbrella).
Possible measures: Smiling Sun will need to formulate a policy on clinic signboard and use of logo in order to
avoid multiple identities. Communication strategy should maintain a balance in promoting clinic services and
should be contextually appropriate for urban and rural areas, population group etc. Depot holders need to be
reoriented to the extent possible so that they can as work as health promoters and not just as family planning
agents.
Redefine the catchments area in the context of provision of health services. Service promotion activities need to
be extended beyond the boundaries of existing catchments areas.
Capacity building of NGOs: Large numbers of partner NGOs are overwhelmingly dependent on Smiling Sun for
its existence though few have diversified its program portfolio. They lack capacities and organizational systems to
attract other donors to support them. The capacity building approach needs to be organization specific with
targeted technical assistance and support. Enhanced NGOs capacity will not only improve their sustainability but
also reduce their dependence on health grant.
Impart new skills to manage franchise program: Franchise model of clinic operation bring new opportunities
as well as challenges for the partner NGOs that needs to be taken in cognizance. There is need to support the
NGOs to understand the new approach and provide relevant business skills and operating procedures to fulfill
their obligations. Organizational development and change management should hold the key in the transitional
management process.
Health mart
Health mart introduced in the clinics is relatively new and they are still the losing concerns. Growth in customer
flow will improve health mart performance but there is a need for marketing for health marts. Clinic pharmacy
and health mart can be integrated and one person can be assigned for its management. This will reduce operating
cost and improve efficiency. Decision for expansion of health mart should be based on market feasibility. An
exclusive study can be planned at a later stage on health mart to have in-depth understanding.