Embed Size (px)
Citation preview
Abbotsford City Centre and Historic
Downtown Commercial Market Study
For: City of Abbotsford
February 2017
C i t y C e n t r e & H i s t o r i c D o w n t o w n C o m m e r c i a l S t u d y | ii
THIS PAGE LEFT INTENTIONALLY BLANK

C i t y C e n t r e & H i s t o r i c D o w n t o w n C o m m e r c i a l S t u d y | iii
Executive Summary
This report has identified the trends and factors that govern the market for commercial
space in Abbotsford’s City Centre and Historic Downtown. The two neighbourhoods
have very different strengths and weaknesses, but both serve unique roles within
Abbotsford’s economic landscape:
• The City Centre is the City’s main commercial hub. It has three large malls and
several standalone anchors, which allow it to draw spending from across the
City. Its retail market is strong, although its office market is overbuilt and in low
demand at present. Although its retail sector is thriving, it is also highly generic
and unspecialized, which leaves it vulnerable to competition from new space
throughout the City. Its urban design is not conducive to walking, which may
stunt its growth in the long run.
• The Historic Downtown is a popular shopping district because of its unique urban-
style design and comfortable public realm. It is attractive to small locally owned
businesses both in the retail and office sectors, and space in the Historic
Downtown is in demand. Although its urban design is good, it could still be
improved on Essendene Avenue and around Jubilee Park. More residential
development, more restaurants and entertainment, and eventually a grocery
store anchor would help the area fulfill its potential.
Within this overall context, GPRA projects demand for the following commercial uses in
the Study Areas according to the following timeline:
Demand Summary for the City Centre (Additional per period)
2017 – 2020 2021 – 2025 2026 – 2030 2031 – 2035 2036 - 2040
Retail Total 17,800 ft2 47,900 ft2 79,500 ft2 135,800 ft2 171,600 ft2 Convenience Retail 17,800 ft2 40,400 ft2 61,800 ft2 72,300 ft2 85,600 ft2 Comparison Retail 0 ft2 0 ft2 0 ft2 42,600 ft2 56,600 ft2 Restaurants & Entertainment
0 ft2 7,500 ft2 17,700 ft2 20,900 ft2 25,100 ft2
Auto-Related 0 ft2 0 ft2 0 ft2 0 ft2 4,300 ft2
Office Total1 0 ft2 1,951 – 16,700 ft2 101,857 – 105,200 ft2
Accommodation Total
0 rooms 0 rooms 0 rooms 0 rooms 100 rooms
1 In the office category, the 2021 – 2030 category actually refers to 2021 – 2031 demand, and the 2031 – 2040 actually refers to 2032 – 2041, arising from the City employment estimate used.
C i t y C e n t r e & H i s t o r i c D o w n t o w n C o m m e r c i a l S t u d y | iv
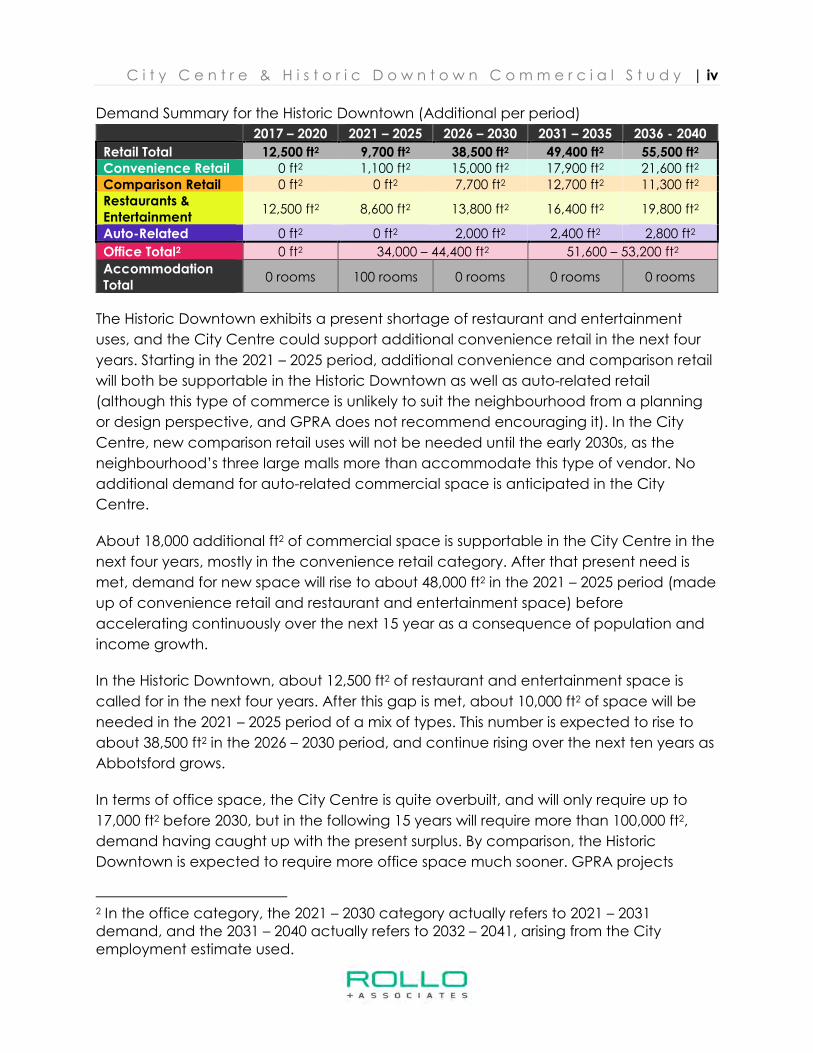
Demand Summary for the Historic Downtown (Additional per period)
2017 – 2020 2021 – 2025 2026 – 2030 2031 – 2035 2036 - 2040
Retail Total 12,500 ft2 9,700 ft2 38,500 ft2 49,400 ft2 55,500 ft2 Convenience Retail 0 ft2 1,100 ft2 15,000 ft2 17,900 ft2 21,600 ft2 Comparison Retail 0 ft2 0 ft2 7,700 ft2 12,700 ft2 11,300 ft2 Restaurants & Entertainment
12,500 ft2 8,600 ft2 13,800 ft2 16,400 ft2 19,800 ft2
Auto-Related 0 ft2 0 ft2 2,000 ft2 2,400 ft2 2,800 ft2
Office Total2 0 ft2 34,000 – 44,400 ft2 51,600 – 53,200 ft2
Accommodation Total
0 rooms 100 rooms 0 rooms 0 rooms 0 rooms
The Historic Downtown exhibits a present shortage of restaurant and entertainment
uses, and the City Centre could support additional convenience retail in the next four
years. Starting in the 2021 – 2025 period, additional convenience and comparison retail
will both be supportable in the Historic Downtown as well as auto-related retail
(although this type of commerce is unlikely to suit the neighbourhood from a planning
or design perspective, and GPRA does not recommend encouraging it). In the City
Centre, new comparison retail uses will not be needed until the early 2030s, as the
neighbourhood’s three large malls more than accommodate this type of vendor. No
additional demand for auto-related commercial space is anticipated in the City
Centre.
About 18,000 additional ft2 of commercial space is supportable in the City Centre in the
next four years, mostly in the convenience retail category. After that present need is
met, demand for new space will rise to about 48,000 ft2 in the 2021 – 2025 period (made
up of convenience retail and restaurant and entertainment space) before
accelerating continuously over the next 15 year as a consequence of population and
income growth.
In the Historic Downtown, about 12,500 ft2 of restaurant and entertainment space is
called for in the next four years. After this gap is met, about 10,000 ft2 of space will be
needed in the 2021 – 2025 period of a mix of types. This number is expected to rise to
about 38,500 ft2 in the 2026 – 2030 period, and continue rising over the next ten years as
Abbotsford grows.
In terms of office space, the City Centre is quite overbuilt, and will only require up to
17,000 ft2 before 2030, but in the following 15 years will require more than 100,000 ft2,
demand having caught up with the present surplus. By comparison, the Historic
Downtown is expected to require more office space much sooner. GPRA projects
2 In the office category, the 2021 – 2030 category actually refers to 2021 – 2031 demand, and the 2031 – 2040 actually refers to 2032 – 2041, arising from the City employment estimate used.
C i t y C e n t r e & H i s t o r i c D o w n t o w n C o m m e r c i a l S t u d y | v
demand for up to 44,000 ft2 of office space before 2030, but only about 53,000 ft2 of
new space in the following 15 years, the Historic Downtown being small and with lower
overall employment than the City Centre.
Finally, GPRA projects demand for one new hotel of about 100 rooms (although this is
likely to be quite flexible) in each of the Study Areas. The Historic Downtown is likely to
be ready for a new hotel before the City Centre, so GPRA has placed the former in the
2021- 2025 period, and the latter in the 2036 – 2040 period.
Although addressing future supportable retail outside of the Historic Downtown and the
City Centre is outside of this report’s scope, it is important to acknowledge that
development outside of the Study Area can profoundly affect the vitality of retail in the
City Centre and the Historic Downtown.
While Abbotsford has limited influence on many internal and external growth factors,
the City does have the power to restrict major new retail projects outside of the Study
Areas and concentrate future development around existing retail nodes. This report
acknowledges that a number of convenience-oriented retail nodes will likely be
necessary as Abbotsford’s population grows over the next 25 years, but if the City
wishes to strengthen existing retail centres such as the Historic Downtown and the City
Centre it is important not to dilute the competitive landscape with power centres and
shopping centres that draw consumer spending.
Decisions to limit comparison big box & shopping centre development may be fiscally
painful in the short-term but will promote long term vitality of the Study Areas.
C i t y C e n t r e & H i s t o r i c D o w n t o w n C o m m e r c i a l S t u d y | vi
Table of Contents
Executive Summary ...................................................................................................................... iii
1 Introduction ............................................................................................................................ 1
1.1 Project Overview .......................................................................................................... 1
1.2 Geographical Terminology .......................................................................................... 2
1.2.1 Study Areas ............................................................................................................. 2
1.2.2 Neighbourhoods ................................................................................................... 3
2 Abbotsford City Centre and Historic Downtown .............................................................. 4
2.1 Overall trends and factors ............................................................................................ 4
2.2 The City Centre .............................................................................................................. 5
2.2.1 City Centre Description ......................................................................................... 5
2.2.2 City Centre Forces and Trends ............................................................................. 7
2.3 The Historic Downtown .................................................................................................. 8
2.3.1 Historic Downtown Description ............................................................................. 8
2.3.2 Historic Downtown Forces and Trends ............................................................... 10
2.3.3 Barriers to Commercial Development in the Historic Downtown ................. 12
3 Retail and Service Commercial ....................................................................................... 14
3.1 Trends and Factors in Study Area Commercial Space .......................................... 14
3.2 Definition and types of retail and service commercial .......................................... 15
3.3 Existing retail and service commercial ..................................................................... 16
3.4 Retail and Service Commercial Projection .............................................................. 27
4 Office ................................................................................................................................... 48
4.1 Trends and Factors in the Office Market .................................................................. 48
4.1.1 The Abbotsford Office Market ........................................................................... 48
4.1.2 The City Centre Office Market ........................................................................... 49
4.1.3 The Historic Downtown Office Market .............................................................. 49
4.2 Current Office Inventory ............................................................................................. 50
4.3 Office Demand Projection ......................................................................................... 54
4.3.1 Employment Projection ....................................................................................... 54
4.3.2 Current Office Employment ............................................................................... 55
4.3.3 Abbotsford Office Demand Projection ............................................................ 56
4.3.4 Study Area Office Demand Projection ............................................................ 57
C i t y C e n t r e & H i s t o r i c D o w n t o w n C o m m e r c i a l S t u d y | vii
5 Hotel ...................................................................................................................................... 59
5.1 Abbotsford Accommodation Supply ...................................................................... 59
5.2 Trends and Factors in the Accommodation Market ............................................. 61
5.2.1 Bed & Breakfasts in Abbotsford ......................................................................... 61
5.2.2 Hotels in Abbotsford ............................................................................................ 61
5.2.3 Hotels in the Study Areas .................................................................................... 62
5.2.4 Online Accommodation Websites .................................................................... 62
5.3 Abbotsford Accommodation Demand Projection ............................................... 63
6 Best Practices in Downtown Planning ............................................................................. 68
6.1 Urban Design ............................................................................................................... 68
6.2 Market Dynamics ........................................................................................................ 69
6.3 Business Mix .................................................................................................................. 70
6.4 Consistent and Engaged Leadership ...................................................................... 71
7 Opportunities for Development and Improvement ...................................................... 72
7.1 Commercial Demand Projection Summary ............................................................ 72
7.2 Development and Improvement in the City Centre ............................................. 74
7.2.1 Developable Land in the City Centre .............................................................. 74
7.2.2 Other Improvements in the City Centre ........................................................... 75
7.3 Development and Improvement in the Historic Downtown ................................ 76
7.3.1 Developable Land in the Historic Downtown ................................................. 77
7.3.2 Other Improvements in the Historic Downtown .............................................. 78
7.4 Policy Outside of Study Areas ................................................................................... 79
8 Conclusion .......................................................................................................................... 80
C i t y C e n t r e & H i s t o r i c D o w n t o w n C o m m e r c i a l S t u d y | 1
1 Introduction
1.1 Project Overview
G. P. Rollo & Associates (GPRA) has been retained by the City of Abbotsford (the City)
to complete a Commercial Market Study of the Historic Downtown and City Centre
(the Study Areas) with the aim of assessing the current supply and projected demand of
commercial uses (retail, service commercial, office, entertainment and tourism uses) in
each area to assist in the planning of these areas. As part of this study, GPRA has:
• Assessed commercial development trends, constraints, and opportunities for new
and revitalized commercial development in the Historic Downtown and City
Centre neighborhoods
• Provided an accurate GIS-based and -illustrated inventory of commercial space
which has allowed detailed analysis and understanding of the supply of
commercial space in these two neighbourhoods, and has been combined with
a City-provided population projection to produce a commercial demand
forecast for each
• Created an inventory of office space covering all of Abbotsford, including the
Study Areas, with the aim of understanding their importance and role within
Abbotsford’s office market. Informed by a City-provided employment projection
as well as numerous interviews with stakeholders such as realtors and developers,
GPRA then used this inventory to create an office demand projection for the
Study Areas
• Analyzed Abbotsford’s supply of accommodation businesses such as hotels, inns,
and bed & breakfasts, including interviews with staff representatives of most
large accommodation operations, and used this information to create an
accommodation demand projection for Abbotsford, with commentary on its
implications for the Study Areas
• Provided analyses and recommendations on land use and urban design that are
market-driven.
C i t y C e n t r e & H i s t o r i c D o w n t o w n C o m m e r c i a l S t u d y | 2
1.2 Geographical Terminology
“Study Area” and “Neighbourhood” are two terms that will be frequently referred to
throughout this report, especially in Section 3. The Study Areas, or the focus of this study,
are the City Centre and the Historic Downtown. It is important to note that although
these two study areas share the same name as two of Abbotsford’s Neighbourhoods,
they share fundamentally different purposes.
1.2.1 Study Areas
Study Areas refer to the geographical extent or boundaries of the focus of this study.
These areas contain some of Abbotsford’s most vibrant commercial areas. In the 21st
Century commercial nodes of the magnitude seen in both Study Areas can rarely be
sustained on the local community alone, and therefore rely on spending inflow from
varying distances that can range from neighbourhood (e.g. convenience store), city-
wide (e.g. home improvement store) to even state or province wide (e.g. super
regional mall such as Metropolis at Metrotown).
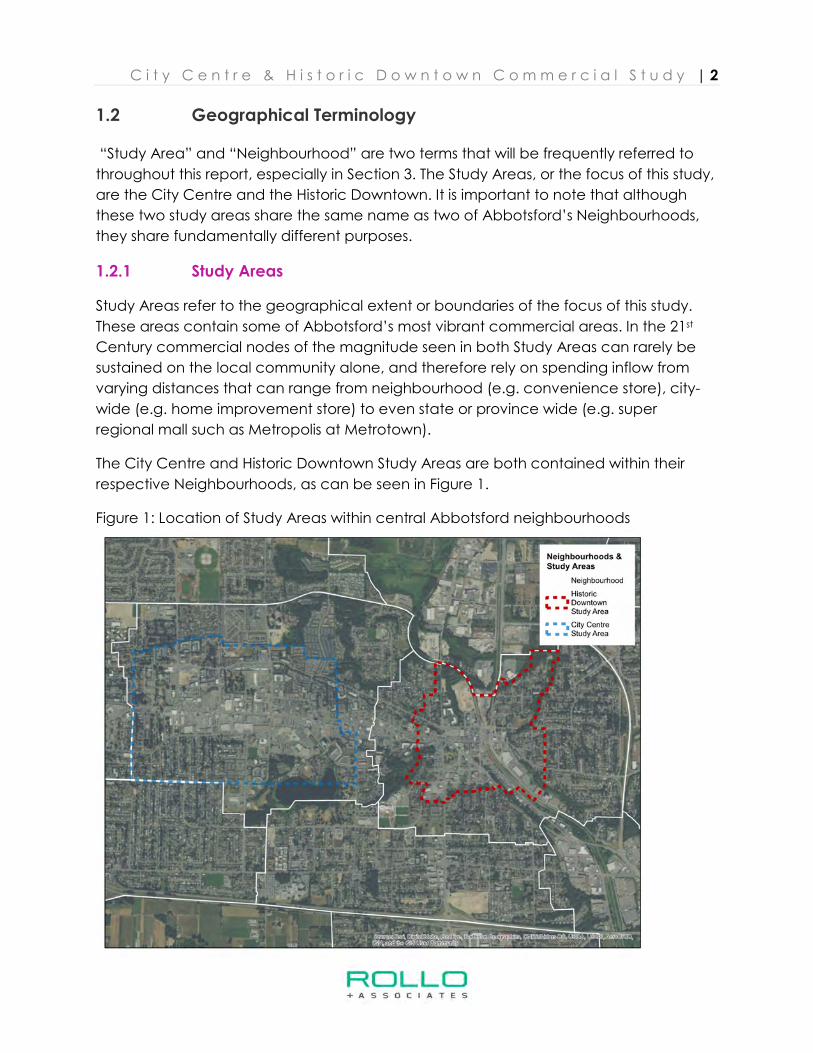
The City Centre and Historic Downtown Study Areas are both contained within their
respective Neighbourhoods, as can be seen in Figure 1.
Figure 1: Location of Study Areas within central Abbotsford neighbourhoods
C i t y C e n t r e & H i s t o r i c D o w n t o w n C o m m e r c i a l S t u d y | 3
Commercial districts across Abbotsford exert a varying degree of competitive influence
on the two Study Areas. This competitive influence is factored into this report, however
market demand for commercial growth outside of the two Study Areas is not explored
in detail.
1.2.2 Neighbourhoods
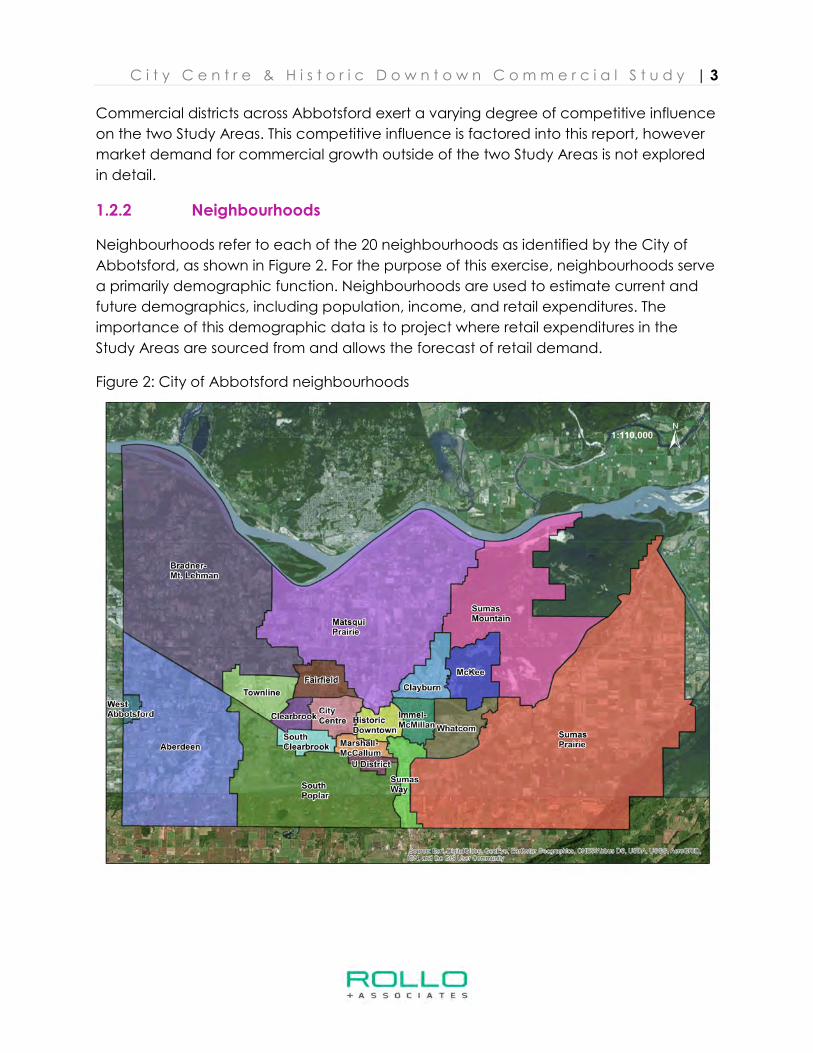
Neighbourhoods refer to each of the 20 neighbourhoods as identified by the City of
Abbotsford, as shown in Figure 2. For the purpose of this exercise, neighbourhoods serve
a primarily demographic function. Neighbourhoods are used to estimate current and
future demographics, including population, income, and retail expenditures. The
importance of this demographic data is to project where retail expenditures in the
Study Areas are sourced from and allows the forecast of retail demand.
Figure 2: City of Abbotsford neighbourhoods
C i t y C e n t r e & H i s t o r i c D o w n t o w n C o m m e r c i a l S t u d y | 4
2 Abbotsford City Centre and Historic Downtown
This section defines and describes the two Study Areas after commenting on the
general trends and factors that govern commercial development in Abbotsford.
2.1 Overall trends and factors
With a 2016 Census population of 141,397, the City of Abbotsford is the fifth most
populous city in British Columbia, and the most populous city outside of Metro
Vancouver. It is the most populous municipality in the Fraser Valley Regional District
(FVRD), which is the third most populous region in British Columbia after Vancouver and
Victoria. Abbotsford makes up about 47% of the District’s population.
Abbotsford and the FVRD are immediately to the east of Metro Vancouver, and play
an important role as the “next stop” along the Trans-Canada Highway. Consequently,
of the non-residents who visit Abbotsford, most stay near Highway 1 and this corridor
has emerged as the primary location for hotels. Beyond mere Highway proximity, other
activities that bring visitors to Abbotsford include government-related travel, sporting
events, concerts and performances (mostly at the Abbotsford Centre) and a growing
assortment of festivals and celebrations such as the Tulip Festival in April and the
Downtown Christmas Tree Lighting in November. The Fraser Valley Trade & Exhibition
Centre (Tradex) is another important event venue. In general, stakeholders such as
hotel staff, bed & breakfast operators, and property developers acknowledge that
Tourism Abbotsford has done a good job of attracting events to the City, and that the
overall impact of this effort has been positive.
Although it is growing, the impact of visitor spending on Abbotsford’s commercial
sectors remains small. Most spending in Abbotsford is by Abbotsford residents, and
therefore the pace of commercial development in the City has been tied to residential
growth, a dependency which is expected to continue. Residential development in
Abbotsford is in turn tied to the residential market trends of British Columbia’s other
regions, most notably Metro Vancouver where an ongoing housing shortage has
increased residential prices beyond the reach of many residents, driving growth
outward, including to the Fraser Valley. For many young people and young families in
particular, ownership of a detached house has become unachievable within Metro
Vancouver, so purchasing a home in Abbotsford is an attractive alternative. This
dynamic has been a key engine of growth in Abbotsford in the last several years,
C i t y C e n t r e & H i s t o r i c D o w n t o w n C o m m e r c i a l S t u d y | 5
although with recent changes to the Province’s foreign purchasing3 and first-time
homebuyer lending practices4, the near future of the housing market is unclear.
However the market develops in the immediate future, the long-term trend of
residential development in Abbotsford is cyclical. With successive waves of
development, Abbotsford will densify and mature, making more specialized
commercial operations viable.
2.2 The City Centre
2.2.1 City Centre Description
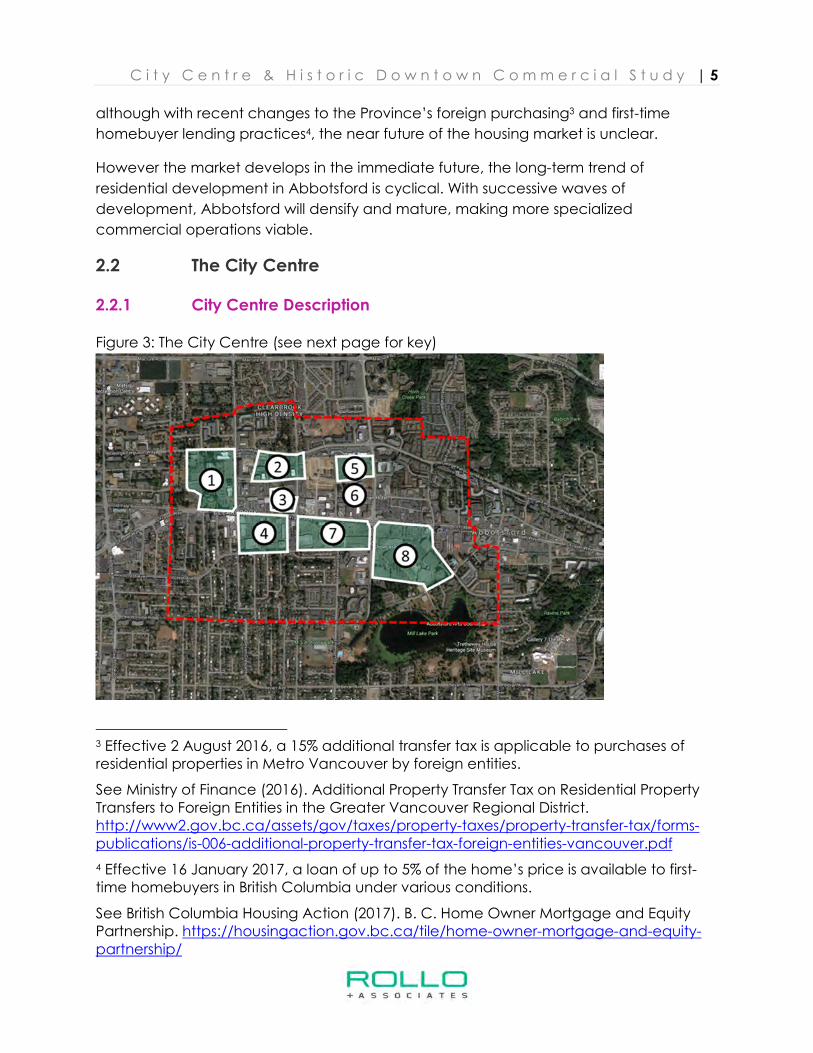
Figure 3: The City Centre (see next page for key)
3 Effective 2 August 2016, a 15% additional transfer tax is applicable to purchases of residential properties in Metro Vancouver by foreign entities.
See Ministry of Finance (2016). Additional Property Transfer Tax on Residential Property Transfers to Foreign Entities in the Greater Vancouver Regional District. http://www2.gov.bc.ca/assets/gov/taxes/property-taxes/property-transfer-tax/forms-publications/is-006-additional-property-transfer-tax-foreign-entities-vancouver.pdf
4 Effective 16 January 2017, a loan of up to 5% of the home’s price is available to first-time homebuyers in British Columbia under various conditions.
See British Columbia Housing Action (2017). B. C. Home Owner Mortgage and Equity Partnership. https://housingaction.gov.bc.ca/tile/home-owner-mortgage-and-equity-partnership/
C i t y C e n t r e & H i s t o r i c D o w n t o w n C o m m e r c i a l S t u d y | 6
Abbotsford’s City Centre (shown in Figure 3 in red) is the roughly rectangular area
bordered approximately by Peardonville Road and Mill Lake to the south; Ware Street,
Mill Lake Road, and Horn Street to the east; Parkview Street and Tims Street to the west;
and to the north by a line running between and roughly parallel to George Ferguson
Way and Maclure Road.
The neighbourhood is centred on South Fraser Way which is its commercial backbone
and main thoroughfare, and contains:
• Abbotsford’s civic core (indicated as point 1 in Figure 3), including:
o Abbotsford City Hall
o Abbotsford Court Services
o Abbotsford School District
o Abbotsford Police Department
o Abbotsford Fire Department
o Clearbrook Library
o The Reach Museum
o ICBC Claim Centre
• Three major malls to the south of South Fraser Way:
o Clearbrook Town Square (indicated as point 4 in Figure 3)
o West Oaks Mall (indicated as point 7 in Figure 3)
o Sevenoaks Shopping Centre (indicated as point 8 in Figure 3)
• A number of major retailers to the north of South Fraser Way such as:
o Canadian Tire (indicated as point 3 in Figure 3)
o Real Canadian Superstore (indicated as point 5 in Figure 3)
• A community services and health hub centred on Cruickshank Street between
George Ferguson Way and Simon Avenue (indicated as point 2 in Figure 3)
• Numerous other restaurants, retailers, offices, and a Sandman Hotel (indicated as
point 6 in Figure 3)
• Many residential properties in a range of typologies and ages.
As such, the neighbourhood is among Abbotsford’s most important commercial
centres, and offers goods and services of every kind. It is a successful commercial
neighbourhood because it is central and accessible to most of Abbotsford, and
specializes in large “national” retailers and restaurant chains as well as a surplus of well-
tenanted mall space with an abundance of parking. It primarily serves Abbotsford
residents rather than through-traffic.
C i t y C e n t r e & H i s t o r i c D o w n t o w n C o m m e r c i a l S t u d y | 7
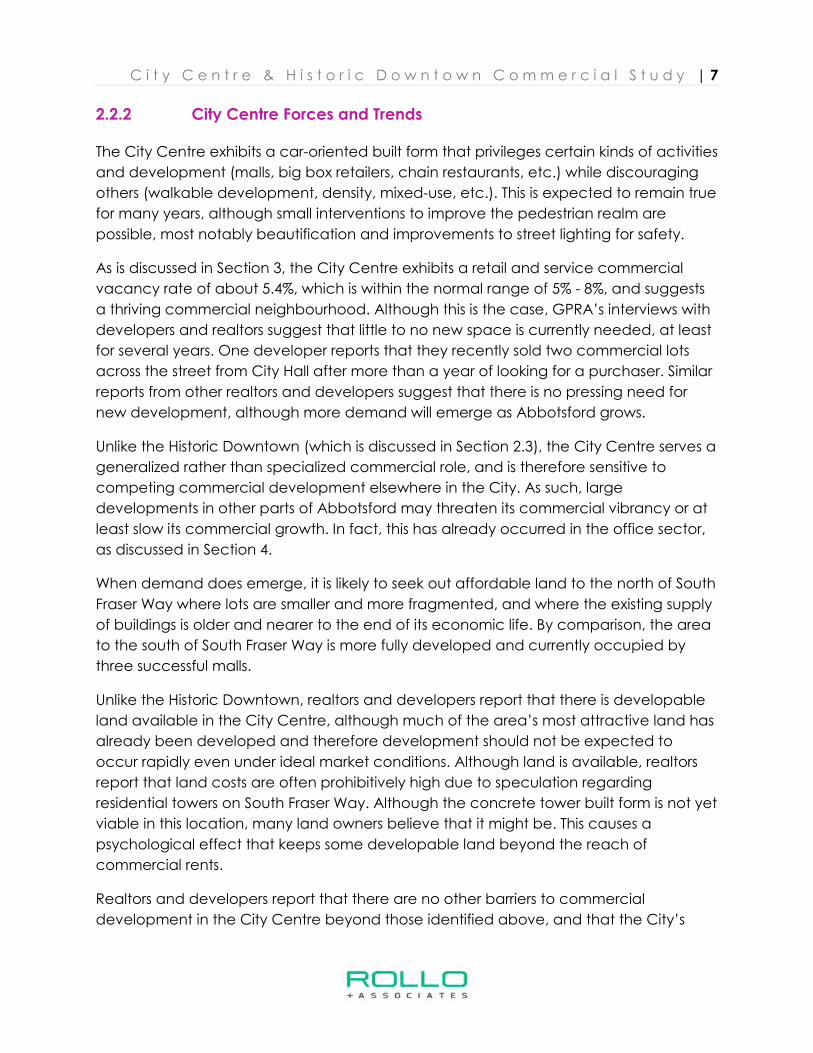
2.2.2 City Centre Forces and Trends
The City Centre exhibits a car-oriented built form that privileges certain kinds of activities
and development (malls, big box retailers, chain restaurants, etc.) while discouraging
others (walkable development, density, mixed-use, etc.). This is expected to remain true
for many years, although small interventions to improve the pedestrian realm are
possible, most notably beautification and improvements to street lighting for safety.
As is discussed in Section 3, the City Centre exhibits a retail and service commercial
vacancy rate of about 5.4%, which is within the normal range of 5% - 8%, and suggests
a thriving commercial neighbourhood. Although this is the case, GPRA’s interviews with
developers and realtors suggest that little to no new space is currently needed, at least
for several years. One developer reports that they recently sold two commercial lots
across the street from City Hall after more than a year of looking for a purchaser. Similar
reports from other realtors and developers suggest that there is no pressing need for
new development, although more demand will emerge as Abbotsford grows.
Unlike the Historic Downtown (which is discussed in Section 2.3), the City Centre serves a
generalized rather than specialized commercial role, and is therefore sensitive to
competing commercial development elsewhere in the City. As such, large
developments in other parts of Abbotsford may threaten its commercial vibrancy or at
least slow its commercial growth. In fact, this has already occurred in the office sector,
as discussed in Section 4.
When demand does emerge, it is likely to seek out affordable land to the north of South
Fraser Way where lots are smaller and more fragmented, and where the existing supply
of buildings is older and nearer to the end of its economic life. By comparison, the area
to the south of South Fraser Way is more fully developed and currently occupied by
three successful malls.
Unlike the Historic Downtown, realtors and developers report that there is developable
land available in the City Centre, although much of the area’s most attractive land has
already been developed and therefore development should not be expected to
occur rapidly even under ideal market conditions. Although land is available, realtors
report that land costs are often prohibitively high due to speculation regarding
residential towers on South Fraser Way. Although the concrete tower built form is not yet
viable in this location, many land owners believe that it might be. This causes a
psychological effect that keeps some developable land beyond the reach of
commercial rents.
Realtors and developers report that there are no other barriers to commercial
development in the City Centre beyond those identified above, and that the City’s
C i t y C e n t r e & H i s t o r i c D o w n t o w n C o m m e r c i a l S t u d y | 8
policies are favourable to development. It is therefore expected that more
development will occur in time.
2.3 The Historic Downtown
2.3.1 Historic Downtown Description
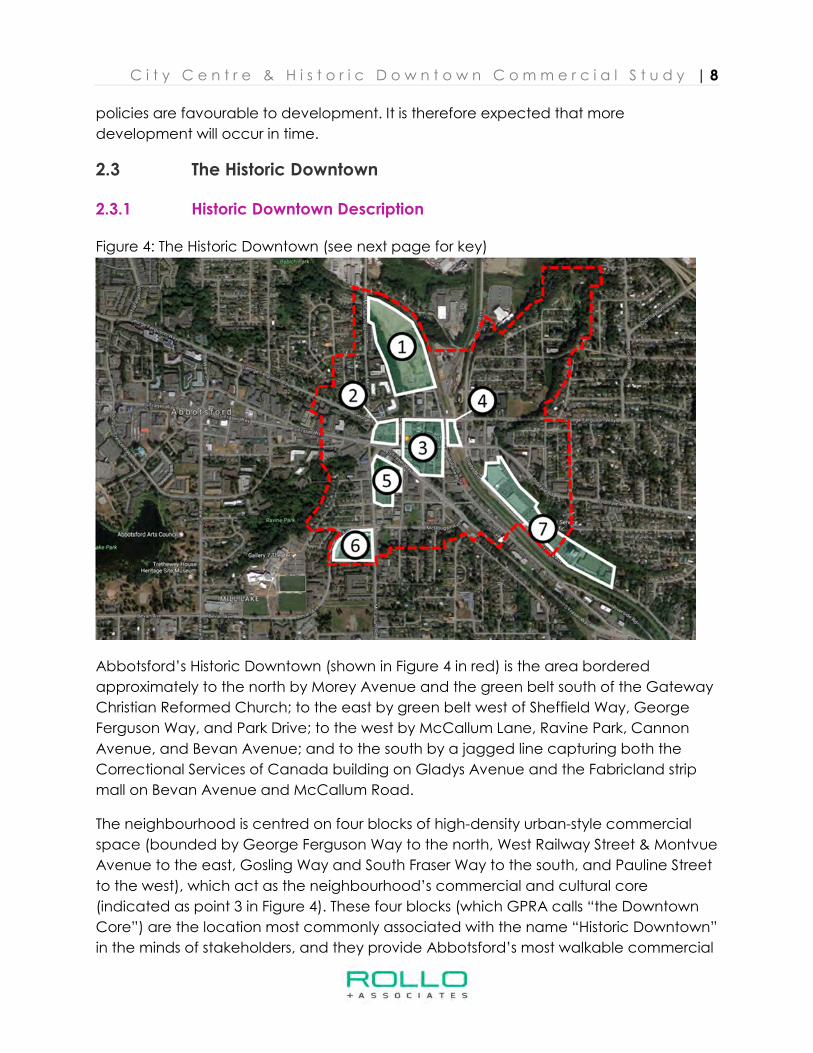
Figure 4: The Historic Downtown (see next page for key)
Abbotsford’s Historic Downtown (shown in Figure 4 in red) is the area bordered
approximately to the north by Morey Avenue and the green belt south of the Gateway
Christian Reformed Church; to the east by green belt west of Sheffield Way, George
Ferguson Way, and Park Drive; to the west by McCallum Lane, Ravine Park, Cannon
Avenue, and Bevan Avenue; and to the south by a jagged line capturing both the
Correctional Services of Canada building on Gladys Avenue and the Fabricland strip
mall on Bevan Avenue and McCallum Road.
The neighbourhood is centred on four blocks of high-density urban-style commercial
space (bounded by George Ferguson Way to the north, West Railway Street & Montvue
Avenue to the east, Gosling Way and South Fraser Way to the south, and Pauline Street
to the west), which act as the neighbourhood’s commercial and cultural core
(indicated as point 3 in Figure 4). These four blocks (which GPRA calls “the Downtown
Core”) are the location most commonly associated with the name “Historic Downtown”
in the minds of stakeholders, and they provide Abbotsford’s most walkable commercial
C i t y C e n t r e & H i s t o r i c D o w n t o w n C o m m e r c i a l S t u d y | 9
environment which has proven ideal for restaurants, cafés, book stores, food stores,
spas, kitchen and home furnishing stores, dance studios, and other establishments
generally associated with downtown areas.
The Historic Downtown also contains:
• A City-owned parking lot adjacent to the Downtown Core, on the east side of
West Railway Street, between George Ferguson Way and Essendene Avenue
(indicated as point 4 in Figure 4)
• A swath of developable land of about 17 acres to the north of the Downtown
Core, the former Clayburn Brick Factory (indicated as point 1 in Figure 4)
• A zone with a good location but facing socio-economic challenges (indicated
as point 5 in Figure 4), which includes:
o Jubilee Park
o A City-owned parking lot
o Travelodge Abbotsford
• A string of large-footprint office and thrift retail uses, all with significant amounts
of parking, in a car-dependent section of Gladys Avenue near the Historic
Downtown’s southeast corner (indicated as point 7 in Figure 4), including:
o The Mennonite Central Committee (MCC) Thrift Store complex
o Canada Post office building
o Correctional Services of Canada office building
o The former grain elevator office building
o An office building at 34079 Gladys Road
o The Salvation Army complex.
• Two under-utilized strip malls, each with at least 25% vacancy (which is well
beyond the healthy range of 5% - 8%):
o One immediately to the west of the Downtown Core, anchored by a
Dollar Tree and a branch of Sprott Shaw College (indicated as point 2 in
Figure 4)
o One in the Historic Downtown’s southwest corner, anchored by a
Fabricland and SKT Farm Market (indicated as point 6 in Figure 4)
And throughout the area that surrounds the Downtown Core, the following uses are
common:
• Government and social services
• Small and medium-sized strip malls, most of them old
• Small restaurants and retail operations
• Single family homes and multi-family residential buildings.
C i t y C e n t r e & H i s t o r i c D o w n t o w n C o m m e r c i a l S t u d y | 10
2.3.2 Historic Downtown Forces and Trends
The Historic Downtown uses its built form well: it is walkable and has comfortable
building heights and block lengths as well as good overall urban design. It is both
central and accessible to the City as a whole, making it an attractive destination.
Although it is now considered successful by most of the stakeholders interviewed by
GPRA, the Historic Downtown was not always so vibrant. Realtors and developers report
that 10 years ago the Downtown Core was aging poorly, had little street life, and
attracted only the most cost-sensitive tenants. Since then it has been refurbished,
renovated, and revitalized. This process is ongoing, with four or five buildings currently
under renovation.
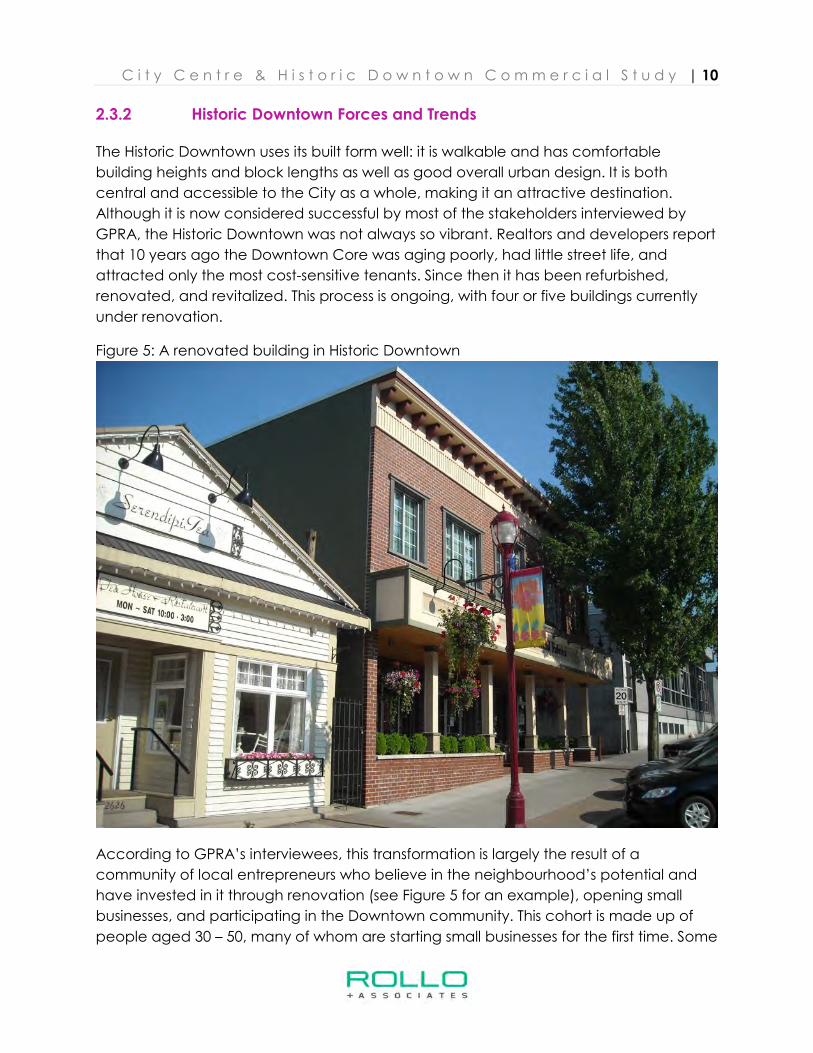
Figure 5: A renovated building in Historic Downtown
According to GPRA’s interviewees, this transformation is largely the result of a
community of local entrepreneurs who believe in the neighbourhood’s potential and
have invested in it through renovation (see Figure 5 for an example), opening small
businesses, and participating in the Downtown community. This cohort is made up of
people aged 30 – 50, many of whom are starting small businesses for the first time. Some
C i t y C e n t r e & H i s t o r i c D o w n t o w n C o m m e r c i a l S t u d y | 11
grew up in the Fraser Valley and are now returning from elsewhere, either to start
families or for other personal reasons. Others simply see Abbotsford as good place to
establish themselves and their careers. It is a diverse and enthusiastic group, and the
City should continue to leverage it to drive positive change in the Historic Downtown.
This surge of local enthusiasm has positively impacted the Historic Downtown from a
commercial perspective, but growth and change in the area has also been aided by
successful City policies. Developers report that the Historic Downtown Revitalization Tax
Exemption5 and cash-in-lieu of parking policy6 have both been critical in enabling
development by rendering projects more financially viable. Tourism Abbotsford’s efforts
to attract events have also been successful at bringing people to the Historic
Downtown, which has been noticed and appreciated by local business owners. In
summary, the City’s focus on the Historic Downtown has paid off, resulting in a good
relationship between the City and the Abbotsford Downtown Business Association, at
least according to one developer.
The Downtown Core is trendy and appealing to many businesses. According to one
realtor, this has resulted in a lower commercial vacancy rate for the Historic Downtown
than in Abbotsford generally. Although this may be true for the Downtown Core in
particular, GPRA’s commercial inventory (see Section 3) reveals that the Historic
Downtown actually has a very high retail vacancy rate of about 14%. However, this
does not indicate a weak retail market in the Historic Downtown as a whole, but rather
reflects very high vacancy in two separate strips malls (indicated in Figure 4, pg. 8 at
points “2” and “6”), as mentioned in Section 2.3.1. This is discussed in greater detail in
Section 3.
By virtue of its age and urban design, the Historic Downtown is mostly appropriate for
small commercial units and firms seeking such units. This is true in both the retail and
office sectors. Most businesses in the area are small locally-owned operations with a
particular interest in the community and neighbourhood. Larger operations and
franchises tend to locate elsewhere in the City. Small businesses are drawn to the
Historic Downtown because small units are what is available there, but they have also
5 City of Abbotsford (2015). Historic Downtown Revitalization Tax Exemption Application Form. https://www.abbotsford.ca/Assets/2014+Abbotsford/Planning+and+Development/Planning/Application+Forms/Historic+Downtown+Revitalization+Tax+Exemption+Application+Form.pdf
6 “Where a new building is constructed on a vacant lot within the area designated Historic Downtown Abbotsford… the owner may remit a cash payment to the City in the amount of $3,000 per off-street parking space in lieu of the required off-street parking, up to a maximum of 10 spaces.” From Abbotsford Zoning Bylaw No. 2400-2014, Section 150.5.1c. https://abbotsford.civicweb.net/document/11742
C i t y C e n t r e & H i s t o r i c D o w n t o w n C o m m e r c i a l S t u d y | 12
been drawn to the area due to low costs arising from older, less expensive rental space.
Insofar as older unrenovated buildings remain in the area, cost-conscious firms will
continue to go there. However, if renovation and replacement of older buildings
continues apace, this will be less true over time, and cost-conscious firms will need to
locate elsewhere. Already a shift has occurred away from lower-end businesses
towards higher-end, more boutique operations drawing on the Downtown Core’s
trendiness, and the supply of old buildings suitable for replacement or refurbishment is
dwindling. City policies that promote renovation and redevelopment will tend to
expedite this transition.
2.3.3 Barriers to Commercial Development in the Historic Downtown
2.3.3.1 Parking
The most commonly mentioned barrier to commercial development in the Historic
Downtown (and to the neighbourhood’s success generally) is the perceived lack of
parking in the area. One realtor claims that he is losing tenants due to lack of parking,
and points to downtowns in other communities that have fared poorly against
competing commercial centres with more parking space, for example Downtown
Langley with respect to Willowbrook Shopping Centre. Many stakeholders argue that
visitors to the Historic Downtown expect to be able to park within a block of their
destination and are unwilling to walk further, park underground, or pay very much.
Larger commercial tenants may also be unwilling to locate in the Historic Downtown as
they typically require a great deal of parking.
Although GPRA recognizes that the perceived lack of street parking can be a barrier to
commercial success in multiple ways, there are options for addressing this barrier.
Options include:
• Pricing street parking, which would free up parking spaces but increase visitor
costs
• Building one or more City-owned parking structures in the Downtown Core
• Requiring more privately owned parking as part of development, either on the
street or underground, which would deter development in either case
• Continuing with the current policy, which means some visitors use City-owned
lots and walk several blocks to their destinations.
C i t y C e n t r e & H i s t o r i c D o w n t o w n C o m m e r c i a l S t u d y | 13
2.3.3.2 Jubilee Park
The Historic Downtown – particularly the area around Jubilee Park – is frequented by a
population of vulnerable individuals, many of them homeless. Some stakeholders
identified this group and the services that cater to them as a barrier to the
neighbourhood’s commercial vibrancy, primarily due to security concerns. Addressing
this potential barrier goes beyond the scope of this research, though design
improvements to Jubilee Park and adjacent areas could go a long way in making it a
safer place.
2.3.3.3 Lack of Anchors
One realtor pointed out that unlike the City Centre, the Historic Downtown lacks large
retailers or “anchors” that would act as draws on customers, bringing people to the
neighbourhood who would then spend time and money there en route. In particular,
he recommended placing at least two large anchors in the Historic Downtown – ideally
one on either side of the Downtown Core, which would encourage visitors to pass
through the Core en route, and would stimulate more spending. Addressing this barriers
is complicated by a general lack of large developable lots in the Historic Downtown.
Placing more anchor tenants in the Historic Downtown might have the positive impact
described here.
2.3.3.4 Design of Essendene Avenue
Some stakeholders identified Essendene Avenue as a challenging location, because it
passes right through the Downtown Core but has the width, traffic volume, and traffic
speeds of an arterial road. The Avenue is therefore poorly designed for pedestrians and
feels unsafe as a consequence. Traffic calming and further pedestrian improvements
on Essendene Avenue might improve the Downtown Core from a commercial
perspective.
2.3.3.5 Lack of Neighbourhood Residents
There are residences in the Historic Downtown, but there could be more. Adding more
residents to the neighbourhood would be a positive change. The financial impact of
residential growth on Downtown businesses will be relatively minor, but the
psychological impact will be positive, since it will create an established presence,
ownership of the neighbourhood, and eyes on the street to enhance safety.
C i t y C e n t r e & H i s t o r i c D o w n t o w n C o m m e r c i a l S t u d y | 14
3 Retail and Service Commercial
This section presents GPRA’s research on existing retail and service commercial usage,
supply, and market conditions in the Study Areas, and then describes our process for
producing a 25-year retail and service commercial space projection for each.
3.1 Trends and Factors in Study Area Commercial Space
Retail within the City Centre study area is well established and is a highly successful
automobile oriented node. Retail is well built out within this Study Area, and typically
development within this neighbourhood involves replacement or renovation of an
existing building. The City Centre study area has seen a handful of small retail projects in
the past few years including the Wendy’s 2015 replacement, the 2014 demolition of
former pad tenant Earls replacement by a new two storey CIBC outlet, and the
ancillary restaurant operations to Sandman’s 2010 hotel development, Denny’s and
Moxie’s. Retail development can also be found at the ground floor level of mixed use
projects such as The Mark, Alwood Professional Centre, and the under construction La
Galleria which will introduce a further 40,000 SF inventory to the City Centre.
City Centre’s major retail centre, Sevenoaks Shopping Centre is currently performing
well with a low vacancy rate. Despite the mall’s last major renovations occurring in
2000, the centre will likely remain the premier comparison retail destination in
Abbotsford for the foreseeable future. To the west of Sevenoaks is the West Oaks
Shopping Centre, a convenience oriented strip centre anchored by Save on Foods and
London Drugs. The centre contains a small portion of enclosed retail space which is
struggling, however the exterior big box units appear to be performing well.
The Historic Downtown is currently seeing a renaissance driven by smaller, locally
operated retailers in contrast with the City Centre’s predominantly national /
international chains. Retailers historically situated in the Historic Downtown due to more
affordable rents, although this pattern is reversing quite rapidly with various retailers and
restaurateurs opening in the Historic Downtown, driving several small-scale infill
developments. Examples of such development can be seen with Yale Crossing (2010),
Pioneer Square (2013), and the Flatiron Building (2017), each introducing mixed use
development into the area, with at grade retail below residential or office uses.
Although boutique retailing in the Historic Downtown continues to see growth, everyday
convenience retail continues to be under represented. As a critical mass of residents
emerges over coming years this will likely change as a small format grocery store will
likely seek to fill this niche market.
Recent developments outside of the Study Areas include Phase I of McCallum Junction,
a 130,000 ft2 strip centre anchored by destination hunting, fishing, and outdoor
C i t y C e n t r e & H i s t o r i c D o w n t o w n C o m m e r c i a l S t u d y | 15
recreation store Cabela’s, a first in the Lower Mainland. Phase II of McCallum Junction is
expected to introduce numerous pad units and CRUs with confirmed tenants including
McDonald’s, Starbucks, and numerous commercial services.
Another major recent development is the High Street, a 600,000 ft2 unenclosed
shopping centre at Highway 1 and Mt. Lehman Road. Anchor tenants include a
Walmart, London Drugs, Old Navy, and Cineplex. The centre’s tenant mix has a high
proportion of chain food and beverage operators and introduces several first to market
casual and quick service eateries including Canadian Brewhouse, Famoso Pizzeria,
Mucho Burrito, and Cupcake. Food and beverage outlets are clustered to the west of
the project and help to facilitate foot traffic between the centre’s convenience uses
past low to mid-market apparel, accessories, and cosmetic / beauty retailers.
Other notable retail deals over the past couple of years include the tenanting of the
former Target location in Abbotsford Power Centre as part of a national expansion by
home improvement store Lowe’s, and the shuttering of the adjacent Rona.
3.2 Definition and types of retail and service commercial
Retail and service commercial businesses cater to consumers rather than other
businesses. This category of commerce excludes:
• Accommodation
• Business services such as industrial equipment rental
• Care facilities
• Construction and trades
• Logistics operations such as shipping and storage
• Above-ground office space, which is addressed separately in Section 4.
Most businesses with storefronts or “public” offices can be considered retail or service
commercial. The four primary categories of retail and service commercial are:
• Convenience retail, typically associated with daily needs including grocery
stores, pharmacies, liquor stores, service commercial (businesses selling services
rather than tangible goods), healthcare services, and financial services
• Comparison retail, which sells higher order items such as clothing, furniture,
household appliances, jewelry and watches etc.
• Automotive, including dealerships, auto parts and servicing, and gas stations
• Food and beverage & entertainment and leisure, which includes restaurants,
bars, entertainment (passive e.g. movie theatre), and leisure (active e.g.
gymnasium)
C i t y C e n t r e & H i s t o r i c D o w n t o w n C o m m e r c i a l S t u d y | 16
3.3 Existing retail and service commercial
GPRA has created an inventory of existing retail and service commercial space in
Abbotsford based on the following sources of data:
• The City’s business license database
• Colliers’ 2015 Commercial Study (OCP)
• Building footprints extracted from Open Street Map data
• A walking inventory of the Study Areas completed by GPRA
• Online sources such as Google Streetview and mall websites
• Interviews with local realtors & developers.
Tables 1, 2, and 3 present the complete inventory of retail and service commercial
space in Abbotsford, divided into the four primary categories as well as 22 secondary
categories. It is an approximate estimation of currently used space, with vacant space
shown as a separate item. The amount of space used by each category of commercial
activity is indicated for Abbotsford in general, and for the Study Areas. Figures 6, 7, and
8 on the following pages map the location of retail and service commercial in both
Study Areas, City Centre, and Historic Downtown, respectively. Figure 9 outlines key
retail nodes within Abbotsford outside of the Study Areas.
C i t y C e n t r e & H i s t o r i c D o w n t o w n C o m m e r c i a l S t u d y | 17
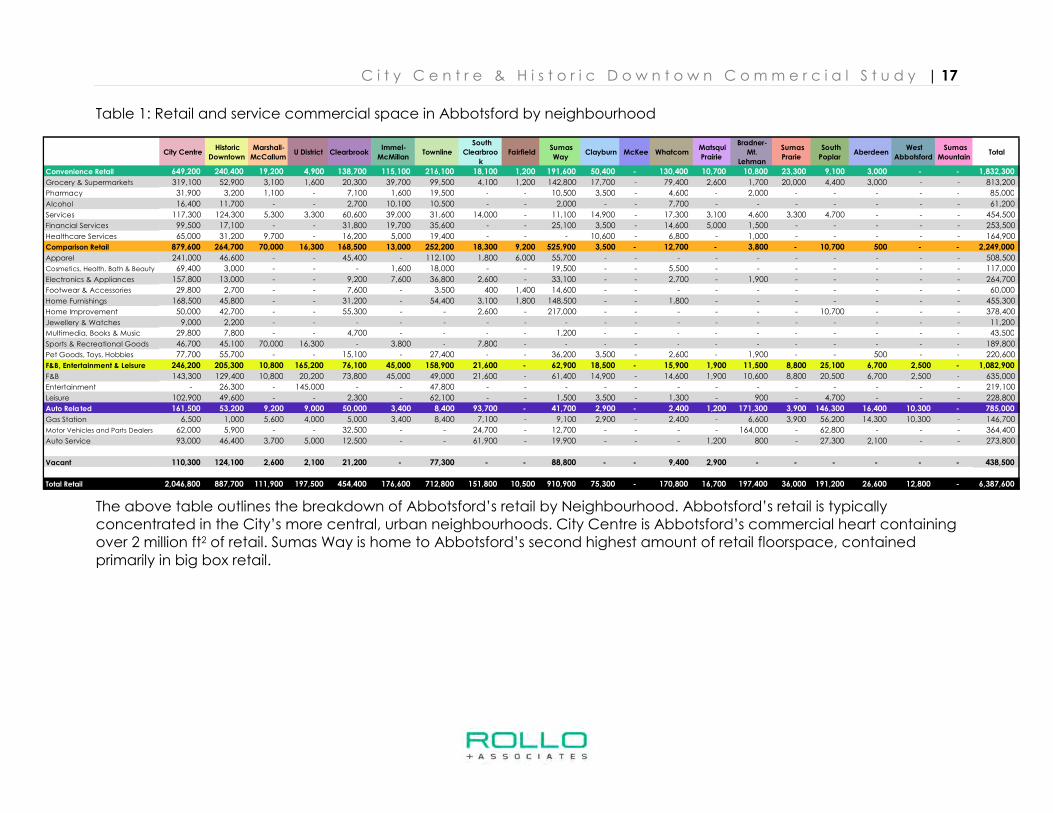
Table 1: Retail and service commercial space in Abbotsford by neighbourhood
The above table outlines the breakdown of Abbotsford’s retail by Neighbourhood. Abbotsford’s retail is typically concentrated in the City’s more central, urban neighbourhoods. City Centre is Abbotsford’s commercial heart containing over 2 million ft2 of retail. Sumas Way is home to Abbotsford’s second highest amount of retail floorspace, contained primarily in big box retail.
City Centre Historic
Downtown
Marshall-
McCallum U District Clearbrook
Immel-
McMillan Townline
South
Clearbroo
k
Fairfield Sumas
Way Clayburn McKee Whatcom
Matsqui
Prairie
Bradner-
Mt.
Lehman
Sumas
Prarie
South
Poplar Aberdeen
West
Abbotsford
Sumas
Mountain Total
Convenience Retail 649,200 240,400 19,200 4,900 138,700 115,100 216,100 18,100 1,200 191,600 50,400 - 130,400 10,700 10,800 23,300 9,100 3,000 - - 1,832,300
Grocery & Supermarkets 319,100 52,900 3,100 1,600 20,300 39,700 99,500 4,100 1,200 142,800 17,700 - 79,400 2,600 1,700 20,000 4,400 3,000 - - 813,200
Pharmacy 31,900 3,200 1,100 - 7,100 1,600 19,500 - - 10,500 3,500 - 4,600 - 2,000 - - - - - 85,000
Alcohol 16,400 11,700 - - 2,700 10,100 10,500 - - 2,000 - - 7,700 - - - - - - - 61,200
Services 117,300 124,300 5,300 3,300 60,600 39,000 31,600 14,000 - 11,100 14,900 - 17,300 3,100 4,600 3,300 4,700 - - - 454,500
Financial Services 99,500 17,100 - - 31,800 19,700 35,600 - - 25,100 3,500 - 14,600 5,000 1,500 - - - - - 253,500
Healthcare Services 65,000 31,200 9,700 - 16,200 5,000 19,400 - - - 10,600 - 6,800 - 1,000 - - - - - 164,900
Comparison Retail 879,600 264,700 70,000 16,300 168,500 13,000 252,200 18,300 9,200 525,900 3,500 - 12,700 - 3,800 - 10,700 500 - - 2,249,000
Apparel 241,000 46,600 - - 45,400 - 112,100 1,800 6,000 55,700 - - - - - - - - - - 508,500
Cosmetics, Health, Bath & Beauty 69,400 3,000 - - - 1,600 18,000 - - 19,500 - - 5,500 - - - - - - - 117,000
Electronics & Appliances 157,800 13,000 - - 9,200 7,600 36,800 2,600 - 33,100 - - 2,700 - 1,900 - - - - - 264,700
Footwear & Accessories 29,800 2,700 - - 7,600 - 3,500 400 1,400 14,600 - - - - - - - - - - 60,000
Home Furnishings 168,500 45,800 - - 31,200 - 54,400 3,100 1,800 148,500 - - 1,800 - - - - - - - 455,300
Home Improvement 50,000 42,700 - - 55,300 - - 2,600 - 217,000 - - - - - - 10,700 - - - 378,400
Jewellery & Watches 9,000 2,200 - - - - - - - - - - - - - - - - - - 11,200
Multimedia, Books & Music 29,800 7,800 - - 4,700 - - - - 1,200 - - - - - - - - - - 43,500
Sports & Recreational Goods 46,700 45,100 70,000 16,300 - 3,800 - 7,800 - - - - - - - - - - - - 189,800
Pet Goods, Toys, Hobbies 77,700 55,700 - - 15,100 - 27,400 - - 36,200 3,500 - 2,600 - 1,900 - - 500 - - 220,600
F&B, Entertainment & Leisure 246,200 205,300 10,800 165,200 76,100 45,000 158,900 21,600 - 62,900 18,500 - 15,900 1,900 11,500 8,800 25,100 6,700 2,500 - 1,082,900
F&B 143,300 129,400 10,800 20,200 73,800 45,000 49,000 21,600 - 61,400 14,900 - 14,600 1,900 10,600 8,800 20,500 6,700 2,500 - 635,000
Entertainment - 26,300 - 145,000 - - 47,800 - - - - - - - - - - - - - 219,100
Leisure 102,900 49,600 - - 2,300 - 62,100 - - 1,500 3,500 - 1,300 - 900 - 4,700 - - - 228,800
Auto Rela ted 161,500 53,200 9,200 9,000 50,000 3,400 8,400 93,700 - 41,700 2,900 - 2,400 1,200 171,300 3,900 146,300 16,400 10,300 - 785,000
Gas Station 6,500 1,000 5,600 4,000 5,000 3,400 8,400 7,100 - 9,100 2,900 - 2,400 - 6,600 3,900 56,200 14,300 10,300 - 146,700
Motor Vehicles and Parts Dealers 62,000 5,900 - - 32,500 - - 24,700 - 12,700 - - - - 164,000 - 62,800 - - - 364,400
Auto Service 93,000 46,400 3,700 5,000 12,500 - - 61,900 - 19,900 - - - 1,200 800 - 27,300 2,100 - - 273,800
Vacant 110,300 124,100 2,600 2,100 21,200 - 77,300 - - 88,800 - - 9,400 2,900 - - - - - - 438,500
Total Retail 2,046,800 887,700 111,900 197,500 454,400 176,600 712,800 151,800 10,500 910,900 75,300 - 170,800 16,700 197,400 36,000 191,200 26,600 12,800 - 6,387,600
C i t y C e n t r e & H i s t o r i c D o w n t o w n C o m m e r c i a l S t u d y | 18
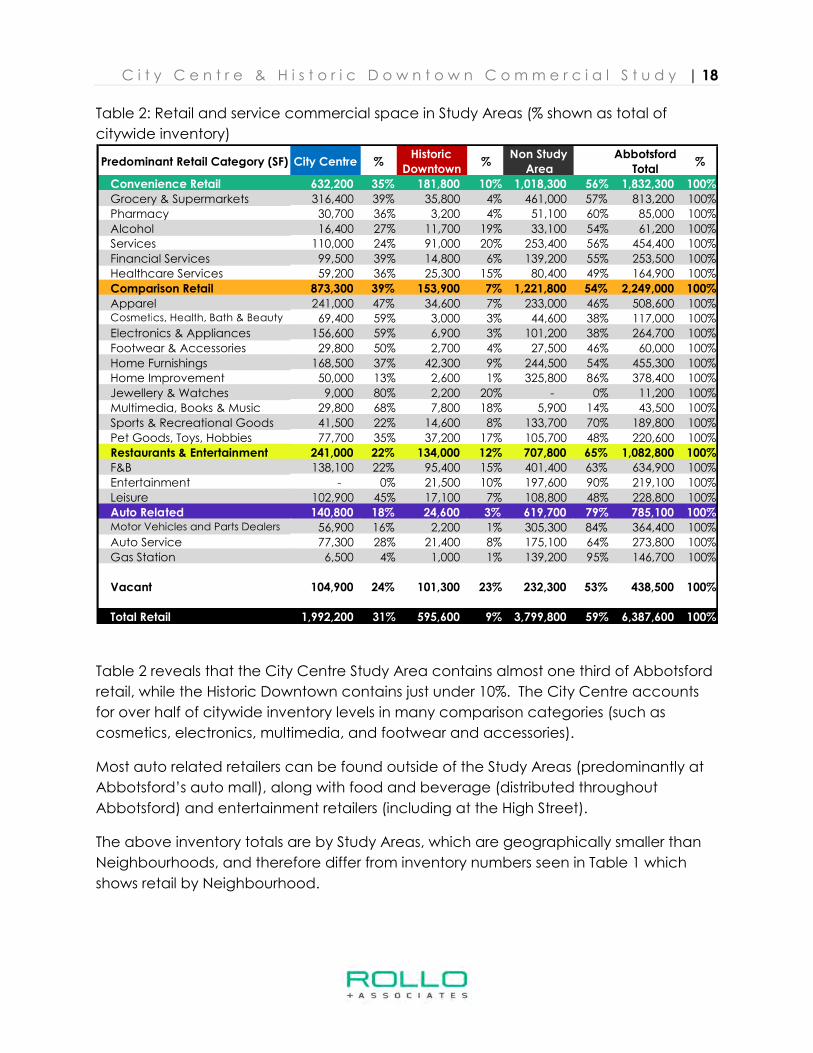
Table 2: Retail and service commercial space in Study Areas (% shown as total of
citywide inventory)
Table 2 reveals that the City Centre Study Area contains almost one third of Abbotsford
retail, while the Historic Downtown contains just under 10%. The City Centre accounts
for over half of citywide inventory levels in many comparison categories (such as
cosmetics, electronics, multimedia, and footwear and accessories).
Most auto related retailers can be found outside of the Study Areas (predominantly at
Abbotsford’s auto mall), along with food and beverage (distributed throughout
Abbotsford) and entertainment retailers (including at the High Street).
The above inventory totals are by Study Areas, which are geographically smaller than
Neighbourhoods, and therefore differ from inventory numbers seen in Table 1 which
shows retail by Neighbourhood.
Predominant Retail Category (SF) City Centre %Historic
Downtown%
Non Study
Area
Abbotsford
Total%
Convenience Retail 632,200 35% 181,800 10% 1,018,300 56% 1,832,300 100%
Grocery & Supermarkets 316,400 39% 35,800 4% 461,000 57% 813,200 100%
Pharmacy 30,700 36% 3,200 4% 51,100 60% 85,000 100%
Alcohol 16,400 27% 11,700 19% 33,100 54% 61,200 100%
Services 110,000 24% 91,000 20% 253,400 56% 454,400 100%
Financial Services 99,500 39% 14,800 6% 139,200 55% 253,500 100%
Healthcare Services 59,200 36% 25,300 15% 80,400 49% 164,900 100%
Comparison Retail 873,300 39% 153,900 7% 1,221,800 54% 2,249,000 100%
Apparel 241,000 47% 34,600 7% 233,000 46% 508,600 100%Cosmetics, Health, Bath & Beauty 69,400 59% 3,000 3% 44,600 38% 117,000 100%
Electronics & Appliances 156,600 59% 6,900 3% 101,200 38% 264,700 100%
Footwear & Accessories 29,800 50% 2,700 4% 27,500 46% 60,000 100%
Home Furnishings 168,500 37% 42,300 9% 244,500 54% 455,300 100%
Home Improvement 50,000 13% 2,600 1% 325,800 86% 378,400 100%
Jewellery & Watches 9,000 80% 2,200 20% - 0% 11,200 100%
Multimedia, Books & Music 29,800 68% 7,800 18% 5,900 14% 43,500 100%
Sports & Recreational Goods 41,500 22% 14,600 8% 133,700 70% 189,800 100%
Pet Goods, Toys, Hobbies 77,700 35% 37,200 17% 105,700 48% 220,600 100%
Restaurants & Entertainment 241,000 22% 134,000 12% 707,800 65% 1,082,800 100%
F&B 138,100 22% 95,400 15% 401,400 63% 634,900 100%
Entertainment - 0% 21,500 10% 197,600 90% 219,100 100%
Leisure 102,900 45% 17,100 7% 108,800 48% 228,800 100%
Auto Related 140,800 18% 24,600 3% 619,700 79% 785,100 100%Motor Vehicles and Parts Dealers 56,900 16% 2,200 1% 305,300 84% 364,400 100%
Auto Service 77,300 28% 21,400 8% 175,100 64% 273,800 100%
Gas Station 6,500 4% 1,000 1% 139,200 95% 146,700 100%
Vacant 104,900 24% 101,300 23% 232,300 53% 438,500 100%
Total Retail 1,992,200 31% 595,600 9% 3,799,800 59% 6,387,600 100%
C i t y C e n t r e & H i s t o r i c D o w n t o w n C o m m e r c i a l S t u d y | 19
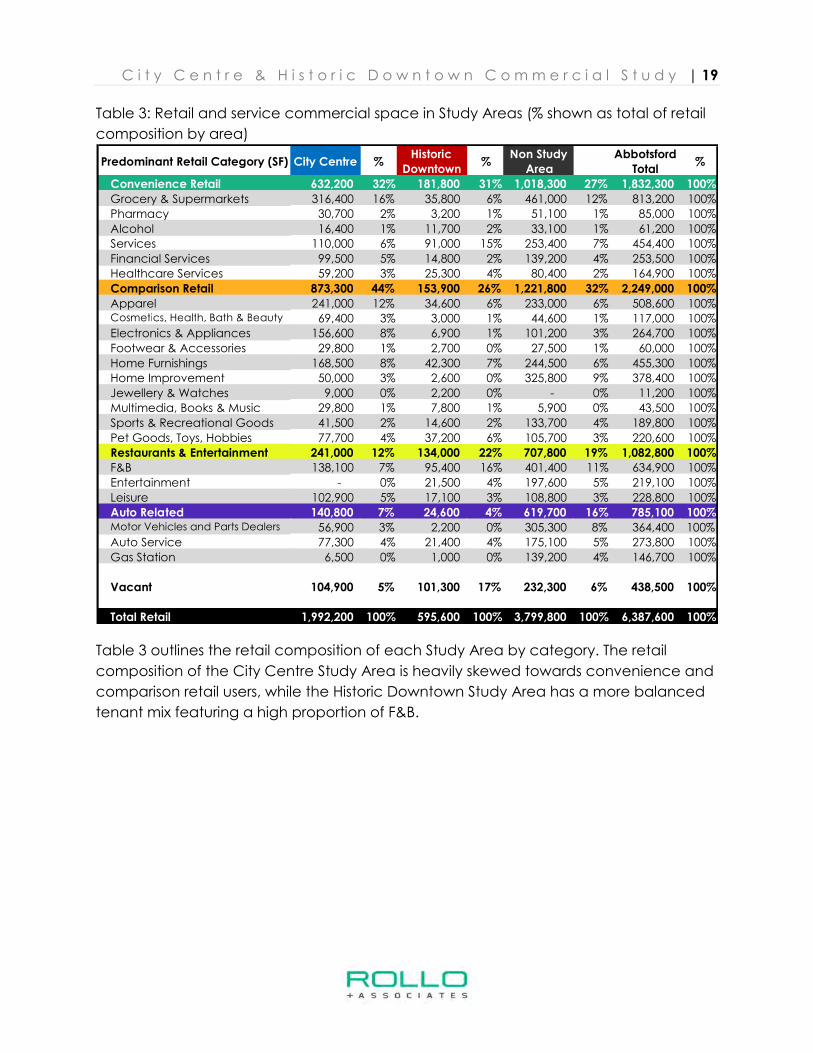
Table 3: Retail and service commercial space in Study Areas (% shown as total of retail
composition by area)
Table 3 outlines the retail composition of each Study Area by category. The retail
composition of the City Centre Study Area is heavily skewed towards convenience and
comparison retail users, while the Historic Downtown Study Area has a more balanced
tenant mix featuring a high proportion of F&B.
Predominant Retail Category (SF) City Centre %Historic
Downtown%
Non Study
Area
Abbotsford
Total%
Convenience Retail 632,200 32% 181,800 31% 1,018,300 27% 1,832,300 100%
Grocery & Supermarkets 316,400 16% 35,800 6% 461,000 12% 813,200 100%
Pharmacy 30,700 2% 3,200 1% 51,100 1% 85,000 100%
Alcohol 16,400 1% 11,700 2% 33,100 1% 61,200 100%
Services 110,000 6% 91,000 15% 253,400 7% 454,400 100%
Financial Services 99,500 5% 14,800 2% 139,200 4% 253,500 100%
Healthcare Services 59,200 3% 25,300 4% 80,400 2% 164,900 100%
Comparison Retail 873,300 44% 153,900 26% 1,221,800 32% 2,249,000 100%
Apparel 241,000 12% 34,600 6% 233,000 6% 508,600 100%Cosmetics, Health, Bath & Beauty 69,400 3% 3,000 1% 44,600 1% 117,000 100%
Electronics & Appliances 156,600 8% 6,900 1% 101,200 3% 264,700 100%
Footwear & Accessories 29,800 1% 2,700 0% 27,500 1% 60,000 100%
Home Furnishings 168,500 8% 42,300 7% 244,500 6% 455,300 100%
Home Improvement 50,000 3% 2,600 0% 325,800 9% 378,400 100%
Jewellery & Watches 9,000 0% 2,200 0% - 0% 11,200 100%
Multimedia, Books & Music 29,800 1% 7,800 1% 5,900 0% 43,500 100%
Sports & Recreational Goods 41,500 2% 14,600 2% 133,700 4% 189,800 100%
Pet Goods, Toys, Hobbies 77,700 4% 37,200 6% 105,700 3% 220,600 100%
Restaurants & Entertainment 241,000 12% 134,000 22% 707,800 19% 1,082,800 100%
F&B 138,100 7% 95,400 16% 401,400 11% 634,900 100%
Entertainment - 0% 21,500 4% 197,600 5% 219,100 100%
Leisure 102,900 5% 17,100 3% 108,800 3% 228,800 100%
Auto Related 140,800 7% 24,600 4% 619,700 16% 785,100 100%Motor Vehicles and Parts Dealers 56,900 3% 2,200 0% 305,300 8% 364,400 100%
Auto Service 77,300 4% 21,400 4% 175,100 5% 273,800 100%
Gas Station 6,500 0% 1,000 0% 139,200 4% 146,700 100%
Vacant 104,900 5% 101,300 17% 232,300 6% 438,500 100%
Total Retail 1,992,200 100% 595,600 100% 3,799,800 100% 6,387,600 100%
C i t y C e n t r e & H i s t o r i c D o w n t o w n C o m m e r c i a l S t u d y | 20
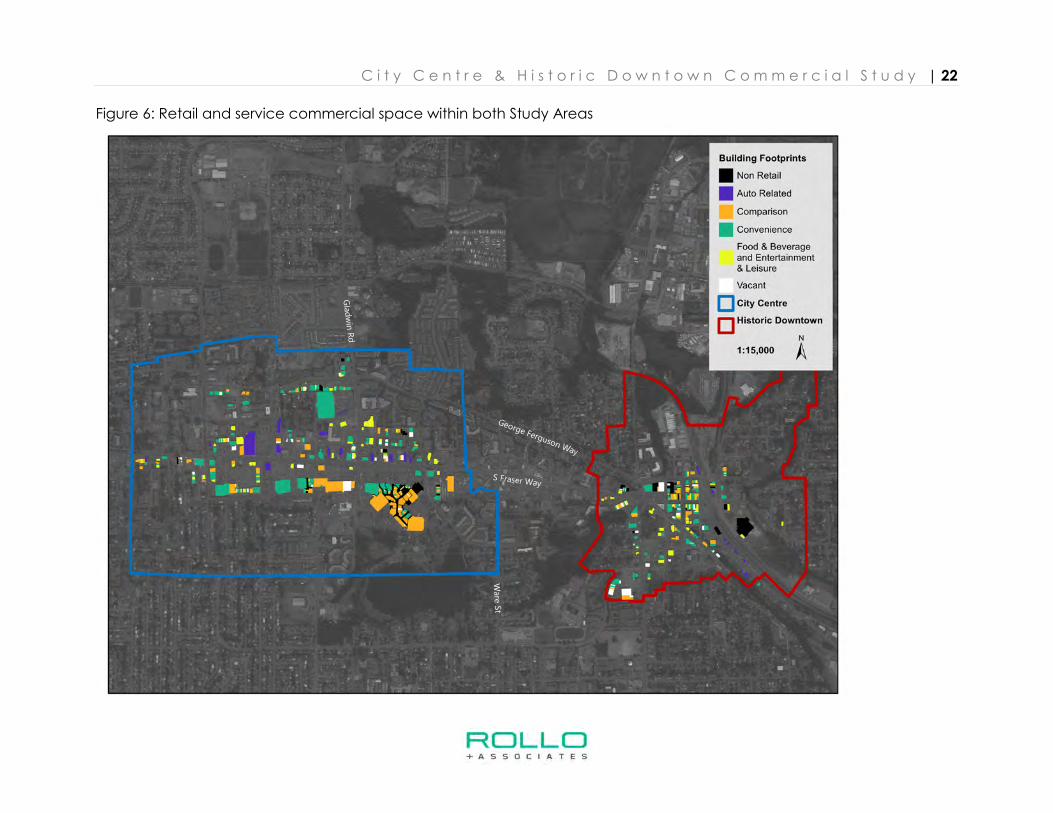
Figure 6 (page 22) outlines the distribution of retail throughout both the City Centre and
Historic Downtown Study Areas. One of the key differences that can be observed when
comparing the two Study Areas is that unit sizes within the City Centre are significantly
larger than those in the Historic Downtown, mirroring a trend that can be seen across
much of North America. As automobile and suburban culture rapidly expanded in the
Mid-20th Century retail underwent a seismic shift that saw the development of large
scale suburban projects that had few land restraints.
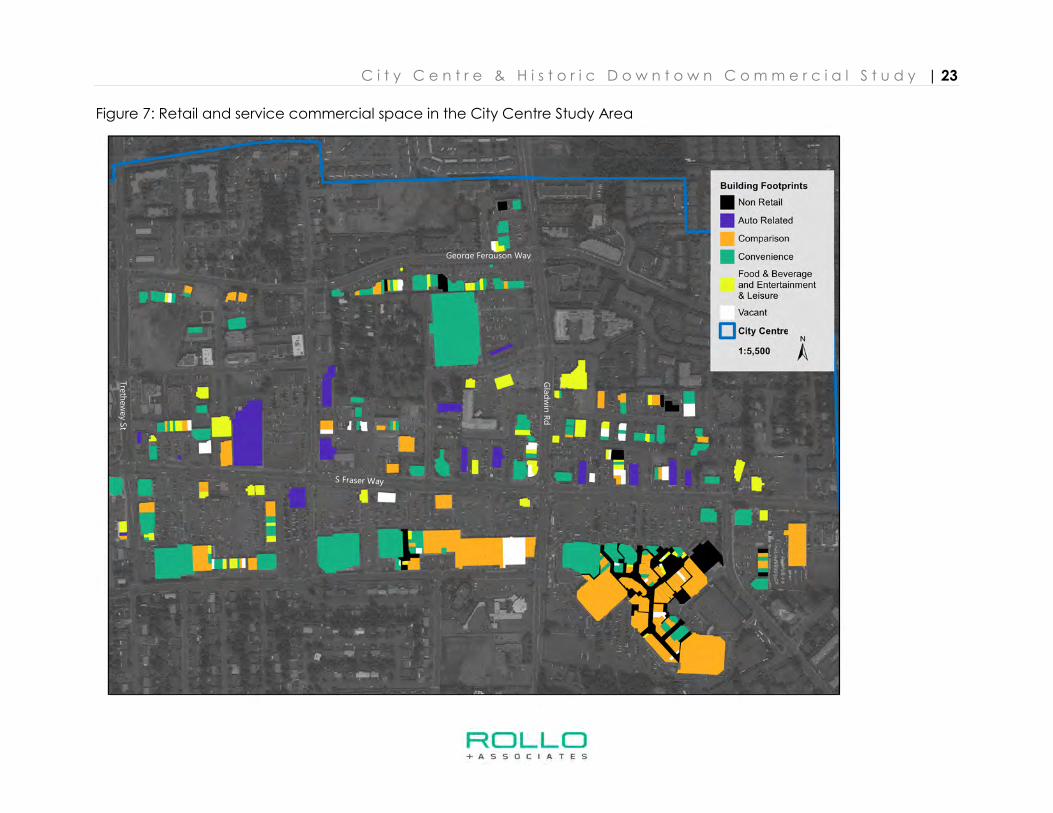
The City Centre Study Area (Figure 7, pg. 23) caters to some of the densest, most
populated neighbourhoods in Abbotsford with a diverse convenience retail mix
situated along major arterials in the study area. Major national grocery retails such as
Save on Foods, Independent Grocer, and the Real Canadian Superstore can be found
alongside ancillary everyday goods and services such as liquor stores, butchers, dry
cleaners, hair dressers, shoe repair stores etc. Due in part to its central location the City
Centre is also home to a disproportionately high amount of financial services such as
banks which benefit from locating along busy thoroughfares.
The City Centre contains 40% of Abbotsford’s comparison retail, primarily located south
of Fraser Way in the Sevenoaks Shopping Centre, along with several other smaller
power centres such as Clearbrook Town Square and West Oaks Mall. Comparison retail
within the City Centre contains almost a wide variety of domestic and international
retailer such as Hudson’s Bay, Sears, Best Buy, Bed, Bath & Beyond, Sports Chek,
Canadian Tire, etc. Although these reputable retailers offer a wide selection of
products, they are also available in almost every other municipality in the Lower
Mainland (particularly Surrey, Langley, and Vancouver), and stock goods widely
available online, increasing the likelihood of sales leakage.
Both the City Centre and the Historic Downtown currently have limited entertainment
venues, such as theatres and cinemas. Entertainment venues typically draw from a
wide distance and can provide surrounding businesses with increased foot traffic (such
as theatre patrons eating dinner before a performance). This effect is particularly
pronounced in walkable neighbourhoods. Leisure options are well represented in the
City Centre, which contains major gyms such as Trevor Linden / She’s Fit, Good Life
Fitness, and VRC Fitness.
The City Centre’s food and beverage offering contains many national and international
F&B operators including both full service restaurants (Moxie’s, White Spot, Boston Pizza),
and quick service restaurants (McDonalds, Wendy’s, A&W). These restaurants are
concentrated along South Fraser Way. Other locally operated food and beverage
operations can be found, particularly quick service restaurants in convenience strip
centres.
C i t y C e n t r e & H i s t o r i c D o w n t o w n C o m m e r c i a l S t u d y | 21
The City Centre contains just under a fifth of Abbotsford’s auto related category. Car
dealerships typically prefer to cluster in suburban auto mall type developments which
provide larger plots of cheaper land to showcase products. As land values in the City
Centre rise it is likely that Auto Related users will transition away from the area.
Vacancy rates in the City Centre currently stand at 5%, which is indicative of a healthy
market.
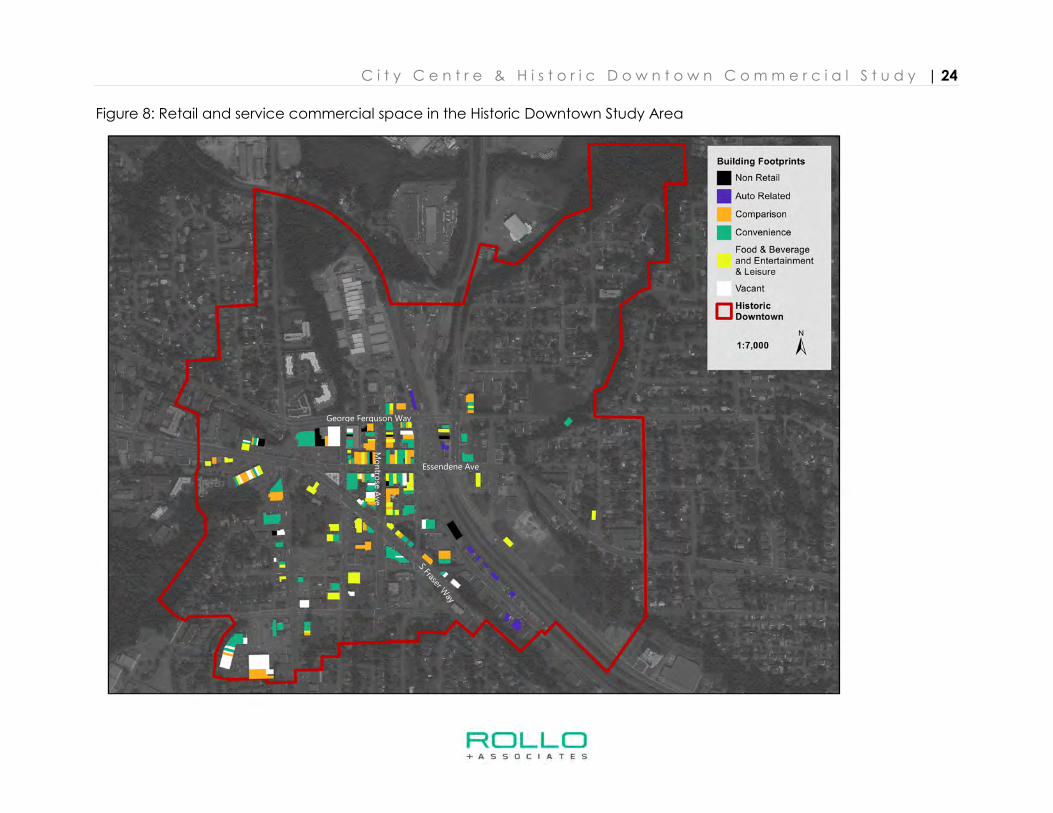
The Historic Downtown Study Area (Figure 8, pg. 24) features significantly less
convenience retail than the City Centre study area. This is particularly pronounced in
the grocery and supermarket category, which is can be an important asset in creating
walkable downtown areas as it reduces the necessity to drive to pick up everyday
goods. Major supermarket chains typically prefer to locate on major thoroughfares with
large amounts of surface parking except in denser urban cores, such as Downtown
Vancouver and Downtown Toronto. One of the potential issues facing the
development of even a small supermarket in the Historic Downtown is limited land
availability, and to develop a store with a 10,000 ft2 floor plate along major arterials
land assembly would likely be required.
Although everyday services such as grocery, liquor, and pharmacies are all but absent
from the Historic Downtown there is a large portion of service retail including hair salons,
dry cleaners, travel agents, etc.
Comparison retail in the Historic Downtown leans towards more niche, locally operated
retailers. This concentration of local vendors is likely due to multiple factors including
cheaper rents, preferences to the downtown’s human scale landscape, and inability to
secure mall or big box leases. This diverse tenant mix helps to differentiate the Historic
Downtown from regional shopping centres across Abbotsford and the Lower Mainland
by offering locally produced goods.
The Historic Downtown currently has a high proportion of food and beverage vendors
operating in the study area. In contrast to the City Centre, almost all the F&B operators
in the Historic Downtown area are independently owned and operated.
The Historic Downtown contains little in the way of Auto Related retailers, a trend that
will almost certainly continue.
Vacancy rates are high at 17%, although it is important to note that the study area
encompasses the struggling McCallum Centre south of the Historic Downtown, which
has approximately 38,000 ft2 vacant, or almost 40% of the Study Area’s vacancy.
C i t y C e n t r e & H i s t o r i c D o w n t o w n C o m m e r c i a l S t u d y | 22
Figure 6: Retail and service commercial space within both Study Areas
C i t y C e n t r e & H i s t o r i c D o w n t o w n C o m m e r c i a l S t u d y | 23
Figure 7: Retail and service commercial space in the City Centre Study Area
George Ferguson Way
Gla
dw
in R
d
Tre
thew
ey S
t
C i t y C e n t r e & H i s t o r i c D o w n t o w n C o m m e r c i a l S t u d y | 24
Figure 8: Retail and service commercial space in the Historic Downtown Study Area
George Ferguson Way
Mo
ntro
se A
ve
Essendene Ave
C i t y C e n t r e & H i s t o r i c D o w n t o w n C o m m e r c i a l S t u d y | 25
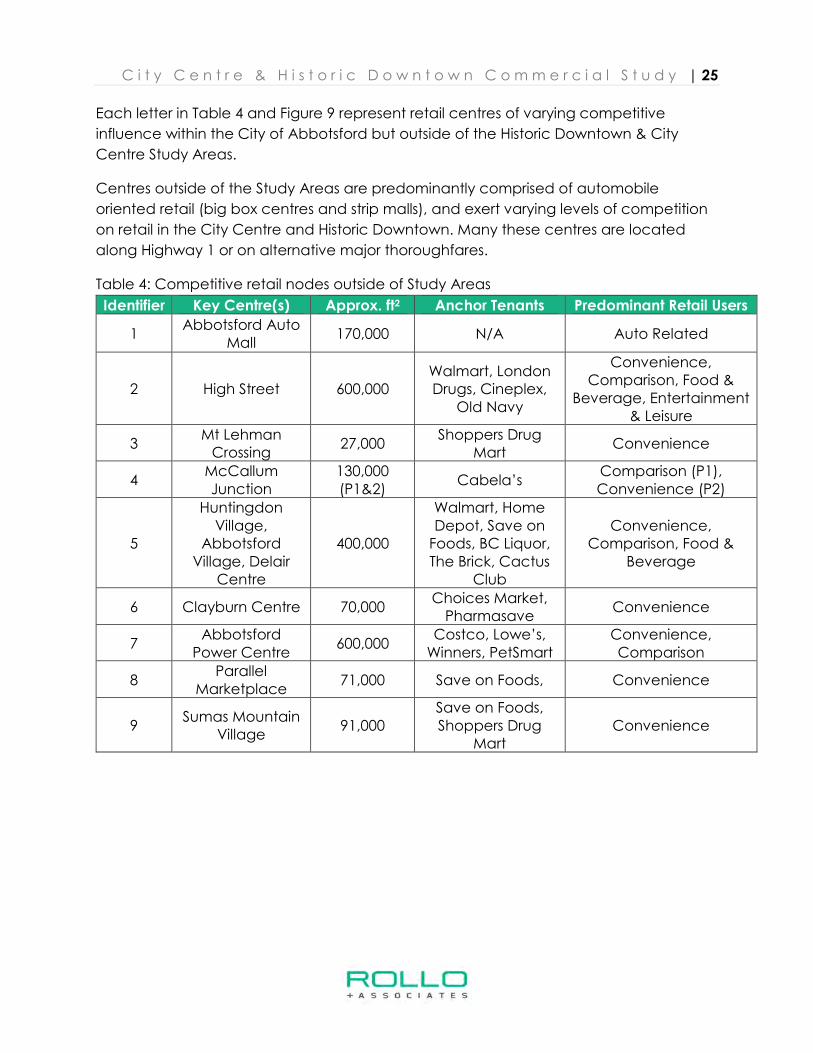
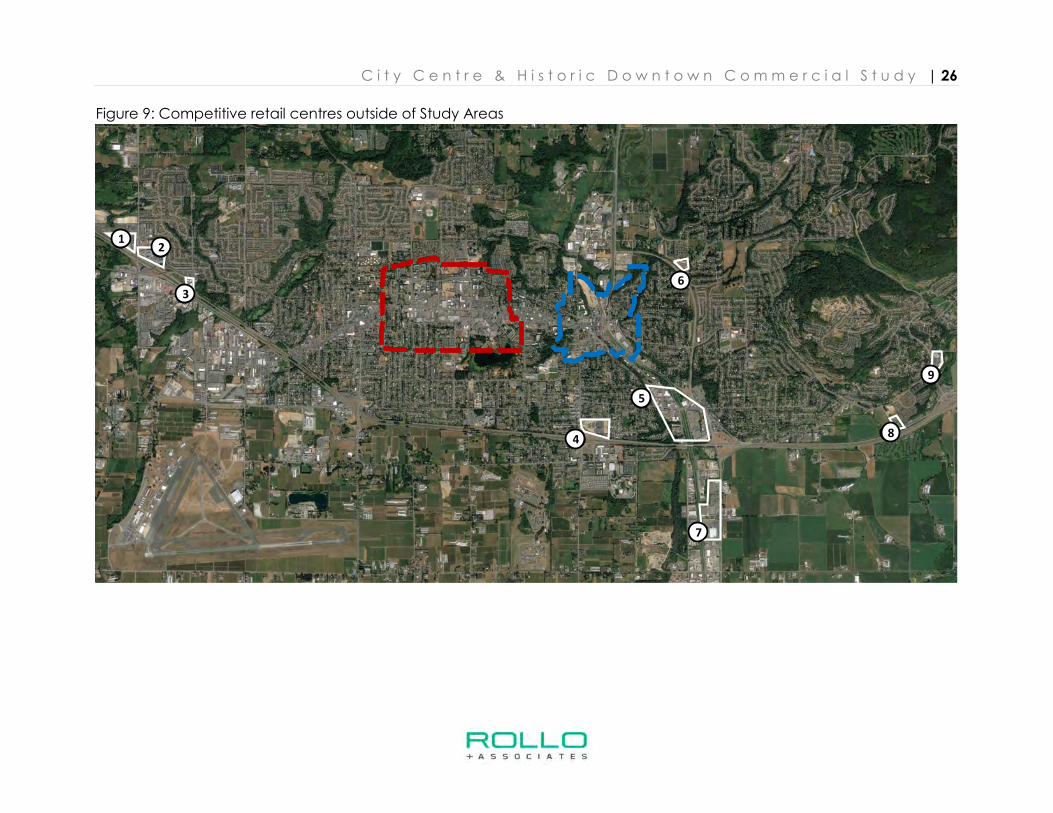
Each letter in Table 4 and Figure 9 represent retail centres of varying competitive
influence within the City of Abbotsford but outside of the Historic Downtown & City
Centre Study Areas.
Centres outside of the Study Areas are predominantly comprised of automobile
oriented retail (big box centres and strip malls), and exert varying levels of competition
on retail in the City Centre and Historic Downtown. Many these centres are located
along Highway 1 or on alternative major thoroughfares.
Table 4: Competitive retail nodes outside of Study Areas
Identifier Key Centre(s) Approx. ft2 Anchor Tenants Predominant Retail Users
1 Abbotsford Auto
Mall 170,000 N/A Auto Related
2 High Street 600,000 Walmart, London Drugs, Cineplex,
Old Navy
Convenience, Comparison, Food &
Beverage, Entertainment & Leisure
3 Mt Lehman Crossing
27,000 Shoppers Drug
Mart Convenience
4 McCallum Junction
130,000 (P1&2)
Cabela’s Comparison (P1), Convenience (P2)
5
Huntingdon Village,
Abbotsford Village, Delair
Centre
400,000
Walmart, Home Depot, Save on Foods, BC Liquor, The Brick, Cactus
Club
Convenience, Comparison, Food &
Beverage
6 Clayburn Centre 70,000 Choices Market, Pharmasave
Convenience
7 Abbotsford Power Centre
600,000 Costco, Lowe’s, Winners, PetSmart
Convenience, Comparison
8 Parallel
Marketplace 71,000 Save on Foods, Convenience
9 Sumas Mountain
Village 91,000
Save on Foods, Shoppers Drug
Mart Convenience
C i t y C e n t r e & H i s t o r i c D o w n t o w n C o m m e r c i a l S t u d y | 26
Figure 9: Competitive retail centres outside of Study Areas
AB
C
D
E
F
G
H
I
12
3
4
5
6
7
8
9
C i t y C e n t r e & H i s t o r i c D o w n t o w n C o m m e r c i a l S t u d y | 27
3.4 Retail and Service Commercial Projection
To project current and future demand for retail and service commercial floor space
within the study areas a model has been developed that factors in a variety of
assumptions including population projections, demographics, consumer spending
patterns, retail competition both internally and externally, and spending inflow from
surrounding communities.
The following section outlines key demographics within Abbotsford to inform existing
and future retail demand. The related Figures 10 – 17 follow on pg. 29 – 36.
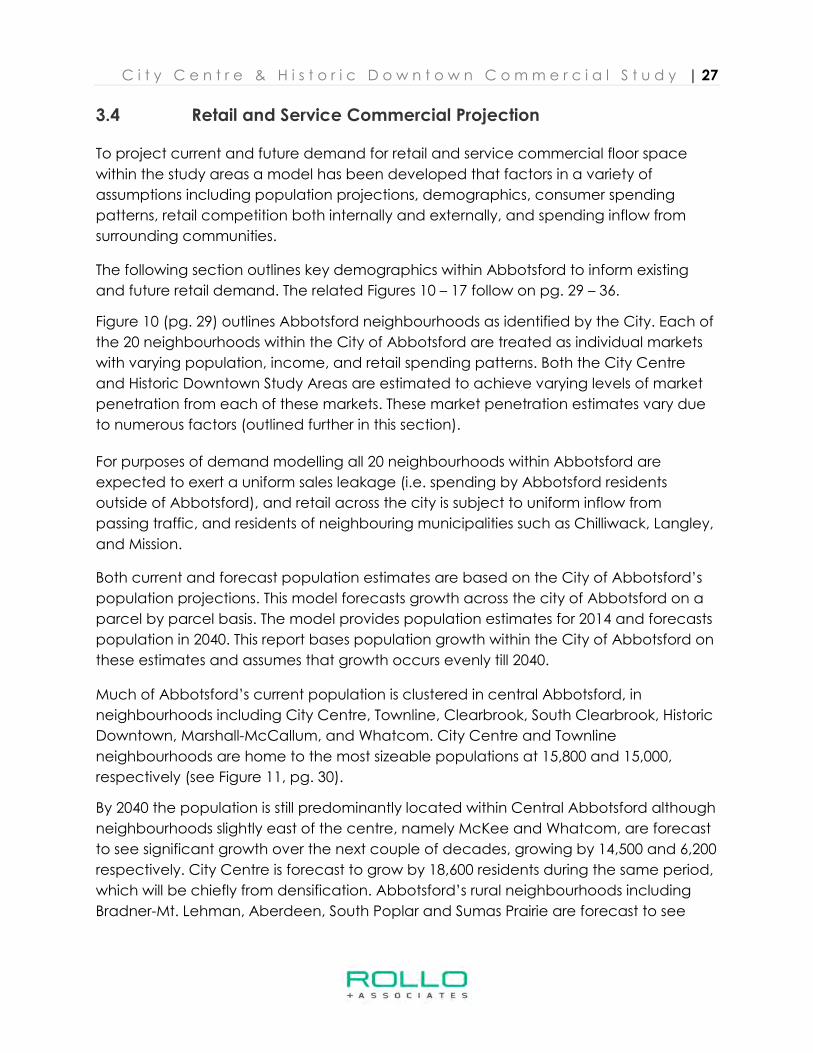
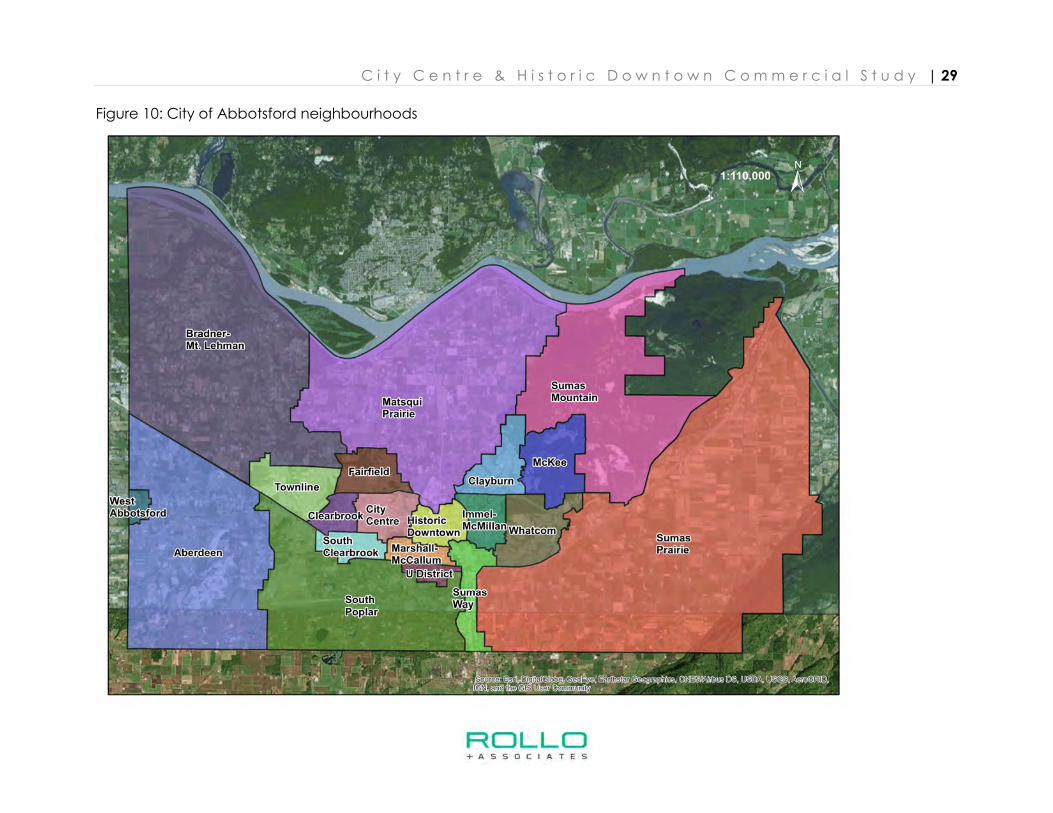
Figure 10 (pg. 29) outlines Abbotsford neighbourhoods as identified by the City. Each of the 20 neighbourhoods within the City of Abbotsford are treated as individual markets
with varying population, income, and retail spending patterns. Both the City Centre
and Historic Downtown Study Areas are estimated to achieve varying levels of market
penetration from each of these markets. These market penetration estimates vary due
to numerous factors (outlined further in this section).
For purposes of demand modelling all 20 neighbourhoods within Abbotsford are
expected to exert a uniform sales leakage (i.e. spending by Abbotsford residents
outside of Abbotsford), and retail across the city is subject to uniform inflow from
passing traffic, and residents of neighbouring municipalities such as Chilliwack, Langley,
and Mission.
Both current and forecast population estimates are based on the City of Abbotsford’s
population projections. This model forecasts growth across the city of Abbotsford on a parcel by parcel basis. The model provides population estimates for 2014 and forecasts
population in 2040. This report bases population growth within the City of Abbotsford on
these estimates and assumes that growth occurs evenly till 2040.
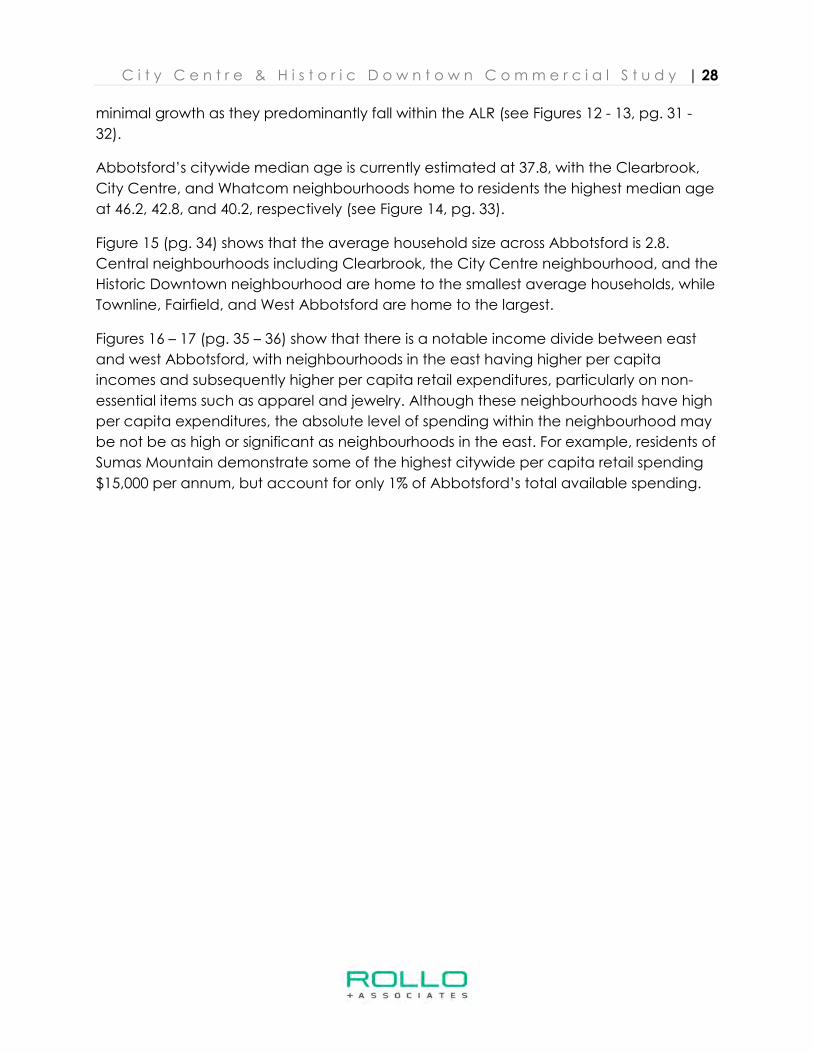
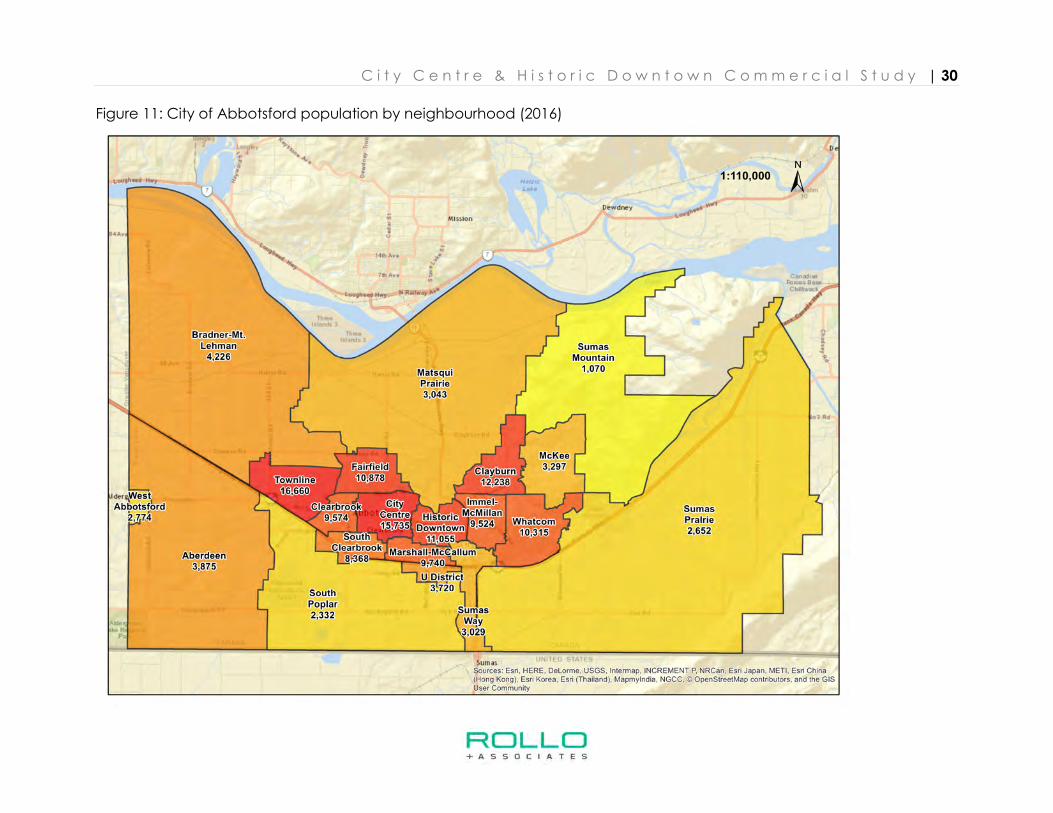
Much of Abbotsford’s current population is clustered in central Abbotsford, in
neighbourhoods including City Centre, Townline, Clearbrook, South Clearbrook, Historic
Downtown, Marshall-McCallum, and Whatcom. City Centre and Townline
neighbourhoods are home to the most sizeable populations at 15,800 and 15,000,
respectively (see Figure 11, pg. 30).
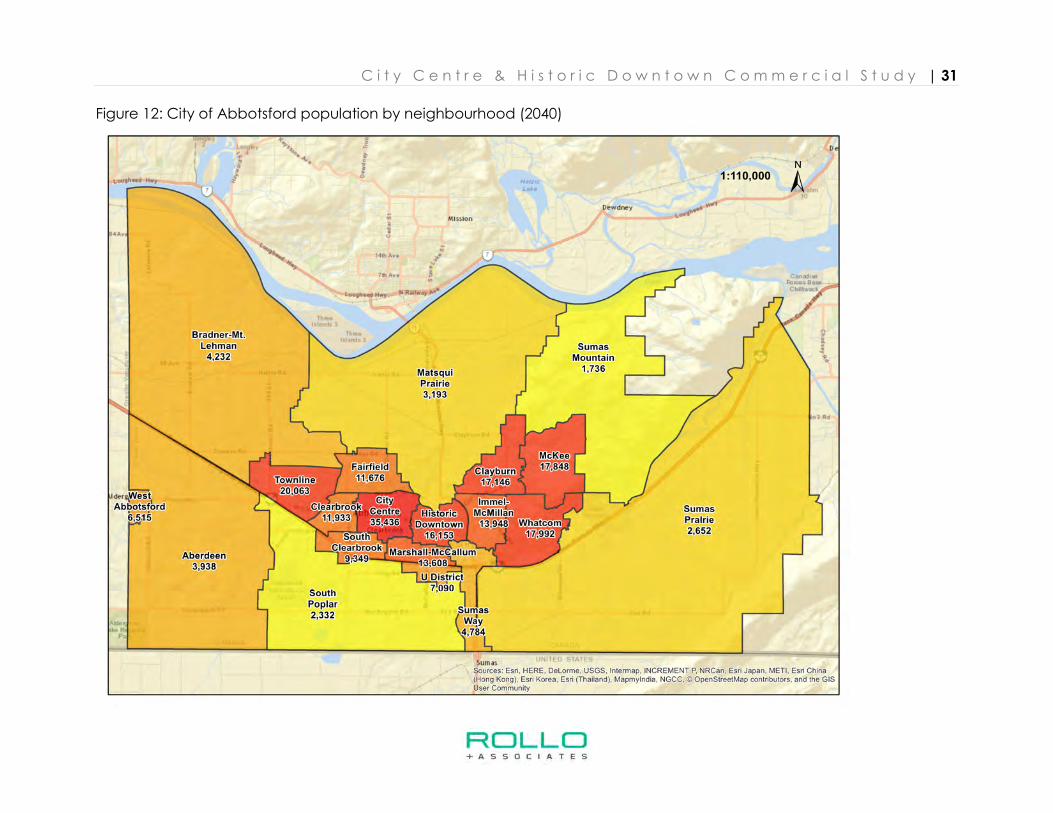
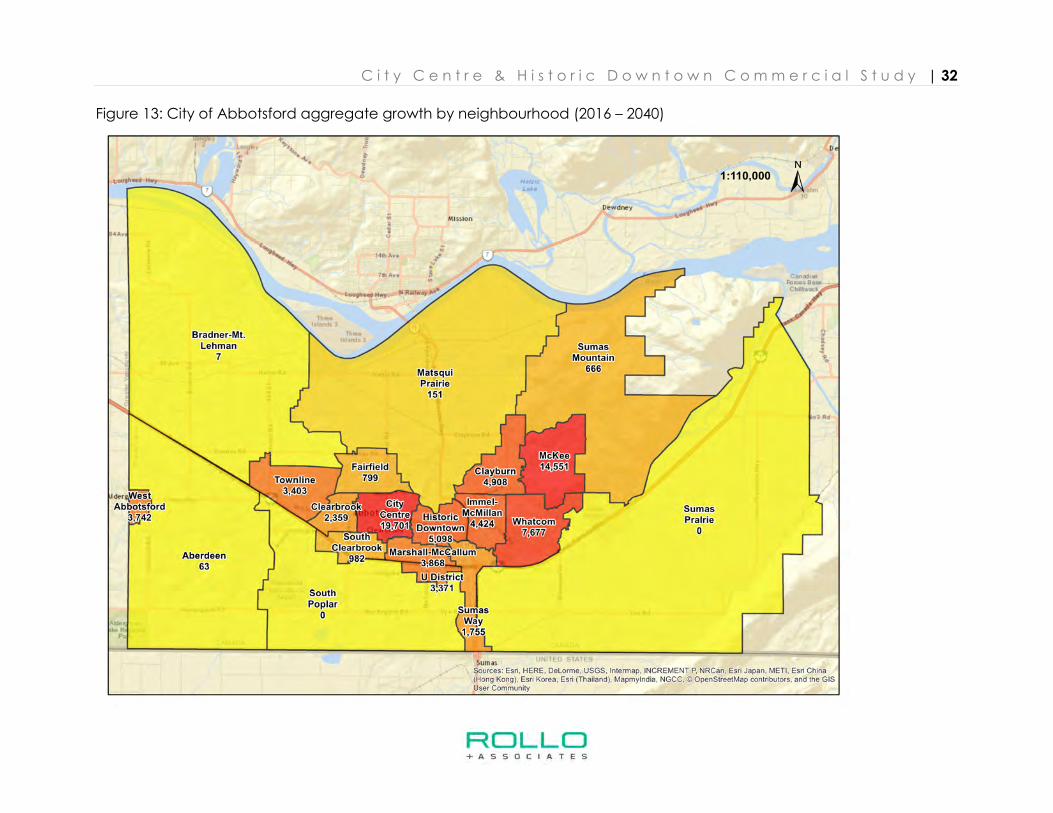
By 2040 the population is still predominantly located within Central Abbotsford although
neighbourhoods slightly east of the centre, namely McKee and Whatcom, are forecast
to see significant growth over the next couple of decades, growing by 14,500 and 6,200
respectively. City Centre is forecast to grow by 18,600 residents during the same period,
which will be chiefly from densification. Abbotsford’s rural neighbourhoods including Bradner-Mt. Lehman, Aberdeen, South Poplar and Sumas Prairie are forecast to see
C i t y C e n t r e & H i s t o r i c D o w n t o w n C o m m e r c i a l S t u d y | 28
minimal growth as they predominantly fall within the ALR (see Figures 12 - 13, pg. 31 -
32).
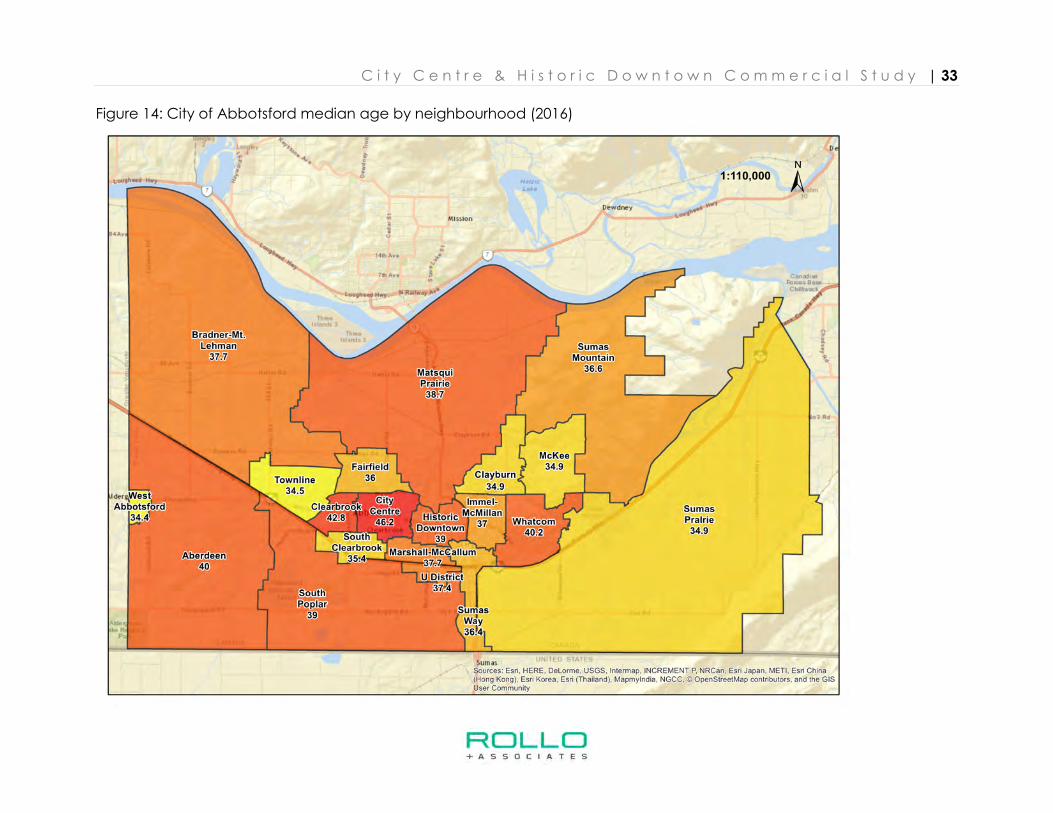
Abbotsford’s citywide median age is currently estimated at 37.8, with the Clearbrook,
City Centre, and Whatcom neighbourhoods home to residents the highest median age
at 46.2, 42.8, and 40.2, respectively (see Figure 14, pg. 33).
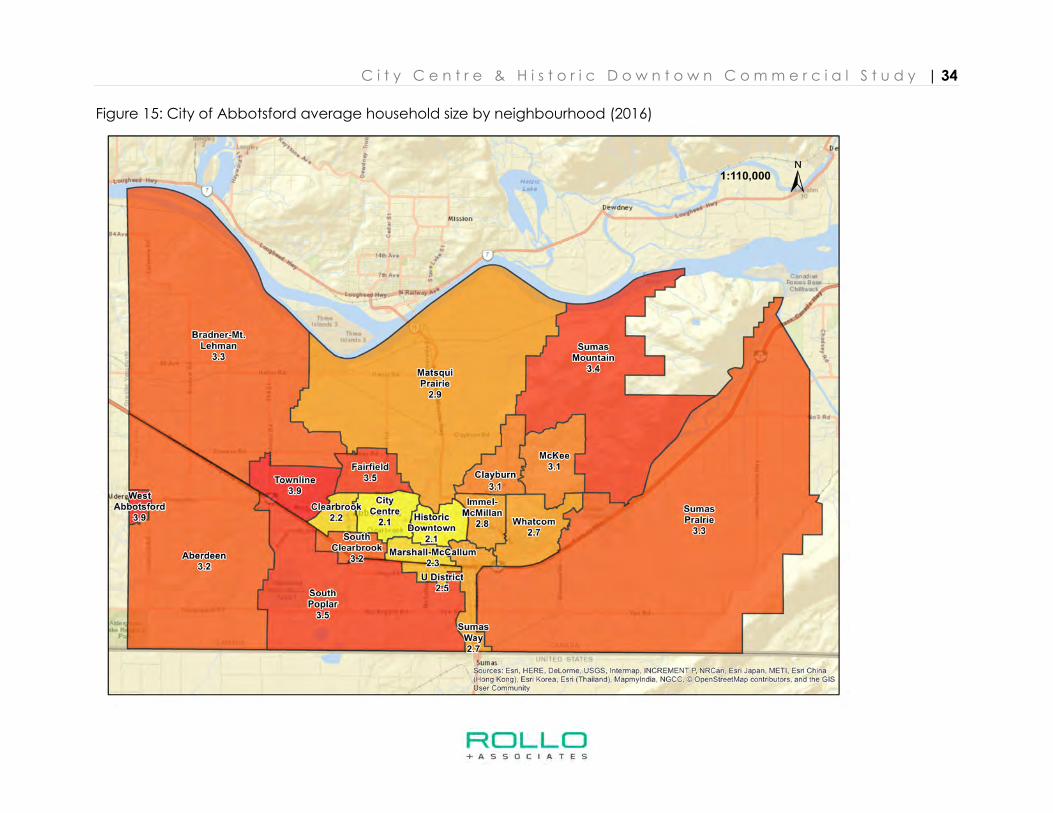
Figure 15 (pg. 34) shows that the average household size across Abbotsford is 2.8.
Central neighbourhoods including Clearbrook, the City Centre neighbourhood, and the
Historic Downtown neighbourhood are home to the smallest average households, while
Townline, Fairfield, and West Abbotsford are home to the largest.
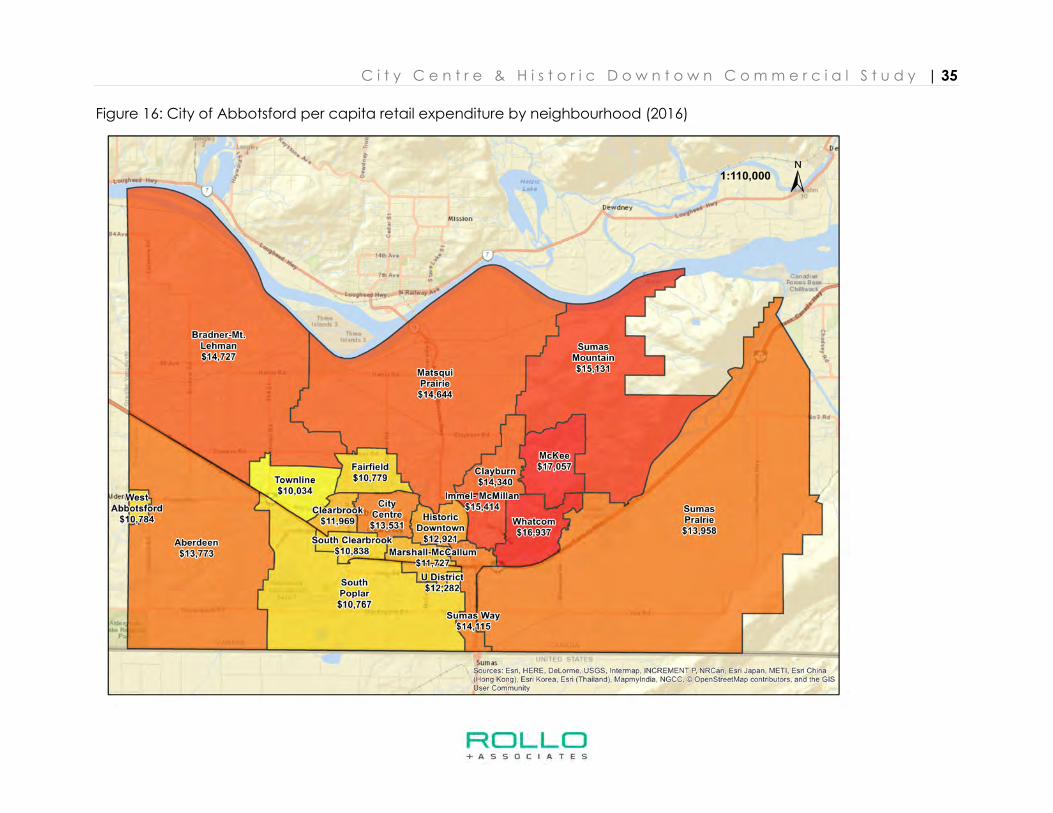
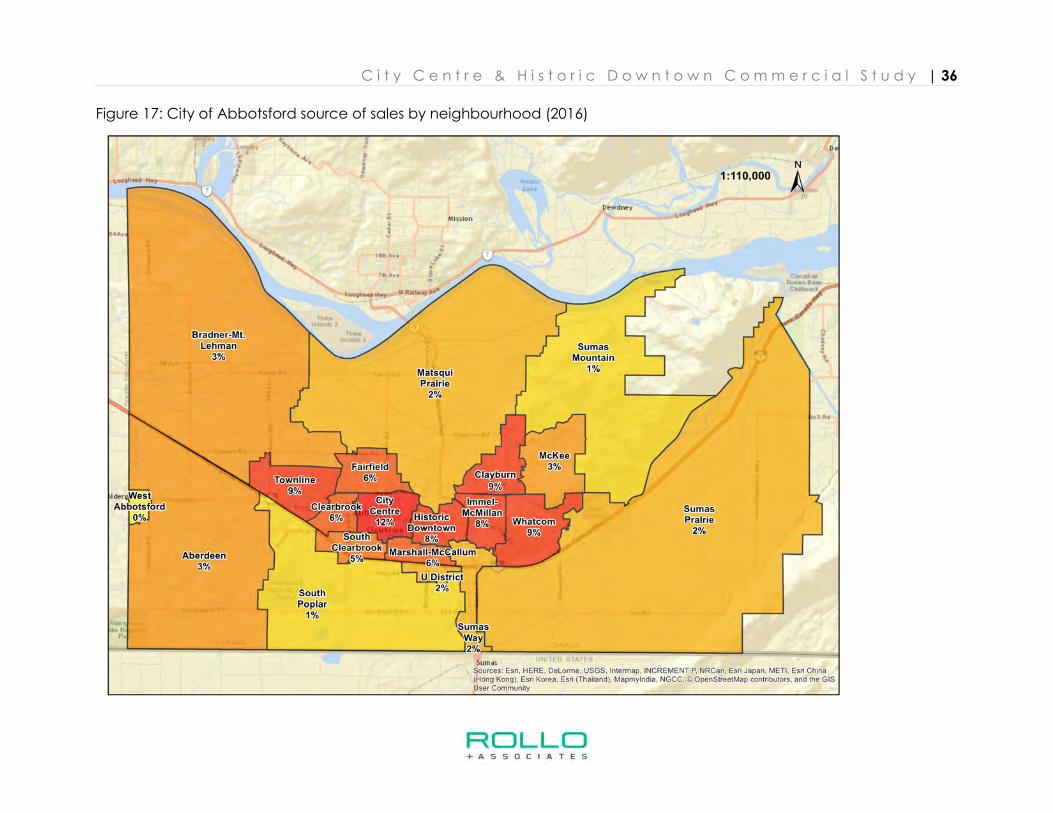
Figures 16 – 17 (pg. 35 – 36) show that there is a notable income divide between east
and west Abbotsford, with neighbourhoods in the east having higher per capita
incomes and subsequently higher per capita retail expenditures, particularly on non-
essential items such as apparel and jewelry. Although these neighbourhoods have high
per capita expenditures, the absolute level of spending within the neighbourhood may
be not be as high or significant as neighbourhoods in the east. For example, residents of
Sumas Mountain demonstrate some of the highest citywide per capita retail spending
$15,000 per annum, but account for only 1% of Abbotsford’s total available spending.
C i t y C e n t r e & H i s t o r i c D o w n t o w n C o m m e r c i a l S t u d y | 29
Figure 10: City of Abbotsford neighbourhoods
C i t y C e n t r e & H i s t o r i c D o w n t o w n C o m m e r c i a l S t u d y | 30
Figure 11: City of Abbotsford population by neighbourhood (2016)
C i t y C e n t r e & H i s t o r i c D o w n t o w n C o m m e r c i a l S t u d y | 31
Figure 12: City of Abbotsford population by neighbourhood (2040)
C i t y C e n t r e & H i s t o r i c D o w n t o w n C o m m e r c i a l S t u d y | 32
Figure 13: City of Abbotsford aggregate growth by neighbourhood (2016 – 2040)
C i t y C e n t r e & H i s t o r i c D o w n t o w n C o m m e r c i a l S t u d y | 33
Figure 14: City of Abbotsford median age by neighbourhood (2016)
C i t y C e n t r e & H i s t o r i c D o w n t o w n C o m m e r c i a l S t u d y | 34
Figure 15: City of Abbotsford average household size by neighbourhood (2016)
C i t y C e n t r e & H i s t o r i c D o w n t o w n C o m m e r c i a l S t u d y | 35
Figure 16: City of Abbotsford per capita retail expenditure by neighbourhood (2016)
C i t y C e n t r e & H i s t o r i c D o w n t o w n C o m m e r c i a l S t u d y | 36
Figure 17: City of Abbotsford source of sales by neighbourhood (2016)
C i t y C e n t r e & H i s t o r i c D o w n t o w n C o m m e r c i a l S t u d y | 37
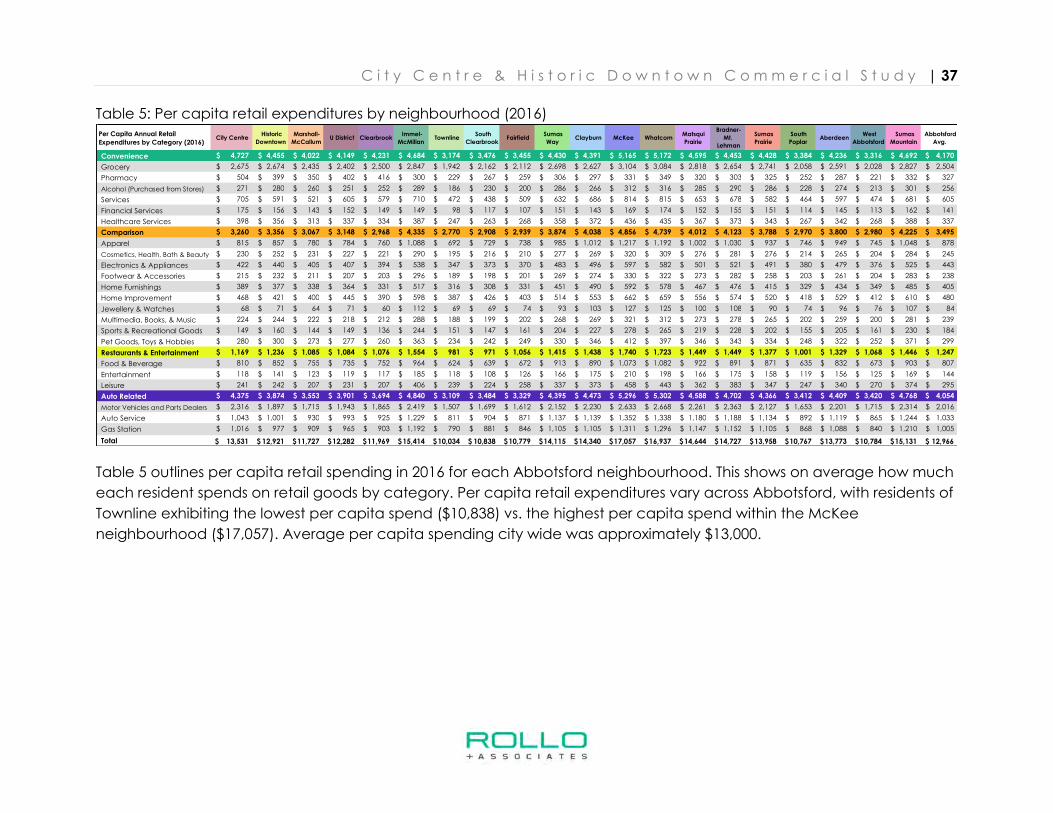
Table 5: Per capita retail expenditures by neighbourhood (2016)
Table 5 outlines per capita retail spending in 2016 for each Abbotsford neighbourhood. This shows on average how much
each resident spends on retail goods by category. Per capita retail expenditures vary across Abbotsford, with residents of
Townline exhibiting the lowest per capita spend ($10,838) vs. the highest per capita spend within the McKee
neighbourhood ($17,057). Average per capita spending city wide was approximately $13,000.
Per Capita Annual Retail
Expenditures by Category (2016) City Centre
Historic
Downtown
Marshall-
McCallum U District Clearbrook
Immel-
McMillan Townline
South
Clearbrook Fairfield
Sumas
Way Clayburn McKee Whatcom
Matsqui
Prairie
Bradner-
Mt.
Lehman
Sumas
Prairie
South
Poplar Aberdeen
West
Abbotsford
Sumas
Mountain
Abbotsford
Avg.
Convenience 4,727$ 4,455$ 4,022$ 4,149$ 4,231$ 4,684$ 3,174$ 3,476$ 3,455$ 4,430$ 4,391$ 5,165$ 5,172$ 4,595$ 4,453$ 4,428$ 3,384$ 4,236$ 3,316$ 4,692$ 4,170$
Grocery 2,675$ 2,674$ 2,435$ 2,402$ 2,500$ 2,847$ 1,942$ 2,162$ 2,112$ 2,698$ 2,627$ 3,104$ 3,084$ 2,818$ 2,654$ 2,741$ 2,058$ 2,591$ 2,028$ 2,827$ 2,504$
Pharmacy 504$ 399$ 350$ 402$ 416$ 300$ 229$ 267$ 259$ 306$ 297$ 331$ 349$ 320$ 303$ 325$ 252$ 287$ 221$ 332$ 327$
Alcohol (Purchased from Stores) 271$ 280$ 260$ 251$ 252$ 289$ 186$ 230$ 200$ 286$ 266$ 312$ 316$ 285$ 290$ 286$ 228$ 274$ 213$ 301$ 256$
Services 705$ 591$ 521$ 605$ 579$ 710$ 472$ 438$ 509$ 632$ 686$ 814$ 815$ 653$ 678$ 582$ 464$ 597$ 474$ 681$ 605$
Financial Services 175$ 156$ 143$ 152$ 149$ 149$ 98$ 117$ 107$ 151$ 143$ 169$ 174$ 152$ 155$ 151$ 114$ 145$ 113$ 162$ 141$
Healthcare Services 398$ 356$ 313$ 337$ 334$ 387$ 247$ 263$ 268$ 358$ 372$ 436$ 435$ 367$ 373$ 343$ 267$ 342$ 268$ 388$ 337$
Comparison 3,260$ 3,356$ 3,067$ 3,148$ 2,968$ 4,335$ 2,770$ 2,908$ 2,939$ 3,874$ 4,038$ 4,856$ 4,739$ 4,012$ 4,123$ 3,788$ 2,970$ 3,800$ 2,980$ 4,225$ 3,495$
Apparel 815$ 857$ 780$ 784$ 760$ 1,088$ 692$ 729$ 738$ 985$ 1,012$ 1,217$ 1,192$ 1,002$ 1,030$ 937$ 746$ 949$ 745$ 1,048$ 878$
Cosmetics, Health, Bath & Beauty 230$ 252$ 231$ 227$ 221$ 290$ 195$ 216$ 210$ 277$ 269$ 320$ 309$ 276$ 281$ 276$ 214$ 265$ 204$ 284$ 245$
Electronics & Appliances 422$ 440$ 405$ 407$ 394$ 538$ 347$ 373$ 370$ 483$ 496$ 597$ 582$ 501$ 521$ 491$ 380$ 479$ 376$ 525$ 443$
Footwear & Accessories 215$ 232$ 211$ 207$ 203$ 296$ 189$ 198$ 201$ 269$ 274$ 330$ 322$ 273$ 282$ 258$ 203$ 261$ 204$ 283$ 238$
Home Furnishings 389$ 377$ 338$ 364$ 331$ 517$ 316$ 308$ 331$ 451$ 490$ 592$ 578$ 467$ 476$ 415$ 329$ 434$ 349$ 485$ 405$
Home Improvement 468$ 421$ 400$ 445$ 390$ 598$ 387$ 426$ 403$ 514$ 553$ 662$ 659$ 556$ 574$ 520$ 418$ 529$ 412$ 610$ 480$
Jewellery & Watches 68$ 71$ 64$ 71$ 60$ 112$ 69$ 69$ 74$ 93$ 103$ 127$ 125$ 100$ 108$ 90$ 74$ 96$ 76$ 107$ 84$
Multimedia, Books, & Music 224$ 244$ 222$ 218$ 212$ 288$ 188$ 199$ 202$ 268$ 269$ 321$ 312$ 273$ 278$ 265$ 202$ 259$ 200$ 281$ 239$
Sports & Recreational Goods 149$ 160$ 144$ 149$ 136$ 244$ 151$ 147$ 161$ 204$ 227$ 278$ 265$ 219$ 228$ 202$ 155$ 205$ 161$ 230$ 184$
Pet Goods, Toys & Hobbies 280$ 300$ 273$ 277$ 260$ 363$ 234$ 242$ 249$ 330$ 346$ 412$ 397$ 346$ 343$ 334$ 248$ 322$ 252$ 371$ 299$
Restaurants & Entertainment 1,169$ 1,236$ 1,085$ 1,084$ 1,076$ 1,554$ 981$ 971$ 1,056$ 1,415$ 1,438$ 1,740$ 1,723$ 1,449$ 1,449$ 1,377$ 1,001$ 1,329$ 1,068$ 1,446$ 1,247$
Food & Beverage 810$ 852$ 755$ 735$ 752$ 964$ 624$ 639$ 672$ 913$ 890$ 1,073$ 1,082$ 922$ 891$ 871$ 635$ 832$ 673$ 903$ 807$
Entertainment 118$ 141$ 123$ 119$ 117$ 185$ 118$ 108$ 126$ 166$ 175$ 210$ 198$ 166$ 175$ 158$ 119$ 156$ 125$ 169$ 144$
Leisure 241$ 242$ 207$ 231$ 207$ 406$ 239$ 224$ 258$ 337$ 373$ 458$ 443$ 362$ 383$ 347$ 247$ 340$ 270$ 374$ 295$
Auto Related 4,375$ 3,874$ 3,553$ 3,901$ 3,694$ 4,840$ 3,109$ 3,484$ 3,329$ 4,395$ 4,473$ 5,296$ 5,302$ 4,588$ 4,702$ 4,366$ 3,412$ 4,409$ 3,420$ 4,768$ 4,054$
Motor Vehicles and Parts Dealers 2,316$ 1,897$ 1,715$ 1,943$ 1,865$ 2,419$ 1,507$ 1,699$ 1,612$ 2,152$ 2,230$ 2,633$ 2,668$ 2,261$ 2,363$ 2,127$ 1,653$ 2,201$ 1,715$ 2,314$ 2,016$
Auto Service 1,043$ 1,001$ 930$ 993$ 925$ 1,229$ 811$ 904$ 871$ 1,137$ 1,139$ 1,352$ 1,338$ 1,180$ 1,188$ 1,134$ 892$ 1,119$ 865$ 1,244$ 1,033$
Gas Station 1,016$ 977$ 909$ 965$ 903$ 1,192$ 790$ 881$ 846$ 1,105$ 1,105$ 1,311$ 1,296$ 1,147$ 1,152$ 1,105$ 868$ 1,088$ 840$ 1,210$ 1,005$
Total 13,531$ 12,921$ 11,727$ 12,282$ 11,969$ 15,414$ 10,034$ 10,838$ 10,779$ 14,115$ 14,340$ 17,057$ 16,937$ 14,644$ 14,727$ 13,958$ 10,767$ 13,773$ 10,784$ 15,131$ 12,966$
C i t y C e n t r e & H i s t o r i c D o w n t o w n C o m m e r c i a l S t u d y | 38
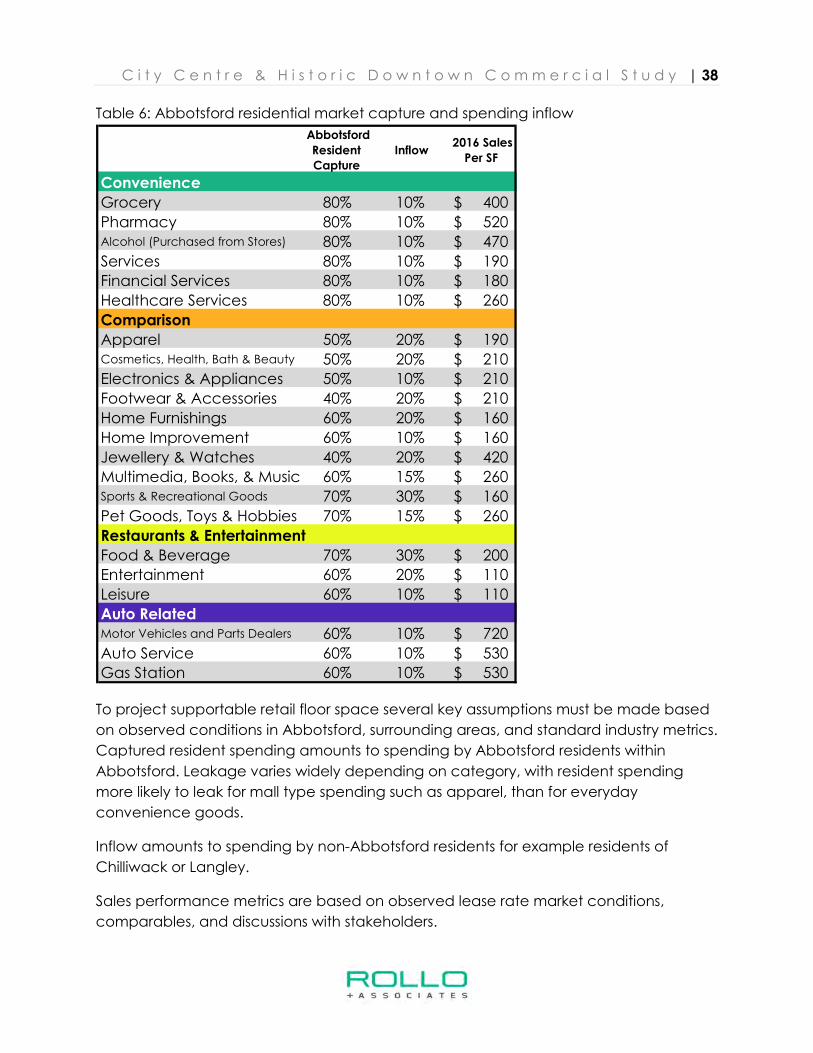
Table 6: Abbotsford residential market capture and spending inflow
To project supportable retail floor space several key assumptions must be made based
on observed conditions in Abbotsford, surrounding areas, and standard industry metrics.
Captured resident spending amounts to spending by Abbotsford residents within
Abbotsford. Leakage varies widely depending on category, with resident spending
more likely to leak for mall type spending such as apparel, than for everyday
convenience goods.
Inflow amounts to spending by non-Abbotsford residents for example residents of
Chilliwack or Langley.
Sales performance metrics are based on observed lease rate market conditions,
comparables, and discussions with stakeholders.
Abbotsford
Resident
Capture
Inflow 2016 Sales
Per SF
Convenience
Grocery 80% 10% 400$
Pharmacy 80% 10% 520$ Alcohol (Purchased from Stores) 80% 10% 470$
Services 80% 10% 190$
Financial Services 80% 10% 180$
Healthcare Services 80% 10% 260$
Comparison
Apparel 50% 20% 190$ Cosmetics, Health, Bath & Beauty 50% 20% 210$
Electronics & Appliances 50% 10% 210$
Footwear & Accessories 40% 20% 210$
Home Furnishings 60% 20% 160$
Home Improvement 60% 10% 160$
Jewellery & Watches 40% 20% 420$
Multimedia, Books, & Music 60% 15% 260$ Sports & Recreational Goods 70% 30% 160$
Pet Goods, Toys & Hobbies 70% 15% 260$
Restaurants & Entertainment
Food & Beverage 70% 30% 200$
Entertainment 60% 20% 110$
Leisure 60% 10% 110$
Auto RelatedMotor Vehicles and Parts Dealers 60% 10% 720$
Auto Service 60% 10% 530$
Gas Station 60% 10% 530$
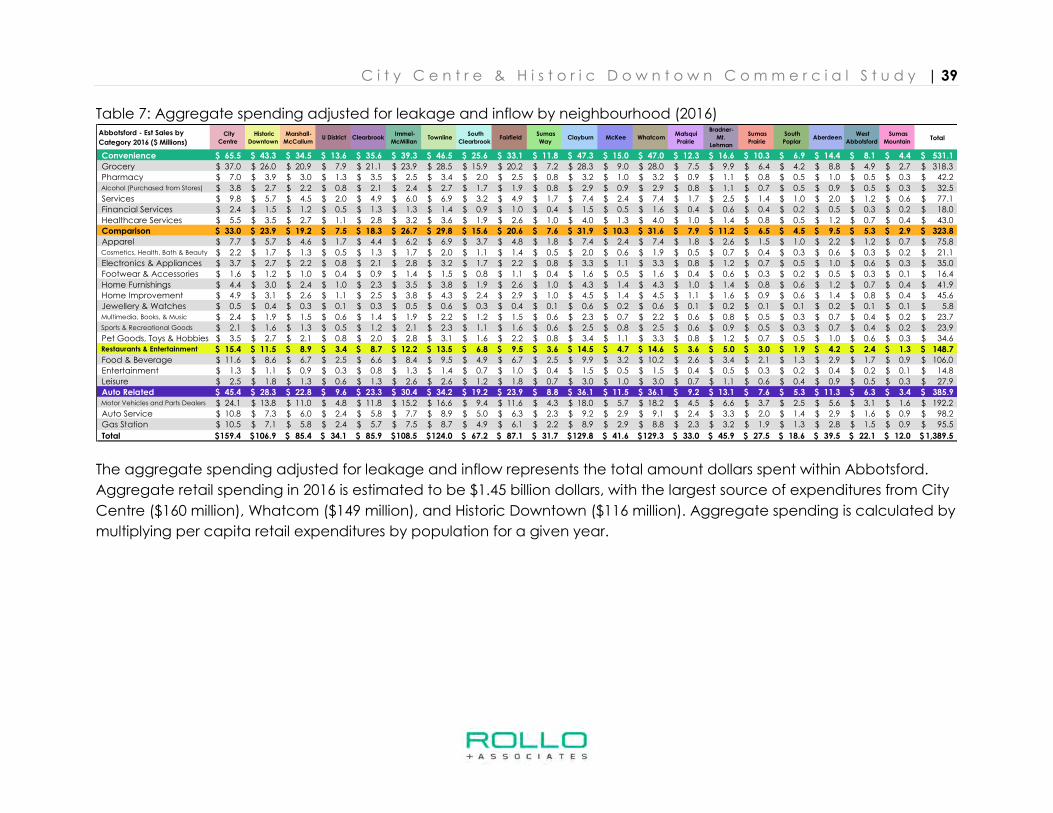
C i t y C e n t r e & H i s t o r i c D o w n t o w n C o m m e r c i a l S t u d y | 39
Table 7: Aggregate spending adjusted for leakage and inflow by neighbourhood (2016)
The aggregate spending adjusted for leakage and inflow represents the total amount dollars spent within Abbotsford.
Aggregate retail spending in 2016 is estimated to be $1.45 billion dollars, with the largest source of expenditures from City
Centre ($160 million), Whatcom ($149 million), and Historic Downtown ($116 million). Aggregate spending is calculated by
multiplying per capita retail expenditures by population for a given year.
Abbotsford - Est Sales by
Category 2016 ($ Millions)
City
Centre
Historic
Downtown
Marshall-
McCallum U District Clearbrook
Immel-
McMillan Townline
South
Clearbrook Fairfield
Sumas
Way Clayburn McKee Whatcom
Matsqui
Prairie
Bradner-
Mt.
Lehman
Sumas
Prairie
South
Poplar Aberdeen
West
Abbotsford
Sumas
Mountain Total
Convenience 65.5$ 43.3$ 34.5$ 13.6$ 35.6$ 39.3$ 46.5$ 25.6$ 33.1$ 11.8$ 47.3$ 15.0$ 47.0$ 12.3$ 16.6$ 10.3$ 6.9$ 14.4$ 8.1$ 4.4$ 531.1$
Grocery 37.0$ 26.0$ 20.9$ 7.9$ 21.1$ 23.9$ 28.5$ 15.9$ 20.2$ 7.2$ 28.3$ 9.0$ 28.0$ 7.5$ 9.9$ 6.4$ 4.2$ 8.8$ 4.9$ 2.7$ 318.3$
Pharmacy 7.0$ 3.9$ 3.0$ 1.3$ 3.5$ 2.5$ 3.4$ 2.0$ 2.5$ 0.8$ 3.2$ 1.0$ 3.2$ 0.9$ 1.1$ 0.8$ 0.5$ 1.0$ 0.5$ 0.3$ 42.2$ Alcohol (Purchased from Stores) 3.8$ 2.7$ 2.2$ 0.8$ 2.1$ 2.4$ 2.7$ 1.7$ 1.9$ 0.8$ 2.9$ 0.9$ 2.9$ 0.8$ 1.1$ 0.7$ 0.5$ 0.9$ 0.5$ 0.3$ 32.5$
Services 9.8$ 5.7$ 4.5$ 2.0$ 4.9$ 6.0$ 6.9$ 3.2$ 4.9$ 1.7$ 7.4$ 2.4$ 7.4$ 1.7$ 2.5$ 1.4$ 1.0$ 2.0$ 1.2$ 0.6$ 77.1$
Financial Services 2.4$ 1.5$ 1.2$ 0.5$ 1.3$ 1.3$ 1.4$ 0.9$ 1.0$ 0.4$ 1.5$ 0.5$ 1.6$ 0.4$ 0.6$ 0.4$ 0.2$ 0.5$ 0.3$ 0.2$ 18.0$
Healthcare Services 5.5$ 3.5$ 2.7$ 1.1$ 2.8$ 3.2$ 3.6$ 1.9$ 2.6$ 1.0$ 4.0$ 1.3$ 4.0$ 1.0$ 1.4$ 0.8$ 0.5$ 1.2$ 0.7$ 0.4$ 43.0$
Comparison 33.0$ 23.9$ 19.2$ 7.5$ 18.3$ 26.7$ 29.8$ 15.6$ 20.6$ 7.6$ 31.9$ 10.3$ 31.6$ 7.9$ 11.2$ 6.5$ 4.5$ 9.5$ 5.3$ 2.9$ 323.8$
Apparel 7.7$ 5.7$ 4.6$ 1.7$ 4.4$ 6.2$ 6.9$ 3.7$ 4.8$ 1.8$ 7.4$ 2.4$ 7.4$ 1.8$ 2.6$ 1.5$ 1.0$ 2.2$ 1.2$ 0.7$ 75.8$ Cosmetics, Health, Bath & Beauty 2.2$ 1.7$ 1.3$ 0.5$ 1.3$ 1.7$ 2.0$ 1.1$ 1.4$ 0.5$ 2.0$ 0.6$ 1.9$ 0.5$ 0.7$ 0.4$ 0.3$ 0.6$ 0.3$ 0.2$ 21.1$
Electronics & Appliances 3.7$ 2.7$ 2.2$ 0.8$ 2.1$ 2.8$ 3.2$ 1.7$ 2.2$ 0.8$ 3.3$ 1.1$ 3.3$ 0.8$ 1.2$ 0.7$ 0.5$ 1.0$ 0.6$ 0.3$ 35.0$
Footwear & Accessories 1.6$ 1.2$ 1.0$ 0.4$ 0.9$ 1.4$ 1.5$ 0.8$ 1.1$ 0.4$ 1.6$ 0.5$ 1.6$ 0.4$ 0.6$ 0.3$ 0.2$ 0.5$ 0.3$ 0.1$ 16.4$
Home Furnishings 4.4$ 3.0$ 2.4$ 1.0$ 2.3$ 3.5$ 3.8$ 1.9$ 2.6$ 1.0$ 4.3$ 1.4$ 4.3$ 1.0$ 1.4$ 0.8$ 0.6$ 1.2$ 0.7$ 0.4$ 41.9$
Home Improvement 4.9$ 3.1$ 2.6$ 1.1$ 2.5$ 3.8$ 4.3$ 2.4$ 2.9$ 1.0$ 4.5$ 1.4$ 4.5$ 1.1$ 1.6$ 0.9$ 0.6$ 1.4$ 0.8$ 0.4$ 45.6$
Jewellery & Watches 0.5$ 0.4$ 0.3$ 0.1$ 0.3$ 0.5$ 0.6$ 0.3$ 0.4$ 0.1$ 0.6$ 0.2$ 0.6$ 0.1$ 0.2$ 0.1$ 0.1$ 0.2$ 0.1$ 0.1$ 5.8$ Multimedia, Books, & Music 2.4$ 1.9$ 1.5$ 0.6$ 1.4$ 1.9$ 2.2$ 1.2$ 1.5$ 0.6$ 2.3$ 0.7$ 2.2$ 0.6$ 0.8$ 0.5$ 0.3$ 0.7$ 0.4$ 0.2$ 23.7$ Sports & Recreational Goods 2.1$ 1.6$ 1.3$ 0.5$ 1.2$ 2.1$ 2.3$ 1.1$ 1.6$ 0.6$ 2.5$ 0.8$ 2.5$ 0.6$ 0.9$ 0.5$ 0.3$ 0.7$ 0.4$ 0.2$ 23.9$
Pet Goods, Toys & Hobbies 3.5$ 2.7$ 2.1$ 0.8$ 2.0$ 2.8$ 3.1$ 1.6$ 2.2$ 0.8$ 3.4$ 1.1$ 3.3$ 0.8$ 1.2$ 0.7$ 0.5$ 1.0$ 0.6$ 0.3$ 34.6$ Restaurants & Entertainment 15.4$ 11.5$ 8.9$ 3.4$ 8.7$ 12.2$ 13.5$ 6.8$ 9.5$ 3.6$ 14.5$ 4.7$ 14.6$ 3.6$ 5.0$ 3.0$ 1.9$ 4.2$ 2.4$ 1.3$ 148.7$
Food & Beverage 11.6$ 8.6$ 6.7$ 2.5$ 6.6$ 8.4$ 9.5$ 4.9$ 6.7$ 2.5$ 9.9$ 3.2$ 10.2$ 2.6$ 3.4$ 2.1$ 1.3$ 2.9$ 1.7$ 0.9$ 106.0$
Entertainment 1.3$ 1.1$ 0.9$ 0.3$ 0.8$ 1.3$ 1.4$ 0.7$ 1.0$ 0.4$ 1.5$ 0.5$ 1.5$ 0.4$ 0.5$ 0.3$ 0.2$ 0.4$ 0.2$ 0.1$ 14.8$
Leisure 2.5$ 1.8$ 1.3$ 0.6$ 1.3$ 2.6$ 2.6$ 1.2$ 1.8$ 0.7$ 3.0$ 1.0$ 3.0$ 0.7$ 1.1$ 0.6$ 0.4$ 0.9$ 0.5$ 0.3$ 27.9$
Auto Related 45.4$ 28.3$ 22.8$ 9.6$ 23.3$ 30.4$ 34.2$ 19.2$ 23.9$ 8.8$ 36.1$ 11.5$ 36.1$ 9.2$ 13.1$ 7.6$ 5.3$ 11.3$ 6.3$ 3.4$ 385.9$ Motor Vehicles and Parts Dealers 24.1$ 13.8$ 11.0$ 4.8$ 11.8$ 15.2$ 16.6$ 9.4$ 11.6$ 4.3$ 18.0$ 5.7$ 18.2$ 4.5$ 6.6$ 3.7$ 2.5$ 5.6$ 3.1$ 1.6$ 192.2$
Auto Service 10.8$ 7.3$ 6.0$ 2.4$ 5.8$ 7.7$ 8.9$ 5.0$ 6.3$ 2.3$ 9.2$ 2.9$ 9.1$ 2.4$ 3.3$ 2.0$ 1.4$ 2.9$ 1.6$ 0.9$ 98.2$
Gas Station 10.5$ 7.1$ 5.8$ 2.4$ 5.7$ 7.5$ 8.7$ 4.9$ 6.1$ 2.2$ 8.9$ 2.9$ 8.8$ 2.3$ 3.2$ 1.9$ 1.3$ 2.8$ 1.5$ 0.9$ 95.5$
Total 159.4$ 106.9$ 85.4$ 34.1$ 85.9$ 108.5$ 124.0$ 67.2$ 87.1$ 31.7$ 129.8$ 41.6$ 129.3$ 33.0$ 45.9$ 27.5$ 18.6$ 39.5$ 22.1$ 12.0$ 1,389.5$
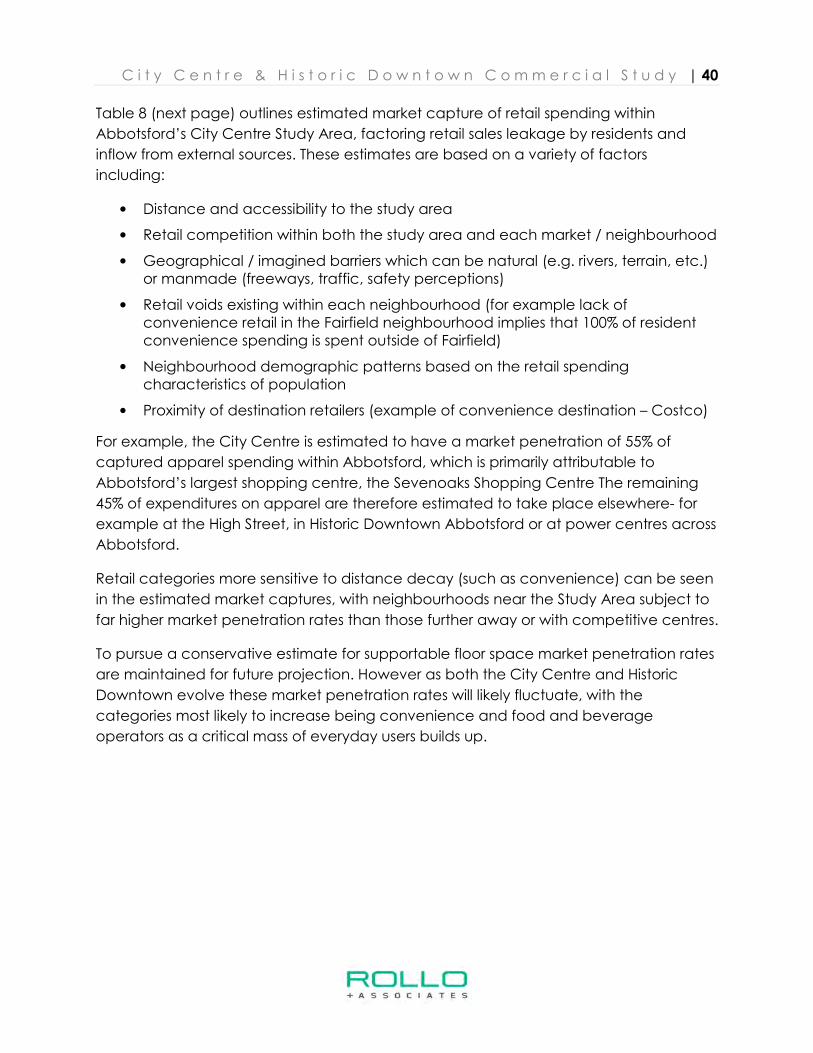
C i t y C e n t r e & H i s t o r i c D o w n t o w n C o m m e r c i a l S t u d y | 40
Table 8 (next page) outlines estimated market capture of retail spending within
Abbotsford’s City Centre Study Area, factoring retail sales leakage by residents and
inflow from external sources. These estimates are based on a variety of factors
including:
• Distance and accessibility to the study area
• Retail competition within both the study area and each market / neighbourhood
• Geographical / imagined barriers which can be natural (e.g. rivers, terrain, etc.) or manmade (freeways, traffic, safety perceptions)
• Retail voids existing within each neighbourhood (for example lack of convenience retail in the Fairfield neighbourhood implies that 100% of resident convenience spending is spent outside of Fairfield)
• Neighbourhood demographic patterns based on the retail spending characteristics of population
• Proximity of destination retailers (example of convenience destination – Costco)
For example, the City Centre is estimated to have a market penetration of 55% of
captured apparel spending within Abbotsford, which is primarily attributable to
Abbotsford’s largest shopping centre, the Sevenoaks Shopping Centre The remaining
45% of expenditures on apparel are therefore estimated to take place elsewhere- for
example at the High Street, in Historic Downtown Abbotsford or at power centres across
Abbotsford.
Retail categories more sensitive to distance decay (such as convenience) can be seen
in the estimated market captures, with neighbourhoods near the Study Area subject to
far higher market penetration rates than those further away or with competitive centres.
To pursue a conservative estimate for supportable floor space market penetration rates
are maintained for future projection. However as both the City Centre and Historic
Downtown evolve these market penetration rates will likely fluctuate, with the
categories most likely to increase being convenience and food and beverage
operators as a critical mass of everyday users builds up.
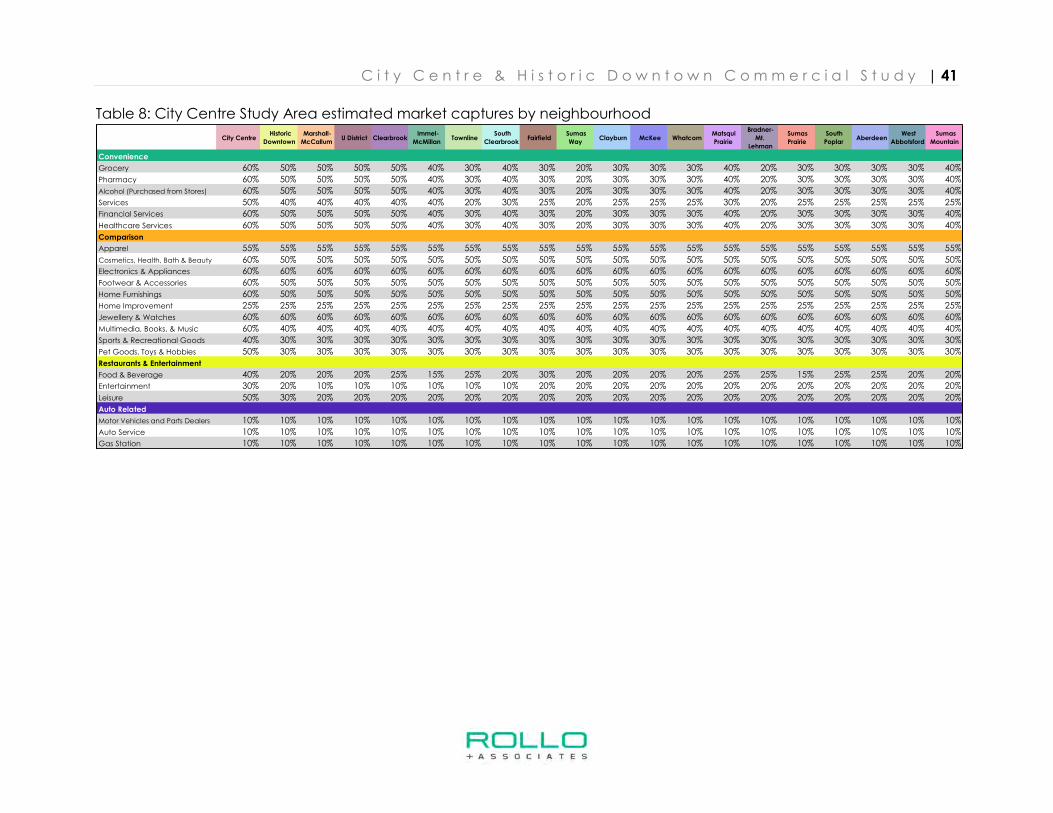
C i t y C e n t r e & H i s t o r i c D o w n t o w n C o m m e r c i a l S t u d y | 41
Table 8: City Centre Study Area estimated market captures by neighbourhood
City Centre Historic
Downtown
Marshall-
McCallum U District Clearbrook
Immel-
McMillan Townline
South
Clearbrook Fairfield
Sumas
Way Clayburn McKee Whatcom
Matsqui
Prairie
Bradner-
Mt.
Lehman
Sumas
Prairie
South
Poplar Aberdeen
West
Abbotsford
Sumas
Mountain
Convenience
Grocery 60% 50% 50% 50% 50% 40% 30% 40% 30% 20% 30% 30% 30% 40% 20% 30% 30% 30% 30% 40%
Pharmacy 60% 50% 50% 50% 50% 40% 30% 40% 30% 20% 30% 30% 30% 40% 20% 30% 30% 30% 30% 40%
Alcohol (Purchased from Stores) 60% 50% 50% 50% 50% 40% 30% 40% 30% 20% 30% 30% 30% 40% 20% 30% 30% 30% 30% 40%
Services 50% 40% 40% 40% 40% 40% 20% 30% 25% 20% 25% 25% 25% 30% 20% 25% 25% 25% 25% 25%
Financial Services 60% 50% 50% 50% 50% 40% 30% 40% 30% 20% 30% 30% 30% 40% 20% 30% 30% 30% 30% 40%
Healthcare Services 60% 50% 50% 50% 50% 40% 30% 40% 30% 20% 30% 30% 30% 40% 20% 30% 30% 30% 30% 40%
Comparison
Apparel 55% 55% 55% 55% 55% 55% 55% 55% 55% 55% 55% 55% 55% 55% 55% 55% 55% 55% 55% 55%
Cosmetics, Health, Bath & Beauty 60% 50% 50% 50% 50% 50% 50% 50% 50% 50% 50% 50% 50% 50% 50% 50% 50% 50% 50% 50%
Electronics & Appliances 60% 60% 60% 60% 60% 60% 60% 60% 60% 60% 60% 60% 60% 60% 60% 60% 60% 60% 60% 60%
Footwear & Accessories 60% 50% 50% 50% 50% 50% 50% 50% 50% 50% 50% 50% 50% 50% 50% 50% 50% 50% 50% 50%
Home Furnishings 60% 50% 50% 50% 50% 50% 50% 50% 50% 50% 50% 50% 50% 50% 50% 50% 50% 50% 50% 50%
Home Improvement 25% 25% 25% 25% 25% 25% 25% 25% 25% 25% 25% 25% 25% 25% 25% 25% 25% 25% 25% 25%
Jewellery & Watches 60% 60% 60% 60% 60% 60% 60% 60% 60% 60% 60% 60% 60% 60% 60% 60% 60% 60% 60% 60%
Multimedia, Books, & Music 60% 40% 40% 40% 40% 40% 40% 40% 40% 40% 40% 40% 40% 40% 40% 40% 40% 40% 40% 40%
Sports & Recreational Goods 40% 30% 30% 30% 30% 30% 30% 30% 30% 30% 30% 30% 30% 30% 30% 30% 30% 30% 30% 30%
Pet Goods, Toys & Hobbies 50% 30% 30% 30% 30% 30% 30% 30% 30% 30% 30% 30% 30% 30% 30% 30% 30% 30% 30% 30%
Restaurants & Entertainment
Food & Beverage 40% 20% 20% 20% 25% 15% 25% 20% 30% 20% 20% 20% 20% 25% 25% 15% 25% 25% 20% 20%
Entertainment 30% 20% 10% 10% 10% 10% 10% 10% 20% 20% 20% 20% 20% 20% 20% 20% 20% 20% 20% 20%
Leisure 50% 30% 20% 20% 20% 20% 20% 20% 20% 20% 20% 20% 20% 20% 20% 20% 20% 20% 20% 20%
Auto Related
Motor Vehicles and Parts Dealers 10% 10% 10% 10% 10% 10% 10% 10% 10% 10% 10% 10% 10% 10% 10% 10% 10% 10% 10% 10%
Auto Service 10% 10% 10% 10% 10% 10% 10% 10% 10% 10% 10% 10% 10% 10% 10% 10% 10% 10% 10% 10%
Gas Station 10% 10% 10% 10% 10% 10% 10% 10% 10% 10% 10% 10% 10% 10% 10% 10% 10% 10% 10% 10%
C i t y C e n t r e & H i s t o r i c D o w n t o w n C o m m e r c i a l S t u d y | 42
Table 9: City Centre Study Area estimated retail sales by neighbourhood (2016)
Table 9 estimates current retail sales within the City Centre Study Area by neighbourhood and retail category. These
figures are obtained by applying market capture percentages to aggregate retail sales. Retail sales are estimated at
$424 million, of which $204 million attributable to convenience retail (e.g. at grocers such as Safeway, the Real Canadian
Superstore, Independent Grocer, Save on Foods). Comparison retail such as clothing, electronics, and home furnishings
are estimated to achieve sales of $147 million.
The City Centre neighbourhood is the largest source of sales ($66 million) within the Study Area, followed by the Historic
Downtown neighbourhood ($37 million), and Clayburn ($36 million).
City Centre - Est Sales by
Category 2016 ($ Millions)
City
Centre
Historic
Downtown
Rest of
Abbotsford Total
Convenience 38.3$ 21.1$ 145.0$ 204.3$
Grocery 22.2$ 13.0$ 89.8$ 125.0$
Pharmacy 4.2$ 1.9$ 11.3$ 17.5$ Alcohol (Purchased from Stores) 2.3$ 1.4$ 9.2$ 12.8$
Services 4.9$ 2.3$ 17.7$ 24.9$
Financial Services 1.5$ 0.8$ 5.0$ 7.2$
Healthcare Services 3.3$ 1.7$ 12.0$ 17.0$
Comparison 17.0$ 10.7$ 118.9$ 146.5$
Apparel 4.2$ 3.1$ 34.3$ 41.7$ Cosmetics, Health, Bath & Beauty 1.3$ 0.8$ 8.6$ 10.8$
Electronics & Appliances 2.2$ 1.6$ 17.2$ 21.0$
Footwear & Accessories 1.0$ 0.6$ 6.8$ 8.4$
Home Furnishings 2.6$ 1.5$ 17.3$ 21.4$
Home Improvement 1.2$ 0.8$ 9.4$ 11.4$
Jewellery & Watches 0.3$ 0.2$ 2.9$ 3.5$ Multimedia, Books, & Music 1.5$ 0.7$ 7.8$ 10.0$ Sports & Recreational Goods 0.9$ 0.5$ 6.0$ 7.4$
Pet Goods, Toys & Hobbies 1.8$ 0.8$ 8.5$ 11.1$ Restaurants & Entertainment 6.3$ 2.5$ 25.3$ 34.0$
Food & Beverage 4.6$ 1.7$ 18.6$ 25.0$
Entertainment 0.4$ 0.2$ 1.9$ 2.6$
Leisure 1.3$ 0.5$ 4.7$ 6.5$
Auto Related 4.5$ 2.8$ 31.2$ 38.6$ Motor Vehicles and Parts Dealers 2.4$ 1.4$ 15.4$ 19.2$
Auto Service 1.1$ 0.7$ 8.0$ 9.8$
Gas Station 1.1$ 0.7$ 7.8$ 9.5$
Total 66.1$ 37.1$ 320.3$ 423.5$
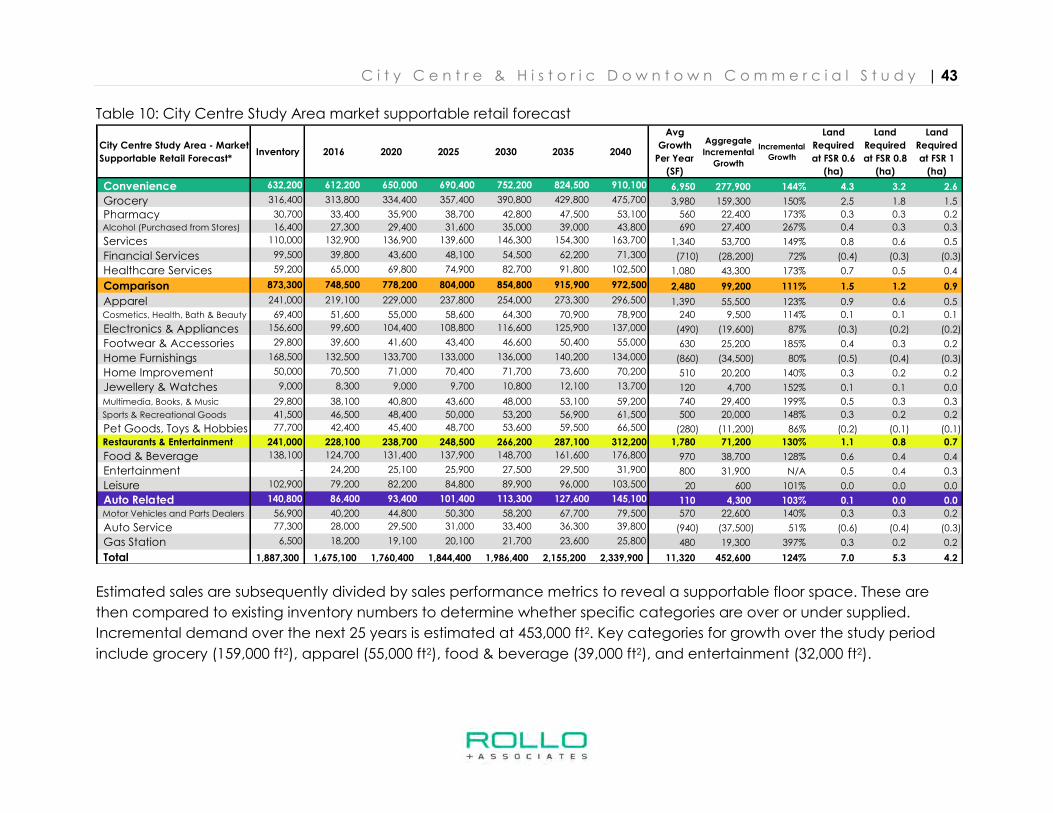
C i t y C e n t r e & H i s t o r i c D o w n t o w n C o m m e r c i a l S t u d y | 43
Table 10: City Centre Study Area market supportable retail forecast
Estimated sales are subsequently divided by sales performance metrics to reveal a supportable floor space. These are
then compared to existing inventory numbers to determine whether specific categories are over or under supplied.
Incremental demand over the next 25 years is estimated at 453,000 ft2. Key categories for growth over the study period
include grocery (159,000 ft2), apparel (55,000 ft2), food & beverage (39,000 ft2), and entertainment (32,000 ft2).
City Centre Study Area - Market
Supportable Retail Forecast*Inventory 2016 2020 2025 2030 2035 2040
Avg
Growth
Per Year
(SF)
Aggregate
Incremental
Growth
Incremental
Growth
Land
Required
at FSR 0.6
(ha)
Land
Required
at FSR 0.8
(ha)
Land
Required
at FSR 1
(ha)
Convenience 632,200 612,200 650,000 690,400 752,200 824,500 910,100 6,950 277,900 144% 4.3 3.2 2.6
Grocery 316,400 313,800 334,400 357,400 390,800 429,800 475,700 3,980 159,300 150% 2.5 1.8 1.5
Pharmacy 30,700 33,400 35,900 38,700 42,800 47,500 53,100 560 22,400 173% 0.3 0.3 0.2
Alcohol (Purchased from Stores) 16,400 27,300 29,400 31,600 35,000 39,000 43,800 690 27,400 267% 0.4 0.3 0.3
Services 110,000 132,900 136,900 139,600 146,300 154,300 163,700 1,340 53,700 149% 0.8 0.6 0.5
Financial Services 99,500 39,800 43,600 48,100 54,500 62,200 71,300 (710) (28,200) 72% (0.4) (0.3) (0.3)
Healthcare Services 59,200 65,000 69,800 74,900 82,700 91,800 102,500 1,080 43,300 173% 0.7 0.5 0.4
Comparison 873,300 748,500 778,200 804,000 854,800 915,900 972,500 2,480 99,200 111% 1.5 1.2 0.9
Apparel 241,000 219,100 229,000 237,800 254,000 273,300 296,500 1,390 55,500 123% 0.9 0.6 0.5
Cosmetics, Health, Bath & Beauty 69,400 51,600 55,000 58,600 64,300 70,900 78,900 240 9,500 114% 0.1 0.1 0.1
Electronics & Appliances 156,600 99,600 104,400 108,800 116,600 125,900 137,000 (490) (19,600) 87% (0.3) (0.2) (0.2)
Footwear & Accessories 29,800 39,600 41,600 43,400 46,600 50,400 55,000 630 25,200 185% 0.4 0.3 0.2
Home Furnishings 168,500 132,500 133,700 133,000 136,000 140,200 134,000 (860) (34,500) 80% (0.5) (0.4) (0.3)
Home Improvement 50,000 70,500 71,000 70,400 71,700 73,600 70,200 510 20,200 140% 0.3 0.2 0.2
Jewellery & Watches 9,000 8,300 9,000 9,700 10,800 12,100 13,700 120 4,700 152% 0.1 0.1 0.0
Multimedia, Books, & Music 29,800 38,100 40,800 43,600 48,000 53,100 59,200 740 29,400 199% 0.5 0.3 0.3
Sports & Recreational Goods 41,500 46,500 48,400 50,000 53,200 56,900 61,500 500 20,000 148% 0.3 0.2 0.2
Pet Goods, Toys & Hobbies 77,700 42,400 45,400 48,700 53,600 59,500 66,500 (280) (11,200) 86% (0.2) (0.1) (0.1)
Restaurants & Entertainment 241,000 228,100 238,700 248,500 266,200 287,100 312,200 1,780 71,200 130% 1.1 0.8 0.7
Food & Beverage 138,100 124,700 131,400 137,900 148,700 161,600 176,800 970 38,700 128% 0.6 0.4 0.4
Entertainment - 24,200 25,100 25,900 27,500 29,500 31,900 800 31,900 N/A 0.5 0.4 0.3
Leisure 102,900 79,200 82,200 84,800 89,900 96,000 103,500 20 600 101% 0.0 0.0 0.0
Auto Related 140,800 86,400 93,400 101,400 113,300 127,600 145,100 110 4,300 103% 0.1 0.0 0.0
Motor Vehicles and Parts Dealers 56,900 40,200 44,800 50,300 58,200 67,700 79,500 570 22,600 140% 0.3 0.3 0.2
Auto Service 77,300 28,000 29,500 31,000 33,400 36,300 39,800 (940) (37,500) 51% (0.6) (0.4) (0.3)
Gas Station 6,500 18,200 19,100 20,100 21,700 23,600 25,800 480 19,300 397% 0.3 0.2 0.2
Total 1,887,300 1,675,100 1,760,400 1,844,400 1,986,400 2,155,200 2,339,900 11,320 452,600 124% 7.0 5.3 4.2
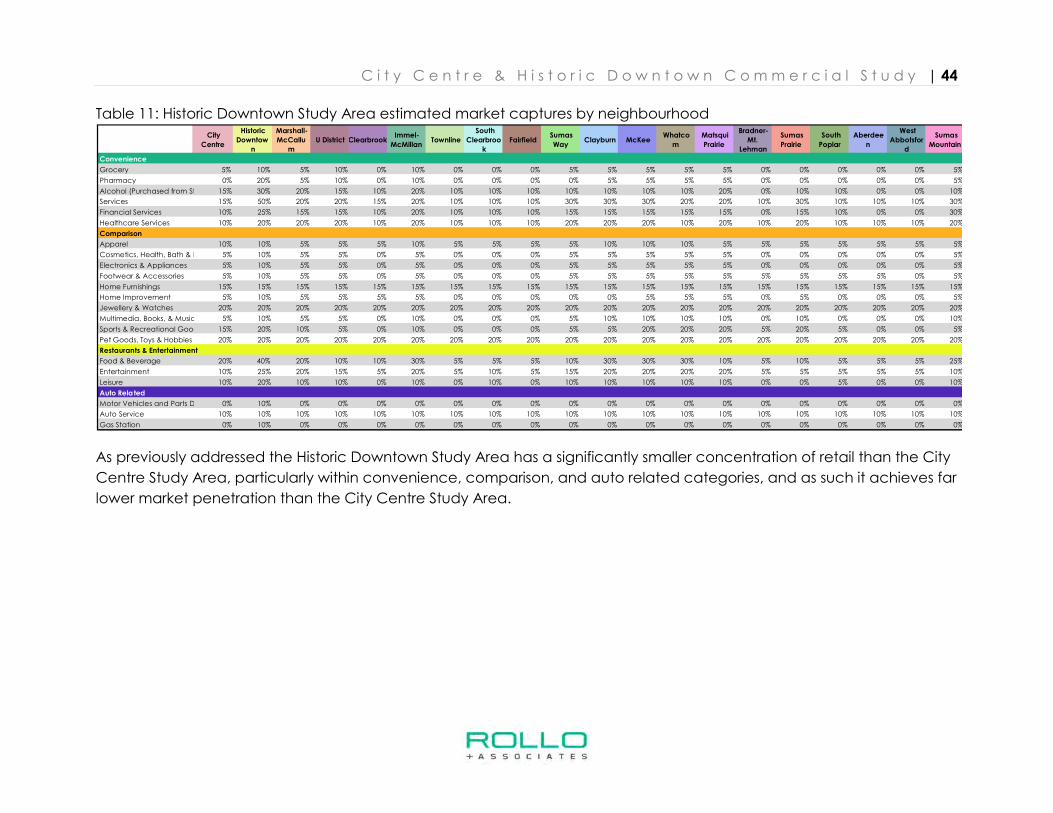
C i t y C e n t r e & H i s t o r i c D o w n t o w n C o m m e r c i a l S t u d y | 44
Table 11: Historic Downtown Study Area estimated market captures by neighbourhood
As previously addressed the Historic Downtown Study Area has a significantly smaller concentration of retail than the City
Centre Study Area, particularly within convenience, comparison, and auto related categories, and as such it achieves far
lower market penetration than the City Centre Study Area.
City
Centre
Historic
Downtow
n
Marshall-
McCallu
m
U District Clearbrook Immel-
McMillan Townline
South
Clearbroo
k
Fairfield Sumas
Way Clayburn McKee
Whatco
m
Matsqui
Prairie
Bradner-
Mt.
Lehman
Sumas
Prairie
South
Poplar
Aberdee
n
West
Abbotsfor
d
Sumas
Mountain
Convenience
Grocery 5% 10% 5% 10% 0% 10% 0% 0% 0% 5% 5% 5% 5% 5% 0% 0% 0% 0% 0% 5%
Pharmacy 0% 20% 5% 10% 0% 10% 0% 0% 0% 0% 5% 5% 5% 5% 0% 0% 0% 0% 0% 5%
Alcohol (Purchased from St 15% 30% 20% 15% 10% 20% 10% 10% 10% 10% 10% 10% 10% 20% 0% 10% 10% 0% 0% 10%
Services 15% 50% 20% 20% 15% 20% 10% 10% 10% 30% 30% 30% 20% 20% 10% 30% 10% 10% 10% 30%
Financial Services 10% 25% 15% 15% 10% 20% 10% 10% 10% 15% 15% 15% 15% 15% 0% 15% 10% 0% 0% 30%
Healthcare Services 10% 20% 20% 20% 10% 20% 10% 10% 10% 20% 20% 20% 10% 20% 10% 20% 10% 10% 10% 20%
Comparison
Apparel 10% 10% 5% 5% 5% 10% 5% 5% 5% 5% 10% 10% 10% 5% 5% 5% 5% 5% 5% 5%
Cosmetics, Health, Bath & B 5% 10% 5% 5% 0% 5% 0% 0% 0% 5% 5% 5% 5% 5% 0% 0% 0% 0% 0% 5%
Electronics & Appliances 5% 10% 5% 5% 0% 5% 0% 0% 0% 5% 5% 5% 5% 5% 0% 0% 0% 0% 0% 5%
Footwear & Accessories 5% 10% 5% 5% 0% 5% 0% 0% 0% 5% 5% 5% 5% 5% 5% 5% 5% 5% 0% 5%
Home Furnishings 15% 15% 15% 15% 15% 15% 15% 15% 15% 15% 15% 15% 15% 15% 15% 15% 15% 15% 15% 15%
Home Improvement 5% 10% 5% 5% 5% 5% 0% 0% 0% 0% 0% 5% 5% 5% 0% 5% 0% 0% 0% 5%
Jewellery & Watches 20% 20% 20% 20% 20% 20% 20% 20% 20% 20% 20% 20% 20% 20% 20% 20% 20% 20% 20% 20%
Multimedia, Books, & Music 5% 10% 5% 5% 0% 10% 0% 0% 0% 5% 10% 10% 10% 10% 0% 10% 0% 0% 0% 10%
Sports & Recreational Good 15% 20% 10% 5% 0% 10% 0% 0% 0% 5% 5% 20% 20% 20% 5% 20% 5% 0% 0% 5%
Pet Goods, Toys & Hobbies 20% 20% 20% 20% 20% 20% 20% 20% 20% 20% 20% 20% 20% 20% 20% 20% 20% 20% 20% 20%
Restaurants & Entertainment
Food & Beverage 20% 40% 20% 10% 10% 30% 5% 5% 5% 10% 30% 30% 30% 10% 5% 10% 5% 5% 5% 25%
Entertainment 10% 25% 20% 15% 5% 20% 5% 10% 5% 15% 20% 20% 20% 20% 5% 5% 5% 5% 5% 10%
Leisure 10% 20% 10% 10% 0% 10% 0% 10% 0% 10% 10% 10% 10% 10% 0% 0% 5% 0% 0% 10%
Auto Related
Motor Vehicles and Parts D 0% 10% 0% 0% 0% 0% 0% 0% 0% 0% 0% 0% 0% 0% 0% 0% 0% 0% 0% 0%
Auto Service 10% 10% 10% 10% 10% 10% 10% 10% 10% 10% 10% 10% 10% 10% 10% 10% 10% 10% 10% 10%
Gas Station 0% 10% 0% 0% 0% 0% 0% 0% 0% 0% 0% 0% 0% 0% 0% 0% 0% 0% 0% 0%
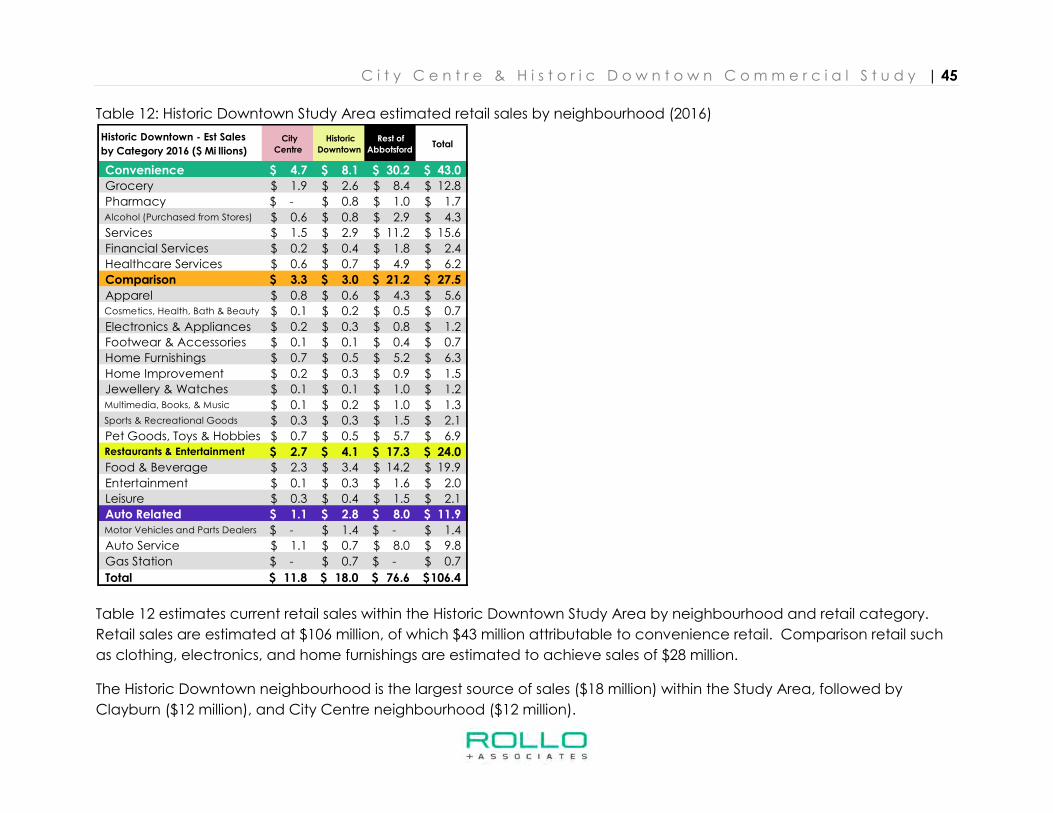
C i t y C e n t r e & H i s t o r i c D o w n t o w n C o m m e r c i a l S t u d y | 45
Table 12: Historic Downtown Study Area estimated retail sales by neighbourhood (2016)
Table 12 estimates current retail sales within the Historic Downtown Study Area by neighbourhood and retail category.
Retail sales are estimated at $106 million, of which $43 million attributable to convenience retail. Comparison retail such
as clothing, electronics, and home furnishings are estimated to achieve sales of $28 million.
The Historic Downtown neighbourhood is the largest source of sales ($18 million) within the Study Area, followed by
Clayburn ($12 million), and City Centre neighbourhood ($12 million).
Historic Downtown - Est Sales
by Category 2016 ($ Mi llions)
City
Centre
Historic
Downtown
Rest of
Abbotsford Total
Convenience 4.7$ 8.1$ 30.2$ 43.0$
Grocery 1.9$ 2.6$ 8.4$ 12.8$
Pharmacy -$ 0.8$ 1.0$ 1.7$ Alcohol (Purchased from Stores) 0.6$ 0.8$ 2.9$ 4.3$
Services 1.5$ 2.9$ 11.2$ 15.6$
Financial Services 0.2$ 0.4$ 1.8$ 2.4$
Healthcare Services 0.6$ 0.7$ 4.9$ 6.2$
Comparison 3.3$ 3.0$ 21.2$ 27.5$
Apparel 0.8$ 0.6$ 4.3$ 5.6$ Cosmetics, Health, Bath & Beauty 0.1$ 0.2$ 0.5$ 0.7$
Electronics & Appliances 0.2$ 0.3$ 0.8$ 1.2$
Footwear & Accessories 0.1$ 0.1$ 0.4$ 0.7$
Home Furnishings 0.7$ 0.5$ 5.2$ 6.3$
Home Improvement 0.2$ 0.3$ 0.9$ 1.5$
Jewellery & Watches 0.1$ 0.1$ 1.0$ 1.2$ Multimedia, Books, & Music 0.1$ 0.2$ 1.0$ 1.3$ Sports & Recreational Goods 0.3$ 0.3$ 1.5$ 2.1$
Pet Goods, Toys & Hobbies 0.7$ 0.5$ 5.7$ 6.9$ Restaurants & Entertainment 2.7$ 4.1$ 17.3$ 24.0$
Food & Beverage 2.3$ 3.4$ 14.2$ 19.9$
Entertainment 0.1$ 0.3$ 1.6$ 2.0$
Leisure 0.3$ 0.4$ 1.5$ 2.1$
Auto Related 1.1$ 2.8$ 8.0$ 11.9$ Motor Vehicles and Parts Dealers -$ 1.4$ -$ 1.4$
Auto Service 1.1$ 0.7$ 8.0$ 9.8$
Gas Station -$ 0.7$ -$ 0.7$
Total 11.8$ 18.0$ 76.6$ 106.4$
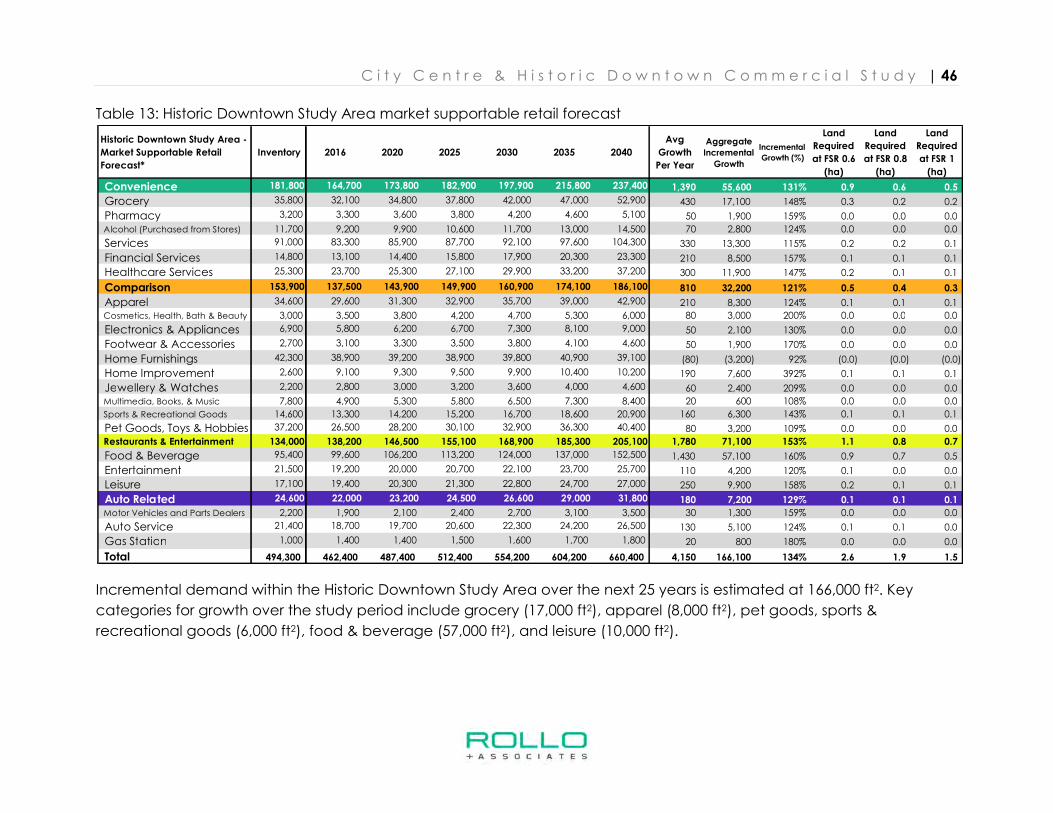
C i t y C e n t r e & H i s t o r i c D o w n t o w n C o m m e r c i a l S t u d y | 46
Table 13: Historic Downtown Study Area market supportable retail forecast
Incremental demand within the Historic Downtown Study Area over the next 25 years is estimated at 166,000 ft2. Key
categories for growth over the study period include grocery (17,000 ft2), apparel (8,000 ft2), pet goods, sports &
recreational goods (6,000 ft2), food & beverage (57,000 ft2), and leisure (10,000 ft2).
Historic Downtown Study Area -
Market Supportable Retail
Forecast*
Inventory 2016 2020 2025 2030 2035 2040
Avg
Growth
Per Year
Aggregate
Incremental
Growth
Incremental
Growth (%)
Land
Required
at FSR 0.6
(ha)
Land
Required
at FSR 0.8
(ha)
Land
Required
at FSR 1
(ha)
Convenience 181,800 164,700 173,800 182,900 197,900 215,800 237,400 1,390 55,600 131% 0.9 0.6 0.5
Grocery 35,800 32,100 34,800 37,800 42,000 47,000 52,900 430 17,100 148% 0.3 0.2 0.2
Pharmacy 3,200 3,300 3,600 3,800 4,200 4,600 5,100 50 1,900 159% 0.0 0.0 0.0
Alcohol (Purchased from Stores) 11,700 9,200 9,900 10,600 11,700 13,000 14,500 70 2,800 124% 0.0 0.0 0.0
Services 91,000 83,300 85,900 87,700 92,100 97,600 104,300 330 13,300 115% 0.2 0.2 0.1
Financial Services 14,800 13,100 14,400 15,800 17,900 20,300 23,300 210 8,500 157% 0.1 0.1 0.1
Healthcare Services 25,300 23,700 25,300 27,100 29,900 33,200 37,200 300 11,900 147% 0.2 0.1 0.1
Comparison 153,900 137,500 143,900 149,900 160,900 174,100 186,100 810 32,200 121% 0.5 0.4 0.3
Apparel 34,600 29,600 31,300 32,900 35,700 39,000 42,900 210 8,300 124% 0.1 0.1 0.1
Cosmetics, Health, Bath & Beauty 3,000 3,500 3,800 4,200 4,700 5,300 6,000 80 3,000 200% 0.0 0.0 0.0
Electronics & Appliances 6,900 5,800 6,200 6,700 7,300 8,100 9,000 50 2,100 130% 0.0 0.0 0.0
Footwear & Accessories 2,700 3,100 3,300 3,500 3,800 4,100 4,600 50 1,900 170% 0.0 0.0 0.0
Home Furnishings 42,300 38,900 39,200 38,900 39,800 40,900 39,100 (80) (3,200) 92% (0.0) (0.0) (0.0)
Home Improvement 2,600 9,100 9,300 9,500 9,900 10,400 10,200 190 7,600 392% 0.1 0.1 0.1
Jewellery & Watches 2,200 2,800 3,000 3,200 3,600 4,000 4,600 60 2,400 209% 0.0 0.0 0.0
Multimedia, Books, & Music 7,800 4,900 5,300 5,800 6,500 7,300 8,400 20 600 108% 0.0 0.0 0.0
Sports & Recreational Goods 14,600 13,300 14,200 15,200 16,700 18,600 20,900 160 6,300 143% 0.1 0.1 0.1
Pet Goods, Toys & Hobbies 37,200 26,500 28,200 30,100 32,900 36,300 40,400 80 3,200 109% 0.0 0.0 0.0
Restaurants & Entertainment 134,000 138,200 146,500 155,100 168,900 185,300 205,100 1,780 71,100 153% 1.1 0.8 0.7
Food & Beverage 95,400 99,600 106,200 113,200 124,000 137,000 152,500 1,430 57,100 160% 0.9 0.7 0.5
Entertainment 21,500 19,200 20,000 20,700 22,100 23,700 25,700 110 4,200 120% 0.1 0.0 0.0
Leisure 17,100 19,400 20,300 21,300 22,800 24,700 27,000 250 9,900 158% 0.2 0.1 0.1
Auto Related 24,600 22,000 23,200 24,500 26,600 29,000 31,800 180 7,200 129% 0.1 0.1 0.1
Motor Vehicles and Parts Dealers 2,200 1,900 2,100 2,400 2,700 3,100 3,500 30 1,300 159% 0.0 0.0 0.0
Auto Service 21,400 18,700 19,700 20,600 22,300 24,200 26,500 130 5,100 124% 0.1 0.1 0.0
Gas Station 1,000 1,400 1,400 1,500 1,600 1,700 1,800 20 800 180% 0.0 0.0 0.0
Total 494,300 462,400 487,400 512,400 554,200 604,200 660,400 4,150 166,100 134% 2.6 1.9 1.5
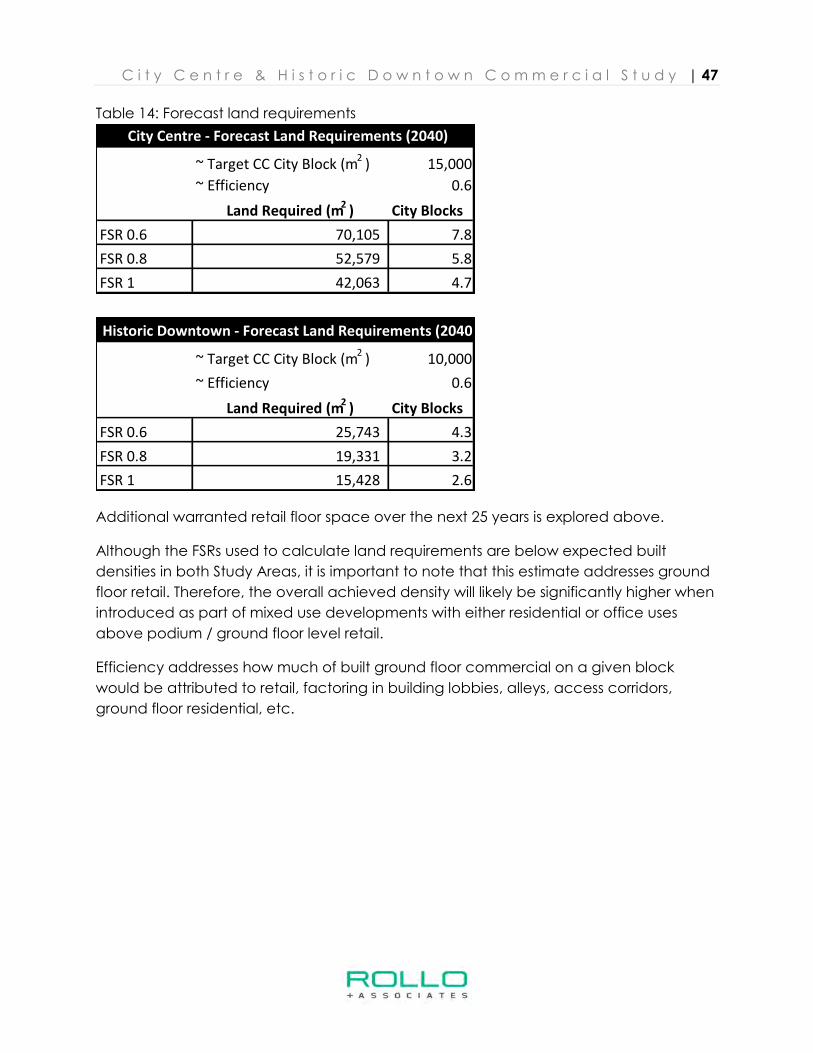
C i t y C e n t r e & H i s t o r i c D o w n t o w n C o m m e r c i a l S t u d y | 47
Table 14: Forecast land requirements
Additional warranted retail floor space over the next 25 years is explored above.
Although the FSRs used to calculate land requirements are below expected built
densities in both Study Areas, it is important to note that this estimate addresses ground
floor retail. Therefore, the overall achieved density will likely be significantly higher when
introduced as part of mixed use developments with either residential or office uses
above podium / ground floor level retail.
Efficiency addresses how much of built ground floor commercial on a given block
would be attributed to retail, factoring in building lobbies, alleys, access corridors,
ground floor residential, etc.
~ Target CC City Block (m2
) 15,000
~ Efficiency 0.6
Land Required (m2
) City Blocks
FSR 0.6 70,105 7.8
FSR 0.8 52,579 5.8
FSR 1 42,063 4.7
~ Target CC City Block (m2
) 10,000
~ Efficiency 0.6
Land Required (m2
) City Blocks
FSR 0.6 25,743 4.3
FSR 0.8 19,331 3.2
FSR 1 15,428 2.6
City Centre - Forecast Land Requirements (2040)
Historic Downtown - Forecast Land Requirements (2040)
C i t y C e n t r e & H i s t o r i c D o w n t o w n C o m m e r c i a l S t u d y | 48
4 Office
This section describes the economic factors and trends governing the market for office
space in the Study Areas as well as Abbotsford generally. It then presents GPRA’s
inventory of Abbotsford office space as well as a projection of office space demand for
the next 25 years.
4.1 Trends and Factors in the Office Market
4.1.1 The Abbotsford Office Market
Suburban office space is a “soft” market generally, exhibiting low demand, low rents,
and little growth. According to local realtors and developers there is almost no
absorption of Abbotsford office space at present, and when space does get leased, it
is because of spillover from areas to the west. In other words, office tenants typically
take space in Vancouver if they can afford it, and then settle for areas further out as
determined by available rents. Abbotsford would not be the first choice for most
businesses (with the possible exception of dedicated locals). For this reason,
Abbotsford’s office market is likely to remain soft, as it can be undercut quite easily by
an increase in supply to the west, over which the City has no control. At best, planning
for office space in Abbotsford is a matter of waiting for existing office space to fill up
and for new space to be needed, as the market follows its perpetual cycle of
undersupply, rising rents, development, and oversupply.
Several large office developments occurred in Abbotsford since 2010, including:
• The Correctional Services of Canada building on Gladys Avenue (73,000 ft2)
• The former grain elevator on Gladys Avenue (64,000 ft2)
• The Mark office condominium on South Fraser Way (18,000 ft2)
• The 6-storey Bank of Montreal office building on South Fraser Way (59,000 ft2)
Between them, these four buildings alone contain almost 214,000 ft2 of office space, or
about 14% of the City’s total. Although this is not an overwhelming amount, it does
represent fairly rapid growth in a generally slow market. Realtor interviews suggest that
this new space (or the space left vacant by this new space, as in the case of
Correctional Services Canada) was absorbed only slowly. The Mark, for instance, took
several years to fill despite its high quality, desirable strata tenure, and excellent
location.
As it currently stands, the market for office space throughout Abbotsford is still
recovering from this recent period of development, and has an extremely high office
vacancy rate of about 20%. There is little demand and new office development is
uneconomic. According to realtors, there is three to four years of unused supply
C i t y C e n t r e & H i s t o r i c D o w n t o w n C o m m e r c i a l S t u d y | 49
available on the market, and this should be filled before new construction is required.
The current economic rent7 for new office space is about $20 per ft2 per year, which is
well above what most office tenants are willing to pay.
Realtors report that they still receive inquiries for some office space, most notably
rentable spaces of 2,000 – 3,000 ft2 in buildings with elevators. Second-floor office space
without elevators is allegedly impossible to lease, even for subsidized rental rates.
Several government agencies use office space in Abbotsford, but the City lacks large
private sector office users because they typically prefer locating closer to Vancouver.
Private sector office tenants in Abbotsford tend to be smaller, locally-owned
operations, including:
• Medical offices
• Lawyers
• Accountants
• Engineering and design firms.
Medical office tenants have largely moved to malls due to financial inducements, or
have moved to the Mark. Many are also located along McCallum Road, clustered
where the old MSA Hospital once existed. The medical office sector is currently a well-
served sector in Abbotsford.
4.1.2 The City Centre Office Market
Due to the period of recent office development in Abbotsford discussed above, there is
a large quantity of vacant office space in the City Centre, possibly as much as 25% of
the neighbourhood’s office supply. The area has little sense of place, unlike the Historic
Downtown, and office users who select it are typically driven more by cost concerns.
However, the area is highly central and accessible to Abbotsford, has many amenities,
and would be a logical location for future office development once the market
recovers.
4.1.3 The Historic Downtown Office Market
As with retail, office tenants that seek out space in the Historic Downtown tend to be
smaller businesses, often locally owned. In addition to medical offices (which are
ubiquitous throughout Abbotsford), the Historic Downtown is especially appealing to
accounting, tech firms, and design firms due to its walkability and urban character. Not
a lot of larger institutions or operations can find space in the area due to the smaller
7 “Economic rent” is the rental rate that would be required to make new construction financially viable.
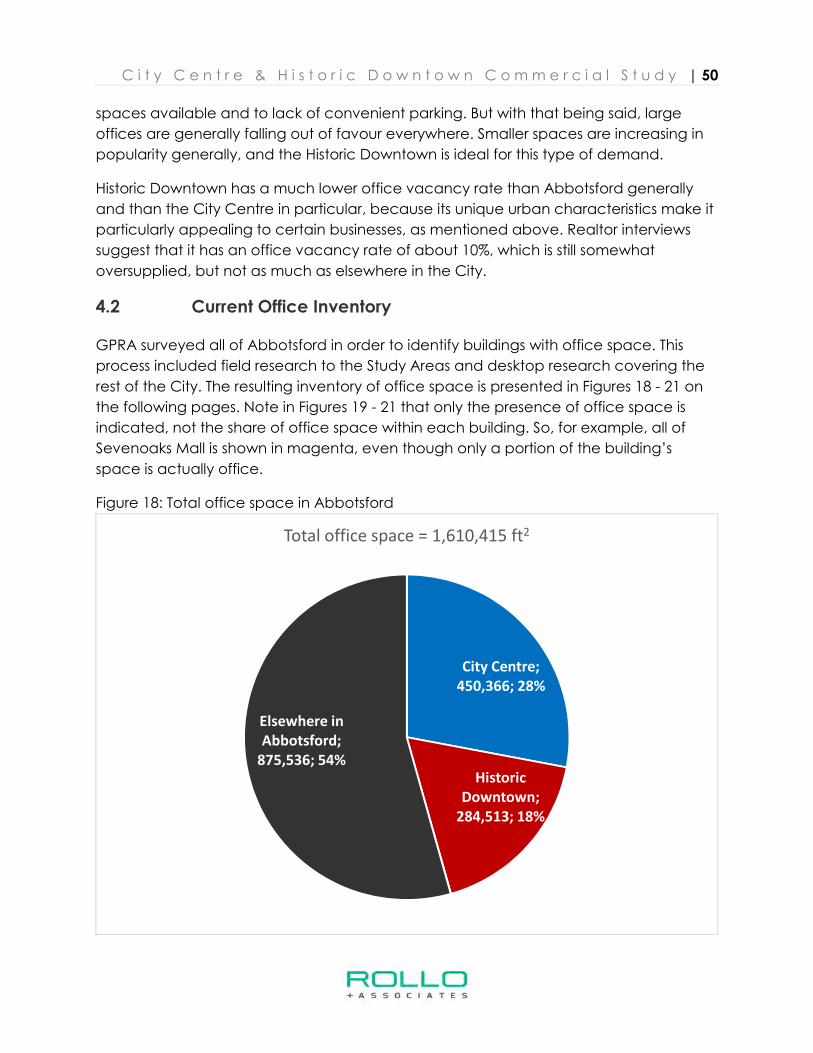
C i t y C e n t r e & H i s t o r i c D o w n t o w n C o m m e r c i a l S t u d y | 50
spaces available and to lack of convenient parking. But with that being said, large
offices are generally falling out of favour everywhere. Smaller spaces are increasing in
popularity generally, and the Historic Downtown is ideal for this type of demand.
Historic Downtown has a much lower office vacancy rate than Abbotsford generally
and than the City Centre in particular, because its unique urban characteristics make it
particularly appealing to certain businesses, as mentioned above. Realtor interviews
suggest that it has an office vacancy rate of about 10%, which is still somewhat
oversupplied, but not as much as elsewhere in the City.
4.2 Current Office Inventory
GPRA surveyed all of Abbotsford in order to identify buildings with office space. This
process included field research to the Study Areas and desktop research covering the
rest of the City. The resulting inventory of office space is presented in Figures 18 - 21 on
the following pages. Note in Figures 19 - 21 that only the presence of office space is
indicated, not the share of office space within each building. So, for example, all of
Sevenoaks Mall is shown in magenta, even though only a portion of the building’s
space is actually office.
Figure 18: Total office space in Abbotsford
City Centre;
450,366; 28%
Historic
Downtown;
284,513; 18%
Elsewhere in
Abbotsford;
875,536; 54%
Total office space = 1,610,415 ft2
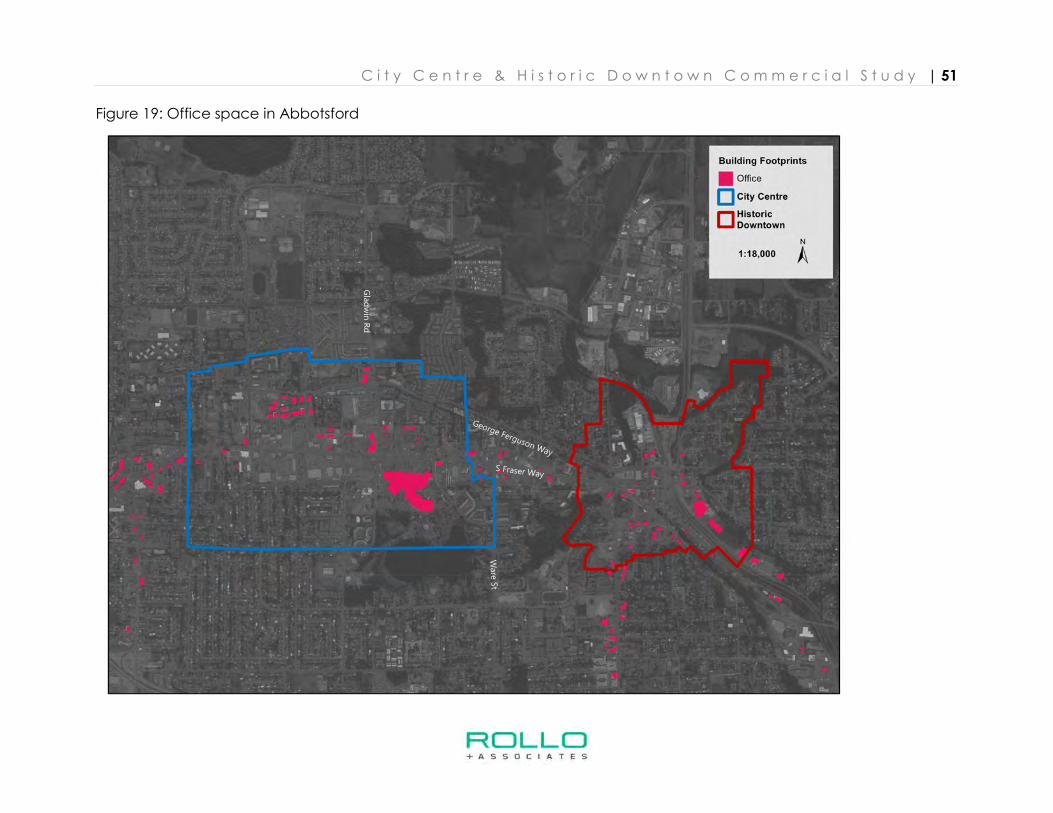
C i t y C e n t r e & H i s t o r i c D o w n t o w n C o m m e r c i a l S t u d y | 51
Figure 19: Office space in Abbotsford
G
lad
win
Rd
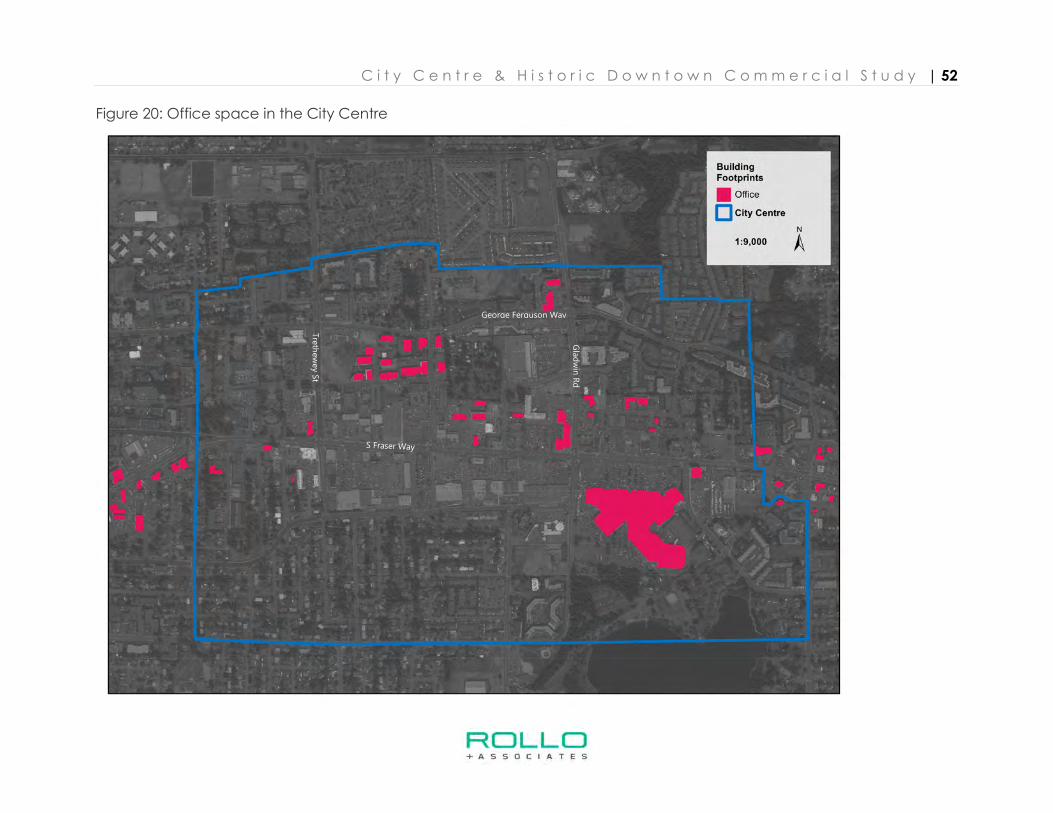
C i t y C e n t r e & H i s t o r i c D o w n t o w n C o m m e r c i a l S t u d y | 52
Figure 20: Office space in the City Centre
George Ferguson Way
Gla
dw
in R
d
Tre
thew
ey S
t
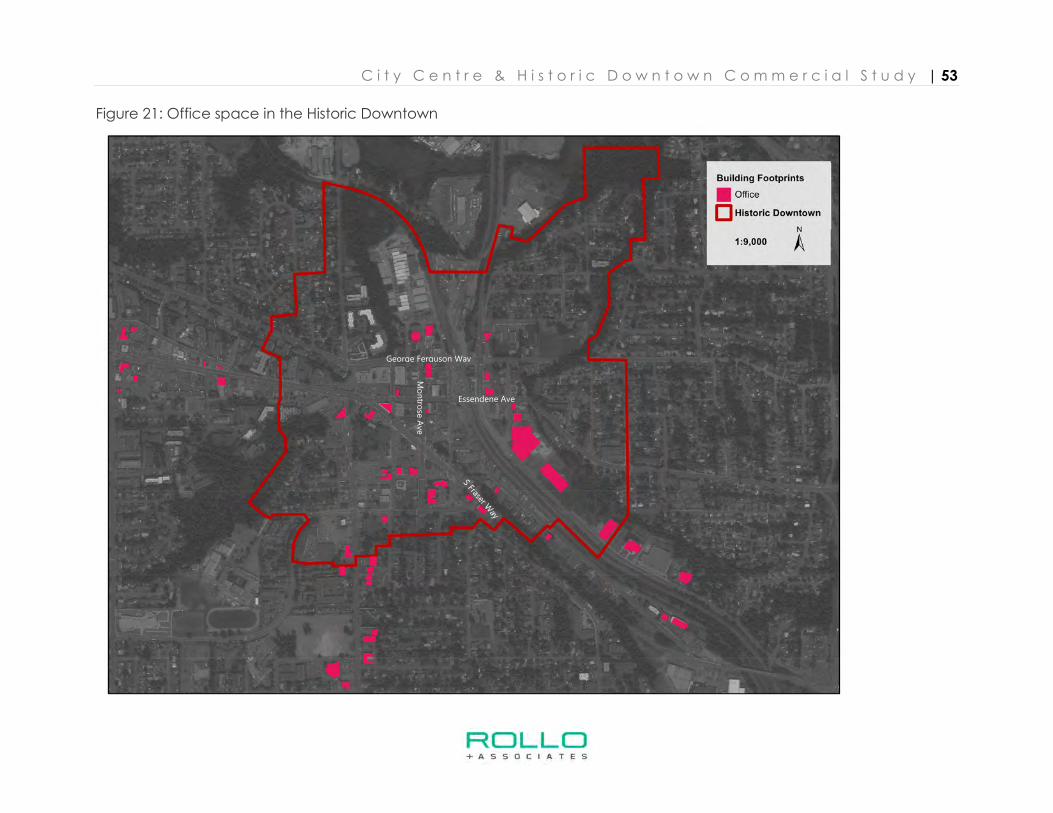
C i t y C e n t r e & H i s t o r i c D o w n t o w n C o m m e r c i a l S t u d y | 53
Figure 21: Office space in the Historic Downtown
George Ferguson Way
Mo
ntro
se A
ve
Essendene Ave
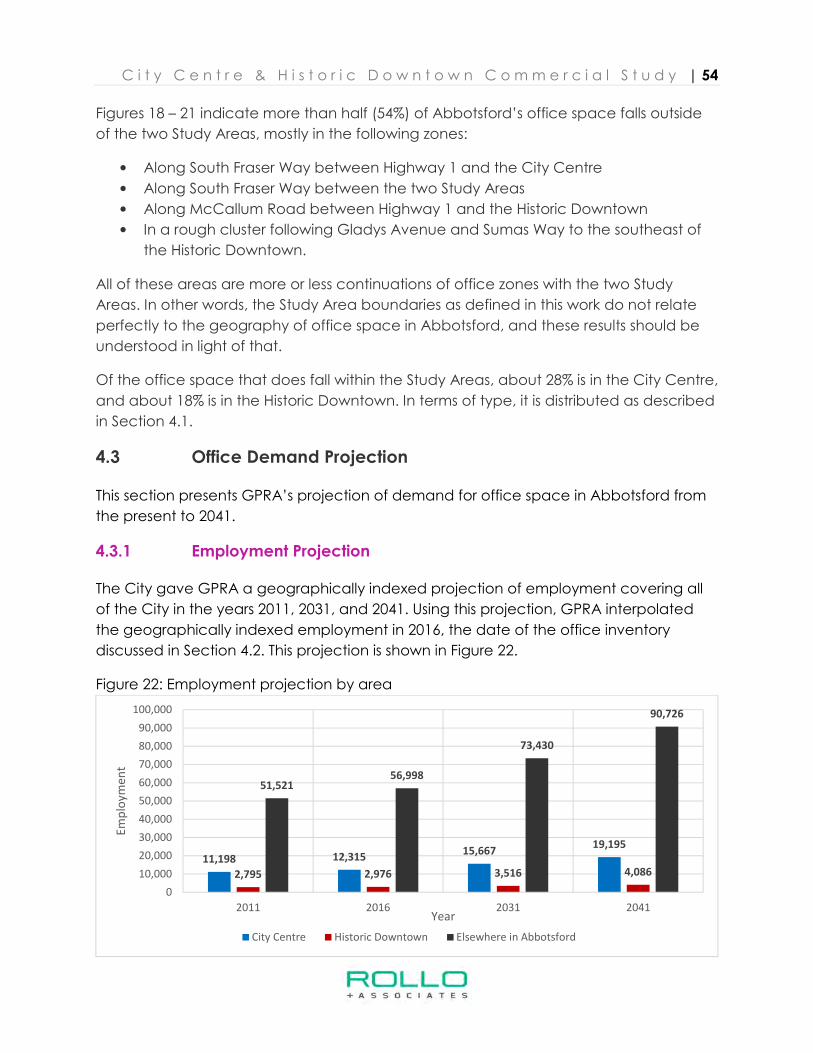
C i t y C e n t r e & H i s t o r i c D o w n t o w n C o m m e r c i a l S t u d y | 54
Figures 18 – 21 indicate more than half (54%) of Abbotsford’s office space falls outside
of the two Study Areas, mostly in the following zones:
• Along South Fraser Way between Highway 1 and the City Centre
• Along South Fraser Way between the two Study Areas
• Along McCallum Road between Highway 1 and the Historic Downtown
• In a rough cluster following Gladys Avenue and Sumas Way to the southeast of
the Historic Downtown.
All of these areas are more or less continuations of office zones with the two Study
Areas. In other words, the Study Area boundaries as defined in this work do not relate
perfectly to the geography of office space in Abbotsford, and these results should be
understood in light of that.
Of the office space that does fall within the Study Areas, about 28% is in the City Centre,
and about 18% is in the Historic Downtown. In terms of type, it is distributed as described
in Section 4.1.
4.3 Office Demand Projection
This section presents GPRA’s projection of demand for office space in Abbotsford from
the present to 2041.
4.3.1 Employment Projection
The City gave GPRA a geographically indexed projection of employment covering all
of the City in the years 2011, 2031, and 2041. Using this projection, GPRA interpolated
the geographically indexed employment in 2016, the date of the office inventory
discussed in Section 4.2. This projection is shown in Figure 22.
Figure 22: Employment projection by area
11,198 12,31515,667
19,195
2,795 2,976 3,516 4,086
51,52156,998
73,430
90,726
0
10,000
20,000
30,000
40,000
50,000
60,000
70,000
80,000
90,000
100,000
2011 2016 2031 2041
Em
plo
ym
en
t
Year
City Centre Historic Downtown Elsewhere in Abbotsford
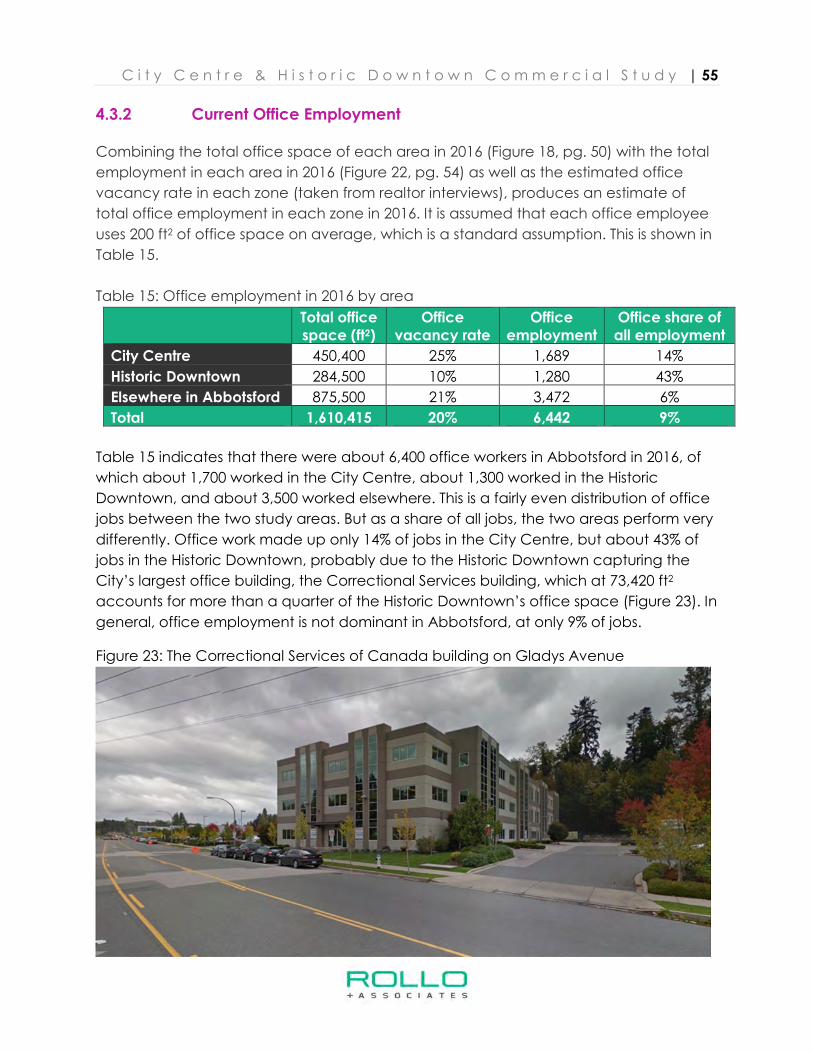
C i t y C e n t r e & H i s t o r i c D o w n t o w n C o m m e r c i a l S t u d y | 55
4.3.2 Current Office Employment
Combining the total office space of each area in 2016 (Figure 18, pg. 50) with the total
employment in each area in 2016 (Figure 22, pg. 54) as well as the estimated office
vacancy rate in each zone (taken from realtor interviews), produces an estimate of
total office employment in each zone in 2016. It is assumed that each office employee
uses 200 ft2 of office space on average, which is a standard assumption. This is shown in
Table 15.
Table 15: Office employment in 2016 by area
Total office space (ft2)
Office vacancy rate
Office employment
Office share of all employment
City Centre 450,400 25% 1,689 14%
Historic Downtown 284,500 10% 1,280 43%
Elsewhere in Abbotsford 875,500 21% 3,472 6%
Total 1,610,415 20% 6,442 9%
Table 15 indicates that there were about 6,400 office workers in Abbotsford in 2016, of
which about 1,700 worked in the City Centre, about 1,300 worked in the Historic
Downtown, and about 3,500 worked elsewhere. This is a fairly even distribution of office
jobs between the two study areas. But as a share of all jobs, the two areas perform very
differently. Office work made up only 14% of jobs in the City Centre, but about 43% of
jobs in the Historic Downtown, probably due to the Historic Downtown capturing the
City’s largest office building, the Correctional Services building, which at 73,420 ft2
accounts for more than a quarter of the Historic Downtown’s office space (Figure 23). In
general, office employment is not dominant in Abbotsford, at only 9% of jobs.
Figure 23: The Correctional Services of Canada building on Gladys Avenue
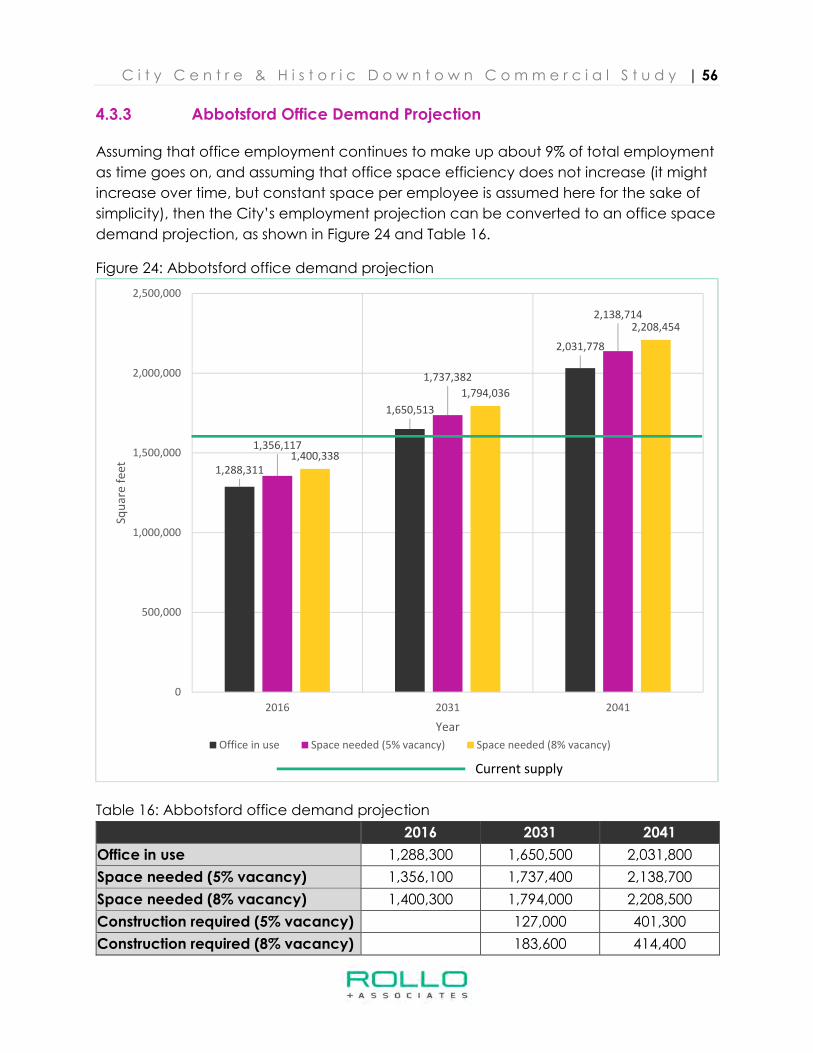
C i t y C e n t r e & H i s t o r i c D o w n t o w n C o m m e r c i a l S t u d y | 56
4.3.3 Abbotsford Office Demand Projection
Assuming that office employment continues to make up about 9% of total employment
as time goes on, and assuming that office space efficiency does not increase (it might
increase over time, but constant space per employee is assumed here for the sake of
simplicity), then the City’s employment projection can be converted to an office space
demand projection, as shown in Figure 24 and Table 16.
Figure 24: Abbotsford office demand projection
Table 16: Abbotsford office demand projection 2016 2031 2041
Office in use 1,288,300 1,650,500 2,031,800
Space needed (5% vacancy) 1,356,100 1,737,400 2,138,700
Space needed (8% vacancy) 1,400,300 1,794,000 2,208,500
Construction required (5% vacancy) 127,000 401,300
Construction required (8% vacancy) 183,600 414,400
1,288,311
1,650,513
2,031,778
1,356,117
1,737,382
2,138,714
1,400,338
1,794,036
2,208,454
0
500,000
1,000,000
1,500,000
2,000,000
2,500,000
2016 2031 2041
Sq
ua
re f
ee
t
Year
Office in use Space needed (5% vacancy) Space needed (8% vacancy)
Current supply
C i t y C e n t r e & H i s t o r i c D o w n t o w n C o m m e r c i a l S t u d y | 57
Figure 24 and Table 16 indicate that at the City’s current level of office vacancy (about
20%), about 1.29 million of its 1.61 million square feet of office are in use. As employment
in the City increases, this amount is expected to increase to 1.65 million ft2 in 2031, and
then 2.03 million ft2 in 2041. A vacancy rate of 5% - 8% is typically considered
appropriate in the office sector. To achieve this level of vacancy, the City will therefore
need to contain 1.74 – 1.79 million ft2 of office in 2031, and 2.14 – 2.21 million ft2 of office
in 2041.
In other words, there is currently no shortfall of office space in the City, but in the 2020 -
2031 period there will be demand for an additional 127,000 – 184,000 ft2 of office space,
and in the 2032 - 2041 period there will be demand for an additional 401,000 – 414,000
ft2 of office space. GPRA believes that no new space will be required from 2017 – 2019.
4.3.4 Study Area Office Demand Projection
Assuming that office employment continues to make up the same share of total
employment in each of the Study Areas as it did in 2016 (14% in the City Centre and
43% in the Historic Downtown, respectively), then the City’s employment projection for
the Study Areas (Figure 22, pg. 54) can be converted into a projection of required
office space. Permitting a range of vacancy rates from 5% - 8% in each Area produces
the following demand projections, shown in Tables 17 and 18.
Table 17: City Centre office demand projection 2016 2031 2041
Office in use 337,800 429,700 526,500
Space needed (5% vacancy) 355,600 452,300 554,200
Space needed (8% vacancy) 367,100 467,100 572,200
Construction required (5% vacancy) 2,000 101,900
Construction required (8% vacancy) 16,700 105,200
Table 18: Historic Downtown office demand projection 2016 2031 2041
Office in use 256,100 302,600 351,600
Space needed (5% vacancy) 269,500 318,500 370,100
Space needed (8% vacancy) 278,300 328,900 382,100
Construction required (5% vacancy) 34,000 51,600
Construction required (8% vacancy) 44,400 53,200
Table 17 shows that with its currently high vacancy rate, the City Centre will only need
between 2,000 – 17,000 ft2 of additional office space from 2020 – 2031, which is easily
enough to fit within a small mixed used development. As the market develops and
vacancy reaches a more normal level during the 2032 – 2041 period, and additional
C i t y C e n t r e & H i s t o r i c D o w n t o w n C o m m e r c i a l S t u d y | 58
102,000 – 105,000 ft2 will be required, which is the equivalent of two large office
buildings or several smaller ones.
Table 18 shows that with its much lower vacancy rate, the Historic Downtown will need
more new office space in the near future than the City Centre: from 34,000 – 44,000 ft2
of additional office space between 2020 and 2031, which is the equivalent of one
medium-sized or two small office buildings. But over the longer term, it is assumed that
the two Areas will have similar vacancy rates, and therefore the Historic Downtown will
not need to grow as fast as the larger City Centre during the 2032- 2041 period,
requiring only 52,000 – 53,000 new ft2 of space, or the equivalent of one large building.
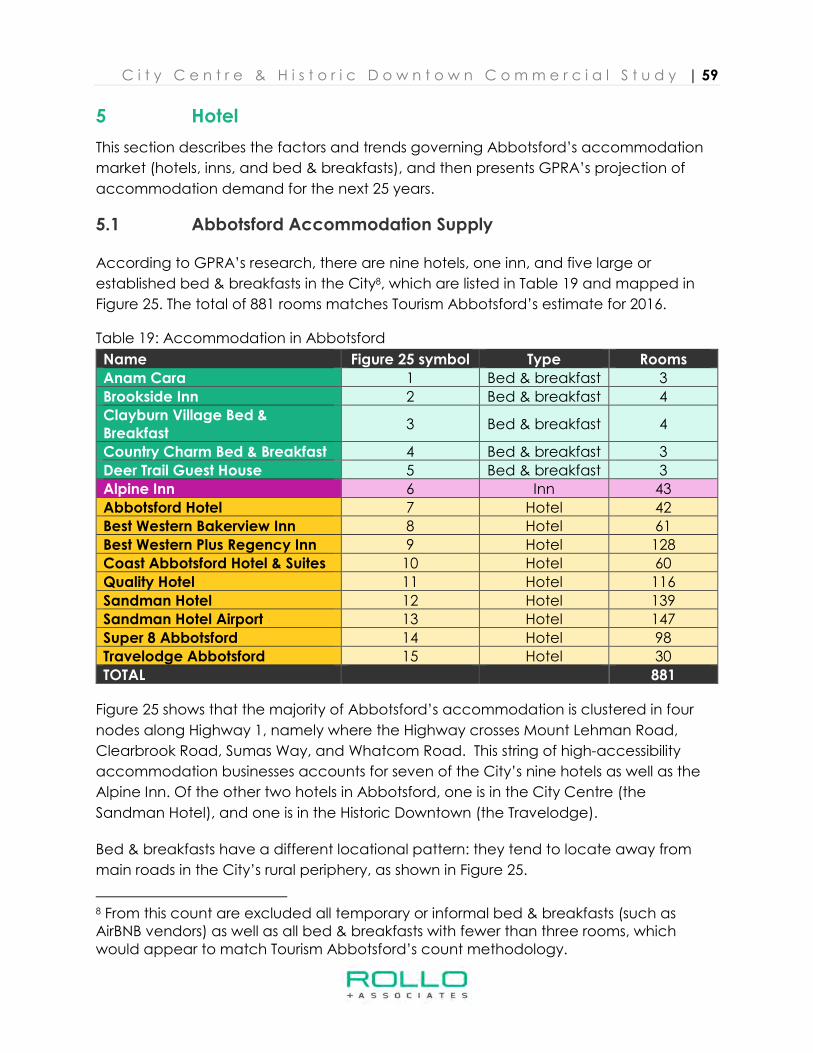
C i t y C e n t r e & H i s t o r i c D o w n t o w n C o m m e r c i a l S t u d y | 59
5 Hotel
This section describes the factors and trends governing Abbotsford’s accommodation
market (hotels, inns, and bed & breakfasts), and then presents GPRA’s projection of
accommodation demand for the next 25 years.
5.1 Abbotsford Accommodation Supply
According to GPRA’s research, there are nine hotels, one inn, and five large or
established bed & breakfasts in the City8, which are listed in Table 19 and mapped in
Figure 25. The total of 881 rooms matches Tourism Abbotsford’s estimate for 2016.
Table 19: Accommodation in Abbotsford
Name Figure 25 symbol Type Rooms
Anam Cara 1 Bed & breakfast 3
Brookside Inn 2 Bed & breakfast 4
Clayburn Village Bed & Breakfast
3 Bed & breakfast 4
Country Charm Bed & Breakfast 4 Bed & breakfast 3
Deer Trail Guest House 5 Bed & breakfast 3
Alpine Inn 6 Inn 43
Abbotsford Hotel 7 Hotel 42
Best Western Bakerview Inn 8 Hotel 61
Best Western Plus Regency Inn 9 Hotel 128
Coast Abbotsford Hotel & Suites 10 Hotel 60
Quality Hotel 11 Hotel 116
Sandman Hotel 12 Hotel 139
Sandman Hotel Airport 13 Hotel 147
Super 8 Abbotsford 14 Hotel 98
Travelodge Abbotsford 15 Hotel 30
TOTAL 881
Figure 25 shows that the majority of Abbotsford’s accommodation is clustered in four
nodes along Highway 1, namely where the Highway crosses Mount Lehman Road,
Clearbrook Road, Sumas Way, and Whatcom Road. This string of high-accessibility
accommodation businesses accounts for seven of the City’s nine hotels as well as the
Alpine Inn. Of the other two hotels in Abbotsford, one is in the City Centre (the
Sandman Hotel), and one is in the Historic Downtown (the Travelodge).
Bed & breakfasts have a different locational pattern: they tend to locate away from
main roads in the City’s rural periphery, as shown in Figure 25.
8 From this count are excluded all temporary or informal bed & breakfasts (such as AirBNB vendors) as well as all bed & breakfasts with fewer than three rooms, which would appear to match Tourism Abbotsford’s count methodology.
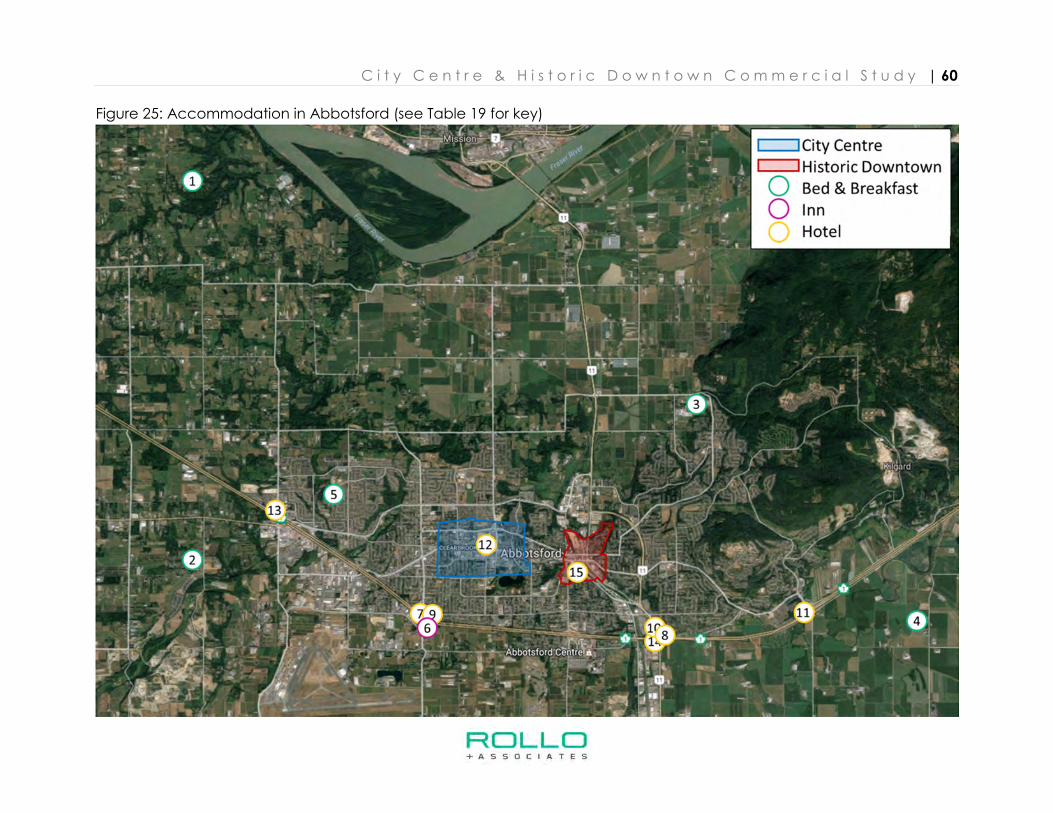
C i t y C e n t r e & H i s t o r i c D o w n t o w n C o m m e r c i a l S t u d y | 60
Figure 25: Accommodation in Abbotsford (see Table 19 for key)
C i t y C e n t r e & H i s t o r i c D o w n t o w n C o m m e r c i a l S t u d y | 61
5.2 Trends and Factors in the Accommodation Market
GPRA interviewed representatives of nearly every hotel, inn, and large bed & breakfast
in Abbotsford to gain a sense of the factors and trends that govern Abbotsford’s
accommodation industry. In the process, the consultant team identified the attractions
that draw visitors to Abbotsford, the demographic groups that tend to visit the City, and
the recommendations that accommodation industry members have for City policy.
5.2.1 Bed & Breakfasts in Abbotsford
Bed and breakfast operators report that Abbotsford is an excellent place to run this kind
of business, that the market is good, and that it is growing fast. Bed & breakfasts
typically attract visitors looking for a calm and bucolic experience, who are therefore
drawn to rural areas on the outskirts of major cities, which fits much of Abbotsford
perfectly. Although it is noteworthy that Abbotsford has several successful bed &
breakfasts and will likely be able to support many more in the near to medium future,
this sub-market is largely irrelevant to the two Study Areas, both of which are central
and urban rather than quiet and rural.
5.2.2 Hotels in Abbotsford
The market for hotel rooms in Abbotsford is more complicated. Aside from the quaint
rural appeal of its peripheral areas, Abbotsford is not a major tourist destination.
According to local hotel staff Abbotsford’s hotels are mostly used as one stop in a
longer trip, or en route to somewhere else. Often people stop in Abbotsford before
heading into Vancouver the following day, and most people on multi-day trips through
Abbotsford don’t stop there.
As mentioned in Section 2, activities that bring visitors to Abbotsford in particular include
weddings and funerals, government-related travel, sporting events, concerts and
performances (mostly at the Abbotsford Arts Centre) and a growing assortment of
festivals and celebrations such as the Tulip Festival in April and the Downtown Christmas
Tree Lighting in November. The Fraser Valley Trade & Exhibition Centre (Tradex) is
another important event venue. In general, hoteliers acknowledge that Tourism
Abbotsford has done a good job of attracting events to the City, and that the overall
impact of this effort has been positive. Attracting more dedicated visitors and larger
events will be an ongoing challenge requiring creativity and cooperation among many
stakeholders.
Hoteliers in Abbotsford generally report that room occupancy rates have increased
over the last five years, which agrees with GPRA’s quantitative findings (see Section
5.3). The Alberta economic downturn of the last year has led to a drop in visits from that
province, but this has coincided with a general increase in international tourist visits in
C i t y C e n t r e & H i s t o r i c D o w n t o w n C o m m e r c i a l S t u d y | 62
Abbotsford and throughout British Columbia, owing in part to Canada’s weak dollar.
The number of events in Abbotsford has increased in this time as well, bringing more
visitors. Another factor that might be helping Abbotsford’s hotel market is the general
unaffordability of hotel space in Vancouver, which is yet another outcome of that
region’s expensive real estate.
5.2.3 Hotels in the Study Areas
Of the 11 major accommodation businesses identified in Abbotsford, only one is
located in each Study Area. The City Centre contains a Sandman Inn, although GPRA
was unable to reach them for an interview. The Historic Downtown contains a
Travelodge adjacent to Jubilee Park, and this interview proved insightful.
By their own admission, Travelodge is one of the City’s lower-end hotels as well as its
smallest (at only 30 rooms), however as the only hotel in the Historic Downtown, it serves
an important role and benefits from the accessible and popular location. Although this
is the case, Travelodge staff did highlight Jubilee Park’s challenges, particularly around
safety. Improving the Park’s design and adding more lights may help overcome this
obstacle.
5.2.4 Online Accommodation Websites
In GPRA’s research throughout Western Canada, many hoteliers and municipalities
have identified online accommodation websites such as AirBNB as a threat to
established vendors in the industry as these websites typically create uncontrolled and
unregulated room supply and also allow small informal bed & breakfasts to operate
without paying the commercial property tax rate, which gives them an unfair
advantage. In speaking with representatives of Abbotsford’s accommodation industry,
GPRA noted that two thirds of respondents identified no problem with online
accommodation websites, although one third did believe there was a problem. GPRA
found less than 10 single-room AirBNB vendors advertising on the website in December
2016, although interviews suggest that this number may double in the summer. This is a
relatively small increase in room supply (up from 881 to maybe 901), and clearly the
impact of such websites has not prevented growth in this industry.
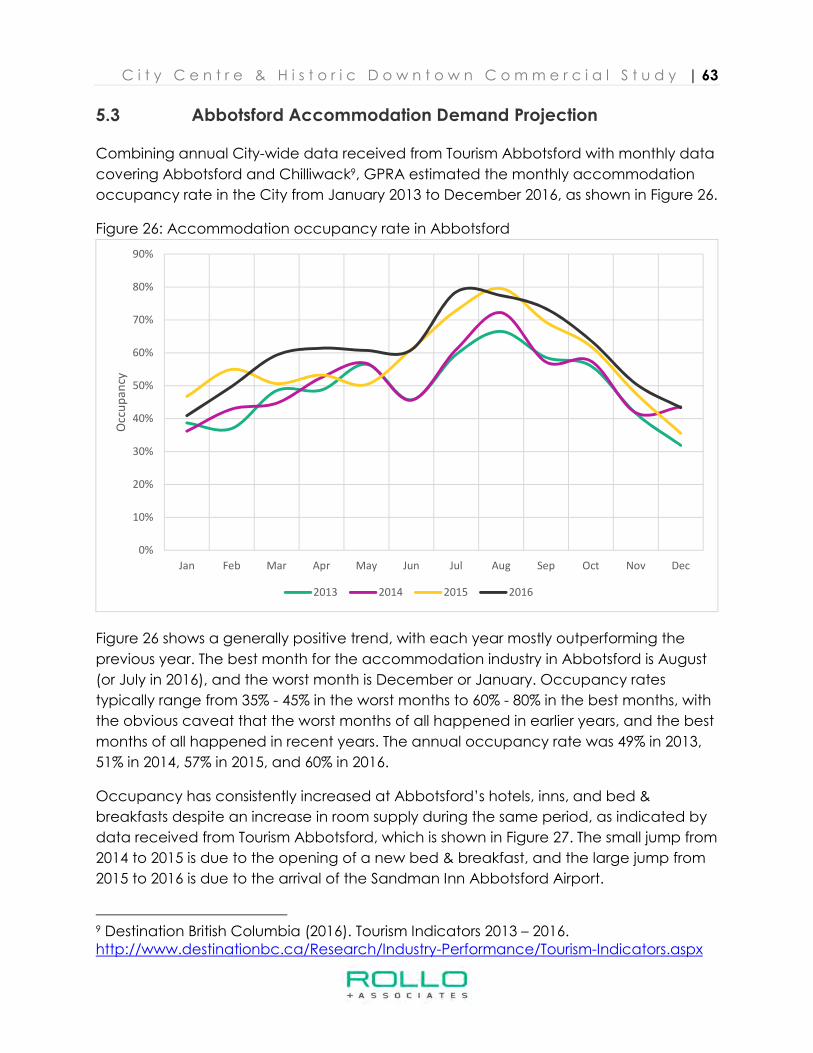
C i t y C e n t r e & H i s t o r i c D o w n t o w n C o m m e r c i a l S t u d y | 63
5.3 Abbotsford Accommodation Demand Projection
Combining annual City-wide data received from Tourism Abbotsford with monthly data
covering Abbotsford and Chilliwack9, GPRA estimated the monthly accommodation
occupancy rate in the City from January 2013 to December 2016, as shown in Figure 26.
Figure 26: Accommodation occupancy rate in Abbotsford
Figure 26 shows a generally positive trend, with each year mostly outperforming the
previous year. The best month for the accommodation industry in Abbotsford is August
(or July in 2016), and the worst month is December or January. Occupancy rates
typically range from 35% - 45% in the worst months to 60% - 80% in the best months, with
the obvious caveat that the worst months of all happened in earlier years, and the best
months of all happened in recent years. The annual occupancy rate was 49% in 2013,
51% in 2014, 57% in 2015, and 60% in 2016.
Occupancy has consistently increased at Abbotsford’s hotels, inns, and bed &
breakfasts despite an increase in room supply during the same period, as indicated by
data received from Tourism Abbotsford, which is shown in Figure 27. The small jump from
2014 to 2015 is due to the opening of a new bed & breakfast, and the large jump from
2015 to 2016 is due to the arrival of the Sandman Inn Abbotsford Airport.
9 Destination British Columbia (2016). Tourism Indicators 2013 – 2016. http://www.destinationbc.ca/Research/Industry-Performance/Tourism-Indicators.aspx
0%
10%
20%
30%
40%
50%
60%
70%
80%
90%
Jan Feb Mar Apr May Jun Jul Aug Sep Oct Nov Dec
Occ
up
an
cy
2013 2014 2015 2016
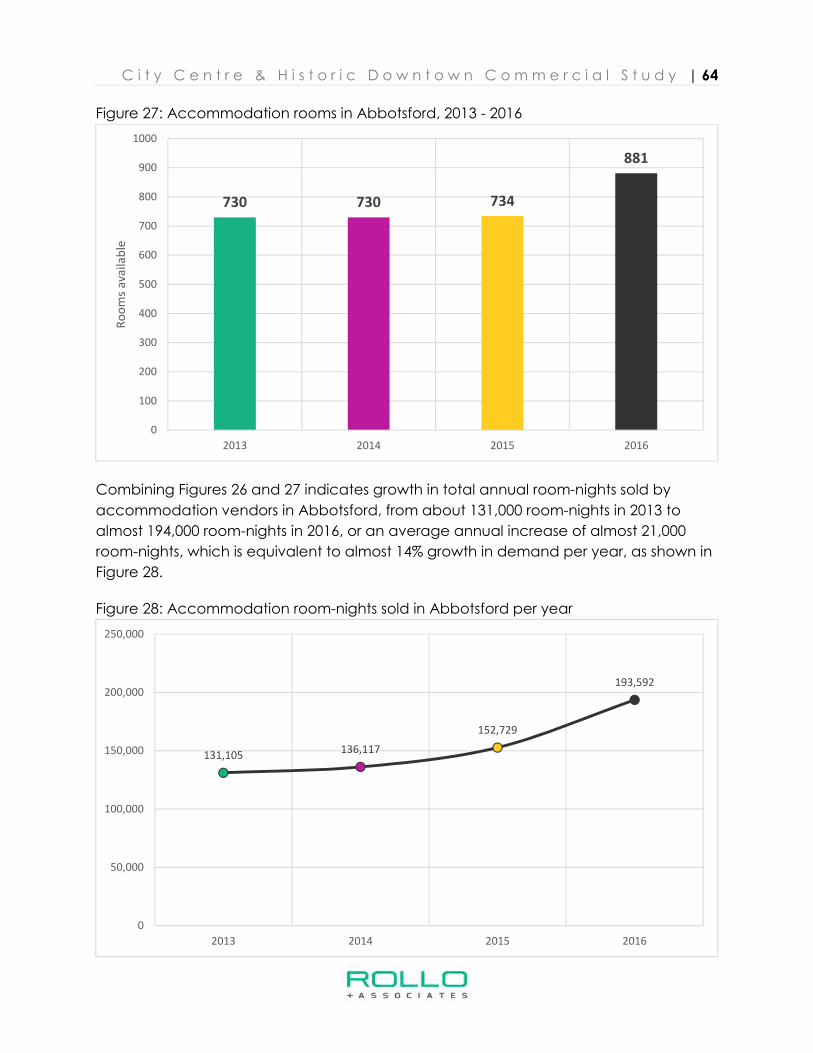
C i t y C e n t r e & H i s t o r i c D o w n t o w n C o m m e r c i a l S t u d y | 64
Figure 27: Accommodation rooms in Abbotsford, 2013 - 2016
Combining Figures 26 and 27 indicates growth in total annual room-nights sold by
accommodation vendors in Abbotsford, from about 131,000 room-nights in 2013 to
almost 194,000 room-nights in 2016, or an average annual increase of almost 21,000
room-nights, which is equivalent to almost 14% growth in demand per year, as shown in
Figure 28.
Figure 28: Accommodation room-nights sold in Abbotsford per year
730 730 734
881
0
100
200
300
400
500
600
700
800
900
1000
2013 2014 2015 2016
Ro
om
s a
va
ila
ble
131,105136,117
152,729
193,592
0
50,000
100,000
150,000
200,000
250,000
2013 2014 2015 2016
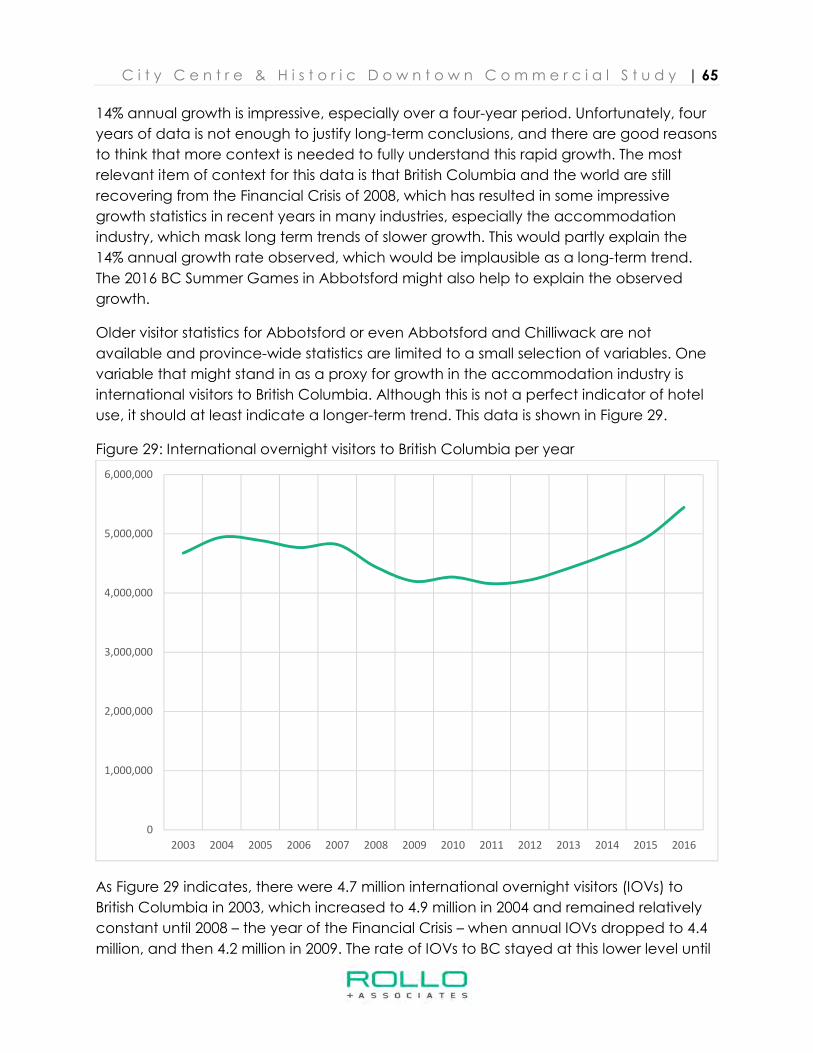
C i t y C e n t r e & H i s t o r i c D o w n t o w n C o m m e r c i a l S t u d y | 65
14% annual growth is impressive, especially over a four-year period. Unfortunately, four
years of data is not enough to justify long-term conclusions, and there are good reasons
to think that more context is needed to fully understand this rapid growth. The most
relevant item of context for this data is that British Columbia and the world are still
recovering from the Financial Crisis of 2008, which has resulted in some impressive
growth statistics in recent years in many industries, especially the accommodation
industry, which mask long term trends of slower growth. This would partly explain the
14% annual growth rate observed, which would be implausible as a long-term trend.
The 2016 BC Summer Games in Abbotsford might also help to explain the observed
growth.
Older visitor statistics for Abbotsford or even Abbotsford and Chilliwack are not
available and province-wide statistics are limited to a small selection of variables. One
variable that might stand in as a proxy for growth in the accommodation industry is
international visitors to British Columbia. Although this is not a perfect indicator of hotel
use, it should at least indicate a longer-term trend. This data is shown in Figure 29.
Figure 29: International overnight visitors to British Columbia per year
As Figure 29 indicates, there were 4.7 million international overnight visitors (IOVs) to
British Columbia in 2003, which increased to 4.9 million in 2004 and remained relatively
constant until 2008 – the year of the Financial Crisis – when annual IOVs dropped to 4.4
million, and then 4.2 million in 2009. The rate of IOVs to BC stayed at this lower level until
0
1,000,000
2,000,000
3,000,000
4,000,000
5,000,000
6,000,000
2003 2004 2005 2006 2007 2008 2009 2010 2011 2012 2013 2014 2015 2016
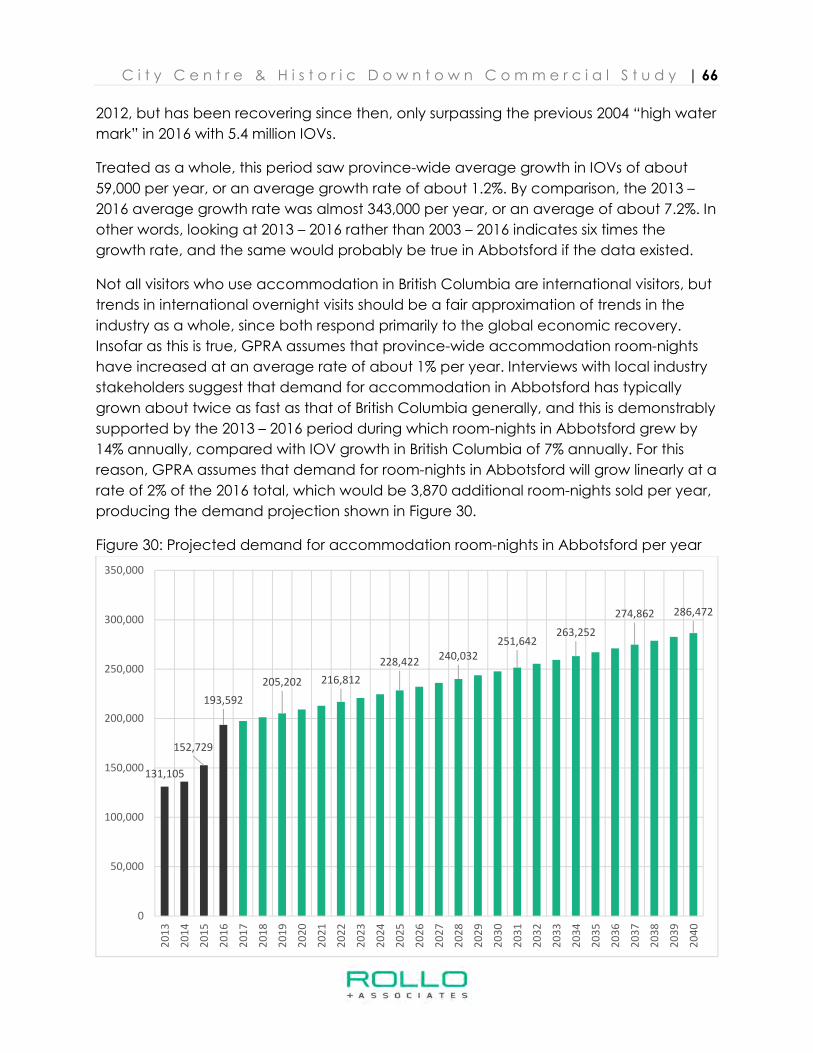
C i t y C e n t r e & H i s t o r i c D o w n t o w n C o m m e r c i a l S t u d y | 66
2012, but has been recovering since then, only surpassing the previous 2004 “high water
mark” in 2016 with 5.4 million IOVs.
Treated as a whole, this period saw province-wide average growth in IOVs of about
59,000 per year, or an average growth rate of about 1.2%. By comparison, the 2013 –
2016 average growth rate was almost 343,000 per year, or an average of about 7.2%. In
other words, looking at 2013 – 2016 rather than 2003 – 2016 indicates six times the
growth rate, and the same would probably be true in Abbotsford if the data existed.
Not all visitors who use accommodation in British Columbia are international visitors, but
trends in international overnight visits should be a fair approximation of trends in the
industry as a whole, since both respond primarily to the global economic recovery.
Insofar as this is true, GPRA assumes that province-wide accommodation room-nights
have increased at an average rate of about 1% per year. Interviews with local industry
stakeholders suggest that demand for accommodation in Abbotsford has typically
grown about twice as fast as that of British Columbia generally, and this is demonstrably
supported by the 2013 – 2016 period during which room-nights in Abbotsford grew by
14% annually, compared with IOV growth in British Columbia of 7% annually. For this
reason, GPRA assumes that demand for room-nights in Abbotsford will grow linearly at a
rate of 2% of the 2016 total, which would be 3,870 additional room-nights sold per year,
producing the demand projection shown in Figure 30.
Figure 30: Projected demand for accommodation room-nights in Abbotsford per year
131,105
152,729
193,592
205,202 216,812
228,422240,032
251,642263,252
274,862 286,472
0
50,000
100,000
150,000
200,000
250,000
300,000
350,000
20
13
20
14
20
15
20
16
20
17
20
18
20
19
20
20
20
21
20
22
20
23
20
24
20
25
20
26
20
27
20
28
20
29
20
30
20
31
20
32
20
33
20
34
20
35
20
36
20
37
20
38
20
39
20
40
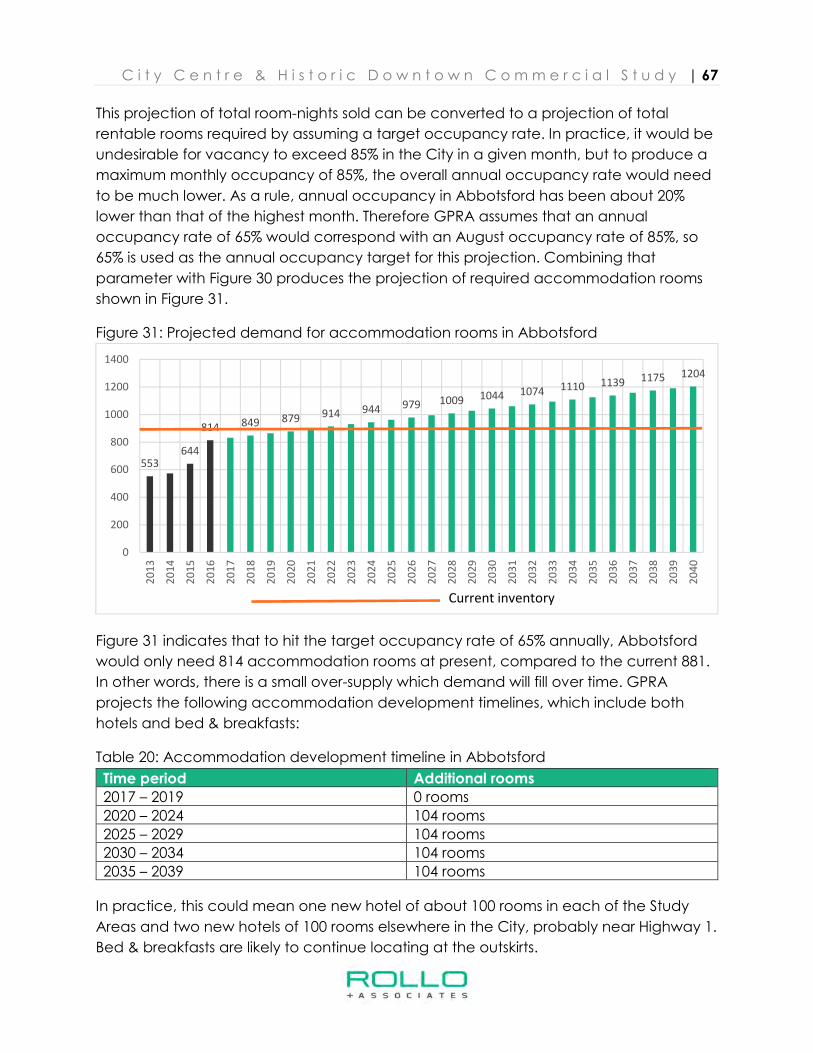
C i t y C e n t r e & H i s t o r i c D o w n t o w n C o m m e r c i a l S t u d y | 67
This projection of total room-nights sold can be converted to a projection of total
rentable rooms required by assuming a target occupancy rate. In practice, it would be
undesirable for vacancy to exceed 85% in the City in a given month, but to produce a
maximum monthly occupancy of 85%, the overall annual occupancy rate would need
to be much lower. As a rule, annual occupancy in Abbotsford has been about 20%
lower than that of the highest month. Therefore GPRA assumes that an annual
occupancy rate of 65% would correspond with an August occupancy rate of 85%, so
65% is used as the annual occupancy target for this projection. Combining that
parameter with Figure 30 produces the projection of required accommodation rooms
shown in Figure 31.
Figure 31: Projected demand for accommodation rooms in Abbotsford
Figure 31 indicates that to hit the target occupancy rate of 65% annually, Abbotsford
would only need 814 accommodation rooms at present, compared to the current 881.
In other words, there is a small over-supply which demand will fill over time. GPRA
projects the following accommodation development timelines, which include both
hotels and bed & breakfasts:
Table 20: Accommodation development timeline in Abbotsford
Time period Additional rooms
2017 – 2019 0 rooms
2020 – 2024 104 rooms
2025 – 2029 104 rooms
2030 – 2034 104 rooms
2035 – 2039 104 rooms
In practice, this could mean one new hotel of about 100 rooms in each of the Study
Areas and two new hotels of 100 rooms elsewhere in the City, probably near Highway 1.
Bed & breakfasts are likely to continue locating at the outskirts.
553644
814 849 879 914 944 979 1009 1044 1074 1110 1139 1175 1204
0
200
400
600
800
1000
1200
1400
20
13
20
14
20
15
20
16
20
17
20
18
20
19
20
20
20
21
20
22
20
23
20
24
20
25
20
26
20
27
20
28
20
29
20
30
20
31
20
32
20
33
20
34
20
35
20
36
20
37
20
38
20
39
20
40
Current inventory
C i t y C e n t r e & H i s t o r i c D o w n t o w n C o m m e r c i a l S t u d y | 68
6 Best Practices in Downtown Planning
Before discussing the best way to accommodate the additional commercial uses
projected for Abbotsford’s City Centre and Historic Downtown in Sections 3 - 5, this
Section presents four principles of town centre commercial planning that GPRA has
learned from past experience on similar projects throughout Western Canada.
For the two Study Areas to succeed in the future as commercial districts, the City must
ensure that existing businesses survive and thrive, and that complementary new
businesses are attracted. Both the City Centre and the Historic Downtown must offer
existing and prospective businesses the fundamental neighbourhood conditions that
they need to succeed. At a minimum, these include a strong customer base and a
clean, safe, and attractive commercial environment. Understanding and diagnosing
the types of improvements needed to move the Study Areas towards success is a
significant part of this research as it sets the stage for commercial tenant recruitment
and retention.
6.1 Urban Design
The first principle of town centre planning is high-quality urban design which includes:
• A general orientation prioritizing pedestrian over automobile traffic
• Compelling and interesting storefronts to attract visitors
• Convenience and accessibility, both at the building and neighbourhood scales
• Inviting public spaces such as parks and streets, including greenery, decorations,
and outdoor furniture.
In general, the Historic Downtown is a more inviting physical environment with a more
urban and walkable built form, although there is still room for improvement especially in
the areas of pedestrian safety and parking management. By comparison, the City
Centre has an automobile-oriented built form that is not conducive to mixed-use
development, pedestrianism, or public gatherings.
C i t y C e n t r e & H i s t o r i c D o w n t o w n C o m m e r c i a l S t u d y | 69
6.2 Market Dynamics
Successful town centres are typically supported by a combination of a captive local
market and inflow from regional day visitors and tourists. To achieve local market
support, downtowns must first have access to a sufficiently sized population or
employment base - preferably within close walking distance of businesses. At the same
time, minimizing the outflow of consumer expenditures made by adjacent residents and
employees requires local businesses to possess a deep understanding of the profile of
their customer, as well as the nuances of their consumer preferences (such as matching
opening hours with shopping hours).
Drawing visitors from further afield necessitates the town centre to offer compelling
reasons for customers to travel past closer, competing retail destinations. One-of-a-kind
of businesses, authentic urban experiences, or festivals and events are among the
range of drawing factors that successful downtowns leverage to attract non-local
visitors.
The final element in the market dynamics of a successful downtown is the level of local
and regional awareness of the range of goods and services available. Effective
branding and marketing can help better position a downtown as a competitive
shopping destination. By leveraging market dynamics and capturing sufficient
consumer spending to support local businesses, over the long-term successful town
centres are able to thrive and adapt to changing needs.
Abbotsford’s City Centre and Historic Downtown have different strengths and
weaknesses in terms of market positioning and branding. The City Centre has the
advantage of acting as the City’s main commercial hub, and draws spending from
across the municipality. Its retail market is strong even if its branding is poor. It supports
several large malls and many anchor tenants, but is vulnerable to competitors
elsewhere in the City. By comparison, the Historic Downtown achieves relatively low
market capture in much of Abbotsford, but has a unique identity, strong branding, and
appealing venues that bring a unique and dedicated set of tenants and customers to
the neighbourhood. The Historic Downtown might achieve better market positioning by
adding one or two anchor tenants, and both Study Areas would benefit from increased
residential density within the neighbourhood, although this is especially feasible in the
Historic Downtown.
C i t y C e n t r e & H i s t o r i c D o w n t o w n C o m m e r c i a l S t u d y | 70
6.3 Business Mix
The most important ingredients for commercial success in town centre main street
environments are the variety and quality of merchandising offered. To be successful,
the town centre must offer a sufficient selection of quality stores and services that can
attract residents to shop downtown on a regular basis. Importantly, anchor retail
tenants (such as grocery stores) play a critical role in drawing visitors and allowing them
to disperse to smaller, adjacent retailers. In town centre environments, this anchoring
role can also be performed by non-retail uses such as community centres, public
libraries, public spaces, and other institutions.
A town centre must focus on creating a merchandising mix that provides either a
unique or complementary shopping experience compared to major shopping centre
competition, or must become dominant in one or more merchandising niches
compared to other competitive shopping destinations.
Today’s consumers are sophisticated and demanding as they are accustomed to high
quality shopping experiences outside of their local community. As such, businesses must
provide contemporary merchandising, store layout, and store design. Downtown
businesses must deliver high quality goods and services, exceptional customer service,
and competitive prices. While a degree of transition in tenants enables a downtown to
shift to meet changing consumer needs, high turnover indicates unviable economic
conditions. Healthy downtowns are grounded in stable market conditions and a
merchandising offering that competitively responds to consumer demand.
Both the City Centre and Historic Downtown offer a diverse mix of business types,
catering to most consumer needs, with the possible exception of supermarkets in the
Historic Downtown, which that neighbourhood will have a shortage of within the next
ten years.

C i t y C e n t r e & H i s t o r i c D o w n t o w n C o m m e r c i a l S t u d y | 71
6.4 Consistent and Engaged Leadership
In a highly competitive retail environment, success can be difficult to achieve. Town
centres are often challenged by the diversity of their many separate stakeholder
groups, such as landlords, tenants, business associations, politicians, and planners. The
goals and objectives of these separate groups often conflict. In particular, divided land
ownership and absentee landlords are frequently a key obstacle transforming a
struggling downtown into a successful and vibrant destination.
The successful revitalization of a town centre requires a strong level of partnership and
commitment among the various stakeholders, led by the committed leadership of
individuals and organizations that can take coordinated action in responding to
competition.
GPRA’s interviews revealed no coordinated stakeholder effort in the City Centre such
as a neighbourhood business association, although notably few outright barriers to
growth were identified either. The Historic Downtown has undergone greater change
and more coordination has therefore been required, but interviews indicate that the
Abbotsford Downtown Business Association already appears to be following many best
practices in encouraging visitation to Historic Downtown, including frequent social
media outreach, an up-to-date attractive website, organizing frequent events, and
having a good online presence. City efforts to promote business success have helped
as well. Strengthening the network between the ADBA and other stakeholders such as
Tourism Abbotsford, local realtors, entrepreneurs, and land owners could help
strengthen awareness of business opportunities in the Historic Downtown.
Innovative leasing solutions can be provided by sites such as Storefront, the commercial
equivalent of Airbnb, which allow property owners to lease out temporary retail space.
Revolving pop up stores help to bring repeat visitors to the area and reduce unsightly
vacant storefronts.
Although local weather patterns may be unreliable during the winter, many cities
across Canada are choosing to embrace winter by creating strategies to bring people
together year-round, such as Edmonton’s WinterCity Strategy. Events scheduled outside
of summer would provide an injection of spending that would help balance the year for
many businesses. The November Downtown Tree Lighting Ceremony is a step in this
direction.
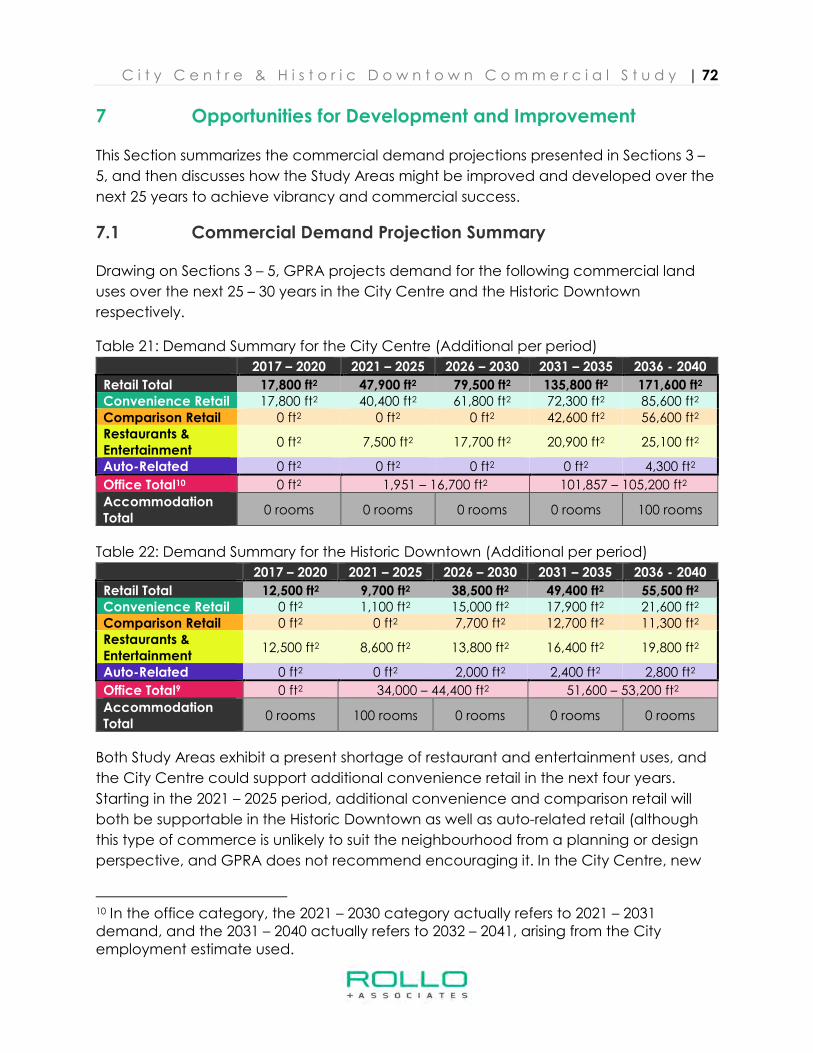
C i t y C e n t r e & H i s t o r i c D o w n t o w n C o m m e r c i a l S t u d y | 72
7 Opportunities for Development and Improvement
This Section summarizes the commercial demand projections presented in Sections 3 –
5, and then discusses how the Study Areas might be improved and developed over the
next 25 years to achieve vibrancy and commercial success.
7.1 Commercial Demand Projection Summary
Drawing on Sections 3 – 5, GPRA projects demand for the following commercial land
uses over the next 25 – 30 years in the City Centre and the Historic Downtown
respectively.
Table 21: Demand Summary for the City Centre (Additional per period)
2017 – 2020 2021 – 2025 2026 – 2030 2031 – 2035 2036 - 2040
Retail Total 17,800 ft2 47,900 ft2 79,500 ft2 135,800 ft2 171,600 ft2 Convenience Retail 17,800 ft2 40,400 ft2 61,800 ft2 72,300 ft2 85,600 ft2
Comparison Retail 0 ft2 0 ft2 0 ft2 42,600 ft2 56,600 ft2 Restaurants & Entertainment
0 ft2 7,500 ft2 17,700 ft2 20,900 ft2 25,100 ft2
Auto-Related 0 ft2 0 ft2 0 ft2 0 ft2 4,300 ft2
Office Total10 0 ft2 1,951 – 16,700 ft2 101,857 – 105,200 ft2
Accommodation Total
0 rooms 0 rooms 0 rooms 0 rooms 100 rooms
Table 22: Demand Summary for the Historic Downtown (Additional per period)
2017 – 2020 2021 – 2025 2026 – 2030 2031 – 2035 2036 - 2040
Retail Total 12,500 ft2 9,700 ft2 38,500 ft2 49,400 ft2 55,500 ft2 Convenience Retail 0 ft2 1,100 ft2 15,000 ft2 17,900 ft2 21,600 ft2 Comparison Retail 0 ft2 0 ft2 7,700 ft2 12,700 ft2 11,300 ft2 Restaurants & Entertainment
12,500 ft2 8,600 ft2 13,800 ft2 16,400 ft2 19,800 ft2
Auto-Related 0 ft2 0 ft2 2,000 ft2 2,400 ft2 2,800 ft2
Office Total9 0 ft2 34,000 – 44,400 ft2 51,600 – 53,200 ft2
Accommodation Total
0 rooms 100 rooms 0 rooms 0 rooms 0 rooms
Both Study Areas exhibit a present shortage of restaurant and entertainment uses, and
the City Centre could support additional convenience retail in the next four years.
Starting in the 2021 – 2025 period, additional convenience and comparison retail will
both be supportable in the Historic Downtown as well as auto-related retail (although
this type of commerce is unlikely to suit the neighbourhood from a planning or design
perspective, and GPRA does not recommend encouraging it. In the City Centre, new
10 In the office category, the 2021 – 2030 category actually refers to 2021 – 2031 demand, and the 2031 – 2040 actually refers to 2032 – 2041, arising from the City employment estimate used.
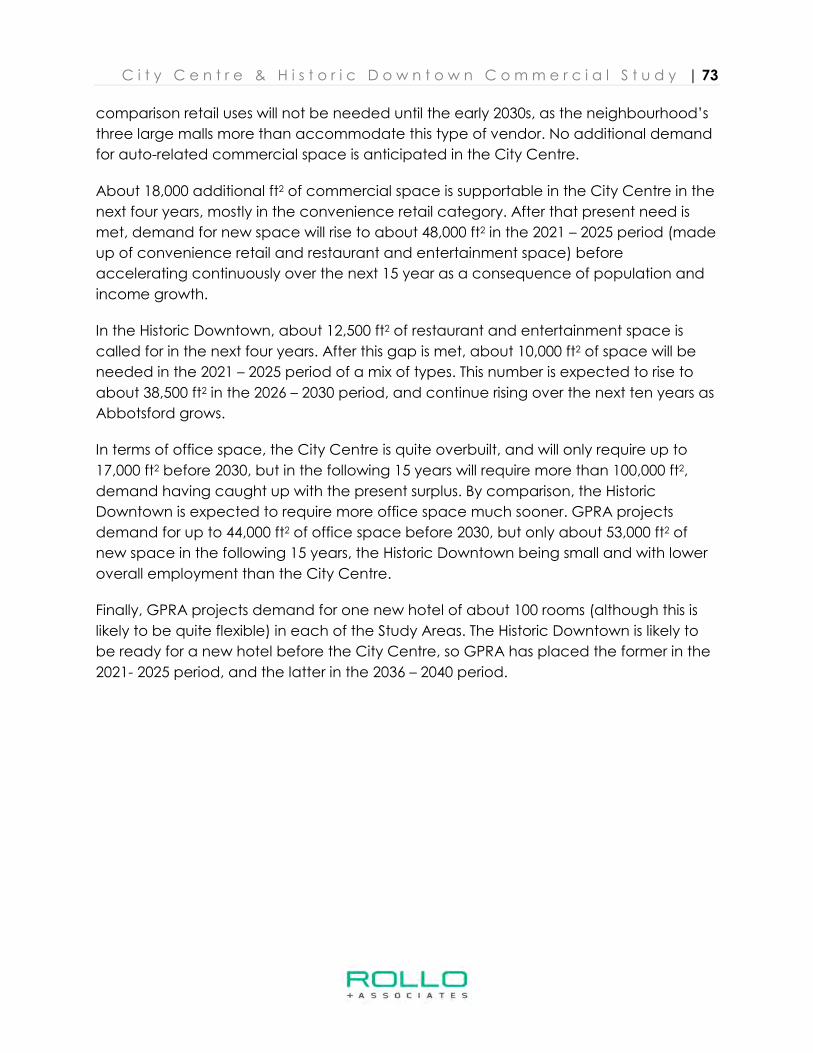
C i t y C e n t r e & H i s t o r i c D o w n t o w n C o m m e r c i a l S t u d y | 73
comparison retail uses will not be needed until the early 2030s, as the neighbourhood’s
three large malls more than accommodate this type of vendor. No additional demand
for auto-related commercial space is anticipated in the City Centre.
About 18,000 additional ft2 of commercial space is supportable in the City Centre in the
next four years, mostly in the convenience retail category. After that present need is
met, demand for new space will rise to about 48,000 ft2 in the 2021 – 2025 period (made
up of convenience retail and restaurant and entertainment space) before
accelerating continuously over the next 15 year as a consequence of population and
income growth.
In the Historic Downtown, about 12,500 ft2 of restaurant and entertainment space is
called for in the next four years. After this gap is met, about 10,000 ft2 of space will be
needed in the 2021 – 2025 period of a mix of types. This number is expected to rise to
about 38,500 ft2 in the 2026 – 2030 period, and continue rising over the next ten years as
Abbotsford grows.
In terms of office space, the City Centre is quite overbuilt, and will only require up to
17,000 ft2 before 2030, but in the following 15 years will require more than 100,000 ft2,
demand having caught up with the present surplus. By comparison, the Historic
Downtown is expected to require more office space much sooner. GPRA projects
demand for up to 44,000 ft2 of office space before 2030, but only about 53,000 ft2 of
new space in the following 15 years, the Historic Downtown being small and with lower
overall employment than the City Centre.
Finally, GPRA projects demand for one new hotel of about 100 rooms (although this is
likely to be quite flexible) in each of the Study Areas. The Historic Downtown is likely to
be ready for a new hotel before the City Centre, so GPRA has placed the former in the
2021- 2025 period, and the latter in the 2036 – 2040 period.
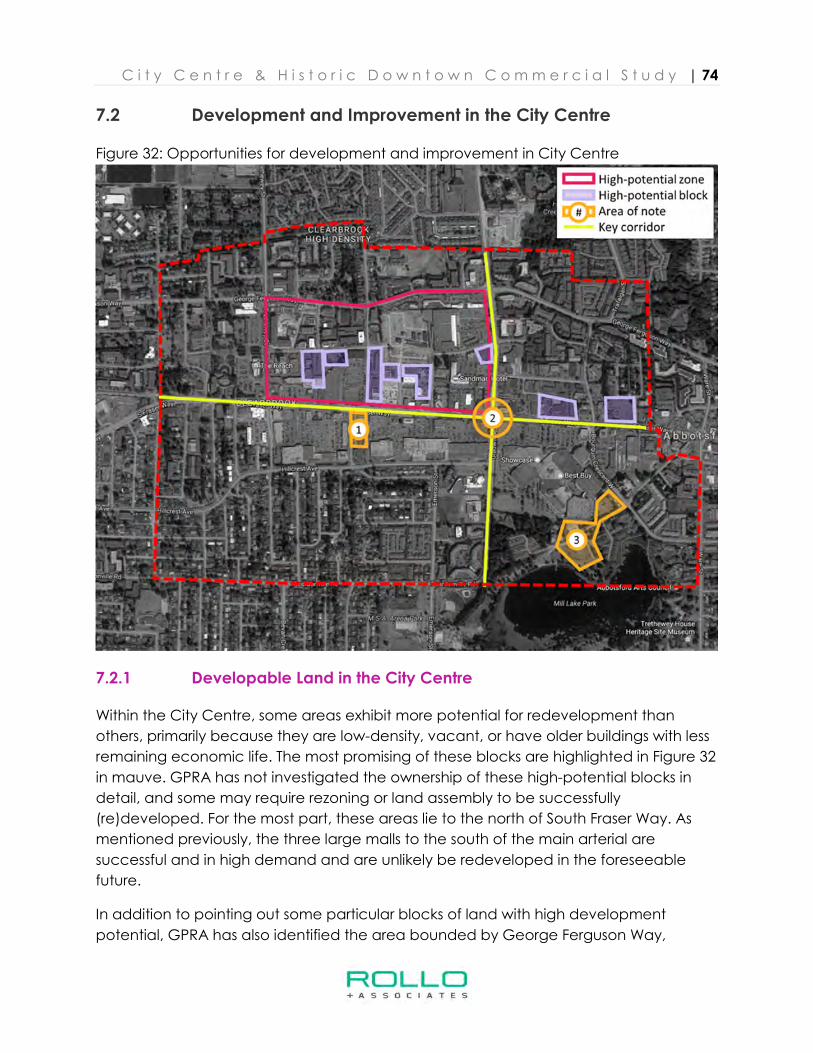
C i t y C e n t r e & H i s t o r i c D o w n t o w n C o m m e r c i a l S t u d y | 74
7.2 Development and Improvement in the City Centre
Figure 32: Opportunities for development and improvement in City Centre
7.2.1 Developable Land in the City Centre
Within the City Centre, some areas exhibit more potential for redevelopment than
others, primarily because they are low-density, vacant, or have older buildings with less
remaining economic life. The most promising of these blocks are highlighted in Figure 32
in mauve. GPRA has not investigated the ownership of these high-potential blocks in
detail, and some may require rezoning or land assembly to be successfully
(re)developed. For the most part, these areas lie to the north of South Fraser Way. As
mentioned previously, the three large malls to the south of the main arterial are
successful and in high demand and are unlikely be redeveloped in the foreseeable
future.
In addition to pointing out some particular blocks of land with high development
potential, GPRA has also identified the area bounded by George Ferguson Way,
C i t y C e n t r e & H i s t o r i c D o w n t o w n C o m m e r c i a l S t u d y | 75
Trethewey Street, South Fraser Way, and Gladwin Road (shown in magenta in Figure 32)
as a zone of generally high redevelopment potential. This area has relatively short
blocks, more urban built form, and an existing mix of office, residential, and commercial
uses. In other words, it already has many of the ingredients of a successful walkable
commercial area. With the right interventions such as residential densification and
public realm improvements, it could evolve into a successful mixed-use neighbourhood.
A renovation-focused tax incentive similar to the Historic Downtown Revitalization Tax
Exemption could be appropriate here. Since office seems to cluster in this area,
redevelopment here should include at-grade retail to give office workers increased
walkable lunch options. The City might also want to consider strategies for shortening
blocks to improve walkability, for example by connecting Garden Street with Emerson
Street between Simon Avenue and South Fraser Way.
The auto dealership on the south side of South Fraser Way (indicated as point 1 on
Figure 32) is currently successful, but this type of retail is generally incompatible with a
denser or more urban town centre concept. In the long run, this business may be drawn
to more affordable space at the Fraser Valley Auto Mall or elsewhere, which would free
up this land for a more appropriate commercial use.
7.2.2 Other Improvements in the City Centre
Unlike the Historic Downtown, the City Centre neighbourhood lacks a focal point, a
meaningful central point with good public space. The logical location for a
neighbourhood focal point would be the intersection of South Fraser Way and Gladwin
Road (indicated as point 2 in Figure 32), which presently has few distinguishing features.
It could be enhanced by improved pedestrian access, a pedestrian resting area with
trees and benches, and generally more signals that it is a meaningful location.
Streetscape improvements to South Fraser Way and Gladwin Road (shown in yellow in
Figure 32) would help make the City Centre more attractive to pedestrians and
residents, and would also contribute to the creation of a focal point at their
intersection. GPRA recommends improvements to the walking environment for
pedestrians along Fraser Way and Gladwin Road to connect the residential areas to
the north and south of the City Centre and allow residents more enjoyable access to
retail and park space. Along South Fraser Way, the City should aim to restrict pad style
development in favour of pedestrian-friendly commercial formats that in the long term
would create a more urban streetscape. More trees, timed crosswalks, and better
lighting should be introduced throughout the City Centre’s main streets.
Mill Lake Park could play a larger role in the City Centre neighbourhood. Its presence
and accessibility could be improved with better linkages between the park, transit, and
Sevenoaks Mall. This is indicated with point 3 in Figure 32.
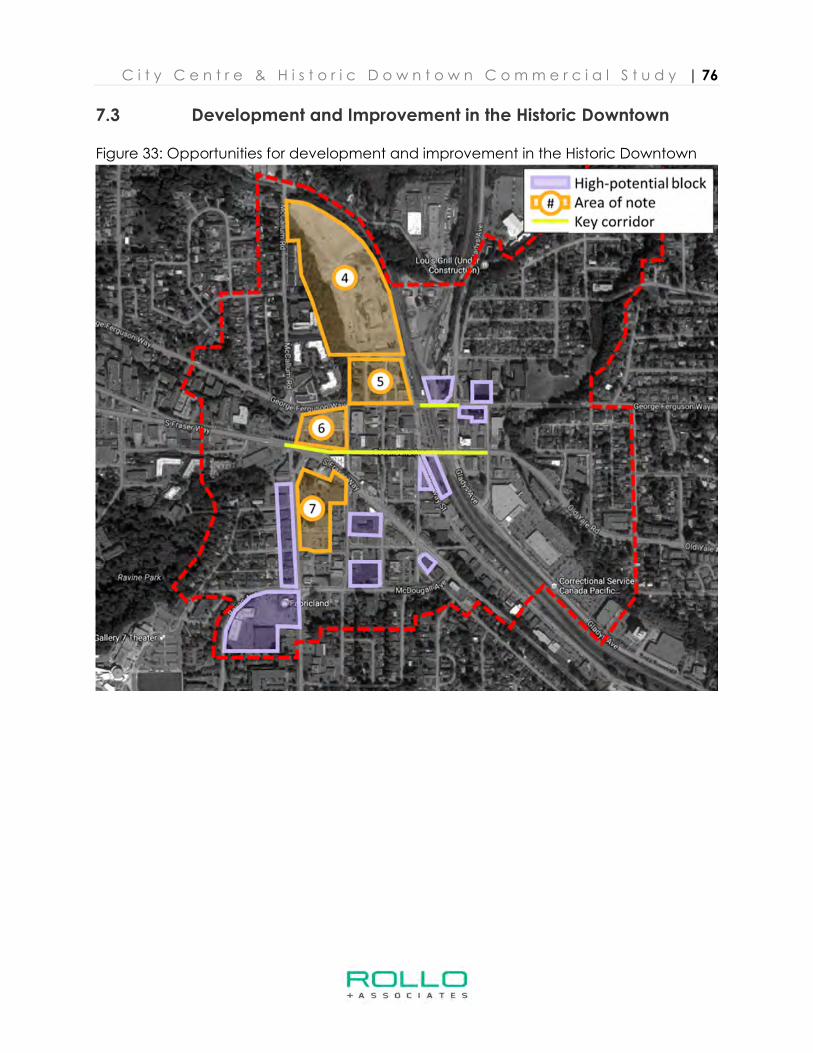
C i t y C e n t r e & H i s t o r i c D o w n t o w n C o m m e r c i a l S t u d y | 76
7.3 Development and Improvement in the Historic Downtown
Figure 33: Opportunities for development and improvement in the Historic Downtown
C i t y C e n t r e & H i s t o r i c D o w n t o w n C o m m e r c i a l S t u d y | 77
7.3.1 Developable Land in the Historic Downtown
As mentioned elsewhere, the 17 ac former Clayburn Brick Factory parcel to the north of
the Downtown Core (indicated as point 4 in Figure 33) is the most prominent piece of
developable land in the Historic Downtown. If properly developed with strong
pedestrian access, small blocks, dense zoning, and good landscaping, it could
become a valuable extension of the Historic Downtown. It is likely to be appropriate for
a mix or residential, office, and ground-floor retail uses.
In developing the Clayburn Brick Factory, the two blocks between the Clayburn Brick
Factory and the Downtown Core (the area bounded by Pine Street, West Railway
Street, George Ferguson Way, and Trinity Street, indicated as point 5 in Figure 33) would
also come under development pressure. There is some vacant land and some under-
utilized land in this area, as well as an office of the British Columbia Ministry of Social
Services and the Trinity Memorial United Church. Some of this could be preserved,
refurbished, or renovated, and some infill is likely to take place, facilitating the
integration of the Clayburn Brick Factory development with the existing Downtown
Core to create a complete urban fabric.
In addition to the Clayburn Brick Factory, GPRA has also identified a number of
locations with high (re)development potential, some of which are mentioned in Section
2.3.4. These areas, which are highlighted in mauve in Figure 33, are either vacant or
under-utilized. Their development potential varies considerably based on their different
sizes and shapes. The struggling Fabricland and Dollarama strip malls present
particularly large opportunities for mixed-use redevelopment. The latter (indicated at
point 6 in Figure 33) would make an excellent location for a supermarket anchor,
preferably one not currently found in Abbotsford. Demand might exist for such a
development in the near future.
In general, the Historic Downtown should be densified through a mix of multi-family infill
and mixed-use development. This would add “eyes on the street”, enhance
neighbourhood identity, and further create a local market for the neighbourhood’s
vendors. The Cash in Lieu of Parking policy and the Historic Downtown Revitalization Tax
Exemption are both successful interventions that encourage the right kind of
development in the area. They should be continued.
C i t y C e n t r e & H i s t o r i c D o w n t o w n C o m m e r c i a l S t u d y | 78
7.3.2 Other Improvements in the Historic Downtown
Although the Historic Downtown is comparatively walkable for Abbotsford, there are a
few improvements to the pedestrian realm that would have a positive impact:
• Easier pedestrian connections across the rail line, both at George Ferguson Way
and Essendene Avenue (shown in yellow in Figure 33), which would help to
activate the eastern side of the Historic Downtown and encourage residential
and commercial development there
• Some stakeholders identified Essendene Avenue as a challenging location,
because it passes right through the Downtown Core but has the width, traffic
volume, and traffic speeds of an arterial road. The Avenue is therefore poorly
designed for pedestrians and feels unsafe as a consequence. A “road diet” to
calm traffic might address this issue
• The pedestrian accessibility of Essendene Avenue would also be enhanced by
improved transit, the introduction of parklets, and better wayfinding
• The large intersection of South Fraser Way, Essendene Avenue, and McCallum
Road could be significantly improved for pedestrians, and transformed into a
meaningful gateway to the Downtown Core
• The area around Jubilee Park (indicated at point 7 in Figure 33) is struggling,
primarily due to safety and security concerns. The City’s parking strategy would
work better if more visitors were willing to park at the City-owned lot and walk to
the Downtown Core. Security concerns in the area around Jubilee Park
discourage both parking and walking, especially at night. Interventions could
include improved lighting, improved design of the park to create more visibility
and better sight-lines, demolition and redesign of the Park’s buildings to create
fewer enclosed spaces and “blind corners”, and putting more “eyes on the
street” through development of more housing in the area
• Supportability or demand for civic uses is not within the study scope, but civic
amenities such as libraries, community centres, leisure centres, and theatres help
encourage foot traffic and visitation from surrounding communities and give
residents places to gather and linger, translating to increased spending potential
for surrounding businesses
• It may be worthwhile to create more vacancy among street parking stalls in the
Downtown Core, but the only viable way to do this is to introduce metered
parking, which may prove to be a challenge
C i t y C e n t r e & H i s t o r i c D o w n t o w n C o m m e r c i a l S t u d y | 79
7.4 Policy Outside of Study Areas
Although addressing future supportable retail outside of the Historic Downtown and the
City Centre is outside of this report’s scope, it is important to acknowledge that
development outside of the Study Area can profoundly affect the vitality of retail in the
City Centre and the Historic Downtown.
While Abbotsford has limited influence on many internal and external growth factors,
the City does have the power to restrict major new retail projects outside of the Study
Areas and concentrate future development around existing retail nodes. This report
acknowledges that a number of convenience-oriented retail nodes will likely be
necessary as Abbotsford’s population grows over the next 25 years, but if the City
wishes to strengthen existing retail centres such as the Historic Downtown and the City
Centre it is important not to dilute the competitive landscape with power centres and
shopping centres that draw consumer spending.
Decisions to limit comparison big box & shopping centre development may be fiscally
painful in the short-term but will promote long term vitality of the Study Areas.
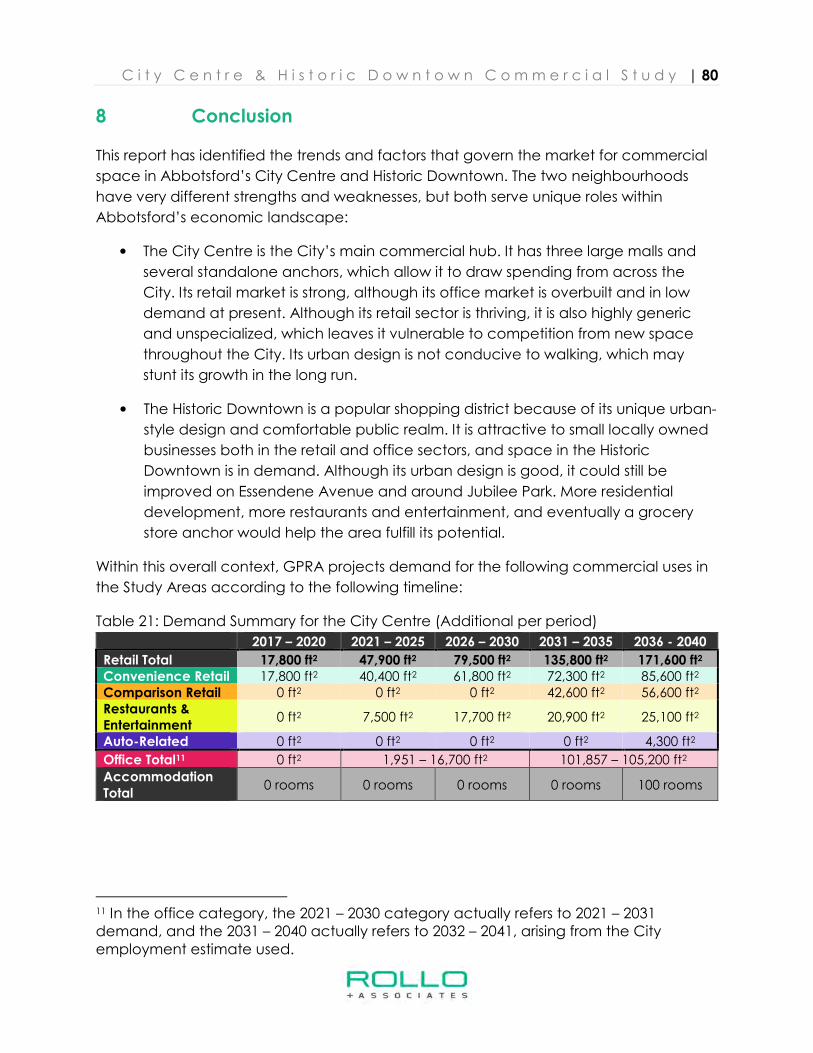
C i t y C e n t r e & H i s t o r i c D o w n t o w n C o m m e r c i a l S t u d y | 80
8 Conclusion
This report has identified the trends and factors that govern the market for commercial
space in Abbotsford’s City Centre and Historic Downtown. The two neighbourhoods
have very different strengths and weaknesses, but both serve unique roles within
Abbotsford’s economic landscape:
• The City Centre is the City’s main commercial hub. It has three large malls and
several standalone anchors, which allow it to draw spending from across the
City. Its retail market is strong, although its office market is overbuilt and in low
demand at present. Although its retail sector is thriving, it is also highly generic
and unspecialized, which leaves it vulnerable to competition from new space
throughout the City. Its urban design is not conducive to walking, which may
stunt its growth in the long run.
• The Historic Downtown is a popular shopping district because of its unique urban-
style design and comfortable public realm. It is attractive to small locally owned
businesses both in the retail and office sectors, and space in the Historic
Downtown is in demand. Although its urban design is good, it could still be
improved on Essendene Avenue and around Jubilee Park. More residential
development, more restaurants and entertainment, and eventually a grocery
store anchor would help the area fulfill its potential.
Within this overall context, GPRA projects demand for the following commercial uses in
the Study Areas according to the following timeline:
Table 21: Demand Summary for the City Centre (Additional per period)
2017 – 2020 2021 – 2025 2026 – 2030 2031 – 2035 2036 - 2040
Retail Total 17,800 ft2 47,900 ft2 79,500 ft2 135,800 ft2 171,600 ft2 Convenience Retail 17,800 ft2 40,400 ft2 61,800 ft2 72,300 ft2 85,600 ft2 Comparison Retail 0 ft2 0 ft2 0 ft2 42,600 ft2 56,600 ft2 Restaurants & Entertainment
0 ft2 7,500 ft2 17,700 ft2 20,900 ft2 25,100 ft2
Auto-Related 0 ft2 0 ft2 0 ft2 0 ft2 4,300 ft2
Office Total11 0 ft2 1,951 – 16,700 ft2 101,857 – 105,200 ft2
Accommodation Total
0 rooms 0 rooms 0 rooms 0 rooms 100 rooms
11 In the office category, the 2021 – 2030 category actually refers to 2021 – 2031 demand, and the 2031 – 2040 actually refers to 2032 – 2041, arising from the City employment estimate used.
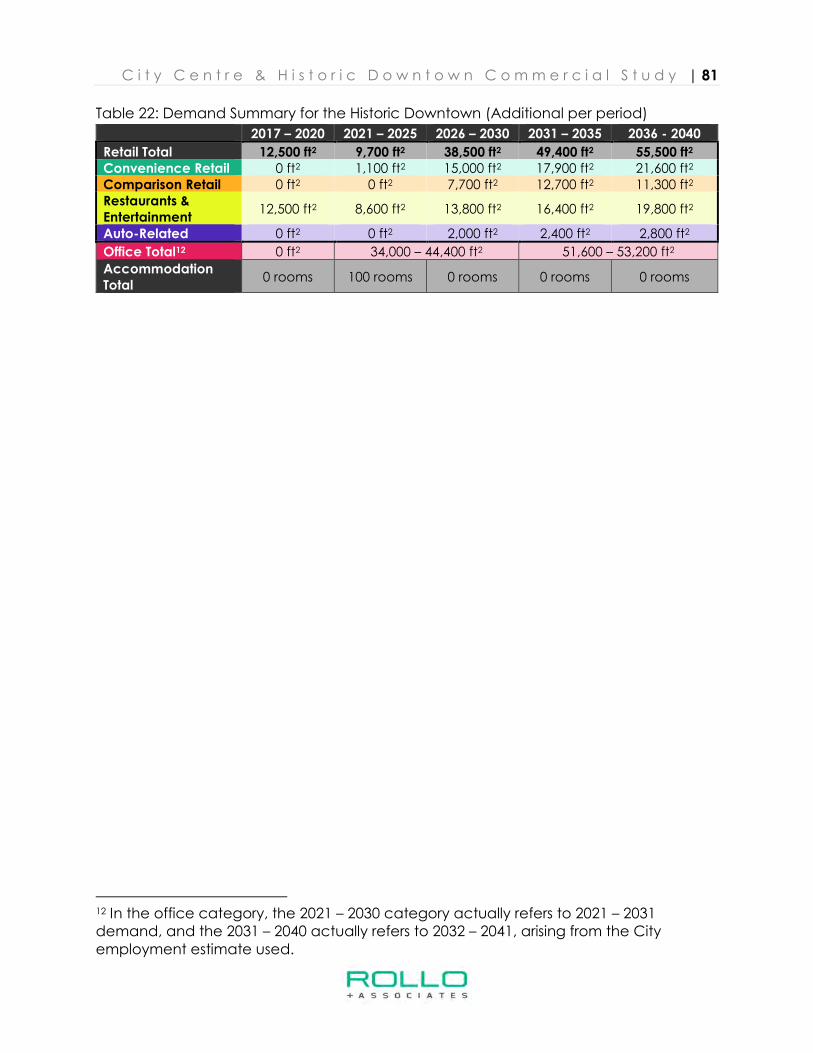
C i t y C e n t r e & H i s t o r i c D o w n t o w n C o m m e r c i a l S t u d y | 81
Table 22: Demand Summary for the Historic Downtown (Additional per period)
2017 – 2020 2021 – 2025 2026 – 2030 2031 – 2035 2036 - 2040
Retail Total 12,500 ft2 9,700 ft2 38,500 ft2 49,400 ft2 55,500 ft2 Convenience Retail 0 ft2 1,100 ft2 15,000 ft2 17,900 ft2 21,600 ft2 Comparison Retail 0 ft2 0 ft2 7,700 ft2 12,700 ft2 11,300 ft2 Restaurants & Entertainment
12,500 ft2 8,600 ft2 13,800 ft2 16,400 ft2 19,800 ft2
Auto-Related 0 ft2 0 ft2 2,000 ft2 2,400 ft2 2,800 ft2
Office Total12 0 ft2 34,000 – 44,400 ft2 51,600 – 53,200 ft2
Accommodation Total
0 rooms 100 rooms 0 rooms 0 rooms 0 rooms
12 In the office category, the 2021 – 2030 category actually refers to 2021 – 2031 demand, and the 2031 – 2040 actually refers to 2032 – 2041, arising from the City employment estimate used.