Embed Size (px)
Citation preview
ab136949 – PGE2 ELISA Kit (Fluorescent)
Instructions for Use
For fluorescent and quantitative determination of PGE2 in cell supernatants.
This product is for research use only and is not intended for diagnostic use.

1
Table of Contents
1. Introduction 3
2. Principle of the Assay 4
3. Assay Summary 5
4. Kit Contents 5
5. Storage and Handling 6
6. Additional Materials Required 6
7. Protocol 7
8. Calculation of Results 10
9. Performance Characteristics 13
10. Troubleshooting 20
2

1. Introduction
ab136949 is a complete kit for the quantitative determination of
PGE2 in buffers and culture media. Please read the entire kit insert
before performing this assay.
Prostaglandin E2 (PGE2) is formed in a variety of cells from PGH2,
which itself is synthesized from arachidonic acid by the enzyme
prostaglandin synthetas. PGE2 has been shown to have a number of
biological actions, including vasodilation, both anti and
proinflammatory action, modulation of sleep/wake cycles, and
facilitation of the replication of human immunodeficiency virus. It
elevates cAMP levels, stimulates bone resorption, and has
thermoregulatory effects. It has been shown to be a regulator of
sodium excretion and renal hemodynamics.
3
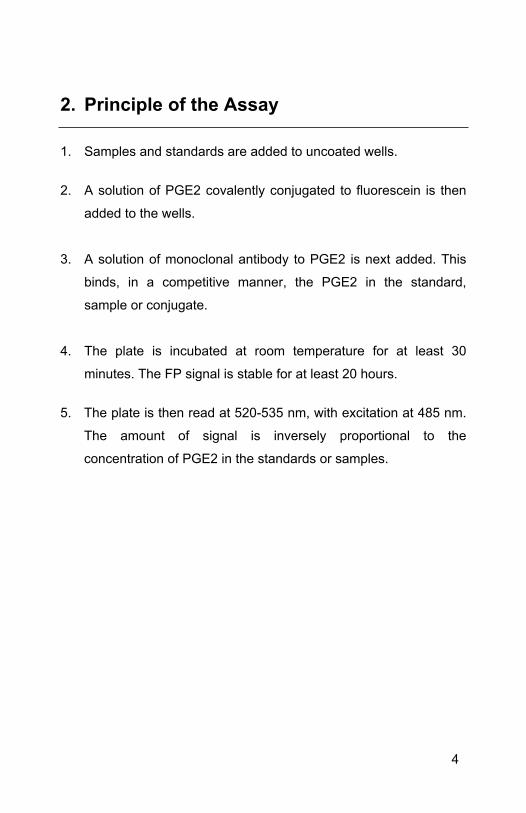
2. Principle of the Assay
1. Samples and standards are added to uncoated wells.
2. A solution of PGE2 covalently conjugated to fluorescein is then
added to the wells.
3. A solution of monoclonal antibody to PGE2 is next added. This
binds, in a competitive manner, the PGE2 in the standard,
sample or conjugate.
4. The plate is incubated at room temperature for at least 30
minutes. The FP signal is stable for at least 20 hours.
5. The plate is then read at 520-535 nm, with excitation at 485 nm.
The amount of signal is inversely proportional to the
concentration of PGE2 in the standards or samples.
4
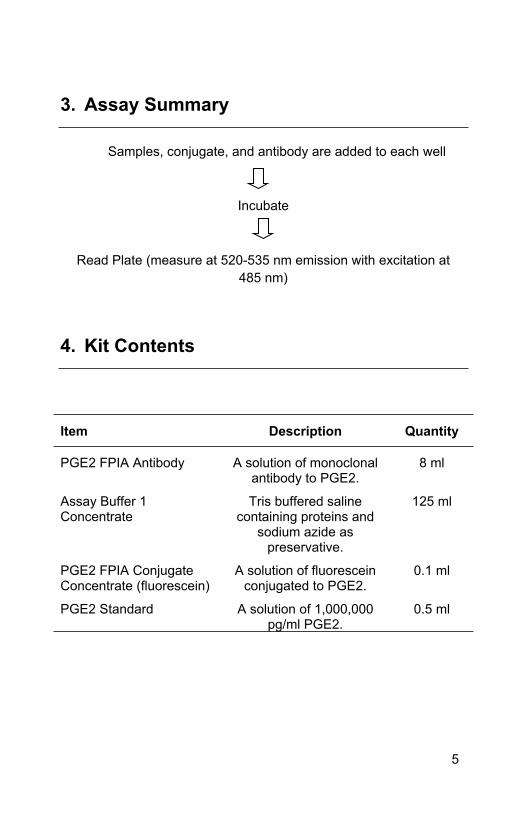
3. Assay Summary
Samples, conjugate, and antibody are added to each well
Incubate
Read Plate (measure at 520-535 nm emission with excitation at 485 nm)
4. Kit Contents
Item Description Quantity
PGE2 FPIA Antibody A solution of monoclonal antibody to PGE2.
8 ml
Assay Buffer 1 Concentrate
Tris buffered saline containing proteins and
sodium azide as preservative.
125 ml
PGE2 FPIA Conjugate Concentrate (fluorescein)
A solution of fluorescein conjugated to PGE2.
0.1 ml
PGE2 Standard A solution of 1,000,000 pg/ml PGE2.
0.5 ml
5
5. Storage and Handling
All components of this kit, except the PGE2 FPIA Conjugate
Concentrate and PGE2 Standard, are stable at 4°C. The PGE2 FPIA
Conjugate Concentrate (fluorescein) and PGE2 Standard must be
stored at -20°C.
6. Additional Materials Required
Solid black uncoated low-binding microtiter plate.
Foil microtiter plate sealer.
Fluorescence polarization detector capable of reading
emissions at 520-535 nm, with excitation at 485 nm.
6
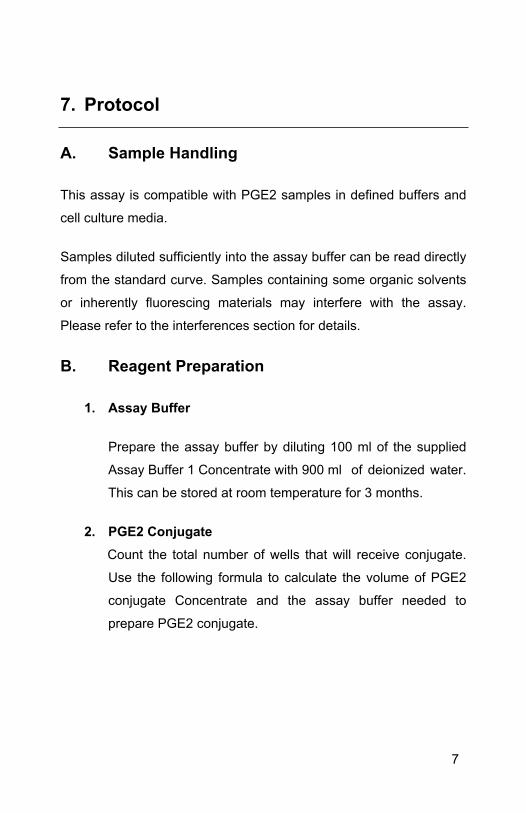
7. Protocol
A. Sample Handling
This assay is compatible with PGE2 samples in defined buffers and
cell culture media.
Samples diluted sufficiently into the assay buffer can be read directly
from the standard curve. Samples containing some organic solvents
or inherently fluorescing materials may interfere with the assay.
Please refer to the interferences section for details.
B. Reagent Preparation
1. Assay Buffer
Prepare the assay buffer by diluting 100 ml of the supplied
Assay Buffer 1 Concentrate with 900 ml of deionized water.
This can be stored at room temperature for 3 months.
2. PGE2 ConjugateCount the total number of wells that will receive conjugate.
Use the following formula to calculate the volume of PGE2
conjugate Concentrate and the assay buffer needed to
prepare PGE2 conjugate.
7
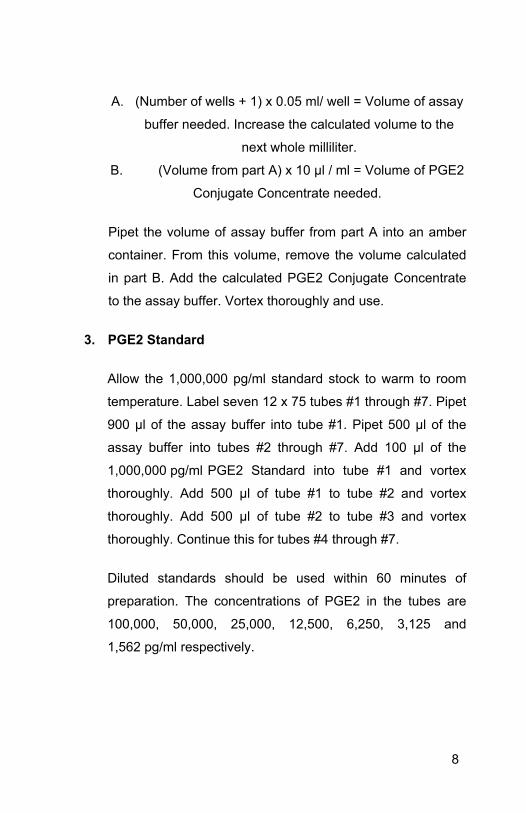
A. (Number of wells + 1) x 0.05 ml/ well = Volume of assay
buffer needed. Increase the calculated volume to the
next whole milliliter.
B. (Volume from part A) x 10 µl / ml = Volume of PGE2
Conjugate Concentrate needed.
Pipet the volume of assay buffer from part A into an amber
container. From this volume, remove the volume calculated
in part B. Add the calculated PGE2 Conjugate Concentrate
to the assay buffer. Vortex thoroughly and use.
3. PGE2 Standard
Allow the 1,000,000 pg/ml standard stock to warm to room
temperature. Label seven 12 x 75 tubes #1 through #7. Pipet
900 µl of the assay buffer into tube #1. Pipet 500 µl of the
assay buffer into tubes #2 through #7. Add 100 µl of the
1,000,000 pg/ml PGE2 Standard into tube #1 and vortex
thoroughly. Add 500 µl of tube #1 to tube #2 and vortex
thoroughly. Add 500 µl of tube #2 to tube #3 and vortex
thoroughly. Continue this for tubes #4 through #7.
Diluted standards should be used within 60 minutes of
preparation. The concentrations of PGE2 in the tubes are
100,000, 50,000, 25,000, 12,500, 6,250, 3,125 and
1,562 pg/ml respectively.
8
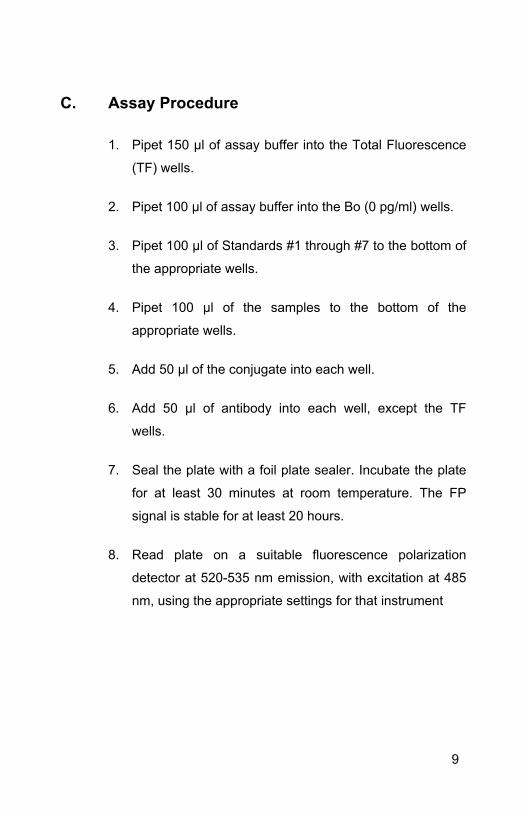
C. Assay Procedure
1. Pipet 150 µl of assay buffer into the Total Fluorescence
(TF) wells.
2. Pipet 100 µl of assay buffer into the Bo (0 pg/ml) wells.
3. Pipet 100 µl of Standards #1 through #7 to the bottom of
the appropriate wells.
4. Pipet 100 µl of the samples to the bottom of the
appropriate wells.
5. Add 50 µl of the conjugate into each well.
6. Add 50 µl of antibody into each well, except the TF
wells.
7. Seal the plate with a foil plate sealer. Incubate the plate
for at least 30 minutes at room temperature. The FP
signal is stable for at least 20 hours.
8. Read plate on a suitable fluorescence polarization
detector at 520-535 nm emission, with excitation at 485
nm, using the appropriate settings for that instrument
9
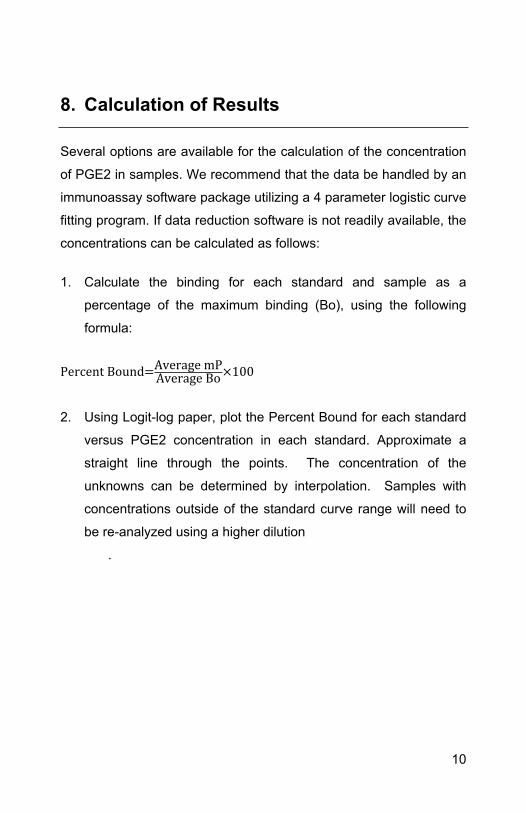
8. Calculation of Results
Several options are available for the calculation of the concentration
of PGE2 in samples. We recommend that the data be handled by an
immunoassay software package utilizing a 4 parameter logistic curve
fitting program. If data reduction software is not readily available, the
concentrations can be calculated as follows:
1. Calculate the binding for each standard and sample as a
percentage of the maximum binding (Bo), using the following
formula:
Percent Bound=Average mPAverage Bo ×100
2. Using Logit-log paper, plot the Percent Bound for each standard
versus PGE2 concentration in each standard. Approximate a
straight line through the points. The concentration of the
unknowns can be determined by interpolation. Samples with
concentrations outside of the standard curve range will need to
be re-analyzed using a higher dilution
.
10
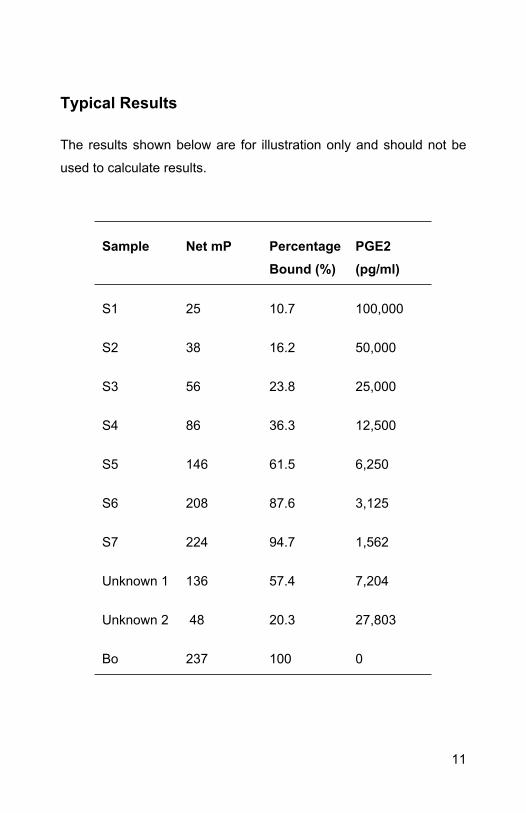
Typical Results
The results shown below are for illustration only and should not be
used to calculate results.
Sample Net mP Percentage Bound (%)
PGE2 (pg/ml)
S1 25 10.7 100,000
S2 38 16.2 50,000
S3 56 23.8 25,000
S4 86 36.3 12,500
S5 146 61.5 6,250
S6 208 87.6 3,125
S7 224 94.7 1,562
Unknown 1 136 57.4 7,204
Unknown 2 48 20.3 27,803
Bo 237 100 0
11

12
9. Performance Characteristics
A. Specificity
The cross reactivities for a number of related compounds were
determined by diluting the compounds in the kit assay buffer at
concentrations from 1,000,000 to1,000 pg/ml. These samples
were then measured in the PGE2 FPIA kit, and the measured
PGE2 concentration at 50% B/Bo calculated. The % cross
reactivity was calculated by comparison with the actual
concentration of the cross reactant in the sample and expressed
as a percentage.
13
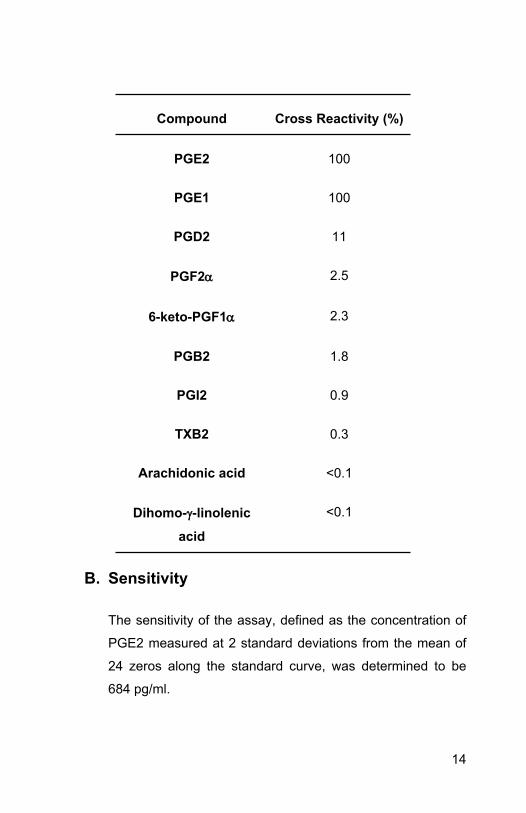
Compound Cross Reactivity (%)
PGE2 100
PGE1 100
PGD2 11
PGF2 2.5
6-keto-PGF1 2.3
PGB2 1.8
PGI2 0.9
TXB2 0.3
Arachidonic acid <0.1
Dihomo--linolenic
acid
<0.1
B. Sensitivity
The sensitivity of the assay, defined as the concentration of
PGE2 measured at 2 standard deviations from the mean of
24 zeros along the standard curve, was determined to be
684 pg/ml.
14
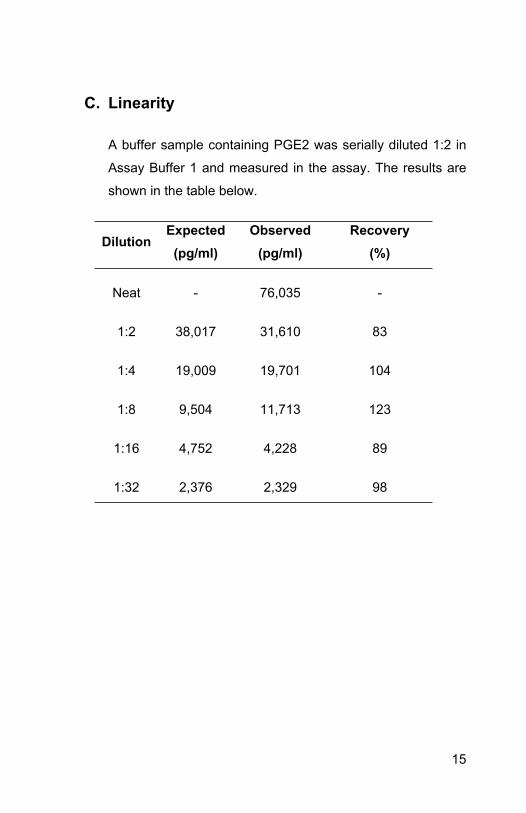
C. Linearity
A buffer sample containing PGE2 was serially diluted 1:2 in
Assay Buffer 1 and measured in the assay. The results are
shown in the table below.
DilutionExpected
(pg/ml)Observed
(pg/ml)Recovery
(%)
Neat - 76,035 -
1:2 38,017 31,610 83
1:4 19,009 19,701 104
1:8 9,504 11,713 123
1:16 4,752 4,228 89
1:32 2,376 2,329 98
15
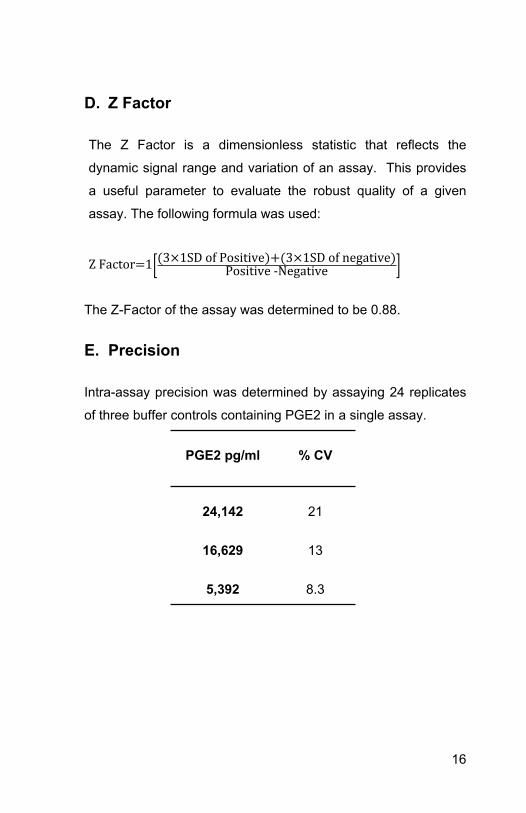
D. Z Factor
The Z Factor is a dimensionless statistic that reflects the
dynamic signal range and variation of an assay. This provides
a useful parameter to evaluate the robust quality of a given
assay. The following formula was used:
Z Factor=1[(3×1SD of Positive)+(3×1SD of negative)Positive -Negative ]
The Z-Factor of the assay was determined to be 0.88.
E. Precision
Intra-assay precision was determined by assaying 24 replicates
of three buffer controls containing PGE2 in a single assay.
PGE2 pg/ml % CV
24,142 21
16,629 13
5,392 8.3
16
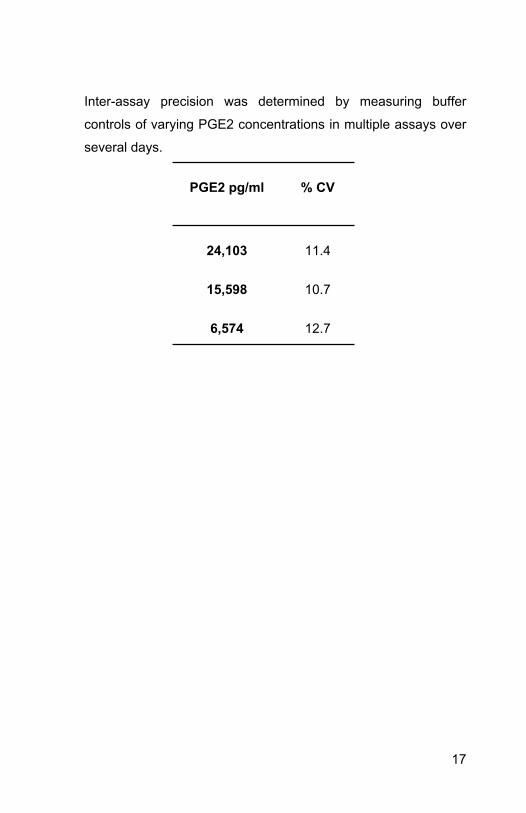
Inter-assay precision was determined by measuring buffer
controls of varying PGE2 concentrations in multiple assays over
several days.
PGE2 pg/ml % CV
24,103 11.4
15,598 10.7
6,574 12.7
17
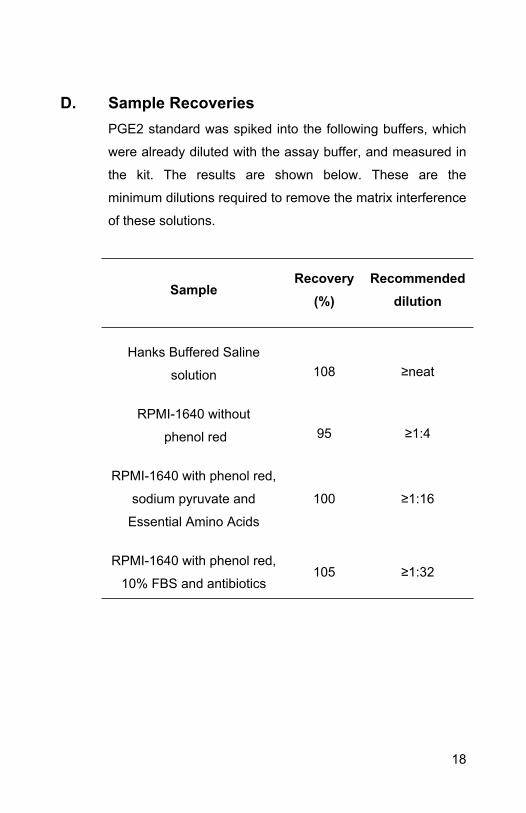
D. Sample RecoveriesPGE2 standard was spiked into the following buffers, which
were already diluted with the assay buffer, and measured in
the kit. The results are shown below. These are the
minimum dilutions required to remove the matrix interference
of these solutions.
SampleRecovery
(%)Recommended
dilution
Hanks Buffered Saline
solution 108 ≥neat
RPMI-1640 without
phenol red 95 ≥1:4
RPMI-1640 with phenol red,
sodium pyruvate and
Essential Amino Acids
100 ≥1:16
RPMI-1640 with phenol red,
10% FBS and antibiotics105 ≥1:32
18
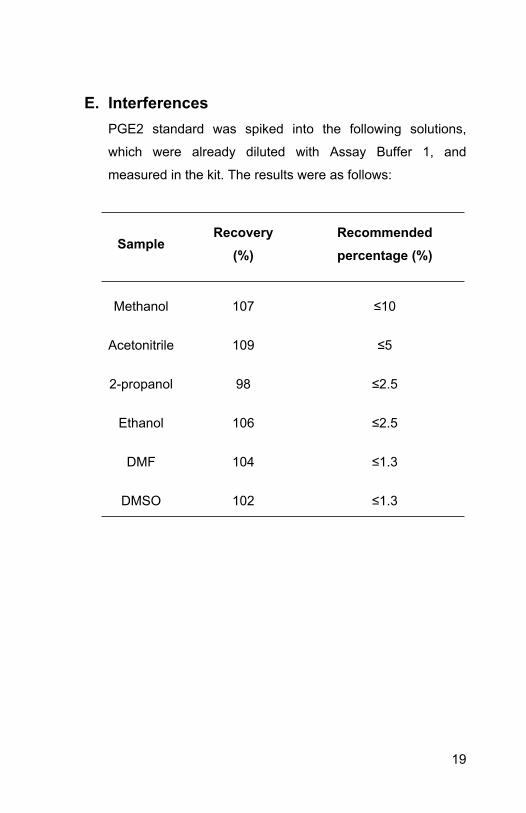
E. InterferencesPGE2 standard was spiked into the following solutions,
which were already diluted with Assay Buffer 1, and
measured in the kit. The results were as follows:
SampleRecovery
(%)Recommended percentage (%)
Methanol 107 ≤10
Acetonitrile 109 ≤5
2-propanol 98 ≤2.5
Ethanol 106 ≤2.5
DMF 104 ≤1.3
DMSO 102 ≤1.3
19
10. Troubleshooting
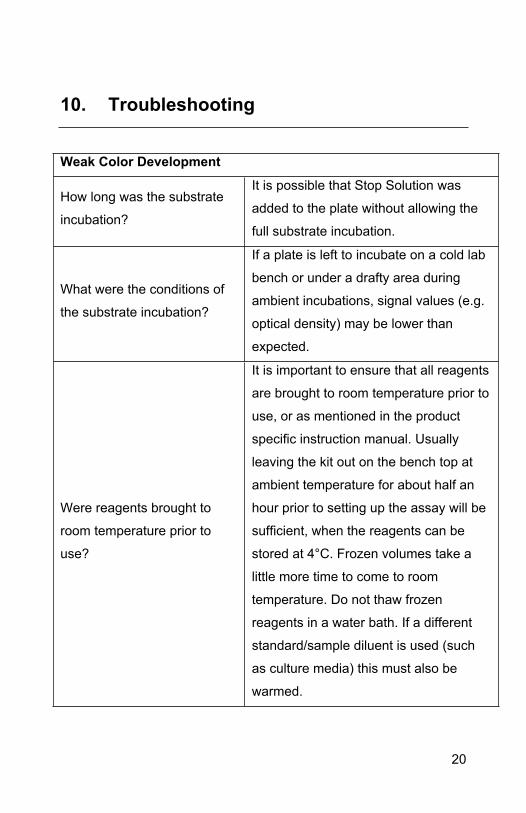
Weak Color Development
How long was the substrate
incubation?
It is possible that Stop Solution was
added to the plate without allowing the
full substrate incubation.
What were the conditions of
the substrate incubation?
If a plate is left to incubate on a cold lab
bench or under a drafty area during
ambient incubations, signal values (e.g.
optical density) may be lower than
expected.
Were reagents brought to
room temperature prior to
use?
It is important to ensure that all reagents
are brought to room temperature prior to
use, or as mentioned in the product
specific instruction manual. Usually
leaving the kit out on the bench top at
ambient temperature for about half an
hour prior to setting up the assay will be
sufficient, when the reagents can be
stored at 4°C. Frozen volumes take a
little more time to come to room
temperature. Do not thaw frozen
reagents in a water bath. If a different
standard/sample diluent is used (such
as culture media) this must also be
warmed.
20
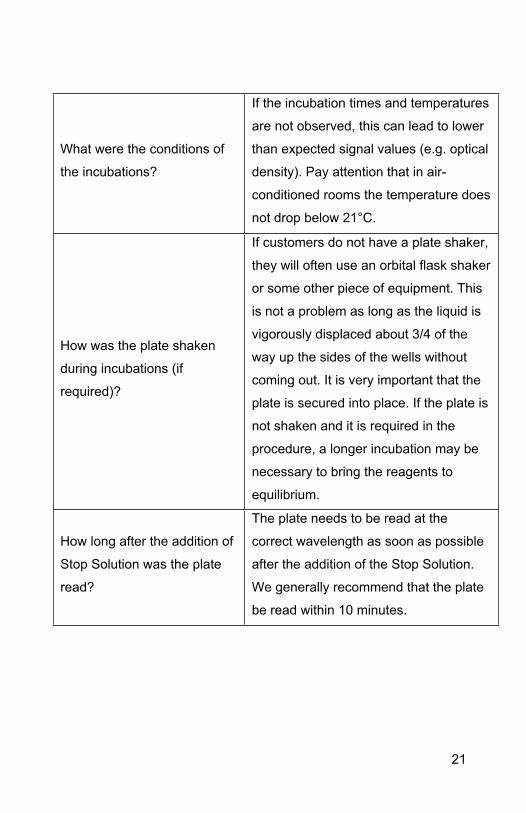
What were the conditions of
the incubations?
If the incubation times and temperatures
are not observed, this can lead to lower
than expected signal values (e.g. optical
density). Pay attention that in air-
conditioned rooms the temperature does
not drop below 21°C.
How was the plate shaken
during incubations (if
required)?
If customers do not have a plate shaker,
they will often use an orbital flask shaker
or some other piece of equipment. This
is not a problem as long as the liquid is
vigorously displaced about 3/4 of the
way up the sides of the wells without
coming out. It is very important that the
plate is secured into place. If the plate is
not shaken and it is required in the
procedure, a longer incubation may be
necessary to bring the reagents to
equilibrium.
How long after the addition of
Stop Solution was the plate
read?
The plate needs to be read at the
correct wavelength as soon as possible
after the addition of the Stop Solution.
We generally recommend that the plate
be read within 10 minutes.
21
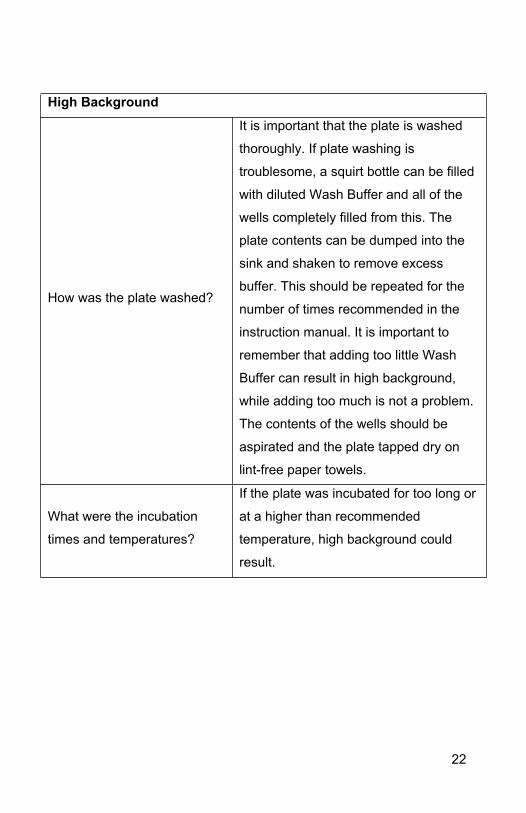
High Background
How was the plate washed?
It is important that the plate is washed
thoroughly. If plate washing is
troublesome, a squirt bottle can be filled
with diluted Wash Buffer and all of the
wells completely filled from this. The
plate contents can be dumped into the
sink and shaken to remove excess
buffer. This should be repeated for the
number of times recommended in the
instruction manual. It is important to
remember that adding too little Wash
Buffer can result in high background,
while adding too much is not a problem.
The contents of the wells should be
aspirated and the plate tapped dry on
lint-free paper towels.
What were the incubation
times and temperatures?
If the plate was incubated for too long or
at a higher than recommended
temperature, high background could
result.
22
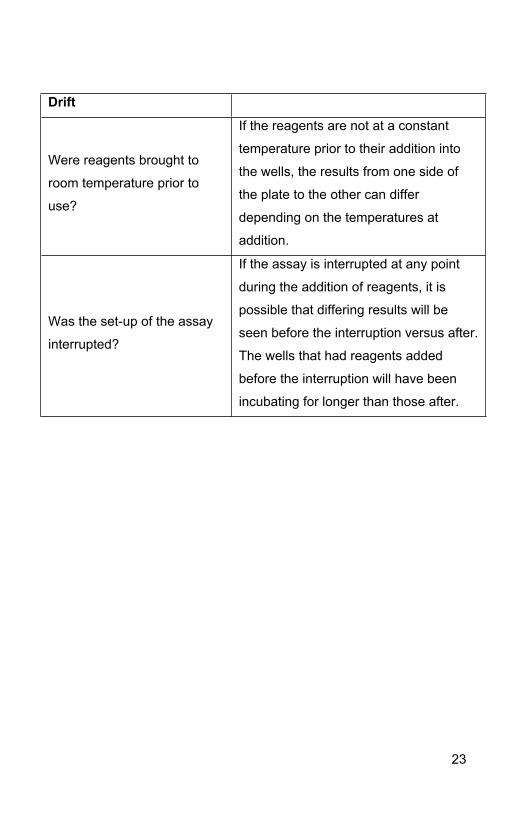
Drift
Were reagents brought to
room temperature prior to
use?
If the reagents are not at a constant
temperature prior to their addition into
the wells, the results from one side of
the plate to the other can differ
depending on the temperatures at
addition.
Was the set-up of the assay
interrupted?
If the assay is interrupted at any point
during the addition of reagents, it is
possible that differing results will be
seen before the interruption versus after.
The wells that had reagents added
before the interruption will have been
incubating for longer than those after.
23
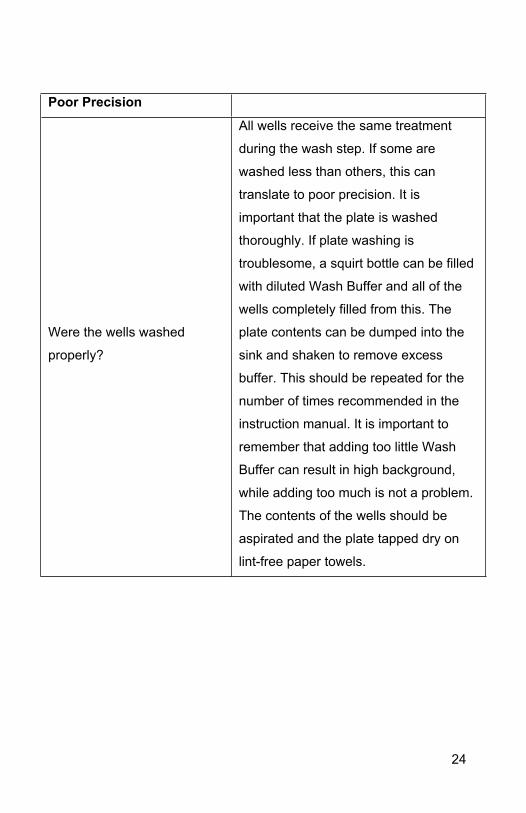
Poor Precision
Were the wells washed
properly?
All wells receive the same treatment
during the wash step. If some are
washed less than others, this can
translate to poor precision. It is
important that the plate is washed
thoroughly. If plate washing is
troublesome, a squirt bottle can be filled
with diluted Wash Buffer and all of the
wells completely filled from this. The
plate contents can be dumped into the
sink and shaken to remove excess
buffer. This should be repeated for the
number of times recommended in the
instruction manual. It is important to
remember that adding too little Wash
Buffer can result in high background,
while adding too much is not a problem.
The contents of the wells should be
aspirated and the plate tapped dry on
lint-free paper towels.
24
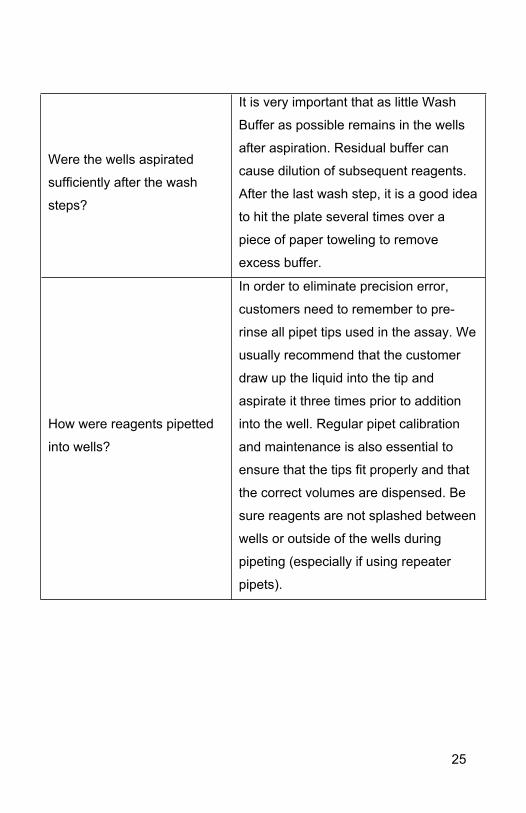
Were the wells aspirated
sufficiently after the wash
steps?
It is very important that as little Wash
Buffer as possible remains in the wells
after aspiration. Residual buffer can
cause dilution of subsequent reagents.
After the last wash step, it is a good idea
to hit the plate several times over a
piece of paper toweling to remove
excess buffer.
How were reagents pipetted
into wells?
In order to eliminate precision error,
customers need to remember to pre-
rinse all pipet tips used in the assay. We
usually recommend that the customer
draw up the liquid into the tip and
aspirate it three times prior to addition
into the well. Regular pipet calibration
and maintenance is also essential to
ensure that the tips fit properly and that
the correct volumes are dispensed. Be
sure reagents are not splashed between
wells or outside of the wells during
pipeting (especially if using repeater
pipets).
25
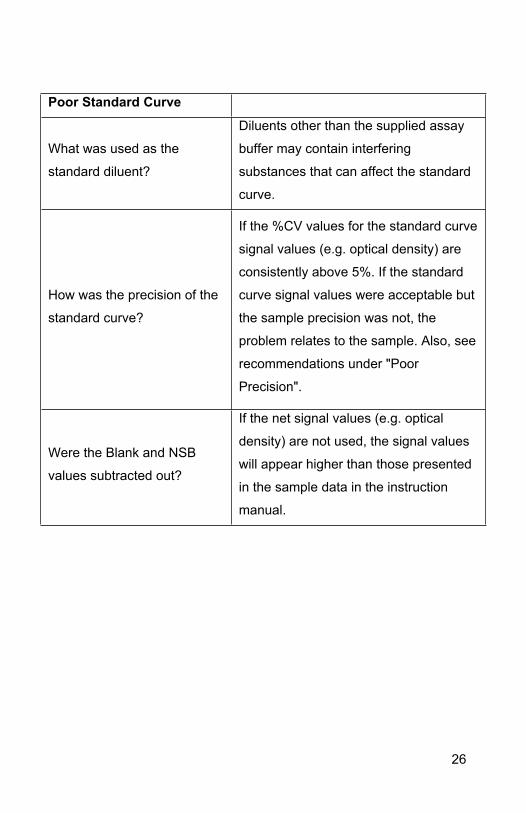
Poor Standard Curve
What was used as the
standard diluent?
Diluents other than the supplied assay
buffer may contain interfering
substances that can affect the standard
curve.
How was the precision of the
standard curve?
If the %CV values for the standard curve
signal values (e.g. optical density) are
consistently above 5%. If the standard
curve signal values were acceptable but
the sample precision was not, the
problem relates to the sample. Also, see
recommendations under "Poor
Precision".
Were the Blank and NSB
values subtracted out?
If the net signal values (e.g. optical
density) are not used, the signal values
will appear higher than those presented
in the sample data in the instruction
manual.
26
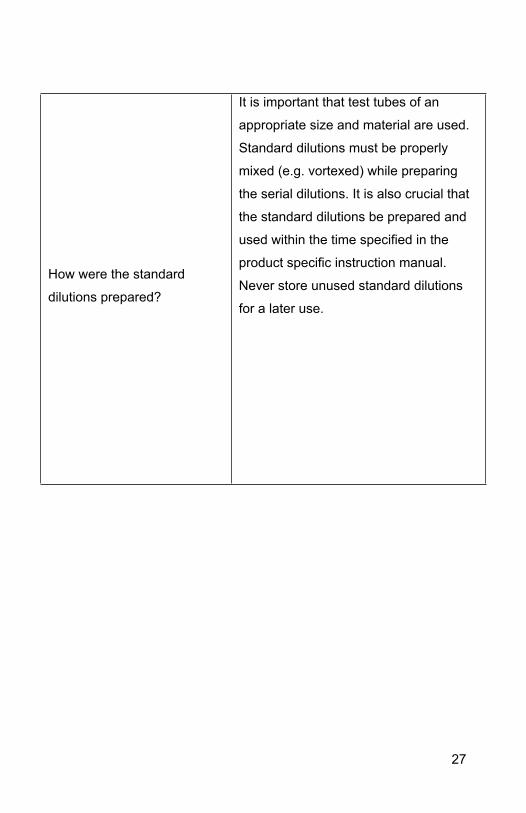
How were the standard
dilutions prepared?
It is important that test tubes of an
appropriate size and material are used.
Standard dilutions must be properly
mixed (e.g. vortexed) while preparing
the serial dilutions. It is also crucial that
the standard dilutions be prepared and
used within the time specified in the
product specific instruction manual.
Never store unused standard dilutions
for a later use.
27
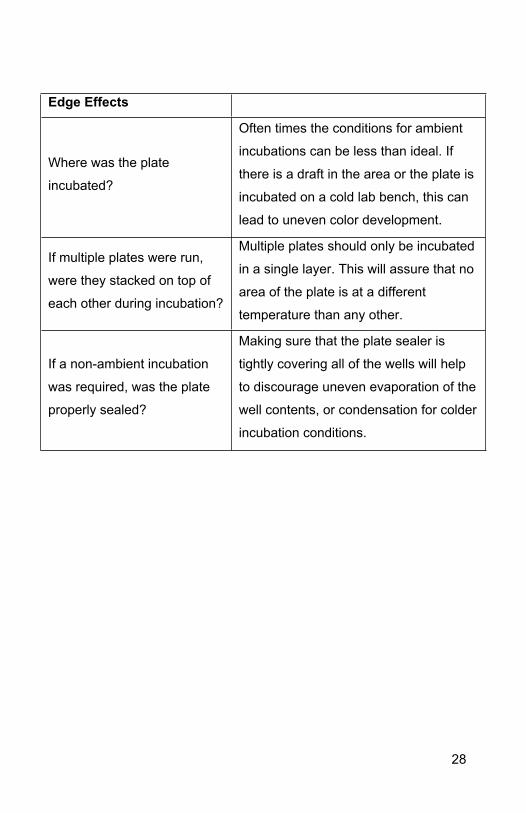
Edge Effects
Where was the plate
incubated?
Often times the conditions for ambient
incubations can be less than ideal. If
there is a draft in the area or the plate is
incubated on a cold lab bench, this can
lead to uneven color development.
If multiple plates were run,
were they stacked on top of
each other during incubation?
Multiple plates should only be incubated
in a single layer. This will assure that no
area of the plate is at a different
temperature than any other.
If a non-ambient incubation
was required, was the plate
properly sealed?
Making sure that the plate sealer is
tightly covering all of the wells will help
to discourage uneven evaporation of the
well contents, or condensation for colder
incubation conditions.
28

29

30

UK, EU and ROWEmail: [email protected]: +44 (0)1223 696000www.abcam.com
US, Canada and Latin AmericaEmail: [email protected]: 888-77-ABCAM (22226)www.abcam.com
China and Asia Pacific Email: [email protected]: 108008523689 (中國聯通)www.abcam.cn
JapanEmail: [email protected]: +81-(0)3-6231-0940www.abcam.co.jp
31
Copyright © 2012 Abcam, All Rights Reserved. The Abcam logo is a registered trademark.
All information / detail is correct at time of going to print.