Embed Size (px)
Citation preview
Wright State University Wright State University
CORE Scholar CORE Scholar
Browse all Theses and Dissertations Theses and Dissertations
2017
Ab Initio Study of the Effects of Humidity on Perovskite Based Ab Initio Study of the Effects of Humidity on Perovskite Based
Hybrid Solar Cell Interfaces Hybrid Solar Cell Interfaces
Shantanu Rajendra Rachalwar Wright State University
Follow this and additional works at: https://corescholar.libraries.wright.edu/etd_all
Part of the Oil, Gas, and Energy Commons, and the Power and Energy Commons
Repository Citation Repository Citation Rachalwar, Shantanu Rajendra, "Ab Initio Study of the Effects of Humidity on Perovskite Based Hybrid Solar Cell Interfaces" (2017). Browse all Theses and Dissertations. 1877. https://corescholar.libraries.wright.edu/etd_all/1877
This Thesis is brought to you for free and open access by the Theses and Dissertations at CORE Scholar. It has been accepted for inclusion in Browse all Theses and Dissertations by an authorized administrator of CORE Scholar. For more information, please contact [email protected].
AB INITIO STUDY OF THE EFFECTS OF HUMIDITY ON
PEROVSKITE BASED HYBRID SOLAR CELL INTERFACES
A thesis submitted in partial fulfillment of the requirements for the degree of Master of Science in Renewable and Clean Energy Engineering
By
SHANTANU RAJENDRA RACHALWAR
B.E., University of Pune, 2014
2017
Wright State University
WRIGHT STATE UNIVERSITY
GRADUATE SCHOOL
December 8, 2017
I HEREBY RECOMMEND THAT THE THESIS PREPARED UNDER MY
SUPERVISION BY Shantanu Rajendra Rachalwar ENTITLED Ab initio study of the
effects of humidity on perovskite based hybrid solar cell interfaces BE ACCEPTED IN
PARTIAL FULLFILLMENT OF THE REQUIRMENT FOR DEGREE OF Master of
Science in Renewable and Clean Energy Engineering.
________________________________
Amir A. Farajian, Ph.D.
Thesis Director
________________________________
Joseph C. Slater, Ph.D., P.E.
Chair, Department of Mechanical and
Materials Engineering
Committee on final examination:
________________________________
Amir A. Farajian, Ph.D.
________________________________
Hong Huang, Ph.D.
________________________________
Nikolai Priezjev, Ph.D.
________________________________
Barry Milligan, Ph.D.
Interim Dean of the Graduate School
iii
ABSTRACT
Rachalwar, Shantanu Rajendra. M.S.R.C.E. Department of Mechanical and Materials
Engineering, Wright State University, 2017. Ab Initio Study of the Effects of Humidity on
Perovskite Based Hybrid Solar Cell Interfaces
Despite the impressive success of perovskite-based hybrid solar cells, their
widespread usage has been limited partially owing to stability issues under working
environmental conditions. Among these, the effects of humidity are some of the most
significant. Water intercalation generally degrades the material, shortens its useful life, and
reduces the efficiency of photovoltaic energy conversion. Understanding the reasons for
these effects can be achieved through detailed and accurate atomic-scale analysis.
Here, we study water intercalation at the interfaces of perovskite-based hybrid solar
cell material and TiO2 electrode. Accurate ab initio computer simulations are used to obtain
structural and electronic properties. We systematically investigate interfacial geometry and
determine the most stable configurations for different orientations of TiO2 (001) surface
and different layers of hybrid organic-inorganic tetragonal perovskite lead Iodide. We also
determine water adsorption characteristic on reconstructed TiO2 and hybrid perovskite
surfaces. These are then used to obtain the most stable interfacial configurations upon water
intercalation. Based on the obtained electronic properties we compare interface
functionality with and without water and discuss consequent effects on solar cell
performance.
iv
TABLE OF CONTENTS
TITLE PAGE
CHAPTER 1 INTRODUCTION ......................................................................... 1
1.1 Thesis Aim .................................................................................................... 2
1.2 LITERATURE REVIEW ............................................................................. 3
1.2.1 Overview ................................................................................................ 3
1.2.2 PEROVSKITE ....................................................................................... 3
1.2.3 WATER ON PEROVSKITE ................................................................. 7
1.2.4 TITANIUM DIOXIDE ........................................................................ 11
1.2.5 WATER ON TiO2 ............................................................................... 13
1.2.6 PEROVSKITE AND TITANIUM DIOXIDE INTERFACE .............. 14
CHAPTER 2 METHODOLOGY ...................................................................... 18
2.1 BACKGROUND THEORY ....................................................................... 18
2.1.1 COMPUTATIONAL MATERIAL SCIENCE [38] ............................ 18
2.2 PROCEDURE ............................................................................................. 21
2.2.1 Summary .............................................................................................. 21
v
2.2.2 Insertion of water molecule into the optimized lower energy interface of
perovskite and TiO2 .................................................................................................. 25
2.2.3 WATER INTERCALATION GEOMETRY ....................................... 26
CHAPTER 3 RESULTS AND DISCUSSION .................................................. 29
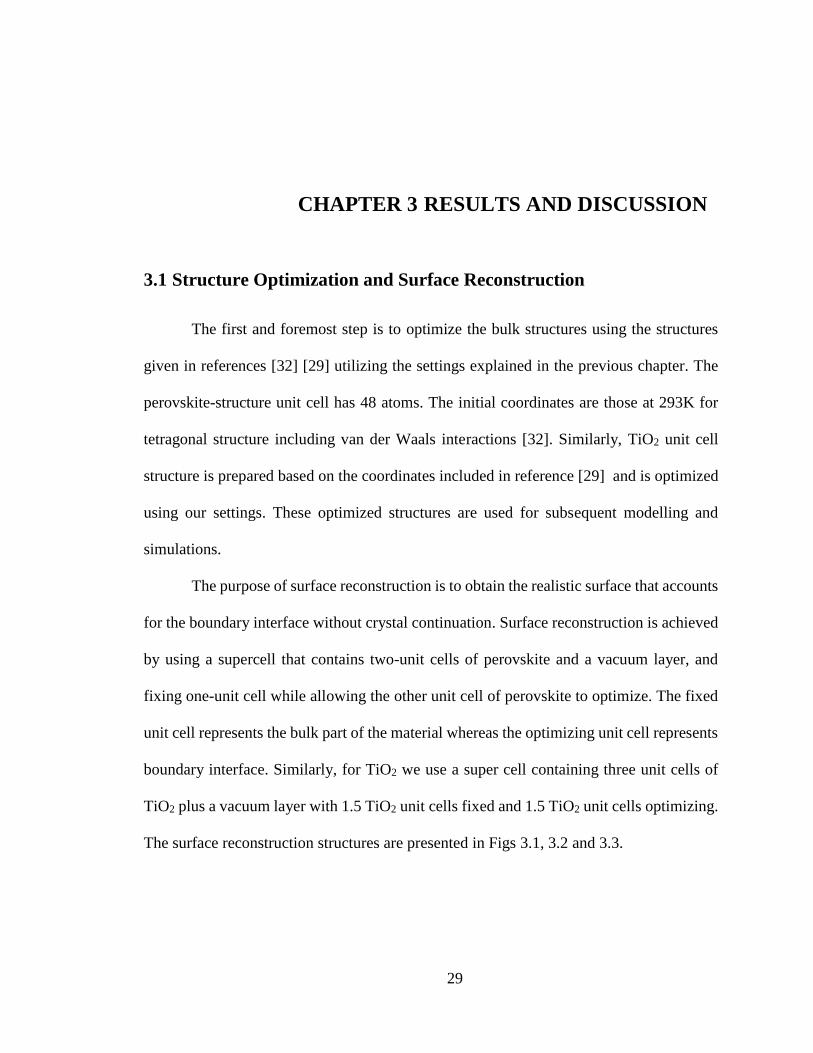
3.1 Structure Optimization and Surface Reconstruction ................................... 29
3.1.1 MAI surface of Perovskite as Interface ............................................... 30
3.1.2 PbI surface of Perovskite as Interface .................................................. 32
3.1.3 Surface reconstruction of TiO2 surface ................................................ 33
3.1.4 Surface Reconstruction of Perovskite with water ................................ 34
3.1.5 Surface Reconstruction of TiO2 surface with water ............................ 37
3.2 Interface Structures ..................................................................................... 39
3.2.1 Perovskite-TiO2 interface without water ............................................. 39
3.2.2 Final minimum energy PbI interface structure with water intercalation.
................................................................................................................................... 42
3.3 Electronic Properties of Interface and Effects of Water Intercalation ........ 44
3.3.1 Electrostatic Potential for the MAI interface structure ........................ 44
3.3.2 Electrostatic Potential for PbI interface structure without and with water
................................................................................................................................... 46
vi
3.3.3 Average electrostatic potential for PbI interface structure without and
with water.................................................................................................................. 47
3.3.4 Density of States .................................................................................. 49
CHAPTER 4 CONCLUSIONS .......................................................................... 50
REFERENCES………………………………………………………………….51
vii
LIST OF FIGURES
TITLE PAGE
Figure 1.1 Simple schematic diagram of CH3NH3PbI3 [12] ............................................... 4
Figure 1.2 Hybrid perovskite structures from left to right: orthorhombic, tetragonal and
cubic phases [17]................................................................................................................. 5
Figure 1.3 Simple solar cell model ..................................................................................... 6
Figure 1.4 water adsorption with lowest energy structure of water on the MAI and PbI
terminated surface with different polarities [27]. ............................................................... 8
Figure 1.5 MAI and PbI terminated surface with water adsorption sites [28] .................... 9
Figure 1.6 Tetragonal rutile structure with atom arrangements [29]. ............................... 11
Figure 1.7 Ab initio molecular dynamics simulation cell of the water/TiO2 interface [45].
........................................................................................................................................... 13
Figure 1.8 Optimized interfaces between methyl-ammonium hybrid perovskite layers
(MAI and PbI) and anatase (A) as well as rutile (R) phases of TiO2: MAI/A (a), PbI/A (b),
MAI/R (c), and PbI/R (d). [32] ......................................................................................... 14
Figure 1.9 Electron localization function for MAI/A (a), PbI/A (b), MAI/R (c), and PbI/R
(d) interfaces [32] .............................................................................................................. 15
Figure 1.10 charge density and electrostatic potential for MAI/A (a), PbI/A (b), MAI/R (c),
and PbI/R (d) interfaces [32]. ............................................................................................ 16
viii
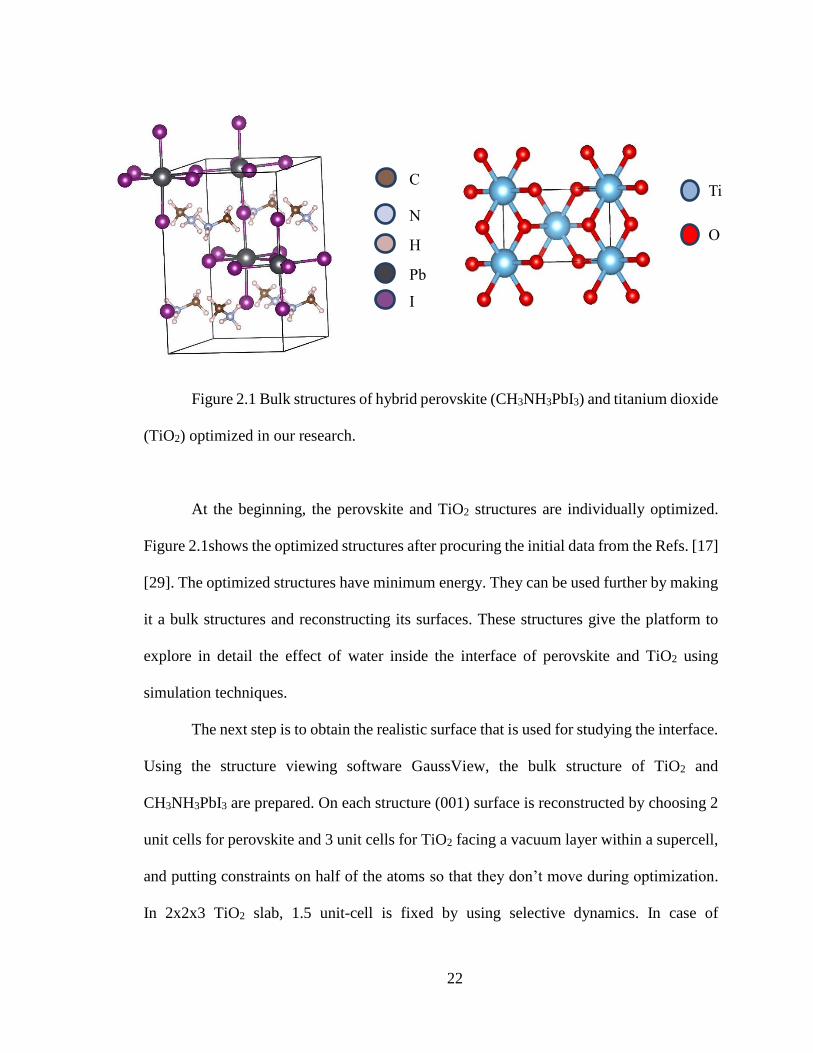
Figure 2.1 Bulk structures of hybrid perovskite (CH3NH3PbI3) and titanium dioxide (TiO2)
optimized in our research. ................................................................................................. 22
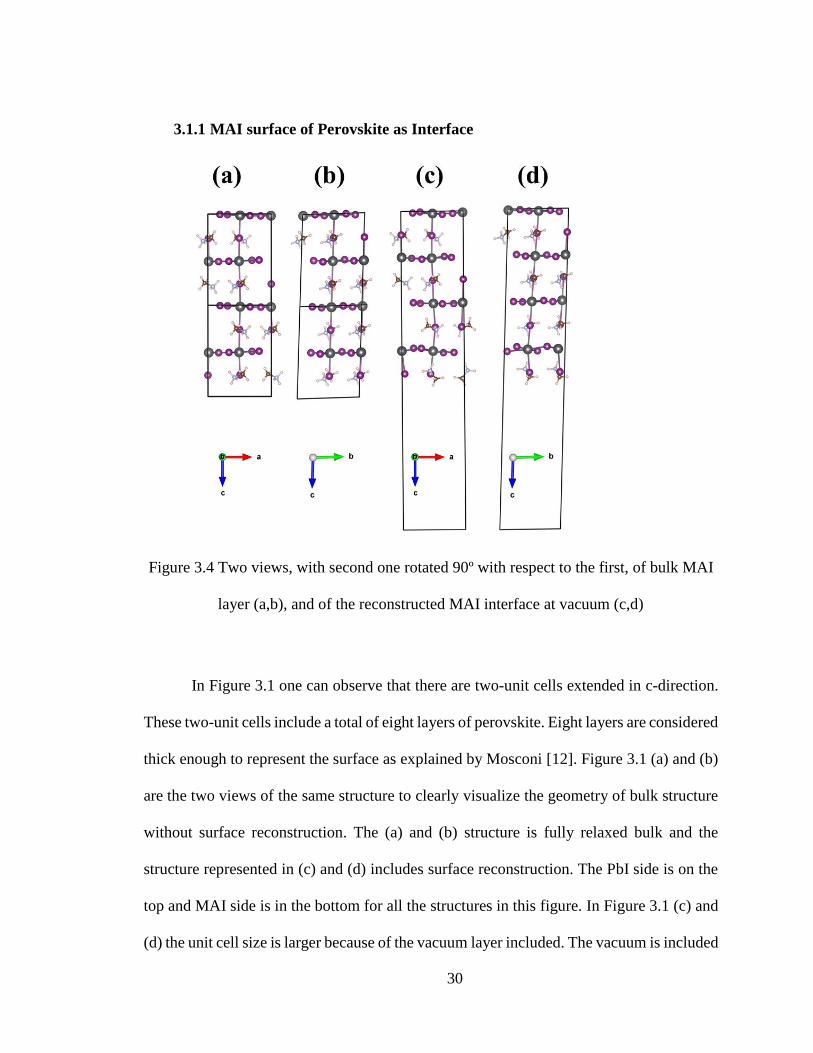
Figure 3.4 Two views, with second one rotated 90º with respect to the first, of bulk MAI
layer (a,b), and of the reconstructed MAI interface at vacuum (c,d) ................................ 30
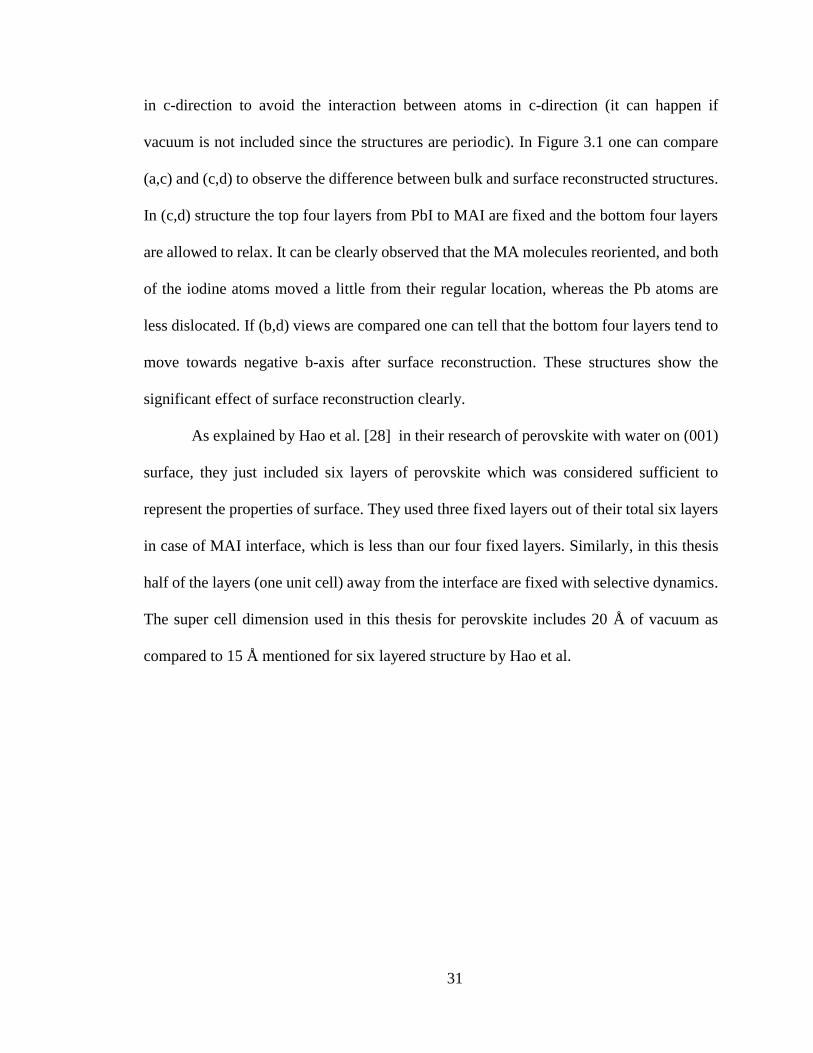
Figure 3.5 Two views, with second one rotated 90º with respect to the first, of bulk PbI
layer (a,b), and of the reconstructed PbI interface at vacuum (c,d) .................................. 32
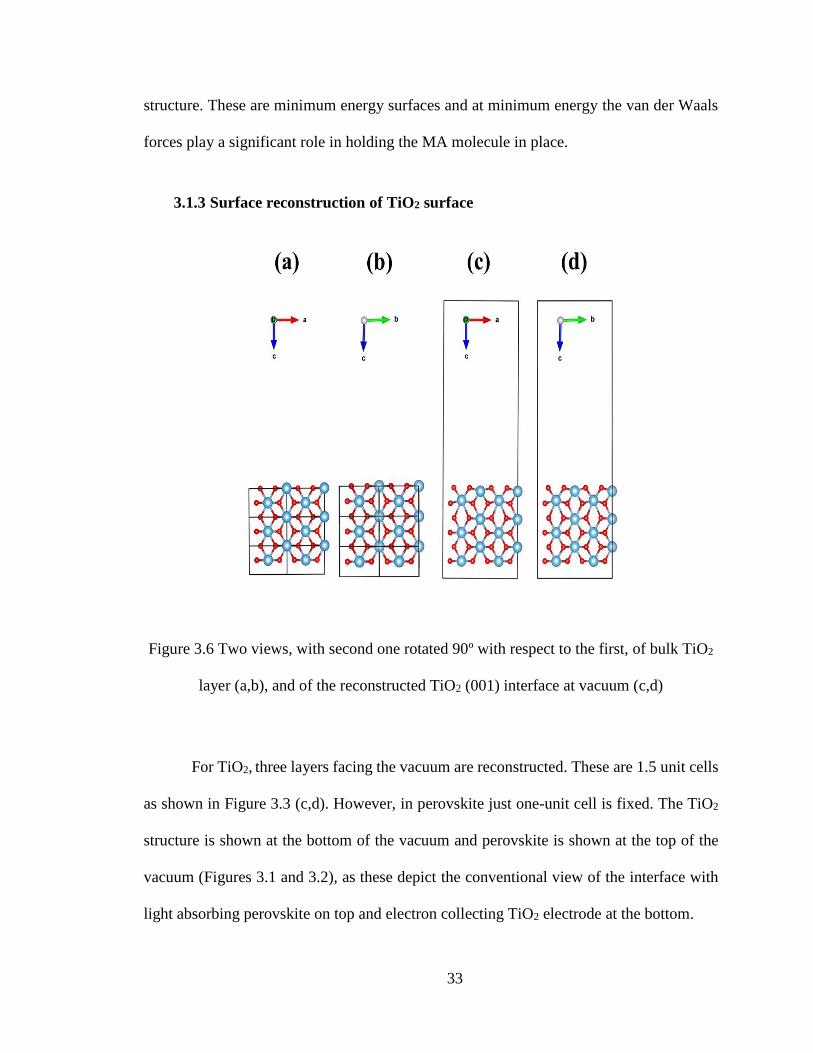
Figure 3.6 Two views, with second one rotated 90º with respect to the first, of bulk TiO2
layer (a,b), and of the reconstructed TiO2 (001) interface at vacuum (c,d) ...................... 33
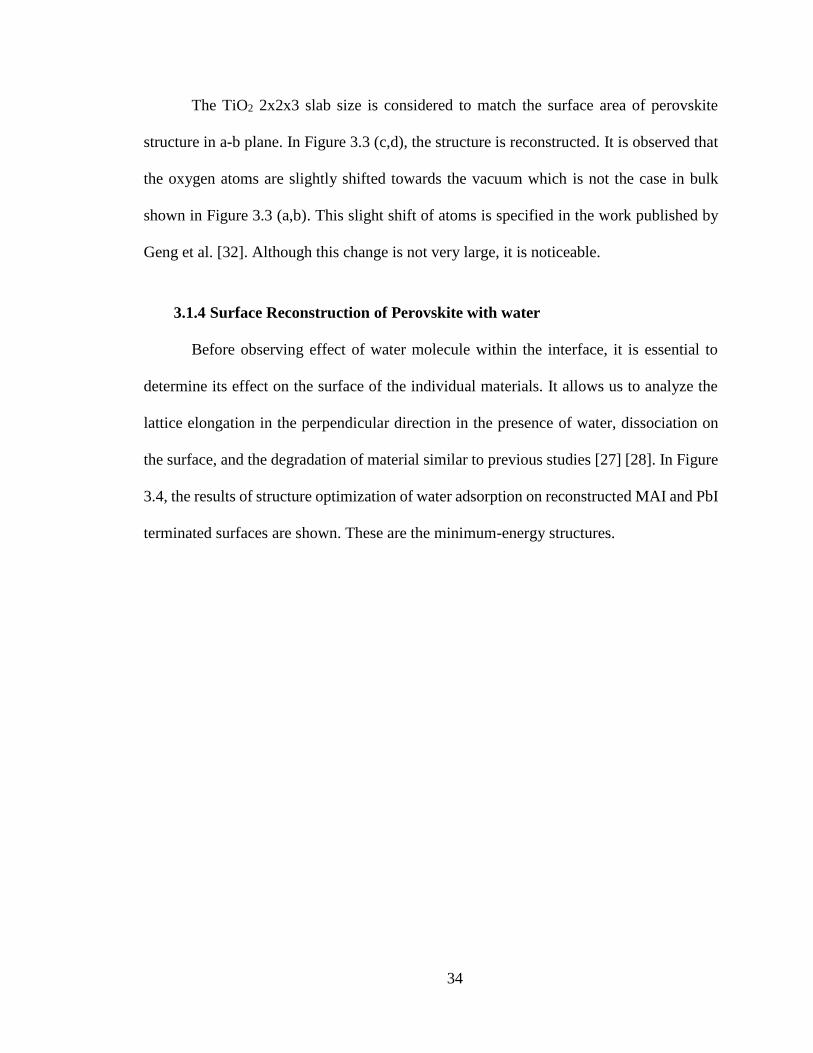
Figure 3.7 Two views if the most stable hybrid perovskite surfaces after water adsorption,
with second one rotated 90º with respect to the first, of reconstructed MAI interface at
vacuum (a,b), and of the reconstructed PbI interface at vacuum (c,d) ............................. 35
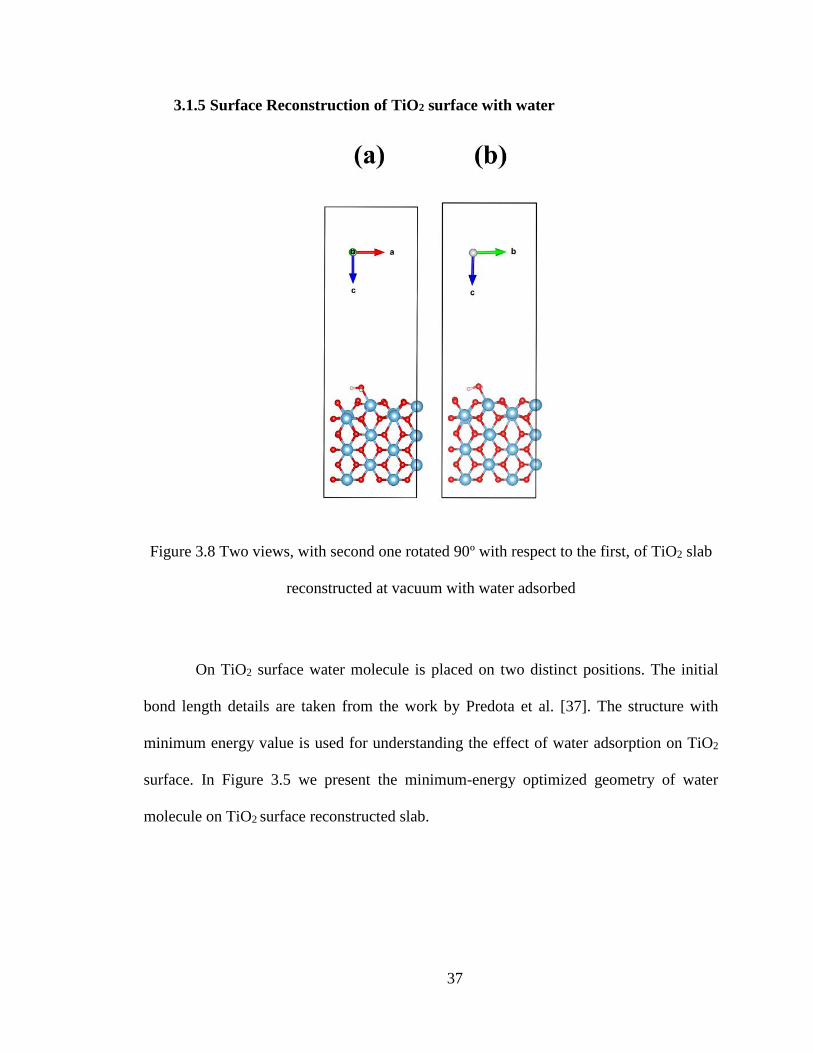
Figure 3.8 Two views, with second one rotated 90º with respect to the first, of TiO2 slab
reconstructed at vacuum with water adsorbed .................................................................. 37
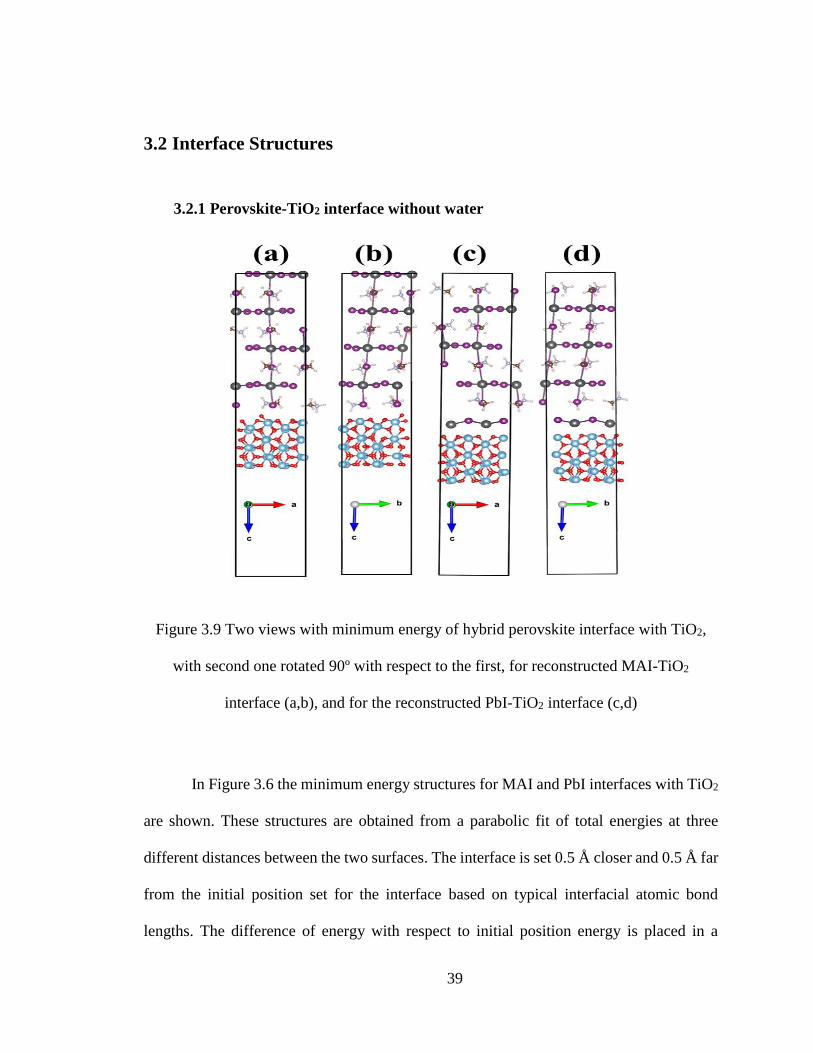
Figure 3.9 Two views with minimum energy of hybrid perovskite interface with TiO2, with
second one rotated 90º with respect to the first, for reconstructed MAI-TiO2 interface (a,b),
and for the reconstructed PbI-TiO2 interface (c,d) ............................................................ 39
Figure 3.10 Two views, with second one rotated 90º with respect to the first, of
reconstructed PbI-TiO2 interface with intercalated water (a,b) ........................................ 42
Figure 3.11 Minimum (blue), maximum (black) and average (red) electrostatic potential of
MAI-TiO2 interface (a) and magnified average electrostatic potential for MAI-TiO2 (b).
Vacuum is at the left, TiO2 is in the middle and perovskite is at the right of each graph. 44
ix
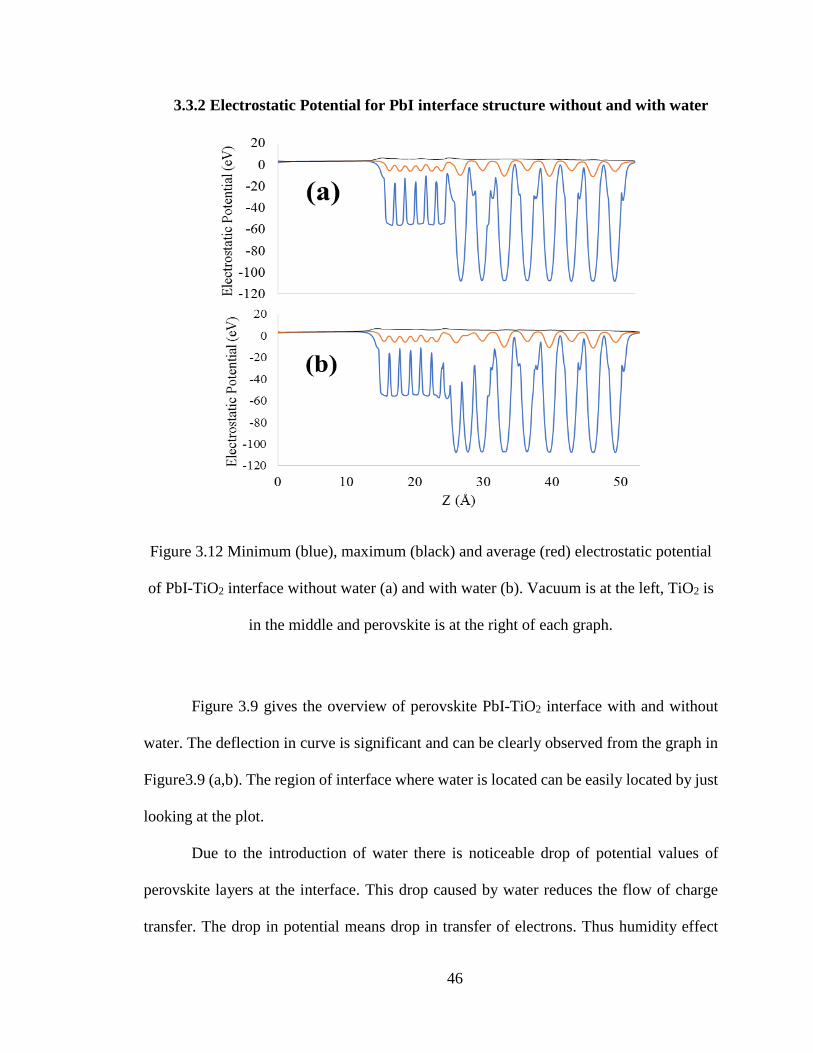
Figure 3.12 Minimum (blue), maximum (black) and average (red) electrostatic potential of
PbI-TiO2 interface without water (a) and with water (b). Vacuum is at the left, TiO2 is in
the middle and perovskite is at the right of each graph. ................................................... 46
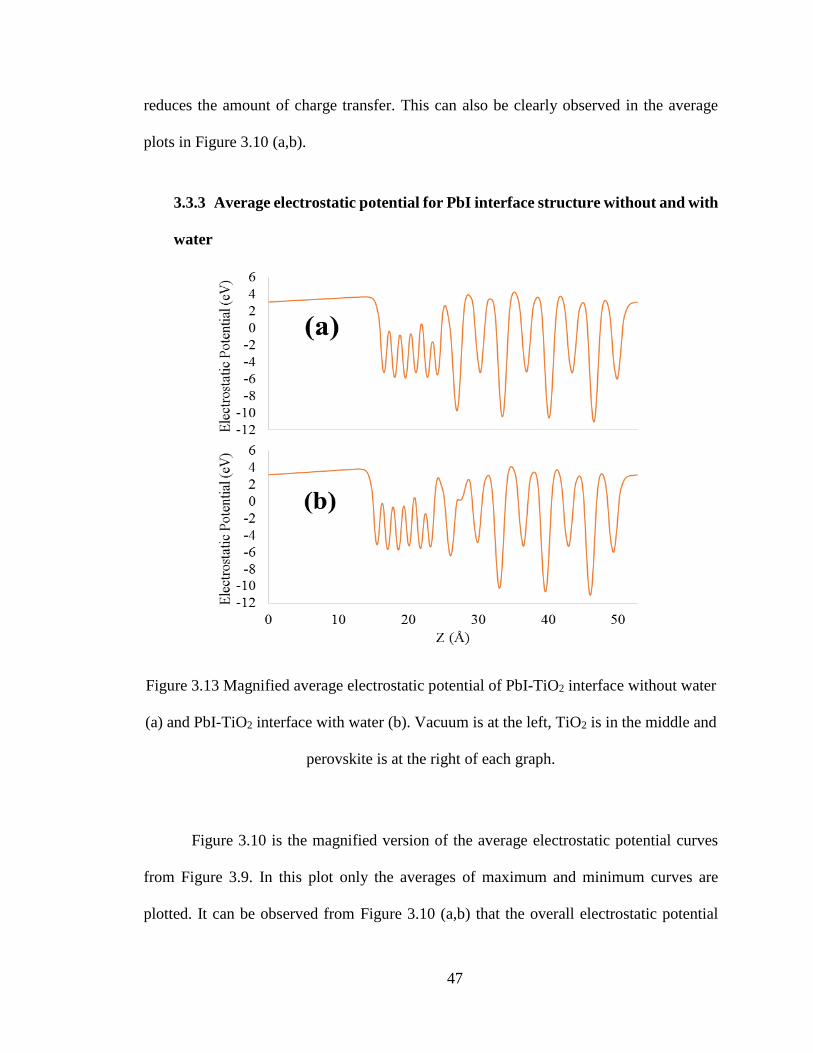
Figure 3.13 Magnified average electrostatic potential of PbI-TiO2 interface without water
(a) and PbI-TiO2 interface with water (b). Vacuum is at the left, TiO2 is in the middle and
perovskite is at the right of each graph. ............................................................................ 47
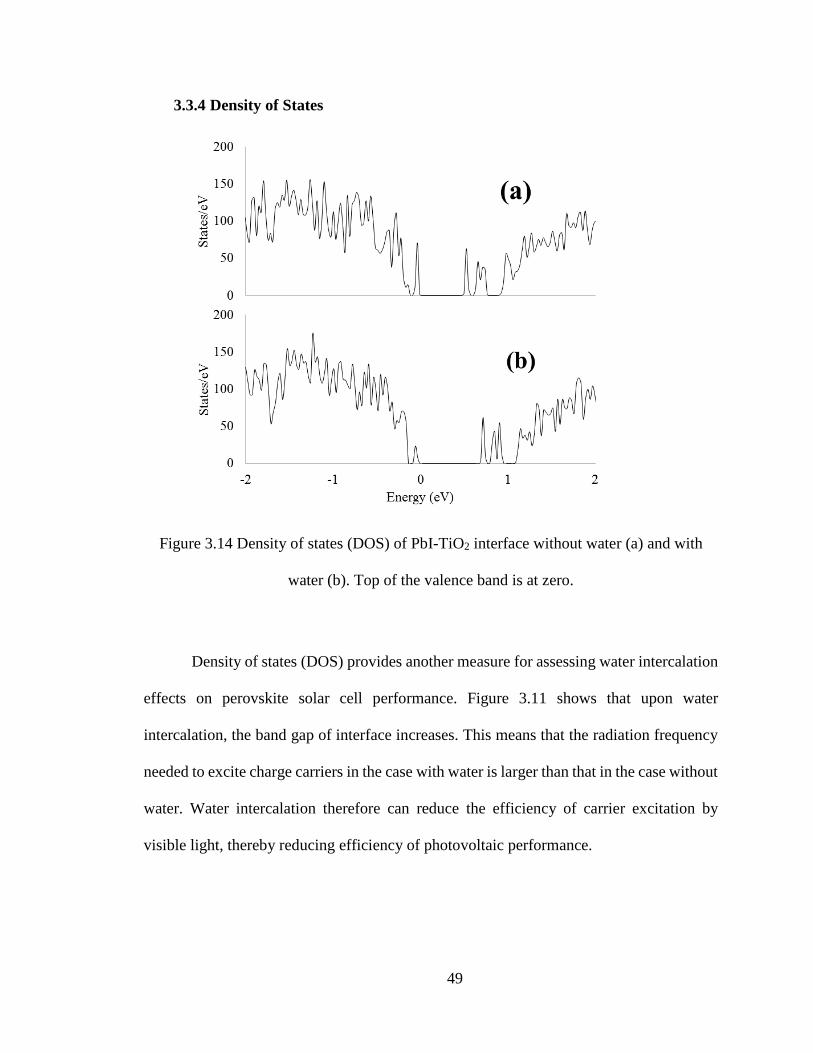
Figure 3.14 Density of states (DOS) of PbI-TiO2 interface without water (a) and with water
(b). Top of the valence band is at zero. ............................................................................. 49
x
LIST OF TABLES
TITLE PAGE
Table 1: Interatomic distances and angles [29]................................................................. 12
Table 2 Energy values of MAI and PbI layer with water ................................................. 36
Table 3 Energy values of TiO2 structure with water ......................................................... 38
Table 4 Energy values of interface without water ............................................................ 40

xi
LIST OF ACRONYMS
VASP Vienna ab initio Simulation Package
DFT Density Functional Theory
LDA Local Density Approximation
GGA Generalized Gradient Approximation
TiO2 Titanium Dioxide
PCE Power Conversion Efficiency
MA Methyl-Ammonium
PV Photovoltaic
ETL Electron Transport Layer
HTM Hole Transport Material
FTO Fluorine doped Tin Oxide
DOS Density of states
DFT Density Functional Theory
GGA Generalized-Gradient Approximation
xii
ACKNOWLEDGEMENTS
I would like to express my sincere gratitude to Dr. Amir Farajian for giving me an
opportunity to work under him and for helping me throughout the research work. His
ancillary made this thesis interesting and intuitive.
I would like to thank Ohio Super Computers for providing all the resources and Mr.
Mike Vanhorn for promptly fixing the system and for providing access to required software
with ease. Thanks to Luke Wirth, Siddharth Rathod and Parin Amlani for providing me
assistance with one or the other thing during this thesis.
Finally, I would like to thank my parents who had faith in me and supported me
throughout this journey. Heartfelt thanks to my younger sister Shweta Rachalwar for
cheering me every time and my cousin Chaitanya Padgilwar who always motivated me and
without whom I would have never pushed myself to pursue master’s degree. I sincerely
convey my regards to them. At last but not the least, thanks to all my family members and
my beloved friends from India and US for encouraging me to pursue my dreams and
making this journey wonderful and memorable.

1
CHAPTER 1 INTRODUCTION
Over the past few years, the world population has been going up on an average by
75 million per year now reaching to about 7 billion. The fact of increase in population is
shown by US department of commerce. With this increase in population, there has been an
increase in demand of all consumable resources. The industrial revolution began in the mid
eighteenth century, changing human lives completely. This revolution boosted
transportation and meanwhile the electrification of houses took place. In the 21st century
we can now travel hundreds of miles in a few hours, connect with people thousands of
miles away within seconds, change the temperature in a house according to comfort. To
achieve this, the basic requirement is energy. We could successfully improve the
technologies in this domain that consume fossil fuel. The fossil fuels currently being used
are not just limited but cause climate change. After almost 150 years, scientists have
realized the necessity of shifting the dependency from conventional to unconventional
sources of energy. Unconventional sources can be solar energy, wind energy, geothermal
energy etc. but solar and wind have grown because of their efficiency and feasibility over
any other source of energy. As a clean source of energy, market of solar energy is wide.
Since solar energy does not produce noise and utilizes less space as compared to any other
renewable energy source, it is worth investing time in researching solar components to
increase its efficiency.
2
The current photovoltaic solar cells are predominantly manufactured using
crystalline silicon. In 2014, researchers at the University of New South Wales [1] [2],
Australia claimed efficiency of greater than 25% for the crystalline silicon solar cells. This
claim was supported by Panasonic (Japan) [3] and SunPower (USA) using silicon wafers
[4]. The current problem with crystalline silicon solar cells is their expense and
complication to fabricate. There are opportunities for other solar technologies if they can
prove to give higher power conversion efficiencies or reduced manufacturing costs.
Organic-inorganic perovskite solar cells seem to be promising in answering both
challenges. In 2009, one showed efficiency of 3.8% [5] and it drastically increased to a
confirmed efficiency of 22.1% [6]. The main reason behind researchers’ interest in
perovskite solar cells are their rapid increase in power conversion efficiency within a brief
period, simple assembly and low fabrication costs.
1.1 Thesis Aim
The main aim of this research is to understand the effect of moisture on hybrid
perovskite, titanium dioxide (TiO2), and in the interface of hybrid perovskite and (TiO2).
In this thesis, all results are produced using a computational approach. To obtain the initial
structure, we will use reference literature for the basic coordinates. It will also help us
understand the literature associated with perovskite humidity and Titanium oxide.
Subsequently, we will optimize the structures using accurate ab initio approaches to ensure
obtaining realistic interfaces.
In our research, we consider different settings for producing the results which will
be elaborated upon explicitly. Here, minimum energy structures will be calculated for each
3
individual interface to find the stable structure. It is essential to identify a realistic interface
to analyze the effect of humidity. To analyze this effect electrostatic potential and density
of states are derived and utilized to assess the effects of humidity on photovoltaic
performance of hybrid perovskite solar cells.
1.2 LITERATURE REVIEW
1.2.1 Overview
To work on a new idea, it is important to understand the relevant work performed
by other researchers. This review will help us understand materials such as perovskite as
well as the behavior of water with perovskite and Titanium oxide. Since the research
mainly focuses on computer simulation, this survey will be discussing mainly the
simulation aspect of the materials and interface.
1.2.2 PEROVSKITE
Perovskite as a solar cell material was first introduced by Kojima in 2009 [5]. The
organic-inorganic hybrid perovskite compound is denoted with a chemical formula
CH3NH3PbX3. (X can be either Bromine, Chlorine or Iodine). In this thesis, discussion will
be on the tetragonal structure of CH3NH3PbI3 as it is preferred over others for this
application, because of stability at room temperature and sensitivity to visible light
frequencies. The properties that contribute in making a perovskite a favorable candidate
for photovoltaics are its optical and excitonic properties and electrical conductivity [5]. The
photoluminescence was checked before and after grinding organic-inorganic lead halide
perovskite compound and it was found that photoluminescence of the material is strong

4
after grinding [8]. This understanding led the thought of perovskite as a solar cell material.
The perovskite material showed a strong band-gap adsorption despite being a
semiconductor [9]. These properties provide staunch support for perovskite to be a
potential material for solar cell applications [10] [11]. It is important to be able to visualize
the perovskite structure to understand the material in detail. Schematics of a simple hybrid
perovskite is depicted in Figure 1.1.
Figure 1.1 Simple schematic diagram of CH3NH3PbI3 [12]
Chemical formula for representing hybrid perovskite is ABX3. A is the positively
charged organic cations (CH3NH3+) which is also denoted as Methyl-ammonium (MA),
and B is lead (Pb) and X is the negatively charged halide anion which can be either chlorine,
bromine or iodine (Cl-, Br- or I-). The stability of perovskite depends on size of the lead
(A) atom [13]. It can be clearly seen that the organic-inorganic molecules are not
interconnected with chemical bonds. The forces that holds CH3NH3 together with the rest
of perovskite structure are the van der Waals forces [14]. The shape of the perovskite
5
structure can change with respect to temperature between cubic, tetragonal and
orthorhombic. The structure is cubic at elevated temperature and at around 327 K it tends
to become tetragonal and when the temperature falls below165 K it becomes orthorhombic
[15] [16].
It is important to understand the formation of the tetragonal perovskite structure which can
be used for solar cell applications. To understand this in detail, it is essential to be aware
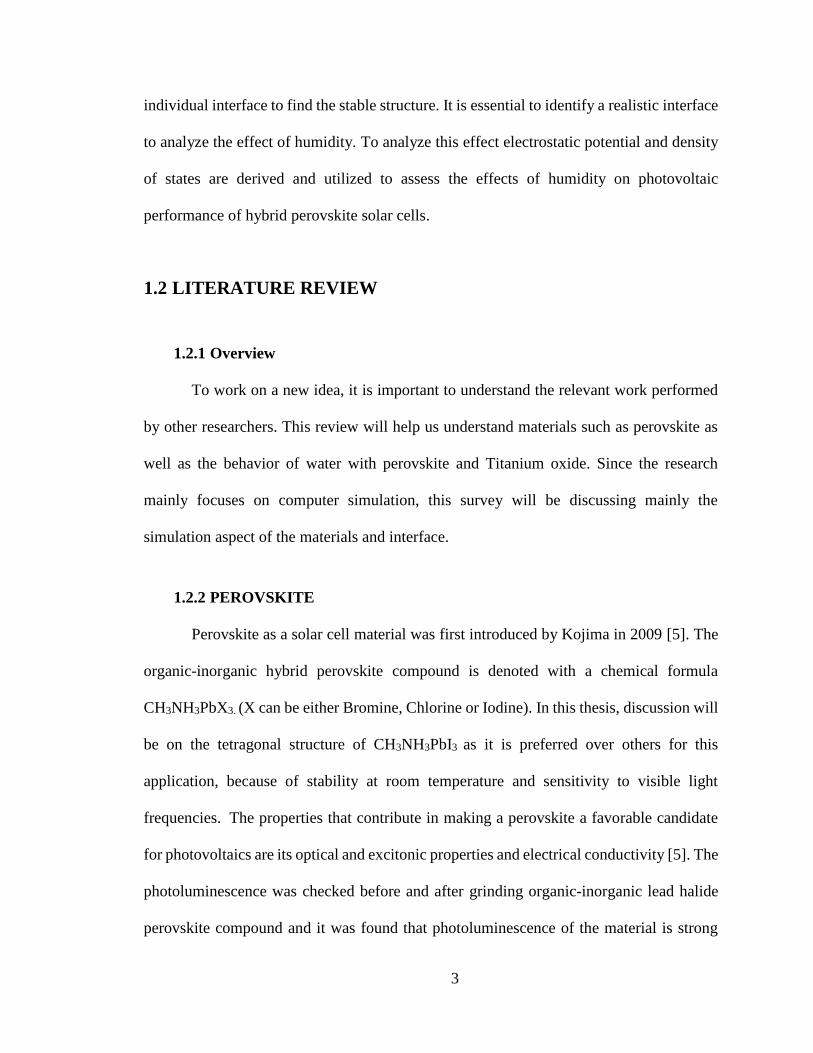
of its electronic properties of structure [17]. The model basically consists of 48 atoms as
originally reported in the reference provided [16] [18] [19].
Figure 1.2 Hybrid perovskite structures from left to right: orthorhombic, tetragonal and
cubic phases [17].
In Figure 1.2 the geometric parameters for tetragonal structure [18] are shown by dotted
lines. In this structure “α” is the dihedral angle, “β” is the rotational angle, “γ” and “ω” are
the apical and equatorial angle respectively.
6
In this thesis, to analyze the structure of the hybrid perovskite material, we first
minimize the forces on the atoms to relax the structure. At minimum energy atoms tend to
be stable giving the realistic structure. The settings that were implemented for relaxation
of atoms are described in Chapter 2. To compute the forces and electronic structures, the
Vienna Ab initio Simulation Package (VASP) [20] [21] software is used, which uses
density functional theory (DFT) [22] [23] enhanced by inclusion of van der Waals forces
for processing the results. For obtaining realistic results, the projector augmented wave
approximation is also taken into consideration. Some of the basic settings that are used in
VASP are (these terms are explained later in Chapter 2 of this report.): The energy
convergence criterion is 10-7 eV per unit cell. The maximum allowed force on the atoms is
10−2 eV/Å. We use gamma-centered k-mesh of 3x3x2 for bulk calculations. The plane-
wave energy cutoff is 400 eV. The structures are computed using both generalized gradient
approximation (GGA) [24] PBE functional [25] as well as van der Waals’ correlation
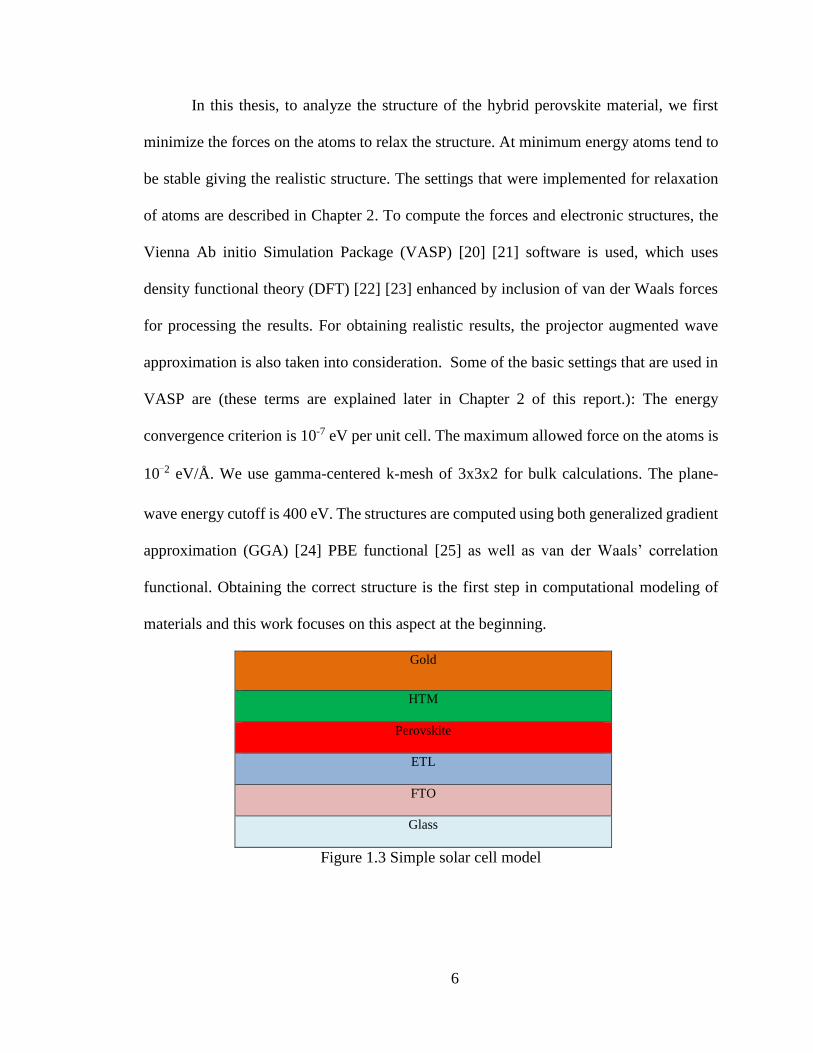
functional. Obtaining the correct structure is the first step in computational modeling of
materials and this work focuses on this aspect at the beginning.
Gold
HTM
Perovskite
ETL
FTO
Glass
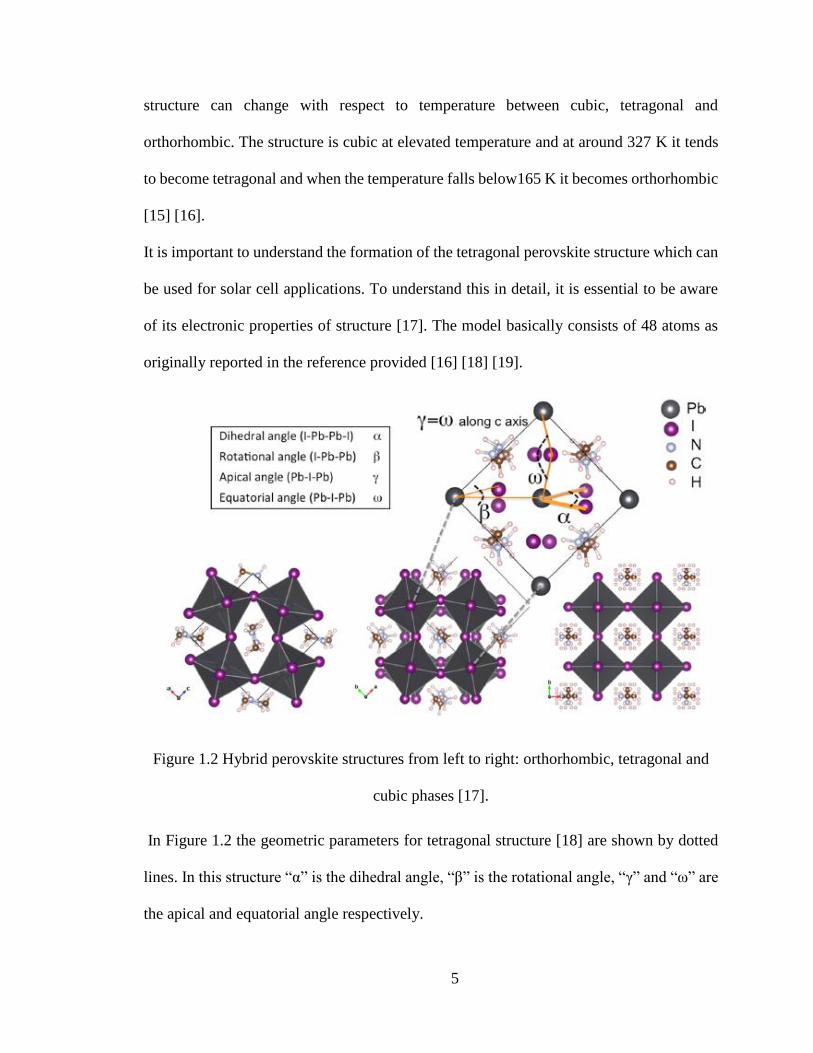
Figure 1.3 Simple solar cell model
7
Figure 1.3 gives a basic idea of the simple perovskite solar cell model. It constitutes
of multiple layers and the perovskite layer is sandwiched between Hole Transporting
Materials (HTM) and Electron Transporting Layer (ETL). It basically generates electron-
hole pairs generated at interface due to sunlight. Gold layer is the metal contact, HTM is
usually Spiro-OMeTAD [26]. In this research, ETL is TiO2 and is further discussed in
detail.
1.2.3 WATER ON PEROVSKITE
The stability issue due to environmental condition is a significant aspect that is
stopping the commercialization of perovskite solar cell. It is important to understand the
effect of moisture on the perovskite surface to understand the penetration of water
molecules in the surface at the interface. There are two surfaces to investigate the effect of
moisture. One is the MAI (Methyl-ammonium(CH3NH3)-iodide) terminated surface and
the other one is the PbI (lead-iodide) surface. Finding the minimum energy of water
adsorption on these structures is essential to understand moisture effect.
8
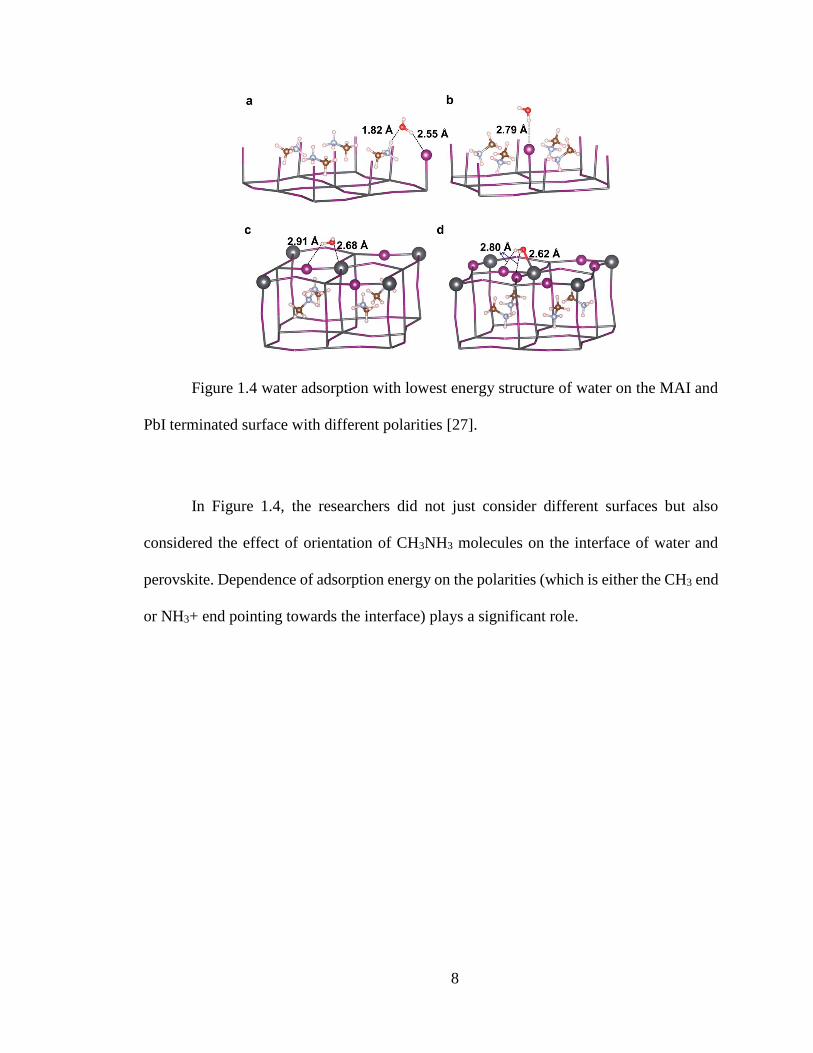
Figure 1.4 water adsorption with lowest energy structure of water on the MAI and
PbI terminated surface with different polarities [27].
In Figure 1.4, the researchers did not just consider different surfaces but also
considered the effect of orientation of CH3NH3 molecules on the interface of water and
perovskite. Dependence of adsorption energy on the polarities (which is either the CH3 end
or NH3+ end pointing towards the interface) plays a significant role.
9
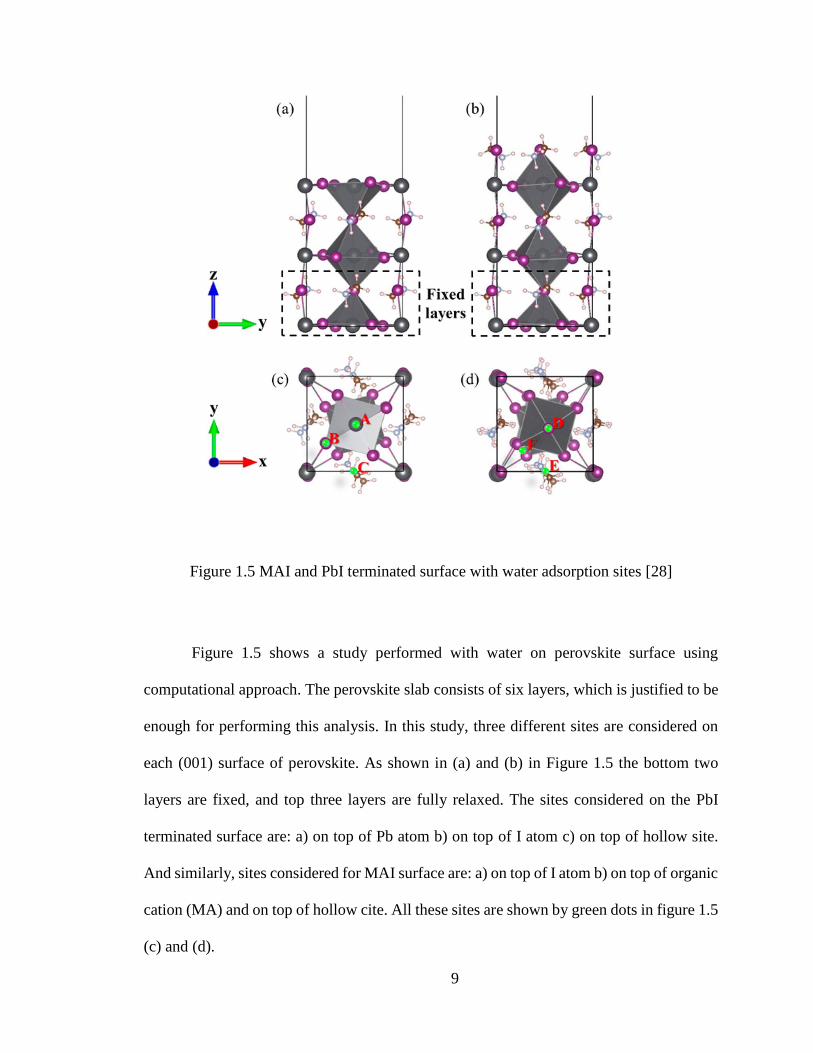
Figure 1.5 MAI and PbI terminated surface with water adsorption sites [28]
Figure 1.5 shows a study performed with water on perovskite surface using
computational approach. The perovskite slab consists of six layers, which is justified to be
enough for performing this analysis. In this study, three different sites are considered on
each (001) surface of perovskite. As shown in (a) and (b) in Figure 1.5 the bottom two
layers are fixed, and top three layers are fully relaxed. The sites considered on the PbI
terminated surface are: a) on top of Pb atom b) on top of I atom c) on top of hollow site.
And similarly, sites considered for MAI surface are: a) on top of I atom b) on top of organic
cation (MA) and on top of hollow cite. All these sites are shown by green dots in figure 1.5
(c) and (d).
10
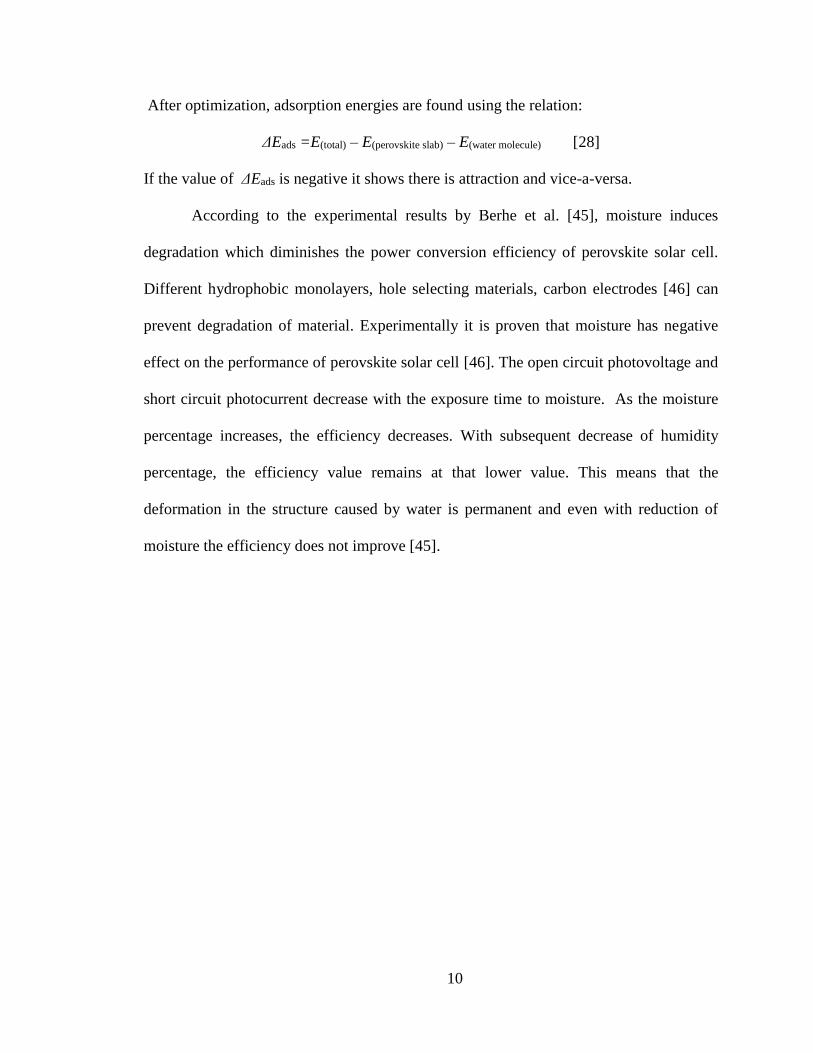
After optimization, adsorption energies are found using the relation:
ΔEads =E(total) – E(perovskite slab) – E(water molecule) [28]
If the value of ΔEads is negative it shows there is attraction and vice-a-versa.
According to the experimental results by Berhe et al. [45], moisture induces
degradation which diminishes the power conversion efficiency of perovskite solar cell.
Different hydrophobic monolayers, hole selecting materials, carbon electrodes [46] can
prevent degradation of material. Experimentally it is proven that moisture has negative
effect on the performance of perovskite solar cell [46]. The open circuit photovoltage and
short circuit photocurrent decrease with the exposure time to moisture. As the moisture
percentage increases, the efficiency decreases. With subsequent decrease of humidity
percentage, the efficiency value remains at that lower value. This means that the
deformation in the structure caused by water is permanent and even with reduction of
moisture the efficiency does not improve [45].
11
1.2.4 TITANIUM DIOXIDE
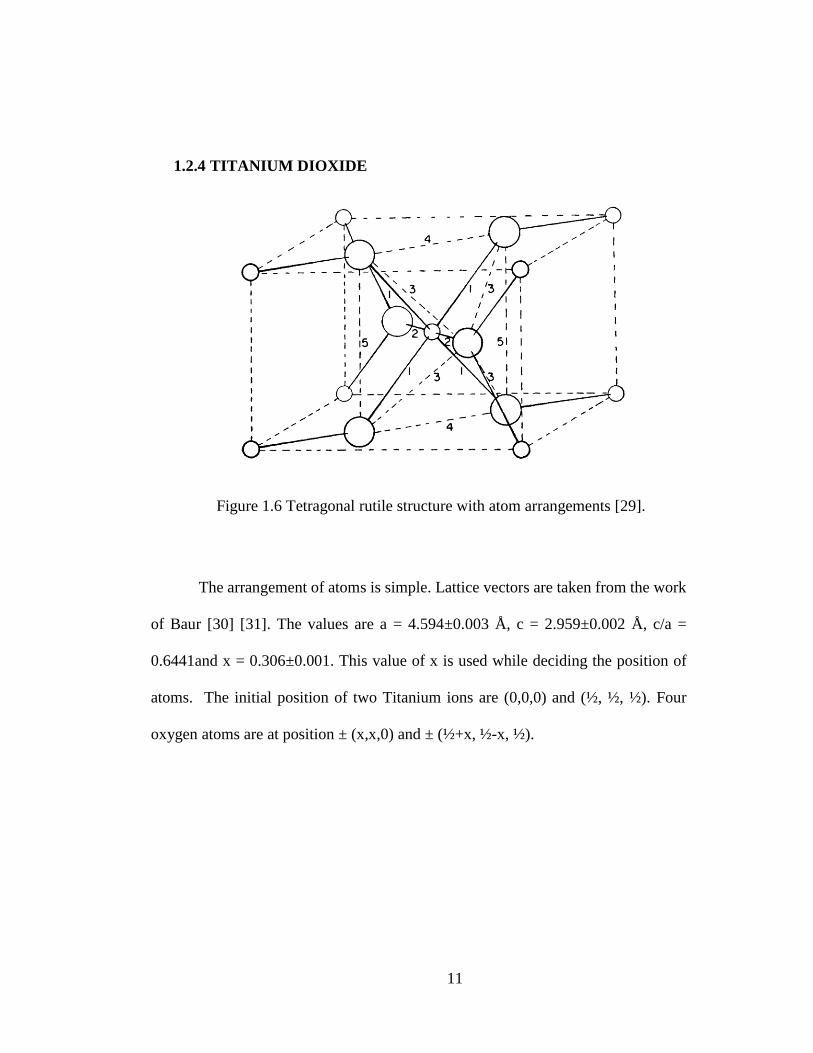
Figure 1.6 Tetragonal rutile structure with atom arrangements [29].
The arrangement of atoms is simple. Lattice vectors are taken from the work
of Baur [30] [31]. The values are a = 4.594±0.003 Å, c = 2.959±0.002 Å, c/a =
0.6441and x = 0.306±0.001. This value of x is used while deciding the position of
atoms. The initial position of two Titanium ions are (0,0,0) and (½, ½, ½). Four
oxygen atoms are at position ± (x,x,0) and ± (½+x, ½-x, ½).
12
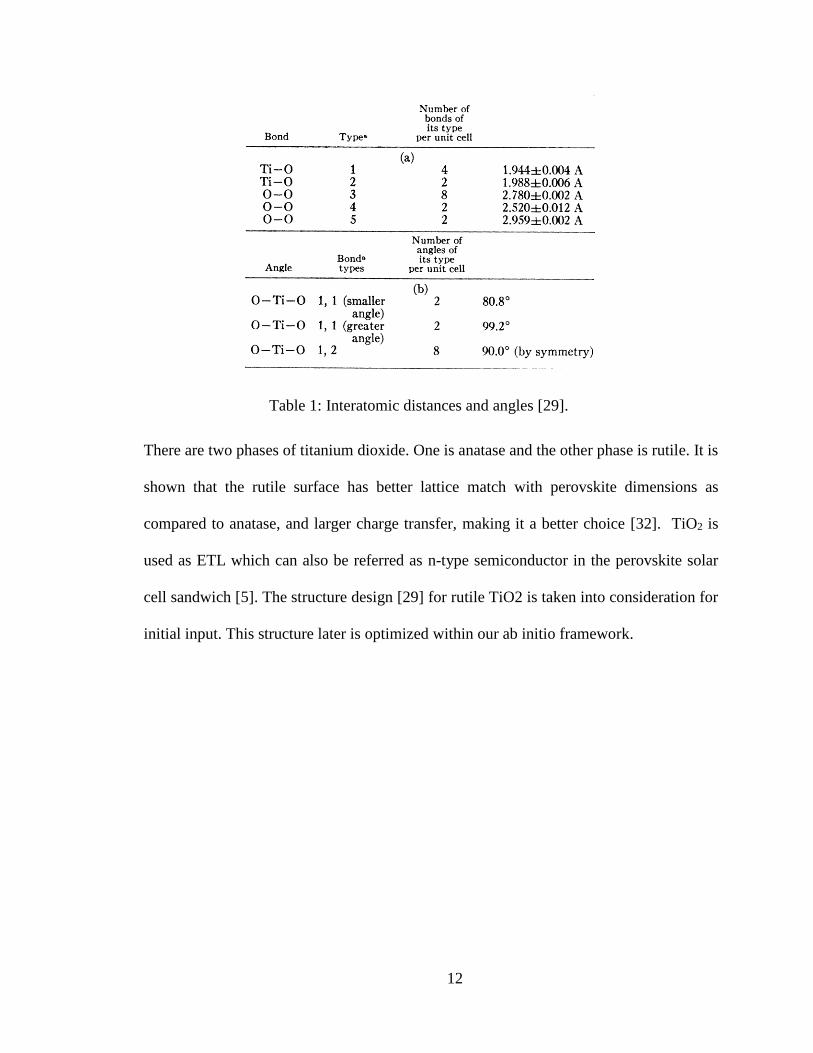
Table 1: Interatomic distances and angles [29].
There are two phases of titanium dioxide. One is anatase and the other phase is rutile. It is
shown that the rutile surface has better lattice match with perovskite dimensions as
compared to anatase, and larger charge transfer, making it a better choice [32]. TiO2 is
used as ETL which can also be referred as n-type semiconductor in the perovskite solar
cell sandwich [5]. The structure design [29] for rutile TiO2 is taken into consideration for
initial input. This structure later is optimized within our ab initio framework.
13
1.2.5 WATER ON TiO2
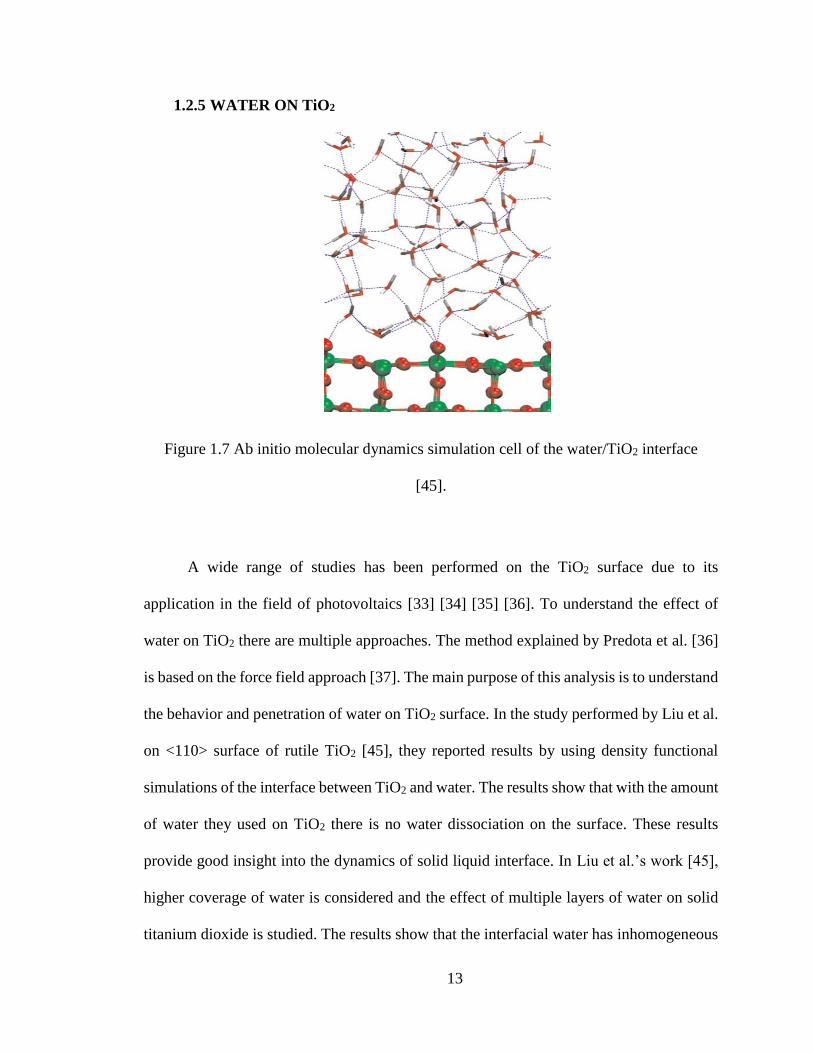
Figure 1.7 Ab initio molecular dynamics simulation cell of the water/TiO2 interface
[45].
A wide range of studies has been performed on the TiO2 surface due to its
application in the field of photovoltaics [33] [34] [35] [36]. To understand the effect of
water on TiO2 there are multiple approaches. The method explained by Predota et al. [36]
is based on the force field approach [37]. The main purpose of this analysis is to understand
the behavior and penetration of water on TiO2 surface. In the study performed by Liu et al.
on <110> surface of rutile TiO2 [45], they reported results by using density functional
simulations of the interface between TiO2 and water. The results show that with the amount
of water they used on TiO2 there is no water dissociation on the surface. These results
provide good insight into the dynamics of solid liquid interface. In Liu et al.’s work [45],
higher coverage of water is considered and the effect of multiple layers of water on solid
titanium dioxide is studied. The results show that the interfacial water has inhomogeneous
14
dynamics. The study also reveals that the second layer of water also tends to reorient the
first layer. In this interface the adsorption energies are calculated for individual atom and
for interface and is subtracted to find the flow of energy. This helped in understanding the
effect of water coverage and provided the data of initial bond lengths for this research. The
reference data for the input structure are taken from the paper published by Predota [36].
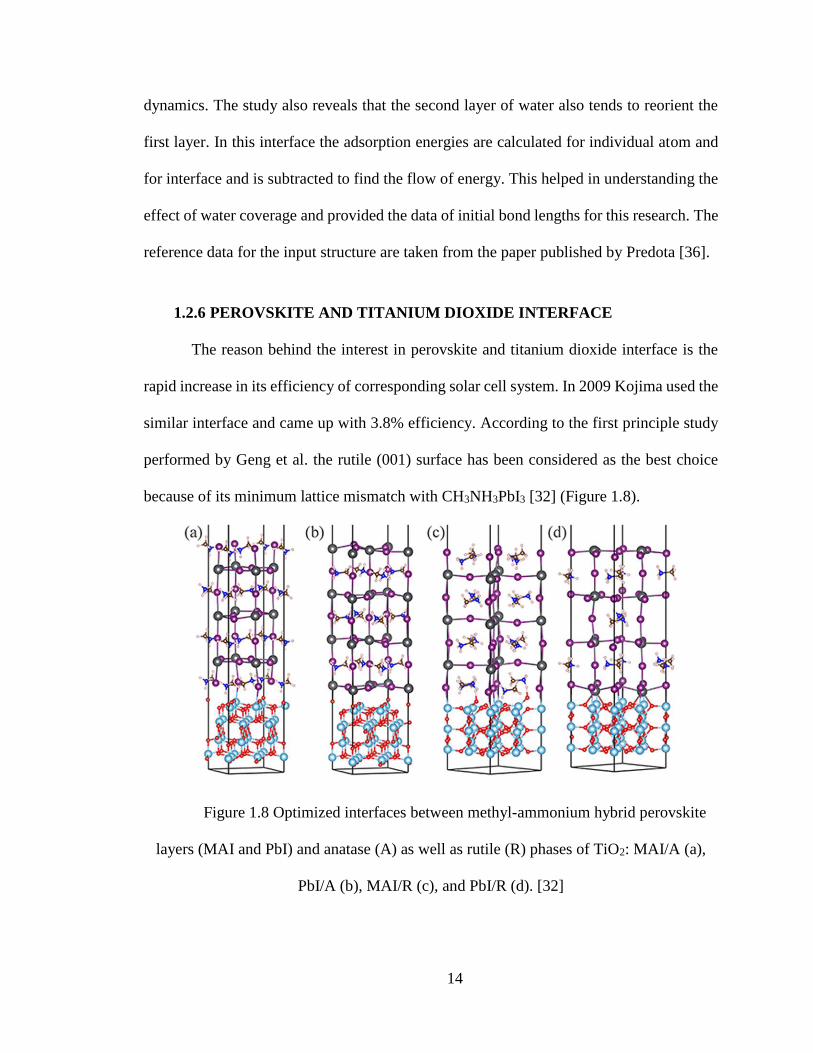
1.2.6 PEROVSKITE AND TITANIUM DIOXIDE INTERFACE
The reason behind the interest in perovskite and titanium dioxide interface is the
rapid increase in its efficiency of corresponding solar cell system. In 2009 Kojima used the
similar interface and came up with 3.8% efficiency. According to the first principle study
performed by Geng et al. the rutile (001) surface has been considered as the best choice
because of its minimum lattice mismatch with CH3NH3PbI3 [32] (Figure 1.8).
Figure 1.8 Optimized interfaces between methyl-ammonium hybrid perovskite
layers (MAI and PbI) and anatase (A) as well as rutile (R) phases of TiO2: MAI/A (a),
PbI/A (b), MAI/R (c), and PbI/R (d). [32]
15
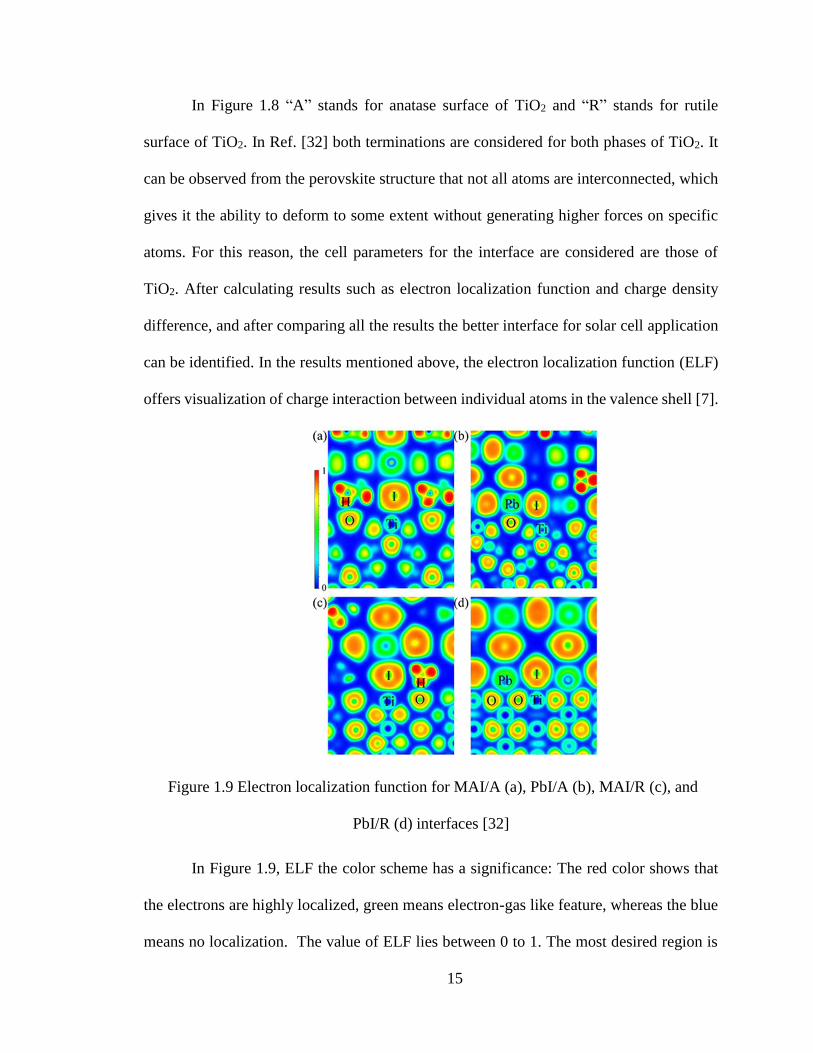
In Figure 1.8 “A” stands for anatase surface of TiO2 and “R” stands for rutile
surface of TiO2. In Ref. [32] both terminations are considered for both phases of TiO2. It
can be observed from the perovskite structure that not all atoms are interconnected, which
gives it the ability to deform to some extent without generating higher forces on specific
atoms. For this reason, the cell parameters for the interface are considered are those of
TiO2. After calculating results such as electron localization function and charge density
difference, and after comparing all the results the better interface for solar cell application
can be identified. In the results mentioned above, the electron localization function (ELF)
offers visualization of charge interaction between individual atoms in the valence shell [7].
Figure 1.9 Electron localization function for MAI/A (a), PbI/A (b), MAI/R (c), and
PbI/R (d) interfaces [32]
In Figure 1.9, ELF the color scheme has a significance: The red color shows that
the electrons are highly localized, green means electron-gas like feature, whereas the blue
means no localization. The value of ELF lies between 0 to 1. The most desired region is
16
the one with electron-gas like region which technically means the surface has better charge
transfer. According to Figure 1.9, from ELF it can be observed that PbI terminated surface
has better charge transfer [32].
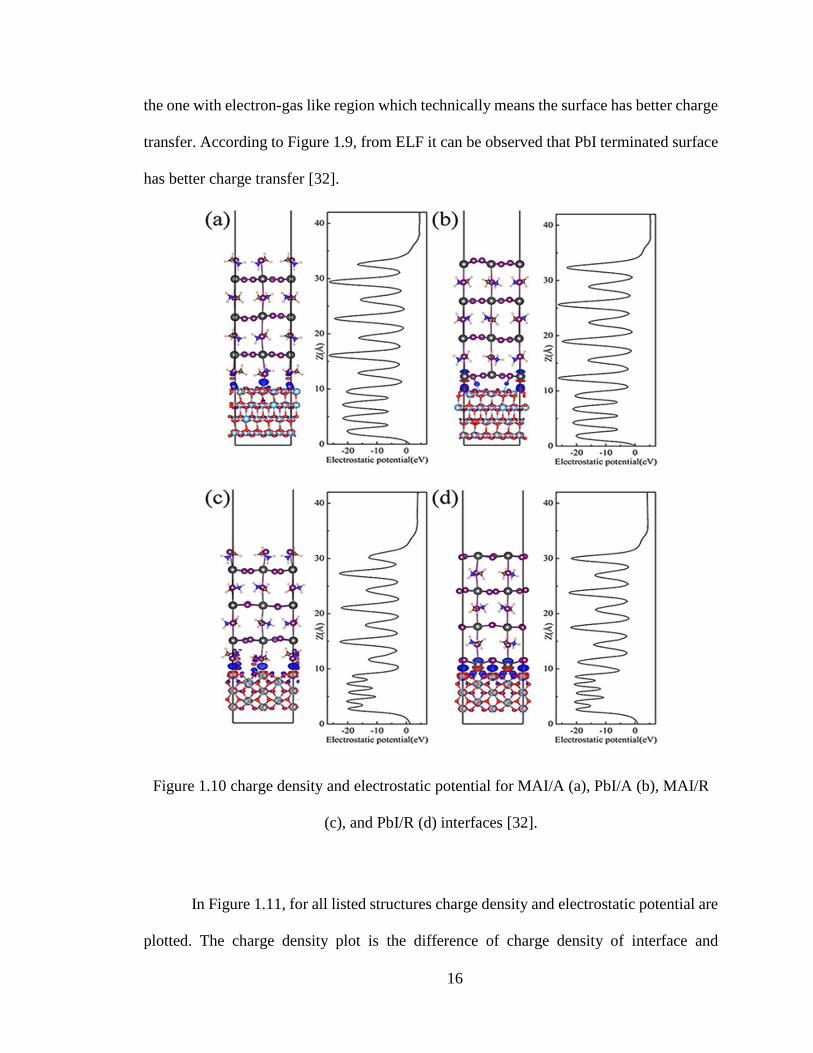
Figure 1.10 charge density and electrostatic potential for MAI/A (a), PbI/A (b), MAI/R
(c), and PbI/R (d) interfaces [32].
In Figure 1.11, for all listed structures charge density and electrostatic potential are
plotted. The charge density plot is the difference of charge density of interface and
17
individual materials. In the right there is electrostatic potential which is used to find
electronic level positions. Due to the presence of chemical-potential difference, there is
charge transfer from perovskite to TiO2 generating electric field. To analyze the difference
quantitatively the Bader charge is calculated which helps to distinguish between different
interfaces. It is observed in the Geng’s results [32] that the direction of charge transfer
remains same whereas the charge transfer in the rutile interface is more.
Since the potential difference is larger in rutile interface as compared to anatase the
charge transfer in rutile is higher. In rutile structure after comparison between MAI and
PbI terminated surfaces, it is observed that the potential drop is higher at PbI terminated
surface than at MAI, in which case electrons are accumulated at TiO2. This causes better
electron-hole separation in the solar cells. All these results eventually helped us to consider
rutile structure for our research.
18
CHAPTER 2 METHODOLOGY
2.1 BACKGROUND THEORY
2.1.1 COMPUTATIONAL MATERIAL SCIENCE [38]
Over the past few years, computers have become powerful enough to complete
resource intensive calculations relatively efficient. Computational Material Science (CMS)
allows us to understand the characteristics and properties of a material with the help of
modelling and simulation. This approach gives the engineer an opportunity to analyze the
properties and nature of material with different levels of accurace. In CMS, it is possible
to put constraints on the model to study a specific behavior of a material.
In this thesis, the computer program that is used is for producing all results is
Vienna Ab Initio Simulation Package (VASP) [20] [21]. Using the first principles plane
wave basis, where first principle modelling refers to solving of Schrödinger equation in the
form of matrix. The basis function that is used is plane wave basis which is a method for
periodic structure [39]. This program performs modeling at the atomic level to compute
electronic structure and quantum mechanical molecular dynamics. This software solves the
Schrödinger equation either using Density Functional Theory in which Kohn-Sham (KS)
equation must be solved or using Hartree-Fock method which involves solving of Roothaan
equations, or by the combination of DFT/Hartree-Fock method. All the necessary terms
associated with VASP are explained below.
19
To perform quantum simulations, the most important equation in quantum
mechanics is Schrödinger equation. This is used to understand the properties of sub-atomic
and atomic particles, in particular electrons, which also act as a wave. The simplest form
of Schrödinger equation is the time-independent form:
Ĥ𝛹 = 𝐸𝛹
In this Ĥ is the Hamiltonian operator which shows the total energy of the system,
𝛹 is the wave function which is in stationary state and E is the energy of the wave function.
Understanding properties in quantum studies can be achieved by solving Schrödinger
equation. Directly solving this equation is not an efficient task for large systems of practical
interest, so multiple iterative approaches have been proposed and are currently being used.
To briefly explain the history of different iterative approaches, the method that was
initially introduced was Thomas-Fermi Dirac theory (TFD) which is used to approximate
the electronic structure using electronic density [40]. This approach gives an approximate
error of about 10% after finding TFD energies, thus this approach is used for approximate
estimates of atomic properties [40].
The successor of TFD is Hartree-Fock (HF) theory. Although this theory is more
precise and useful than TFD, it has drawbacks. This theory underestimates the bond
energies. To overcome this problem post HF approaches [40] were developed which
produced results with high accuracy but were computationally expensive.
In 1964 and 1965 three researchers named Hohenberg, Kohn and Sham published
two papers successively discussing Density Functional Theory (DFT), [22] [41] which is
one of the iterative approaches to find the properties of electronic structure. According to
the paper published in 1964 [22] the total density of electrons is used to calculate the energy
20
as well as determine the ground state properties of the system. This is achieved by solving
Kohn-Sham (KS) equation.
One of the terms entering the KS equation is exchange-correlation ter that specifies
the quantum interactions between electrons. To define the exchange correlation term
depending on the electron density there are two widely used approximations, Local Density
Approximation (LDA) [42] and Generalized Gradient Approximation (GGA) [25]. This
term helps in finding the complete correlation and exchange of a system’s energy [20]. The
LDA approach is straightforward. It assumes that the density of electron gas is the same
everywhere, while in the case of GGA it considers the inhomogeneities of electron density.
Interactions between electrons and atomic ions are usually included using
pseudopotentials. The reason behind approximating pseudopotential is essential to
understand. The core electron wave function remains the same in any chemical
environment. These core electrons can be replaced by “ultrasoft” pseudopotentials. The
reason for an ultrasoft potentials is to make the wave function form smooth, which
influences all electrons behavior even outside the core region. Pseudopotential can produce
the effect of core electrons in any environment. Introducing this is computationally
efficient [43].
To understand the concept of projector augmented wave functions (PAW), it is
important to know the behavior of wave functions. The wave function is fairly smooth at
the bonding region while near the nucleus it oscillates rapidly. This is a difficulty of
electronic structure method that is resolved using the PAW method. In this method the
wave functions are divided into parts, which are now considered as partial wave expansions
around the sphere of the atom center and envelope function around the sphere. The PAW

21
method has accuracy comparable to the electronic structure method which is LDA based,
and by using this approach an excellent quality molecular dynamics simulation can be
obtained [44].
2.2 PROCEDURE
2.2.1 Summary
To obtain the stable interface of perovskite and TiO2 in the presence of moisture
we use a systematic approach. Here we explain the design of individual structures, their
optimization, surface reconstruction, water Intercalation and the settings required to
achieve all these in VASP. Previously in background theory section we briefly mentioned
the approaches that are applied in the VASP software to conduct the optimization. To
begin, the primary requirement is to have the coordinates for the input structure. The two
main structures are perovskite [17] and TiO2 [29] whose coordinates are procured from the
supplementary information of the former reference and the information included in the
latter, respectively. The data for designing unit cell structures is used in addition to other
data necessary for VASP simulations.
There are basically four main input files and one additional file to trigger the VASP
program. The four main input files include information about atomic positions, reciprocal
lattice (k-space), pseudopotentials, and detailed settings. The additional input file includes
information about van der Waals interactions.
22
Figure 2.1 Bulk structures of hybrid perovskite (CH3NH3PbI3) and titanium dioxide
(TiO2) optimized in our research.
At the beginning, the perovskite and TiO2 structures are individually optimized.
Figure 2.1shows the optimized structures after procuring the initial data from the Refs. [17]
[29]. The optimized structures have minimum energy. They can be used further by making
it a bulk structures and reconstructing its surfaces. These structures give the platform to
explore in detail the effect of water inside the interface of perovskite and TiO2 using
simulation techniques.
The next step is to obtain the realistic surface that is used for studying the interface.
Using the structure viewing software GaussView, the bulk structure of TiO2 and
CH3NH3PbI3 are prepared. On each structure (001) surface is reconstructed by choosing 2
unit cells for perovskite and 3 unit cells for TiO2 facing a vacuum layer within a supercell,
and putting constraints on half of the atoms so that they don’t move during optimization.
In 2x2x3 TiO2 slab, 1.5 unit-cell is fixed by using selective dynamics. In case of
I
Pb
H
N
C Ti
O
23
CH3NH3PbI3 1x1x2 slab is prepared where two surfaces are obtained. One surface is MAI
terminated and the other one is PbI terminated. For both of these surfaces, individually
selective dynamics is applied on four layers which is one unit-cell. These are then
optimized to obtain reconstructed surfaces.
Before understanding the behavior of water molecule inside the interface of
CH3NH3PbI3 and TiO2, it is essential to understand the effect of moisture on each of these
optimized bulk surfaces such as MAI, PbI and TiO2 obtained after applying selective
dynamics. The water molecule is first arranged on TiO2 surface. Bond lengths of water on
TiO2 surface are referred from the research work by Predota et al. [37]. One water molecule
is arranged on a bulk surface in two separate ways [45]. This gives a platform to compare
two arrangements of water on TiO2 on the criterion of minimum energy. Likewise, water
is arranged on MAI and PbI terminated surfaces in two separate ways respectively [27].
According to the research performed on perovskite with water [27] the polarity of CH3NH3
is also taken into consideration which is complex in its own way. This leaves us with two
structures of MAI with water, two structures of PbI with water and two structures of TiO2
with water.
The structures with minimum energy after the completion of optimization process
are the more stable structures. These structures are later required in the stage where the
water intercalation is performed.
The step after this is developing interface structures using optimized CH3NH3PbI3
slab of 1x1x2 and TiO2 slab of 2x2x3. The structures that are used for constructing interface
are not initially surface reconstructed. It is important to make sure that there is 20 Å vacuum
in c-direction to avoid the unphysical interactions. With this setting twelve interface
24
structures are prepared. These structures are individually distinct because of multiple
criterions. Basically there are two sets of six structures one set of MAI interface and one
set of PbI interface. These two sets are further divided in the sets of three, here in three
structures TiO2 slab is rotated by 90° as compared to other three. Now each structure in a
set of three is different because of the initial distance between perovskite and TiO2 at the
interface. This difference is 0.5 Å. After preparing all these interfaces, single point energy
calculations (without optimization) are performed to obtain the energy of each structure.
All these values of energies are put together in an Excel file against the change of distance
in each set of three. So basically, in each set of three there is one reference interface and
two other interfaces with ± 0.5 Å distance. Next, the difference of energies from reference
structure with respect to change in distance is plotted. To find the difference in energies
the relations used are:
1. E0 => ΔE =0
2. E < => ΔE = E < - E 0
3. E > => ΔE = E > - E 0
Here E0 is the energy value of reference interface. E< is the value of energy of interface
with 0.5 Å distance smaller than the reference interface. E> is the value of energy of
interface with 0.5 Å distance larger than the reference interface. The energy values are
fitted with a parabolic curve. The equation for the parabolic curve generated is quadratic:
F(x) = ax2 + bx + c by differentiating this equation with respect to x the minimum value
for x can be calculated which can be referred to x0:
𝑥0 = −𝑏/2𝑎
Using this equation and with each set of three among 12 structures four new
structures are developed with x0 as their initial interface distance. These are: MAI and TiO2,
25
90° rotated TiO2 with MAI, PbI and TiO2, 90° rotated TiO2 with PbI. Further these four
structures with new interface distances are optimized using selective dynamics. There are
now two sets of structures with two interfaces (MAI and PbI) in each set. For MAI, the
structure with minimum energy is chosen, and similarly for PbI. This leaves us with two
optimized minimum energy structures one of each kind. These two structures can now be
used as most stable interfaces for intercalation of water.
2.2.2 Insertion of water molecule into the optimized interfaces of perovskite
and TiO2
Step 1: Measure the difference between the Z co-ordinates of waters oxygen atom and the
average Z co-ordinates of carbon, nitrogen and Iodine (for MAI surface or Pb and I atoms
for PbI surface) in the lowest energy optimized water on perovskite.
Step 2: Repeat step 1 for optimized water on TiO2 (Between Z co-ordinate of water oxygen
and average Z co-ordinate of oxygen on TiO2 surface).
Step 3: Add the results of step 1 and 2. This will be the approximate distance between
perovskite and TiO2 after water intercalation.
Step 4: Take the corresponding (MAI or PbI) minimum energy structure. Determine the
difference between average Z co-ordinates of C, N and I for MAI and subtract from it the
average of Z co-ordinates from oxygens on TiO2 surface. This will be the approximate
distance between TiO2 and perovskite without water intercalation.
Step 5: Subtract the results of step 4 from step 3.
Step 6: Add the result of step 5 to increase the distance between optimized minimum energy
corresponding interface of TiO2 and perovskite such that there will be room for water
intercalation. (There is no water yet).
26
Step 7: Insert one oxygen atom such that it will be closest to the orientation of oxygen from
water on the corresponding perovskite surface. Add two hydrogen atoms to oxygen to make
a water molecule and adjust the orientation of hydrogens such that they closely resembles
water on corresponding perovskite. Considering that we have two minimum energy
perovskite interfaces the aforementioned procedure in step 7 will give us two interface
structures with intercalated water.
Step 8: Repeat step 7 but use the orientation of water from optimized orientation of water
on TiO2. Considering that we have two interfaces between TiO2 and perovskite (MAI and
PbI) the aforementioned in step 8 will give us two interface structures with intercalated
water.
Step 9: Use the four interfaces structure with intercalated water for constrained
optimization.
2.2.3 WATER INTERCALATION GEOMETRY
We want to have four interface structures with water intercalation two coming from
MAI and two from PbI. For each interface there are two water geometries, one according
to water optimization corresponding to perovskite surface and one corresponding to TiO2
surface. The idea is that we increase the average interface distance such that a water
molecule can be accommodated in accordance with surface reconstruction upon water
adsorption. Then arrange water molecule at the interface such that it closely resembles the
adsorbed geometries on individual surfaces.
There are three problems that arise during initial structure setting for water
intercalation:
1. The unit cell of interface is in accordance to TiO2 surface and not that perovskite.
27
2. Rotation of MA molecules upon different optimizations.
3. Surface reconstructions are different from individual surface to interface surface
reconstruction.
Despite these problems we arranged water molecules at different interfaces as close as
possible to the geometries individually optimized for different surfaces.
For PbI terminated interface, for example, we choose the result whose water
molecule was initially set according to the water optimization on perovskite surface. This
structure is energetically favored by 84 meV ove the same interface whose water was
initially set according to water optimization on TiO2. We will continue the rest of the
calculation with this minimum energy structure. The structure characteristic are as follows:
Optimized interface distance before water intercalation = 2.59
Increase in distance with water intercalation = 1.51
The next step is to decrease this distance and optimize the structure with water and compare
energies at different interlayer distances. We decrease the distance in steps of 0.5 Å. To do
that we moved the whole structure of perovskite and TiO2 by 0.25 Å each while water is
kept at the same position. And, by applying the selective dynamics two ends are fixed and
the structure is optimized. After optimizing the structures three times, they are brought
close to the original distance which was obtained without water intercalation. In these three
steps, a plot is obtained with difference in minimum energies against distance from the
reference structure. This plot is fitted with a parabolic curve that is described by a
polynomial equation, which, when differentiated and equated to zero, gives a minimum
energy value for distance with respect to the reference curve. This distance calculated is

28
set between slabs and is allowed to relax. In this way, from the scratch the structures are
prepared and finally the effect of moisture is added in the interface.
29
CHAPTER 3 RESULTS AND DISCUSSION
3.1 Structure Optimization and Surface Reconstruction
The first and foremost step is to optimize the bulk structures using the structures
given in references [32] [29] utilizing the settings explained in the previous chapter. The
perovskite-structure unit cell has 48 atoms. The initial coordinates are those at 293K for
tetragonal structure including van der Waals interactions [32]. Similarly, TiO2 unit cell
structure is prepared based on the coordinates included in reference [29] and is optimized
using our settings. These optimized structures are used for subsequent modelling and
simulations.
The purpose of surface reconstruction is to obtain the realistic surface that accounts
for the boundary interface without crystal continuation. Surface reconstruction is achieved
by using a supercell that contains two-unit cells of perovskite and a vacuum layer, and
fixing one-unit cell while allowing the other unit cell of perovskite to optimize. The fixed
unit cell represents the bulk part of the material whereas the optimizing unit cell represents
boundary interface. Similarly, for TiO2 we use a super cell containing three unit cells of
TiO2 plus a vacuum layer with 1.5 TiO2 unit cells fixed and 1.5 TiO2 unit cells optimizing.
The surface reconstruction structures are presented in Figs 3.1, 3.2 and 3.3.
30
3.1.1 MAI surface of Perovskite as Interface
Figure 3.4 Two views, with second one rotated 90º with respect to the first, of bulk MAI
layer (a,b), and of the reconstructed MAI interface at vacuum (c,d)
In Figure 3.1 one can observe that there are two-unit cells extended in c-direction.
These two-unit cells include a total of eight layers of perovskite. Eight layers are considered
thick enough to represent the surface as explained by Mosconi [12]. Figure 3.1 (a) and (b)
are the two views of the same structure to clearly visualize the geometry of bulk structure
without surface reconstruction. The (a) and (b) structure is fully relaxed bulk and the
structure represented in (c) and (d) includes surface reconstruction. The PbI side is on the
top and MAI side is in the bottom for all the structures in this figure. In Figure 3.1 (c) and
(d) the unit cell size is larger because of the vacuum layer included. The vacuum is included
31
in c-direction to avoid the interaction between atoms in c-direction (it can happen if
vacuum is not included since the structures are periodic). In Figure 3.1 one can compare
(a,c) and (c,d) to observe the difference between bulk and surface reconstructed structures.
In (c,d) structure the top four layers from PbI to MAI are fixed and the bottom four layers
are allowed to relax. It can be clearly observed that the MA molecules reoriented, and both
of the iodine atoms moved a little from their regular location, whereas the Pb atoms are
less dislocated. If (b,d) views are compared one can tell that the bottom four layers tend to
move towards negative b-axis after surface reconstruction. These structures show the
significant effect of surface reconstruction clearly.
As explained by Hao et al. [28] in their research of perovskite with water on (001)
surface, they just included six layers of perovskite which was considered sufficient to
represent the properties of surface. They used three fixed layers out of their total six layers
in case of MAI interface, which is less than our four fixed layers. Similarly, in this thesis
half of the layers (one unit cell) away from the interface are fixed with selective dynamics.
The super cell dimension used in this thesis for perovskite includes 20 Å of vacuum as
compared to 15 Å mentioned for six layered structure by Hao et al.
32
3.1.2 PbI surface of Perovskite as Interface
Figure 3.5 Two views, with second one rotated 90º with respect to the first, of bulk PbI
layer (a,b), and of the reconstructed PbI interface at vacuum (c,d)
Similar to what we explained for Figure 3.1, in Figure 3.2, PbI terminated surface
is reconstructed since it can also form the interface. Figure 3.2 (c,d) represents surface
optimized with selective dynamics that has a vacuum of 20 Å. Similar vacuum layer is used
for all the structures which are surface reconstructed. In Figure 3.2 (c,d), the bottom four
layers of structure are allowed to optimize while the top four layers are kept fixed. The
surface reconstruction in Figure 3.2 is not as significant as in Figure 3.1. At MAI interface
the dipole moments of MA cations cause a relatively significant movement compared to
the initial orientation, as MA molecules are not connected with chemical bonds to the PbI
33
structure. These are minimum energy surfaces and at minimum energy the van der Waals
forces play a significant role in holding the MA molecule in place.
3.1.3 Surface reconstruction of TiO2 surface
Figure 3.6 Two views, with second one rotated 90º with respect to the first, of bulk TiO2
layer (a,b), and of the reconstructed TiO2 (001) interface at vacuum (c,d)
For TiO2, three layers facing the vacuum are reconstructed. These are 1.5 unit cells
as shown in Figure 3.3 (c,d). However, in perovskite just one-unit cell is fixed. The TiO2
structure is shown at the bottom of the vacuum and perovskite is shown at the top of the
vacuum (Figures 3.1 and 3.2), as these depict the conventional view of the interface with
light absorbing perovskite on top and electron collecting TiO2 electrode at the bottom.
34
The TiO2 2x2x3 slab size is considered to match the surface area of perovskite
structure in a-b plane. In Figure 3.3 (c,d), the structure is reconstructed. It is observed that
the oxygen atoms are slightly shifted towards the vacuum which is not the case in bulk
shown in Figure 3.3 (a,b). This slight shift of atoms is specified in the work published by
Geng et al. [32]. Although this change is not very large, it is noticeable.
3.1.4 Surface Reconstruction of Perovskite with water
Before observing effect of water molecule within the interface, it is essential to
determine its effect on the surface of the individual materials. It allows us to analyze the
lattice elongation in the perpendicular direction in the presence of water, dissociation on
the surface, and the degradation of material similar to previous studies [27] [28]. In Figure
3.4, the results of structure optimization of water adsorption on reconstructed MAI and PbI
terminated surfaces are shown. These are the minimum-energy structures.
35
Figure 3.7 Two views if the most stable hybrid perovskite surfaces after water adsorption,
with second one rotated 90º with respect to the first, of reconstructed MAI interface at
vacuum (a,b), and of the reconstructed PbI interface at vacuum (c,d)
Two initial positions of water molecule on the MAI perovskite layer are chosen
inaccordance with Koocher et al. [27]. For the MAI terminated surface in Figure 3.4 (a,b),
in one case water molecule is placed on the hollow site which is also considered by Hao et
al. [28] and in the other case water molecule is placed on one iodine atom. After
optimization of both structures the molecule on top of the hollow site showed the minimum
energy for the structure. For performing this optimization, the MAI surface reconstructed
structure from Figure 3.1 is used.
36
Similarly on PbI terminated surface, two initial structures are used for the
optimizations depicted in Figure 3.4 (c,d): in one case water molecule is placed on the
hollow site and in other case water molecule is placed on a Pb atom. After optimization of
both the structures the water molecule on top of the Pb atom showed the minimum energy
for the structure which is Figure 3.4 (c,d). The work performed by Koocher et al. [27]
includes extensive study of water on perovskite surfaces with the effect of orientation of
MA molecules.
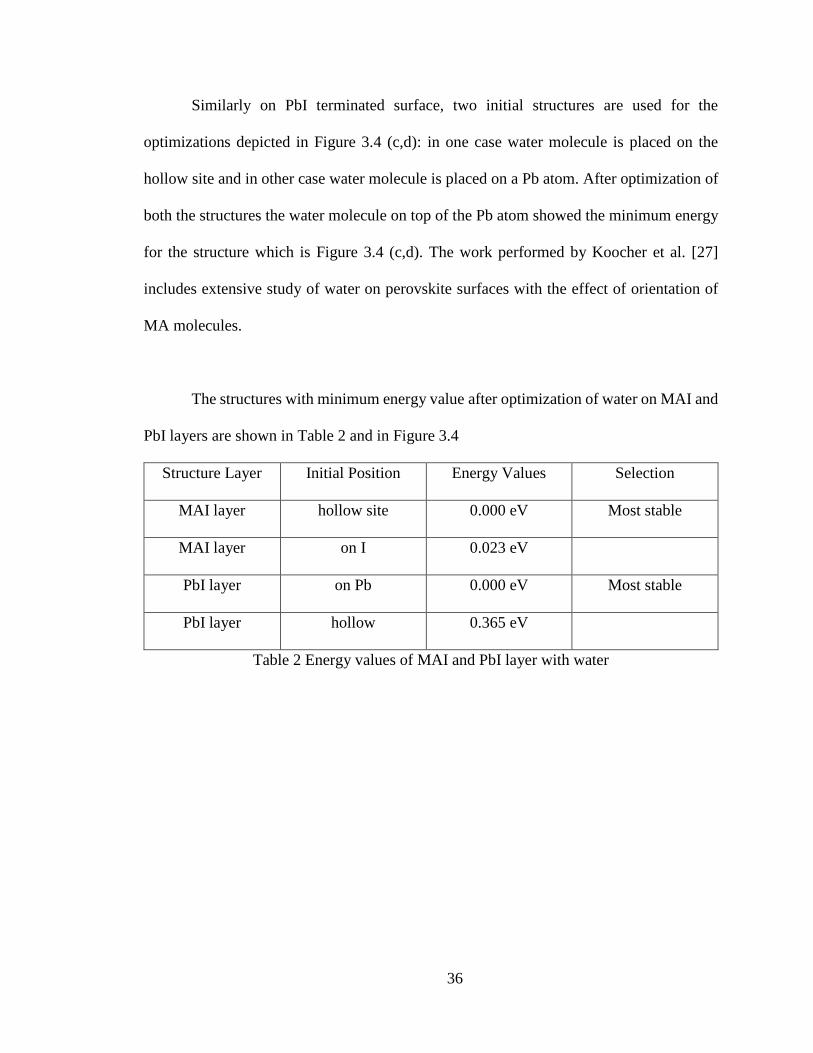
The structures with minimum energy value after optimization of water on MAI and
PbI layers are shown in Table 2 and in Figure 3.4
Structure Layer Initial Position Energy Values Selection
MAI layer hollow site 0.000 eV Most stable
MAI layer on I 0.023 eV
PbI layer on Pb 0.000 eV Most stable
PbI layer hollow 0.365 eV
Table 2 Energy values of MAI and PbI layer with water
37
3.1.5 Surface Reconstruction of TiO2 surface with water
Figure 3.8 Two views, with second one rotated 90º with respect to the first, of TiO2 slab
reconstructed at vacuum with water adsorbed
On TiO2 surface water molecule is placed on two distinct positions. The initial
bond length details are taken from the work by Predota et al. [37]. The structure with
minimum energy value is used for understanding the effect of water adsorption on TiO2
surface. In Figure 3.5 we present the minimum-energy optimized geometry of water
molecule on TiO2 surface reconstructed slab.
38
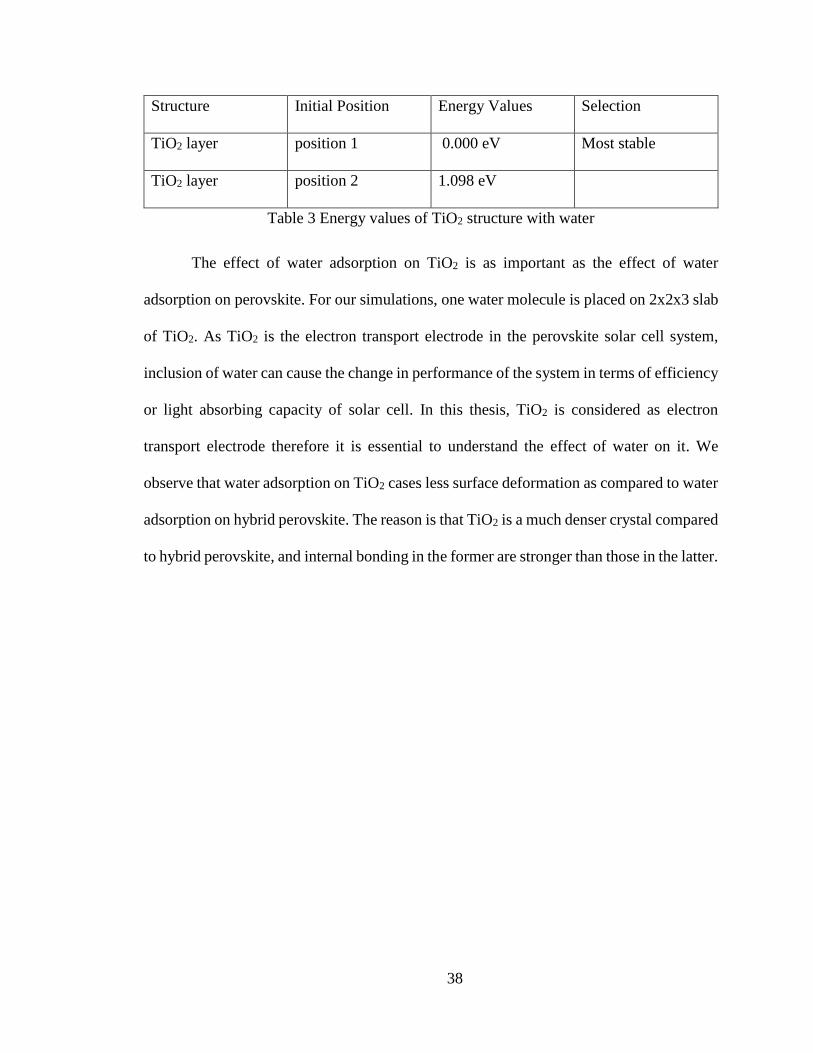
Structure Initial Position Energy Values Selection
TiO2 layer position 1 0.000 eV Most stable
TiO2 layer position 2 1.098 eV
Table 3 Energy values of TiO2 structure with water
The effect of water adsorption on TiO2 is as important as the effect of water
adsorption on perovskite. For our simulations, one water molecule is placed on 2x2x3 slab
of TiO2. As TiO2 is the electron transport electrode in the perovskite solar cell system,
inclusion of water can cause the change in performance of the system in terms of efficiency
or light absorbing capacity of solar cell. In this thesis, TiO2 is considered as electron
transport electrode therefore it is essential to understand the effect of water on it. We
observe that water adsorption on TiO2 cases less surface deformation as compared to water
adsorption on hybrid perovskite. The reason is that TiO2 is a much denser crystal compared
to hybrid perovskite, and internal bonding in the former are stronger than those in the latter.
39
3.2 Interface Structures
3.2.1 Perovskite-TiO2 interface without water
Figure 3.9 Two views with minimum energy of hybrid perovskite interface with TiO2,
with second one rotated 90º with respect to the first, for reconstructed MAI-TiO2
interface (a,b), and for the reconstructed PbI-TiO2 interface (c,d)
In Figure 3.6 the minimum energy structures for MAI and PbI interfaces with TiO2
are shown. These structures are obtained from a parabolic fit of total energies at three
different distances between the two surfaces. The interface is set 0.5 Å closer and 0.5 Å far
from the initial position set for the interface based on typical interfacial atomic bond
lengths. The difference of energy with respect to initial position energy is placed in a
40
tabular format against the value of displacement. From the parabolic fit curve a polynomial
is obtained which is differentiated to find the equation for minimum energy distance. In
this way, from twelve energy calculations at different interfacial distances, four minimum
energy structures are obtained. Two for MAI and two for PbI, corresponding to two
structures with 90º relative rotation of the perovskite structure parallel to the a-b plane.
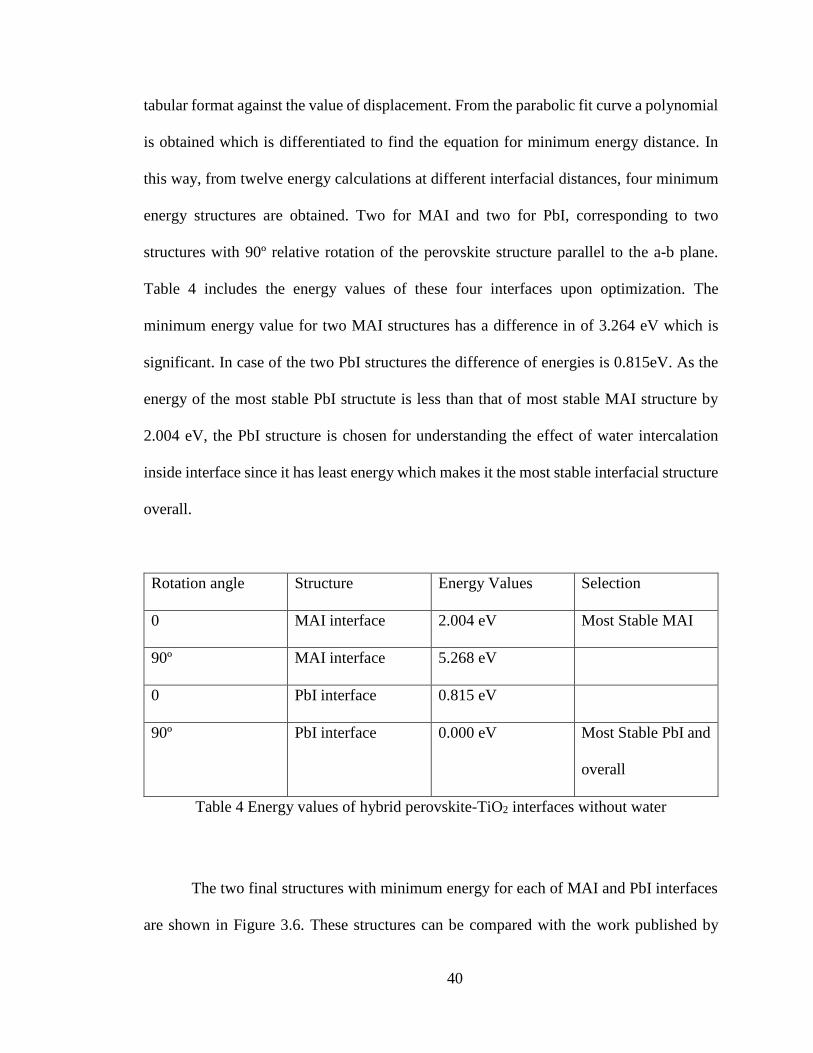
Table 4 includes the energy values of these four interfaces upon optimization. The
minimum energy value for two MAI structures has a difference in of 3.264 eV which is
significant. In case of the two PbI structures the difference of energies is 0.815eV. As the
energy of the most stable PbI structute is less than that of most stable MAI structure by
2.004 eV, the PbI structure is chosen for understanding the effect of water intercalation
inside interface since it has least energy which makes it the most stable interfacial structure
overall.
Rotation angle Structure Energy Values Selection
0 MAI interface 2.004 eV Most Stable MAI
90º MAI interface 5.268 eV
0 PbI interface 0.815 eV
90º PbI interface 0.000 eV Most Stable PbI and
overall
Table 4 Energy values of hybrid perovskite-TiO2 interfaces without water
The two final structures with minimum energy for each of MAI and PbI interfaces
are shown in Figure 3.6. These structures can be compared with the work published by
41
Geng et al. [32]. These are basically the optimized stable structures with rutile TiO2 and
two surfaces (MAI and PbI) of perovskite. In this thesis, the optimized cell parameters of
TiO2 in a-b (horizontal) plane are used to build the supercell of the interface. The structures
deform and there is a lattice mismatch. To understand the behavior of moment of electrons,
electrostatic potential plot is useful and to understand the energy required to transfer the
electron at the interface the density of plot is useful. These plots are derived in subsequent
chapters for the interfacial structures depicted in Figure 3.6, as well as for the PbI interface
including water intercalation.
42
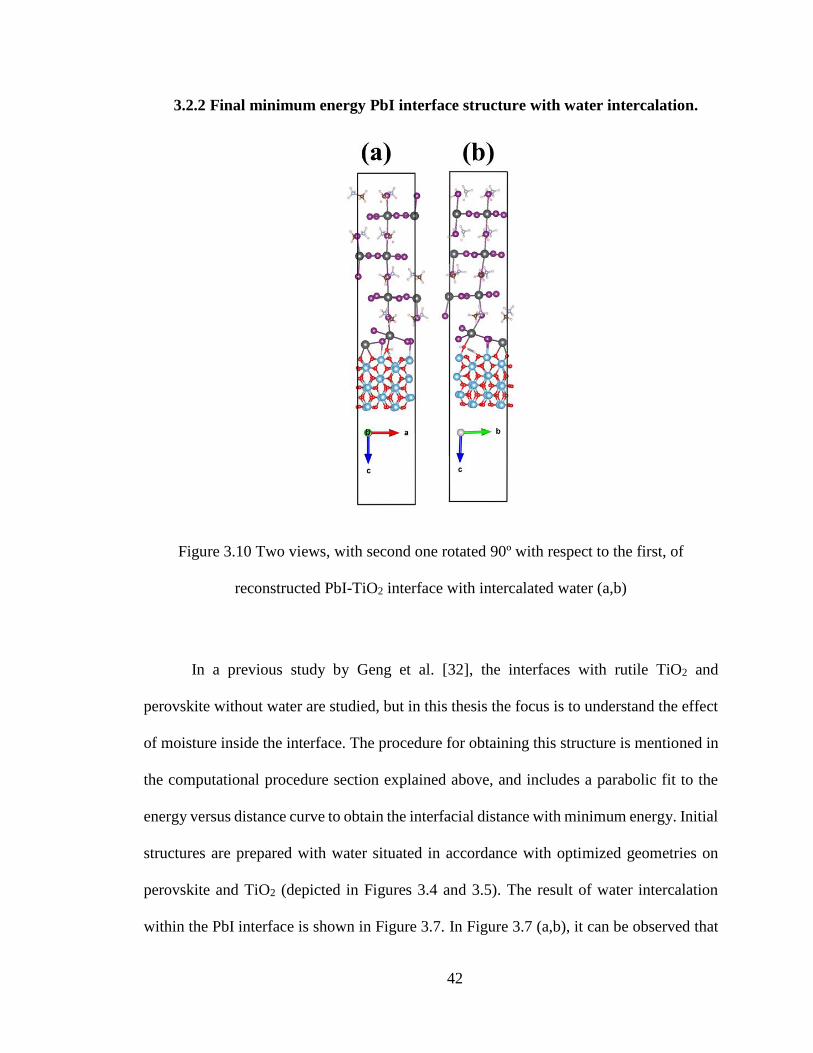
3.2.2 Final minimum energy PbI interface structure with water intercalation.
Figure 3.10 Two views, with second one rotated 90º with respect to the first, of
reconstructed PbI-TiO2 interface with intercalated water (a,b)
In a previous study by Geng et al. [32], the interfaces with rutile TiO2 and
perovskite without water are studied, but in this thesis the focus is to understand the effect
of moisture inside the interface. The procedure for obtaining this structure is mentioned in
the computational procedure section explained above, and includes a parabolic fit to the
energy versus distance curve to obtain the interfacial distance with minimum energy. Initial
structures are prepared with water situated in accordance with optimized geometries on
perovskite and TiO2 (depicted in Figures 3.4 and 3.5). The result of water intercalation
within the PbI interface is shown in Figure 3.7. In Figure 3.7 (a,b), it can be observed that
43
the PbI layer is severely deformed with the intercalation of water. This damage contributes
to reducing the performance of the system when used as a solar cell. With introduction of
one water molecule over one-unit cell there is degradation of the perovskite surface. The
damage to the performance of the interface is studied in the next sections when the
electrostatic potential plots are compared against the interface without water shown in
Figure 3.6 (c,d).
This study of interface with moisture gives an in-depth knowledge of structures
with respect to the change in properties of materials at the interface. In figure 3.7 (a,b), the
introduction of water did not cause much deformation on TiO2 whereas perovskite molded
to adapt the foreign material which is water molecule. This change is shown to modify
some of the internal characteristics of the interface structure and degrades the photovoltaic
application, as explained in the next sections.
44
3.3 Electronic Properties of Interface and Effects of Water Intercalation
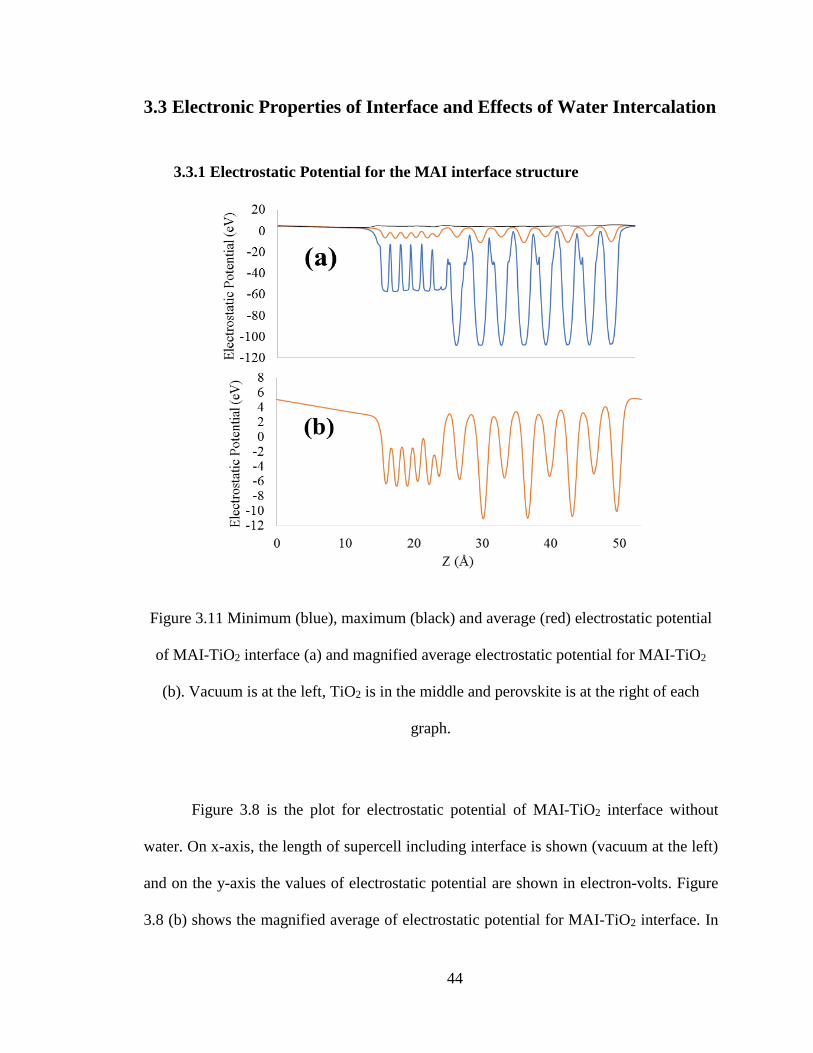
3.3.1 Electrostatic Potential for the MAI interface structure
Figure 3.11 Minimum (blue), maximum (black) and average (red) electrostatic potential
of MAI-TiO2 interface (a) and magnified average electrostatic potential for MAI-TiO2
(b). Vacuum is at the left, TiO2 is in the middle and perovskite is at the right of each
graph.
Figure 3.8 is the plot for electrostatic potential of MAI-TiO2 interface without
water. On x-axis, the length of supercell including interface is shown (vacuum at the left)
and on the y-axis the values of electrostatic potential are shown in electron-volts. Figure
3.8 (b) shows the magnified average of electrostatic potential for MAI-TiO2 interface. In
45
this curve, average electrostatic potential of perovskite material is higher than TiO2 which
shows the flow of electron is from perovskite to TiO2.
This result can be compared with the results produced by Geng et al. [32]. The
variations are almost same and so are the curves. In case of MAI the potential drop between
perovskite and TiO2 is not significant (as compared to the PbI case explained in the next
section) . The potential values of perovskite are not too high but are higher than TiO2. This
causes potential difference and electrons flow from perovskite to TiO2. If this potential drop
is higher then there is more electron saturation on TiO2 side with better electron-hole
separation.
46
3.3.2 Electrostatic Potential for PbI interface structure without and with water
Figure 3.12 Minimum (blue), maximum (black) and average (red) electrostatic potential
of PbI-TiO2 interface without water (a) and with water (b). Vacuum is at the left, TiO2 is
in the middle and perovskite is at the right of each graph.
Figure 3.9 gives the overview of perovskite PbI-TiO2 interface with and without
water. The deflection in curve is significant and can be clearly observed from the graph in
Figure3.9 (a,b). The region of interface where water is located can be easily located by just
looking at the plot.
Due to the introduction of water there is noticeable drop of potential values of
perovskite layers at the interface. This drop caused by water reduces the flow of charge
transfer. The drop in potential means drop in transfer of electrons. Thus humidity effect
47
reduces the amount of charge transfer. This can also be clearly observed in the average
plots in Figure 3.10 (a,b).
3.3.3 Average electrostatic potential for PbI interface structure without and with
water
Figure 3.13 Magnified average electrostatic potential of PbI-TiO2 interface without water
(a) and PbI-TiO2 interface with water (b). Vacuum is at the left, TiO2 is in the middle and
perovskite is at the right of each graph.
Figure 3.10 is the magnified version of the average electrostatic potential curves
from Figure 3.9. In this plot only the averages of maximum and minimum curves are
plotted. It can be observed from Figure 3.10 (a,b) that the overall electrostatic potential
48
value of the perovskite structure is lower in perovskite with water compared to perovskite
without water. However, the electrostatic potential of TiO2 is almost constant. Thus, the
difference in electrostatic potential of perovskite and TiO2 with water is lower and,
therefore, there is reduction in the flow of charge compared to the case of interface without
water. Thus, moisture adversely affects the photovoltaic performance of solar cell, and
humidity effect should be eliminated for obtaining better performance of perovskite in solar
cell application.
To describe the efficiency for a solar cell, the following relation can be used.
𝜂 =𝐼𝑠𝑐𝑉𝑜𝑐 (𝐹𝐹)
𝑃𝑖𝑛𝑝𝑢𝑡 𝑥 100 % [47].
Here, Isc is the short circuit current, Voc is the open circuit voltage, FF is the fill
factor, and Pinput is the input light power. The input power for the structure with water and
without water remains the same. There are several contributions to Voc corresponding to
potential drop at all interfaces in the solar cell. What we studied here is just one of those
interfaces. The average voltage difference between perovskite and TiO2 without water is
1.749 eV whereas with water it is 1.555 eV. This suggests lowering of Voc by 0.194 eV.
The total open circuit voltage cannot be determined within the scope of the current work,
but the inclusion of the change in electrostatic potential drop at perovskite-TiO2 interface
after water adsorption reduces efficiency. The reduction in short circuit current because of
the interfacial disorder caused by water intercalation further reduces efficiency.
49
3.3.4 Density of States
Figure 3.14 Density of states (DOS) of PbI-TiO2 interface without water (a) and with
water (b). Top of the valence band is at zero.
Density of states (DOS) provides another measure for assessing water intercalation
effects on perovskite solar cell performance. Figure 3.11 shows that upon water
intercalation, the band gap of interface increases. This means that the radiation frequency
needed to excite charge carriers in the case with water is larger than that in the case without
water. Water intercalation therefore can reduce the efficiency of carrier excitation by
visible light, thereby reducing efficiency of photovoltaic performance.

50
CHAPTER 4 CONCLUSIONS
Hybrid organic-inorganic perovskite materials are excellent candidates for
photovoltaic solar energy harvesting, owing to their high efficiency and relatively low cost.
Their widespread usage, however, is diminished because of important limitations including
stability under working conditions. Humidity is known to degrade tese materials and reduce
the efficiency of solar energy conversion. In order to understand details of water inclusion
effects on solar cell performance, here we perform ab initio simulations on interfaces of
hybrid perovskite lead-iodide material and TiO2 electrode. Surface reconstructions and
interface geometries are obtained in absence and presence of water, along with electronic
structures (electrostatic potential and density of states).
Our results show that water intercalation at interface results in significant
rearrangement of interface geometry. The corresponding electronic structure shows
degradation of photovoltaic performance upon water intercalation. Specifically, the
electrostatic potential difference between perovskite and electrode diminishes in presence
of water, indicating less charge transfer between hybrid perovskite and electrode. Density
of states shows increased gap in presence of water indicating less efficient carrier excitation
in optical range of radiation. These results provide detailed insight into solar cell
performance degradation in presence of water, and can be used for addressing this stability
issue of hybrid perovskite solar cells.
51
REFERENCES
1. M. A. Green, "The path to 25% silicon solar cell
efficiency:History of silicon cell evolution," Progress in
Photovoltaics, 17,183–189, 2009.
2. J. H. Zhao, A. Wang, M. A. Green, "24·5% Efficiency silicon
PERT cells on MCZ substrates and 24·7% efficiency PERL cells
on FZ substrates," Prog. Photovoltaics, 7, 471-474, 1999.
3. A. Descoeudres, C. Allebe, N. Badel, L. Barraud, J. Champliaud,
F. Debrot, A. Faes, A. Lachowicz, J. Levrat, S. Nicolay, L.
Sansonnens, M. Despeisse, C. Ballif, "Silicon Heterojunction
Solar Cells: Towards Low-cost High-Efficiency Industrial
Devices and Application to Low-concentration PV," Energy
Procedia,77, 508-514, 2015.
4. C. Battaglia, A. Cuevas, S. Wolf, "High-efficiency crystalline
silicon solar cells:status and perspectives," Energy Environ.
Sci.,,9, 1552-1576, 2016.
52
5. A. Kojima, K. Teshima, Y. Shirai, T. Miyasaka, "Organometal
Halide Perovskites as Visible-Light Sensitizers for Photovoltaic
cells," J. AM. CHEM. SOC.,131, 6050–6051, 2009.
6. P. Pratiwi, "Optical Properties Degradation of Organo lead
Halide Perovskite with lead derived from solder wire," TEKNIK
MESIN, 7, 51-55, 2017.
7. G. C. Papavassiliou, G. A. Mousdis, G. C. Anyfantis, "Organic-
Inorganic Hybrid Compounds Based on Lead Halide Units:
Preparation from Melts and through Grinding Effects," Z.
Naturforsch.,65b, 516-520, 2010.
8. K. Yamada, H. Kawaguchi, T. Matsui, T. Okuda and S. B.
Ichiba, Chem., 63, 2521–2525., 1990.
9. M. M. Lee, J. Teuscher, T. Miyasaka, T. N. Murakami and H. J.
Snaith, "Efficient hybrid solar cells based on Meso-
superstrucutred organometal Halide Perovskites," Science,338,
643-647, 2012.
10. H. S. Kim, C. R. Lee, J. H. Im, K. B. Lee, T. Moehl, A.
Marchioro, S. J. Moon, R. Humphry-Baker, J. H. Yum and J. E.
Moser, "Lead Iodide perovskite sensitized all solid state
53
submicron thin film mesoscopic solar cell with efficiency
exceeding 9%," Science,2,591-597, 2012.
11. E. Mosconi, A. Amat, Md. Nazeeruddin, M. Gratzel, F. Angelis,
"First-Principles Modeling of Mixed Halide Organometal
Perovskites for photovoltaic applications," J. Phys. Chem.
C,117,13902−13913, 2013.
12. K. Korshunova, L. Winterfeld, W. Beenken, E. Runge,
"Thermodynamic stability of mixed Pb:Sn Methyl-ammonium
halide perovskites," Phys. Status Solidi B,10, 1907-1915, 2016.
13. J. Klimes, D. Bowler, A. Michaelides, "Chemical accuracy for
the van der Waals density functional," JOURNAL OF
PHYSICS,22, 1-5, 2010.
14. A. Poglitsch, D. Weber, "Dynamic Disorder in
Methylammoniumtrihalogenoplumbates," J. Chem.
Phys.,87,6373, 1987.
15. M. T. Weller, O. J. Weber, P. F. Henry, A. M. Di Pumpo, T.
Hansen, "Complete Structure and Cation Orientation in the
perovskite photovoltaic methylammonium lead iodide between
100 and 352 K," Chem. Commun.,51, 4180−4183, 2015.
54
16. Ana L. Montero-Alejo, E. Proupin, D. Rojas, P. Palacios, P.
Wahnon, J. Conesa, "Modeling of Thermal Effect on the
Electronic Properties of Photovoltaic Perovskite CH3NH3PbI3:
The Case of Tetragonal Phase," J. Phys. Chem., 120,
7976−7986, 2016.
17. Y. Kawamura, H. Mashiyama and K. Hasebe, "Structural Study
on Cubic-Tetragonal Transition of CH3NH3PbI3," J. Phys. Soc
Jpn,71, 1694−1697, 2002.
18. C. C. Stoumpos, C. D. Malliakas and M. G. Kanatzidis,
"Semiconducting Tin and Lead Iodide Perovskites with Organic
Cations: Phase Transitions, High Mobilities, and Near-Infrared
Photoluminescent Properties," Inorg. Chem,52, 9019−9038.,
2013.
19. G. Kresse, J.FurthMuller., "Efficiency of ab-initio total energy
calculations for metals and semiconductors using a plane-wave
basis set.," Computational material science,6, 15-50, 1996.
20. G. Kresse, J. Furthmuller, "Efficient iterative schemes for ab
initio total energy calculations using a plane-wave basis set,"
Phys Review B.,54, 11 169-11 186, 1996.
55
21. W. Kohn, P. HOHENBERG, "Inhomogeneous electron gas,"
Physical Review.,136, 864-871, 1964.
22. W. Kohn, L. SHAM, "Self-Consistent Equations Including
Exchange and Correlation Effects," Physical Review,140,1133-
1138, 1965.
23. Z. Wu, R. Cohen, "A More accurate generalized gradient
approximation for solids," Physical Review,73, 1-5, 2006.
24. J. Perdew, K. Burke, M. Ernzerhof, "Generalizied gradient
approximation made simple," Phys. Rev. Lett.,77, 3865–3868,
1996.
25. F. Fabregat-santiago, J. Bisquert, L. Cevey, P. Chen, M. Wang,
S. Zakeeruddin, M. Gratzel, "Electron Transport and
Recombination in solid state dye solar cell with Spiro-OMeTAD
as Hole Conductor," JACS articles,131, 558-562, 2008.
26. N. Koocher, D. Greco, F. Wang, S. Liu, A. Rappe, "Polarization
Dependence of Water Adsorption to CH3NH3PbI3 (001)
surfaces," J. Phys. Chem.,6, 4371−4378, 2015.
27. W. Hao, X. Chen, S. Li, "Synergistic Effects of Water and
Oxygen Molecule Co-adsorption on (001) Surfaces of
56
Tetragonal CH3NH3PbI3: A First-Principles Study," J. Phys.
Chem.,120, 28448−28455, 2016.
28. F. GRANT, "Properties of Rutile (Titanium Dioxide)," Reviews
of Modern Physics,31,646-673, 1959.
29. J. Delville, Compt.rend,233, 944, 1953.
30. W.H.Baur, Acta Cryst,9,515, 1956.
31. W. Geng, C. Tong, J. Liu, W. Zhu, W. Lau, L. Liu, "Structures
and Electronic Properties of Different CH3NH3PbI3/ TiO2
Interface: A First-Principles Study," Scientific Reports, 6,1-8,
2016.
32. U. Diebold, "The surface science of Titanium Dioxide," Elsevier
science, 48, 53-229, 2003.
33. M. Grätzel, "Photoelectrochemical cells," Macmillan Magazines
Ltd, 414, 2001.
34. N. Sakai, R. Wang, A. Fujishima, T. Watanabe, K. Hasimoto,
"Photogeneration of Highly Amphiphilic TiO2 Surfaces," Adv.
Mater., 10, 135-138, 1998.
35. T. Zheng, C. Wu, M. Chen, Y. Zhang, P. Cummings, "A DFT
study of water adsorption on rutile TiO2 (110) surface: The
57
effects of surface steps," American Institute of Physics,145,
044702, 2016.
36. M. Predota, A. Bandura, P. Cummings, J. Kubicki, D.
Wesolowski, A. Chialvo, M. Machesky, "Electric Double Layer
at the Rutile (110) Surface. 1. Structure of Surfaces and
Interfacial Water from Molecular Dynamics by Use of ab Initio
Potentials," J. Phys. Chem., 108, 12049-12060, 2004.
37. K. Edgecombe, A. Becke, "A simple measure of electron
localization in atomic and molecular systems," American
Institute of Physics, 92, 5397-5403, 1990.
38. S. Sinnit, "Introduction to Computational Materials Science,"
Physics Today, 67, 52-54, 2014.
39. M.M.G. Alemany, M. Jain, M. Tiago, Y. Zhou, Y. Saad, J.
Chelikowsky, "Efficient first principles calculations of the
Electronic strucutres of Periodic Systems," Computer Physics
Communications, 177, 339-347, 2007.
40. A. D. Becke, "Perspective: Fifty years of density-functional
theory in chemical physics," The Journal of Chemical
Physics,140, 1-15, 2014.
58
41. J. Perdew, A. Zunger, "Self-interaction correction to density-
functional approximations for many electron systems," Physics
Review, 23, 5048-5079, 1981.
42. N. Troullier, J. Martins, "EfFicient pseudopotentials for plane-
wave calculations," Physical Review B, 43, 1993-2006, 1991.
43. P. E. Blochl, "Projector augmented-wave method," Physical
review B, 50, 17953-17979, 1994.
44. L. Liu, C. Zhang, G. Thornton, A. Michaelides, "Structure and
dynamics of liquid water on rutile TiO2(110)," Physical Review
B, 82, 61415-1-161415-4, 2010.
45. T. Berhe, W. Su, C. Chen, C.Pan, J.Cheng, H.Chen, M.Tsai,
L.Chen, A. Dubale, B. Hwang, “Organometal halide perovskite
solar cells: degradation and stability,” Royal Society of
Chemistry, 10, 1039, 2015.
46. M. Salado, L. Bernal, L.Calio, A. Todinova, C. Santos, S.
Ahmad, A. Borras, J.Idigoras, J.Anta, “Impact of moisture on
efficiency-determining electronic processes in perovskite solar
cells,” Royal Society of Chemistry, 5, 10917-10927,2017
47. J. Nelson, “The Physics of Solar Cells” Imperial College Press,
12, 2003