Embed Size (px)
Citation preview
HAL Id: tel-01590262https://tel.archives-ouvertes.fr/tel-01590262
Submitted on 19 Sep 2017
HAL is a multi-disciplinary open accessarchive for the deposit and dissemination of sci-entific research documents, whether they are pub-lished or not. The documents may come fromteaching and research institutions in France orabroad, or from public or private research centers.
L’archive ouverte pluridisciplinaire HAL, estdestinée au dépôt et à la diffusion de documentsscientifiques de niveau recherche, publiés ou non,émanant des établissements d’enseignement et derecherche français ou étrangers, des laboratoirespublics ou privés.
Ab initio prediction of crystalline phases and theirelectronic properties : from ambient to extreme
pressuresJingming Shi
To cite this version:Jingming Shi. Ab initio prediction of crystalline phases and their electronic properties : from ambientto extreme pressures. Cristallography. Université de Lyon, 2017. English. �NNT : 2017LYSE1110�.�tel-01590262�
No d’ordre NNT : 2017LYSE1110
THÈSE DE DOCTORAT DE L’UNIVERSITÉ DE LYONopérée au sein de
l’Université Claude Bernard Lyon 1
École Doctorale ED52Physique et d’Astrophysique de Lyon
Spécialité de doctorat :Discipline : Physique
Soutenue publiquement le 06/07/2017, par :Jingming SHI
Ab initio prediction of crystallinephases and their electronic properties :
from ambient to extreme pressures
Devant le jury composé de :
NIEHAUS Thomas, Professeur, Université Claude Bernard Lyon 1 Président
BLASE Xavier, Directeur de Recherches CNRS, Institut Néel, Grenoble RapporteurSAITTA Marco, Professeur, Université Pierre et Marie Curie-Paris-Sorbonne RapporteurRADESCU Silvana, Professeur, Universidad de la Laguna ExaminatriceMARTINET Christine, IR CNRS, Université Claude Bernard Lyon 1 ExaminatriceMARQUES Miguel, Professeur, Martin-Luther-Universität Examinateur
BOTTI Silvana, Professeur, Friedrich-Schiller University of Jena Co-directrice de thèseSAN MIGUEL Alfonso, Professeur, Université Claude Bernard Lyon 1 Directeur de thèse

ii
Abstract
In this thesis we use global structural prediction methods (Particle Swarm Optimization and
Minima Hopping Method) and high-throughput techniques to predict crystal structures of
different systems under different conditions. We performed structural prediction by using
the Crystal structure Analysis by Particle Swarm Optimization(CALYPSO) combined with
Density Functional Theory (DFT) that made possible to unveil several stable compounds,
so far unknown, on the phase diagrams of Ba–Si and N–H–O. Afterwards, we performed a
high-throughput investigation on ternary compounds of composition ABX2, where A and B
are elements of the periodic table up to Bi, and X is a chalcogen (O, S, Se, and Te) by using
DFT and combining calculations of crystal prototypes with structural prediction (Minima
Hopping Method). The following paragraphs summarize the content by chapter of this
document.
Chapter 1 is a short introduction of this thesis.
Chapter 2 includes the basic theory used in this thesis. Firstly, a short introduction of
DFT is presented. Then, we describe some approximate exchange-correlation functions that
make DFT practical. Next, we introduce different structural prediction algorithms, especially
Particle Swarm Optimization and Minima Hopping Method which we used in this thesis.
Finally, we discuss how to determine if a new structure is thermodynamically stable.
In Chapter 3, we first consider the Ba–Si system. Using an unbiased structural search
based on a particle-swarm optimization algorithm combined with DFT calculations, we
investigate systematically the ground-state phase stability and structural diversity of Ba–Si
binaries at high pressure. The phase diagram turns out to be quite intricate, with several
compositions stabilizing/destabilizing as a function of pressure. In particular, we identify
novel phases of BaSi, BaSi2, BaSi3, and BaSi5 that might be synthesizable experimentally
over a wide range of pressures. Our results not only clarify and complete the previously
known structural phase diagram, but also provide new insights for understanding the Ba–Si
binary system.
Chapter 4 contains the investigation of the phases diagram of the N–H–O system. By
using an ab initio evolutionary structural search, we report the prediction of two novel stable
crystalline phases in the N–H–O ternary phase diagram at high pressure, namely NOH4 and
iv
HNO3 (nitric acid). Our calculations reveal that the new C2/m phase of NOH4 becomes
stable at 71 GPa, while the P21/m phase of HNO3 stabilizes at 39 GPa. Both phases remain
thermodynamically stable at least up to 150 GPa, the maximum pressure we considered. The
C2/m phase of NOH4 contains two O–H layers and one “dumbbell cluster” layer formed by
two NH3 molecules linked by a N–N covalent bond. The P21/m phase of HNO3 contains a
surprising “quasi clover” layer formed N–O–H covalent bonds. Further calculations show
that both phases are semiconductors, with a band gap of 6.0 eV and 2.6 eV for NOH4 and
NHO3, respectively. We also confirmed that the composition NOH5 (NH3H2O) becomes
unstable at pressures above 122 GPa, decomposing into NH3 and H2O.
Chapter 5 focuses on p-type transparent electrodes of ternary chalcogenides. We use a
high-throughput approach based on DFT to find delafossite and related layered phases of
composition ABX2, where A and B are elements of the periodic table, and X is a chalcogen
(O, S, Se, and Te). From the 15 624 compounds studied in the trigonal delafossite prototype
structure, 285 are within 50 meV/atom from the convex hull of stability. These compounds
are further investigated using global structural prediction methods to obtain their lowest-
energy crystal structure. We find 79 systems not present in the "materials project database"
that are thermodynamically stable and crystallize in the delafossite or in closely related
structures. These novel phases are then characterized by calculating their band gaps and
hole effective masses. This characterization unveils a large diversity of properties, ranging
from normal metals, magnetic metals, and some candidate compounds for p-type transparent
electrodes.
At the end of the thesis, we give our general conclusions and an outlook.
Résumé
Dans cette thèse nous utilisons des méthodes globaux de prédiction des structures cristallo-
graphiques avec les algorithmes d’optimisation par essaims particuliers (« Particle Swarm
Optimization » en anglais) et de « Minima Hopping Method » combinés à des techniques
de grande capacité de traitement de données afin de prédire la structure cristalline de dif-
férents systèmes et dans des conditions thermodynamiques variées. Nous avons réalisé des
prédictions structurales utilisant l’analyse cristalline par optimisation par essaims particuliers
(CALYPSO) combinés avec la Théorie Fonctionnelle de la Densité (DFT) ce qui a permis de
mettre en évidence la stabilité de plusieurs composés jusqu’à la inconnus dans le digramme
de phases du système Ba–Si et dans le système N–H–O. Nous avons également réalisé une
étude à haute capacité de traitement de données sur un système ternaire de composition
ABX2, avec A et B des éléments du tableau périodique allant jusqu’au bismuth et X étant un
chalcogénure (O, S, Se ou Te) . Nous avons utilisé la Théorie Fonctionnelle de la Densité
combinant calculs de prototypes structuraux à partir des prédictions structurelles avec la
méthode de « Minima Hopping ». Dans les paragraphes suivants nous résumons le contenu
de différents chapitres de cette thèse.
Le premier chapitre qui constitue une brève introduction au travail de cette thèse est suivi
du chapitre 2 présentant les aspects théoriques utilisés dans ce travail. D’abord il est fait une
brève introduction à la Théorie Fonctionnelle de la Densité. A continuation nous décrivons
quelques fonctions d’échange-corrélation choisies qui constituent des approximations rendant
l’utilisation de la DFT efficace. Ensuite nous présentons différents procédés de prédiction
structurale, et en particulier les algorithmes d’optimisation par essaims particuliers et de «
Minima Hopping » eu nous avons utilisés dans cette thèse. Finalement il est discuté comment
doit-on se prendre pour évaluer la stabilité thermodynamique des nouvelles phases identifiées.
Dans le chapitre 3, nous considérons le système Ba-Si. A travers l’utilisation d’une
recherche structurale non-biaisée basée sur l’algorithme d’optimisation par essaims partic-
uliers combinée avec des calculs DFT, nous faisons une étude systématique de la stabilité
des phases et de la diversité structurale du système binaire Ba-Si sous haute pression. Le
diagramme de phases résultant est assez complexe avec plusieurs compositions se stabilisant
et se déstabilisant en fonction de la pression. En particulier, nous avons identifié des nouvelles
vi
phases de stœchiométrie BaSi, BaSi2, BaSi3 et BaSi5 qui devraient pouvoir être synthétisées
expérimentalement dans un domaine de pressions étendu. Nos résultants permettent non
seulement de compléter le diagramme de phase de Ba–Si, mais ils donnent plus largement
des clefs pour la compréhension du système binaire Ba–Si.
Dans le chapitre 4 est présentée notre étude du diagramme de phases du système N–H–O.
S’appuyant sur une recherche structural «évolutive » de type ab initio, nous prédisons deux
nouvelles phases du système ternaire N–H–O qui sont NOH4 et HNO3 (acide nitrique).
La nouvelle phase de NOH4 a une symétrie C2/m et devient stable à partir de 71 GPa
tandis que la phase P21/m de HNO3 est stabilisée à 39 GPa. Les deux phases restent
thermodynamiquement stables jusqu’à 150 GPa, la pression limite de notre étude. La phase
C2/m de NOH4 présente deux couches O–H et une couche de type agrégat d’haltères formée
de deux molécules NH3 connectées par des liaisons covalentes N–N. La phase P21/m de
HNO3 (acide nitrique) contient une couche surprenante de type quasi-trèfle formée des
liaisons covalentes N–O–H. Le calcul de la structure électronique montre que les deux phases
sont semiconductrices. Les gaps électroniques pour les phases de NOH4 et NHO3 sont de 6.0
et 2.6 eV respectivement. Nous confirmons également que la composition NOH5 (NH3H2O)
perd son stabilité pour des pressions supérieures à 122 GPa se décomposant en NH3 et H2O
à cette pression.
Le chapitre 5 se focalise sur les électrodes transparentes de type-p à base des chalcogénures
ternaires. Nous utilisons une approche à grande capacité de traitement de données basée
sur la DFT pour obtenir la delafossite et d’autres phases voisines de composition ABX2,
avec A et B des éléments du tableau périodique et X des chalcogénures (O, S, Se et Te). A
partir d’an total de 15624 composés étudiés dans la structure prototypique de la delafossite,
285 structures se trouvent dans la limite de stabilité d’enveloppe convexe avec une marge
de dispersion de 50 meV/atome. Ces composés sont étudiés par les méthodes de prédiction
structurale afin d’obtenir leur structure cristalline de plus basse énergie. Nous trouvons 79
systèmes qui sont absents de la base de données « Materials project database », qui sont
stables du point de vue thermodynamique et qui cristallisent soit dans la structure delafossite,
soit dans des structures très proches. Ces nouvelles phases sont ensuite caractérisées détermi-
nant leur gap électronique et la masse effective des trous. Cette caractérisation révèle une
grande diversité de propriétés allant depuis les métaux ordinaires aux métaux magnétiques et
permettant d’identifier quelques candidats pour des électrodes transparents de type-p.
Nous présentons enfin à la fin du manuscrit nos conclusions générales et les perspectives
de ce travail.
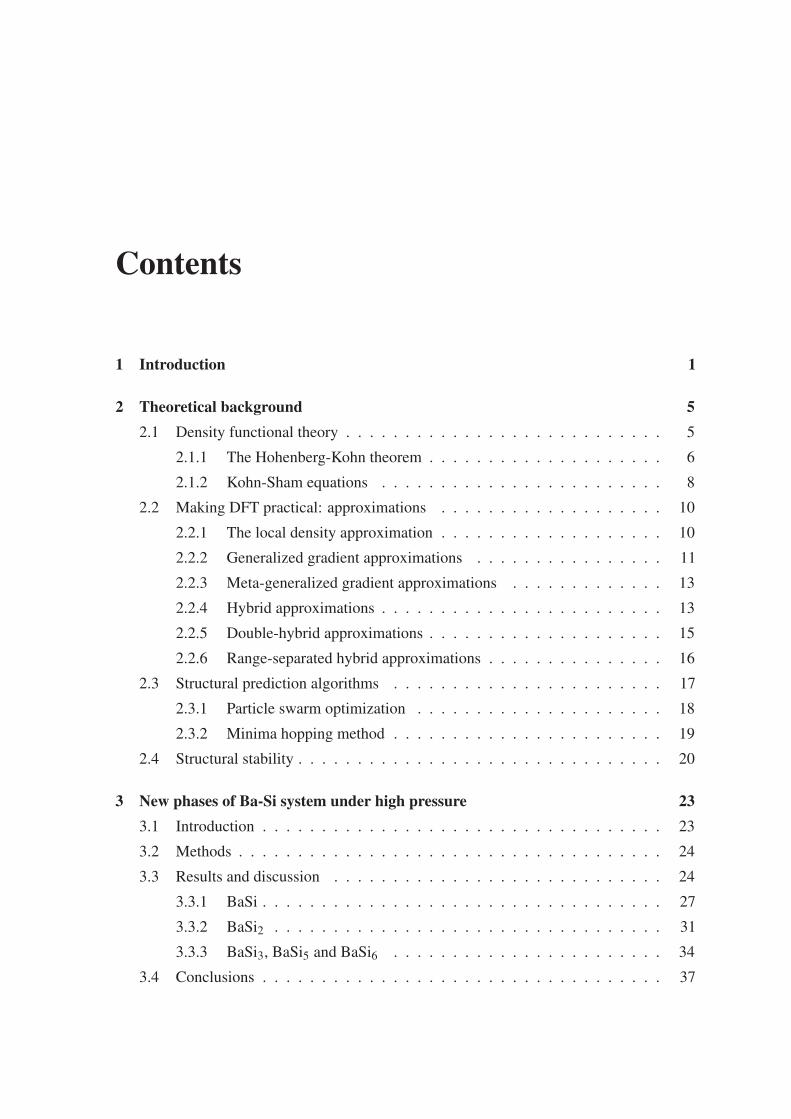
Contents
1 Introduction 1
2 Theoretical background 52.1 Density functional theory . . . . . . . . . . . . . . . . . . . . . . . . . . . 5
2.1.1 The Hohenberg-Kohn theorem . . . . . . . . . . . . . . . . . . . . 6
2.1.2 Kohn-Sham equations . . . . . . . . . . . . . . . . . . . . . . . . 8
2.2 Making DFT practical: approximations . . . . . . . . . . . . . . . . . . . 10
2.2.1 The local density approximation . . . . . . . . . . . . . . . . . . . 10
2.2.2 Generalized gradient approximations . . . . . . . . . . . . . . . . 11
2.2.3 Meta-generalized gradient approximations . . . . . . . . . . . . . 13
2.2.4 Hybrid approximations . . . . . . . . . . . . . . . . . . . . . . . . 13
2.2.5 Double-hybrid approximations . . . . . . . . . . . . . . . . . . . . 15
2.2.6 Range-separated hybrid approximations . . . . . . . . . . . . . . . 16
2.3 Structural prediction algorithms . . . . . . . . . . . . . . . . . . . . . . . 17
2.3.1 Particle swarm optimization . . . . . . . . . . . . . . . . . . . . . 18
2.3.2 Minima hopping method . . . . . . . . . . . . . . . . . . . . . . . 19
2.4 Structural stability . . . . . . . . . . . . . . . . . . . . . . . . . . . . . . . 20
3 New phases of Ba-Si system under high pressure 233.1 Introduction . . . . . . . . . . . . . . . . . . . . . . . . . . . . . . . . . . 23
3.2 Methods . . . . . . . . . . . . . . . . . . . . . . . . . . . . . . . . . . . . 24
3.3 Results and discussion . . . . . . . . . . . . . . . . . . . . . . . . . . . . 24
3.3.1 BaSi . . . . . . . . . . . . . . . . . . . . . . . . . . . . . . . . . . 27
3.3.2 BaSi2 . . . . . . . . . . . . . . . . . . . . . . . . . . . . . . . . . 31
3.3.3 BaSi3, BaSi5 and BaSi6 . . . . . . . . . . . . . . . . . . . . . . . 34
3.4 Conclusions . . . . . . . . . . . . . . . . . . . . . . . . . . . . . . . . . . 37
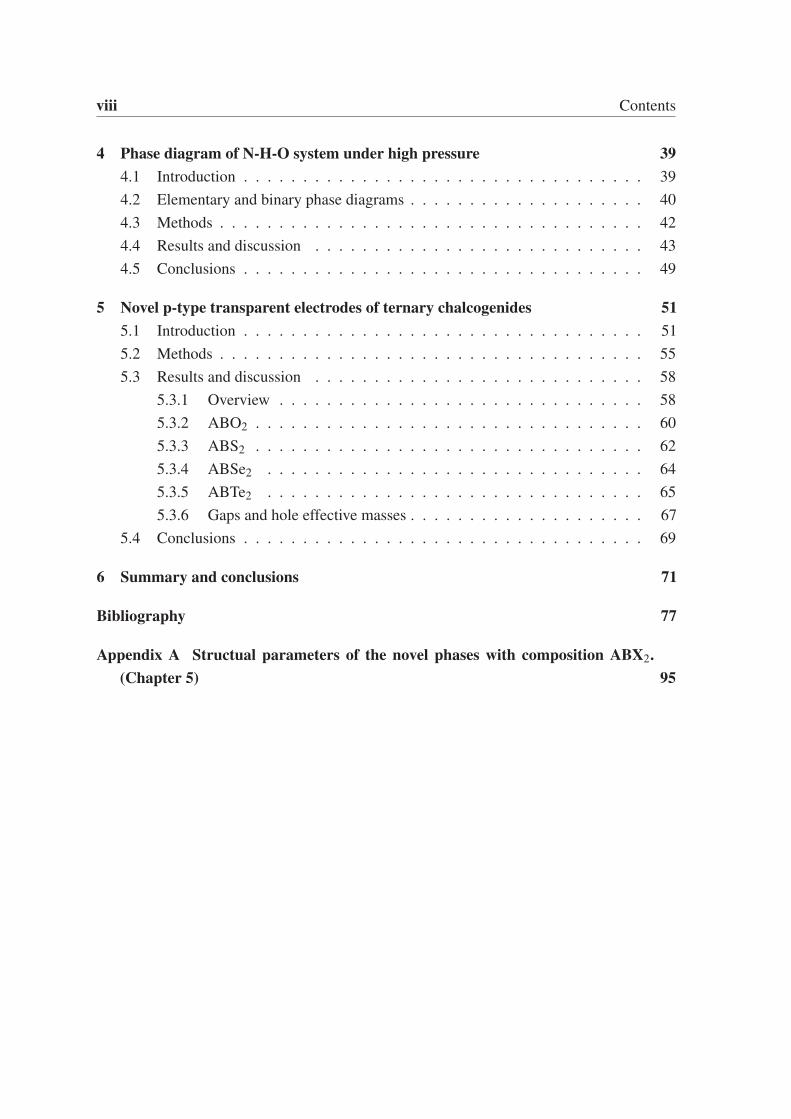
viii Contents
4 Phase diagram of N-H-O system under high pressure 394.1 Introduction . . . . . . . . . . . . . . . . . . . . . . . . . . . . . . . . . . 39
4.2 Elementary and binary phase diagrams . . . . . . . . . . . . . . . . . . . . 40
4.3 Methods . . . . . . . . . . . . . . . . . . . . . . . . . . . . . . . . . . . . 42
4.4 Results and discussion . . . . . . . . . . . . . . . . . . . . . . . . . . . . 43
4.5 Conclusions . . . . . . . . . . . . . . . . . . . . . . . . . . . . . . . . . . 49
5 Novel p-type transparent electrodes of ternary chalcogenides 515.1 Introduction . . . . . . . . . . . . . . . . . . . . . . . . . . . . . . . . . . 51
5.2 Methods . . . . . . . . . . . . . . . . . . . . . . . . . . . . . . . . . . . . 55
5.3 Results and discussion . . . . . . . . . . . . . . . . . . . . . . . . . . . . 58
5.3.1 Overview . . . . . . . . . . . . . . . . . . . . . . . . . . . . . . . 58
5.3.2 ABO2 . . . . . . . . . . . . . . . . . . . . . . . . . . . . . . . . . 60
5.3.3 ABS2 . . . . . . . . . . . . . . . . . . . . . . . . . . . . . . . . . 62
5.3.4 ABSe2 . . . . . . . . . . . . . . . . . . . . . . . . . . . . . . . . 64
5.3.5 ABTe2 . . . . . . . . . . . . . . . . . . . . . . . . . . . . . . . . 65
5.3.6 Gaps and hole effective masses . . . . . . . . . . . . . . . . . . . . 67
5.4 Conclusions . . . . . . . . . . . . . . . . . . . . . . . . . . . . . . . . . . 69
6 Summary and conclusions 71
Bibliography 77
Appendix A Structual parameters of the novel phases with composition ABX2.(Chapter 5) 95
Chapter 1
Introduction
The discovery of new materials often lies at the base of important innovations for industrial
applications. Moreover, it provides insight into fundamental scientific issues. We can
obtain new materials by tailoring intrinsic materials parameters that can be controlled during
synthesis and processing, such as dimensionality, composition and geometric size of the
sample features. On the other hand, we can also use external conditions to induce changes in
the material, such as temperature, pressure, electric, magnetic fields or others. In particular,
pressure is a fundamental thermodynamic variable that can be used to control the properties of
materials, because it can reduce interatomic distances, change bond patterns and profoundly
modify electronic orbitals. It is thus a powerful tool for finding novel materials that are
inaccessible at ambient conditions. Pressure can enable the creation of new materials mainly
through four routes. Firstly, pressure can produce new materials through structural phase
transitions. High pressure can change the energetics of the various possible structures by
altering the interatomic distances and bonding patterns thus stabilizing new materials. A
well known example is synthetic diamond which is made by the compression of graphite.
The sp2 C–C bonding in graphite changes into sp3 C–C bonding in diamond due to the
applied pressure. Secondly, pressure can stabilize new stoichiometries. Structural phase
transitions originate from qualitative changes in the potential energy landscape. Pressure
can also effectively modify the compositional landscape, leading to stabilization of the
exotic stoichiometries that would not be expected from the conventional wisdom based on
chemical rules at ambient conditions. Examples include LixAl1−x [1], NaxAu1−x [2] and
unusual stoichiometries of hydrogen sulfide H3S [3]. Thirdly, pressure can enable new
chemical reactions. Pressure can affect the chemical reactivity of elements by influencing
the electronic orbitals and their occupancy. The outer atomic orbitals (such as the s, p and dorbitals) will hybridize as a result of the changing of the energetic ordering of the orbitals
induced by pressure. Finally, pressure can change the electronic properties of materials.
2 Introduction
Even in the case when the structure and stoichiometry remain unchanged under pressure,
the electronic properties can be fundamentally modified, because pressure can reduce the
interatomic distances and strengthen interatomic interactions. This can broaden energy
bands thus enabling insulator-to-metal, semiconductor-to-metal or metal-to-superconductor
transitions. For example, superconductivity of BaSi2 changes remarkably under pressure [4].
The main goals of this thesis are to discover new stoichiometries and new phases of the Ba–Si
and N–H–O systems under high pressure and to explore their properties and the underlying
physical mechanisms. Our study can give us a fundamental understanding and potential
applications and prospects of these two systems.
As the demand for the materials is endlessly growing, high-throughput computational
materials design also became a burgeoning area in recent years, in particular, because experi-
mental discovery is bound by high costs and is very time-consuming. The high-throughput
computational materials design is based on the marriage between computational quantum-
mechanical-thermodynamic approaches and a multitude of techniques rooted in database
construction and intelligent data mining. The concept is simple yet powerful: create a
large database containing the calculated thermodynamic and electronic properties of existing
and hypothetical materials, and then intelligently interrogate the database in the search of
materials with the desired properties. Clearly, the entire construction should be validated by
reality, namely the existing materials must be predicted correctly and the hypothetical ones
should be eventually synthesized. Such reality check feeds back to the theory to construct
better databases and increased predictive power. With the advent of efficient and accurate
theoretical tools and inexpensive computers, high-throughput computational materials design
has become an important tool for finding new materials. This method has successfully
screened many different kind of materials and applications, such as solar energy harvest-
ing [5], water photospliting [6], carbon capture and gas storage [7], topological insulators [8]
and thermoelectric materials [9]. In the domaing solar energy harvesting, another goal of this
thesis is to find delafossite and related layered phases of composition ABX2 which possess
p-type transparent conduction, where A and B are elements of the periodic table, and X is a
chalcogen (O, S, Se, and Te) by using high-throughput computational materials design. This
study can provide precious indications for further experimental synthesis and opens the way
for more specific theoretical and experimental studies of dopability and transport properties,
which can be restricted only to the most interesting candidates.
This thesis is organized as follows: Chapter 2 is an introduction to the theoretical
framework. Then Chapter 3 and Chapter 4 are about novel phases of the Ba–Si system under
high pressure and the phases diagram of the N–H–O system under high pressure. Chapter 5
is concerned with the investigation of ternary chalcogenides for p-type transparent electrodes

3
through high-throughput computational materials design. Finally, in Chapter 6 we present a
summary and relevant conclusions of this thesis.

Chapter 2
Theoretical background
Ab initio or first-principles methods have emerged in the last two decades as a powerful tool
to probe the properties of matter at the microscopic scale. These approaches are used to derive
macroscopic observables under the controlled condition of a “computational experiment,”
and with a predictive power rooted in the quantum-mechanical description of interacting
atoms and electrons. Density functional theory (DFT) has become the default method of
choice for most applications, due to its combination of reasonable scaling with system size
and good accuracy in reproducing most ground state properties. Such an electronic structure
approach can then be combined with molecular dynamics to provide an accurate description
of thermodynamic properties and phase stability, atomic dynamics, and chemical reactions,
or as a tool to sample the features of a potential energy surface. Due to the development
of computer technology, large and complex systems are now accessible. For example, the
largest system that simulated with DFT contains over 2 million atoms [10].
In this chapter, I will introduce the basic concepts and methods that were used in this
thesis. As DFT is one of the most basic theoretical tools, I give a short introduction of this
theory. Then, in the following sections, I describe different structural prediction algorithms.
Finally, I give a discussion on the stability of crystal phases.
2.1 Density functional theory
We consider a N-electron system (atom, molecule, or solid) in the Born-Oppenheimer
approximation [11] and non-relativistic approximation. The Schrödinger equation [12] can
be written as
HΨ(x1,x2, . . . ,xN) = EΨ(x1,x2, . . . ,xN) , (2.1)
6 Theoretical background
where xi comprehends the spatial and spin coordinates of electron i (ri,σi). The Hamiltonian
operator is formally written as
H = T +Vext +Vee , (2.2)
where
T =−N
∑i=1
1
2∇2
i , (2.3)
is the kinetic enery operator,
Vext =N
∑i=1
vext(ri) , (2.4)
vext(ri) =−∑I
ZI
riI, (2.5)
is the sum of the external potential operators. Here, capital indices stand for the nuclear
coordinates and ZI is the atomic number of the nuclei I. Hartree atomic units are used
throughout. Furthermore
Vee =N
∑i< j
1
ri j, (2.6)
ri j = |ri − r j| , (2.7)
is the electron-electron interaction operator. To obtain the total energy of the system we have
also to add the nuclei-nuclei repulsive energy contribution,
Vnn = ∑I<J
ZIZJ
rIJ. (2.8)
2.1.1 The Hohenberg-Kohn theorem
Consider an electronic system with an arbitrary external local potential vext. The correspond-
ing ground-state wave function Ψ can be obtained by solving the Schrödinger equation (2.1),
from which the associated ground-state density n0(r) can be deduced. Therefore, one has
a mapping from the potential vext to the ground-state density n0(r). In 1964, Hohenberg
and Kohn [13] showed that this mapping can be inverted, i.e, the ground-state density n0(r)determines the potential vext up to an arbitrary addictive constant. This can be easily proved
2.1 Density functional theory 7
by reductio ad absurdum. The ground-state density n0(r) determines the potential vext, which
in turn determines the Hamiltonian, and everything about the many-body problem. In other
words, the potential v is a unique (up to an additive constant) functional of the ground-state
density n, and for instance the ground-state wave function Ψ is also a unique functional of n(which can be denoted by Ψ[n]). Consequently, Hohenberg and Kohn defined the universal
(i.e., independent from the external potential) density functional
F [n] = 〈Ψ[n]| T +Vee |Ψ[n]〉 , (2.9)
which can be used to define the total electronic energy under an external potential vext as a
functional of the density:
Evext [n] = 〈Ψ| T +Vext +Vee |Ψ〉= F [n]+
∫drn(r)vext(r) .
(2.10)
Hohenberg and Kohn further showed that the density functional Evext [n] satisfies a variational
property: The ground-state energy E0 of the system considered is obtained by minimizing this
functional with respect to N−electron densities n that are ground-state densities associated
with some local potential (referred to as v-representable densities)
E0 = min{n}
Evext [n] . (2.11)
the minimum being reached for the ground-state density n0(r) corresponding to the potential
vext. This can also be written as
δδn(r)
[Evext [n]−μ
∫n(r)dr
]=
δF [n]δn(r)
+ vext(r)−μ = 0 . (2.12)
where μ is a Lagrange multiplier that ensures the normalization of the density to the total
number of electrons. Therefore, solving Eq. (2.12) would give us the exact ground-state of
any electronic system.
The existence of a mapping from a ground-state density to a local potential, the existence
of the universal density functional, and the variational property with respect to the density
constitute the Hohenberg-Kohn theorem. Even though the original Hohenberg-Kohn theorem
assumes a nondegenerate ground-state, it was showed later that the theorem is in fact also
valid for a degenerate ground states (see, e.g., Ref. 12).
8 Theoretical background
2.1.2 Kohn-Sham equations
As we discussed above, Hohenberg and Kohn in 1964 presented two theorems that are the
core of the modern DFT [13]. They are known as the first and second Hohenberg-Kohn
theorems. The Hohenberg-Kohn theorems tell us that the ground-state energy is a functional
of the electronic density, however, the form of this functional remains unknown. The energy
include kinetic energy and exchange-correlation energy parts which can not be written as
an explicit functional of the density. To deal with this problem, Kohn and Sham considered
an explicit system of non-interacting electrons (Vee = 0) with the same density of the real
system [14]. In this case, the many-body ground state wave function can be written as a
Slater determinant of single particle wave functions ψi,
Ψs(x1,x2, . . . ,xN) =1√N!
∣∣∣∣∣∣∣∣∣∣
ψ1(r1) ψ2(r1) · · · ψN(r1)
ψ1(r2) ψ2(r2) · · · ψN(r2)...
.... . .
...
ψ1(rN) ψ2(rN) · · · ψN(rN)
∣∣∣∣∣∣∣∣∣∣, (2.13)
that satisfy:
[−1
2∇2 + vKS(r)
]ψi(r) = εiψi(r) . (2.14)
Here, vKS is a fictitious external potential. The ground-state density is obtained from the Nlowest occupied orbitals and can be written as:
n(r) =N
∑i=1
|ψi(r)|2 . (2.15)
For the interacting system, the universal functional can be written as
FHK[n] = Ts[n]+EH[n]+Exc[n] , (2.16)
where EH[n] is the Hartree energy functional
EH[n] =1
2
∫dr
∫dr′
n(r)n(r′)|r− r′| , (2.17)
that represents the classical electrostatic repulsion energy for the charge distribution. While
Ts is the independent-particle kinetic energy that can be given by
Ts =−1
2
N
∑i=1
〈ψi|∇2 |ψi〉= 1
2
N
∑i=1
|∇ψi|2 , (2.18)
2.1 Density functional theory 9
Exc[n] is the exchange-correlation energy functional that remains to be approximate. This
function can be written as
Exc[n] = FHK[n]− (Ts[n]+EH[n]) , (2.19)
or in the more revealing form
Exc[n] = T [n]+Vee[n]− (Ts[n]+EH[n]) . (2.20)
which contains a kinetic contribution and a potential contribution. With these modified
potentials the Euler equation of the Hohenberg-Kohn equation (2.12) can be written as
δTs[n]δn(r)
+ vext(r)+1
2
∫dr′
n(r′)|r− r′| +
δExc[n]δn(r)
−μ = 0 . (2.21)
We then define the Kohn-Sham potential
vKS[n](r) = vext(r)+ vH[n](r)+ vxc[n](r) , (2.22)
where
vH[n](r) =1
2
∫dr′
n(r′)|r− r′| , (2.23)
vxc[n](r) =δExc[n]δn(r)
. (2.24)
The Euler equation of the Hohenberg-Kohn equation (2.21) can be rewritten as
δTs[n]δn(r)
+ vKS[n](r)−μ = 0 . (2.25)
Solving this equation is equivalent to solving the single-particle Schrödinger equation:
[−1
2∇2 + vKS[n](r)
]ψi(r) = εiψi(r) . (2.26)
Equations (2.25) and (2.26) are known as the Kohn-Sham equations [15]. The orbitals
satisfying (2.26) are called the Kohn-Sham orbitals. The Kohn-Sham Hamiltonian can be
written as:
HKS =−1
2∇2 + vKS[n](r) , (2.27)
10 Theoretical background
vKS is called Kohn-Sham potential. The Kohn-Sham equations are similar to the Hartree-
Fock equations, with the difference that they involve a local exchange potential instead of a
nonlocal one, and an additional local correlation potential.
2.2 Making DFT practical: approximations
We review here the main classes of approximate exchange-correlation functionals. These
classes are roughly ordered from the simplest to the most sophisticated ones. The discussion is
focused on the contents of the approximations, not their performance in practical calculations.
On average, more sophisticated approximations are usually more accurate than simpler ones,
even though many exceptions can be found.
2.2.1 The local density approximation
In the local-density approximation (LDA), introduced by Kohn and Sham [15], the exchange-
correlation functional is written as
ELDAxc [n] =
∫n(r)εunif
xc (n(r))dr , (2.28)
where εunifxc (n) is the exchange-correlation energy per particle of the infinite uniform electron
gas with the density n. The uniform electron gas represents a family of systems of interacting
electrons with an arbitrary spatially constant density n that acts as a parameter. Thus, in the
LDA, the exchange-correlation energy per particle of an inhomogeneous system at a spatial
point of density n(r) is approximated as the exchange-correlation energy per particle of the
uniform electron gas of the same density.
The function εunifxc (n) is a sum of exchange and correlation contributions,
εunifxc (n) = εunif
x (n)+ εunifc (n) . (2.29)
The exchange energy per particle of the uniform electron gas can be calculated analytically
εunifx (n) = cxn1/3 , (2.30)
where
cx =−(3/4)(3/π)1/3 . (2.31)
The LDA exchange functional is associated with the names of Dirac [16] and Slater [17].
2.2 Making DFT practical: approximations 11
The correlation energy per particle εunifc (n) of the uniform electron gas can not be
calculated analytically. This quantity has been obtained numerically for a number of densities
n using accurate quantum Monte Carlo calculations [18], and fitted to a parametrized function
of n satisfying the known high- and low-density expansions. Expressed in terms of the
Wigner-Seitz radius rs = (3/(4πn))1/3, the first terms of the high-density expansion (rs → 0)
have the form
εunifc (n) = Alnrs +B+Crslnrs +O(rs) , (2.32)
and the first terms of the low-density expansion (rs →+∞) have the form
εunifc (n) =
ars+
b
r3/2s
+O(1
r2s
) , (2.33)
where A, B, C, a, and b are constants. The two most used parameterizations are the one
of Vosko, Wilk, and Nusair (VWN) [19] and the one of Perdew and Wang (PW92) [20].
Their forms are too complicated to be given here. These parameterizations also include the
generalization to spin densities εunifc (n↑,n↓) differing from εunif
c (n) for spin-polarized systems
(n↑ = n↓) (sometimes specifically referred to as the local-spin-density (LSD) approximation).
2.2.2 Generalized gradient approximations
The next logical step beyond the LDA is the gradient-expansion approximation (GEA). One
way of deriving the GEA is to start from the uniform electron gas, introduce a weak and
slowly-varying external potential vr, and expand the exchange- correlation energy in terms
of the gradients of the density. At second order, one obtains a functional of the form
EGEAxc (n) = ELDA
xc (n)+∫
Cxcn(r)4/3
(∇n(r)n(r)4/3
)2
dr , (2.34)
where
Cxc =Cx +Cc , (2.35)
is the sum of the exchange and correlation coefficients of the second order gradient expansion.
Note that the gradient expansion is most naturally written in terms of the reduced density
gradient ∇n(r)/n(r)4/3 which is a dimensionless quantity. The GEA should improve over
the LDA provided that the reduced density gradient is small. Unfortunately, for real systems,
the reduced density gradient can be large in some regions of space, and the GEA turns out to
be a worse approximation than the LDA.
12 Theoretical background
The failure of the GEA lead to the development of generalized-gradient approximations
(GGA), which really started in the 1980s, of the generic form
EGGAxc (n) =
∫n(r) f (n(r),∇n(r))dr , (2.36)
where f is some function. The GGA are semilocal approximations in the sense that f does
not only use the local value of the density n(r) but also its gradient ∇n(r). For simplicity,
we consider here only the spin-independent form, but in practice GGA functionals are more
generally formulated in terms of spin densities (n↑,n↓) and their gradients (∇n↑,∇n↓).Many GGA functionals have been proposed. We very briefly review here some of the
most widely used ones.
B88 exchange functionalThe Becke 88 (B88 or B) [21] exchange functional is formulated as an additive correction
to LDA. It consists in a compact function of n(r) and |∇n(r)|/n(r)4/3 chosen to satisfy
the exact asymptotic behavior of the exchange energy per particle, and with an empirical
parameter fitted to Hartree-Fock exchange energies of rare-gas atoms.
LYP correlation functionalThe Lee-Yang-Parr (LYP) [22] correlation functional is one of the rare functionals which
have not been constructed starting from the LDA. It originates from the Colle-Salvetti [23]
correlation-energy approximation depending on the Hartree-Fock pair density and containing
four parameters fitted to helium data. By making a further reasonable approximation, LYP
turned the Colle-Salvetti expression into a density functional depending on the density n(r),the square of the density gradient |∇n(r)|2, and the Laplacian of the density ∇2n(r). The
dependence on the Laplacian can be exactly eliminated by an integration by parts [24].
PBE exchange-correlation functionalFor the Perdew-Burke-Ernzerhof functional (PBE) [25], the exchange and correlation
energies per particle are expressed as simpler functions of n(r) and |∇n(r)| enforcing less
exact conditions and with no fitted parameters. Specifically, the function used for correlation
enforces the second-order small-gradient expansion in the high-density limit, the vanishing
of correlation in the large-gradient limit, and the removal of the logarithm divergence of the
LDA in the high-density limit (see Equation 2.32). The function used for exchange is chosen
to cancel out the second-order small-gradient expansion of correlation and to enforce the
Lieb-Oxford bound in the large-gradient limit.
2.2 Making DFT practical: approximations 13
2.2.3 Meta-generalized gradient approximations
The meta-generalized-gradient approximations (meta-GGA or mGGA) are of the generic
form,
EmGGAxc =
∫n(r) f (n(r),∇n(r),∇2n(r),τ(r))dr . (2.37)
They use more ingredients than the GGAs, namely the Laplacian of the density ∇2n(r) and
the non-interacting kinetic energy density τ(r):
τ(r) =1
2
N
∑i=1
|ψi(r)|2 , (2.38)
where ψi(r) are the KS orbitals. Note that meta-GGAs are only implicit functionals of the
density since τ(r) is itself an implicit functional of the density through the orbitals. This tac-
itly implies an extension of the usual KS method. The meta-GGAs are considered part of the
family of semilocal approximations, in the sense that τ(r) depends only the gradient of the or-
bitals. Again, we consider here only the spin-independent form, but meta-GGA are more gen-
erally formulated in terms of spin-resolved quantities (n↑,n↓,∇n↑,∇n↓,∇2n↑,∇2n↓,τ↑,τ↓).One motivation for the introduction of the variable τ(r) is that it appears in the short-range
expansion of the exchange hole [26], which for the case of a closed-shell system is
nx(r,r′) =−n(r)2
− 1
3
[∇2n(r)−4τ(r)+
|∇n(r)|22n(r)
]|r− r′|2 + . . . . (2.39)
Another important motivation is that τ(r) can be use to make the correlation energy per
particle correctly vanish in spatial regions where the density has a one-electron character.
This is done by comparing τ(r) with the von Weizsäcker kinetic energy density
τW(r) =|∇n(r)|2
8n(r). (2.40)
Which is exact for one-electron systems, e.g. by introducing the ratio τ(r)/τW (r).One the most used meta-GGA approximation is the Tao-Perdew-Staroverov-Scuseria
(TPSS) [27] exchange-correlation functional.
2.2.4 Hybrid approximations
Based on arguments relying on the adiabatic-connection formalism, in 1993 Becke [28]
proposed to mix a fraction of the exact or Hartree-Fock (HF) exchange energy with GGA
14 Theoretical background
functionals. In particular, he proposed a three-parameter hybrid (3H) approximation [29] of
the form
E3Hxc = aEHF
x +bEGGAx +(1−a−b)ELDA
x + cEGGAc +(1− c)ELDA
c , (2.41)
where the three parameters a, b, and c are determined by fitting to experimental data. Note
that EHFx depends on the occupied orbitals and has the exact-exchange expression:
EHFx =−1
2
N
∑i=1
N
∑j=1
∫ ∫ ψ∗i (r1)ψ j(r1)ψ∗
j (r2)ψi(r2)
|r1 − r2| dr1dr2 . (2.42)
This constitutes an extension of the usual KS method, sometimes referred to as generalized
Kohn-Sham [30]. The main benefit of adding a fraction of HF exchange is to decrease the
self-interaction error in the exchange functional which tends to favor delocalized electron
densities over localized electron densities. The most famous and widely used three-parameter
hybrid approximation is B3LYP [31], which uses the B88 exchange functional and the LYP
correlation functional, and the parameters a = 0.20, b = 0.72, and c = 0.81.
In 1996, Becke proposed a simpler one-parameter hybrid (1H) approximation [32]
E1Hxc = aEHF
x +(1−a)EDFAx +EDFA
c , (2.43)
where EDFAx and EDFA
c can be any (semilocal) density-functional approximation (DFA),
and the fraction a of HF exchange has to be determined. The fraction of HF exchange
should be small enough to keep the compensation of errors usually occurring between the
approximate semilocal exchange functional EDFAx and the approximate semilocal correlation
functional EDFAc . Fits to experimental data often give an optimal parameter a around 0.25. A
rationale has also been proposed in favor of this value [33]. For example, PBE0 [34, 35] is a
popular one-parameter hybrid approximation which uses a = 0.25 and the PBE exchange and
correlation functionals.
A strategy that has been sometimes used to construct approximations of the form of
Equation 2.43 is to employ parameterized flexible functions for EDFAx and EDFA
c and sys-
tematically optimize all the parameters (including the fraction a of HF exchange) on large
sets of physicochemical properties of molecular systems. For example, the Becke 97 (B97)
exchange-correlation functional [36] is a hybrid GGA approximation containing 13 parame-
ters optimized on atomic exchange and correlation energies, atomization energies, ionization
potentials, and proton affinities. Another example is the so-called family of “Minnesota”
functionals, and in particular the M06 exchange-correlation functional [37] which is a hybrid
meta-GGA approximation containing 36 parameters optimized on a very large set of diverse
2.2 Making DFT practical: approximations 15
physicochemical properties concerning main-group thermochemistry, reaction barrier heights,
noncovalent interactions, electronic spectroscopy, and transition metal bonding.
2.2.5 Double-hybrid approximations
In 2006, Grimme [38] introduced a two-parameter double-hybrid (2DH) approximation
E2DHxc = axEHF
x +(1−ax)EDFAx +(1−ac)EDFA
c +acEMP2c , (2.44)
mixing a fraction ax of the HF exchange energy with a semilocal exchange DFA, and
a fraction ac of the second-order Møller-Plesset (MP2) correlation energy EMP2c with a
semilocal correlation DFA. In equation (2.44), the first three terms are first calculated in a
self-consistent manner, and then the last term EMP2c is added perturbatively using the orbitals
determined in the first step. The expression of EMP2c is
EMP2c =−1
4
N
∑i=1
N
∑j=1
∑a≥N+1
∑b≥N+1
|(ia| jb)− (ib| ja)|2εa − εb − εi − ε j
, (2.45)
where (ia| jb) are two-electron integrals, ε are orbital energies, and i, j and a, b run over
occupied and virtual spin orbitals, respectively. The presence of nonlocal MP2 correlation
allows one to use a larger fraction of nonlocal HF exchange. For example, Grimme proposed
the B2-PLYP approximation which uses the B88 exchange and LYP correlation functionals,
and the parameters ax = 0.53 and ac = 0.27 optimized on experimental heats of formation of
a set of molecules.
In 2011, Sharkas, Toulouse, and Savin [39] showed how the double-hybrid approxima-
tions can be rigorously reformulated using the adiabatic-connection formalism, which leads
to a one-parameter double-hybrid (1DH) approximation
E1DHxc = λEHF
x +(1−λ )EDFAx +(1−λ 2)EDFA
c +λ 2EMP2c , (2.46)
where the fraction HF exchange ax = λ is now connected to the fraction of MP2 correlation
ac = λ 2. It turns out that using ax = λ = 0.53 nearly reproduces the parameter ac = λ 2 =
0.28 � 0.27 independently optimized in B2-PLYP.
The double-hybrid approximations are examples of correlation functionals depending on
virtual orbitals. Another example of a correlation functional depending on virtual orbitals is
the random-phase approximation (RPA), which goes beyond second order and has been the
subject of intensive developments since the 2000s.
16 Theoretical background
2.2.6 Range-separated hybrid approximations
Based on earlier ideas of Savin [40] in 2001, Iikura, Tsuneda, Yanai, and Hirao [41] proposed
a long-range correction (LC) scheme
ELCxc = E lr,HF
x +Esr,DFAx +EDFA
c , (2.47)
where E lr,HFx is the HF exchange energy for a long-range electron-electron interaction
E lr,HFx =−1
2
N
∑i=1
N
∑j=1
∫ ∫φ∗
i (r1)φ j(r2)φ∗j (r2)φi(r1)ω lr
eedr1dr2 , (2.48)
where ω lree = er f (μr12)/r12 where r12 = |r1 − r2| is the inter-electronic distance and er f is
the error function
er f (x) =2√π
∫ x
0e−t2
dt , (2.49)
and Esr,DFAx is the DFA exchange energy for the complementary short-range interaction. In
addition, the short-range exchange part is easier to approximate with a semilocal DFA. The
parameter μ in the error function controls the range of the separation and must be chosen, e.g.
by fitting to experimental data. In practice, a value around μ � 0.3 - 0.5 bohr−1 is often found
to be optimal. A popular example of such LC approximations is LC-ω PBE [42] which uses
a short-range version of the PBE exchange functional, as well as the standard PBE correlation
functional. Note that the LC scheme has also been referred to as the range-separated hybrid
exchange (RSHX) scheme [43].
In 2004, Yanai, Tew, and Handy [44], introduced a more flexible scheme called the
Coulomb-attenuating method (CAM) [44] in which fractions of HF exchange are added at
both short and long range
ECAMxc = aEsr,HF
x +bE lr,HFx +(1−a)Esr,DFA
x +(1−b)E lr,DFAx +EDFA
c , (2.50)
where Esr,HFx is the HF exchange energy for the short-range interaction and E lr,HF
x is the
DFA exchange energy for the long-range interaction. The reintroduction of HF exchange at
short range improves thermodynamic properties such as atomization energies. According to
this scheme, the authors proposed the CAM-B3LYP approximation which uses short- and
long-range versions of the B88 exchange functional, the same correlation functional used
in B3LYP (i.e., 0.81 ELYPc +0.19ELDA
c ), and optimized parameters a = 0.19, b = 0.65, and
μ = 0.334 bohr−1. Another example in this class of approximations is the ωB97X exchange-
2.3 Structural prediction algorithms 17
correlation functional [45] which is based on the B97 exchange-correlation functional with
reoptimized parameters, and uses a = 0.16, b = 1, and μ = 0.3 bohr−1. Another functional
that can be considered as part of this class of approximations is the Heyd-Scuseria-Ernzerhof
(HSE) exchange-correlation functional [46], which uses the parameters a = 0.25,b = 0 (i.e.
no long-range HF exchange), and μ = 0.15 bohr−1, with a long-range version of the PBE
exchange correlation functional and the standard PBE correlation functional. The absence of
HF exchange at long range makes this approximation particularly useful for solids.
2.3 Structural prediction algorithms
The crystal structure occupies a central and often critical role in material science, particularly
when establishing a correspondence between material performance and its basic composition,
since the properties of a material are intimately tied to its crystal structure. Experimentally,
the structure is determined by x-ray diffraction. It has solved numerous problems of crystal
structure. However, only a small faction of systems have been studied experimentally,
especially at high pressure. Therefore, it is often useful to be able to predict the crystal
structure with theoretical techniques. There are two main different ways to predict the
structure of a material. They are high-throughput methods and global crystal structure
prediction methods. It is well known that nature often chooses the same solution to similar
problems. Therefore, one can take a known, experimentally characterized structure, change
its chemical composition, and hope that this will be also a stable phase for a new composition.
This is the main idea of high-throughput methods. This method was already used successfully
for many systems, such as delafossites, perovskites and clathrates. Higher success rates
can be achieved by using sophisticated machine learning algorithms, which can help to
choose the most likely substitutions. This approach is currently widely used with very good
results, and applications to several areas have already been published [47–50]. However,
as it relies heavily on experimental data, it fails to find compounds that are very different
from what is already known. In this case, the global structure prediction methods that only
use the chemical composition are possible. However, these methods are rather complex as
they basically involve classifying a huge number of energy minima on the potential energy
surface. About 20 years ago John Maddox even published an article in Nature to question
the predictive power provided with only the knowledge of chemical composition [51]. His
words still remain largely true, as evidenced by poor results of the latest blind test for
crystal structure prediction [52]. Owing to significant progress in both computational power
and basic material theory, it is now possible to predict the crystal structure using standard
methods based on DFT and beyond. Some of these are simulated annealing [53], genetic
18 Theoretical background
algorithms [54–58], basin hopping [59, 60], metadynamics [61, 62], random sampling [63–
65], data mining [66], particle-swarm optimization [67, 68] and minima hoping [69, 70]. In
the next paragraph we will discuss the two main algorithms that were used in this thesis:
particle-swarm optimization (CALYPSO) and minima hoping method (MHM).
2.3.1 Particle swarm optimization
Particle-swarm optimization was first proposed by Kennedy and Eberhart in the mid 1900s [71,
72]. As a stochastic global optimization method, particle-swarm optimization is inspired
by the choreography of a bird flock and can be seen as a distributed behavior algorithm
that performs multidimensional search. According to the particle-swarm optimization, the
behavior of each individual is affected by either the best local or the best global individual to
help it fly through a hyperspace. Moreover, an individual can learn from its part experiences
to adjust its flying speed and direction. Therefore, all the individuals in the swarm can quickly
converge to the global position and near-optimal geographical position by the behavior of
the flock and their flying histories. Particle-swarm optimization (PSO) has been verified
to perform well on many optimization problems. Y. Ma and Y. Wang implemented PSO
algorithm for crystal structure prediction in the crystal structure analysis by particle swarm
optimization CALYPSO code [67, 68]. In this algorithm, a structure (an individual) in the
searching phase space is viewed as a particle xti, j. A set of individual particles is called a
population or a generation. During the generation of particles, the new particle, xt ′i, j, depends
on its previous position, xti, j, and its velocity, vt ′
i, j, as xt ′i, j = xt
i, j + vt ′i, j. It is necessary to note
that the velocity plays an important role on the determination of the speed and direction
of the particle movement. The new velocity of each individual i at the jth dimension is
calculated based on its previous location (xti, j) before optimization, previous velocity vt
i, j,
current location pbestti, j with an achieved best fitness, i.e., lowest enthalpy, of this individual,
and the population global location gbestti, j with the best fitness value for the entire population
according to equation 2.51
vt ′i, j = ωvt
i, j + c1r1(pbestti, j − xt
i, j)+ c2r2(gbestti, j − xt
i, j) , (2.51)
where j ∈ (1,2,3), ω (in the range of 0.9–0.4) denotes the inertia weight and controls the
momentum of the particle. c1 is a self-confidence factor and expresses how much the particle
trusts its own past experience while c2 is a swarm confidence factor and expresses how much
it trusts the swarm. r1 and r2 are two separately generated random numbers and uniformly
distributed in the range [0, 1]. The velocity update formula includes random parameters
r1 and r2 to ensure good coverage of the searching space and avoid entrapment in local
2.3 Structural prediction algorithms 19
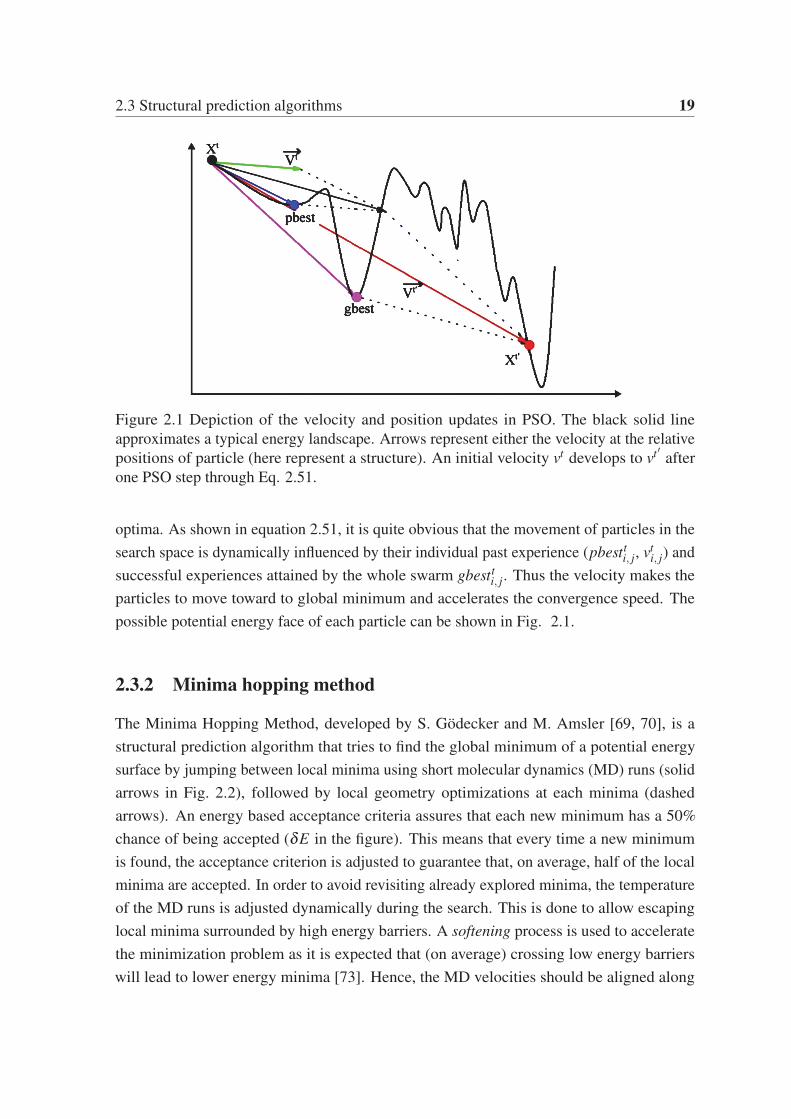
Figure 2.1 Depiction of the velocity and position updates in PSO. The black solid line
approximates a typical energy landscape. Arrows represent either the velocity at the relative
positions of particle (here represent a structure). An initial velocity vt develops to vt ′ after
one PSO step through Eq. 2.51.
optima. As shown in equation 2.51, it is quite obvious that the movement of particles in the
search space is dynamically influenced by their individual past experience (pbestti, j, vt
i, j) and
successful experiences attained by the whole swarm gbestti, j. Thus the velocity makes the
particles to move toward to global minimum and accelerates the convergence speed. The
possible potential energy face of each particle can be shown in Fig. 2.1.
2.3.2 Minima hopping method
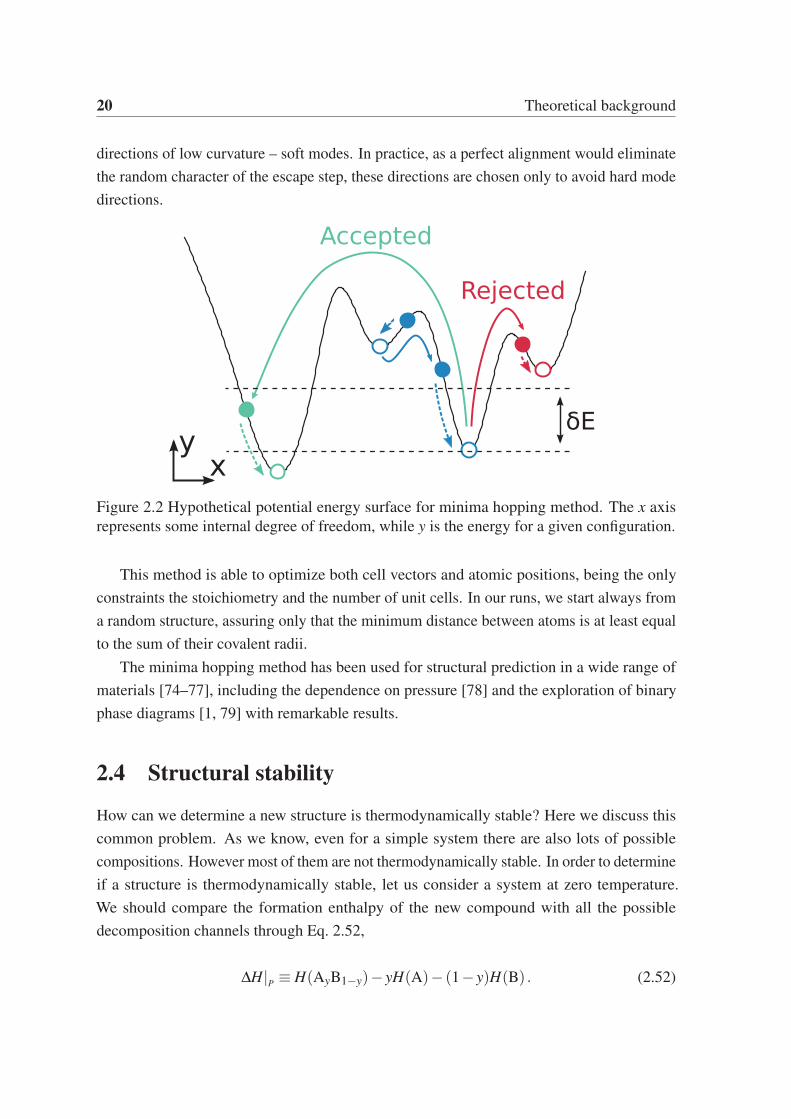
The Minima Hopping Method, developed by S. Gödecker and M. Amsler [69, 70], is a
structural prediction algorithm that tries to find the global minimum of a potential energy
surface by jumping between local minima using short molecular dynamics (MD) runs (solid
arrows in Fig. 2.2), followed by local geometry optimizations at each minima (dashed
arrows). An energy based acceptance criteria assures that each new minimum has a 50%
chance of being accepted (δE in the figure). This means that every time a new minimum
is found, the acceptance criterion is adjusted to guarantee that, on average, half of the local
minima are accepted. In order to avoid revisiting already explored minima, the temperature
of the MD runs is adjusted dynamically during the search. This is done to allow escaping
local minima surrounded by high energy barriers. A softening process is used to accelerate
the minimization problem as it is expected that (on average) crossing low energy barriers
will lead to lower energy minima [73]. Hence, the MD velocities should be aligned along
20 Theoretical background
directions of low curvature – soft modes. In practice, as a perfect alignment would eliminate
the random character of the escape step, these directions are chosen only to avoid hard mode
directions.
Figure 2.2 Hypothetical potential energy surface for minima hopping method. The x axis
represents some internal degree of freedom, while y is the energy for a given configuration.
This method is able to optimize both cell vectors and atomic positions, being the only
constraints the stoichiometry and the number of unit cells. In our runs, we start always from
a random structure, assuring only that the minimum distance between atoms is at least equal
to the sum of their covalent radii.
The minima hopping method has been used for structural prediction in a wide range of
materials [74–77], including the dependence on pressure [78] and the exploration of binary
phase diagrams [1, 79] with remarkable results.
2.4 Structural stability
How can we determine a new structure is thermodynamically stable? Here we discuss this
common problem. As we know, even for a simple system there are also lots of possible
compositions. However most of them are not thermodynamically stable. In order to determine
if a structure is thermodynamically stable, let us consider a system at zero temperature.
We should compare the formation enthalpy of the new compound with all the possible
decomposition channels through Eq. 2.52,
ΔH|P ≡ H(AyB1−y)− yH(A)− (1− y)H(B) . (2.52)
2.4 Structural stability 21
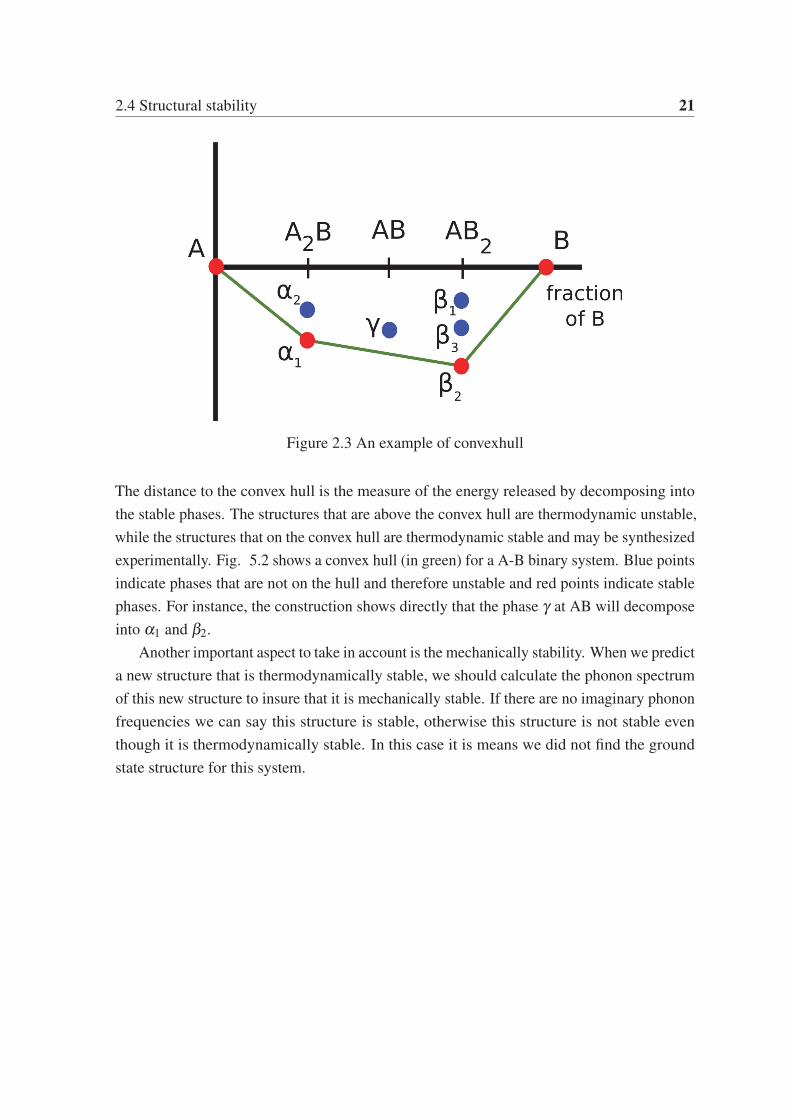
Figure 2.3 An example of convexhull
The distance to the convex hull is the measure of the energy released by decomposing into
the stable phases. The structures that are above the convex hull are thermodynamic unstable,
while the structures that on the convex hull are thermodynamic stable and may be synthesized
experimentally. Fig. 5.2 shows a convex hull (in green) for a A-B binary system. Blue points
indicate phases that are not on the hull and therefore unstable and red points indicate stable
phases. For instance, the construction shows directly that the phase γ at AB will decompose
into α1 and β2.
Another important aspect to take in account is the mechanically stability. When we predict
a new structure that is thermodynamically stable, we should calculate the phonon spectrum
of this new structure to insure that it is mechanically stable. If there are no imaginary phonon
frequencies we can say this structure is stable, otherwise this structure is not stable even
though it is thermodynamically stable. In this case it is means we did not find the ground
state structure for this system.

Chapter 3
New phases of Ba-Si system under highpressure
3.1 Introduction
Alkali-earth silicides are extremely versatile materials, capable of crystallizing in a large
variety of structures. For example, BaSi2, perhaps the most studied member of this family,
exhibits four different phases at ambient conditions, [80] namely an orthorhombic (Pnma),
cubic (P4332), trigonal (P3m1), and hexagonal (P6/mmm) phase [81–84]. This rich struc-
tural diversity naturally leads to a wealth of interesting physical properties. The orthorhombic
and cubic phases are semiconductors [85, 86] with a suitable band-gap for photovoltaic ap-
plications [87] and a large absorption coefficient [88]. On the other hand, the trigonal phase
is metallic, and becomes superconducting at low temperatures [4, 89–91]. It is interesting
to note that this trigonal phase is composed of corrugated planes of silicon intercalated by
barium atoms, and can be viewed as the silicene counterpart of intercalated graphite. It is also
worth mentioning that alkali-earth disilicides are also used as percursors for the synthesis of
silicon clathrates [92, 93]. At ambient pressure there is still another stable composition in the
Ba–Si phase diagram, namely BaSi [80, 94], that crystallizes in a metallic CrB-type phase
(Cmcm).
Unfortunately, at high-pressures there is relatively little experimental and theoretical work
performed on this phase diagram. The composition BaSi6, has been synthesized at around
15 GPa [95], but nothing else is known about this system. Moreover, it is by now well known
that high pressure can change dramatically the chemistry of even the simplest elements [96],
leading to the stabilization of diverse, and often unexpected compositions [97, 98].
24 New phases of Ba-Si system under high pressure
The objective of this work is therefore to perform a systematic theoretical study of the
high-pressure Ba–Si phase diagram, especially in the silicon rich region. We will concentrate
on the pressure range from 0 to 150 GPa as these pressures can nowadays be easily reached
in diamond anvil cells. This will be done through an unbiased structural search based on
a particle-swarm optimization Algorithm [67, 68] (see Chapter 2) and a first principles
density-functional approach to evaluate total energies and forces. The effectiveness of this
method has already been demonstrated by several predictions under high pressure [99–107].
We remark that a surprising structural richness has recently been revealed using the same
structural search algorithm in the Ca–Si phase diagram [108].
3.2 Methods
We investigated the stoichiometries BaSix (x=1, 2, 3, 4, 5, 6), using cells containing 2, 4, 6,
and 8 formula units in a pressure range from 0 to 150 GPa. Ground-state structures were
obtained using the CALYPSO (Crystal structure AnaLYsis by Particle Swarm Optimization)
global structure prediction code [67, 68]. Total energies and forces were calculated with an ab
initio density functional approach [14] within the Perdew-Burke-Ernzenhof [25] generalized
gradient approximation as implemented in the VASP code [109]. We adopted the all-electron
projector-augmented wave method [110] using the valence configurations 5s25p66s2 (for
Ba) and 3s23p2 (for Si). We used a cutoff energy of 600 eV and uniform Monkhorst-Pack
k-meshes [111]. The convergence of all ab initio calculations was ensured to better than
1 meV/atom. The phonon density of states was calculated using a finite displacement
method [112] as implemented in the PHONOPY package [113]. Electron-phonon coupling
(EPC) calculations were carried out with density function perturbation theory using the
program Quantum ESPRESSO [114] with a cutoff of 80 Ry, A 12×12×12 q-point mesh,
and a Gaussian smearing of 0.05 Ry. We note that all calculations were performed at 0 K
neglecting the zero-point correction to the energy, that in any case is expected to be small for
our systems.
3.3 Results and discussion
We investigated the energetic stability of the Ba-Si system by studying the enthalpy of
formation for different BaSix compounds with pressures from 0 to 150 GPa. The formation
enthalpy H of BaySi1−y (0 < y < 1) is defined as
ΔH|P ≡ H(BaySi1−y)− yH(Ba)− (1− y)H(Si) , (3.1)
3.3 Results and discussion 25
where H(Ba) and H(Si) represent the enthalpy of formation of bulk Ba and Si. For Ba,
We used the Im3m [115] and P63/mmc [116] structures under ambient pressure and high
pressure, respectively, while for pure Si we used the Fd3m phase at ambient pressure, the
Si-VI (Cmca) [117] phase at 20 GPa, the Si-VII (P63/mmc) [118] and Si-X (Fm3m) [119]
phases at high pressure. The enthalpy of formation ΔH, and the respective convex hull
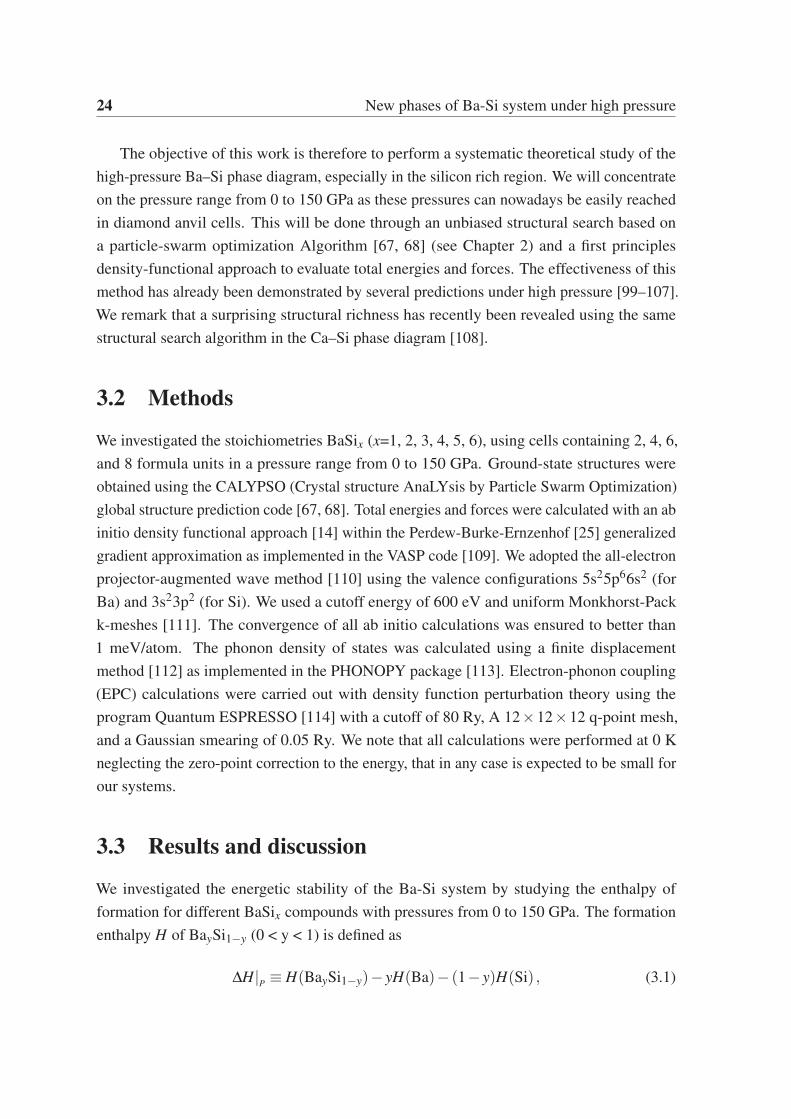
of thermodynamic stability, is depicted in Fig. 3.1 for pressures of 0, 5, 20, 50, 100, and
150 GPa.
Figure 3.1 Calculated enthalpy of formation (ΔH in eV/atom) of various Ba–Si compounds
with respect to the elemental decomposition into bulk Ba and Si at 0, 5, 20, 50, 100, and
150 GPa. The solid lines represent the convex hulls, while the dotted lines are just a guide
for the eyes.
From the convex hulls in Fig. 3.1 we can see that all Ba-Si compounds were found to have
a negative formation enthalpy at ambient pressure. Both BaSi and BaSi2 are thermodynami-
cally stable, in good agreement with experimental results [80–84], with the former being the
most stable composition. The situation, however, becomes quite complex when we increase
26 New phases of Ba-Si system under high pressure
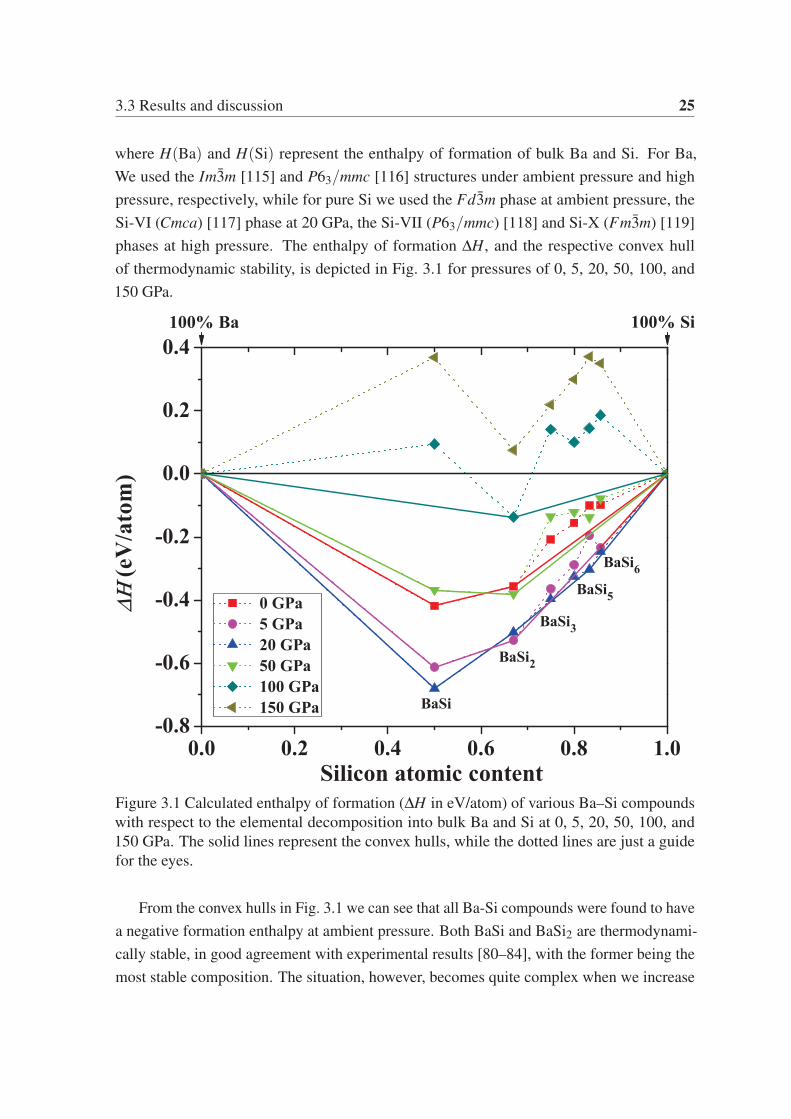
(a) (b)
Figure 3.2 (a) Compressibility, V0/V, for Ba and Si. (b) Ground-state energy and PV
components of the enthalpy of the elements relative to BaSi.
the pressure. At 5 GPa, also BaSi6 becomes thermodynamically stable, again in agreement
with experiment [95]. At 20 GPa, however, the formation enthalpy of BaSi5 decreases, and it
becomes thermodynamically stable, thereby destabilizing BaSi6. At this pressure, also BaSi3
has a phase that is extremely close to the convex hull. As the pressure is further increased
to 50 GPa, all these compositions with high silicon content become thermodynamically
unstable. At 100 GPa BaSi also becomes unstable, and finally, at 150 GPa we do not find any
stable binary compound in the Ba–Si system. The same behavior was observed for Ca–Si
binaries at pressure above 250 GPa [108]. The explanation given in Ref. [108] is that while
both energy and PV contributions to the enthalpy favor compound formation at moderate
pressures, the ΔPV term quickly grows negative and dominates enthalpy variations at high
pressure. The higher compressibility of Ca with respect to Si and Ca–Si binaries is at the
origin of the phase separation at higher pressure. A similar explanation applies also to our
Ba–Si phase diagram, as a consequence of the higher compressibility of Ba. It can be easily
found from Fig. 3.2. The structural parameters of our predicted stable structures for Ba-Si
compounds at their corresponding pressures are shown in Tab. 3.1.
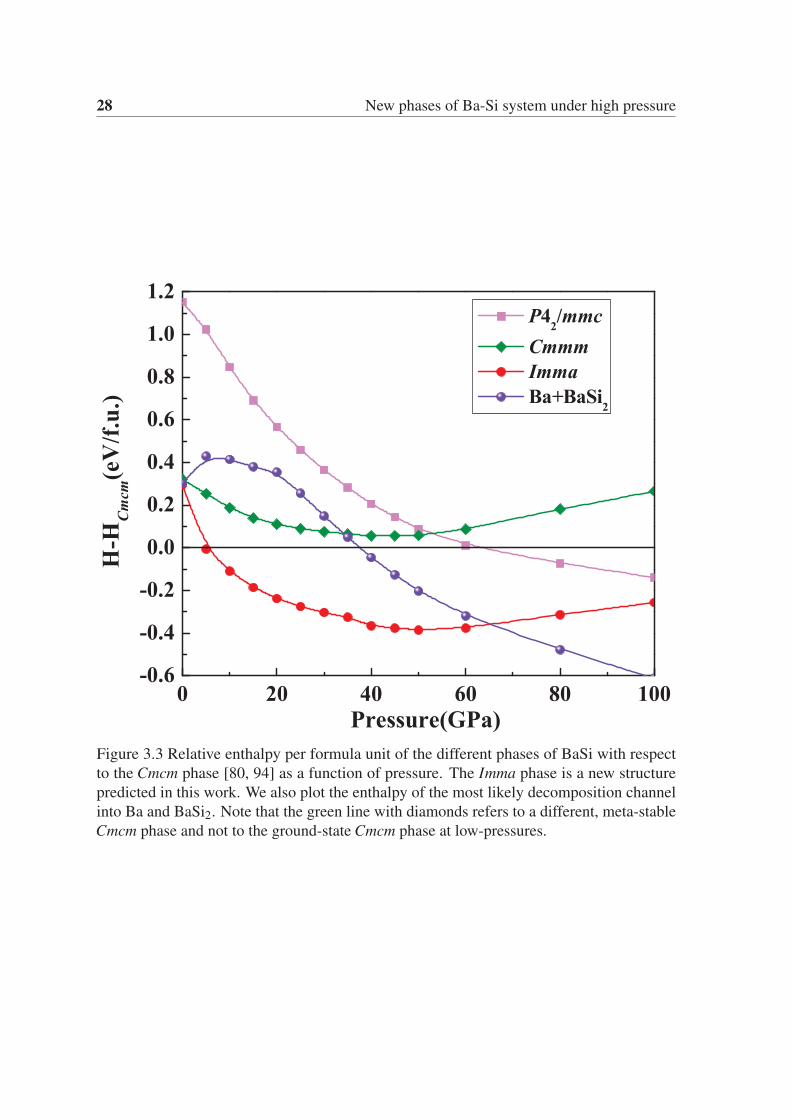
The phase transitions of BaSi under pressure are further illustrated in Fig. 3.3, where we
plot the relative enthalpies per formula unit with respect to the Cmcm structure (that is the
ground-state at ambient conditions), including the enthalpy of the most likely decomposition
channel.
In the following we give a more detailed analysis of the new stable structures found
during our structural prediction runs. The structures are shown in Fig. 3.4. We calculated
phonon spectra, which confirmed the dynamical stability of all the new phases. Finally,
we determined the electronic character (semiconducting or metallic) by inspection of their
electronic density of states.
3.3 Results and discussion 27
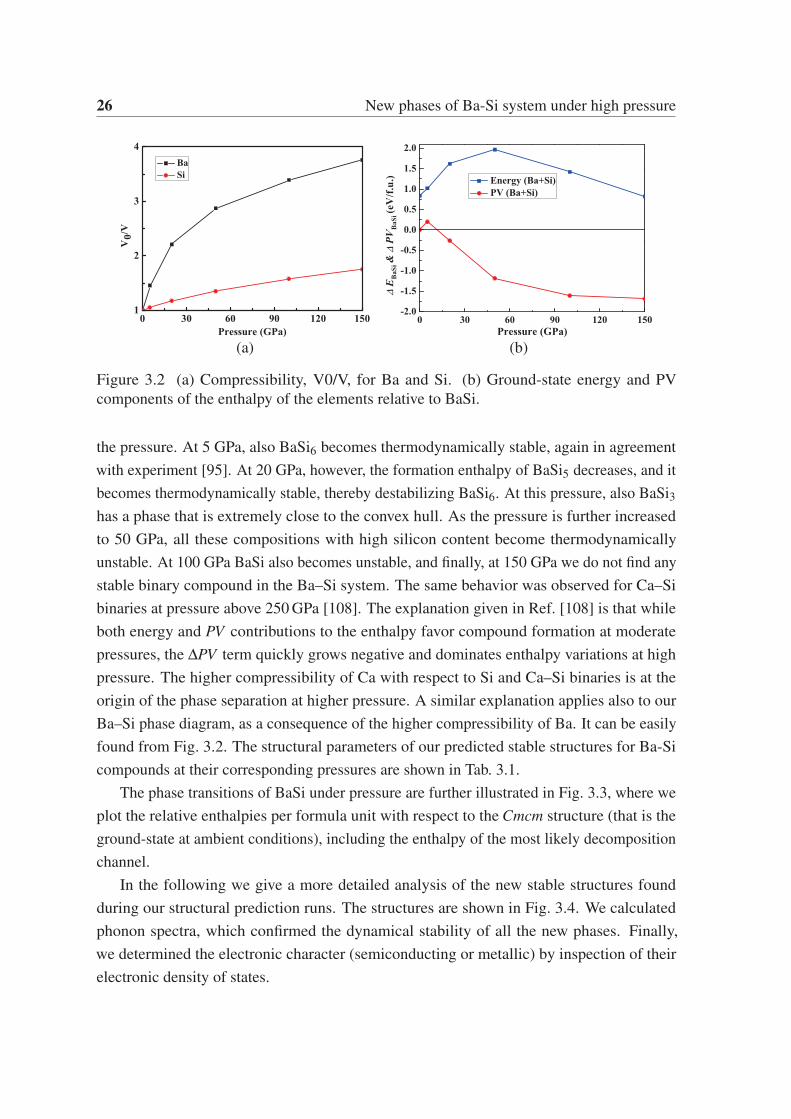
Table 3.1 Calculated structural parameters of our predicted stable structures for Ba-Si
compounds at their corresponding pressures
Space group Lattice Atomic coordinates (fractional)
Pressure parameters
Imma-BaSi a=3.67280 Å Ba(4e) 0.50000 0.25000 0.39804
20 GPa b=5.08260 Å Si(4e) 0.50000 -0.25000 0.17580
c=9.43680 Å
α=β=γ=90◦
Fd3m-BaSi2 a=7.18670 Å Ba(8a) 0.25000 0.25000 0.25000
50 GPa b=7.18670 Å Si(16d) 0.62500 0.12500 0.12500
c=7.18670 Å
α=β=γ=90◦
I4/mmm-BaSi3 a=6.84750 Å Ba1(4e) 0.50000 0.50000 0.31654
20 GPa b=6.84750 Å Ba5(4d) 0.00000 0.50000 0.25000
c=12.17490 Å Si1(16m) 0.68117 0.31883 0.09624
α=β=γ=90◦ Si17(8i) 0.66915 0.00000 0.00000
Cmmm-BaSi5 a=4.2121 Å Ba1(2c) 0.00000 0.50000 0.50000
20 GPa b=7.2510 Å Si1(8n) -0.00000 0.83323 0.81577
c=6.3456 Å Si9(2b) 0.00000 0.50000 -0.00000
α=β=γ=90◦
3.3.1 BaSi
We now focus on Fig. 3.1 and Fig. 3.3 to discuss the stability of BaSi under pressure. We can
see that the BaSi composition is stable in a large range of pressures, from ambient pressure to
more than 65 GPa, after which the decomposition into Ba and BaSi2 becomes energetically
favorable. At ambient pressure, our structural prediction algorithm obtains a ground-state
structure with Cmcm symmetry. This is the phase already known experimentally, in which
Ba atoms form distorted hexagonal structures with one-dimensional channels that are filled
with zigzag chains of Si atoms [80, 94]. However, this phase is quickly destabilized by
pressure, and a novel structure with space group Imma becomes the ground-state at pressures
of around 6 GPa.
The new predicted Imma phase of BaSi is shown in Fig. 3.4 (a). Its primitive cell has two
Ba atoms and two Si atoms. There are striking similarities between this structure and the
low-pressure Cmcm phase. Both phases contain one-dimensional hexagonal channels formed
by Ba atoms, but now the hexagons are regular due to a rearrangement of the Ba-atoms.
The Si chains have the same arrangement in both cases. The distance between the two
28 New phases of Ba-Si system under high pressure
Figure 3.3 Relative enthalpy per formula unit of the different phases of BaSi with respect
to the Cmcm phase [80, 94] as a function of pressure. The Imma phase is a new structure
predicted in this work. We also plot the enthalpy of the most likely decomposition channel
into Ba and BaSi2. Note that the green line with diamonds refers to a different, meta-stable
Cmcm phase and not to the ground-state Cmcm phase at low-pressures.
3.3 Results and discussion 29
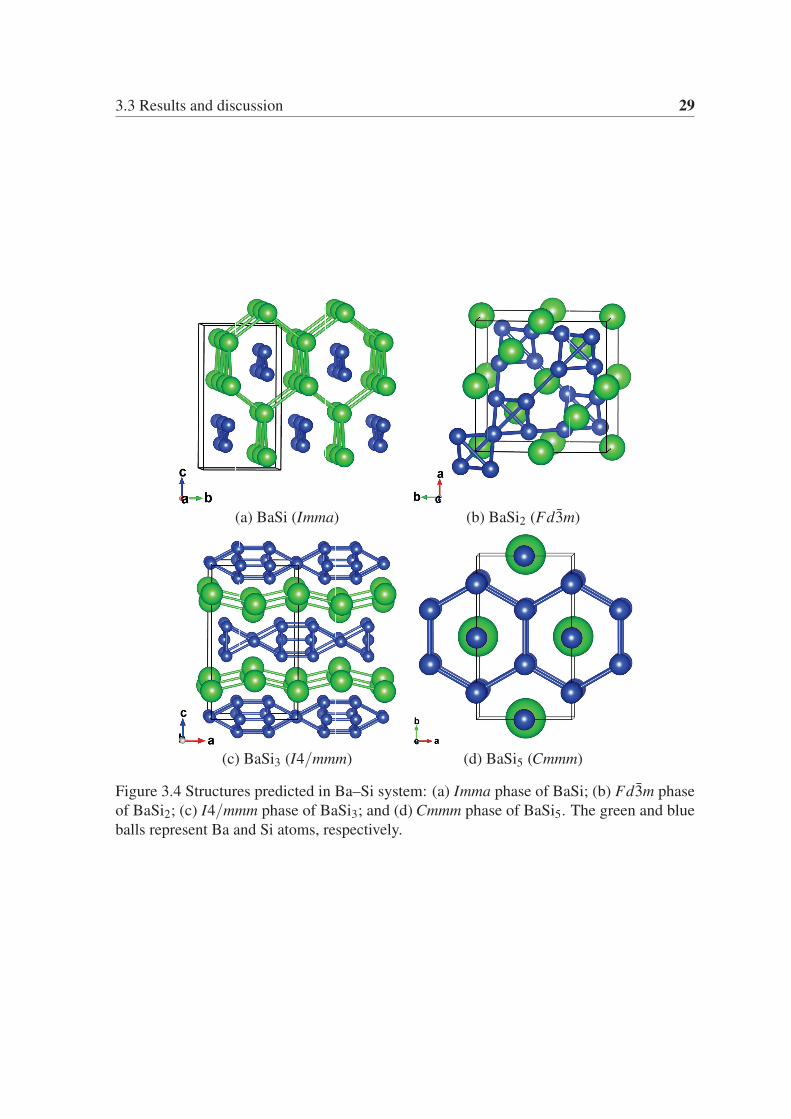
(a) BaSi (Imma) (b) BaSi2 (Fd3m)
(c) BaSi3 (I4/mmm) (d) BaSi5 (Cmmm)
Figure 3.4 Structures predicted in Ba–Si system: (a) Imma phase of BaSi; (b) Fd3m phase
of BaSi2; (c) I4/mmm phase of BaSi3; and (d) Cmmm phase of BaSi5. The green and blue
balls represent Ba and Si atoms, respectively.
30 New phases of Ba-Si system under high pressure
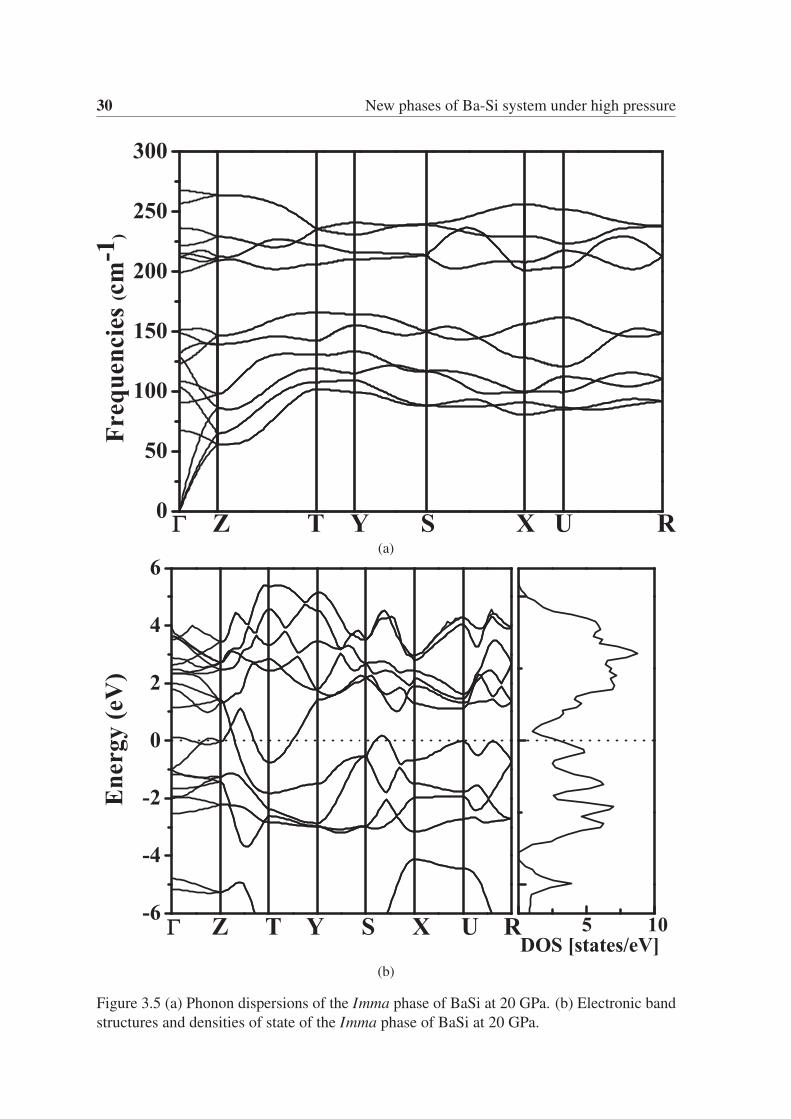
(a)
(b)
Figure 3.5 (a) Phonon dispersions of the Imma phase of BaSi at 20 GPa. (b) Electronic band
structures and densities of state of the Imma phase of BaSi at 20 GPa.
3.3 Results and discussion 31
silicon atoms in the Imma phase is 2.31 Å, while the angle of the chain is about 105.34◦ at
20 GPa. To demonstrate the dynamical stability of this structure, we calculated the phonon
dispersion for the Imma phase at 20 GPa, as shown in Fig. 3.5a. There are no imaginary
phonon frequencies, which indicates that the Imma structure is mechanically stable. The
electronic band structure and projected density of states (DOS) for the Imma structure at
20 GPa are also shown in Fig. 3.5b, showing that this is a metallic phase.
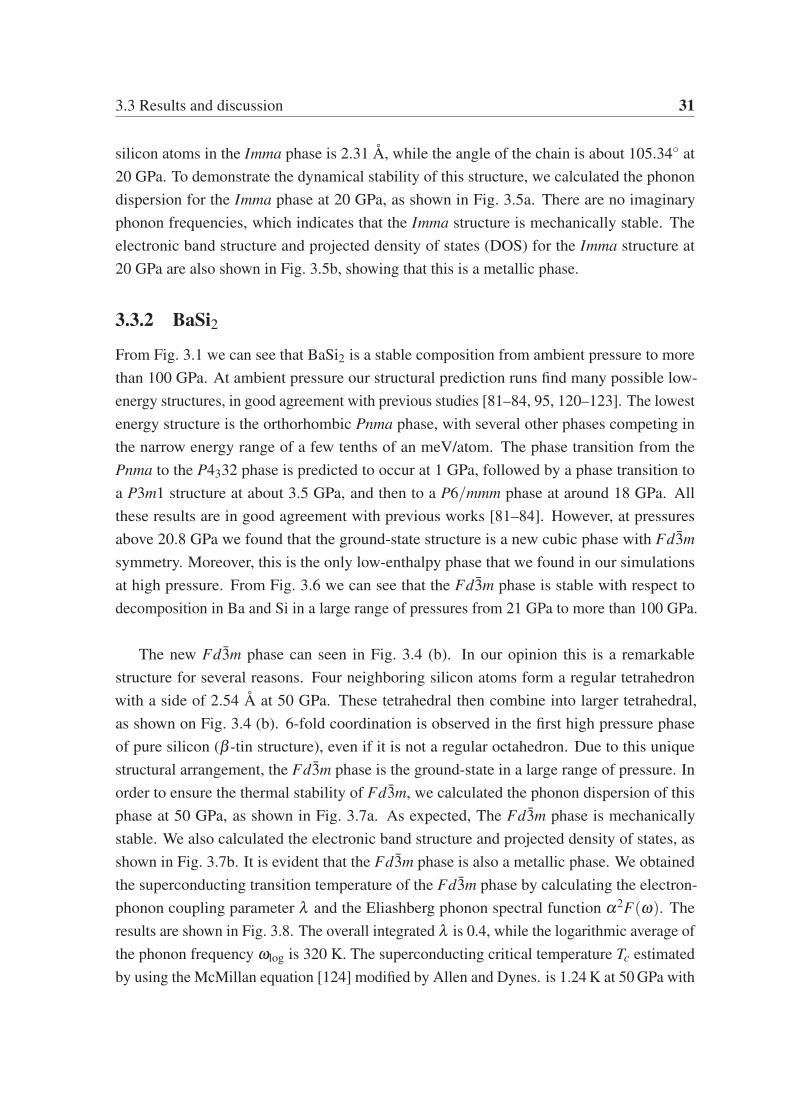
3.3.2 BaSi2From Fig. 3.1 we can see that BaSi2 is a stable composition from ambient pressure to more
than 100 GPa. At ambient pressure our structural prediction runs find many possible low-
energy structures, in good agreement with previous studies [81–84, 95, 120–123]. The lowest
energy structure is the orthorhombic Pnma phase, with several other phases competing in
the narrow energy range of a few tenths of an meV/atom. The phase transition from the
Pnma to the P4332 phase is predicted to occur at 1 GPa, followed by a phase transition to
a P3m1 structure at about 3.5 GPa, and then to a P6/mmm phase at around 18 GPa. All
these results are in good agreement with previous works [81–84]. However, at pressures
above 20.8 GPa we found that the ground-state structure is a new cubic phase with Fd3msymmetry. Moreover, this is the only low-enthalpy phase that we found in our simulations
at high pressure. From Fig. 3.6 we can see that the Fd3m phase is stable with respect to
decomposition in Ba and Si in a large range of pressures from 21 GPa to more than 100 GPa.
The new Fd3m phase can seen in Fig. 3.4 (b). In our opinion this is a remarkable
structure for several reasons. Four neighboring silicon atoms form a regular tetrahedron
with a side of 2.54 Å at 50 GPa. These tetrahedral then combine into larger tetrahedral,
as shown on Fig. 3.4 (b). 6-fold coordination is observed in the first high pressure phase
of pure silicon (β -tin structure), even if it is not a regular octahedron. Due to this unique
structural arrangement, the Fd3m phase is the ground-state in a large range of pressure. In
order to ensure the thermal stability of Fd3m, we calculated the phonon dispersion of this
phase at 50 GPa, as shown in Fig. 3.7a. As expected, The Fd3m phase is mechanically
stable. We also calculated the electronic band structure and projected density of states, as
shown in Fig. 3.7b. It is evident that the Fd3m phase is also a metallic phase. We obtained
the superconducting transition temperature of the Fd3m phase by calculating the electron-
phonon coupling parameter λ and the Eliashberg phonon spectral function α2F(ω). The
results are shown in Fig. 3.8. The overall integrated λ is 0.4, while the logarithmic average of
the phonon frequency ωlog is 320 K. The superconducting critical temperature Tc estimated
by using the McMillan equation [124] modified by Allen and Dynes. is 1.24 K at 50 GPa with
32 New phases of Ba-Si system under high pressure
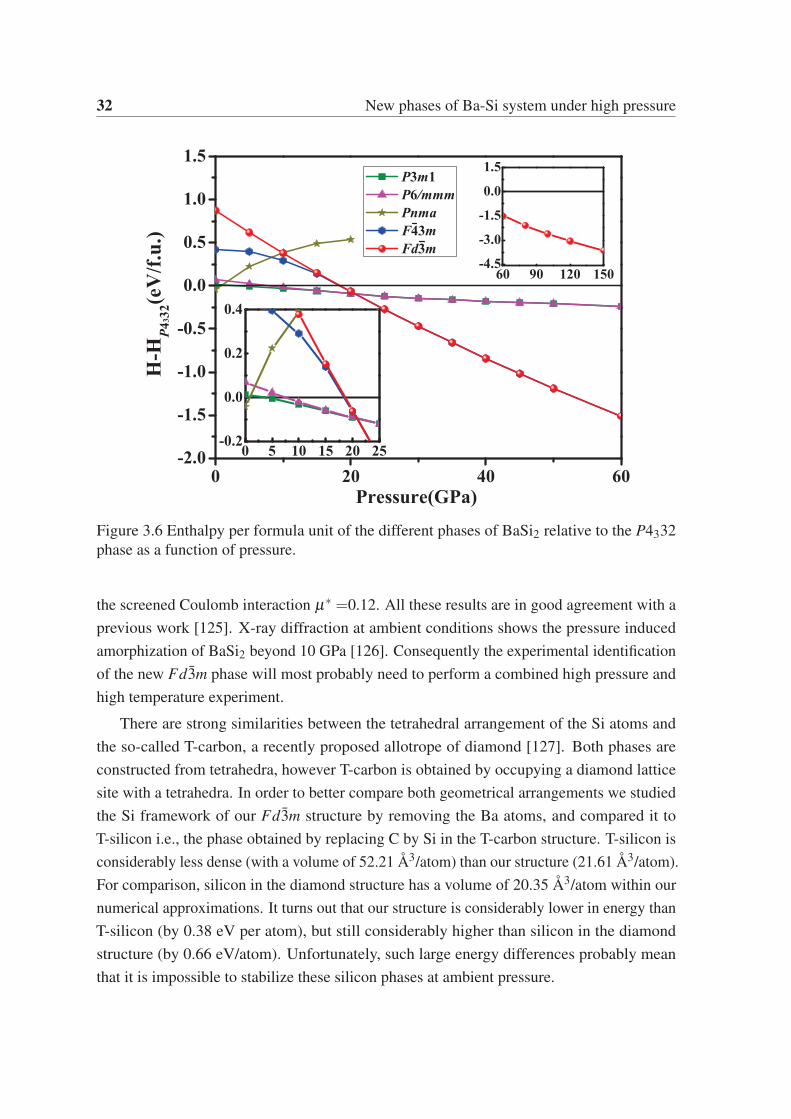
Figure 3.6 Enthalpy per formula unit of the different phases of BaSi2 relative to the P4332
phase as a function of pressure.
the screened Coulomb interaction μ∗ =0.12. All these results are in good agreement with a
previous work [125]. X-ray diffraction at ambient conditions shows the pressure induced
amorphization of BaSi2 beyond 10 GPa [126]. Consequently the experimental identification
of the new Fd3m phase will most probably need to perform a combined high pressure and
high temperature experiment.
There are strong similarities between the tetrahedral arrangement of the Si atoms and
the so-called T-carbon, a recently proposed allotrope of diamond [127]. Both phases are
constructed from tetrahedra, however T-carbon is obtained by occupying a diamond lattice
site with a tetrahedra. In order to better compare both geometrical arrangements we studied
the Si framework of our Fd3m structure by removing the Ba atoms, and compared it to
T-silicon i.e., the phase obtained by replacing C by Si in the T-carbon structure. T-silicon is
considerably less dense (with a volume of 52.21 Å3/atom) than our structure (21.61 Å3/atom).
For comparison, silicon in the diamond structure has a volume of 20.35 Å3/atom within our
numerical approximations. It turns out that our structure is considerably lower in energy than
T-silicon (by 0.38 eV per atom), but still considerably higher than silicon in the diamond
structure (by 0.66 eV/atom). Unfortunately, such large energy differences probably mean
that it is impossible to stabilize these silicon phases at ambient pressure.
3.3 Results and discussion 33
(a)
(b)
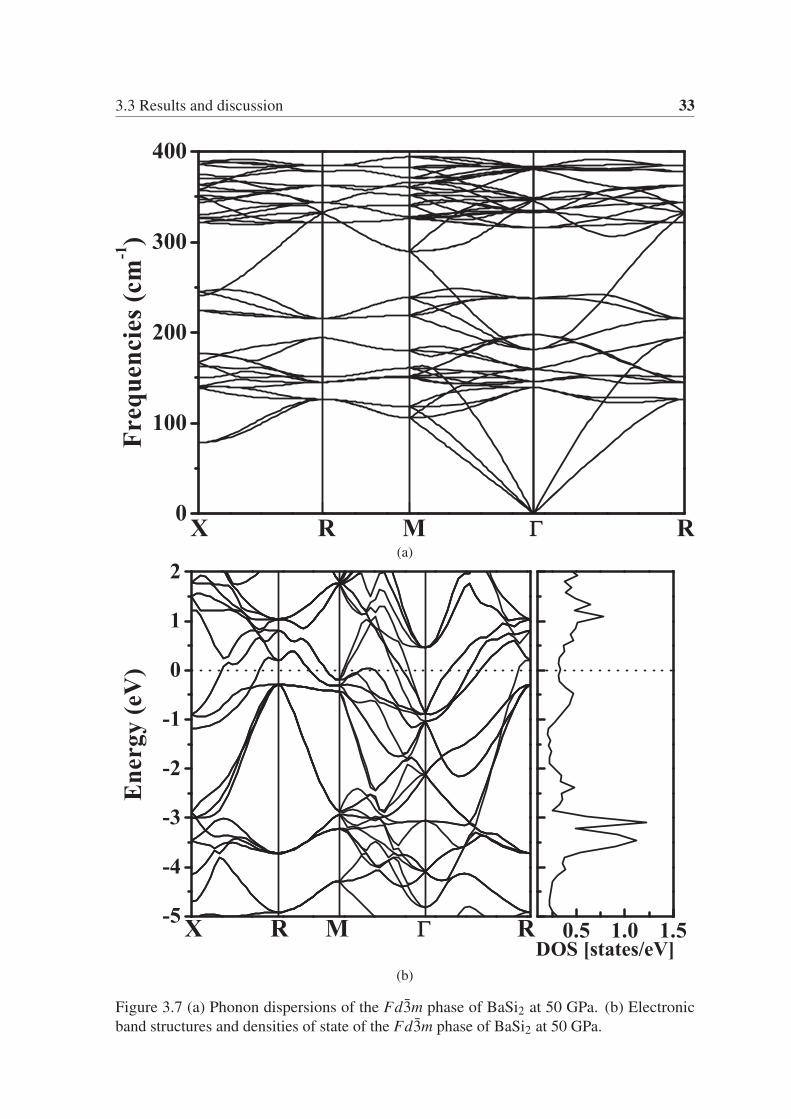
Figure 3.7 (a) Phonon dispersions of the Fd3m phase of BaSi2 at 50 GPa. (b) Electronic
band structures and densities of state of the Fd3m phase of BaSi2 at 50 GPa.

34 New phases of Ba-Si system under high pressure
Figure 3.8 Eliashberg phonon spectral function α2F(ω) and integrated EPC parameter λ as
a function of frequency for the Fd3m structure at 50 GPa.
3.3.3 BaSi3, BaSi5 and BaSi6
The composition BaSi3 is very close to the convex hull for pressures of around 20 GPa.
Our predicted structure [see Fig. 3.4 (c)] has I4/mmm symmetry and 4 formula units in its
primitive cell. This is a very complicated and unusual structure, with corrugated Ba planes
separated by Si layers. In these layers we find silicon cubes connected between themselves
through bridging Si atoms in a two-dimensional lattice. The smallest distance between two
silicon atoms at 20 GPa is 2.34 Å, while the longest Si-Si bond is 2.47 Å.
On the other hand, we found that BaSi5 crystallizes in a fascinating Cmmm structure [see
Fig. 3.4 (d)] that is on the convex hull in a small pressure range at around 20 GPa. This phase
consists of two superposed flat hexagonal Si layers intercalated by Ba atoms that are located
at the center of the Si hexagons. Between the two Si planes one finds further Si atoms also at
the center of the hexagons. The Si-Si bond distance is in this case 2.43 Å.
The composition BaSi6 is stable at pressures from 5 to 20 GPa. Our structural prediction
runs find an interesting structure with Cmcm symmetry, where silicon atoms form a beer barrel
type polyhedron, with the polyhedra linked by sharing faces to form channels containing the
Ba atoms. This is the same structure found in previous works [95].
3.3 Results and discussion 35
(a)
(b)
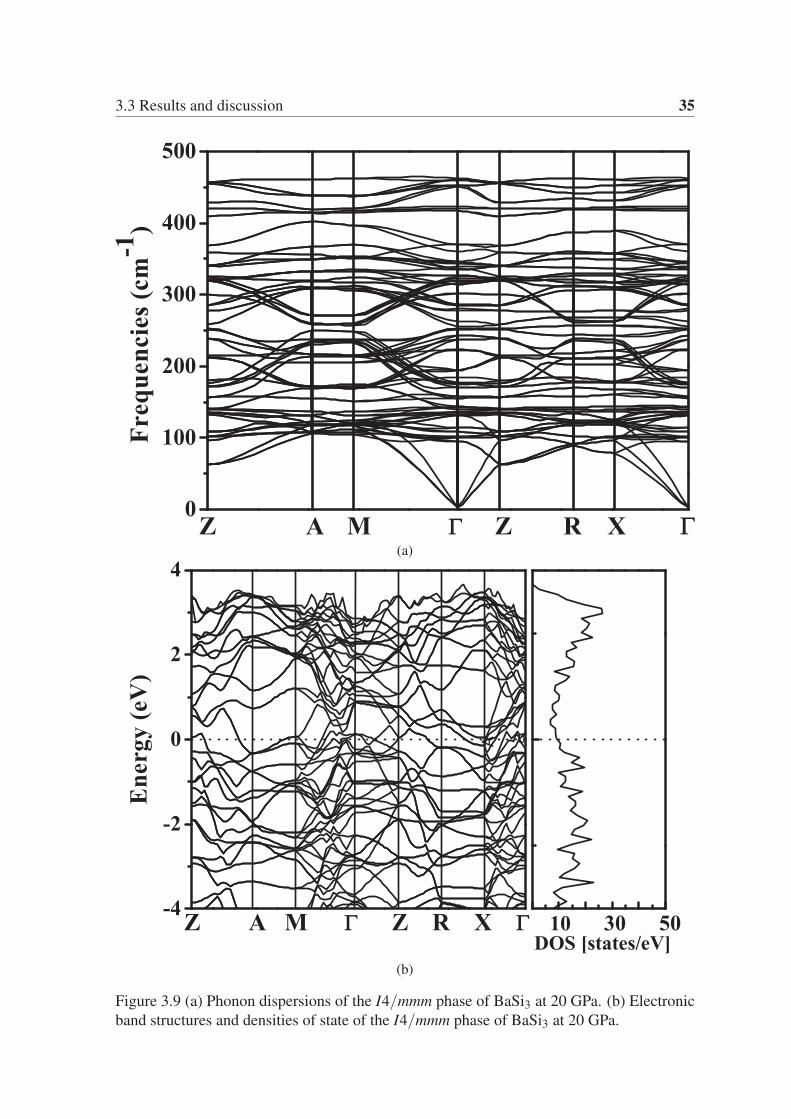
Figure 3.9 (a) Phonon dispersions of the I4/mmm phase of BaSi3 at 20 GPa. (b) Electronic
band structures and densities of state of the I4/mmm phase of BaSi3 at 20 GPa.
36 New phases of Ba-Si system under high pressure
(a)
(b)
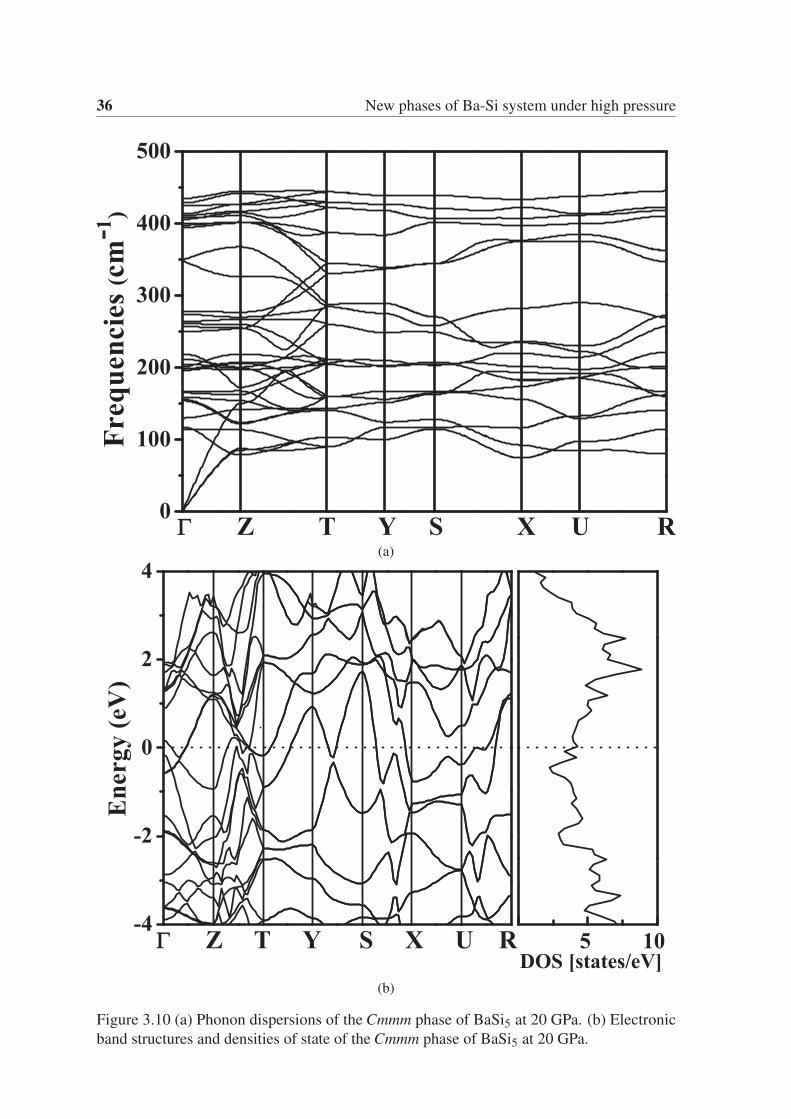
Figure 3.10 (a) Phonon dispersions of the Cmmm phase of BaSi5 at 20 GPa. (b) Electronic
band structures and densities of state of the Cmmm phase of BaSi5 at 20 GPa.
3.4 Conclusions 37
From the phonon dispersion of the I4/mmm phase of BaSi3 and the Cmmm phase of BaSi5,
as shown in Fig. 3.9a and Fig. 3.10a, we can ensure that both structures are mechanically
stable. We calculated the band structure and the electronic density of states for the I4/mmmphase of BaSi3 and the Cmmm phase of BaSi5. As shown in Fig. 3.9b and Fig. 3.10b, both
phases are metallic.
3.4 Conclusions
In summary, using a global structural prediction method we studied systematically the phase
diagram and the electronic properties of Ba–Si compounds. We identify five novel stoichio-
metric BaSix phases with unexpected structures that might be experimentally synthesizable
over a wide range of pressure. These include BaSi, BaSi2, BaSi3, BaSi5, and BaSi6. For the
BaSi system, we find a new metallic Imma phase that is stable under pressure from 6 GPa
to 65 GPa. For BaSi2, there is a new metallic phase Fd3m that is stable from 21 GPa to
100 GPa. This phase, in which each Si forms six bonds with other neighboring Si atoms,
becomes superconducting below 1.2 K at 50 GPa. Finally, at around 20 GPa two unexpected
compositions become stable, namely BaSi3 (I4/mmm) and BaSi5 (Cmmm), both displaying
metallic behavior. These results show the remarkable variety of Ba–Si compounds, and can
serve as an important guide for further experimental studies of this binary system.

Chapter 4
Phase diagram of N-H-O system underhigh pressure
4.1 Introduction
Nitrogen, oxygen and hydrogen are some of the simplest and better studied elements of
the periodic table. Moreover, they are some of the most abundant elements in the solar
system and form several textbook compounds (such as water, nitrogen oxides, ammonia,
nitric acid, etc.) that are fundamental not only to life, but also to modern industry [128–
132]. The ternary phase diagram H–N–O is extremely well characterized as a function of
temperature at ambient pressure. There are also a large amount of studies, both experimental
and theoretical, focused on the binary phase diagrams H–N, H–O, and N–O up to very
high pressures [133–135]. However, much less is known about the ternary diagram at high
pressure.
Our aim in this chapter is to perform a systematically study of the ternary H–N–O phase
diagram as a function of pressure. Our main tool are global structural prediction methods.
These methods have proved extremely important in exploring phase-diagrams under pressure
in the last years, and have yielded a remarkable number of important results. For example,
they were used to show that the xenon apparently missing from the Earth is in fact bound with
iron at the interior of our planet [98], or that simple alkali metals become semiconducting
and transparent under pressure [136]. More recently, structural prediction was able to
find superconductivity with record transition temperature in hydrogen sulfide [137, 138], a
prediction that was quickly confirmed experimentally one year later [139].
It is simple to understand the importance and attractiveness of structural prediction in high
pressure science. High-pressure changes substantially the chemistry, leading to novel and
40 Phase diagram of N-H-O system under high pressure
unexpected bonding patterns, making predictions based on our (ambient pressure) intuition
often to fail spectacularly. Furthermore, high-pressure investigations, requiring delicate
diamond anvil cell experiments, are difficult and expensive. Computers, on the other hand,
are by now ubiquitous and have reached unparalleled performances. Computer experiments
appear therefore as a fast and cost-efficient method to explore the phase diagram of solid
substances as a function of pressure.
There are several powerful global structural prediction algorithms developed over the
past decade (such as genetic algorithms [54–56], particle swarm methods [67, 68], random
search [63], minima hopping method [69, 70], etc.), and these are now available in a number
of freely available codes. It is therefore not surprising that global structural prediction studies
of bulk solids under pressure have mushroomed over the past years. A large majority of these
works concentrate on single stoichiometries or binary phase diagrams. Studies of ternary
phase diagrams are of course rarer, due to the much larger number of possible compositions,
and the consequent increase of the required computational effort.
4.2 Elementary and binary phase diagrams
The H–N–O phase diagram in its elementary and binary versions has been extensively studied,
both experimentally and theoretically, in a wide range of pressures and temperatures. In the
following, we will try to summarize briefly the current knowledge of this phase diagram,
starting with the elemental phases.
Hydrogen as the first and arguably the simplest element of the periodic table, has attracted
much attention since Wigner and Huntington proposed in 1935 that solid hydrogen might
dissociate into an atomic metal at around 25 GPa [128]. Unfortunately, the extremely weak
X-ray scattering of hydrogen and the lack of convenient experimental methods hindered for a
long time experimental studies of the low-temperature and high-pressure structures. Phase
I of hydrogen consists of a disordered hcp structure [140], while the low temperature and
high pressure phases II and III of hydrogen were extensively studied both experimentally
and theoretically [63, 103, 141–147]. More recently, experimental results suggest a phase
transition to a metallic, atomic phase at around 447 GPa [148], but these results are still
under intense debate.
Nitrogen has a remarkably rich phase-diagram, with no less than 13 solid molecule
phases [129, 149–155], an amorphous state [150] and two non-molecular phases [156, 157].
At 300 K, nitrogen freezes at 3 GPa to β -N2, and further compression results in the δ , δloc,
ε , ζ and κ phases at 5, 11, 16, 60, and 115 GPa, respectively [130, 131, 151, 158, 159].
Finally, at about 150 GPa, there is a transition to the amorphous η which exhibits substantial
4.2 Elementary and binary phase diagrams 41
pressure hysteresis [150, 160]. Recently, Frost and co-workers synthesized λ -N2 through low
temperature compression and observed it to have a remarkably wide stability range [161].
Oxygen also exhibits a rich polymorphism with seven unambiguously established crys-
talline phases. At ambient pressure and as a function of temperature, oxygen solidifies
to the paramagnetic γ-phase, then to the magnetically disordered β -phase [132, 162] and
ultimately to the anti-ferromagnetic α-phase [163]. At the pressure of 6 GPa, the α-phase
transforms into the anti-ferromagnetic δ -phase [164–166]. As the pressure increases to
about 8 GPa, the δ -phase of oxygen is destroyed, leading to the ε-O8 phase consisting of
O8 clusters [167, 168]. Above 96 GPa, ε-O8 was observed to transform into a metallic
ζ -phase [169, 170] (that intriguingly exhibits superconductivity with a transition tempera-
ture of 0.6 K [171]). Zhu and co-workers predicted another phase of oxygen at 1.92 TPa
exhibiting polymeric spiral chains of O4 [101]. These studies explored the high-pressure
phase diagrams of solid oxygen up to the maximum pressure of 2 TPa.
Like the elementary substances, also the binary N–H, N–O, and O–H systems have been
extensively studied. The low temperature and pressure phase-I (P213) of NH3 undergoes
first-order phase transitions into phase-IV (P212121) at around 3-4 GPa and then into phase-V
at about 14 GPa [133–135]. In 2008, Pickard et al. found that the phase-V of ammonia also
belongs to the space group of P212121. Furthermore, they predicted two new ionic phases
(Pma2 and P21/m) under high pressure that then re-transform into a molecular phase (Pnma)
at about 440 GPa [64].
As one of the most important binary compounds, H2O ice has a very rich phase diagram.
Till now, at least 15 solid phases have been identified experimentally [172, 173] and another 7
high-pressure phases have been predicted through theoretical studies [174–177]. Experimen-
tally, all crystalline phases were found to consist of water molecules connected by hydrogen
bonds except ice-X. This is an atomic crystal that is stable above 70 GPa at low temperature.
Nitrogen oxides like NO, N2O5, NO2 and N2O have also been studied both experimentally
and theoretically. NO is a metastable compound at low pressure, while a polymeric NO
structure becomes stable at 198 GPa [178]. Molecular N2O5 phases are stable in a wide
pressure range from 9 to 446 GPa, when they decompose into NO and O [178]. The cubic
phase (Im−3) of NO2 forgoes two phase transitions at 7 GPa (to a P21/c crystal) and then
at 64 GPa (to an another P21/c phase), before decomposing at 91 GPa [178]. N2O follows a
series of phase transitions from Pa3[179] → Cmca[180] → C2m[181] → P21/m[182] at the
pressures of 5, 57, 177 and 194 GPa, respectively.
Finally, the ternary phase AMH I [183] of NH3H2O transforms into AMH II [184] at
about 2.8 GPa and then transforms into a P4/nmm and then to a Ima2 phase at 3.3 GPa
and 42 GPa [185] respectively. On the other hand, a new high-pressure phase (P21/c) of
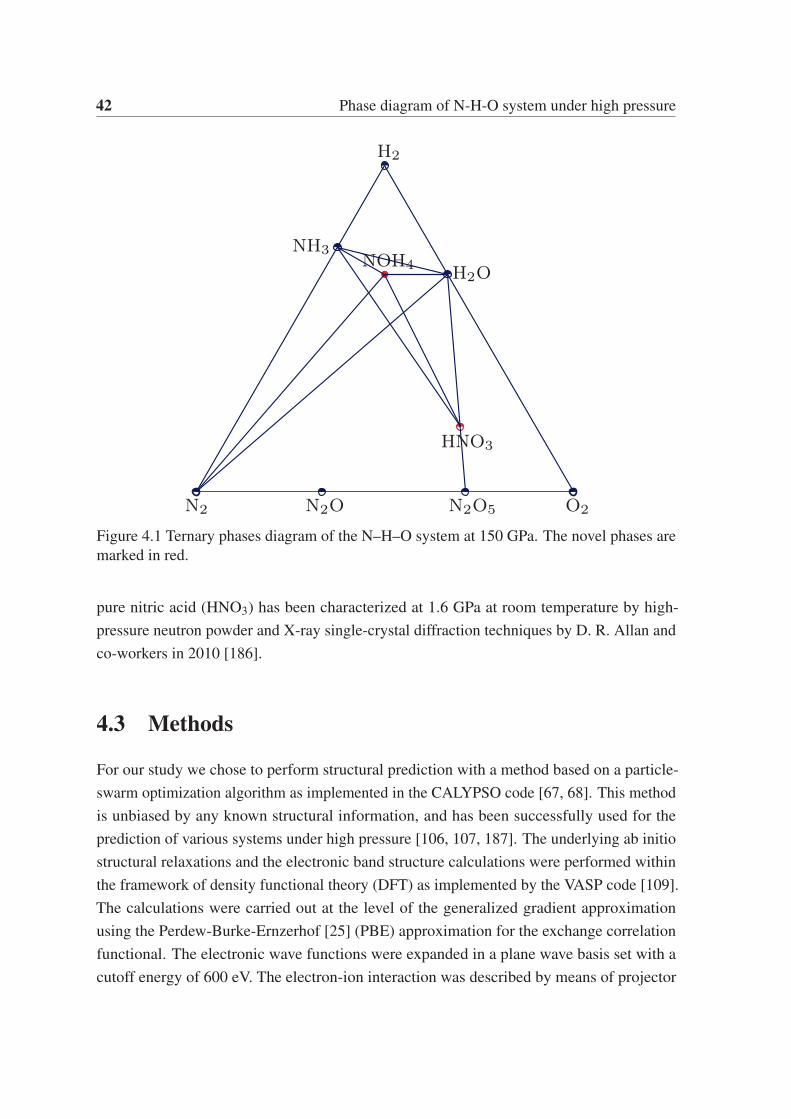
42 Phase diagram of N-H-O system under high pressure
N2 O2
H2
NH3
N2O N2O5
H2O
HNO3
NOH4
Figure 4.1 Ternary phases diagram of the N–H–O system at 150 GPa. The novel phases are
marked in red.
pure nitric acid (HNO3) has been characterized at 1.6 GPa at room temperature by high-
pressure neutron powder and X-ray single-crystal diffraction techniques by D. R. Allan and
co-workers in 2010 [186].
4.3 Methods
For our study we chose to perform structural prediction with a method based on a particle-
swarm optimization algorithm as implemented in the CALYPSO code [67, 68]. This method
is unbiased by any known structural information, and has been successfully used for the
prediction of various systems under high pressure [106, 107, 187]. The underlying ab initio
structural relaxations and the electronic band structure calculations were performed within
the framework of density functional theory (DFT) as implemented by the VASP code [109].
The calculations were carried out at the level of the generalized gradient approximation
using the Perdew-Burke-Ernzerhof [25] (PBE) approximation for the exchange correlation
functional. The electronic wave functions were expanded in a plane wave basis set with a
cutoff energy of 600 eV. The electron-ion interaction was described by means of projector
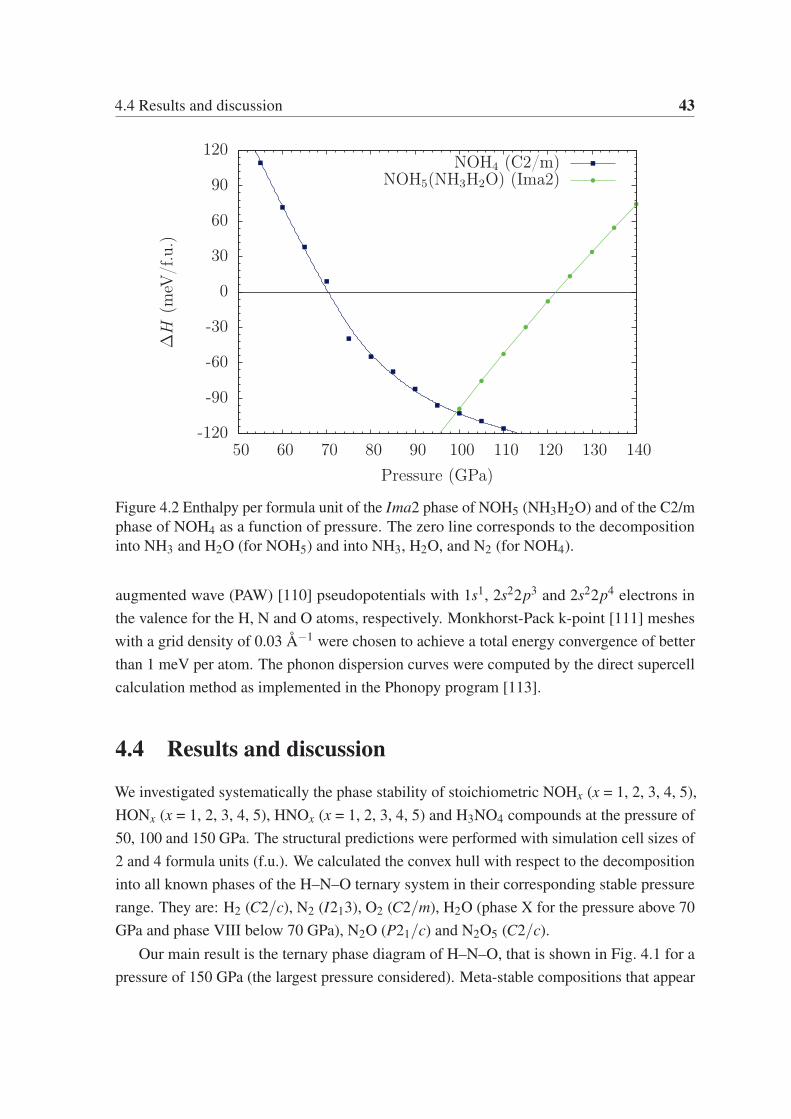
4.4 Results and discussion 43
-120
-90
-60
-30
0
30
60
90
120
50 60 70 80 90 100 110 120 130 140
ΔH
(meV
/f.u
.)
Pressure (GPa)
NOH4 (C2/m)NOH5(NH3H2O) (Ima2)
Figure 4.2 Enthalpy per formula unit of the Ima2 phase of NOH5 (NH3H2O) and of the C2/m
phase of NOH4 as a function of pressure. The zero line corresponds to the decomposition
into NH3 and H2O (for NOH5) and into NH3, H2O, and N2 (for NOH4).
augmented wave (PAW) [110] pseudopotentials with 1s1, 2s22p3 and 2s22p4 electrons in
the valence for the H, N and O atoms, respectively. Monkhorst-Pack k-point [111] meshes
with a grid density of 0.03 Å−1 were chosen to achieve a total energy convergence of better
than 1 meV per atom. The phonon dispersion curves were computed by the direct supercell
calculation method as implemented in the Phonopy program [113].
4.4 Results and discussion
We investigated systematically the phase stability of stoichiometric NOHx (x = 1, 2, 3, 4, 5),
HONx (x = 1, 2, 3, 4, 5), HNOx (x = 1, 2, 3, 4, 5) and H3NO4 compounds at the pressure of
50, 100 and 150 GPa. The structural predictions were performed with simulation cell sizes of
2 and 4 formula units (f.u.). We calculated the convex hull with respect to the decomposition
into all known phases of the H–N–O ternary system in their corresponding stable pressure
range. They are: H2 (C2/c), N2 (I213), O2 (C2/m), H2O (phase X for the pressure above 70
GPa and phase VIII below 70 GPa), N2O (P21/c) and N2O5 (C2/c).
Our main result is the ternary phase diagram of H–N–O, that is shown in Fig. 4.1 for a
pressure of 150 GPa (the largest pressure considered). Meta-stable compositions that appear
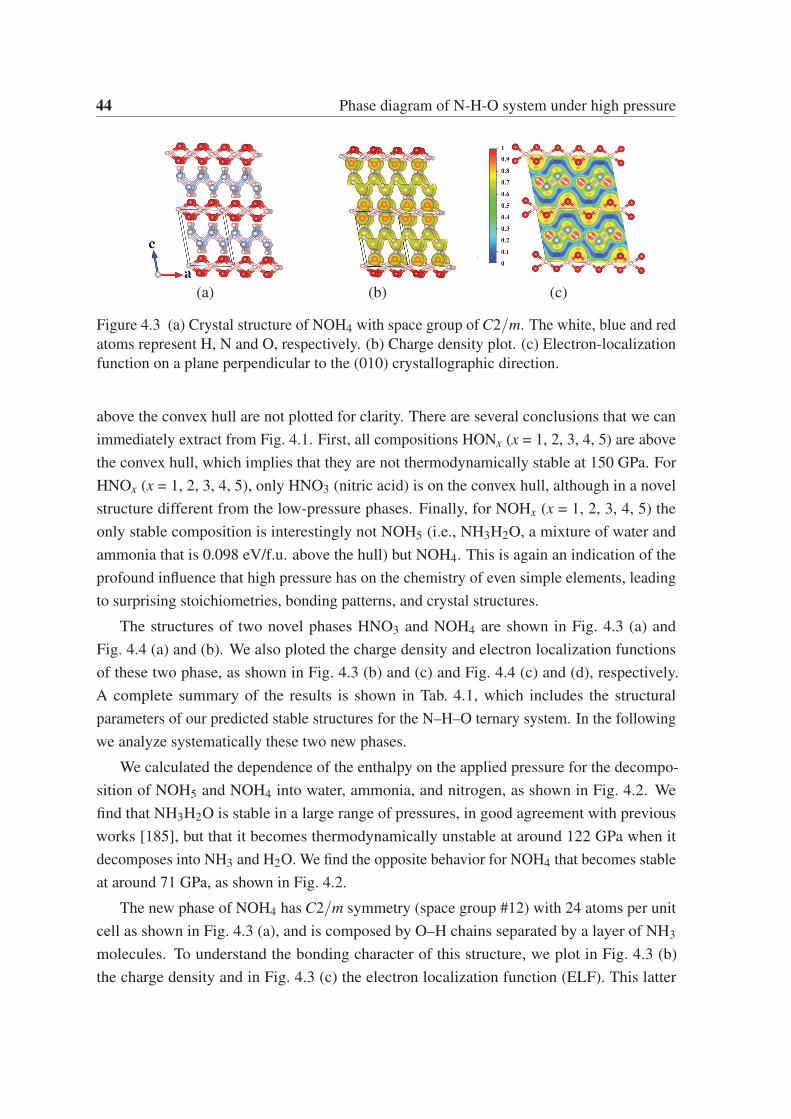
44 Phase diagram of N-H-O system under high pressure
(a) (b) (c)
Figure 4.3 (a) Crystal structure of NOH4 with space group of C2/m. The white, blue and red
atoms represent H, N and O, respectively. (b) Charge density plot. (c) Electron-localization
function on a plane perpendicular to the (010) crystallographic direction.
above the convex hull are not plotted for clarity. There are several conclusions that we can
immediately extract from Fig. 4.1. First, all compositions HONx (x = 1, 2, 3, 4, 5) are above
the convex hull, which implies that they are not thermodynamically stable at 150 GPa. For
HNOx (x = 1, 2, 3, 4, 5), only HNO3 (nitric acid) is on the convex hull, although in a novel
structure different from the low-pressure phases. Finally, for NOHx (x = 1, 2, 3, 4, 5) the
only stable composition is interestingly not NOH5 (i.e., NH3H2O, a mixture of water and
ammonia that is 0.098 eV/f.u. above the hull) but NOH4. This is again an indication of the
profound influence that high pressure has on the chemistry of even simple elements, leading
to surprising stoichiometries, bonding patterns, and crystal structures.
The structures of two novel phases HNO3 and NOH4 are shown in Fig. 4.3 (a) and
Fig. 4.4 (a) and (b). We also ploted the charge density and electron localization functions
of these two phase, as shown in Fig. 4.3 (b) and (c) and Fig. 4.4 (c) and (d), respectively.
A complete summary of the results is shown in Tab. 4.1, which includes the structural
parameters of our predicted stable structures for the N–H–O ternary system. In the following
we analyze systematically these two new phases.
We calculated the dependence of the enthalpy on the applied pressure for the decompo-
sition of NOH5 and NOH4 into water, ammonia, and nitrogen, as shown in Fig. 4.2. We
find that NH3H2O is stable in a large range of pressures, in good agreement with previous
works [185], but that it becomes thermodynamically unstable at around 122 GPa when it
decomposes into NH3 and H2O. We find the opposite behavior for NOH4 that becomes stable
at around 71 GPa, as shown in Fig. 4.2.
The new phase of NOH4 has C2/m symmetry (space group #12) with 24 atoms per unit
cell as shown in Fig. 4.3 (a), and is composed by O–H chains separated by a layer of NH3
molecules. To understand the bonding character of this structure, we plot in Fig. 4.3 (b)
the charge density and in Fig. 4.3 (c) the electron localization function (ELF). This latter
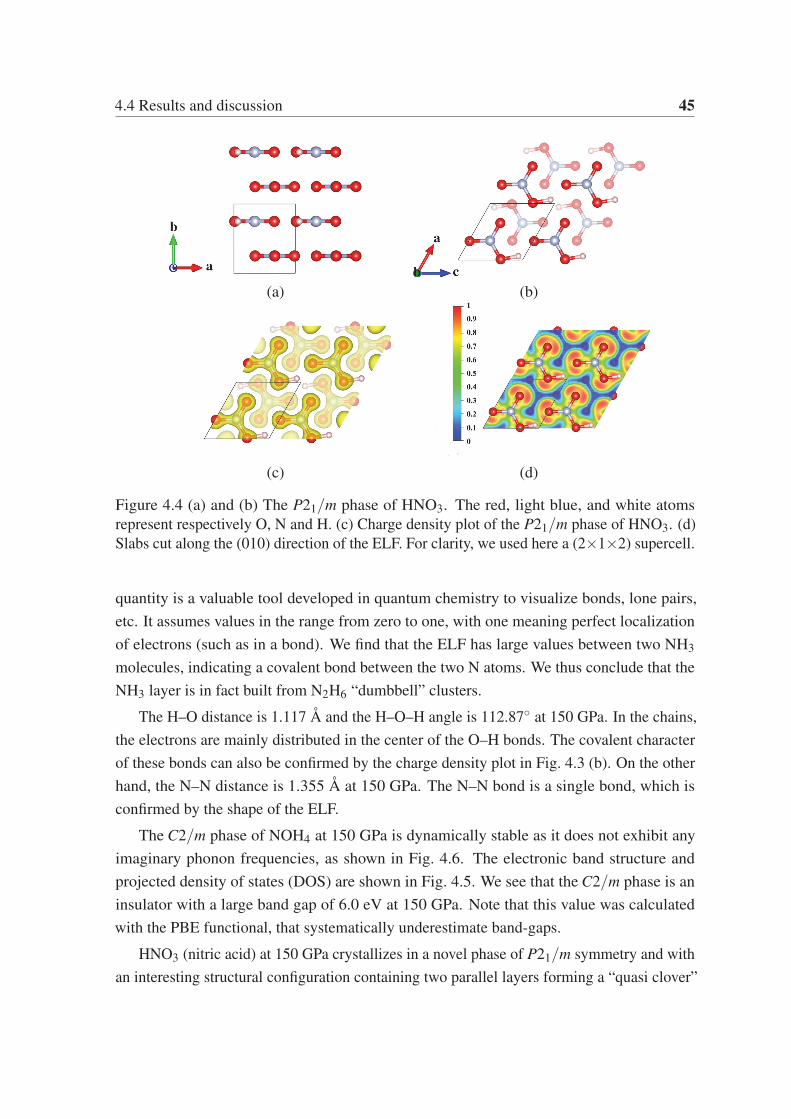
4.4 Results and discussion 45
(a) (b)
(c) (d)
Figure 4.4 (a) and (b) The P21/m phase of HNO3. The red, light blue, and white atoms
represent respectively O, N and H. (c) Charge density plot of the P21/m phase of HNO3. (d)
Slabs cut along the (010) direction of the ELF. For clarity, we used here a (2×1×2) supercell.
quantity is a valuable tool developed in quantum chemistry to visualize bonds, lone pairs,
etc. It assumes values in the range from zero to one, with one meaning perfect localization
of electrons (such as in a bond). We find that the ELF has large values between two NH3
molecules, indicating a covalent bond between the two N atoms. We thus conclude that the
NH3 layer is in fact built from N2H6 “dumbbell” clusters.
The H–O distance is 1.117 Å and the H–O–H angle is 112.87◦ at 150 GPa. In the chains,
the electrons are mainly distributed in the center of the O–H bonds. The covalent character
of these bonds can also be confirmed by the charge density plot in Fig. 4.3 (b). On the other
hand, the N–N distance is 1.355 Å at 150 GPa. The N–N bond is a single bond, which is
confirmed by the shape of the ELF.
The C2/m phase of NOH4 at 150 GPa is dynamically stable as it does not exhibit any
imaginary phonon frequencies, as shown in Fig. 4.6. The electronic band structure and
projected density of states (DOS) are shown in Fig. 4.5. We see that the C2/m phase is an
insulator with a large band gap of 6.0 eV at 150 GPa. Note that this value was calculated
with the PBE functional, that systematically underestimate band-gaps.
HNO3 (nitric acid) at 150 GPa crystallizes in a novel phase of P21/m symmetry and with
an interesting structural configuration containing two parallel layers forming a “quasi clover”
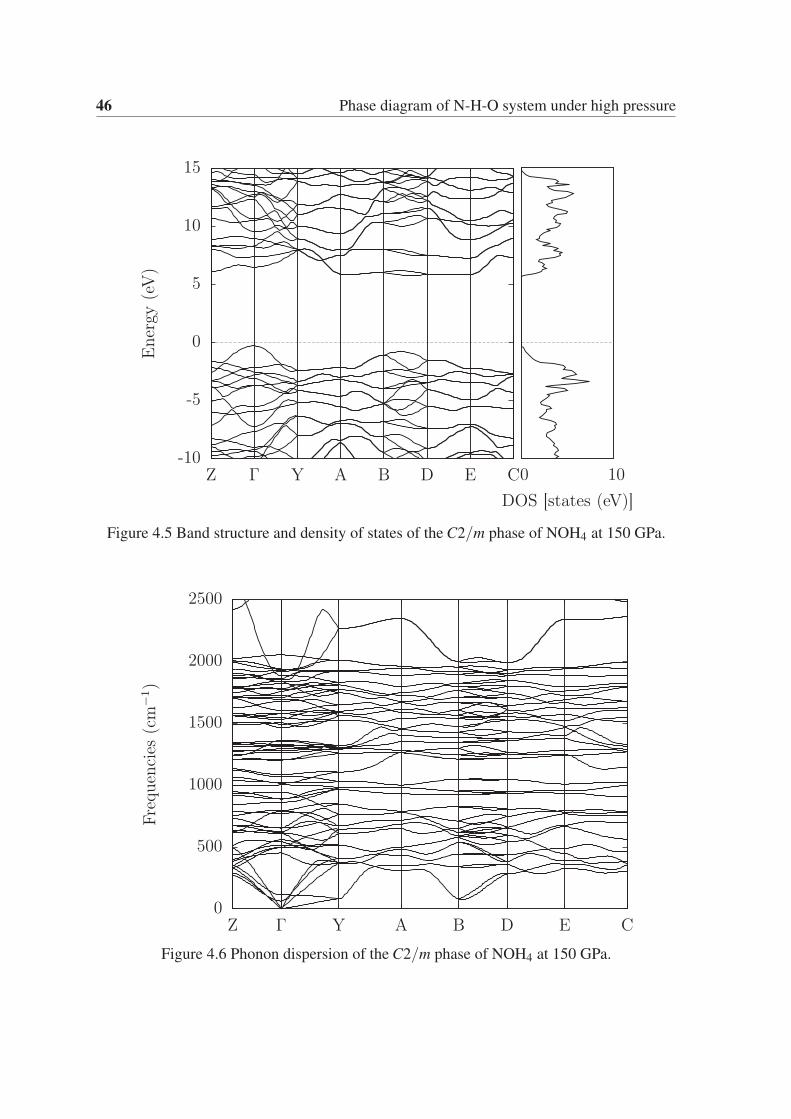
46 Phase diagram of N-H-O system under high pressure
-10
-5
0
5
10
15
Z Γ Y A B D E C
Ene
rgy
(eV
)
0 10DOS [states (eV)]
Figure 4.5 Band structure and density of states of the C2/m phase of NOH4 at 150 GPa.
0
500
1000
1500
2000
2500
Z Γ Y A B D E C
Freq
uenc
ies
(cm
−1)
Figure 4.6 Phonon dispersion of the C2/m phase of NOH4 at 150 GPa.
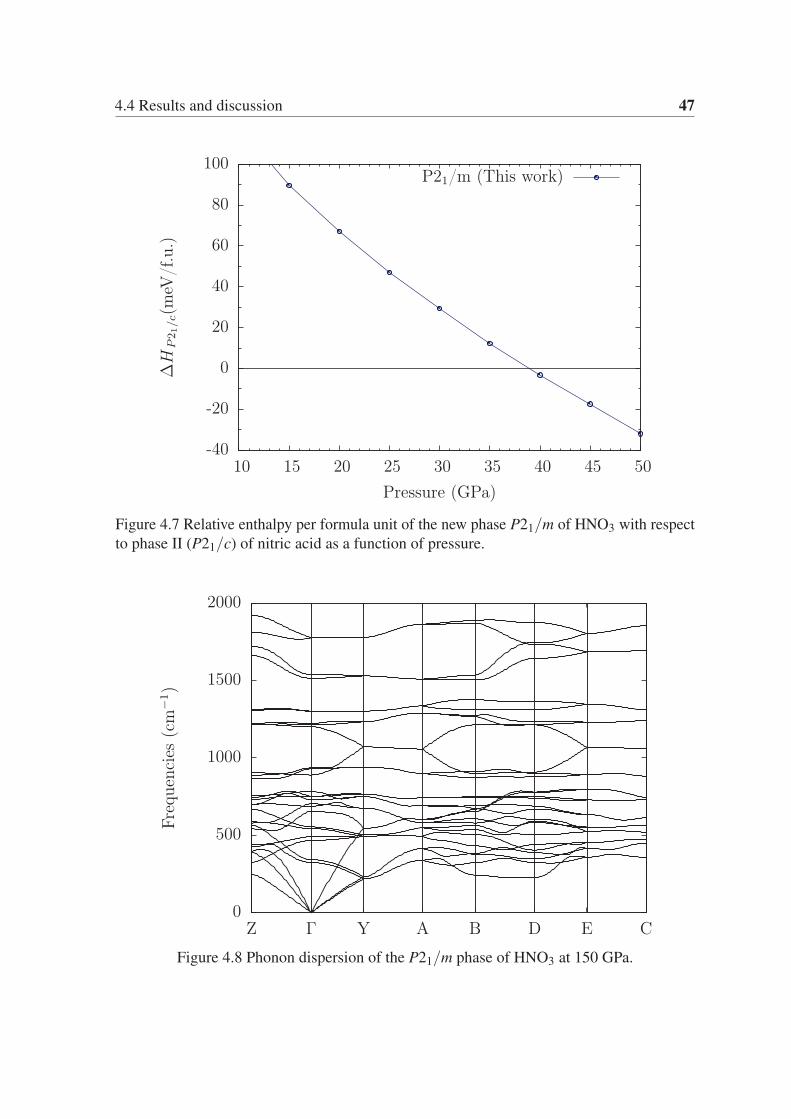
4.4 Results and discussion 47
-40
-20
0
20
40
60
80
100
10 15 20 25 30 35 40 45 50
ΔH
P21/c(m
eV/f
.u.)
Pressure (GPa)
P21/m (This work)
Figure 4.7 Relative enthalpy per formula unit of the new phase P21/m of HNO3 with respect
to phase II (P21/c) of nitric acid as a function of pressure.
0
500
1000
1500
2000
Z Γ Y A B D E C
Freq
uenc
ies
(cm
−1)
Figure 4.8 Phonon dispersion of the P21/m phase of HNO3 at 150 GPa.
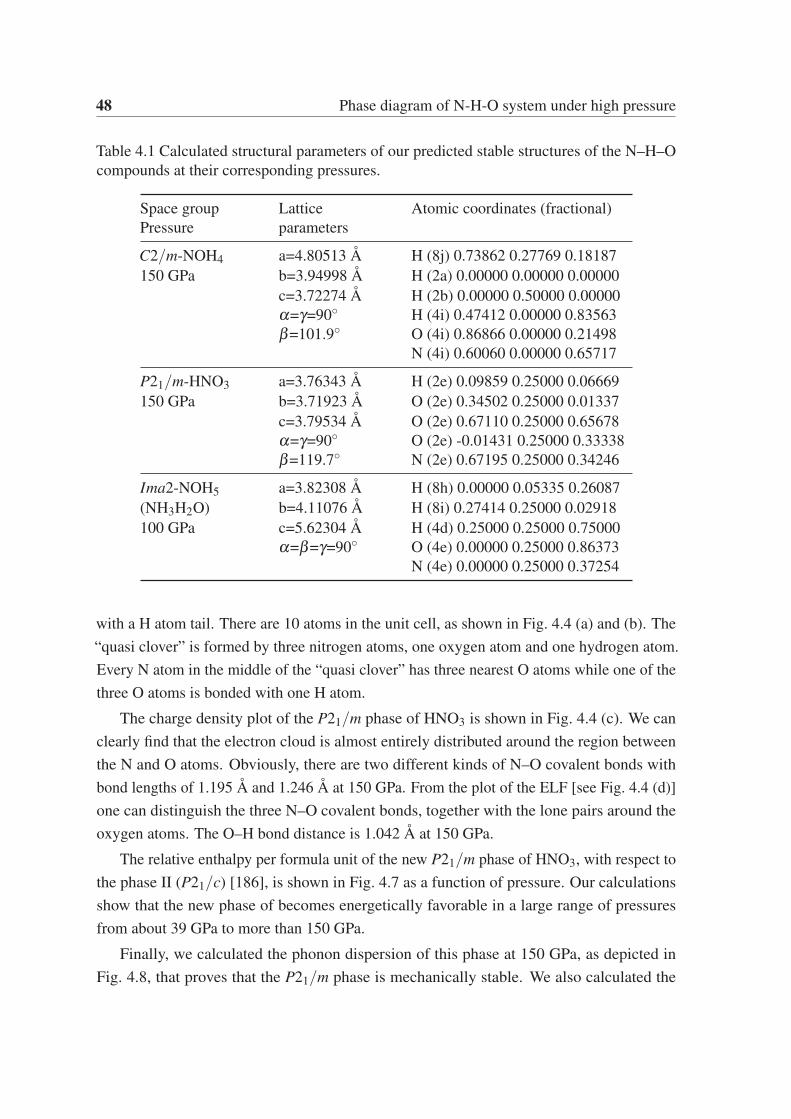
48 Phase diagram of N-H-O system under high pressure
Table 4.1 Calculated structural parameters of our predicted stable structures of the N–H–O
compounds at their corresponding pressures.
Space group Lattice Atomic coordinates (fractional)
Pressure parameters
C2/m-NOH4 a=4.80513 Å H (8j) 0.73862 0.27769 0.18187
150 GPa b=3.94998 Å H (2a) 0.00000 0.00000 0.00000
c=3.72274 Å H (2b) 0.00000 0.50000 0.00000
α=γ=90◦ H (4i) 0.47412 0.00000 0.83563
β=101.9◦ O (4i) 0.86866 0.00000 0.21498
N (4i) 0.60060 0.00000 0.65717
P21/m-HNO3 a=3.76343 Å H (2e) 0.09859 0.25000 0.06669
150 GPa b=3.71923 Å O (2e) 0.34502 0.25000 0.01337
c=3.79534 Å O (2e) 0.67110 0.25000 0.65678
α=γ=90◦ O (2e) -0.01431 0.25000 0.33338
β=119.7◦ N (2e) 0.67195 0.25000 0.34246
Ima2-NOH5 a=3.82308 Å H (8h) 0.00000 0.05335 0.26087
(NH3H2O) b=4.11076 Å H (8i) 0.27414 0.25000 0.02918
100 GPa c=5.62304 Å H (4d) 0.25000 0.25000 0.75000
α=β=γ=90◦ O (4e) 0.00000 0.25000 0.86373
N (4e) 0.00000 0.25000 0.37254
with a H atom tail. There are 10 atoms in the unit cell, as shown in Fig. 4.4 (a) and (b). The
“quasi clover” is formed by three nitrogen atoms, one oxygen atom and one hydrogen atom.
Every N atom in the middle of the “quasi clover” has three nearest O atoms while one of the
three O atoms is bonded with one H atom.
The charge density plot of the P21/m phase of HNO3 is shown in Fig. 4.4 (c). We can
clearly find that the electron cloud is almost entirely distributed around the region between
the N and O atoms. Obviously, there are two different kinds of N–O covalent bonds with
bond lengths of 1.195 Å and 1.246 Å at 150 GPa. From the plot of the ELF [see Fig. 4.4 (d)]
one can distinguish the three N–O covalent bonds, together with the lone pairs around the
oxygen atoms. The O–H bond distance is 1.042 Å at 150 GPa.
The relative enthalpy per formula unit of the new P21/m phase of HNO3, with respect to
the phase II (P21/c) [186], is shown in Fig. 4.7 as a function of pressure. Our calculations
show that the new phase of becomes energetically favorable in a large range of pressures
from about 39 GPa to more than 150 GPa.
Finally, we calculated the phonon dispersion of this phase at 150 GPa, as depicted in
Fig. 4.8, that proves that the P21/m phase is mechanically stable. We also calculated the
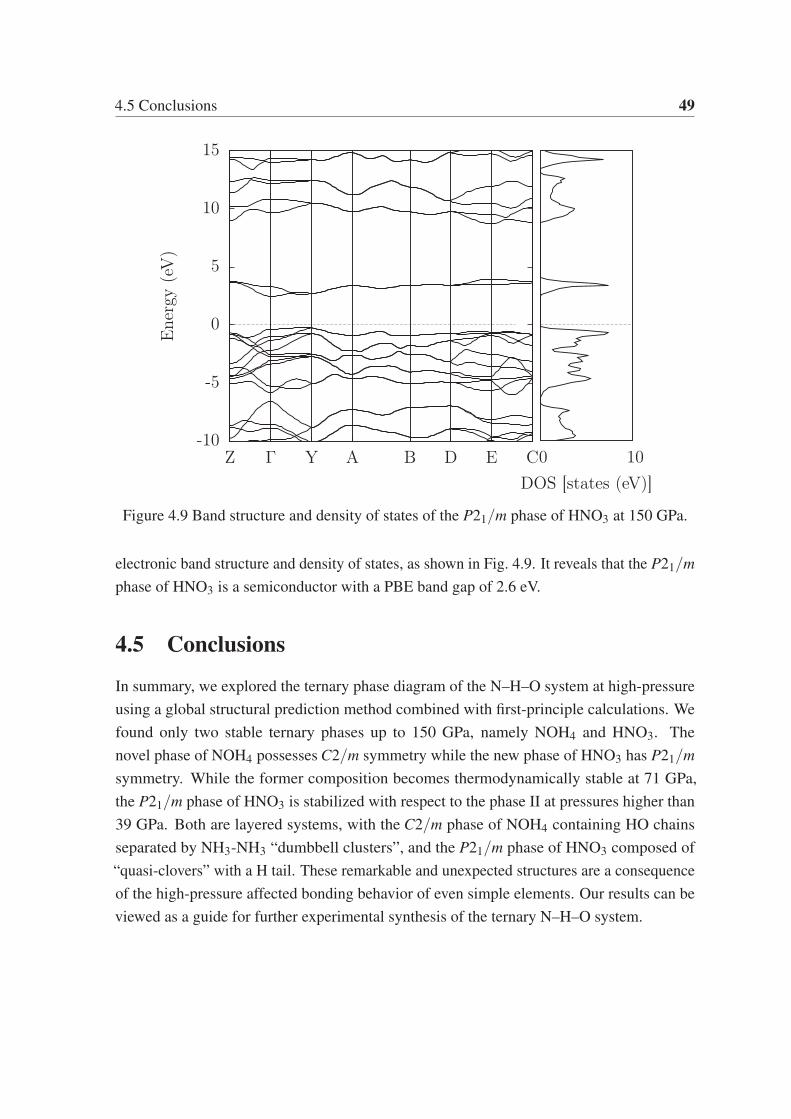
4.5 Conclusions 49
-10
-5
0
5
10
15
Z Γ Y A B D E C
Ene
rgy
(eV
)
0 10DOS [states (eV)]
Figure 4.9 Band structure and density of states of the P21/m phase of HNO3 at 150 GPa.
electronic band structure and density of states, as shown in Fig. 4.9. It reveals that the P21/mphase of HNO3 is a semiconductor with a PBE band gap of 2.6 eV.
4.5 Conclusions
In summary, we explored the ternary phase diagram of the N–H–O system at high-pressure
using a global structural prediction method combined with first-principle calculations. We
found only two stable ternary phases up to 150 GPa, namely NOH4 and HNO3. The
novel phase of NOH4 possesses C2/m symmetry while the new phase of HNO3 has P21/msymmetry. While the former composition becomes thermodynamically stable at 71 GPa,
the P21/m phase of HNO3 is stabilized with respect to the phase II at pressures higher than
39 GPa. Both are layered systems, with the C2/m phase of NOH4 containing HO chains
separated by NH3-NH3 “dumbbell clusters”, and the P21/m phase of HNO3 composed of
“quasi-clovers” with a H tail. These remarkable and unexpected structures are a consequence
of the high-pressure affected bonding behavior of even simple elements. Our results can be
viewed as a guide for further experimental synthesis of the ternary N–H–O system.

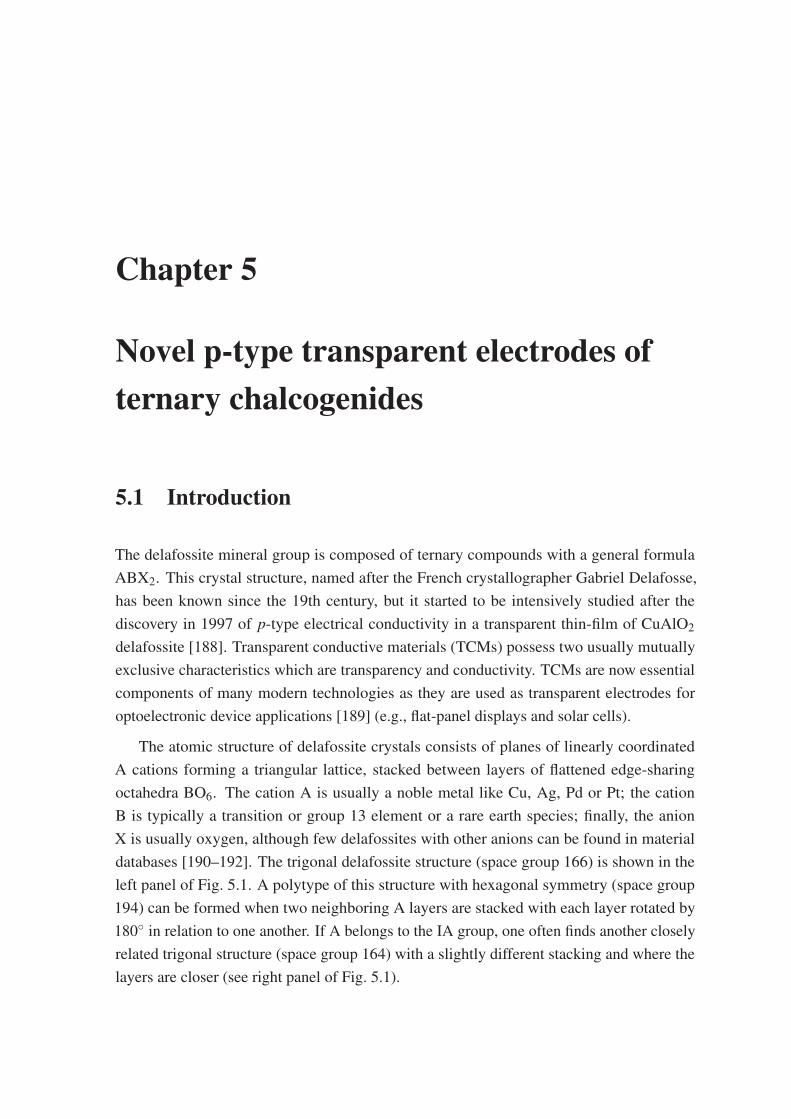
Chapter 5
Novel p-type transparent electrodes ofternary chalcogenides
5.1 Introduction
The delafossite mineral group is composed of ternary compounds with a general formula
ABX2. This crystal structure, named after the French crystallographer Gabriel Delafosse,
has been known since the 19th century, but it started to be intensively studied after the
discovery in 1997 of p-type electrical conductivity in a transparent thin-film of CuAlO2
delafossite [188]. Transparent conductive materials (TCMs) possess two usually mutually
exclusive characteristics which are transparency and conductivity. TCMs are now essential
components of many modern technologies as they are used as transparent electrodes for
optoelectronic device applications [189] (e.g., flat-panel displays and solar cells).
The atomic structure of delafossite crystals consists of planes of linearly coordinated
A cations forming a triangular lattice, stacked between layers of flattened edge-sharing
octahedra BO6. The cation A is usually a noble metal like Cu, Ag, Pd or Pt; the cation
B is typically a transition or group 13 element or a rare earth species; finally, the anion
X is usually oxygen, although few delafossites with other anions can be found in material
databases [190–192]. The trigonal delafossite structure (space group 166) is shown in the
left panel of Fig. 5.1. A polytype of this structure with hexagonal symmetry (space group
194) can be formed when two neighboring A layers are stacked with each layer rotated by
180◦ in relation to one another. If A belongs to the IA group, one often finds another closely
related trigonal structure (space group 164) with a slightly different stacking and where the
layers are closer (see right panel of Fig. 5.1).
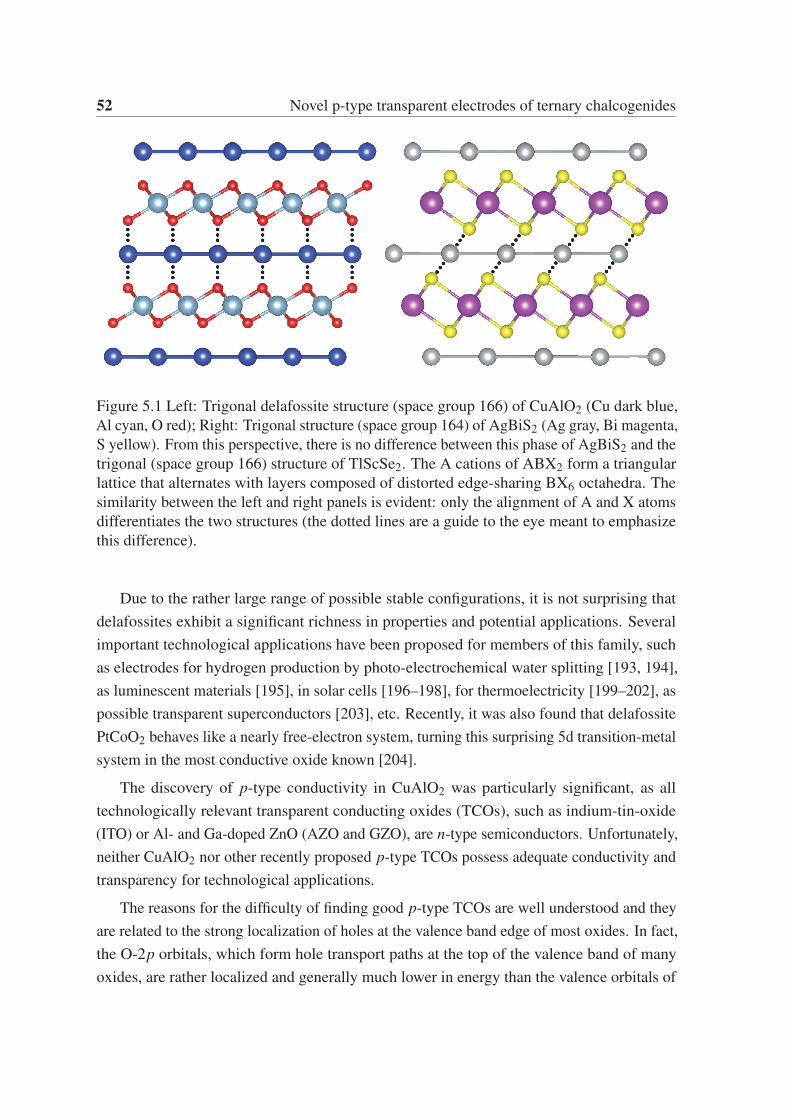
52 Novel p-type transparent electrodes of ternary chalcogenides
Figure 5.1 Left: Trigonal delafossite structure (space group 166) of CuAlO2 (Cu dark blue,
Al cyan, O red); Right: Trigonal structure (space group 164) of AgBiS2 (Ag gray, Bi magenta,
S yellow). From this perspective, there is no difference between this phase of AgBiS2 and the
trigonal (space group 166) structure of TlScSe2. The A cations of ABX2 form a triangular
lattice that alternates with layers composed of distorted edge-sharing BX6 octahedra. The
similarity between the left and right panels is evident: only the alignment of A and X atoms
differentiates the two structures (the dotted lines are a guide to the eye meant to emphasize
this difference).
Due to the rather large range of possible stable configurations, it is not surprising that
delafossites exhibit a significant richness in properties and potential applications. Several
important technological applications have been proposed for members of this family, such
as electrodes for hydrogen production by photo-electrochemical water splitting [193, 194],
as luminescent materials [195], in solar cells [196–198], for thermoelectricity [199–202], as
possible transparent superconductors [203], etc. Recently, it was also found that delafossite
PtCoO2 behaves like a nearly free-electron system, turning this surprising 5d transition-metal
system in the most conductive oxide known [204].
The discovery of p-type conductivity in CuAlO2 was particularly significant, as all
technologically relevant transparent conducting oxides (TCOs), such as indium-tin-oxide
(ITO) or Al- and Ga-doped ZnO (AZO and GZO), are n-type semiconductors. Unfortunately,
neither CuAlO2 nor other recently proposed p-type TCOs possess adequate conductivity and
transparency for technological applications.
The reasons for the difficulty of finding good p-type TCOs are well understood and they
are related to the strong localization of holes at the valence band edge of most oxides. In fact,
the O-2p orbitals, which form hole transport paths at the top of the valence band of many
oxides, are rather localized and generally much lower in energy than the valence orbitals of
5.1 Introduction 53
the metal species. These two facts imply difficulties in hole doping and large hole effective
masses (and therefore low hole mobilities).
In the race for obtaining such elusive material, delafossites have been widely explored
for the past years. Getting inspiration from the structure/property relations in the delafossite
family, Hosono and co-workers [205, 206] proposed few empirical rules for p-type TCOs,
aiming at favoring at the same time large band gaps and dispersive top valence bands: (i) The
A cations should possess closed d shells to prevent from absorbing light in the visible range.
Optical transparency has also been associated with dipole forbidden transitions related to the
linear O-A-O coordination motif. (ii) The energy levels of the A cations should overlap with
the anion p levels (O 2p) to allow for strong hybridization at the top of the valence band.
(iii) Hole paths should be favored, for example providing B states that can mix strongly with
O 2p states into the valence band to build a A-O-B-O-A pathway.
Following Hosono’s rules, the discovery of p-type conductivity in CuAlO2 triggered the
experimental and theoretical characterization of other delafossites [207–211] and of transpar-
ent p-n junctions. CuCrO2 and CuGaO2 are also p-type TCOs [212, 213]. CuInO2 [214] is
particularly interesting because it is amphoteric, i.e. it can be alternatively acceptor-doped
or donor-doped. This ability is explained by the unique presence of two cationic environ-
ments in the delafossite structure: an octahedral indium environment that favors strong
hybridization and n-type dopability, together with a linear copper environment that favors
hybridization at the top valence and p-type doping [211]. Among delafossite compounds,
CuCr1−xMgxO2 [215] possesses the highest conductivity of 220 S cm−1, but transparency
in the visible range is only about 30%, much smaller than for the traditional n-type TCOs.
The recently synthesized Cu deficient CuCrO2 has a conductivity in the range of 1–12 S
cm−1 [216]. It was also claimed that the transparency can be improved by increasing the
temperature, at the cost of higher resistivity [215, 217, 218]. Recently, A. Barnabé and
co-workers studied Mg-doped CuCrO2 thin films by using RF-sputtering [219]. They found
that, at 600◦C, the Mg-doped CuCrO2 structure displayed an optical transmittance of only
63% in the visible range with, however, a conductivity of 1.6 S cm−1.
Another idea, again put forward by Hosono and co-workers [220], is to replace oxygen
with a chalcogen (S, Se, or Te) with more delocalized p orbitals. This has led to the synthesis
of LaCuOS and LaCuOSe p-type oxides [221, 222]. Unfortunately, these latter compounds
have either a too low mobility (LaCuOS) or a too small band gap (LaCuOSe). However,
this strategy looks appealing as the p states of the chalcogen atoms are usually higher and
therefore make the compound more prone to be p-doped. Recent calculations suggest that
this is the case for Ba(Cu,Ag)2(S,Se)2 compounds [223].
54 Novel p-type transparent electrodes of ternary chalcogenides
Going beyond simple empirical rules, experimental databases have been recently explored
by performing high-throughput ab initio calculations [224, 225] to single out compounds
with large band gaps (> 3 eV) and low effective masses. These previous investigations
focused on oxides and showed that small hole effective masses are much rarer that small
electron effective masses. Hautier et al. [224] found that hole effective masses of 0.5–1.0
electron masses (me) in transparent oxides like PbTiO3, PbZrO3, PbHfO3, K2Sn2O3, and
Tl4V2O7 are due to the hybridization of the oxygen 2p orbitals with s states of Sn2+, Pb2+,
Tl1+. Similarly, hole effective masses smaller than 1.0 me and band gaps larger than 3.0 eV
are reported by Sarmadian et al. [225] for X2SeO2, with X = La, Pr, Nd, and Gd. Recently,
Cerqueira et al. [226] performed a search of new compounds of the form (Cu,Ag,Au)XO2
by combining global structural prediction methods and high-throughput calculations. They
showed that there are 45 new (quasi) stable phases in this system, some of which are candidate
p-type transparent conductors. However, these new stable phases contain Ag and Au, which
are not ideal elements for commercial applications.
We remind that finding a large band gap and low hole effective masses is not a sufficient
condition for a good p-type TCO. In fact, another essential condition, much harder to translate
to the minimization/maximization of a simple material property, is the p-type dopability
of the system. As an example, we can think about ZnO: the hole effective mass values for
ZnO range from 0.31 me to 0.59 me and its band gap is about 3.5 eV. Despite these ideal
parameters, numerous attempts to produce p-type doped ZnO have failed [211].
It appears by now clear that if we work only with known materials it will be very hard to
improve both transparency and conductivity to technologically acceptable limits. However,
the search for improved p-type TCMs remains an important open question. Fortunately,
we only know experimentally a fraction of all possible stable compounds. Delafossite
structures, which combine the advantages of linear and octahedral environments for the two
cations remain particularly attractive for p-type TCMs and ambipolar doping. We therefore
asked ourselves: Are there more delafossite compounds that wait to be synthesized and
characterized? And more precisely: can good p-type TCMs be found in the delafossite
family or should we resign ourselves and direct future search towards completely different
crystal families?
Here we provide an answer to the questions above by performing a comprehensive first-
principles investigation of ABX2 systems that may crystallize in the delafossite structure.
We extend in fact our study to all ABX2 compositions where A and B cover the periodic
table from H to Bi (excluding the rare gases and the lanthanides) and X is a chalcogen (O, S,
Se, and Te). This set contains 63×62×4 = 15624 compositions and includes the already
known delafossites crystals. At this point, we take all A and B elements and do not make any
5.2 Methods 55
bias towards non-toxic or abundant elements. Such filtering can however be easily performed
a posteriori.
We note that most research on delafossites is restricted to oxide materials. Also most of
the systems known have X=O. For example, the materials project database [190], contains
90 trigonal ABX2 oxides (with space group 166) while only 23 sulfides, 10 selenides
and 7 tellurides. It is unclear if this is because the delafossite structure prefers the highly
electronegative oxygen, or if it simply reflects a bias against sulfides, selenides, and tellurides.
To screen the large amount of possible compositions of ABX2 compounds, we use
a combination of high-throughput density-functional theory [227] and global structural
prediction methods [228]. This two-step process is essential to ensure that our predicted
structures are (i) thermodynamically stable, i.e. that do not decompose to other more stable
species, and (ii) are indeed delafossites, i.e. that there are no other lower energy phases
for the given composition. The resulting stable delafossite phases are then characterized
theoretically using state-of-the-art ab initio methods. The final results provide precious
indications for further experimental synthesis and open the way for more specific theoretical
and experimental studies of dopability and transport properties, which can be restricted only
to the most interesting candidates.
5.2 Methods
As starting prototype unit cell we used the rhombohedral (space group 166) delafossite
structure, and not the hexagonal (space group 194) one. In fact, these two layered phases only
differ in the stacking of the layers, and we have verified [226] that they exhibit very similar
total energies (with differences of the order of few meV/atom) and electronic properties. In
that sense these two crystal structures are equivalent in our calculations. However, the former
contains 4 atoms in the primitive unit cell, while the latter contains 8, which would lead to a
considerable increase of the computational burden of our high-throughput search.
As the A and B atoms are in the inequivalent crystallographic positions 1a and 1b of
the delafossite structure, there are 15 624 possible ABX2 compositions that combine the 64
chemical elements considered here. It is true that this number could be quite reduced by
eliminating compositions on the basis of empirical rules based on oxidation states or the
radius of the A, B, and X elements. However, we decided not to follow this path in order to
allow for delafossites that do not conform to our intuition.
For each one of these structures we optimized the geometry and calculated the total energy.
This was done within ab initio density functional theory as implemented in the computer
code VASP [229, 230]. All parameters were set to guarantee compatibility with the data
56 Novel p-type transparent electrodes of ternary chalcogenides
available in the materials project database [190] and open quantum materials database [191].
We used the PAW [231] datasets of version 5.2 with a cutoff of 520 eV and Γ-centered
k-point grids, as dense as required to ensure an accuracy of 2 meV/atom in the total energy.
All forces were converged to better than 0.005 eV/Å. We followed the same protocol as
in Ref. [226]: spin-polarized calculation using the Perdew-Burke-Ernzerhof [25] (PBE)
exchange-correlation functional, with the exception of oxides and fluorides containing Co,
Cr, Fe, Mn, Mo, Ni, V, W, where an on-site Coulomb repulsive interaction U with a value of
3.32, 3.7, 5.3, 3.9, 4,38, 6.2, 3.25, and 6.2 eV, respectively, was added to correct the d-states.
We are of course aware that the PBE (+U) functional is not always able to determine the
correct electronic and spin ground-state. Moreover, it is well-known that the PBE, as well as
many other exchange correlation functionals, including hybrid functionals [232], yield an
average error for the energies of formation substantially larger than the so-called chemical
accuracy (around 1 kcal/mol � 43 meV) [233]. Nevertheless, the optimized crystal structure
and the ordering of low-energy phases, resulting from differences of formation energies, is
very often qualitatively and quantitatively good within PBE (+U), even in many cases in
which the electronic states are not correctly described.
The second step of our search is to identify which compositions are thermodynamically
stable (see Chapter 2 for more details). We worked always at zero temperature and pressure,
and we neglected the effects of the zero point motion of the phonons (that are expected to be
negligible for these materials). In this case, the thermodynamic quantity of interest is the
total energy. Fortunately, it is no longer necessary to calculate the total energy of all possible
reservoir compounds, as this information is already available in excellent public databases,
such as the materials project [190], open quantum materials database, [191] and the ab-initio
electronic structure library AFLOWLIB [192]. We chose to use the materials project database
for our reference energies, and to determine the distances to the convex hull of stability with
PYMATGEN [234]. The materials project database includes most of the experimentally known
inorganic crystals that are present in the ICSD database [235, 236] and an increasing number
of theoretically predicted phases, including those proposed in Ref. [226]. Note that, as we
only use the compounds included in the database to build the convex hull, new materials will
appear with negative distances to the hull.
The next step is to perform global structural prediction runs for the most stable structures
stemming from the high-throughput runs. There are several good algorithms available in the
market for this task. Our method of choice is the minima hopping method (see Chapter 2).
Having in mind the possible final application as TCM, for a first characterization of the
structures we determined hole effective masses and band gaps. For the calculation of effective
masses we used the same framework as for the calculation of the total energies, that relies on
5.3 Results and discussion 57
the PBE functional. Effective masses were calculated with the program BOLTZTRAP [237]
for a concentration of 1018 cm−3 and a temperature of 300 K. We remark that while it is
clearly desirable to have dispersive valence bands close to the band gap to ensure high hole
mobilities, this is not the only possibility as other transport mechanisms, e.g., based on small
polarons, have been proposed for delafossite p-type TCOs [211].
Although the PBE functional is a quite reasonable approximation for the curvature of
the bands, it is well known that this functional underestimates considerably the band gaps.
Therefore we decided to adopt the hybrid exchange-correlation functional of Heyd, Scuseria,
and Ernzerhof (HSE06) [46] to obtain reliable band gaps.
Finally, we give a first estimate of the p-type dopability by testing if acceptor-like defects
can be easily formed in the system and whether one can expect or not the generation of
compensating native defects (e.g., anion vacancies). To this purpose, a simple criterion with
significant predictive power is the determination of the branch point energy. The branch
point energy [225, 238, 239], or charge neutrality level, is defined as the energy at which
the defect states induced in the gap change their character from predominantly donor-like
to acceptor-like. The position of this energy with respect to the band edges is particularly
important as the formation of acceptor (donor) defect states in the gap becomes favorable
above (below) it. Hence, in a material with a branch point energy lying in the conduction
band (such as ZnO) or high in the band gap, donor impurity defects tend to be shallow, while
acceptor impurities, if they can exist, will be necessarily deep. The condition to favor p-type
doping is therefore to have the branch point energy at least in the middle of the gap. In
general, the lower the value of this energy the easier p-type doping can be expected. To
calculate this quantity we follow Schleife et al. [238] and we define it as a weighted average
of the mid-gap energies (calculated with a hybrid HSE06 functional) over the Brillouin
zone. The number of valence and conduction states included in the calculation follows the
prescription of Ref. [238], which has already been adopted in other works [225, 239]. This
method is a particularly convenient criterion to use in high-throughput calculations as it only
requires the energy levels of the perfect crystals. We note, however, that reliable conclusions
on the p-type dopability of the system can be obtained only by performing extensive defect
calculations.
Crystal structures were visualized with VESTA [240].
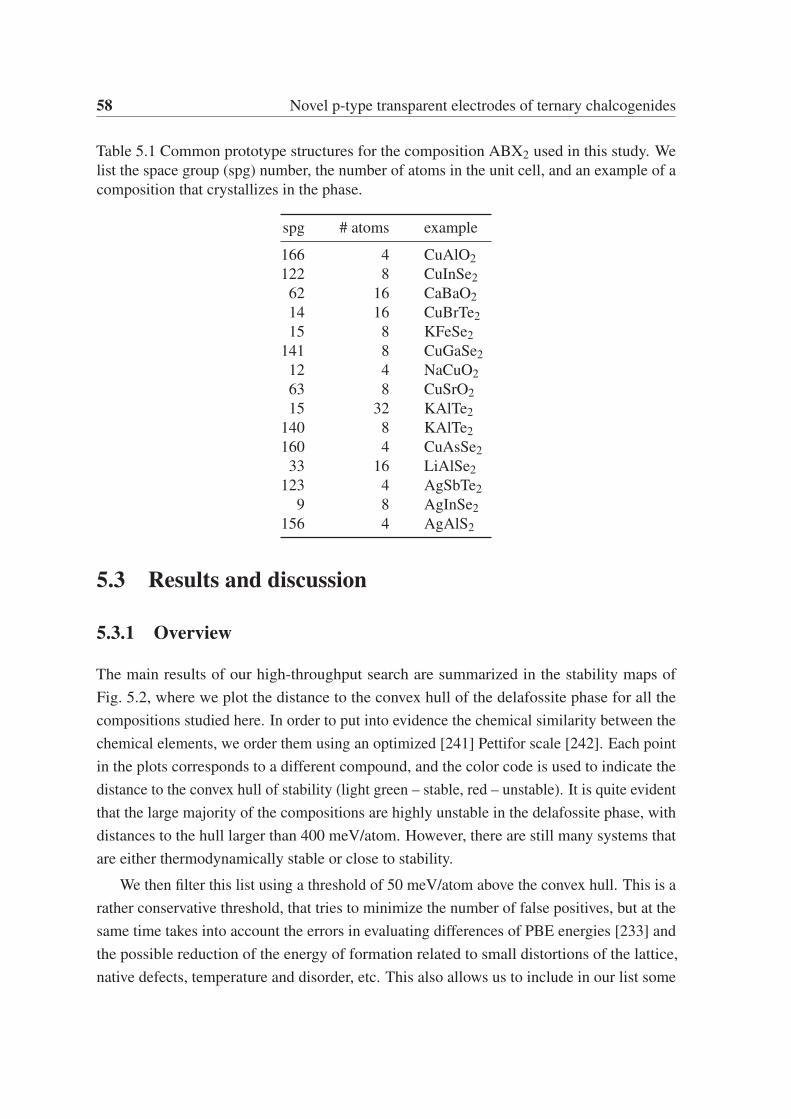
58 Novel p-type transparent electrodes of ternary chalcogenides
Table 5.1 Common prototype structures for the composition ABX2 used in this study. We
list the space group (spg) number, the number of atoms in the unit cell, and an example of a
composition that crystallizes in the phase.
spg # atoms example
166 4 CuAlO2
122 8 CuInSe2
62 16 CaBaO2
14 16 CuBrTe2
15 8 KFeSe2
141 8 CuGaSe2
12 4 NaCuO2
63 8 CuSrO2
15 32 KAlTe2
140 8 KAlTe2
160 4 CuAsSe2
33 16 LiAlSe2
123 4 AgSbTe2
9 8 AgInSe2
156 4 AgAlS2
5.3 Results and discussion
5.3.1 Overview
The main results of our high-throughput search are summarized in the stability maps of
Fig. 5.2, where we plot the distance to the convex hull of the delafossite phase for all the
compositions studied here. In order to put into evidence the chemical similarity between the
chemical elements, we order them using an optimized [241] Pettifor scale [242]. Each point
in the plots corresponds to a different compound, and the color code is used to indicate the
distance to the convex hull of stability (light green – stable, red – unstable). It is quite evident
that the large majority of the compositions are highly unstable in the delafossite phase, with
distances to the hull larger than 400 meV/atom. However, there are still many systems that
are either thermodynamically stable or close to stability.
We then filter this list using a threshold of 50 meV/atom above the convex hull. This is a
rather conservative threshold, that tries to minimize the number of false positives, but at the
same time takes into account the errors in evaluating differences of PBE energies [233] and
the possible reduction of the energy of formation related to small distortions of the lattice,
native defects, temperature and disorder, etc. This also allows us to include in our list some
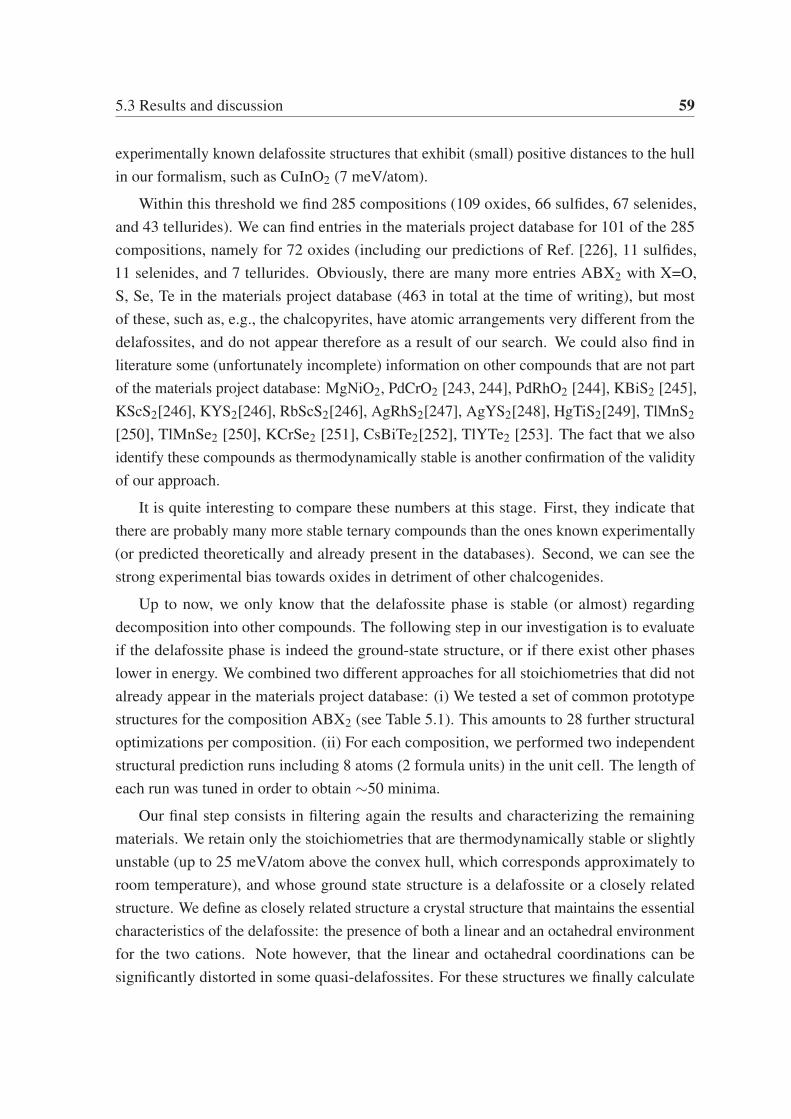
5.3 Results and discussion 59
experimentally known delafossite structures that exhibit (small) positive distances to the hull
in our formalism, such as CuInO2 (7 meV/atom).
Within this threshold we find 285 compositions (109 oxides, 66 sulfides, 67 selenides,
and 43 tellurides). We can find entries in the materials project database for 101 of the 285
compositions, namely for 72 oxides (including our predictions of Ref. [226], 11 sulfides,
11 selenides, and 7 tellurides. Obviously, there are many more entries ABX2 with X=O,
S, Se, Te in the materials project database (463 in total at the time of writing), but most
of these, such as, e.g., the chalcopyrites, have atomic arrangements very different from the
delafossites, and do not appear therefore as a result of our search. We could also find in
literature some (unfortunately incomplete) information on other compounds that are not part
of the materials project database: MgNiO2, PdCrO2 [243, 244], PdRhO2 [244], KBiS2 [245],
KScS2[246], KYS2[246], RbScS2[246], AgRhS2[247], AgYS2[248], HgTiS2[249], TlMnS2
[250], TlMnSe2 [250], KCrSe2 [251], CsBiTe2[252], TlYTe2 [253]. The fact that we also
identify these compounds as thermodynamically stable is another confirmation of the validity
of our approach.
It is quite interesting to compare these numbers at this stage. First, they indicate that
there are probably many more stable ternary compounds than the ones known experimentally
(or predicted theoretically and already present in the databases). Second, we can see the
strong experimental bias towards oxides in detriment of other chalcogenides.
Up to now, we only know that the delafossite phase is stable (or almost) regarding
decomposition into other compounds. The following step in our investigation is to evaluate
if the delafossite phase is indeed the ground-state structure, or if there exist other phases
lower in energy. We combined two different approaches for all stoichiometries that did not
already appear in the materials project database: (i) We tested a set of common prototype
structures for the composition ABX2 (see Table 5.1). This amounts to 28 further structural
optimizations per composition. (ii) For each composition, we performed two independent
structural prediction runs including 8 atoms (2 formula units) in the unit cell. The length of
each run was tuned in order to obtain ∼50 minima.
Our final step consists in filtering again the results and characterizing the remaining
materials. We retain only the stoichiometries that are thermodynamically stable or slightly
unstable (up to 25 meV/atom above the convex hull, which corresponds approximately to
room temperature), and whose ground state structure is a delafossite or a closely related
structure. We define as closely related structure a crystal structure that maintains the essential
characteristics of the delafossite: the presence of both a linear and an octahedral environment
for the two cations. Note however, that the linear and octahedral coordinations can be
significantly distorted in some quasi-delafossites. For these structures we finally calculate
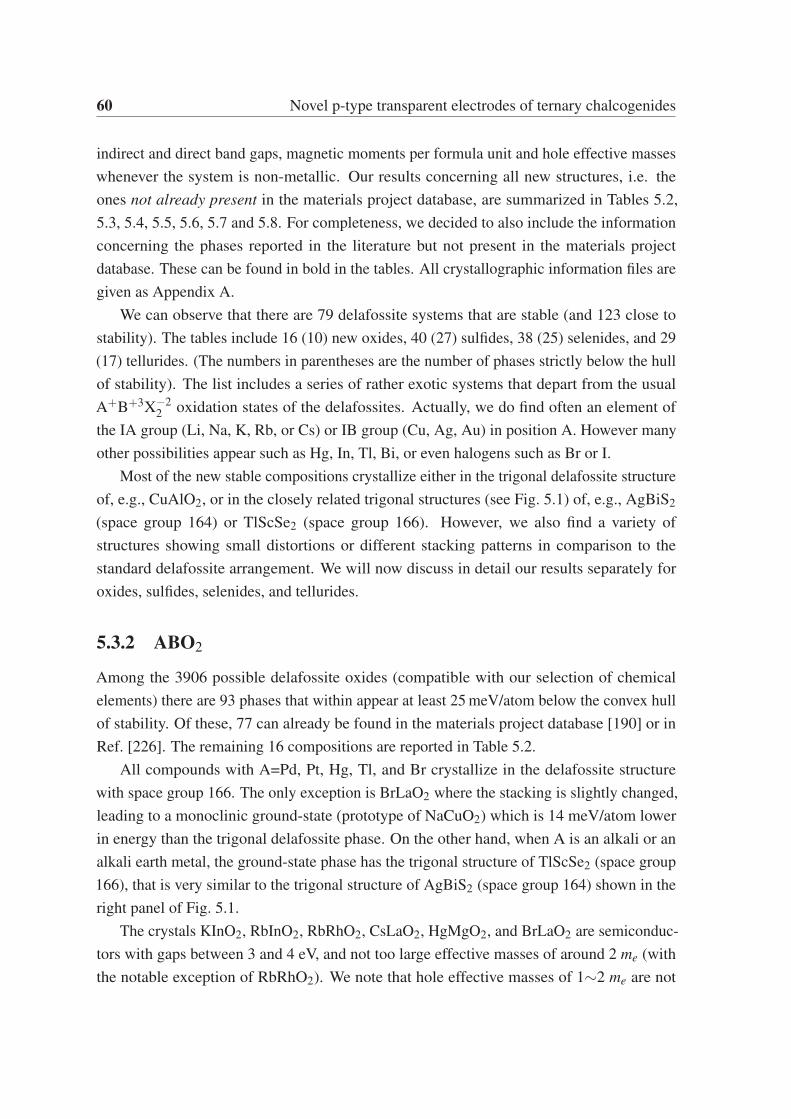
60 Novel p-type transparent electrodes of ternary chalcogenides
indirect and direct band gaps, magnetic moments per formula unit and hole effective masses
whenever the system is non-metallic. Our results concerning all new structures, i.e. the
ones not already present in the materials project database, are summarized in Tables 5.2,
5.3, 5.4, 5.5, 5.6, 5.7 and 5.8. For completeness, we decided to also include the information
concerning the phases reported in the literature but not present in the materials project
database. These can be found in bold in the tables. All crystallographic information files are
given as Appendix A.
We can observe that there are 79 delafossite systems that are stable (and 123 close to
stability). The tables include 16 (10) new oxides, 40 (27) sulfides, 38 (25) selenides, and 29
(17) tellurides. (The numbers in parentheses are the number of phases strictly below the hull
of stability). The list includes a series of rather exotic systems that depart from the usual
A+B+3X−22 oxidation states of the delafossites. Actually, we do find often an element of
the IA group (Li, Na, K, Rb, or Cs) or IB group (Cu, Ag, Au) in position A. However many
other possibilities appear such as Hg, In, Tl, Bi, or even halogens such as Br or I.
Most of the new stable compositions crystallize either in the trigonal delafossite structure
of, e.g., CuAlO2, or in the closely related trigonal structures (see Fig. 5.1) of, e.g., AgBiS2
(space group 164) or TlScSe2 (space group 166). However, we also find a variety of
structures showing small distortions or different stacking patterns in comparison to the
standard delafossite arrangement. We will now discuss in detail our results separately for
oxides, sulfides, selenides, and tellurides.
5.3.2 ABO2
Among the 3906 possible delafossite oxides (compatible with our selection of chemical
elements) there are 93 phases that within appear at least 25 meV/atom below the convex hull
of stability. Of these, 77 can already be found in the materials project database [190] or in
Ref. [226]. The remaining 16 compositions are reported in Table 5.2.
All compounds with A=Pd, Pt, Hg, Tl, and Br crystallize in the delafossite structure
with space group 166. The only exception is BrLaO2 where the stacking is slightly changed,
leading to a monoclinic ground-state (prototype of NaCuO2) which is 14 meV/atom lower
in energy than the trigonal delafossite phase. On the other hand, when A is an alkali or an
alkali earth metal, the ground-state phase has the trigonal structure of TlScSe2 (space group
166), that is very similar to the trigonal structure of AgBiS2 (space group 164) shown in the
right panel of Fig. 5.1.
The crystals KInO2, RbInO2, RbRhO2, CsLaO2, HgMgO2, and BrLaO2 are semiconduc-
tors with gaps between 3 and 4 eV, and not too large effective masses of around 2 me (with
the notable exception of RbRhO2). We note that hole effective masses of 1∼2 me are not
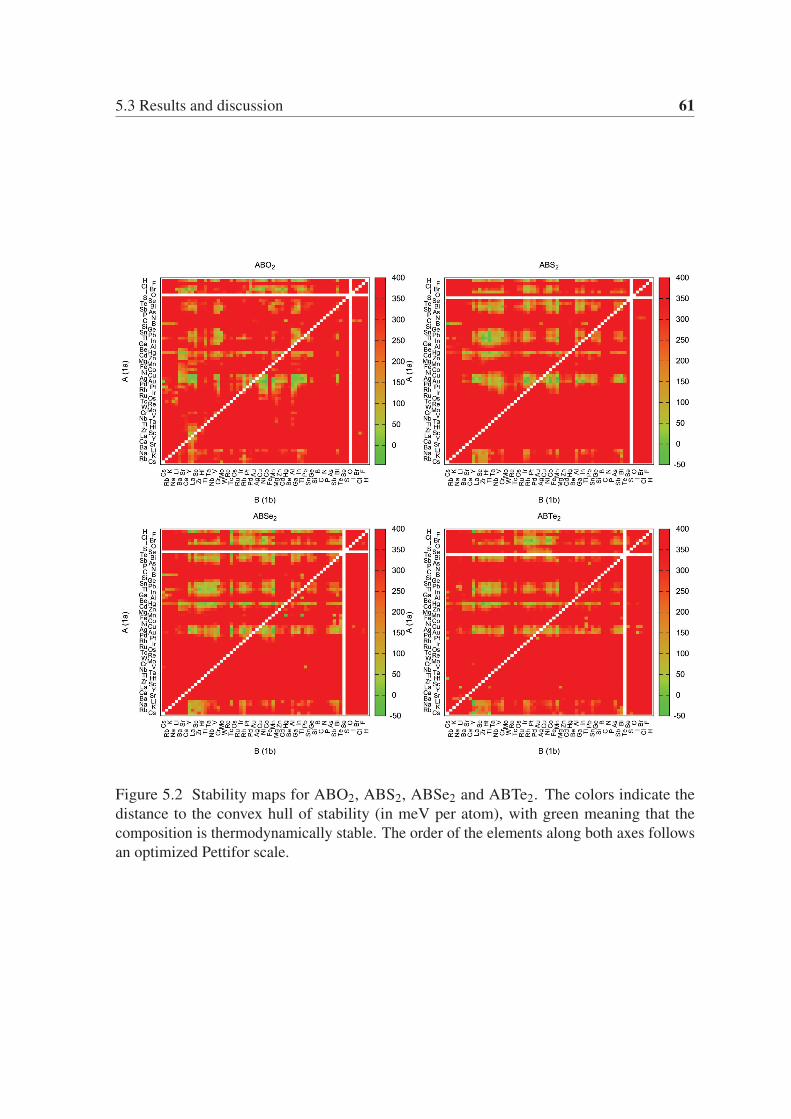
5.3 Results and discussion 61
Figure 5.2 Stability maps for ABO2, ABS2, ABSe2 and ABTe2. The colors indicate the
distance to the convex hull of stability (in meV per atom), with green meaning that the
composition is thermodynamically stable. The order of the elements along both axes follows
an optimized Pettifor scale.
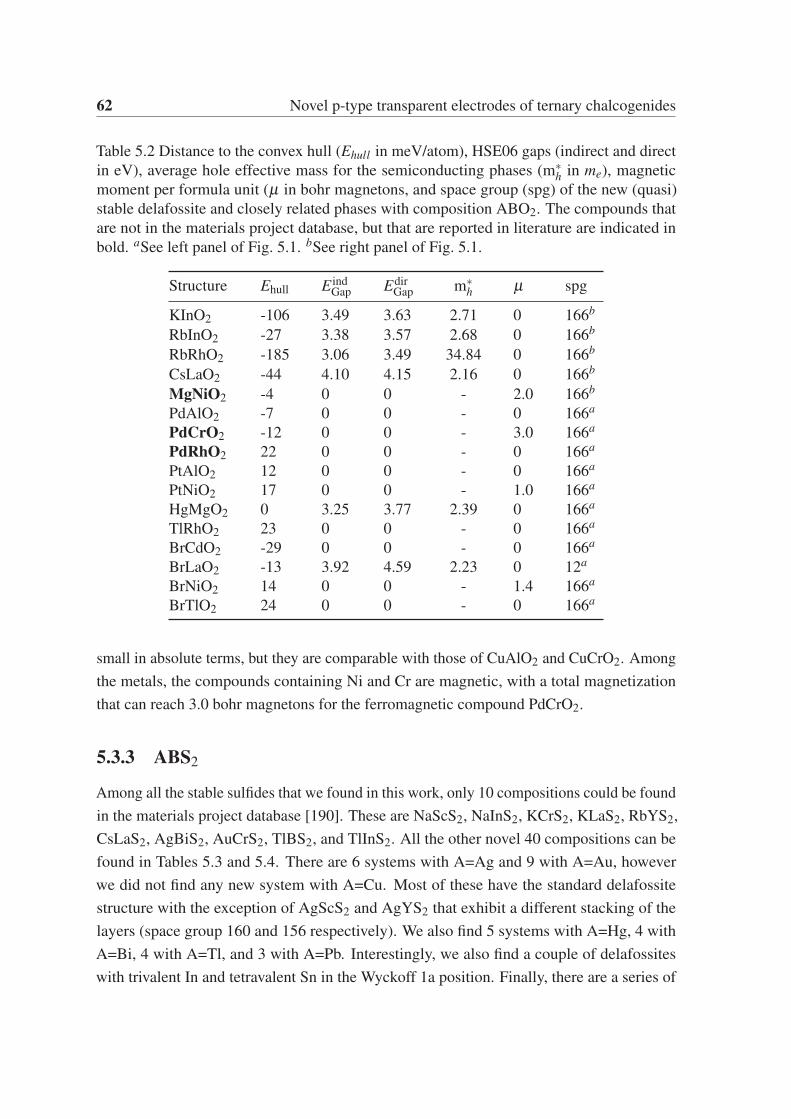
62 Novel p-type transparent electrodes of ternary chalcogenides
Table 5.2 Distance to the convex hull (Ehull in meV/atom), HSE06 gaps (indirect and direct
in eV), average hole effective mass for the semiconducting phases (m∗h in me), magnetic
moment per formula unit (μ in bohr magnetons, and space group (spg) of the new (quasi)
stable delafossite and closely related phases with composition ABO2. The compounds that
are not in the materials project database, but that are reported in literature are indicated in
bold. aSee left panel of Fig. 5.1. bSee right panel of Fig. 5.1.
Structure Ehull E indGap Edir
Gap m∗h μ spg
KInO2 -106 3.49 3.63 2.71 0 166b
RbInO2 -27 3.38 3.57 2.68 0 166b
RbRhO2 -185 3.06 3.49 34.84 0 166b
CsLaO2 -44 4.10 4.15 2.16 0 166b
MgNiO2 -4 0 0 - 2.0 166b
PdAlO2 -7 0 0 - 0 166a
PdCrO2 -12 0 0 - 3.0 166a
PdRhO2 22 0 0 - 0 166a
PtAlO2 12 0 0 - 0 166a
PtNiO2 17 0 0 - 1.0 166a
HgMgO2 0 3.25 3.77 2.39 0 166a
TlRhO2 23 0 0 - 0 166a
BrCdO2 -29 0 0 - 0 166a
BrLaO2 -13 3.92 4.59 2.23 0 12a
BrNiO2 14 0 0 - 1.4 166a
BrTlO2 24 0 0 - 0 166a
small in absolute terms, but they are comparable with those of CuAlO2 and CuCrO2. Among
the metals, the compounds containing Ni and Cr are magnetic, with a total magnetization
that can reach 3.0 bohr magnetons for the ferromagnetic compound PdCrO2.
5.3.3 ABS2
Among all the stable sulfides that we found in this work, only 10 compositions could be found
in the materials project database [190]. These are NaScS2, NaInS2, KCrS2, KLaS2, RbYS2,
CsLaS2, AgBiS2, AuCrS2, TlBS2, and TlInS2. All the other novel 40 compositions can be
found in Tables 5.3 and 5.4. There are 6 systems with A=Ag and 9 with A=Au, however
we did not find any new system with A=Cu. Most of these have the standard delafossite
structure with the exception of AgScS2 and AgYS2 that exhibit a different stacking of the
layers (space group 160 and 156 respectively). We also find 5 systems with A=Hg, 4 with
A=Bi, 4 with A=Tl, and 3 with A=Pb. Interestingly, we also find a couple of delafossites
with trivalent In and tetravalent Sn in the Wyckoff 1a position. Finally, there are a series of
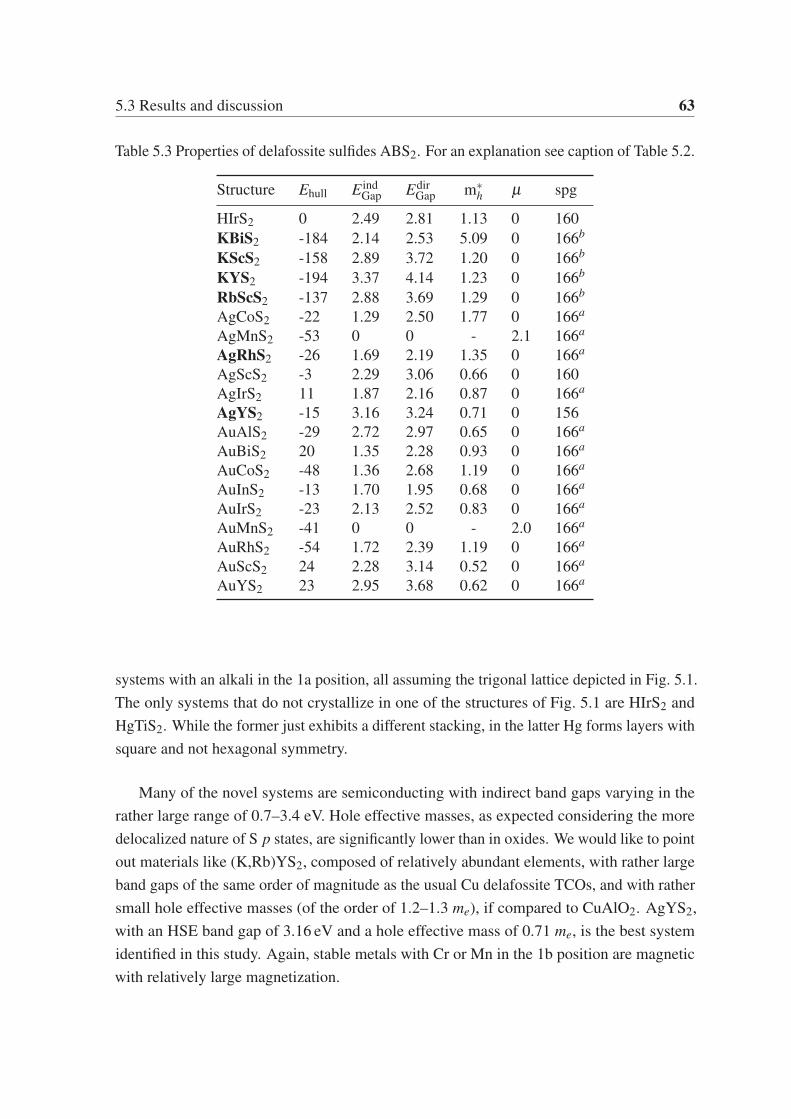
5.3 Results and discussion 63
Table 5.3 Properties of delafossite sulfides ABS2. For an explanation see caption of Table 5.2.
Structure Ehull E indGap Edir
Gap m∗h μ spg
HIrS2 0 2.49 2.81 1.13 0 160
KBiS2 -184 2.14 2.53 5.09 0 166b
KScS2 -158 2.89 3.72 1.20 0 166b
KYS2 -194 3.37 4.14 1.23 0 166b
RbScS2 -137 2.88 3.69 1.29 0 166b
AgCoS2 -22 1.29 2.50 1.77 0 166a
AgMnS2 -53 0 0 - 2.1 166a
AgRhS2 -26 1.69 2.19 1.35 0 166a
AgScS2 -3 2.29 3.06 0.66 0 160
AgIrS2 11 1.87 2.16 0.87 0 166a
AgYS2 -15 3.16 3.24 0.71 0 156
AuAlS2 -29 2.72 2.97 0.65 0 166a
AuBiS2 20 1.35 2.28 0.93 0 166a
AuCoS2 -48 1.36 2.68 1.19 0 166a
AuInS2 -13 1.70 1.95 0.68 0 166a
AuIrS2 -23 2.13 2.52 0.83 0 166a
AuMnS2 -41 0 0 - 2.0 166a
AuRhS2 -54 1.72 2.39 1.19 0 166a
AuScS2 24 2.28 3.14 0.52 0 166a
AuYS2 23 2.95 3.68 0.62 0 166a
systems with an alkali in the 1a position, all assuming the trigonal lattice depicted in Fig. 5.1.
The only systems that do not crystallize in one of the structures of Fig. 5.1 are HIrS2 and
HgTiS2. While the former just exhibits a different stacking, in the latter Hg forms layers with
square and not hexagonal symmetry.
Many of the novel systems are semiconducting with indirect band gaps varying in the
rather large range of 0.7–3.4 eV. Hole effective masses, as expected considering the more
delocalized nature of S p states, are significantly lower than in oxides. We would like to point
out materials like (K,Rb)YS2, composed of relatively abundant elements, with rather large
band gaps of the same order of magnitude as the usual Cu delafossite TCOs, and with rather
small hole effective masses (of the order of 1.2–1.3 me), if compared to CuAlO2. AgYS2,
with an HSE band gap of 3.16 eV and a hole effective mass of 0.71 me, is the best system
identified in this study. Again, stable metals with Cr or Mn in the 1b position are magnetic
with relatively large magnetization.
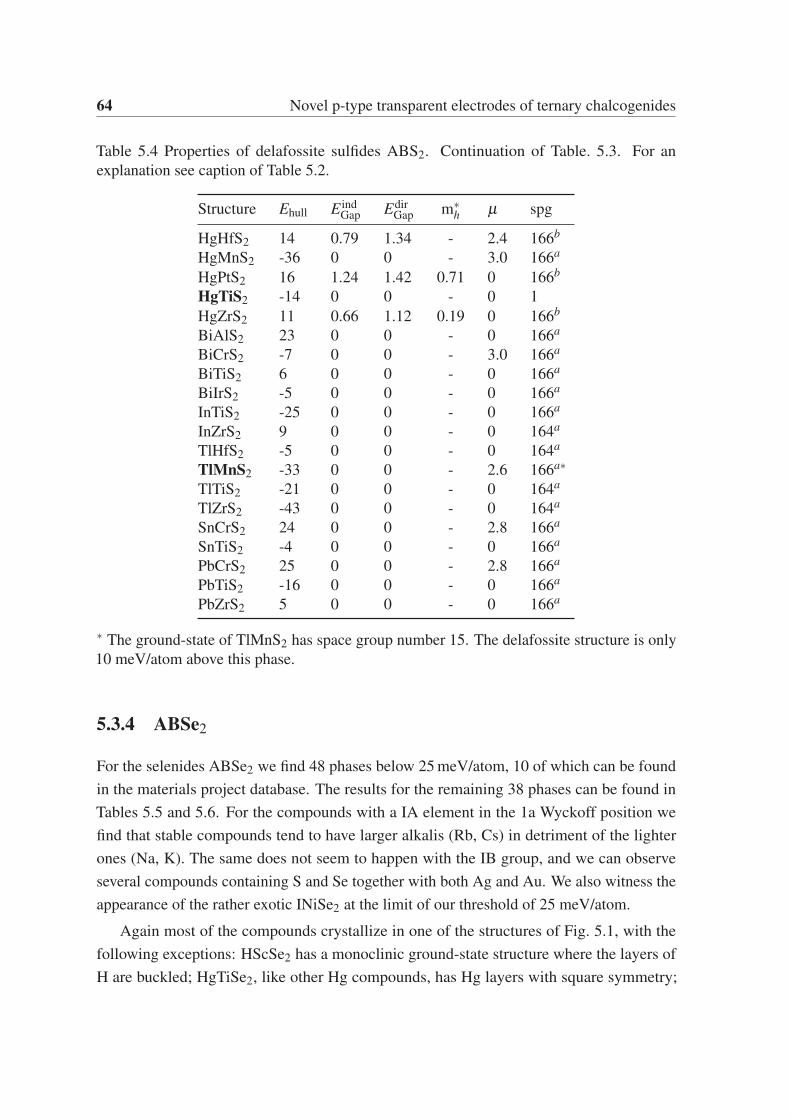
64 Novel p-type transparent electrodes of ternary chalcogenides
Table 5.4 Properties of delafossite sulfides ABS2. Continuation of Table. 5.3. For an
explanation see caption of Table 5.2.
Structure Ehull E indGap Edir
Gap m∗h μ spg
HgHfS2 14 0.79 1.34 - 2.4 166b
HgMnS2 -36 0 0 - 3.0 166a
HgPtS2 16 1.24 1.42 0.71 0 166b
HgTiS2 -14 0 0 - 0 1
HgZrS2 11 0.66 1.12 0.19 0 166b
BiAlS2 23 0 0 - 0 166a
BiCrS2 -7 0 0 - 3.0 166a
BiTiS2 6 0 0 - 0 166a
BiIrS2 -5 0 0 - 0 166a
InTiS2 -25 0 0 - 0 166a
InZrS2 9 0 0 - 0 164a
TlHfS2 -5 0 0 - 0 164a
TlMnS2 -33 0 0 - 2.6 166a∗TlTiS2 -21 0 0 - 0 164a
TlZrS2 -43 0 0 - 0 164a
SnCrS2 24 0 0 - 2.8 166a
SnTiS2 -4 0 0 - 0 166a
PbCrS2 25 0 0 - 2.8 166a
PbTiS2 -16 0 0 - 0 166a
PbZrS2 5 0 0 - 0 166a
∗ The ground-state of TlMnS2 has space group number 15. The delafossite structure is only
10 meV/atom above this phase.
5.3.4 ABSe2
For the selenides ABSe2 we find 48 phases below 25 meV/atom, 10 of which can be found
in the materials project database. The results for the remaining 38 phases can be found in
Tables 5.5 and 5.6. For the compounds with a IA element in the 1a Wyckoff position we
find that stable compounds tend to have larger alkalis (Rb, Cs) in detriment of the lighter
ones (Na, K). The same does not seem to happen with the IB group, and we can observe
several compounds containing S and Se together with both Ag and Au. We also witness the
appearance of the rather exotic INiSe2 at the limit of our threshold of 25 meV/atom.
Again most of the compounds crystallize in one of the structures of Fig. 5.1, with the
following exceptions: HScSe2 has a monoclinic ground-state structure where the layers of
H are buckled; HgTiSe2, like other Hg compounds, has Hg layers with square symmetry;
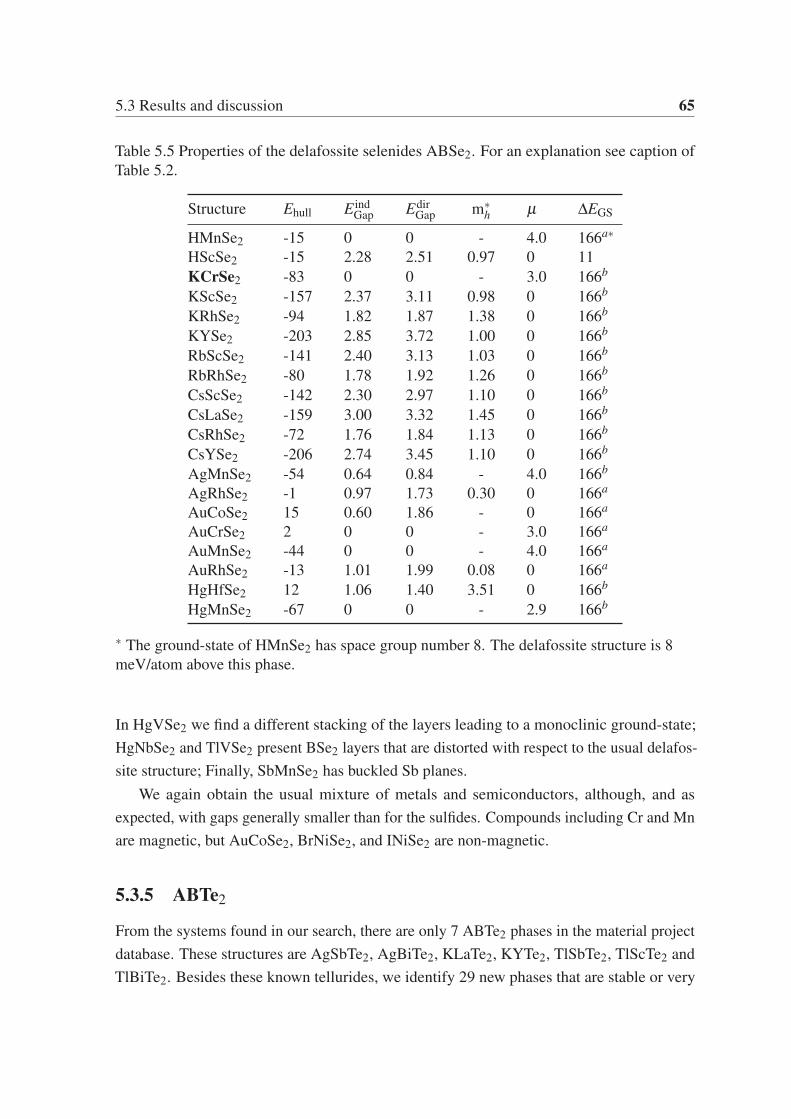
5.3 Results and discussion 65
Table 5.5 Properties of the delafossite selenides ABSe2. For an explanation see caption of
Table 5.2.
Structure Ehull E indGap Edir
Gap m∗h μ ΔEGS
HMnSe2 -15 0 0 - 4.0 166a∗HScSe2 -15 2.28 2.51 0.97 0 11
KCrSe2 -83 0 0 - 3.0 166b
KScSe2 -157 2.37 3.11 0.98 0 166b
KRhSe2 -94 1.82 1.87 1.38 0 166b
KYSe2 -203 2.85 3.72 1.00 0 166b
RbScSe2 -141 2.40 3.13 1.03 0 166b
RbRhSe2 -80 1.78 1.92 1.26 0 166b
CsScSe2 -142 2.30 2.97 1.10 0 166b
CsLaSe2 -159 3.00 3.32 1.45 0 166b
CsRhSe2 -72 1.76 1.84 1.13 0 166b
CsYSe2 -206 2.74 3.45 1.10 0 166b
AgMnSe2 -54 0.64 0.84 - 4.0 166b
AgRhSe2 -1 0.97 1.73 0.30 0 166a
AuCoSe2 15 0.60 1.86 - 0 166a
AuCrSe2 2 0 0 - 3.0 166a
AuMnSe2 -44 0 0 - 4.0 166a
AuRhSe2 -13 1.01 1.99 0.08 0 166a
HgHfSe2 12 1.06 1.40 3.51 0 166b
HgMnSe2 -67 0 0 - 2.9 166b
∗ The ground-state of HMnSe2 has space group number 8. The delafossite structure is 8
meV/atom above this phase.
In HgVSe2 we find a different stacking of the layers leading to a monoclinic ground-state;
HgNbSe2 and TlVSe2 present BSe2 layers that are distorted with respect to the usual delafos-
site structure; Finally, SbMnSe2 has buckled Sb planes.
We again obtain the usual mixture of metals and semiconductors, although, and as
expected, with gaps generally smaller than for the sulfides. Compounds including Cr and Mn
are magnetic, but AuCoSe2, BrNiSe2, and INiSe2 are non-magnetic.
5.3.5 ABTe2
From the systems found in our search, there are only 7 ABTe2 phases in the material project
database. These structures are AgSbTe2, AgBiTe2, KLaTe2, KYTe2, TlSbTe2, TlScTe2 and
TlBiTe2. Besides these known tellurides, we identify 29 new phases that are stable or very
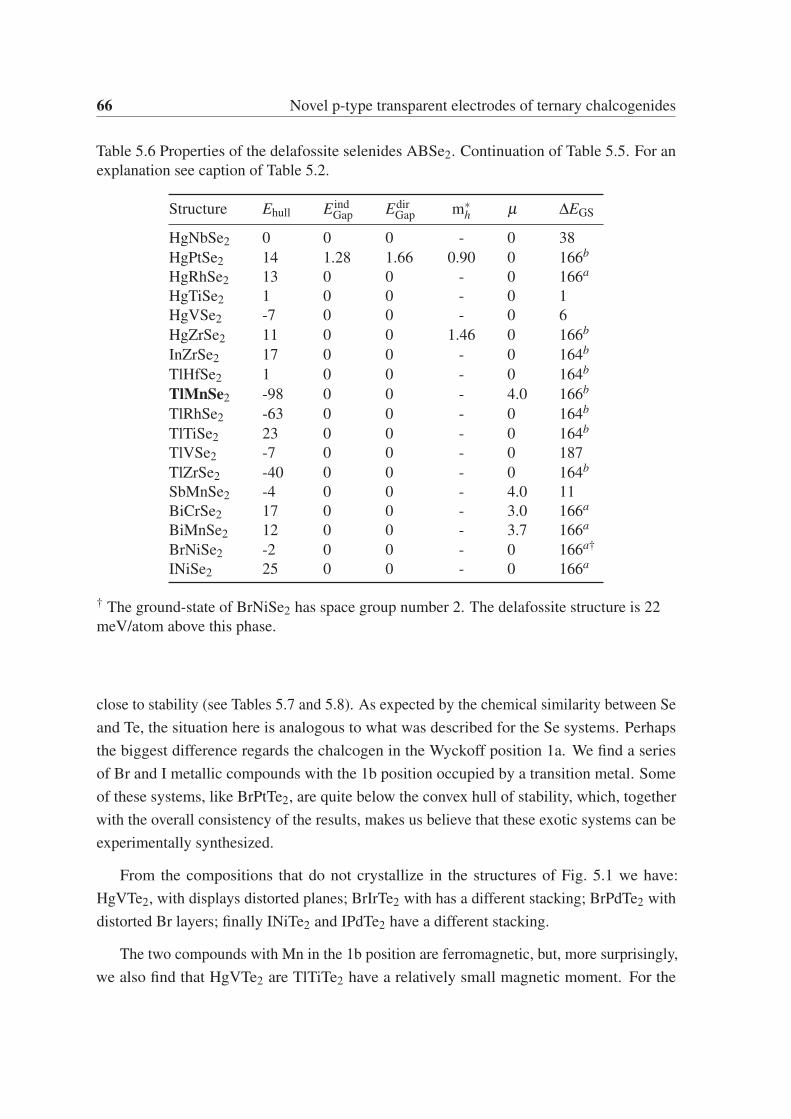
66 Novel p-type transparent electrodes of ternary chalcogenides
Table 5.6 Properties of the delafossite selenides ABSe2. Continuation of Table 5.5. For an
explanation see caption of Table 5.2.
Structure Ehull E indGap Edir
Gap m∗h μ ΔEGS
HgNbSe2 0 0 0 - 0 38
HgPtSe2 14 1.28 1.66 0.90 0 166b
HgRhSe2 13 0 0 - 0 166a
HgTiSe2 1 0 0 - 0 1
HgVSe2 -7 0 0 - 0 6
HgZrSe2 11 0 0 1.46 0 166b
InZrSe2 17 0 0 - 0 164b
TlHfSe2 1 0 0 - 0 164b
TlMnSe2 -98 0 0 - 4.0 166b
TlRhSe2 -63 0 0 - 0 164b
TlTiSe2 23 0 0 - 0 164b
TlVSe2 -7 0 0 - 0 187
TlZrSe2 -40 0 0 - 0 164b
SbMnSe2 -4 0 0 - 4.0 11
BiCrSe2 17 0 0 - 3.0 166a
BiMnSe2 12 0 0 - 3.7 166a
BrNiSe2 -2 0 0 - 0 166a†
INiSe2 25 0 0 - 0 166a
† The ground-state of BrNiSe2 has space group number 2. The delafossite structure is 22
meV/atom above this phase.
close to stability (see Tables 5.7 and 5.8). As expected by the chemical similarity between Se
and Te, the situation here is analogous to what was described for the Se systems. Perhaps
the biggest difference regards the chalcogen in the Wyckoff position 1a. We find a series
of Br and I metallic compounds with the 1b position occupied by a transition metal. Some
of these systems, like BrPtTe2, are quite below the convex hull of stability, which, together
with the overall consistency of the results, makes us believe that these exotic systems can be
experimentally synthesized.
From the compositions that do not crystallize in the structures of Fig. 5.1 we have:
HgVTe2, with displays distorted planes; BrIrTe2 with has a different stacking; BrPdTe2 with
distorted Br layers; finally INiTe2 and IPdTe2 have a different stacking.
The two compounds with Mn in the 1b position are ferromagnetic, but, more surprisingly,
we also find that HgVTe2 are TlTiTe2 have a relatively small magnetic moment. For the
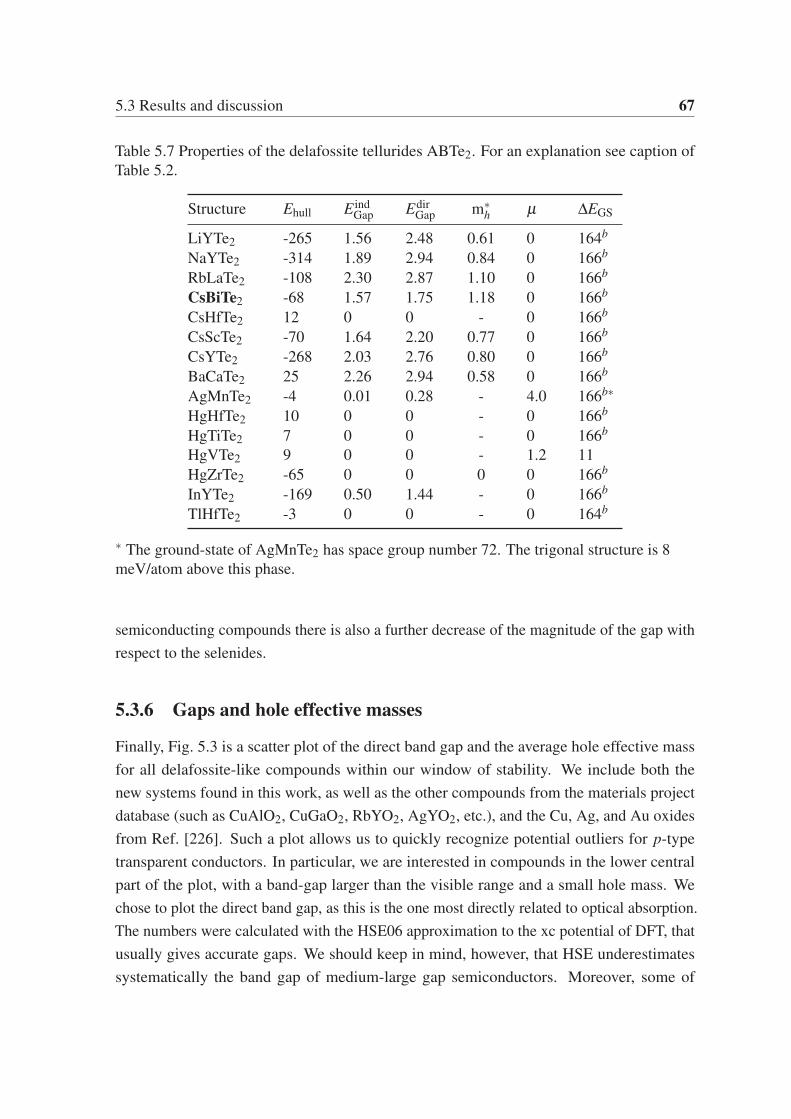
5.3 Results and discussion 67
Table 5.7 Properties of the delafossite tellurides ABTe2. For an explanation see caption of
Table 5.2.
Structure Ehull E indGap Edir
Gap m∗h μ ΔEGS
LiYTe2 -265 1.56 2.48 0.61 0 164b
NaYTe2 -314 1.89 2.94 0.84 0 166b
RbLaTe2 -108 2.30 2.87 1.10 0 166b
CsBiTe2 -68 1.57 1.75 1.18 0 166b
CsHfTe2 12 0 0 - 0 166b
CsScTe2 -70 1.64 2.20 0.77 0 166b
CsYTe2 -268 2.03 2.76 0.80 0 166b
BaCaTe2 25 2.26 2.94 0.58 0 166b
AgMnTe2 -4 0.01 0.28 - 4.0 166b∗HgHfTe2 10 0 0 - 0 166b
HgTiTe2 7 0 0 - 0 166b
HgVTe2 9 0 0 - 1.2 11
HgZrTe2 -65 0 0 0 0 166b
InYTe2 -169 0.50 1.44 - 0 166b
TlHfTe2 -3 0 0 - 0 164b
∗ The ground-state of AgMnTe2 has space group number 72. The trigonal structure is 8
meV/atom above this phase.
semiconducting compounds there is also a further decrease of the magnitude of the gap with
respect to the selenides.
5.3.6 Gaps and hole effective masses
Finally, Fig. 5.3 is a scatter plot of the direct band gap and the average hole effective mass
for all delafossite-like compounds within our window of stability. We include both the
new systems found in this work, as well as the other compounds from the materials project
database (such as CuAlO2, CuGaO2, RbYO2, AgYO2, etc.), and the Cu, Ag, and Au oxides
from Ref. [226]. Such a plot allows us to quickly recognize potential outliers for p-type
transparent conductors. In particular, we are interested in compounds in the lower central
part of the plot, with a band-gap larger than the visible range and a small hole mass. We
chose to plot the direct band gap, as this is the one most directly related to optical absorption.
The numbers were calculated with the HSE06 approximation to the xc potential of DFT, that
usually gives accurate gaps. We should keep in mind, however, that HSE underestimates
systematically the band gap of medium-large gap semiconductors. Moreover, some of
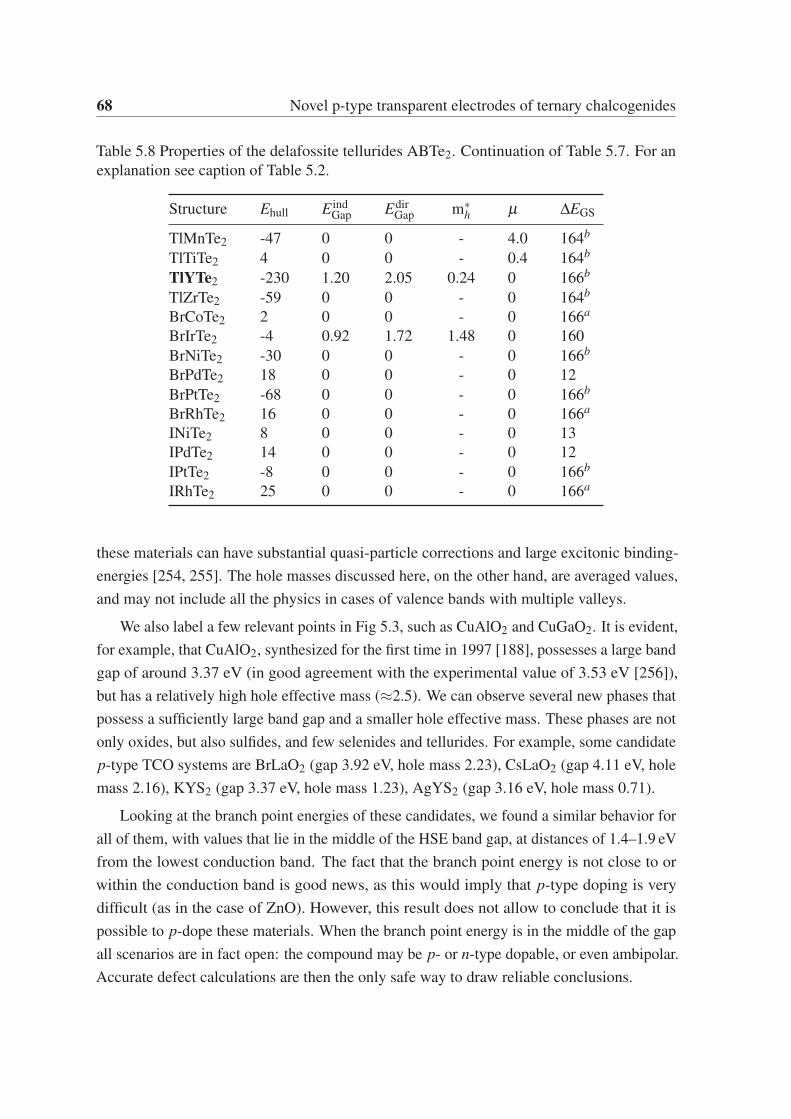
68 Novel p-type transparent electrodes of ternary chalcogenides
Table 5.8 Properties of the delafossite tellurides ABTe2. Continuation of Table 5.7. For an
explanation see caption of Table 5.2.
Structure Ehull E indGap Edir
Gap m∗h μ ΔEGS
TlMnTe2 -47 0 0 - 4.0 164b
TlTiTe2 4 0 0 - 0.4 164b
TlYTe2 -230 1.20 2.05 0.24 0 166b
TlZrTe2 -59 0 0 - 0 164b
BrCoTe2 2 0 0 - 0 166a
BrIrTe2 -4 0.92 1.72 1.48 0 160
BrNiTe2 -30 0 0 - 0 166b
BrPdTe2 18 0 0 - 0 12
BrPtTe2 -68 0 0 - 0 166b
BrRhTe2 16 0 0 - 0 166a
INiTe2 8 0 0 - 0 13
IPdTe2 14 0 0 - 0 12
IPtTe2 -8 0 0 - 0 166b
IRhTe2 25 0 0 - 0 166a
these materials can have substantial quasi-particle corrections and large excitonic binding-
energies [254, 255]. The hole masses discussed here, on the other hand, are averaged values,
and may not include all the physics in cases of valence bands with multiple valleys.
We also label a few relevant points in Fig 5.3, such as CuAlO2 and CuGaO2. It is evident,
for example, that CuAlO2, synthesized for the first time in 1997 [188], possesses a large band
gap of around 3.37 eV (in good agreement with the experimental value of 3.53 eV [256]),
but has a relatively high hole effective mass (≈2.5). We can observe several new phases that
possess a sufficiently large band gap and a smaller hole effective mass. These phases are not
only oxides, but also sulfides, and few selenides and tellurides. For example, some candidate
p-type TCO systems are BrLaO2 (gap 3.92 eV, hole mass 2.23), CsLaO2 (gap 4.11 eV, hole
mass 2.16), KYS2 (gap 3.37 eV, hole mass 1.23), AgYS2 (gap 3.16 eV, hole mass 0.71).
Looking at the branch point energies of these candidates, we found a similar behavior for
all of them, with values that lie in the middle of the HSE band gap, at distances of 1.4–1.9 eV
from the lowest conduction band. The fact that the branch point energy is not close to or
within the conduction band is good news, as this would imply that p-type doping is very
difficult (as in the case of ZnO). However, this result does not allow to conclude that it is
possible to p-dope these materials. When the branch point energy is in the middle of the gap
all scenarios are in fact open: the compound may be p- or n-type dopable, or even ambipolar.
Accurate defect calculations are then the only safe way to draw reliable conclusions.
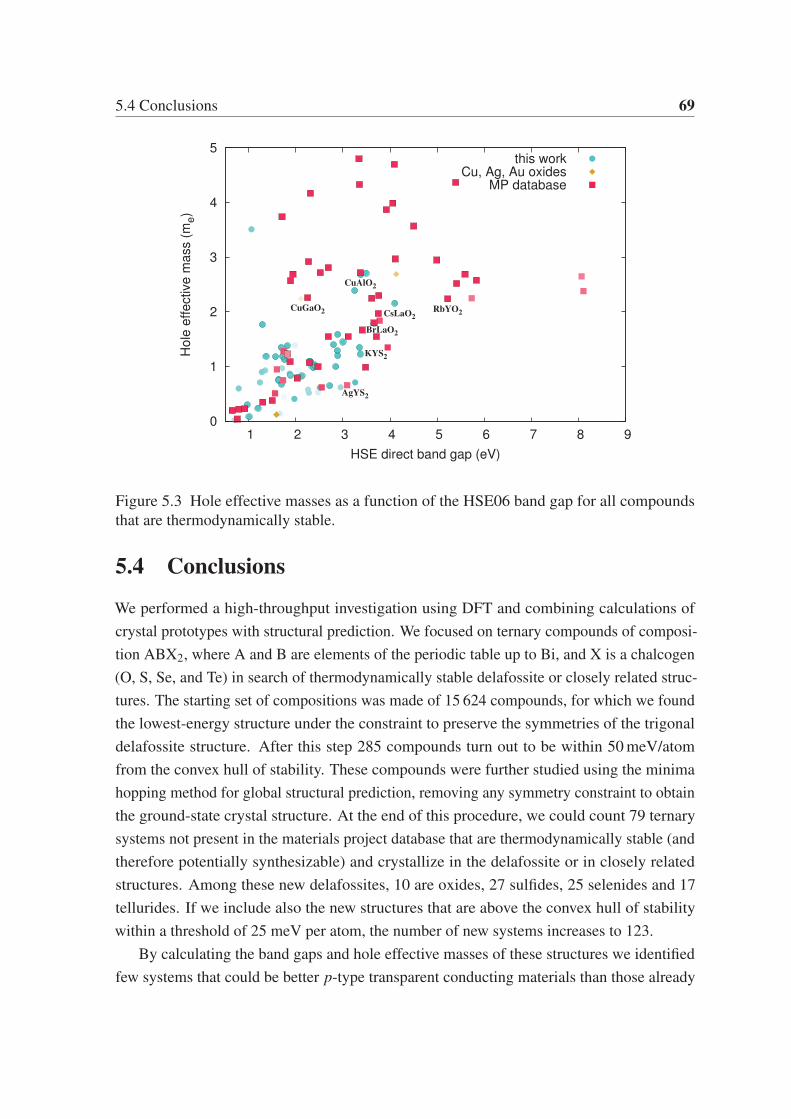
5.4 Conclusions 69
0
1
2
3
4
5
1 2 3 4 5 6 7 8 9
Hol
e ef
fect
ive
mas
s (m
e)
HSE direct band gap (eV)
this workCu, Ag, Au oxides
MP database
CuAlO2
RbYO2CuGaO2
BrLaO2
CsLaO2
KYS2
AgYS2
Figure 5.3 Hole effective masses as a function of the HSE06 band gap for all compounds
that are thermodynamically stable.
5.4 Conclusions
We performed a high-throughput investigation using DFT and combining calculations of
crystal prototypes with structural prediction. We focused on ternary compounds of composi-
tion ABX2, where A and B are elements of the periodic table up to Bi, and X is a chalcogen
(O, S, Se, and Te) in search of thermodynamically stable delafossite or closely related struc-
tures. The starting set of compositions was made of 15 624 compounds, for which we found
the lowest-energy structure under the constraint to preserve the symmetries of the trigonal
delafossite structure. After this step 285 compounds turn out to be within 50 meV/atom
from the convex hull of stability. These compounds were further studied using the minima
hopping method for global structural prediction, removing any symmetry constraint to obtain
the ground-state crystal structure. At the end of this procedure, we could count 79 ternary
systems not present in the materials project database that are thermodynamically stable (and
therefore potentially synthesizable) and crystallize in the delafossite or in closely related
structures. Among these new delafossites, 10 are oxides, 27 sulfides, 25 selenides and 17
tellurides. If we include also the new structures that are above the convex hull of stability
within a threshold of 25 meV per atom, the number of new systems increases to 123.
By calculating the band gaps and hole effective masses of these structures we identified
few systems that could be better p-type transparent conducting materials than those already
70 Novel p-type transparent electrodes of ternary chalcogenides
known. In particular, AgYS2, with an HSE band gap of 3.16 eV and a hole effective mass of
0.71 me, is probably the best system that emerged from this study. KYS2 and RbYS2 have
even larger band gaps (more than 4 eV) and effective masses of only about 1 me. We also
found several systems, mainly containing Cr and Mn, that have relatively large magnetization
densities.
These results provide us with a much more complete picture of the delafossite structure
and can be used as a guide for further experimental and theoretical exploration of this
fascinating family of compounds. The crystal structures of these new compounds are now
available for more accurate theoretical characterization, hoping that some other interesting
properties that have not been screened in this first study can come on the scene and motivate
experimentalists to try to synthesize some of these compounds.
Chapter 6
Summary and conclusions
In this thesis, we used a combination of high-throughput and ab initio global structure
prediction methods to study a wide range of different systems under different conditions. In
the following, a summary of the most notable results is presented.
New phases of Ba-Si system under high pressure Using a global structural prediction
method we studied systematically the phase diagram and the electronic properties of Ba–Si
compounds. We identified five novel stoichiometric BaSix phases with unexpected structures
that might be experimentally synthesizable over a wide range of pressure. These include BaSi,
BaSi2, BaSi3, BaSi5, and BaSi6. For the BaSi system, we found a new metallic Imma phase
that is stable under pressure from 6 GPa to 65 GPa. For BaSi2, there is a new metallic phase
Fd3m that is stable from 21 GPa to 100 GPa. This phase, in which each Si forms six bonds
with other neighboring Si atoms, becomes superconducting below 1.2 K at 50 GPa. Finally,
at around 20 GPa two unexpected compositions become stable, namely BaSi3 (I4/mmm)
and BaSi5 (Cmmm), both displaying metallic behavior. These results show the remarkable
variety of Ba–Si compounds, and can serve as an important guide for further experimental
studies of this binary system.
Phases diagram of N–H–O system under high pressure We explored the structures of
ternary N–H–O system at 150 GPa using structural prediction (CALYPSO) combined with
first-principle calculations. Two novel phases of NOH4 and HNO3 were predicted to exist
at 150 GPa while NH3H2O will decompose into NH3 and H2O when the pressure is above
122 GPa. The novel phase of NOH4 possesses C2/m symmetry while the new phase of
HNO3 has a P21/m symmetry. The C2/m of NOH4 becomes stable at 71 GPa, while the
P21/m phase of HNO3 will be more energetically favorable than the phase II (P21/c) [186]
from 39 GPa to 150 GPa, the maximum pressure that we have studied. For the C2/m phase
72 Summary and conclusions
of NOH4, there is a layer formed by a NH3-NH3 “dumbbell cluster” which is between two
layers formed by O-H chains. On the other hand, for the P21/m phase of HNO3, the layer
is like a “quasi clover” with a H atom tail formed by three O atom, one N atom and one H
atom. Surprisingly we find N-H-O covalent bonds in the P21/m phase of HNO3, revealing
that pressure plays a major role for forming N-H-O covalent bonds in the N–H–O system.
Electronic property calculations revealed that both the C2/m phase of NOH4 and the P21/mphase of HNO3 are insulators with a band gap of 6.0 eV and 2.6 eV, respectively.
Novel p-type transparent electrodes of ternary chalcogenides We performed a high-
throughput investigation using density functional theory of possible thermodynamically
stable phases of delafossite oxides, sulfides, selenides, and tellurides. The stable compositions
were then studied using global structural prediction methods that allowed us to obtain their
ground-state crystal structures. We found a total of 79 new delafossite (or related) phases
that are stable, and therefore potentially possible to synthesize. By calculating the band gaps
and hole effective masses of these structures we identified few systems that could be better
p-type transparent conducting materials than those already known. In particular, AgYS2,
with an HSE band gap of 3.16 eV and a hole effective mass of 0.71 me, is probably the best
system identified in this study. KYS2 and RbYS2 have even larger band gaps (more than
4 eV) and effective masses of about 1 me. We also found several systems, mainly containing
Cr and Mn, that have relatively large magnetization densities. These results provide us with a
much more complete picture of the interesting delafossite family and can be used as a guide
for further experimental and theoretical exploration of this fascinating family of compounds.
In conclusion, the ab-initio prediction of new compounds is by now a mature subject. We
showed that combining the power of DFT with high-throughput techniques and standard
prediction methods is an efficient way to discover new materials with improved properties.
This path is orders of magnitude faster than experimental synthesis and may allow us to have
a rather complete view on more synthesizable compounds in a foreseeable future.

Acknowledgements
First, I tender my deepest thanks to my dedicated supervisors, Prof. Alfonso San Miguel,
Prof. Miguel Marques and Prof. Silvana Botti for giving me the opportunity to work on this
project, for your guidance and encouragement throughout my thesis work, for the discussions
and corrections of my manuscript, and for your care of my living in Lyon and Jena as well.
I also want to thank Dr. Stéphane Pailhès, Dr. Georges Boulon and Dr. Tristan Albaret,
for the fruitful discussions. I would like to thank the rest of my thesis committee, for their
encouragement, insightful comments, and hard questions.
I thank my fellow labmates in our group: Dr. Tiago Cerqueira, Dr. Sabine Korbel, Dr.
Abraao Torres Dias, Pedro Borlido, Sun Lin, Dr. Claudia Rödl, Ivan Guilhon Mitoso Rocha,
Valerio Armuzza, Christoph Otzen, Thomas Bischoff, Dr. Rafael A. Sarmiento Pérez , Silvio
Domingos Silva Santos, Dr. Aude Stolz, Amani Tlili, and Helainne Thomeny Girao for the
stimulating discussions and for all the fun we have had in the last three years.
To my friends, Zonglong Yang, Ye Tian, Xingjie Ma, Tianwen Huang, Kefeng Zhang,
Zeya Jia, Ruihan Guo, Quanyi Yin, Biwen Zhu, Tingting Niu, Dan Yi, Mingchao Ji, Yang
Wang, Yunpeng Luo, Jianbei Huang and other friends whose names are not listed here, thank
you all for your company and help during my stay in Lyon and Jena.
I gratefully acknowledge Prof. Yanming Ma for your advice and help for applying the
scholarship from China Scholarship Council (CSC). I also express my acknowledgement to
CSC for funding this thesis.
I owe a great thanks to my girlfriend Wenwen Cui, thank you so much for your under-
standing and all your support on my work. Last but not the least, I would like to thank my
family, for supporting me spiritually throughout my life.

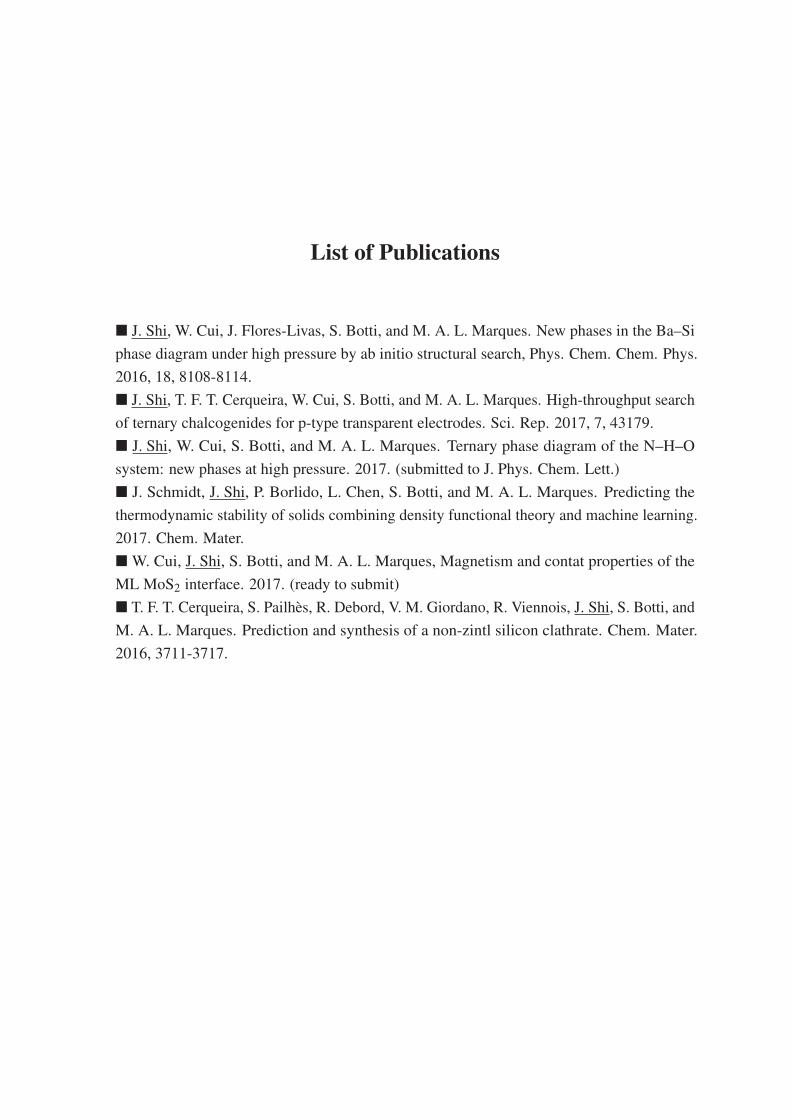
List of Publications
� J. Shi, W. Cui, J. Flores-Livas, S. Botti, and M. A. L. Marques. New phases in the Ba–Si
phase diagram under high pressure by ab initio structural search, Phys. Chem. Chem. Phys.
2016, 18, 8108-8114.
� J. Shi, T. F. T. Cerqueira, W. Cui, S. Botti, and M. A. L. Marques. High-throughput search
of ternary chalcogenides for p-type transparent electrodes. Sci. Rep. 2017, 7, 43179.
� J. Shi, W. Cui, S. Botti, and M. A. L. Marques. Ternary phase diagram of the N–H–O
system: new phases at high pressure. 2017. (submitted to J. Phys. Chem. Lett.)
� J. Schmidt, J. Shi, P. Borlido, L. Chen, S. Botti, and M. A. L. Marques. Predicting the
thermodynamic stability of solids combining density functional theory and machine learning.
2017. Chem. Mater.
� W. Cui, J. Shi, S. Botti, and M. A. L. Marques, Magnetism and contat properties of the
ML MoS2 interface. 2017. (ready to submit)
� T. F. T. Cerqueira, S. Pailhès, R. Debord, V. M. Giordano, R. Viennois, J. Shi, S. Botti, and
M. A. L. Marques. Prediction and synthesis of a non-zintl silicon clathrate. Chem. Mater.
2016, 3711-3717.


Bibliography
[1] Sarmiento-Pérez, R.; Cerqueira, T. F.; Valencia-Jaime, I.; Amsler, M.; Goedecker, S.;Romero, A. H.; Botti, S.; Marques, M. A. Novel phases of lithium-aluminum binariesfrom first-principles structural search. J. Chem. Phys. 2015, 142, 024710.
[2] Sarmiento-Pérez, R.; Cerqueira, T. F. T.; Valencia-Jaime, I.; Amsler, M.; Goedecker, S.;Botti, S.; Marques, M. A. L.; Romero, A. H. Sodium–gold binaries: novel structuresfor ionic compounds from an ab initio structural search. New J. Phys. 2013, 15,115007.
[3] Bernstein, N.; Hellberg, C. S.; Johannes, M.; Mazin, I.; Mehl, M. What superconductsin sulfur hydrides under pressure and why. Phys. Rev. B 2015, 91, 060511.
[4] Flores-Livas, J. A.; Debord, R.; Botti, S.; San Miguel, A.; Marques, M. A.; Pailhès, S.Enhancing the Superconducting Transition Temperature of BaSi2 by Structural Tuning.Phys. Rev. Lett. 2011, 106, 087002.
[5] Yu, L.; Zunger, A. Identification of potential photovoltaic absorbers based on first-principles spectroscopic screening of materials. Phys. Rev. Lett. 2012, 108, 068701.
[6] Lin, L.-C.; Berger, A. H.; Martin, R. L.; Kim, J.; Swisher, J. A.; Jariwala, K.;Rycroft, C. H.; Bhown, A. S.; Deem, M. W.; Haranczyk, M. In silico screeningof carbon-capture materials. Nature. Mater. 2012, 11, 633–641.
[7] Krishna, R.; van Baten, J. M. In silico screening of metal–organic frameworks inseparation applications. Phys. Chem. Chem. Phys. 2011, 13, 10593–10616.
[8] Yang, K.; Setyawan, W.; Wang, S.; Nardelli, M. B.; Curtarolo, S. A search modelfor topological insulators with high-throughput robustness descriptors. Nature Mater.2012, 11, 614–619.
[9] Yang, J.; Li, H.; Wu, T.; Zhang, W.; Chen, L.; Yang, J. Evaluation of Half-HeuslerCompounds as Thermoelectric Materials Based on the Calculated Electrical TransportProperties. Adv. Func. Mater. 2008, 18, 2880–2888.
[10] Bowler, D.; Miyazaki, T. Calculations for millions of atoms with density functionaltheory: linear scaling shows its potential. J. Phys.: Condens. Matter 2010, 22, 074207.
[11] Born, M.; Oppenheimer, R. Zur quantentheorie der molekeln. Ann. Phys. 1927, 389,457–484.
[12] Dreizler, R. M.; Gross, E. K. Density Functional Theory; 1990.
78 Bibliography
[13] Hohenberg, P.; Kohn, W. Inhomogeneous electron gas. Phys. Rev. 1964, 136, B864.
[14] Kohn, W.; Sham, L. Density Function Theory. Phys. Rev. 1965, 140, A1133–A1138.
[15] Kohn, W.; Sham, L. J. Self-consistent equations including exchange and correlationeffects. Phys. Rev. 1965, 140, A1133.
[16] Dirac, P. A. Note on exchange phenomena in the Thomas atom. Mathematical Pro-ceedings of the Cambridge Philosophical Society. 1930; pp 376–385.
[17] Slater, J. C. A simplification of the Hartree-Fock method. Phys. Rev. 1951, 81, 385.
[18] Ceperley, D. M.; Alder, B. Ground state of the electron gas by a stochastic method.Phys. Rev. Lett. 1980, 45, 566.
[19] Vosko, S. H.; Wilk, L.; Nusair, M. Accurate spin-dependent electron liquid correlationenergies for local spin density calculations: a critical analysis. Can. J. Phys. 1980, 58,1200–1211.
[20] Perdew, J. P.; Wang, Y. Accurate and simple analytic representation of the electron-gascorrelation energy. Phys. Rev. B 1992, 45, 13244.
[21] Becke, A. D. Density-functional exchange-energy approximation with correct asymp-totic behavior. Phys. Rev. A 1988, 38, 3098.
[22] Lee, C.; Yang, W.; Parr, R. G. Development of the Colle-Salvetti correlation-energyformula into a functional of the electron density. Phys. Rev. B 1988, 37, 785.
[23] Colle, R.; Salvetti, O. Approximate calculation of the correlation energy for the closedshells. Theor. Chim. Acta 1975, 37, 329–334.
[24] Miehlich, B.; Savin, A.; Stoll, H.; Preuss, H. Results obtained with the correlationenergy density functionals of Becke and Lee, Yang and Parr. Chem. Phys. Lett. 1989,157, 200–206.
[25] Perdew, J. P.; Burke, K.; Ernzerhof, M. Generalized gradient approximation madesimple. Phys. Rev. Lett. 1996, 77, 3865.
[26] Becke, A. Hartree–Fock exchange energy of an inhomogeneous electron gas. Int. J.Quantum Chem. 1983, 23, 1915–1922.
[27] Tao, J.; Perdew, J. P.; Staroverov, V. N.; Scuseria, G. E. Climbing the density func-tional ladder: Nonempirical meta–generalized gradient approximation designed formolecules and solids. Phys. Rev. Lett. 2003, 91, 146401.
[28] Becke, A. D. A new mixing of Hartree–Fock and local density-functional theories. J.Chem. Phys. 1993, 98, 1372–1377.
[29] Becke, A. D. Density-functional thermochemistry. III. The role of exact exchange. J.Chem. Phys. 1993, 98, 5648–5652.
[30] Seidl, A.; Görling, A.; Vogl, P.; Majewski, J. A.; Levy, M. Generalized Kohn-Shamschemes and the band-gap problem. Phys. Rev. B 1996, 53, 3764.
Bibliography 79
[31] Stephens, P.; Devlin, F.; Chabalowski, C.; Frisch, M. J. Ab initio calculation ofvibrational absorption and circular dichroism spectra using density functional forcefields. J. Phys. Chem. 1994, 98, 11623–11627.
[32] Becke, A. D. Density-functional thermochemistry. IV. A new dynamical correlationfunctional and implications for exact-exchange mixing. J. Chem. Phys. 1996, 104,1040–1046.
[33] Perdew, J. P.; Ernzerhof, M.; Burke, K. Rationale for mixing exact exchange withdensity functional approximations. J. Chem. Phys. 1996, 105, 9982–9985.
[34] Adamo, C.; Barone, V. Toward reliable density functional methods without adjustableparameters: The PBE0 model. J. Chem. Phys. 1999, 110, 6158–6170.
[35] Ernzerhof, M.; Scuseria, G. E. Assessment of the Perdew–Burke–Ernzerhof exchange-correlation functional. J. Chem. Phys. 1999, 110, 5029–5036.
[36] Becke, A. D. Density-functional thermochemistry. V. Systematic optimization ofexchange-correlation functionals. J. Chem. Phys. 1997, 107, 8554–8560.
[37] Zhao, Y.; Truhlar, D. G. The M06 suite of density functionals for main group ther-mochemistry, thermochemical kinetics, noncovalent interactions, excited states, andtransition elements: two new functionals and systematic testing of four M06-classfunctionals and 12 other functionals. Theor. Chem. Acc. 2008, 120, 215–241.
[38] Grimme, S. Semiempirical hybrid density functional with perturbative second-ordercorrelation. J. Chem. Phys. 2006, 124, 034108.
[39] Sharkas, K.; Toulouse, J.; Savin, A. Double-hybrid density-functional theory maderigorous. J. Chem. Phys. 2011, 134, 064113.
[40] Seminario, J. M. Recent developments and applications of modern density functionaltheory; Elsevier, 1996; Vol. 4.
[41] Iikura, H.; Tsuneda, T.; Yanai, T.; Hirao, K. A long-range correction scheme forgeneralized-gradient-approximation exchange functionals. J. Chem. Phys. 2001, 115,3540–3544.
[42] Vydrov, O. A.; Scuseria, G. E. Assessment of a long-range corrected hybrid functional.J. Chem. Phys. 2006, 125, 234109.
[43] Gerber, I. C.; Angyán, J. G. Hybrid functional with separated range. Chem. Phys. lett.2005, 415, 100–105.
[44] Yanai, T.; Tew, D. P.; Handy, N. C. A new hybrid exchange–correlation functionalusing the Coulomb-attenuating method (CAM-B3LYP). Chem. Phys. lett. 2004, 393,51–57.
[45] Chai, J.-D.; Head-Gordon, M. Systematic optimization of long-range corrected hybriddensity functionals. J. Chem. Phys. 2008, 128, 084106.
[46] Heyd, J.; Scuseria, G. E.; Ernzerhof, M. Hybrid functionals based on a screenedCoulomb potential. J. Chem. Phys. 2003, 118, 8207–8215.
80 Bibliography
[47] Fujimura, K.; Seko, A.; Koyama, Y.; Kuwabara, A.; Kishida, I.; Shitara, K.;Fisher, C. A.; Moriwake, H.; Tanaka, I. Accelerated Materials Design of LithiumSuperionic Conductors Based on First-Principles Calculations and Machine LearningAlgorithms. Adv. Energy Mater. 2013, 3, 980–985.
[48] Ceder, G. Opportunities and challenges for first-principles materials design and appli-cations to Li battery materials. MRS Bull. 2010, 35, 693–701.
[49] Curtarolo, S.; Hart, G. L. W.; Nardelli, M. B.; Mingo, N.; Sanvito, S.; Levy, O. Thehigh-throughput highway to computational materials design. Nat. Mater. 2013, 12,191–201.
[50] Carrete, J.; Li, W.; Mingo, N.; Wang, S.; Curtarolo, S. Finding unprecedentedlylow-thermal-conductivity half-Heusler semiconductors via high-throughput materialsmodeling. Phys. Rev. X 2014, 4, 011019.
[51] Maddox, J. Waves caused by extreme dilution. Nature 1988, 335, 760–763.
[52] Day, G.; Motherwell, W.; Ammon, H.; Boerrigter, S.; Della Valle, R.; Venuti, E.;Dzyabchenko, A.; Dunitz, J.; Schweizer, B.; Van Eijck, B.; Others, A third blindtest of crystal structure prediction. Acta Crystallogr., Sect. B: Struct. Sci. 2005, 61,511–527.
[53] Kirkpatrick, S.; Gelatt, C. D.; Vecchi, M. P. Optimization by simmulated annealing.Science 1983, 220, 671–680.
[54] Woodley, S.; Battle, P.; Gale, J.; Catlow, C. A. The prediction of inorganic crystalstructures using a genetic algorithm and energy minimisation. Phys. Chem. Chem.Phys. 1999, 1, 2535–2542.
[55] Abraham, N.; Probert, M. A periodic genetic algorithm with real-space representationfor crystal structure and polymorph prediction. Phys. Rev. B 2006, 73, 224104.
[56] Oganov, A. R.; Glass, C. W. Crystal structure prediction using ab initio evolutionarytechniques: Principles and applications. J. Chem. Phys 2006, 124, 244704.
[57] Glass, C. W.; Oganov, A. R.; Hansen, N. USPEX—evolutionary crystal structureprediction. Comput. Phys. Commun. 2006, 175, 713–720.
[58] Trimarchi, G.; Zunger, A. Global space-group optimization problem: Finding thestablest crystal structure without constraints. Phys. Rev. B 2007, 75, 104113.
[59] Wales, D. J.; Doye, J. P. Global optimization by basin-hopping and the lowest energystructures of Lennard-Jones clusters containing up to 110 atoms. J. Phys. Chem. A1997, 101, 5111–5116.
[60] Nayeem, A.; Vila, J.; Scheraga, H. A. A comparative study of the simulated-annealingand Monte Carlo-with-minimization approaches to the minimum-energy structures ofpolypeptides:[Met]-enkephalin. J.Comput. Chem. 1991, 12, 594–605.
[61] Martonák, R.; Laio, A.; Parrinello, M. Predicting crystal structures: The Parrinello-Rahman method revisited. Phys. Rev. Lett. 2003, 90, 075503.
Bibliography 81
[62] Martonák, R.; Laio, A.; Bernasconi, M.; Ceriani, C.; Raiteri, P.; Zipoli, F.; Par-rinello, M. Simulation of structural phase transitions by metadynamics. Z. Kristallogr.2005, 220, 489–498.
[63] Pickard, C. J.; Needs, R. J. Structure of phase III of solid hydrogen. Nat. Phys. 2007,3, 473–476.
[64] Pickard, C. J.; Needs, R. Highly compressed ammonia forms an ionic crystal. Nat.Mater. 2008, 7, 775–779.
[65] Pickard, C. J.; Needs, R. High-pressure phases of silane. Phys. Rev. Lett. 2006, 97,045504.
[66] Mujica, A.; Needs, R. Theoretical study of the high-pressure phase stability of GaP,InP, and InAs. Phys. Rev. B 1997, 55, 9659.
[67] Wang, Y.; Lv, J.; Zhu, L.; Ma, Y. Crystal structure prediction via particle-swarmoptimization. Phys. Rev. B 2010, 82, 094116.
[68] Wang, Y.; Lv, J.; Zhu, L.; Ma, Y. CALYPSO: A method for crystal structure prediction.Comput. Phys. Commun. 2012, 183, 2063–2070.
[69] Goedecker, S. Minima hopping: An efficient search method for the global minimumof the potential energy surface of complex molecular systems. J. Chem. Phys. 2004,120, 9911–9917.
[70] Amsler, M.; Goedecker, S. Crystal structure prediction using the minima hoppingmethod. J. Chem. Phys. 2010, 133, 224104.
[71] Kennedy, J. Eberhart. RC, 1995, Particle swarm optimization {C}. InternationalConference on Neural Networks, IV (Perth, Australia), Piscataway, NJ,(IEEE ServiceCenter). 1942.
[72] Lu, H. Dynamic population strategy assisted particle swarm optimization in multi-objective evolutionary algorithm design. IEEE Neural Network Society, IEEE NNSStudent Research Grants 2002,
[73] Roy, S.; Goedecker, S.; Hellmann, V. Bell-Evans-Polanyi principle for moleculardynamics trajectories and its implications for global optimization. Phys. Rev. E 2008,77, 056707.
[74] Amsler, M.; Flores-Livas, J. A.; Lehtovaara, L.; Balima, F.; Ghas emi, S. A.; Ma-chon, D.; Pailhès, S.; Willand, A.; Caliste, D.; Botti, S.; San Miguel, A.; Goedecker, S.;Marques, M. A. L. Crystal Structure of Cold Compressed Graphite. Phys. Rev. Lett.2012, 108, 065501.
[75] Huan, T. D.; Amsler, M.; Marques, M. A. L.; Botti, S.; Willand, A.; Goedecker, S.Low-Energy Polymeric Phases of Alanates. Phys. Rev. Lett. 2013, 110, 135502.
[76] Amsler, M.; Botti, S.; Marques, M. A. L.; Goedecker, S. Conducting Boron SheetsFormed by the Reconstruction of the α-Boron (111) Surface. Phys. Rev. Lett. 2013,111, 136101.
82 Bibliography
[77] Cerqueira, T. F. T.; Sarmiento-Pérez, R.; Trani, F.; Amsler, M.; Goedecker, S.; Mar-ques, M.; Botti, S. The crystal structure of p-type transparent conductive oxide CuBO2.MRS Commun. 2013, 3, 157–160.
[78] Flores-Livas, J. A.; Amsler, M.; Lenosky, T. J.; Lehtovaara, L.; Botti, S.; Marques, M.A. L.; Goedecker, S. High-Pressure Structures of Disilane and Their SuperconductingProperties. Phys. Rev. Lett. 2012, 108, 117004.
[79] Valencia-Jaime, I.; Sarmiento-Pérez, R.; Botti, S.; Marques, M. A.; Amsler, M.;Goedecker, S.; Romero, A. H. Novel crystal structures for lithium–silicon alloypredicted by minima hopping method. J. Alloy. Compd. 2016, 655, 147–154.
[80] Evers, J.; Weiss, A. Electrical properties of CrB type alkaline earth monosilicides andmonogermanides. Solid State Commun. 1975, 17, 41–43.
[81] Schäfer, H.; Janzon, K.; Weiss, A. BaSi2, a phase with discrete Si4 tetrahedra. Angew.Chem., Int. Ed. Engl. 1963, 2, 393–394.
[82] Evers, J.; Oehlinger, G.; Weiss, A. Crystal Structure of Barium Disilicide at HighPressures. Angew. Chem., Int. Ed. Engl. 1977, 16, 659–660.
[83] Evers, J.; Oehlinger, G.; Weiss, A. A New High-Pressure Phase of Barium Disilicide.Angew. Chem., Int. Ed. Engl. 1978, 17, 538–539.
[84] Evers, J. Transformation of three-connected silicon in BaSi2. J. Solid State Chem.1980, 32, 77–86.
[85] Kumar, M.; Umezawa, N.; Imai, M. BaSi2 as a promising low-cost, earth-abundantmaterial with large optical activity for thin-film solar cells: A hybrid density functionalstudy. Appl. Phys. Express 2014, 7, 071203.
[86] Imai, M.; Hirano, T. Electrical resistivity of metastable phases of BaSi2 synthesizedunder high pressure and high temperature. J. Alloys Compd. 1995, 224, 111–116.
[87] Pokhrel, A.; Samad, L.; Meng, F.; Jin, S. Synthesis and characterization of bariumsilicide (BaSi2) nanowire arrays for potential solar applications. Nanoscale 2015, 7,17450–17456.
[88] Morita, K.; Inomata, Y.; Suemasu, T. Optical and electrical properties of semiconduct-ing BaSi 2 thin films on Si substrates grown by molecular beam epitaxy. Thin SolidFilms 2006, 508, 363–366.
[89] Imai, M.; Hirata, K.; Hirano, T. Superconductivity of trigonal BaSi2. Phys. C 1995,245, 12–14.
[90] Flores-Livas, J. A.; Sanna, A. Superconductivity in intercalated group-IV honeycombstructures. Phys. Rev. B 2015, 91, 054508.
[91] Flores-Livas, J. A.; Debord, R.; Botti, S.; San Miguel, A.; Pailhès, S.; Marques, M.A. L. Superconductivity in layered binary silicides: A density functional theory study.Phys. Rev. B 2011, 84, 184503.
Bibliography 83
[92] Toulemonde, P.; San Miguel, A.; Merlen, A.; Viennois, R.; Le Floch, S.; Adessi, C.;Blase, X.; Tholence, J. High pressure synthesis and properties of intercalated siliconclathrates. J. Phys. Chem. Solids 2006, 67, 1117–1121.
[93] Yamanaka, S.; Enishi, E.; Fukuoka, H.; Yasukawa, M. High-pressure synthesis of anew silicon clathrate superconductor, Ba8Si46. Inorg. Chem. 2000, 39, 56–58.
[94] Rieger, W.; Parthé, E. Alkaline earth silicides, germanides and stannides with CrBstructure type. Acta Crystallogr. 1967, 22, 919–922.
[95] Yamanaka, S.; Maekawa, S. Structural evolution of the binary system Ba-Si underhigh-pressure and high-temperature conditions. Z. Naturforsch., B: J. Chem. Sci. 2006,61, 1493–1499.
[96] Dong, X.; Oganov, A. R.; Qian, G.; Zhou, X.-F.; Zhu, Q.; Wang, H.-T. How do chemi-cal properties of the atoms change under pressure. ArXiv preprint ArXiv:1503.002302015,
[97] Zhang, W.; Oganov, A. R.; Goncharov, A. F.; Zhu, Q.; Boulfelfel, S. E.; Lyakhov, A. O.;Stavrou, E.; Somayazulu, M.; Prakapenka, V. B.; Konôpková, Z. Unexpected StableStoichiometries of Sodium Chlorides. Science 2013, 342, 1502–1505.
[98] Zhu, L.; Liu, H.; Pickard, C. J.; Zou, G.; Ma, Y. Reactions of xenon with iron andnickel are predicted in the Earth’s inner core. Nat. Chem. 2014, 6, 644–648.
[99] Cui, W.; Shi, J.; Liu, H.; Lu, C.; Wang, H. Novel high-pressure crystal structures ofboron trifluoride. J. Phys. Chem. Solids 2014, 75, 1094–1098.
[100] Wang, H.; John, S. T.; Tanaka, K.; Iitaka, T.; Ma, Y. Superconductive sodalite-likeclathrate calcium hydride at high pressures. Proc. Natl. Acad. Sci. 2012, 109, 6463–6466.
[101] Zhu, L.; Wang, Z.; Wang, Y.; Zou, G.; Mao, H.-k.; Ma, Y. Spiral chain O4 form ofdense oxygen. Proc. Natl. Acad. Sci. 2012, 109, 751–753.
[102] Li, Y.; Wang, Y.; Pickard, C. J.; Needs, R. J.; Wang, Y.; Ma, Y. Metallic IcosahedronPhase of Sodium at Terapascal Pressures. Phys. Rev. Lett. 2015, 114, 125501.
[103] Liu, H.; Ma, Y. Proton or deuteron transfer in phase IV of solid hydrogen and deu-terium. Phys. Rev. Lett. 2013, 110, 025903.
[104] Peng, F.; Miao, M.; Wang, H.; Li, Q.; Ma, Y. Predicted lithium–boron compoundsunder high pressure. J. Am. Chem. Soc. 2012, 134, 18599–18605.
[105] Lu, C.; Miao, M.; Ma, Y. Structural evolution of carbon dioxide under high pressure.J. Am. Chem. Soc. 2013, 135, 14167–14171.
[106] Lv, J.; Wang, Y.; Zhu, L.; Ma, Y. Predicted novel high-pressure phases of lithium.Phys. Rev. Lett. 2011, 106, 015503.
[107] Cui, W.; Shi, J.; Liu, H.; Yao, Y.; Wang, H.; Iitaka, T.; Ma, Y. Hydrogen segregationand its roles in structural stability and metallization: silane under pressure. Sci. Rep.2015, 5, 13039.
84 Bibliography
[108] Gao, G.; Ashcroft, N. W.; Miao, M.; Hoffmann, R. Novel Si Networks in the Ca/SiPhase Diagram under Pressure. J. Phys. Chem. C 2014, 118, 25167–25175.
[109] Kresse, G.; Hafner, J. Ab initio molecular dynamics for liquid metals. Phys. Rev. B1993, 47, 558.
[110] Kresse, G.; Joubert, D. From ultrasoft pseudopotentials to the projector augmented-wave method. Phys. Rev. B 1999, 59, 1758.
[111] Monkhorst, H. J.; Pack, J. D. Special points for Brillouin-zone integrations. Phys. Rev.B 1976, 13, 5188.
[112] Parlinski, K.; Li, Z.; Kawazoe, Y. First-principles determination of the soft mode incubic ZrO2. Phys. Rev. Lett. 1997, 78, 4063.
[113] Togo, A.; Oba, F.; Tanaka, I. First-principles calculations of the ferroelastic transitionbetween rutile-type and CaCl2-type SiO2 at high pressures. Phys. Rev. B 2008, 78,134106.
[114] ESPRESSO, Q. a modular and open-source software project for quantum simulationsof materials/P. Giannozzi, S. Baroni, N. Bonini [et al.]. J. Phys.: Condens. Matter2009, 21, 395502.
[115] Probst, C.; Wittig, J. Superconductivity of bcc barium under pressure. Phys. Rev. Lett.1977, 39, 1161.
[116] Kenichi, T. High-pressure structural study of barium to 90 GPa. Phys. Rev. B 1994,50, 16238.
[117] Hanfland, M.; Schwarz, U.; Syassen, K.; Takemura, K. Crystal structure of the high-pressure phase silicon VI. Phys. rev. lett. 1999, 82, 1197.
[118] Olijnyk, H.; Sikka, S.; Holzapfel, W. Structural phase transitions in Si and Ge underpressures up to 50 GPa. Phys. Lett. A 1984, 103, 137–140.
[119] Duclos, S. J.; Vohra, Y. K.; Ruoff, A. L. Experimental study of the crystal stabilityand equation of state of Si to 248 GPa. Phys. Rev. B 1990, 41, 12021.
[120] Imai, M.; Hirano, T.; Kikegawa, T.; Shimomura, O. In situ measurements ofthe orthorhombic-to-trigonal transition in BaSi2 sunder high-pressure and high-temperature conditions. Phys. Rev. B 1997, 55, 132.
[121] Wang, J.-T.; Chen, C.; Kawazoe, Y. Phase stability and transition of BaSi2-typedisilicides and digermanides. Phys. Rev. B 2015, 91, 054107.
[122] Imai, M.; Hirano, T.; Kikegawa, T.; Shimomura, O. Phase transitions of BaSi2 at highpressures and high temperatures. Phys. Rev. B 1998, 58, 11922.
[123] Pani, M.; Palenzona, A. The phase diagram of the Ba-Si system. J. Alloys Compd.2008, 454, L1–L2.
[124] McMahon, J. M.; Morales, M. A.; Pierleoni, C.; Ceperley, D. M. The properties ofhydrogen and helium under extreme conditions. Rev. Mod. Phys. 2012, 84, 1607.
Bibliography 85
[125] Flores-Livas, J. A. Computational and experimental studies of sp3-materials at high
pressure. PhD Thesis, École doctorale de Physique et d′Astrophysique (Lyon), 2012.
[126] Nishii, T.; Mizuno, T.; Mori, Y.; Takarabe, K.; Imai, M.; Kohara, S. X-ray diffractionstudy of amorphous phase of BaSi2 under high pressure. physica status solidi (b) 2007,244, 270–273.
[127] Sheng, X.-L.; Yan, Q.-B.; Ye, F.; Zheng, Q.-R.; Su, G. T-Carbon: A Novel CarbonAllotrope. Phys. Rev. Lett. 2011, 106, 155703.
[128] Wigner, E.; Huntington, H. á. On the possibility of a metallic modification of hydrogen.J. Chem. Phys. 1935, 3, 764–770.
[129] Gregoryanz, E.; Goncharov, A. F.; Hemley, R. J.; Mao, H.-k.; Somayazulu, M.;Shen, G. Raman, infrared, and x-ray evidence for new phases of nitrogen at highpressures and temperatures. Phys. Rev. B 2002, 66, 224108.
[130] Streib, W. E.; Jordan, T. H.; Lipscomb, W. N. Single-Crystal X-Ray Diffraction Studyof β Nitrogen. J. Chem. Phys. 1962, 37, 2962–2965.
[131] Hanfland, M.; Lorenzen, M.; Wassilew-Reul, C.; Zontone, F. Structures of molecularnitrogen at high pressures. Rev. High Press. Sci. Technol. 1998, 7, 787–789.
[132] Hörl, E. Structure and structure imperfections of solid β -oxygen. Acta Crystallogr.1962, 15, 845–850.
[133] Datchi, F.; Ninet, S.; Gauthier, M.; Saitta, A.; Canny, B.; Decremps, F. Solid ammoniaat high pressure: A single-crystal x-ray diffraction study to 123 GPa. Phys. Rev. B2006, 73, 174111.
[134] Gauthier, M.; Pruzan, P.; Chervin, J.; Besson, J. Raman scattering study of ammoniaup to 75 GPa: Evidence for bond symmetrization at 60 GPa. Phys. Rev. B 1988, 37,2102.
[135] Gauthier, M.; Pruzan, P.; Chervin, J.; Polian, A. Brillouin study of liquid and solidammonia up to 20 GPa. Solid State Commun. 1988, 68, 149–153.
[136] Ma, Y.; Eremets, M.; Oganov, A. R.; Xie, Y.; Trojan, I.; Medvedev, S.; Lyakhov, A. O.;Valle, M.; Prakapenka, V. Transparent dense sodium. Nature 2009, 458, 182–185,DOI: 10.1038/nature07786.
[137] Li, Y.; Hao, J.; Liu, H.; Li, Y.; Ma, Y. The metallization and superconductivity ofdense hydrogen sulfide. J. Chem. Phys. 2014, 140, 174712.
[138] Duan, D.; Liu, Y.; Tian, F.; Li, D.; Huang, X.; Zhao, Z.; Yu, H.; Liu, B.; Tian, W.;Cui, T. Pressure-induced metallization of dense (H2S) 2H2 with high-Tc superconduc-tivity. Sci. Rep. 2014, 4, 6968.
[139] Drozdov, A.; Eremets, M.; Troyan, I.; Ksenofontov, V.; Shylin, S. Conventionalsuperconductivity at 203 kelvin at high pressures in the sulfur hydride system. Nature2015, 525, 73–76.
86 Bibliography
[140] Hazen, R.; Mao, H.; Finger, L.; Hemley, R. Single-crystal x-ray diffraction of n-H 2 athigh pressure. Phys. Rev. B 1987, 36, 3944.
[141] Hemley, R.; Mao, H. Phase transition in solid molecular hydrogen at ultrahigh pres-sures. Phys. Rev. Lett. 1988, 61, 857.
[142] Mazin, I.; Hemley, R. J.; Goncharov, A.; Hanfland, M.; Mao, H.-k. Quantum andclassical orientational ordering in solid hydrogen. Phys. Rev. Lett. 1997, 78, 1066.
[143] Goncharov, A. F.; Hemley, R. J.; Mao, H.-k. Vibron frequencies of solid H2 and D2to 200 GPa and implications for the P–T phase diagram. J. Chem. Phys. 2011, 134,174501.
[144] John, S. T.; Klug, D. D. Evidence from molecular dynamics simulations for non-metallic behaviour of solid hydrogen above 160 GPa. Nature 1995, 378, 595.
[145] Kitamura, H.; Tsuneyuki, S.; Ogitsu, T.; Miyake, T. Quantum distribution of protonsin solid molecular hydrogen at megabar pressures. Nature 2000, 404, 259–262.
[146] Tolédano, P.; Katzke, H.; Goncharov, A. F.; Hemley, R. J. Symmetry breaking in densesolid hydrogen: Mechanisms for the transitions to phase II and phase III. Phys. Rev.Lett. 2009, 103, 105301.
[147] Liu, H.; Zhu, L.; Cui, W.; Ma, Y. Room-temperature structures of solid hydrogen athigh pressures. J. Chem. Phys. 2012, 137, 074501.
[148] McMinis, J.; Clay III, R. C.; Lee, D.; Morales, M. A. Molecular to atomic phasetransition in hydrogen under high pressure. Phys. Rev. Lett. 2015, 114, 105305.
[149] Bini, R.; Ulivi, L.; Kreutz, J.; Jodl, H. J. High-pressure phases of solid nitrogen byRaman and infrared spectroscopy. J. Chem. Phys. 2000, 112, 8522–8529.
[150] Gregoryanz, E.; Goncharov, A. F.; Hemley, R. J.; Mao, H.-k. High-pressure amorphousnitrogen. Phys. Rev. B 2001, 64, 052103.
[151] Gregoryanz, E.; Goncharov, A. F.; Sanloup, C.; Somayazulu, M.; Mao, H.-k.; Hem-ley, R. J. High P-T transformations of nitrogen to 170 GPa. J. Chem. Phys. 2007, 126,184505.
[152] Lipp, M. J.; Klepeis, J. P.; Baer, B.; Cynn, H.; Evans, W. J.; Iota, V.; Yoo, C.-S.Transformation of molecular nitrogen to nonmolecular phases at megabar pressuresby direct laser heating. Phys. Rev. B 2007, 76, 014113.
[153] Eremets, M. I.; Hemley, R. J.; Mao, H.-k.; Gregoryanz, E. Semiconducting non-molecular nitrogen up to 240 GPa and its low-pressure stability. Nature 2001, 411,170–174.
[154] Ma, Y.; Oganov, A. R.; Li, Z.; Xie, Y.; Kotakoski, J. Novel high pressure structures ofpolymeric nitrogen. Phys. Rev. Lett. 2009, 102, 065501.
[155] Wang, X.; Wang, Y.; Miao, M.; Zhong, X.; Lv, J.; Cui, T.; Li, J.; Chen, L.;Pickard, C. J.; Ma, Y. Cagelike diamondoid nitrogen at high pressures. Phys. Rev. Lett.2012, 109, 175502.
Bibliography 87
[156] Eremets, M. I.; Gavriliuk, A. G.; Trojan, I. A.; Dzivenko, D. A.; Boehler, R. Single-bonded cubic form of nitrogen. Nat. Mater. 2004, 3, 558–563.
[157] Tomasino, D.; Kim, M.; Smith, J.; Yoo, C.-S. Pressure-induced symmetry-loweringtransition in dense nitrogen to layered polymeric nitrogen (LP-N) with colossal Ramanintensity. Phys. Rev. Lett. 2014, 113, 205502.
[158] Eremets, M.; Gavriliuk, A.; Serebryanaya, N.; Trojan, I.; Dzivenko, D.; Boehler, R.;Mao, H.; Hemley, R. Structural transformation of molecular nitrogen to a single-bonded atomic state at high pressures. J. Chem. Phys. 2004, 121, 11296–11300.
[159] Gregoryanz, E.; Sanloup, C.; Bini, R.; Kreutz, J.; Jodl, H. J.; Somayazulu, M.;Mao, H.-k.; Hemley, R. J. On the -ζ transition of nitrogen. J. Chem. Phys. 2006, 124,116102.
[160] Goncharov, A. F.; Gregoryanz, E.; Mao, H.-k.; Liu, Z.; Hemley, R. J. Optical evidencefor a nonmolecular phase of nitrogen above 150 GPa. Phys. Rev. Lett. 2000, 85, 1262.
[161] Frost, M.; Howie, R. T.; Dalladay-Simpson, P.; Goncharov, A. F.; Gregoryanz, E.Novel high-pressure nitrogen phase formed by compression at low temperature. Phys.Rev. B 2016, 93, 024113.
[162] LeSar, R.; Etters, R. Character of the α-β phase transition in solid oxygen. Phys. Rev.B 1988, 37, 5364.
[163] Meier, R.; Helmholdt, R. Neutron-diffraction study of α-and β -oxygen. Phys. Rev. B1984, 29, 1387.
[164] Schiferl, D.; Cromer, D.; Schwalbe, L.; Mills, R. Structure of’orange’18O2 at 9.6 GPaand 297 K. Acta Crystallogr., Sect. B: Struct. 1983, 39, 153–157.
[165] Gorelli, F. A.; Santoro, M.; Ulivi, L.; Hanfland, M. Crystal structure of solid oxygenat high pressure and low temperature. Phys. Rev. B 2002, 65, 172106.
[166] Goncharenko, I.; Makarova, O.; Ulivi, L. Direct determination of the magnetic struc-ture of the delta phase of oxygen. Phys. Rev. Lett. 2004, 93, 055502.
[167] Fujihisa, H.; Akahama, Y.; Kawamura, H.; Ohishi, Y.; Shimomura, O.; Yamawaki, H.;Sakashita, M.; Gotoh, Y.; Takeya, S.; Honda, K. O 8 cluster structure of the epsilonphase of solid oxygen. Phys. Rev. Lett. 2006, 97, 085503.
[168] Lundegaard, L. F.; Weck, G.; McMahon, M. I.; Desgreniers, S.; Loubeyre, P. Obser-vation of an O8 molecular lattice in the phase of solid oxygen. Nature 2006, 443,201–204.
[169] Desgreniers, S.; Vohra, Y. K.; Ruoff, A. L. Optical response of very high density solidoxygen to 132 GPa. Journal of Physical Chemistry 1990, 94, 1117–1122.
[170] Akahama, Y.; Kawamura, H.; Häusermann, D.; Hanfland, M.; Shimomura, O. Newhigh-pressure structural transition of oxygen at 96 GPa associated with metallizationin a molecular solid. Physical review letters 1995, 74, 4690.
88 Bibliography
[171] Shimizu, K.; Suhara, K.; Ikumo, M.; Eremets, M.; Amaya, K. Superconductivity inoxygen. Nature 1998, 393, 767–769.
[172] Petrenko, V. F.; Whitworth, R. W. Physics of ice; OUP Oxford, 1999.
[173] Salzmann, C. G.; Radaelli, P. G.; Mayer, E.; Finney, J. L. Ice XV: a new thermody-namically stable phase of ice. Phys. Rev. Lett. 2009, 103, 105701.
[174] Benoit, M.; Bernasconi, M.; Focher, P.; Parrinello, M. New high-pressure phase of ice.Phys. Rev. Lett. 1996, 76, 2934.
[175] Militzer, B.; Wilson, H. F. New phases of water ice predicted at megabar pressures.Phys. Rev. Lett. 2010, 105, 195701.
[176] Wang, Y.; Liu, H.; Lv, J.; Zhu, L.; Wang, H.; Ma, Y. High pressure partially ionicphase of water ice. Nat. Commun. 2011, 2, 563.
[177] Pickard, C. J.; Martinez-Canales, M.; Needs, R. J. Decomposition and terapascalphases of water ice. Phys. Rev. Lett. 2013, 110, 245701.
[178] Li, D.; Oganov, A. R.; Dong, X.; Zhou, X.-F.; Zhu, Q.; Qian, G.; Dong, H. Nitrogenoxides under pressure: stability, ionization, polymerization, and superconductivity.Sci. Rep. 2015, 5.
[179] Hamilton, W. C.; Petrie, M. CONFIRMATION OF DISORDER IN SOLID NITROUSOXIDE BY NEUTRON DIFFRACTION1. J. Phys. Chem. 1961, 65, 1453–1454.
[180] Mills, R.; Olinger, B.; Cromer, D.; LeSar, R. Crystal structures of N2O to 12 GPa byx-ray diffraction. J. Chem. Phys. 1991, 95, 5392–5398.
[181] Zhu, C.; Bi, H.; Zhang, S.; Wei, S.; Li, Q. Exploring the metallic phase of N 2 O underhigh pressure. RSC Adv. 2015, 5, 65745–65749.
[182] An, Q.; Xiao, H.; Goddard III, W. A.; Meng, X. Stability of NNO and NPO NanotubeCrystals. J. Phys. Chem. Lett. 2014, 5, 485–489.
[183] Olovsson, I.; Templeton, D. H. The crystal structure of ammonia monohydrate. ActaCrystallogr. 1959, 12, 827–832.
[184] Fortes, A. D.; Suard, E.; Lemee-Cailleau, M.-H.; Pickard, C. J.; Needs, R. J. Crystalstructure of ammonia monohydrate phase II. J. Am. Chem. Soc. 2009, 131, 13508–13515.
[185] Mafety, A. Étude ab initio des glaces d,ammoniac fluoré et hydraté sous conditions
thermodynamiques extrêmes. PhD Thesis, École doctorale de Physique et Chinie desMatériaux - ED 397, 2016.
[186] Allan, D.; Marshall, W.; Francis, D.; Oswald, I.; Pulham, C.; Spanswick, C. Thecrystal structures of the low-temperature and high-pressure polymorphs of nitric acid.Dalton Trans. 2010, 39, 3736–3743.
Bibliography 89
[187] Shi, J.; Cui, W.; Flores-Livas, J. A.; San-Miguel, A.; Botti, S.; Marques, M. A.Investigation of new phases in the Ba–Si phase diagram under high pressure using abinitio structural search. Phys. Chem. Chem. Phys. 2016, 18, 8108–8114.
[188] Kawazoe, H.; Yasukawa, M.; Hyodo, H.; Kurita, M.; Yanagi, H.; Hosono, H. P-typeelectrical conduction in transparent thin films of CuAlO2. Nature 1997, 389, 939–942,DOI: 10.1038/40087.
[189] Minami, T. Transparent conducting oxide semiconductors for transparent electrodes.Semicond. Sci. Technol. 2005, 20, S35, DOI: 10.1088/0268-1242/20/4/004.
[190] Jain, A.; Ong, S. P.; Hautier, G.; Chen, W.; Richards, W. D.; Dacek, S.; Cholia, S.;Gunter, D.; Skinner, D.; Ceder, G. The Materials Project: A materials genomeapproach to accelerating materials innovation. APL Mater. 2013, 1, 011002, DOI:10.1063/1.4812323.
[191] Saal, J. E.; Kirklin, S.; Aykol, M.; Meredig, B.; Wolverton, C. Materials design anddiscovery with high-throughput density functional theory: the open quantum materialsdatabase (OQMD). JOM 2013, 65, 1501–1509, DOI: 10.1007/s11837-013-0755-4.
[192] Curtarolo, S.; Setyawan, W.; Wang, S.; Xue, J.; Yang, K.; Taylor, R. H.; Nelson, L. J.;Hart, G. L.; Sanvito, S.; Buongiorno-Nardelli, M. AFLOWLIB.ORG: A distributedmaterials properties repository from high-throughput ab initio calculations. Comput.Mater. Sci. 2012, 58, 227–235, DOI: 10.1016/j.commatsci.2012.02.002.
[193] Younsi, M.; Saadi, S.; Bouguelia, A.; Aider, A.; Trari, M. Synthesis and characteriza-tion of oxygen-rich delafossite CuYO2+x–Application to H2-photo production. Sol.Energy Mater. Sol. Cells 2007, 91, 1102 – 1109, DOI: 10.1016/j.solmat.2007.03.014.
[194] Saadi, S.; Bouguelia, A.; Derbal, A.; Trari, M. Hydrogen photoproduction overnew catalyst CuLaO2. J. Photochem. Photobiol., A 2007, 187, 97 – 104, DOI:10.1016/j.jphotochem.2006.09.017.
[195] Liu, Y.; Gong, Y.; Mellott, N. P.; Wang, B.; Ye, H.; Wu, Y. Luminescence of delafossite-type CuAlO2 fibers with Eu substitution for Al cations. Sci. Technol. Adv. Mater. 2016,17, 200–209, DOI: 10.1080/14686996.2016.1172024.
[196] Daniel, U.; Radu, B.; Nicolae, V. Photovoltaic Performance of (Al, Mg)-DopedCuCrO2 for p-type Dye-sensitized Solar Cells Application. Nanosci. Nanotechnol.2016, 6, 71–76, DOI: 10.5923/c.nn.201601.14.
[197] Zakutayev, A. Design of nitride semiconductors for solar energy conversion. J. Mater.Chem. A 2016, 4, 6742–6754, DOI: 10.1039/C5TA09446A.
[198] Jiang, T.; Bujoli-Doeuff, M.; Farré, Y.; Blart, E.; Pellegrin, Y.; Gautron, E.; Bou-jtita, M.; Cario, L.; Odobel, F.; Jobic, S. Copper borate as a photocathode in p-typedye-sensitized solar cells. RSC Adv. 2016, 6, 1549–1553, DOI: 10.1039/C5RA24397A.
[199] Ono, Y.; i. Satoh, K.; Nozaki, T.; Kajitani, T. Structural, magnetic and ther-moelectric properties of Delafossite-type oxide, CuCr1−xMgxO2 (0 < x < 0.05).25th International Conference on Thermoelectrics, 2006. 2006; pp 92–96, DOI:10.1109/ICT.2006.331288.
90 Bibliography
[200] Yasuhiro Ono, T. N., Ken-ichi Satoh; Kajitani, T. Structural, Magnetic and Thermo-electric Properties of Delafossite-type Oxide, CuCr1−xMgxO2 (0 ≤ x ≤ 0.05). Jpn. J.Appl. Phys. 2007, 46, 1071, DOI: 10.1143/JJAP.46.1071.
[201] Hayashi, K.; Nozaki, T.; Kajitani, T. Structure and High Temperature ThermoelectricProperties of Delafossite-Type Oxide CuFe1−xNixO2 (0 ≤ x ≤ 0.05). Jpn. J. Appl.Phys. 2007, 46, 5226, DOI: 10.1143/JJAP.46.5226.
[202] Ohkubo, I.; Mori, T. Anisotropic Anomalies of Thermoelectric Transport Propertiesand Electronic Structures in Layered Complex Nitrides AMN2 (A = Na, Cu; M = Ta,Nb). Chem. Mater. 2015, 27, 7265–7275, DOI: 10.1021/acs.chemmater.5b02015.
[203] Chutirat Taddee, T. K.; Amornkitbamrung, V. Characterization of transparent super-conductivity Fe-doped CuCrO2 delafossite oxide. Appl. Surf. Sci. 2016, 380, 237 –242, DOI: 10.1016/j.apsusc.2016.01.120.
[204] Kushwaha, P.; Sunko, V.; Moll, P. J. W.; Bawden, L.; Riley, J. M.; Nandi, N.; Ros-ner, H.; Schmidt, M. P.; Arnold, F.; Hassinger, E.; Kim, T. K.; Hoesch, M.; Macken-zie, A. P.; King, P. D. C. Nearly free electrons in a 5d delafossite oxide metal. Sci. Adv.2015, 1, e1500692, DOI: 10.1126/sciadv.1500692.
[205] Yanagi, H.; Kawazoe, H.; Kudo, A.; Yasukawa, M.; Hosono, H. Chemical Designand Thin Film Preparation of p-Type Conductive Transparent Oxides. J. Electroceram.2000, 4, 407–414, DOI: 10.1023/A:1009959920435.
[206] Kawazoe, H.; Yanagi, H.; Ueda, K.; Hosono, H. Transparent p-Type ConductingOxides: Design and Fabrication of p-n Heterojunctions. MRS Bull. 2000, 25, 28–36,DOI: 10.1557/mrs2000.148.
[207] Marquardt, M. A.; Ashmore, N. A.; Cann, D. P. Crystal chemistry and electricalproperties of the delafossite structure. Thin Solid Films 2006, 496, 146 – 156, DOI:10.1016/j.tsf.2005.08.316.
[208] Scanlon, D. O.; Godinho, K. G.; Morgan, B. J.; Watson, G. W. Understanding conduc-tivity anomalies in CuI-based delafossite transparent conducting oxides: Theoreticalinsights. J. Chem. Phys. 2010, 132, 024707, DOI: 10.1063/1.3290815.
[209] Scanlon, D. O.; Walsh, A.; Watson, G. W. Understanding the p-Type ConductionProperties of the Transparent Conducting Oxide CuBO2: A Density Functional TheoryAnalysis. Chem. Mater. 2009, 21, 4568–4576, DOI: 10.1021/cm9015113.
[210] Scanlon, D. O.; Watson, G. W. Understanding the p-type defect chemistry of CuCrO2.J. Mater. Chem. 2011, 21, 3655–3663, DOI: 10.1039/C0JM03852K.
[211] Ginley, D. S., Hosono, H., Paine, D. C., Eds. Handbook of transparent conductors;Springer, 2010.
[212] Han, M.; Jiang, K.; Zhang, J.; Yu, W.; Li, Y.; Hu, Z.; Chu, J. Structural, electronic bandtransition and optoelectronic properties of delafossite CuGa1−xCrxO2 (0 < x < 1) solidsolution films grown by the sol-gel method. J. Mater. Chem. 2012, 22, 18463–18470,DOI: 10.1039/C2JM33027J.
Bibliography 91
[213] Ueda, K.; Hase, T.; Yanagi, H.; Kawazoe, H.; Hosono, H.; Ohta, H.; Orita, M.;Hirano, M. Epitaxial growth of transparent p-type conducting CuGaO2 thin filmson sapphire (001) substrates by pulsed laser deposition. J. Appl. Phys. 2001, 89,1790–1793, DOI: 10.1063/1.1337587.
[214] Yanagi, H.; Hase, T.; Ibuki, S.; Ueda, K.; Hosono, H. Bipolarity in electrical conduc-tion of transparent oxide semiconductor CuInO2 with delafossite structure. Appl. Phys.Lett. 2001, 78, 1583–1585, DOI: 10.1063/1.1355673.
[215] Nagarajan, R.; Draeseke, A.; Sleight, A.; Tate, J. P-type conductivity inCuCr1−xMgxO2 films and powders. J. Appl. Phys. 2001, 89, 8022–8025, DOI:10.1063/1.1372636.
[216] Farrell, L.; Norton, E.; Smith, C. M.; Caffrey, D.; Shvets, I. V.; Fleischer, K. Synthesisof nanocrystalline Cu deficient CuCrO2–a high figure of merit p-type transparentsemiconductor. J. Mater. Chem. C 2016, 4, 126–134, DOI: 10.1039/C5TC03161C.
[217] Nagarajan, R.; Duan, N.; Jayaraj, M.; Li, J.; Vanaja, K.; Yokochi, A.; Draeseke, A.;Tate, J.; Sleight, A. P-type conductivity in the delafossite structure. Int. J. Inorg. Mater.2001, 3, 265–270, DOI: 10.1063/1.1337587.
[218] Wang, Y.; Gu, Y.; Wang, T.; Shi, W. Structural, optical and electrical properties ofMg-doped CuCrO2 thin films by sol-gel processing. J. Alloys Compd. 2011, 509,5897–5902, DOI: 10.1016/j.jallcom.2011.02.175.
[219] Barnabé, A.; Thimont, Y.; Lalanne, M.; Presmanes, L.; Tailhades, P. p-Type conductingtransparent characteristics of delafossite Mg-doped CuCrO2 thin films prepared byRF-sputtering. J. Mater. Chem. C 2015, 3, 6012–6024, DOI: 10.1039/C5TC01070E.
[220] Hosono, H. Recent progress in transparent oxide semiconductors: Materials and deviceapplication. Thin Solid Films 2007, 515, 6000 – 6014, DOI: 10.1016/j.tsf.2006.12.125.
[221] Ueda, K.; Inoue, S.; Hirose, S.; Kawazoe, H.; Hosono, H. Transparent p-type semi-conductor: LaCuOS layered oxysulfide. Appl. Phys. Lett. 2000, 77, 2701–2703, DOI:10.1063/1.1319507.
[222] Hiramatsu, H.; Ueda, K.; Ohta, H.; Hirano, M.; Kamiya, T.; Hosono, H. Degeneratep-type conductivity in wide-gap LaCuOS1−xSex (x = 0−1) epitaxial films. Appl. Phys.Lett. 2003, 82, 1048–1050, DOI: 10.1063/1.1544643.
[223] Krishnapriyan, A.; Barton, P. T.; Miao, M.; Seshadri, R. First-principles study of bandalignments in the p-type hosts BaM2X2 (M = Cu, Ag; X = S, Se). J. Phys.: Condens.Matter 2014, 26, 155802, DOI: 10.1088/0953-8984/26/15/155802.
[224] Hautier, G.; Miglio, A.; Ceder, G.; Rignanese, G.-M.; Gonze, X. Identification anddesign principles of low hole effective mass p-type transparent conducting oxides. Nat.Commun. 2013, 4, 2292, DOI: 10.1038/ncomms3292.
[225] Sarmadian, N.; Saniz, R.; Partoens, B.; Lamoen, D. Easily doped p-type, low holeeffective mass, transparent oxides. Sci. Rep. 2016, 6, 20446, DOI: 10.1038/srep20446.
92 Bibliography
[226] Cerqueira, T. F.; Lin, S.; Amsler, M.; Goedecker, S.; Botti, S.; Marques, M. A.Identification of novel Cu, Ag, and Au ternary oxides from global structural prediction.Chem. Mater. 2015, 27, 4562–4573, DOI: 10.1021/acs.chemmater.5b00716.
[227] Morgan, D.; Ceder, G.; Curtarolo, S. High-throughput and data mining with ab initiomethods. Meas. Sci. Technol. 2005, 16, 296, DOI: 10.1088/0957-0233/16/1/039.
[228] Oganov, A. R., Ed. Modern Methods of Crystal Structure Prediction; Wiley-VCH:Berlin, 2010.
[229] Kresse, G.; Furthmüller, J. Efficiency of ab-initio total energy calculations for metalsand semiconductors using a plane-wave basis set. Comput. Mater. Sci. 1996, 6, 15–50,DOI: 10.1016/0927-0256(96)00008-0.
[230] Kresse, G.; Furthmüller, J. Efficient iterative schemes for ab initio total-energy cal-culations using a plane-wave basis set. Phys. Rev. B 1996, 54, 11169–11186, DOI:10.1103/PhysRevB.54.11169.
[231] Blöchl, P. E. Projector augmented-wave method. Phys. Rev. B 1994, 50, 17953, DOI:10.1103/PhysRevB.50.17953.
[232] Tran, F.; Stelzl, J.; Blaha, P. Rungs 1 to 4 of DFT Jacob’s ladder: Extensive test on thelattice constant, bulk modulus, and cohesive energy of solids. The Journal of ChemicalPhysics 2016, 144, DOI: 10.1063/1.4948636.
[233] Sarmiento-Pérez, R.; Botti, S.; Marques, M. A. L. Optimized Exchange and Corre-lation Semilocal Functional for the Calculation of Energies of Formation. J. Chem.Theory Comput. 2015, 11, 3844–3850, DOI: 10.1021/acs.jctc.5b00529.
[234] Ong, S. P.; Richards, W. D.; Jain, A.; Hautier, G.; Kocher, M.; Cholia, S.; Gunter, D.;Chevrier, V. L.; Persson, K. A.; Ceder, G. Python Materials Genomics (pymatgen): Arobust, open-source python library for materials analysis. Comput. Mater. Sci. 2013,68, 314–319, DOI: 10.1016/j.commatsci.2012.10.028.
[235] Bergerhoff, G.; Brown, I. Inorganic Crystal Structure Database. In CrystallographicDatabases; International Union of Crystallography: Chester, 1987.
[236] Belsky, A.; Hellenbrandt, M.; Karen, V. L.; Luksch, P. New developments in theInorganic Crystal Structure Database (ICSD): accessibility in support of materialsresearch and design. Acta Crystallogr., Sect. B: Struct. Sci., Cryst. Eng. Mater. 2002,58, 364–369, DOI: 10.1107/S0108768102006948.
[237] Madsen, G. K.; Singh, D. J. BoltzTraP. A code for calculating band-structure dependent quantities. Comput. Phys. Commun. 2006, 175, 67–71, DOI:10.1016/j.cpc.2006.03.007.
[238] Schleife, A.; Fuchs, F.; Rödl, C.; Furthmüller, J.; Bechstedt, F. Branch-point energiesand band discontinuities of III-nitrides and III-II-oxides from quasiparticle band-structure calculation. Appl. Phys. Lett. 2009, 94, 012104, DOI: 10.1063/1.3059569.
[239] Robertson, J.; Clark, S. J. Limits to doping in oxides. Phys. Rev. B 2011, 83, 075205,DOI: 10.1103/PhysRevB.83.075205.
Bibliography 93
[240] Momma, K.; Izumi, F. VESTA 3 for three-dimensional visualization of crystal, volu-metric and morphology data. J. Appl. Crystallogr. 2011, 44, 1272–1276.
[241] Glawe, H.; Sanna, A.; Gross, E. K. U.; Marques, M. A. L. The optimal one dimensionalperiodic table: a modified Pettifor chemical scale from data mining. New J. Phys.2016, 18, 093011, DOI: 10.1088/1367-2630/18/9/093011.
[242] Pettifor, D. A chemical scale for crystal-structure maps. Solid State Commun. 1984,51, 31–34, DOI: 10.1016/0038-1098(84)90765-8.
[243] Takatsu, H.; Nénert, G.; Kadowaki, H.; Yoshizawa, H.; Enderle, M.; Yonezawa, S.;Maeno, Y.; Kim, J.; Tsuji, N.; Takata, M. Magnetic structure of the conductivetriangular-lattice antiferromagnet PdCrO2. Phys. Rev. B 2014, 89, 104408, DOI:10.1103/PhysRevB.89.104408.
[244] Shannon, R. D.; Rogers, D. B.; Prewitt, C. T. Chemistry of noble metal oxides. I.Syntheses and properties of ABO2 delafossite compounds. Inorg. Chem. 1971, 10,713–718, DOI: 10.1021/ic50098a011.
[245] Boon, J. The crystal structure of NaBiS2 and KBiS2. Recl. Trav. Chim. Pays-Bas 1944,63, 32–34, DOI: 10.1002/recl.19440630203.
[246] Havlak, L.; Fabry, J.; Henriques, M.; Dušek, M. Structure determination of KScS2,RbScS2 and KLnS2 (Ln= Nd, Sm, Tb, Dy, Ho, Er, Tm and Yb) and crystal chem-ical discussion. Acta Crystallogr., Sect. C: Struct. Chem. 2015, 71, 623–630, DOI:10.1016/0025-5408(87)90038-9.
[247] Pachoud, E.; Damay, F.; Martin, C.; Mordvinova, N. E.; Lebedev, O. I.; Maig-nan, A. Robustness of Antiferromagnetism and Pyroelectricity in AgCr1−xRhxS2.Chem. Mater. 2016, 28, 1816–1822, DOI: 10.1021/acs.chemmater.5b04948.
[248] Ballestracci, R. Une classe de nouveaux composés sulfurés de terres rares et d’argentde type AgTS2. C. R. Seances Acad. Sci., Ser. C 1966, 262, 1253–1256.
[249] Sidorov, M.; McKelvy, M.; Sharma, R.; Glaunsinger, W.; Ganal, P.; Moreau, P.;Ouvrard, G. Structural Investigation of Mercury-Intercalated Titanium Disulfide. 2.HRTEM of HgxTiS2. Chem. Mater. 1995, 7, 1140–1152, DOI: 10.1021/cm00054a014.
[250] Veliev, R.; Sadykhov, R.; Asadov, Y. G.; Kerimova, E.; Dzhabbarov, A. Mag-netization, paramagnetic susceptibility, and electrical conductivity of layeredTIMnS2 and TIMnSe2 antiferromagnets. Crystallogr. Rep. 2008, 53, 130–133, DOI:10.1134/S1063774508010161.
[251] Dijkstra, J.; Van Bruggen, C.; Haas, C.; de Groot, R. Electronic structure of thehalf-metallic ferromagnet KCrSe2. Phys. Rev. B 1989, 40, 7973, DOI: 10.1103/Phys-RevB.40.7973.
[252] Trippel, A.; Lazarev, V.; Berul, S. Synthesis and properties of some compoundsABiTe2. Zh. Neorg. Khim. 1978, 23, 707–710.
[253] S. Kabré, M. G., M. Julien Pouzol Sur une nouvelle famille de tellurures doubles dethallium(I) et de terres rares. C. R. Seances Acad. Sci., Ser. C 1972, 275, 1367–1370.

94 Bibliography
[254] Vidal, J.; Trani, F.; Bruneval, F.; Marques, M. A. L.; Botti, S. Effects of Electronicand Lattice Polarization on the Band Structure of Delafossite Transparent ConductiveOxides. Phys. Rev. Lett. 2010, 104, 136401, DOI: 10.1103/PhysRevLett.104.136401.
[255] Trani, F.; Vidal, J.; Botti, S.; Marques, M. A. L. Band structures of delafossitetransparent conductive oxides from a self-consistent GW approach. Phys. Rev. B 2010,82, 085115, DOI: 10.1103/PhysRevB.82.085115.
[256] Pellicer-Porres, J.; Segura, A.; Gilliland, A.; Munoz, A.; Rodríguez-Hernández, P.;Kim, D.; Lee, M.; Kim, T. On the band gap of CuAlO2 delafossite. Appl. Phys. Lett.2006, 88, 181904–181904, DOI: 10.1063/1.2200398.
Appendix A
Structual parameters of the novel phaseswith composition ABX2. (Chapter 5)
We summarize structual parameters of the new stable delafossite and closedly related phases
with composition ABO2, ABS2, ABSe2 and ABTe2.
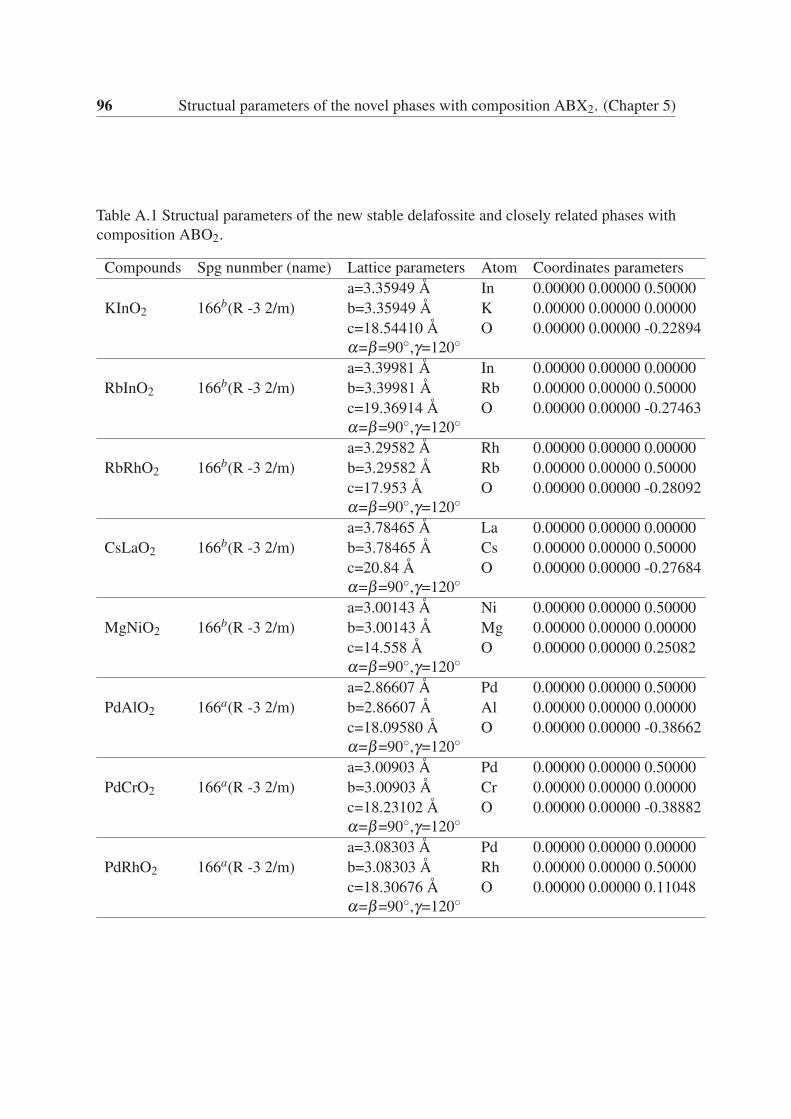
96 Structual parameters of the novel phases with composition ABX2. (Chapter 5)
Table A.1 Structual parameters of the new stable delafossite and closely related phases with
composition ABO2.
Compounds Spg nunmber (name) Lattice parameters Atom Coordinates parameters
a=3.35949 Å In 0.00000 0.00000 0.50000
KInO2 166b(R -3 2/m) b=3.35949 Å K 0.00000 0.00000 0.00000
c=18.54410 Å O 0.00000 0.00000 -0.22894
α=β=90◦,γ=120◦
a=3.39981 Å In 0.00000 0.00000 0.00000
RbInO2 166b(R -3 2/m) b=3.39981 Å Rb 0.00000 0.00000 0.50000
c=19.36914 Å O 0.00000 0.00000 -0.27463
α=β=90◦,γ=120◦
a=3.29582 Å Rh 0.00000 0.00000 0.00000
RbRhO2 166b(R -3 2/m) b=3.29582 Å Rb 0.00000 0.00000 0.50000
c=17.953 Å O 0.00000 0.00000 -0.28092
α=β=90◦,γ=120◦
a=3.78465 Å La 0.00000 0.00000 0.00000
CsLaO2 166b(R -3 2/m) b=3.78465 Å Cs 0.00000 0.00000 0.50000
c=20.84 Å O 0.00000 0.00000 -0.27684
α=β=90◦,γ=120◦
a=3.00143 Å Ni 0.00000 0.00000 0.50000
MgNiO2 166b(R -3 2/m) b=3.00143 Å Mg 0.00000 0.00000 0.00000
c=14.558 Å O 0.00000 0.00000 0.25082
α=β=90◦,γ=120◦
a=2.86607 Å Pd 0.00000 0.00000 0.50000
PdAlO2 166a(R -3 2/m) b=2.86607 Å Al 0.00000 0.00000 0.00000
c=18.09580 Å O 0.00000 0.00000 -0.38662
α=β=90◦,γ=120◦
a=3.00903 Å Pd 0.00000 0.00000 0.50000
PdCrO2 166a(R -3 2/m) b=3.00903 Å Cr 0.00000 0.00000 0.00000
c=18.23102 Å O 0.00000 0.00000 -0.38882
α=β=90◦,γ=120◦
a=3.08303 Å Pd 0.00000 0.00000 0.00000
PdRhO2 166a(R -3 2/m) b=3.08303 Å Rh 0.00000 0.00000 0.50000
c=18.30676 Å O 0.00000 0.00000 0.11048
α=β=90◦,γ=120◦
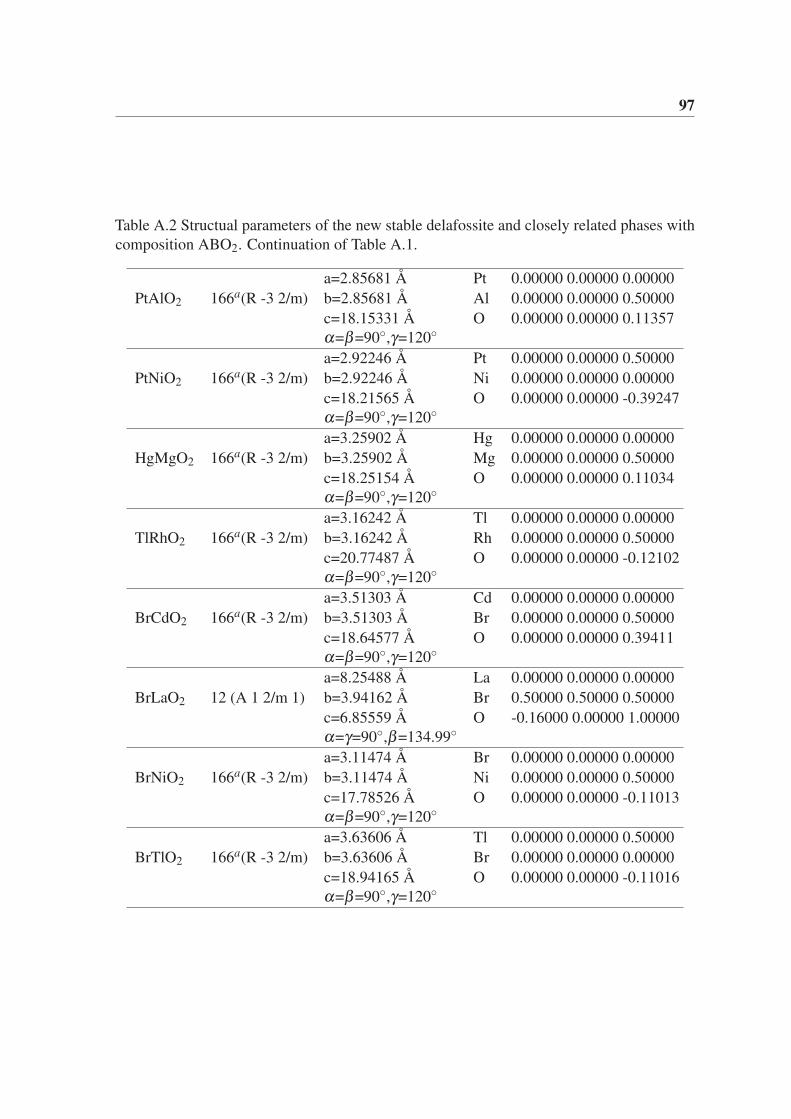
97
Table A.2 Structual parameters of the new stable delafossite and closely related phases with
composition ABO2. Continuation of Table A.1.
a=2.85681 Å Pt 0.00000 0.00000 0.00000
PtAlO2 166a(R -3 2/m) b=2.85681 Å Al 0.00000 0.00000 0.50000
c=18.15331 Å O 0.00000 0.00000 0.11357
α=β=90◦,γ=120◦
a=2.92246 Å Pt 0.00000 0.00000 0.50000
PtNiO2 166a(R -3 2/m) b=2.92246 Å Ni 0.00000 0.00000 0.00000
c=18.21565 Å O 0.00000 0.00000 -0.39247
α=β=90◦,γ=120◦
a=3.25902 Å Hg 0.00000 0.00000 0.00000
HgMgO2 166a(R -3 2/m) b=3.25902 Å Mg 0.00000 0.00000 0.50000
c=18.25154 Å O 0.00000 0.00000 0.11034
α=β=90◦,γ=120◦
a=3.16242 Å Tl 0.00000 0.00000 0.00000
TlRhO2 166a(R -3 2/m) b=3.16242 Å Rh 0.00000 0.00000 0.50000
c=20.77487 Å O 0.00000 0.00000 -0.12102
α=β=90◦,γ=120◦
a=3.51303 Å Cd 0.00000 0.00000 0.00000
BrCdO2 166a(R -3 2/m) b=3.51303 Å Br 0.00000 0.00000 0.50000
c=18.64577 Å O 0.00000 0.00000 0.39411
α=β=90◦,γ=120◦
a=8.25488 Å La 0.00000 0.00000 0.00000
BrLaO2 12 (A 1 2/m 1) b=3.94162 Å Br 0.50000 0.50000 0.50000
c=6.85559 Å O -0.16000 0.00000 1.00000
α=γ=90◦,β=134.99◦
a=3.11474 Å Br 0.00000 0.00000 0.00000
BrNiO2 166a(R -3 2/m) b=3.11474 Å Ni 0.00000 0.00000 0.50000
c=17.78526 Å O 0.00000 0.00000 -0.11013
α=β=90◦,γ=120◦
a=3.63606 Å Tl 0.00000 0.00000 0.50000
BrTlO2 166a(R -3 2/m) b=3.63606 Å Br 0.00000 0.00000 0.00000
c=18.94165 Å O 0.00000 0.00000 -0.11016
α=β=90◦,γ=120◦
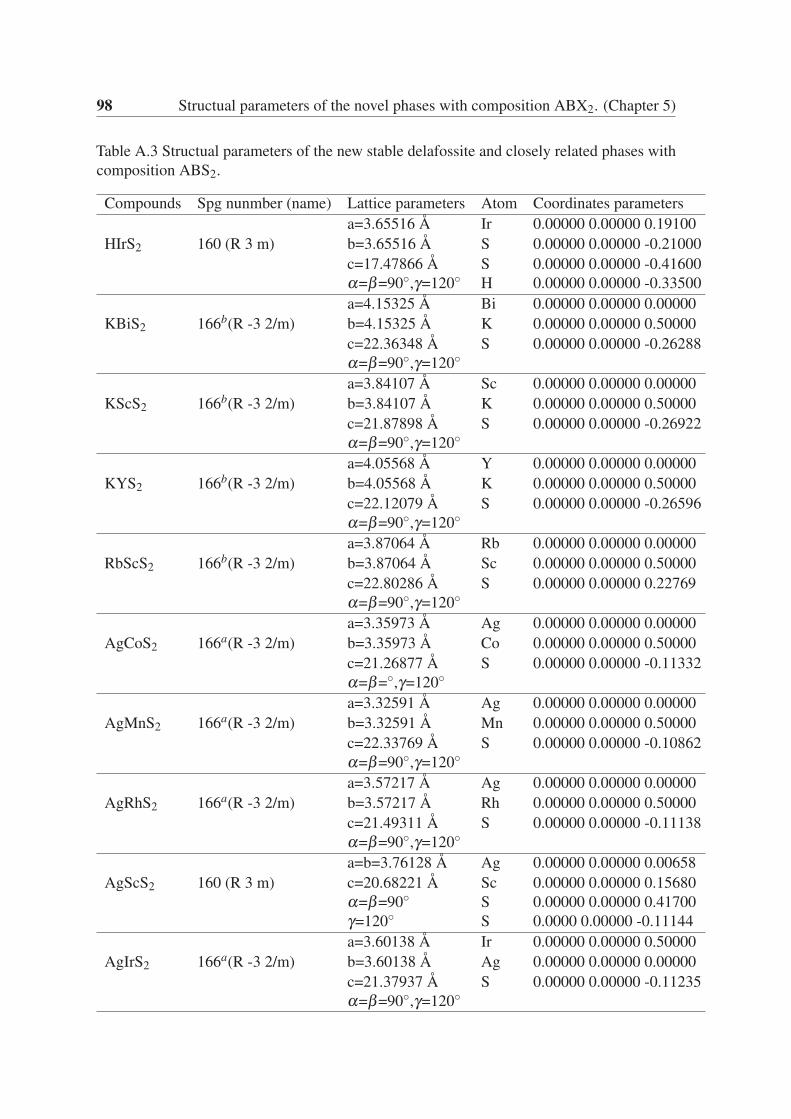
98 Structual parameters of the novel phases with composition ABX2. (Chapter 5)
Table A.3 Structual parameters of the new stable delafossite and closely related phases with
composition ABS2.
Compounds Spg nunmber (name) Lattice parameters Atom Coordinates parameters
a=3.65516 Å Ir 0.00000 0.00000 0.19100
HIrS2 160 (R 3 m) b=3.65516 Å S 0.00000 0.00000 -0.21000
c=17.47866 Å S 0.00000 0.00000 -0.41600
α=β=90◦,γ=120◦ H 0.00000 0.00000 -0.33500
a=4.15325 Å Bi 0.00000 0.00000 0.00000
KBiS2 166b(R -3 2/m) b=4.15325 Å K 0.00000 0.00000 0.50000
c=22.36348 Å S 0.00000 0.00000 -0.26288
α=β=90◦,γ=120◦
a=3.84107 Å Sc 0.00000 0.00000 0.00000
KScS2 166b(R -3 2/m) b=3.84107 Å K 0.00000 0.00000 0.50000
c=21.87898 Å S 0.00000 0.00000 -0.26922
α=β=90◦,γ=120◦
a=4.05568 Å Y 0.00000 0.00000 0.00000
KYS2 166b(R -3 2/m) b=4.05568 Å K 0.00000 0.00000 0.50000
c=22.12079 Å S 0.00000 0.00000 -0.26596
α=β=90◦,γ=120◦
a=3.87064 Å Rb 0.00000 0.00000 0.00000
RbScS2 166b(R -3 2/m) b=3.87064 Å Sc 0.00000 0.00000 0.50000
c=22.80286 Å S 0.00000 0.00000 0.22769
α=β=90◦,γ=120◦
a=3.35973 Å Ag 0.00000 0.00000 0.00000
AgCoS2 166a(R -3 2/m) b=3.35973 Å Co 0.00000 0.00000 0.50000
c=21.26877 Å S 0.00000 0.00000 -0.11332
α=β=◦,γ=120◦
a=3.32591 Å Ag 0.00000 0.00000 0.00000
AgMnS2 166a(R -3 2/m) b=3.32591 Å Mn 0.00000 0.00000 0.50000
c=22.33769 Å S 0.00000 0.00000 -0.10862
α=β=90◦,γ=120◦
a=3.57217 Å Ag 0.00000 0.00000 0.00000
AgRhS2 166a(R -3 2/m) b=3.57217 Å Rh 0.00000 0.00000 0.50000
c=21.49311 Å S 0.00000 0.00000 -0.11138
α=β=90◦,γ=120◦
a=b=3.76128 Å Ag 0.00000 0.00000 0.00658
AgScS2 160 (R 3 m) c=20.68221 Å Sc 0.00000 0.00000 0.15680
α=β=90◦ S 0.00000 0.00000 0.41700
γ=120◦ S 0.0000 0.00000 -0.11144
a=3.60138 Å Ir 0.00000 0.00000 0.50000
AgIrS2 166a(R -3 2/m) b=3.60138 Å Ag 0.00000 0.00000 0.00000
c=21.37937 Å S 0.00000 0.00000 -0.11235
α=β=90◦,γ=120◦

99
Table A.4 Structual parameters of the new stable delafossite and closely related phases with
composition ABS2. Continuation of Table A.3.
a=b=4.05641 Å Ag 0.33300 0.66700 -0.42100
AgYS2 156 (P 3 m 1) c=6.63987 Å Y 0.00000 0.00000 -0.00178
α=β=90◦ S 0.33300 0.66700 0.20456
γ=120◦ S 0.66700 0.33300 -0.23684
a=3.56258 Å Au 0.00000 0.00000 0.00000
AuAlS2 166a(R -3 2/m) b=3.56258 Å S 0.00000 0.00000 -0.10762
c=21.56252 Å Al 0.00000 0.00000 0.50000
α=β=90◦,γ=120◦
a=4.28266 Å Bi 0.00000 0.00000 0.50000
AuBiS2 166a(R -3 2/m) b=4.28266 Å Au 0.00000 0.00000 0.0000
c=22.26884 Å S 0.00000 0.00000 -0.10296
α=β=90◦,γ=120◦
a=3.36726 Å Au 0.00000 0.00000 0.00000
AuCoS2 166a(R -3 2/m) b=3.36726 Å Co 0.00000 0.00000 0.50000
c=20.78827 Å S 0.00000 0.00000 -0.11258
α=β=90◦,γ=120◦
a=3.94181 Å Au 0.00000 0.00000 0.00000
AuInS2 166a(R -3 2/m) b=3.94181 Å In 0.00000 0.00000 0.50000
c=22.00386 Å S 0.00000 0.00000 -0.10468
α=β=90◦,γ=120◦
a=3.61618 Å Au 0.00000 0.00000 0.00000
AuIrS2 166a(R -3 2/m) b=3.61618 Å Ir 0.00000 0.00000 0.50000
c=20.86395 Å S 0.00000 0.00000 -0.11166
α=β=90◦,γ=120◦
a=3.33532 Å Au 0.00000 0.00000 0.00000
AuMnS2 166a(R -3 2/m) b=3.33532 Å Mn 0.00000 0.00000 0.50000
c=21.81510 Å S 0.00000 0.00000 -0.10786
α=β=90◦,γ=120◦
a=3.58538 Å Au 0.00000 0.00000 0.00000
AuRhS2 166a(R -3 2/m) b=3.58538 Å Rh 0.00000 0.00000 0.50000
c=20.98328 Å S 0.00000 0.00000 -0.11063
α=β=90◦,γ=120◦
a=3.82016 Å Au 0.00000 0.00000 0.00000
AuScS2 166a(R -3 2/m) b=3.82016 Å Sc 0.00000 0.00000 0.50000
c=22.01038 Å S 0.00000 0.00000 -0.10493
α=β=90◦,γ=120◦
a=4.13622 Å Au 0.00000 0.00000 0.00000
AuYS2 166a(R -3 2/m) b=4.13622 Å Y 0.00000 0.00000 0.50000
c=22.10901 Å S 0.00000 0.00000 -0.10430
α=β=90◦,γ=120◦
a=3.63137 Å Hg 0.00000 0.00000 0.00000
HgHfS2 166b(R -3 2/m) b=3.63137 Å Hf 0.00000 0.00000 0.50000
c=28.69144 Å S 0.00000 0.00000 0.21733
α=β=90◦,γ=120◦
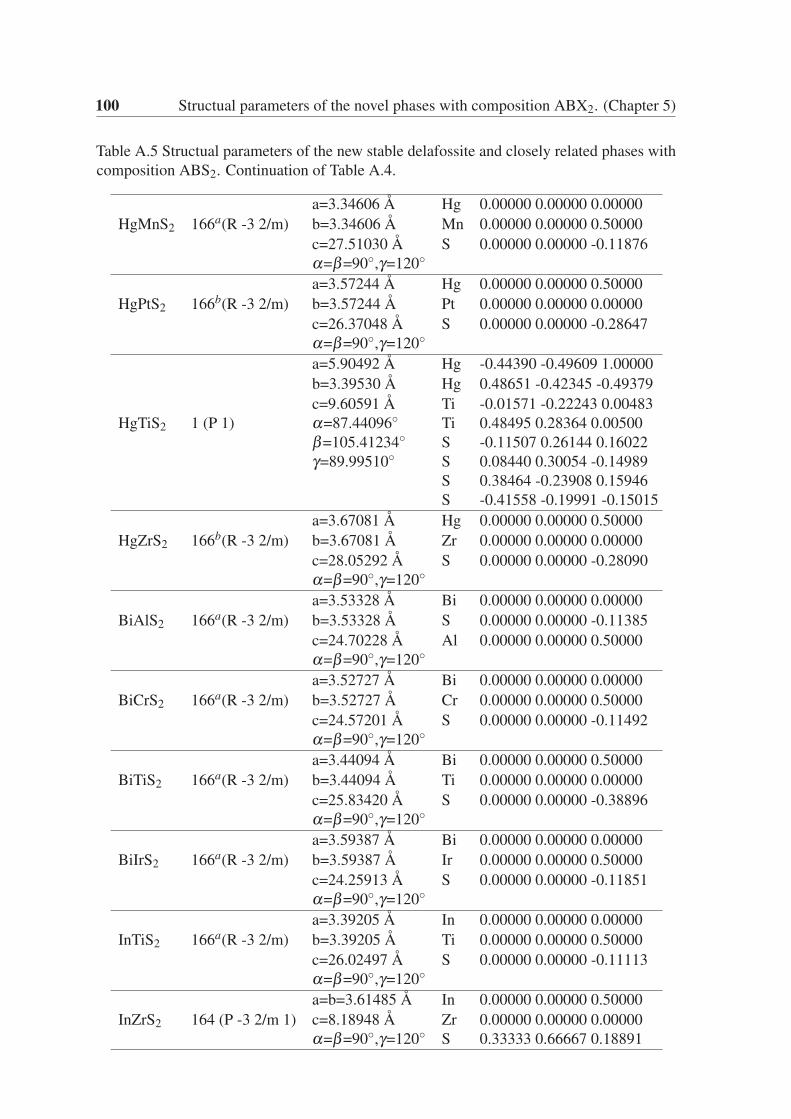
100 Structual parameters of the novel phases with composition ABX2. (Chapter 5)
Table A.5 Structual parameters of the new stable delafossite and closely related phases with
composition ABS2. Continuation of Table A.4.
a=3.34606 Å Hg 0.00000 0.00000 0.00000
HgMnS2 166a(R -3 2/m) b=3.34606 Å Mn 0.00000 0.00000 0.50000
c=27.51030 Å S 0.00000 0.00000 -0.11876
α=β=90◦,γ=120◦
a=3.57244 Å Hg 0.00000 0.00000 0.50000
HgPtS2 166b(R -3 2/m) b=3.57244 Å Pt 0.00000 0.00000 0.00000
c=26.37048 Å S 0.00000 0.00000 -0.28647
α=β=90◦,γ=120◦
a=5.90492 Å Hg -0.44390 -0.49609 1.00000
b=3.39530 Å Hg 0.48651 -0.42345 -0.49379
c=9.60591 Å Ti -0.01571 -0.22243 0.00483
HgTiS2 1 (P 1) α=87.44096◦ Ti 0.48495 0.28364 0.00500
β=105.41234◦ S -0.11507 0.26144 0.16022
γ=89.99510◦ S 0.08440 0.30054 -0.14989
S 0.38464 -0.23908 0.15946
S -0.41558 -0.19991 -0.15015
a=3.67081 Å Hg 0.00000 0.00000 0.50000
HgZrS2 166b(R -3 2/m) b=3.67081 Å Zr 0.00000 0.00000 0.00000
c=28.05292 Å S 0.00000 0.00000 -0.28090
α=β=90◦,γ=120◦
a=3.53328 Å Bi 0.00000 0.00000 0.00000
BiAlS2 166a(R -3 2/m) b=3.53328 Å S 0.00000 0.00000 -0.11385
c=24.70228 Å Al 0.00000 0.00000 0.50000
α=β=90◦,γ=120◦
a=3.52727 Å Bi 0.00000 0.00000 0.00000
BiCrS2 166a(R -3 2/m) b=3.52727 Å Cr 0.00000 0.00000 0.50000
c=24.57201 Å S 0.00000 0.00000 -0.11492
α=β=90◦,γ=120◦
a=3.44094 Å Bi 0.00000 0.00000 0.50000
BiTiS2 166a(R -3 2/m) b=3.44094 Å Ti 0.00000 0.00000 0.00000
c=25.83420 Å S 0.00000 0.00000 -0.38896
α=β=90◦,γ=120◦
a=3.59387 Å Bi 0.00000 0.00000 0.00000
BiIrS2 166a(R -3 2/m) b=3.59387 Å Ir 0.00000 0.00000 0.50000
c=24.25913 Å S 0.00000 0.00000 -0.11851
α=β=90◦,γ=120◦
a=3.39205 Å In 0.00000 0.00000 0.00000
InTiS2 166a(R -3 2/m) b=3.39205 Å Ti 0.00000 0.00000 0.50000
c=26.02497 Å S 0.00000 0.00000 -0.11113
α=β=90◦,γ=120◦
a=b=3.61485 Å In 0.00000 0.00000 0.50000
InZrS2 164 (P -3 2/m 1) c=8.18948 Å Zr 0.00000 0.00000 0.00000
α=β=90◦,γ=120◦ S 0.33333 0.66667 0.18891
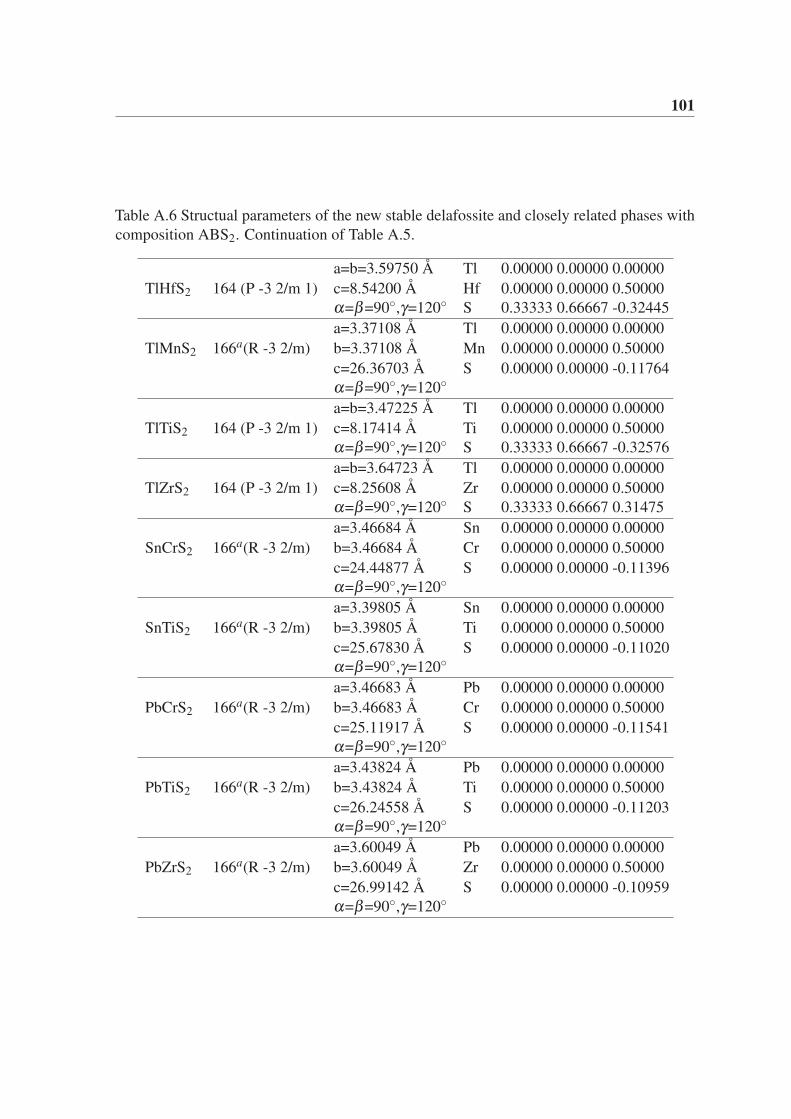
101
Table A.6 Structual parameters of the new stable delafossite and closely related phases with
composition ABS2. Continuation of Table A.5.
a=b=3.59750 Å Tl 0.00000 0.00000 0.00000
TlHfS2 164 (P -3 2/m 1) c=8.54200 Å Hf 0.00000 0.00000 0.50000
α=β=90◦,γ=120◦ S 0.33333 0.66667 -0.32445
a=3.37108 Å Tl 0.00000 0.00000 0.00000
TlMnS2 166a(R -3 2/m) b=3.37108 Å Mn 0.00000 0.00000 0.50000
c=26.36703 Å S 0.00000 0.00000 -0.11764
α=β=90◦,γ=120◦
a=b=3.47225 Å Tl 0.00000 0.00000 0.00000
TlTiS2 164 (P -3 2/m 1) c=8.17414 Å Ti 0.00000 0.00000 0.50000
α=β=90◦,γ=120◦ S 0.33333 0.66667 -0.32576
a=b=3.64723 Å Tl 0.00000 0.00000 0.00000
TlZrS2 164 (P -3 2/m 1) c=8.25608 Å Zr 0.00000 0.00000 0.50000
α=β=90◦,γ=120◦ S 0.33333 0.66667 0.31475
a=3.46684 Å Sn 0.00000 0.00000 0.00000
SnCrS2 166a(R -3 2/m) b=3.46684 Å Cr 0.00000 0.00000 0.50000
c=24.44877 Å S 0.00000 0.00000 -0.11396
α=β=90◦,γ=120◦
a=3.39805 Å Sn 0.00000 0.00000 0.00000
SnTiS2 166a(R -3 2/m) b=3.39805 Å Ti 0.00000 0.00000 0.50000
c=25.67830 Å S 0.00000 0.00000 -0.11020
α=β=90◦,γ=120◦
a=3.46683 Å Pb 0.00000 0.00000 0.00000
PbCrS2 166a(R -3 2/m) b=3.46683 Å Cr 0.00000 0.00000 0.50000
c=25.11917 Å S 0.00000 0.00000 -0.11541
α=β=90◦,γ=120◦
a=3.43824 Å Pb 0.00000 0.00000 0.00000
PbTiS2 166a(R -3 2/m) b=3.43824 Å Ti 0.00000 0.00000 0.50000
c=26.24558 Å S 0.00000 0.00000 -0.11203
α=β=90◦,γ=120◦
a=3.60049 Å Pb 0.00000 0.00000 0.00000
PbZrS2 166a(R -3 2/m) b=3.60049 Å Zr 0.00000 0.00000 0.50000
c=26.99142 Å S 0.00000 0.00000 -0.10959
α=β=90◦,γ=120◦
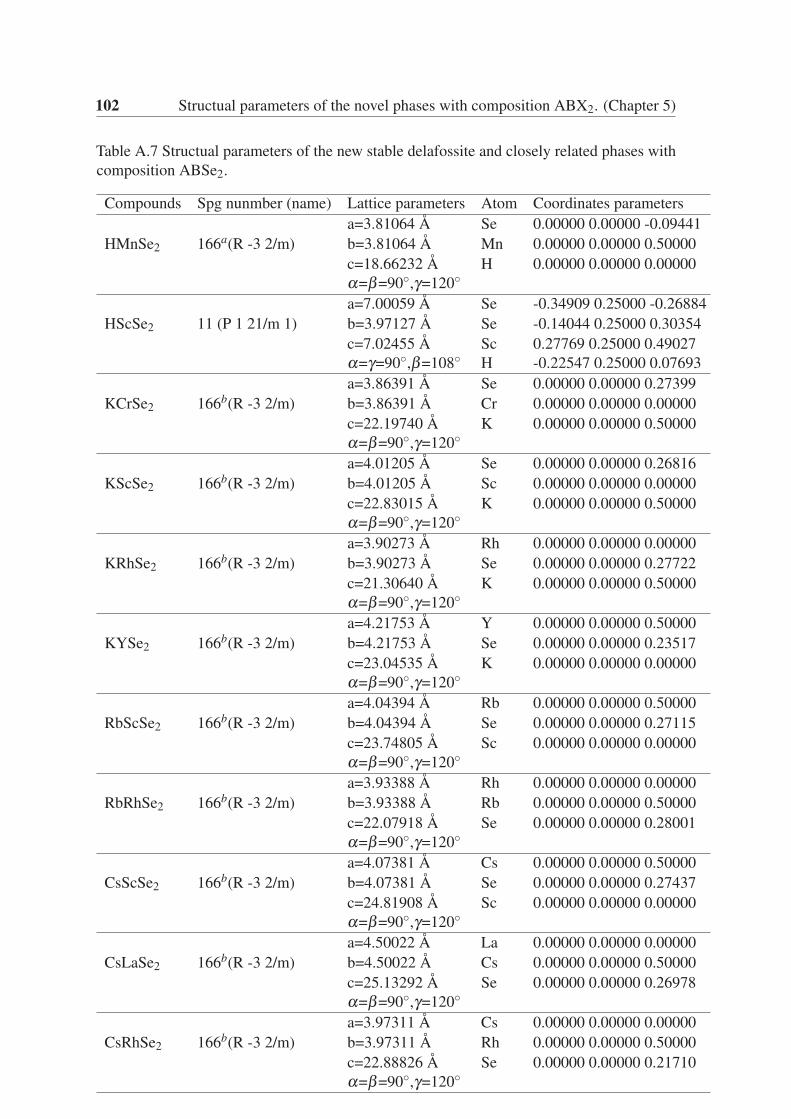
102 Structual parameters of the novel phases with composition ABX2. (Chapter 5)
Table A.7 Structual parameters of the new stable delafossite and closely related phases with
composition ABSe2.
Compounds Spg nunmber (name) Lattice parameters Atom Coordinates parameters
a=3.81064 Å Se 0.00000 0.00000 -0.09441
HMnSe2 166a(R -3 2/m) b=3.81064 Å Mn 0.00000 0.00000 0.50000
c=18.66232 Å H 0.00000 0.00000 0.00000
α=β=90◦,γ=120◦
a=7.00059 Å Se -0.34909 0.25000 -0.26884
HScSe2 11 (P 1 21/m 1) b=3.97127 Å Se -0.14044 0.25000 0.30354
c=7.02455 Å Sc 0.27769 0.25000 0.49027
α=γ=90◦,β=108◦ H -0.22547 0.25000 0.07693
a=3.86391 Å Se 0.00000 0.00000 0.27399
KCrSe2 166b(R -3 2/m) b=3.86391 Å Cr 0.00000 0.00000 0.00000
c=22.19740 Å K 0.00000 0.00000 0.50000
α=β=90◦,γ=120◦
a=4.01205 Å Se 0.00000 0.00000 0.26816
KScSe2 166b(R -3 2/m) b=4.01205 Å Sc 0.00000 0.00000 0.00000
c=22.83015 Å K 0.00000 0.00000 0.50000
α=β=90◦,γ=120◦
a=3.90273 Å Rh 0.00000 0.00000 0.00000
KRhSe2 166b(R -3 2/m) b=3.90273 Å Se 0.00000 0.00000 0.27722
c=21.30640 Å K 0.00000 0.00000 0.50000
α=β=90◦,γ=120◦
a=4.21753 Å Y 0.00000 0.00000 0.50000
KYSe2 166b(R -3 2/m) b=4.21753 Å Se 0.00000 0.00000 0.23517
c=23.04535 Å K 0.00000 0.00000 0.00000
α=β=90◦,γ=120◦
a=4.04394 Å Rb 0.00000 0.00000 0.50000
RbScSe2 166b(R -3 2/m) b=4.04394 Å Se 0.00000 0.00000 0.27115
c=23.74805 Å Sc 0.00000 0.00000 0.00000
α=β=90◦,γ=120◦
a=3.93388 Å Rh 0.00000 0.00000 0.00000
RbRhSe2 166b(R -3 2/m) b=3.93388 Å Rb 0.00000 0.00000 0.50000
c=22.07918 Å Se 0.00000 0.00000 0.28001
α=β=90◦,γ=120◦
a=4.07381 Å Cs 0.00000 0.00000 0.50000
CsScSe2 166b(R -3 2/m) b=4.07381 Å Se 0.00000 0.00000 0.27437
c=24.81908 Å Sc 0.00000 0.00000 0.00000
α=β=90◦,γ=120◦
a=4.50022 Å La 0.00000 0.00000 0.00000
CsLaSe2 166b(R -3 2/m) b=4.50022 Å Cs 0.00000 0.00000 0.50000
c=25.13292 Å Se 0.00000 0.00000 0.26978
α=β=90◦,γ=120◦
a=3.97311 Å Cs 0.00000 0.00000 0.00000
CsRhSe2 166b(R -3 2/m) b=3.97311 Å Rh 0.00000 0.00000 0.50000
c=22.88826 Å Se 0.00000 0.00000 0.21710
α=β=90◦,γ=120◦
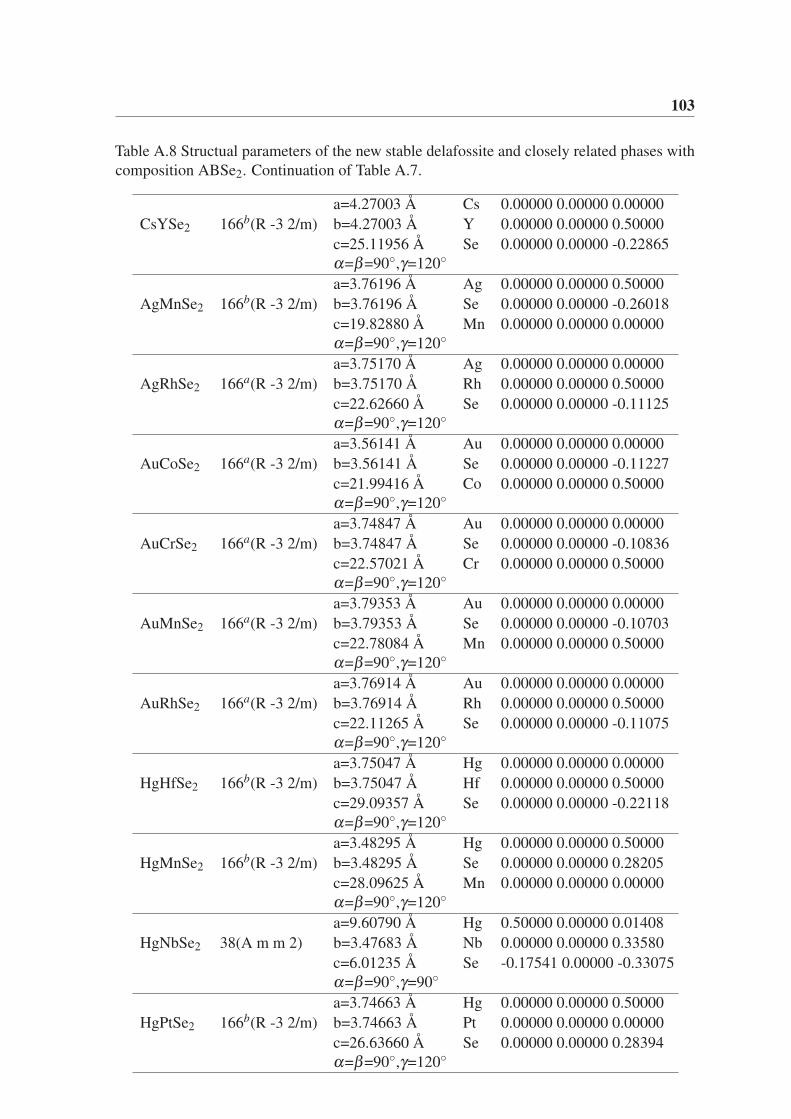
103
Table A.8 Structual parameters of the new stable delafossite and closely related phases with
composition ABSe2. Continuation of Table A.7.
a=4.27003 Å Cs 0.00000 0.00000 0.00000
CsYSe2 166b(R -3 2/m) b=4.27003 Å Y 0.00000 0.00000 0.50000
c=25.11956 Å Se 0.00000 0.00000 -0.22865
α=β=90◦,γ=120◦
a=3.76196 Å Ag 0.00000 0.00000 0.50000
AgMnSe2 166b(R -3 2/m) b=3.76196 Å Se 0.00000 0.00000 -0.26018
c=19.82880 Å Mn 0.00000 0.00000 0.00000
α=β=90◦,γ=120◦
a=3.75170 Å Ag 0.00000 0.00000 0.00000
AgRhSe2 166a(R -3 2/m) b=3.75170 Å Rh 0.00000 0.00000 0.50000
c=22.62660 Å Se 0.00000 0.00000 -0.11125
α=β=90◦,γ=120◦
a=3.56141 Å Au 0.00000 0.00000 0.00000
AuCoSe2 166a(R -3 2/m) b=3.56141 Å Se 0.00000 0.00000 -0.11227
c=21.99416 Å Co 0.00000 0.00000 0.50000
α=β=90◦,γ=120◦
a=3.74847 Å Au 0.00000 0.00000 0.00000
AuCrSe2 166a(R -3 2/m) b=3.74847 Å Se 0.00000 0.00000 -0.10836
c=22.57021 Å Cr 0.00000 0.00000 0.50000
α=β=90◦,γ=120◦
a=3.79353 Å Au 0.00000 0.00000 0.00000
AuMnSe2 166a(R -3 2/m) b=3.79353 Å Se 0.00000 0.00000 -0.10703
c=22.78084 Å Mn 0.00000 0.00000 0.50000
α=β=90◦,γ=120◦
a=3.76914 Å Au 0.00000 0.00000 0.00000
AuRhSe2 166a(R -3 2/m) b=3.76914 Å Rh 0.00000 0.00000 0.50000
c=22.11265 Å Se 0.00000 0.00000 -0.11075
α=β=90◦,γ=120◦
a=3.75047 Å Hg 0.00000 0.00000 0.00000
HgHfSe2 166b(R -3 2/m) b=3.75047 Å Hf 0.00000 0.00000 0.50000
c=29.09357 Å Se 0.00000 0.00000 -0.22118
α=β=90◦,γ=120◦
a=3.48295 Å Hg 0.00000 0.00000 0.50000
HgMnSe2 166b(R -3 2/m) b=3.48295 Å Se 0.00000 0.00000 0.28205
c=28.09625 Å Mn 0.00000 0.00000 0.00000
α=β=90◦,γ=120◦
a=9.60790 Å Hg 0.50000 0.00000 0.01408
HgNbSe2 38(A m m 2) b=3.47683 Å Nb 0.00000 0.00000 0.33580
c=6.01235 Å Se -0.17541 0.00000 -0.33075
α=β=90◦,γ=90◦
a=3.74663 Å Hg 0.00000 0.00000 0.50000
HgPtSe2 166b(R -3 2/m) b=3.74663 Å Pt 0.00000 0.00000 0.00000
c=26.63660 Å Se 0.00000 0.00000 0.28394
α=β=90◦,γ=120◦
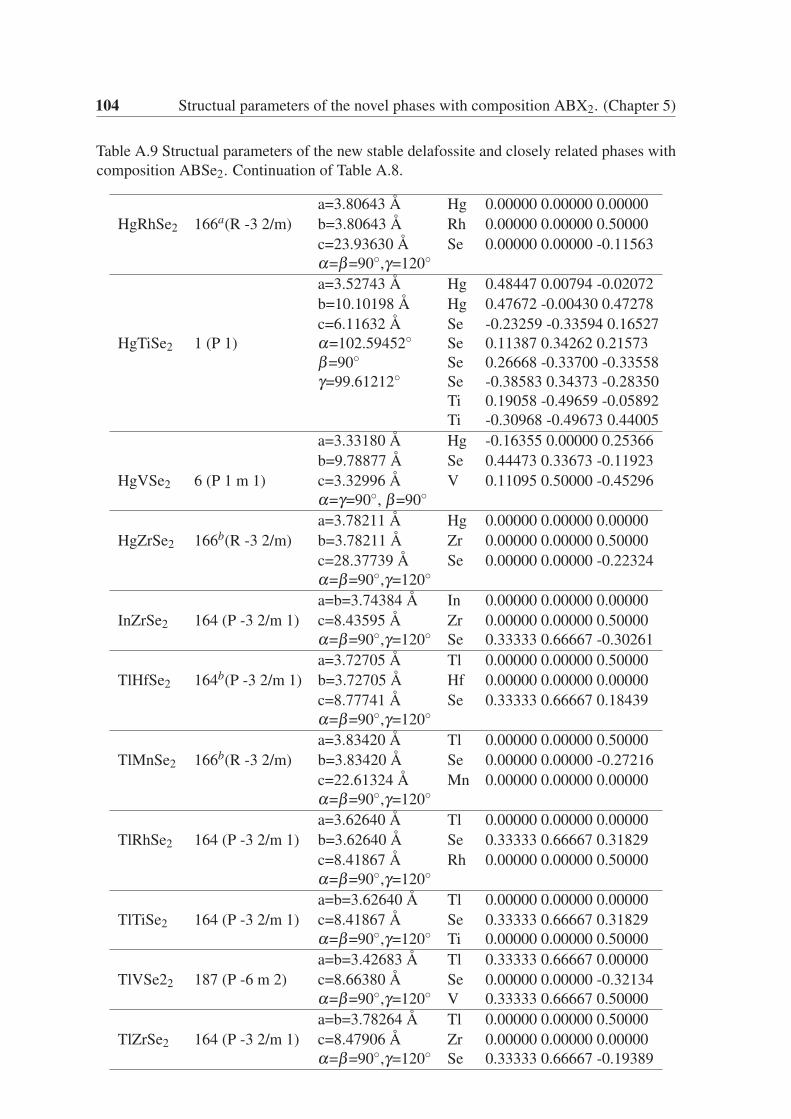
104 Structual parameters of the novel phases with composition ABX2. (Chapter 5)
Table A.9 Structual parameters of the new stable delafossite and closely related phases with
composition ABSe2. Continuation of Table A.8.
a=3.80643 Å Hg 0.00000 0.00000 0.00000
HgRhSe2 166a(R -3 2/m) b=3.80643 Å Rh 0.00000 0.00000 0.50000
c=23.93630 Å Se 0.00000 0.00000 -0.11563
α=β=90◦,γ=120◦
a=3.52743 Å Hg 0.48447 0.00794 -0.02072
b=10.10198 Å Hg 0.47672 -0.00430 0.47278
c=6.11632 Å Se -0.23259 -0.33594 0.16527
HgTiSe2 1 (P 1) α=102.59452◦ Se 0.11387 0.34262 0.21573
β=90◦ Se 0.26668 -0.33700 -0.33558
γ=99.61212◦ Se -0.38583 0.34373 -0.28350
Ti 0.19058 -0.49659 -0.05892
Ti -0.30968 -0.49673 0.44005
a=3.33180 Å Hg -0.16355 0.00000 0.25366
b=9.78877 Å Se 0.44473 0.33673 -0.11923
HgVSe2 6 (P 1 m 1) c=3.32996 Å V 0.11095 0.50000 -0.45296
α=γ=90◦, β=90◦
a=3.78211 Å Hg 0.00000 0.00000 0.00000
HgZrSe2 166b(R -3 2/m) b=3.78211 Å Zr 0.00000 0.00000 0.50000
c=28.37739 Å Se 0.00000 0.00000 -0.22324
α=β=90◦,γ=120◦
a=b=3.74384 Å In 0.00000 0.00000 0.00000
InZrSe2 164 (P -3 2/m 1) c=8.43595 Å Zr 0.00000 0.00000 0.50000
α=β=90◦,γ=120◦ Se 0.33333 0.66667 -0.30261
a=3.72705 Å Tl 0.00000 0.00000 0.50000
TlHfSe2 164b(P -3 2/m 1) b=3.72705 Å Hf 0.00000 0.00000 0.00000
c=8.77741 Å Se 0.33333 0.66667 0.18439
α=β=90◦,γ=120◦
a=3.83420 Å Tl 0.00000 0.00000 0.50000
TlMnSe2 166b(R -3 2/m) b=3.83420 Å Se 0.00000 0.00000 -0.27216
c=22.61324 Å Mn 0.00000 0.00000 0.00000
α=β=90◦,γ=120◦
a=3.62640 Å Tl 0.00000 0.00000 0.00000
TlRhSe2 164 (P -3 2/m 1) b=3.62640 Å Se 0.33333 0.66667 0.31829
c=8.41867 Å Rh 0.00000 0.00000 0.50000
α=β=90◦,γ=120◦
a=b=3.62640 Å Tl 0.00000 0.00000 0.00000
TlTiSe2 164 (P -3 2/m 1) c=8.41867 Å Se 0.33333 0.66667 0.31829
α=β=90◦,γ=120◦ Ti 0.00000 0.00000 0.50000
a=b=3.42683 Å Tl 0.33333 0.66667 0.00000
TlVSe22 187 (P -6 m 2) c=8.66380 Å Se 0.00000 0.00000 -0.32134
α=β=90◦,γ=120◦ V 0.33333 0.66667 0.50000
a=b=3.78264 Å Tl 0.00000 0.00000 0.50000
TlZrSe2 164 (P -3 2/m 1) c=8.47906 Å Zr 0.00000 0.00000 0.00000
α=β=90◦,γ=120◦ Se 0.33333 0.66667 -0.19389
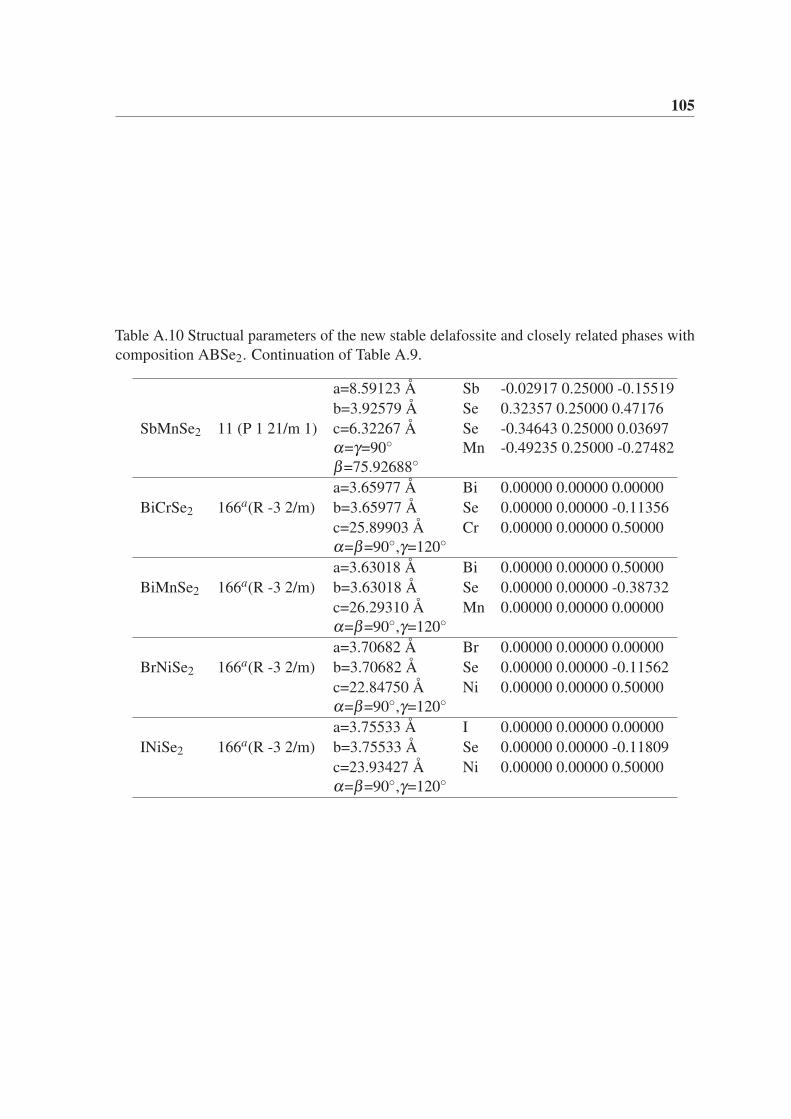
105
Table A.10 Structual parameters of the new stable delafossite and closely related phases with
composition ABSe2. Continuation of Table A.9.
a=8.59123 Å Sb -0.02917 0.25000 -0.15519
b=3.92579 Å Se 0.32357 0.25000 0.47176
SbMnSe2 11 (P 1 21/m 1) c=6.32267 Å Se -0.34643 0.25000 0.03697
α=γ=90◦ Mn -0.49235 0.25000 -0.27482
β=75.92688◦
a=3.65977 Å Bi 0.00000 0.00000 0.00000
BiCrSe2 166a(R -3 2/m) b=3.65977 Å Se 0.00000 0.00000 -0.11356
c=25.89903 Å Cr 0.00000 0.00000 0.50000
α=β=90◦,γ=120◦
a=3.63018 Å Bi 0.00000 0.00000 0.50000
BiMnSe2 166a(R -3 2/m) b=3.63018 Å Se 0.00000 0.00000 -0.38732
c=26.29310 Å Mn 0.00000 0.00000 0.00000
α=β=90◦,γ=120◦
a=3.70682 Å Br 0.00000 0.00000 0.00000
BrNiSe2 166a(R -3 2/m) b=3.70682 Å Se 0.00000 0.00000 -0.11562
c=22.84750 Å Ni 0.00000 0.00000 0.50000
α=β=90◦,γ=120◦
a=3.75533 Å I 0.00000 0.00000 0.00000
INiSe2 166a(R -3 2/m) b=3.75533 Å Se 0.00000 0.00000 -0.11809
c=23.93427 Å Ni 0.00000 0.00000 0.50000
α=β=90◦,γ=120◦
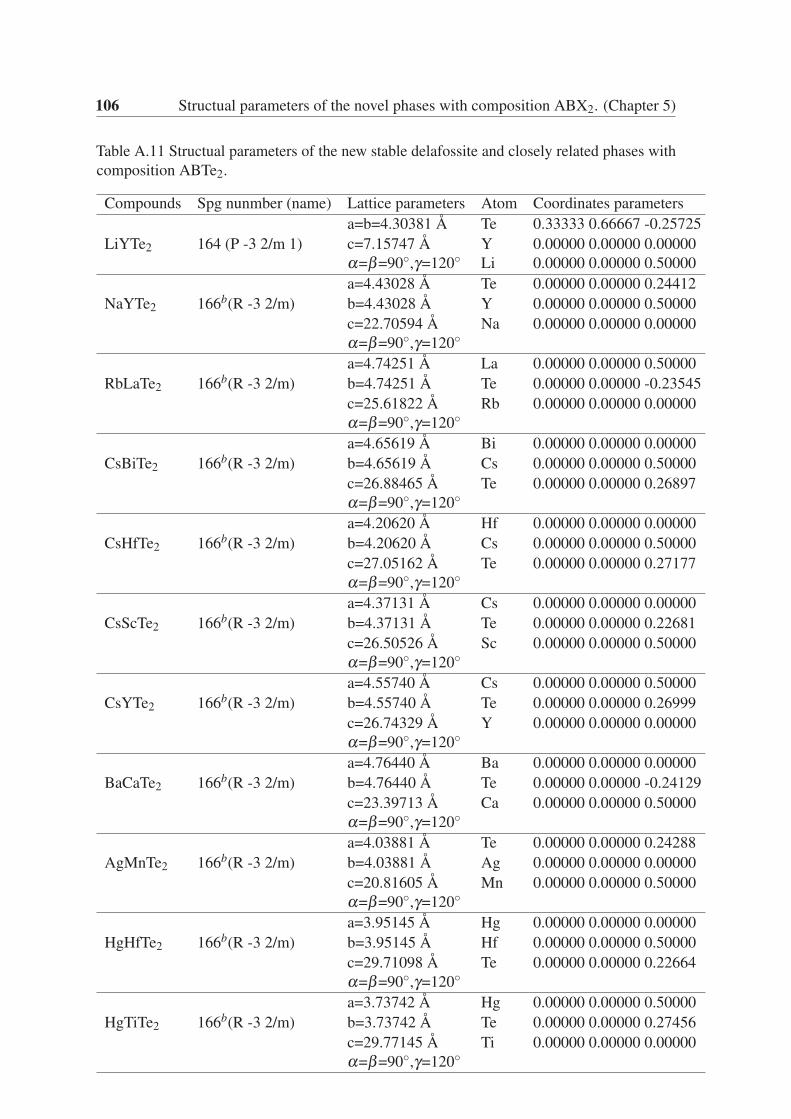
106 Structual parameters of the novel phases with composition ABX2. (Chapter 5)
Table A.11 Structual parameters of the new stable delafossite and closely related phases with
composition ABTe2.
Compounds Spg nunmber (name) Lattice parameters Atom Coordinates parameters
a=b=4.30381 Å Te 0.33333 0.66667 -0.25725
LiYTe2 164 (P -3 2/m 1) c=7.15747 Å Y 0.00000 0.00000 0.00000
α=β=90◦,γ=120◦ Li 0.00000 0.00000 0.50000
a=4.43028 Å Te 0.00000 0.00000 0.24412
NaYTe2 166b(R -3 2/m) b=4.43028 Å Y 0.00000 0.00000 0.50000
c=22.70594 Å Na 0.00000 0.00000 0.00000
α=β=90◦,γ=120◦
a=4.74251 Å La 0.00000 0.00000 0.50000
RbLaTe2 166b(R -3 2/m) b=4.74251 Å Te 0.00000 0.00000 -0.23545
c=25.61822 Å Rb 0.00000 0.00000 0.00000
α=β=90◦,γ=120◦
a=4.65619 Å Bi 0.00000 0.00000 0.00000
CsBiTe2 166b(R -3 2/m) b=4.65619 Å Cs 0.00000 0.00000 0.50000
c=26.88465 Å Te 0.00000 0.00000 0.26897
α=β=90◦,γ=120◦
a=4.20620 Å Hf 0.00000 0.00000 0.00000
CsHfTe2 166b(R -3 2/m) b=4.20620 Å Cs 0.00000 0.00000 0.50000
c=27.05162 Å Te 0.00000 0.00000 0.27177
α=β=90◦,γ=120◦
a=4.37131 Å Cs 0.00000 0.00000 0.00000
CsScTe2 166b(R -3 2/m) b=4.37131 Å Te 0.00000 0.00000 0.22681
c=26.50526 Å Sc 0.00000 0.00000 0.50000
α=β=90◦,γ=120◦
a=4.55740 Å Cs 0.00000 0.00000 0.50000
CsYTe2 166b(R -3 2/m) b=4.55740 Å Te 0.00000 0.00000 0.26999
c=26.74329 Å Y 0.00000 0.00000 0.00000
α=β=90◦,γ=120◦
a=4.76440 Å Ba 0.00000 0.00000 0.00000
BaCaTe2 166b(R -3 2/m) b=4.76440 Å Te 0.00000 0.00000 -0.24129
c=23.39713 Å Ca 0.00000 0.00000 0.50000
α=β=90◦,γ=120◦
a=4.03881 Å Te 0.00000 0.00000 0.24288
AgMnTe2 166b(R -3 2/m) b=4.03881 Å Ag 0.00000 0.00000 0.00000
c=20.81605 Å Mn 0.00000 0.00000 0.50000
α=β=90◦,γ=120◦
a=3.95145 Å Hg 0.00000 0.00000 0.00000
HgHfTe2 166b(R -3 2/m) b=3.95145 Å Hf 0.00000 0.00000 0.50000
c=29.71098 Å Te 0.00000 0.00000 0.22664
α=β=90◦,γ=120◦
a=3.73742 Å Hg 0.00000 0.00000 0.50000
HgTiTe2 166b(R -3 2/m) b=3.73742 Å Te 0.00000 0.00000 0.27456
c=29.77145 Å Ti 0.00000 0.00000 0.00000
α=β=90◦,γ=120◦
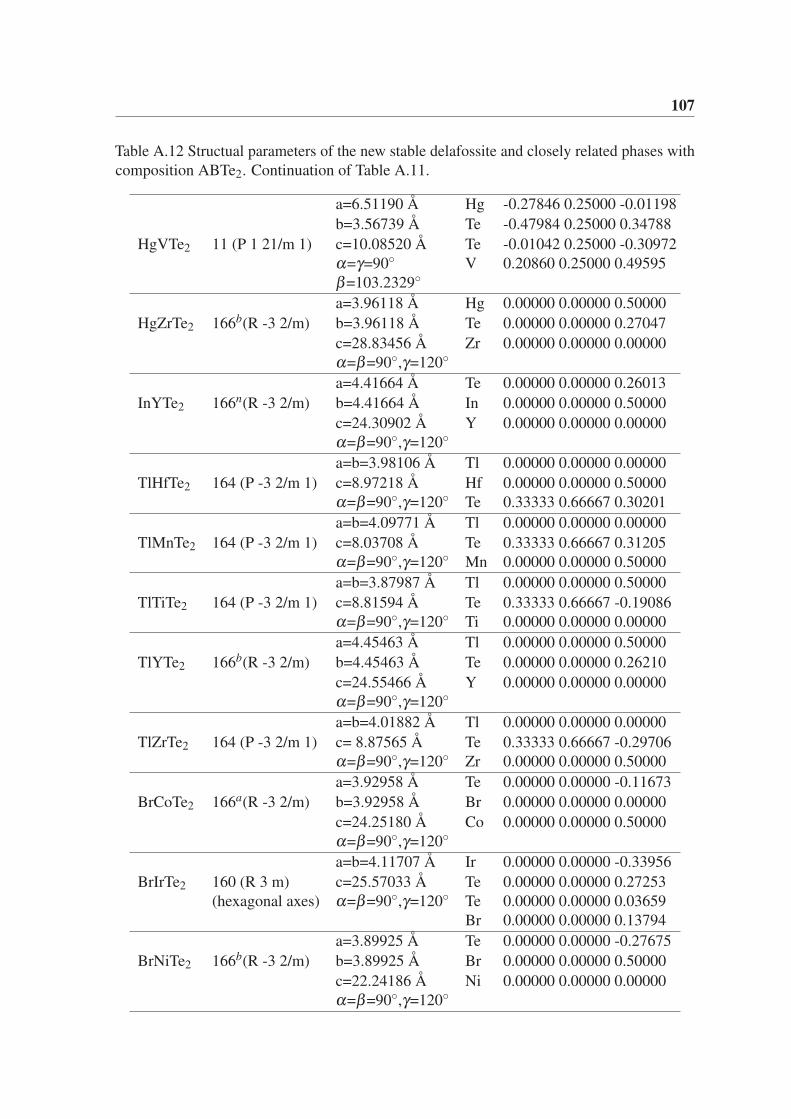
107
Table A.12 Structual parameters of the new stable delafossite and closely related phases with
composition ABTe2. Continuation of Table A.11.
a=6.51190 Å Hg -0.27846 0.25000 -0.01198
b=3.56739 Å Te -0.47984 0.25000 0.34788
HgVTe2 11 (P 1 21/m 1) c=10.08520 Å Te -0.01042 0.25000 -0.30972
α=γ=90◦ V 0.20860 0.25000 0.49595
β=103.2329◦
a=3.96118 Å Hg 0.00000 0.00000 0.50000
HgZrTe2 166b(R -3 2/m) b=3.96118 Å Te 0.00000 0.00000 0.27047
c=28.83456 Å Zr 0.00000 0.00000 0.00000
α=β=90◦,γ=120◦
a=4.41664 Å Te 0.00000 0.00000 0.26013
InYTe2 166n(R -3 2/m) b=4.41664 Å In 0.00000 0.00000 0.50000
c=24.30902 Å Y 0.00000 0.00000 0.00000
α=β=90◦,γ=120◦
a=b=3.98106 Å Tl 0.00000 0.00000 0.00000
TlHfTe2 164 (P -3 2/m 1) c=8.97218 Å Hf 0.00000 0.00000 0.50000
α=β=90◦,γ=120◦ Te 0.33333 0.66667 0.30201
a=b=4.09771 Å Tl 0.00000 0.00000 0.00000
TlMnTe2 164 (P -3 2/m 1) c=8.03708 Å Te 0.33333 0.66667 0.31205
α=β=90◦,γ=120◦ Mn 0.00000 0.00000 0.50000
a=b=3.87987 Å Tl 0.00000 0.00000 0.50000
TlTiTe2 164 (P -3 2/m 1) c=8.81594 Å Te 0.33333 0.66667 -0.19086
α=β=90◦,γ=120◦ Ti 0.00000 0.00000 0.00000
a=4.45463 Å Tl 0.00000 0.00000 0.50000
TlYTe2 166b(R -3 2/m) b=4.45463 Å Te 0.00000 0.00000 0.26210
c=24.55466 Å Y 0.00000 0.00000 0.00000
α=β=90◦,γ=120◦
a=b=4.01882 Å Tl 0.00000 0.00000 0.00000
TlZrTe2 164 (P -3 2/m 1) c= 8.87565 Å Te 0.33333 0.66667 -0.29706
α=β=90◦,γ=120◦ Zr 0.00000 0.00000 0.50000
a=3.92958 Å Te 0.00000 0.00000 -0.11673
BrCoTe2 166a(R -3 2/m) b=3.92958 Å Br 0.00000 0.00000 0.00000
c=24.25180 Å Co 0.00000 0.00000 0.50000
α=β=90◦,γ=120◦
a=b=4.11707 Å Ir 0.00000 0.00000 -0.33956
BrIrTe2 160 (R 3 m) c=25.57033 Å Te 0.00000 0.00000 0.27253
(hexagonal axes) α=β=90◦,γ=120◦ Te 0.00000 0.00000 0.03659
Br 0.00000 0.00000 0.13794
a=3.89925 Å Te 0.00000 0.00000 -0.27675
BrNiTe2 166b(R -3 2/m) b=3.89925 Å Br 0.00000 0.00000 0.50000
c=22.24186 Å Ni 0.00000 0.00000 0.00000
α=β=90◦,γ=120◦
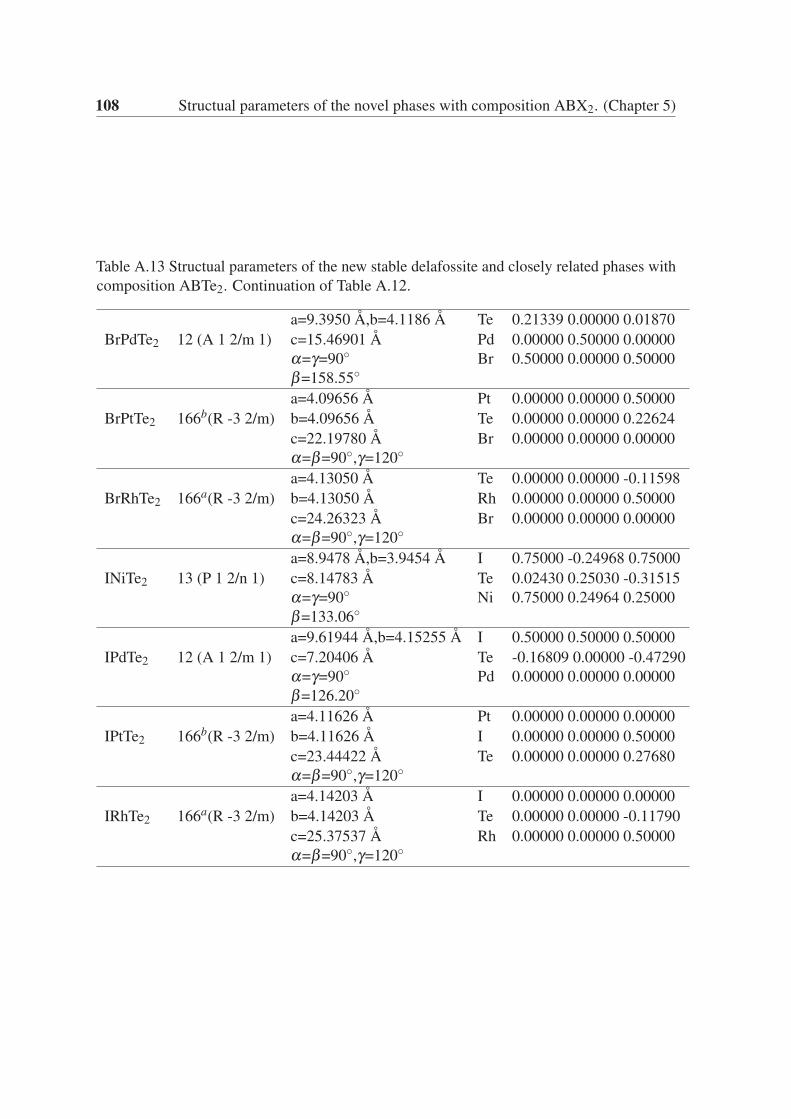
108 Structual parameters of the novel phases with composition ABX2. (Chapter 5)
Table A.13 Structual parameters of the new stable delafossite and closely related phases with
composition ABTe2. Continuation of Table A.12.
a=9.3950 Å,b=4.1186 Å Te 0.21339 0.00000 0.01870
BrPdTe2 12 (A 1 2/m 1) c=15.46901 Å Pd 0.00000 0.50000 0.00000
α=γ=90◦ Br 0.50000 0.00000 0.50000
β=158.55◦
a=4.09656 Å Pt 0.00000 0.00000 0.50000
BrPtTe2 166b(R -3 2/m) b=4.09656 Å Te 0.00000 0.00000 0.22624
c=22.19780 Å Br 0.00000 0.00000 0.00000
α=β=90◦,γ=120◦
a=4.13050 Å Te 0.00000 0.00000 -0.11598
BrRhTe2 166a(R -3 2/m) b=4.13050 Å Rh 0.00000 0.00000 0.50000
c=24.26323 Å Br 0.00000 0.00000 0.00000
α=β=90◦,γ=120◦
a=8.9478 Å,b=3.9454 Å I 0.75000 -0.24968 0.75000
INiTe2 13 (P 1 2/n 1) c=8.14783 Å Te 0.02430 0.25030 -0.31515
α=γ=90◦ Ni 0.75000 0.24964 0.25000
β=133.06◦
a=9.61944 Å,b=4.15255 Å I 0.50000 0.50000 0.50000
IPdTe2 12 (A 1 2/m 1) c=7.20406 Å Te -0.16809 0.00000 -0.47290
α=γ=90◦ Pd 0.00000 0.00000 0.00000
β=126.20◦
a=4.11626 Å Pt 0.00000 0.00000 0.00000
IPtTe2 166b(R -3 2/m) b=4.11626 Å I 0.00000 0.00000 0.50000
c=23.44422 Å Te 0.00000 0.00000 0.27680
α=β=90◦,γ=120◦
a=4.14203 Å I 0.00000 0.00000 0.00000
IRhTe2 166a(R -3 2/m) b=4.14203 Å Te 0.00000 0.00000 -0.11790
c=25.37537 Å Rh 0.00000 0.00000 0.50000
α=β=90◦,γ=120◦


![Liquid Crystalline Phases of DNA-1rudi/sola/LC-DNA.pdf2 Liquid crystalline phases of DNA 2.1 Liquid crystal phases [5] Liquid crystals (LCs) are a state of matt er that has properties](https://img.pdfslide.us/doc/110x75/5eb9ec2c5545583d214c3e3c/liquid-crystalline-phases-of-dna-1-rudisolalc-dnapdf-2-liquid-crystalline-phases.jpg)