Embed Size (px)
Citation preview
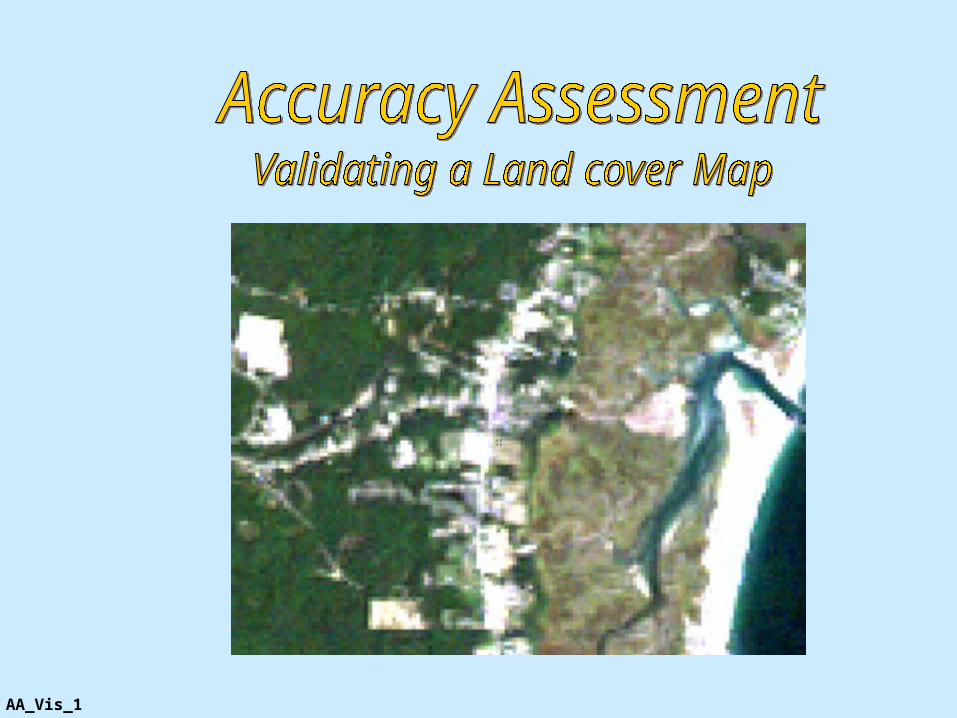
AA_Vis_1
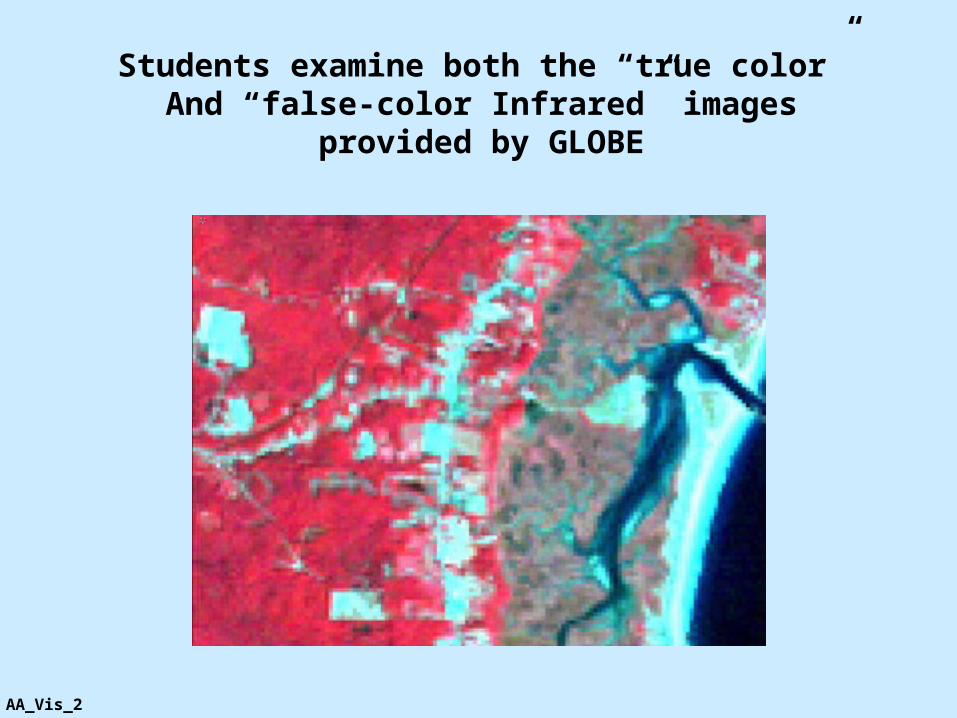
Students examine both the “true color”And “false-color Infrared” images
provided by GLOBE
AA_Vis_2
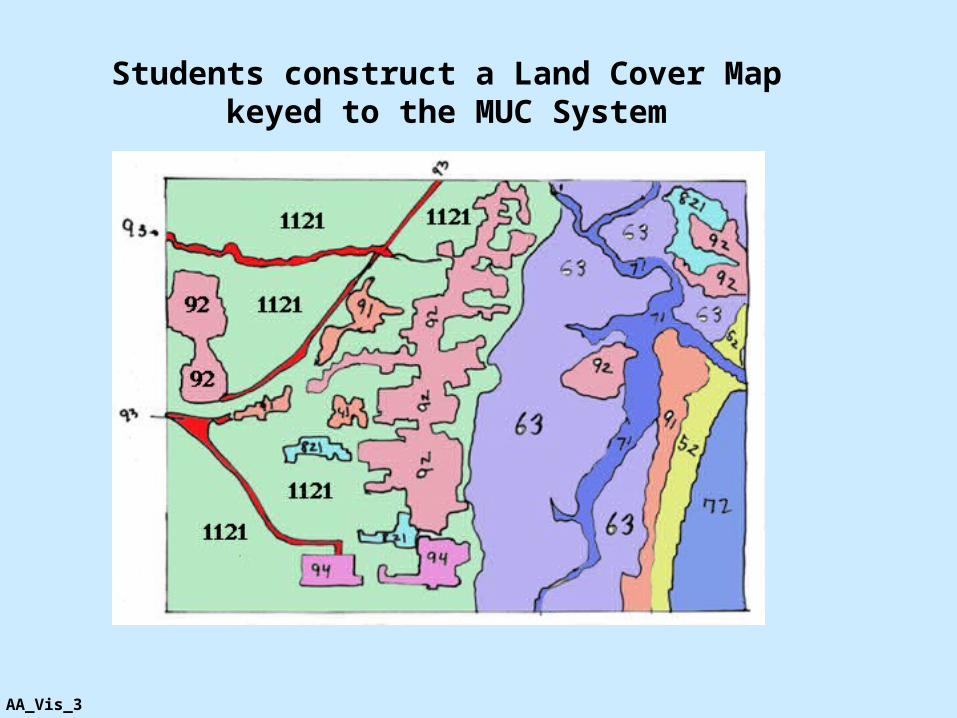
Students construct a Land Cover Mapkeyed to the MUC System
AA_Vis_3
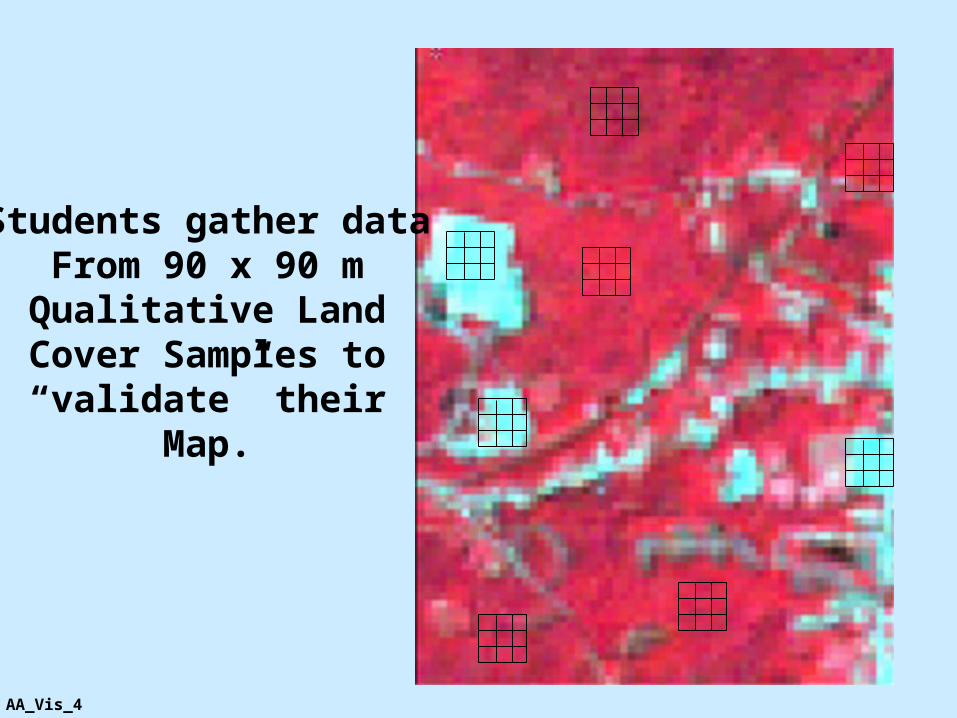
Students gather dataFrom 90 x 90 m
Qualitative LandCover Samples to“validate” their
Map.
AA_Vis_4
1222Site 1
92
Site 2
1121
Site 3
92
Site 4
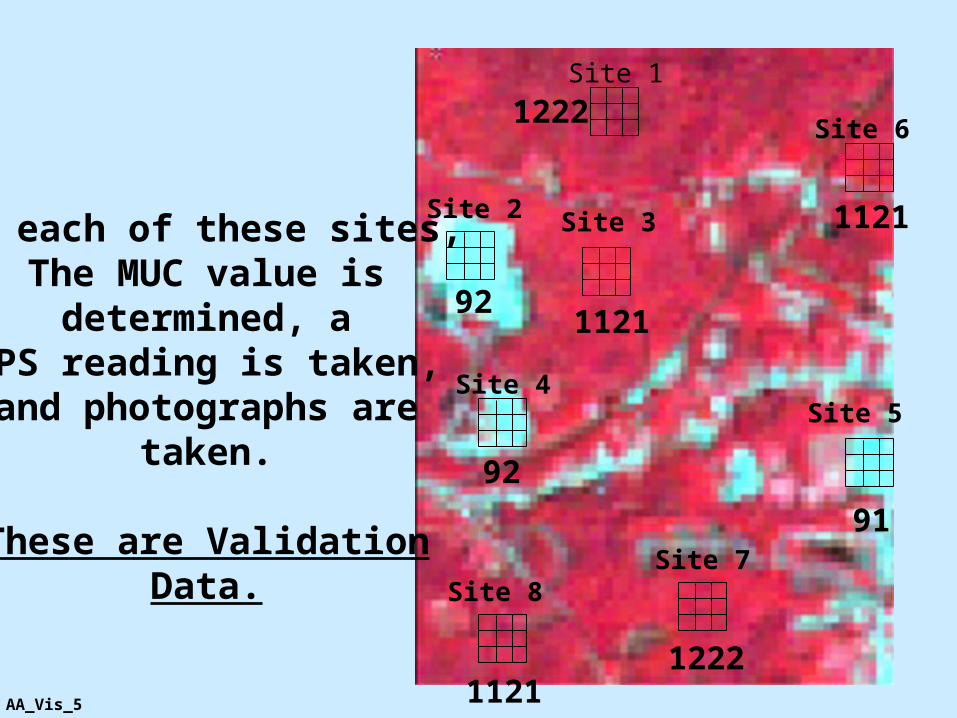
At each of these sites,The MUC value is
determined, aGPS reading is taken,and photographs are
taken.
These are ValidationData.
91
Site 5
1121
Site 6
Site 7
1222
Site 8
1121AA_Vis_5
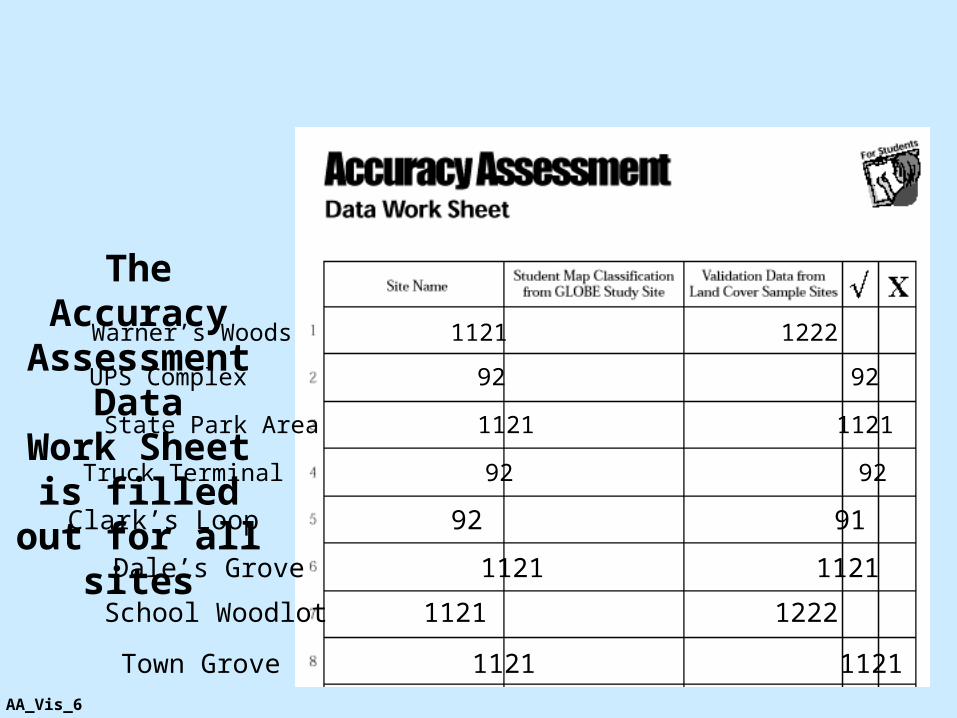
Warner’s Woods 1121 1222 X
UPS Complex 92 92 √
State Park Area 1121 1121 √
Truck Terminal 92 92 √
Clark’s Loop 92 91 X
Dale’s Grove 1121 1121 √
School Woodlot 1121 1222 X
Town Grove 1121 1121 √
The AccuracyAssessment
DataWork Sheet is
filled out for all sites
AA_Vis_6
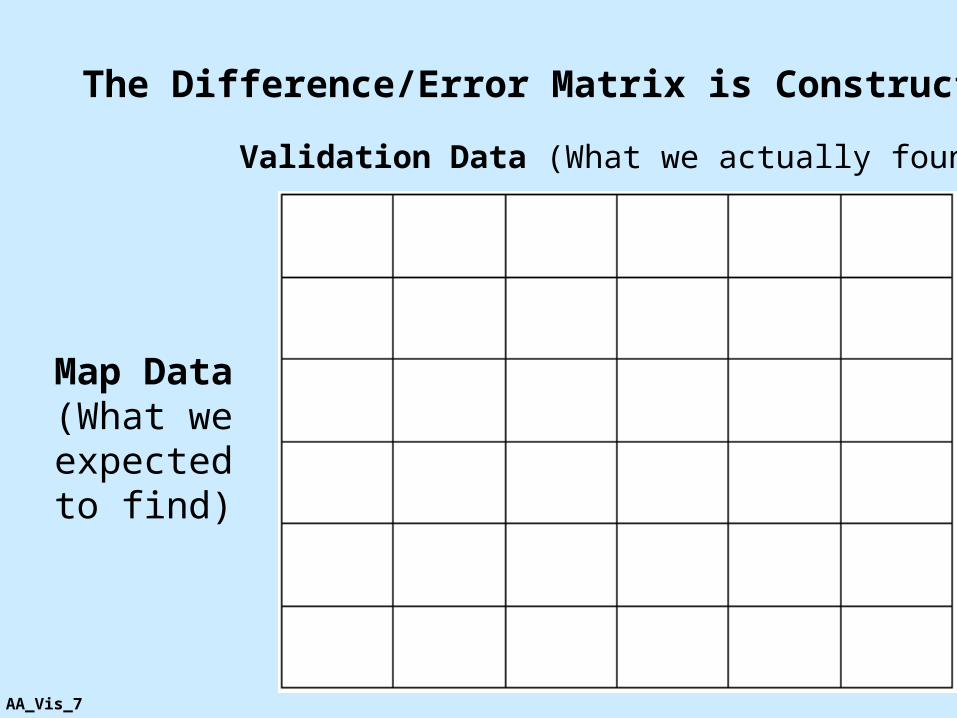
Map Data(What we
expected to find)
Validation Data (What we actually found)
The Difference/Error Matrix is Constructed
AA_Vis_7
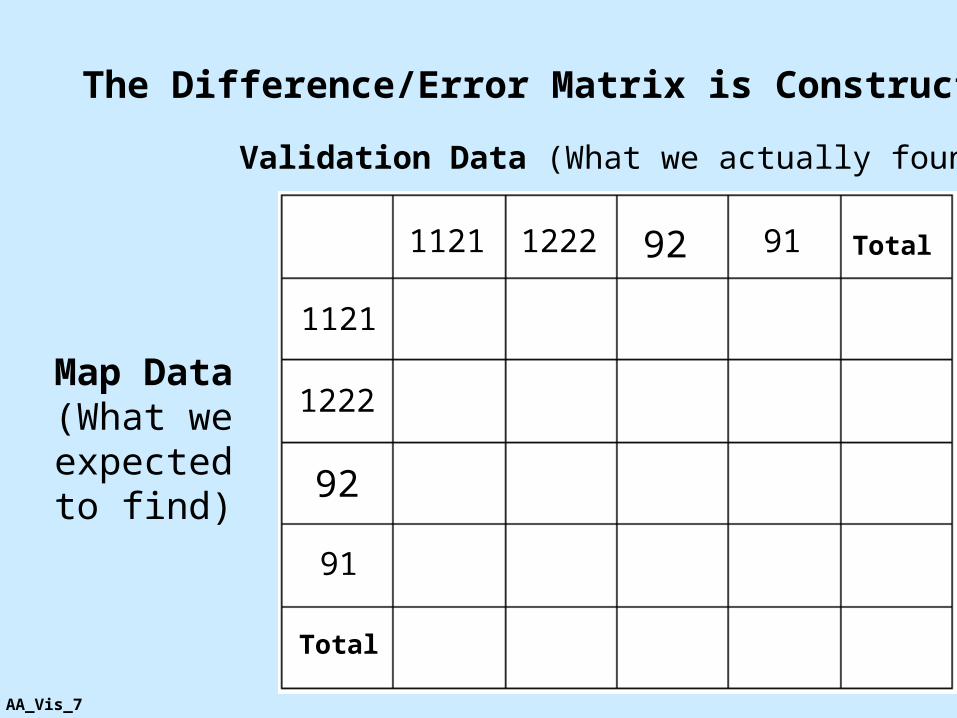
1121
1121
1222
1222
92
92
91
91
Total
Total
Map Data(What we
expected to find)
Validation Data (What we actually found)
The Difference/Error Matrix is Constructed
AA_Vis_7
1121
1121
1222
1222
92
92
91
91
Total
Total
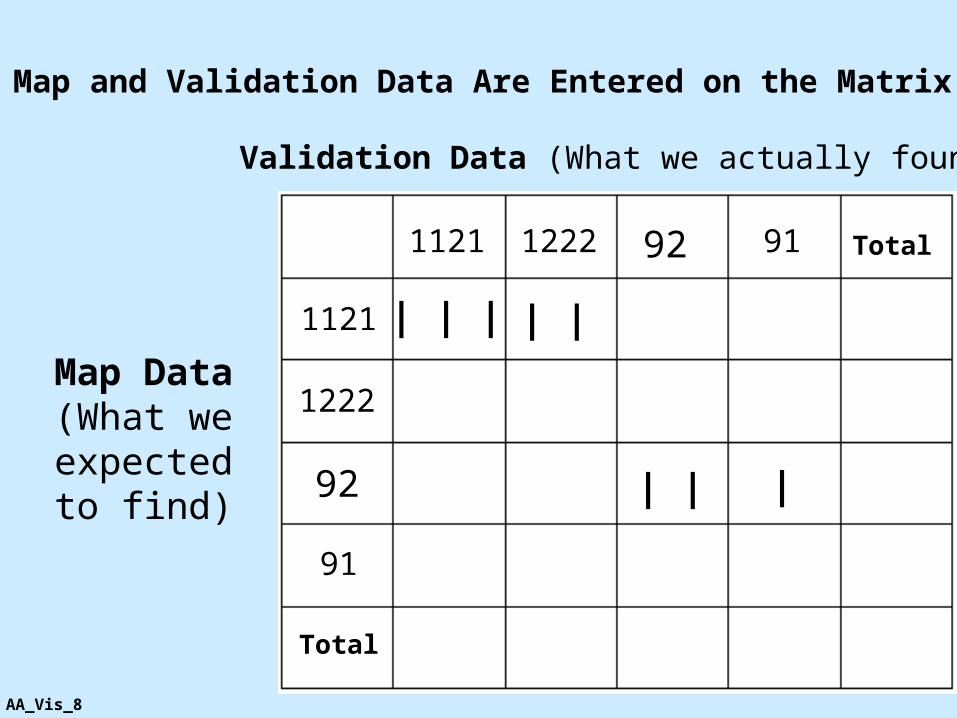
Map Data(What we
expected to find)
Validation Data (What we actually found)
Map and Validation Data Are Entered on the Matrix
| | | | |
| | |
AA_Vis_8
1121
1121
1222
1222
92
92
91
91
Total
Total
Map Data(What we
expected to find)
Validation Data (What we actually found)
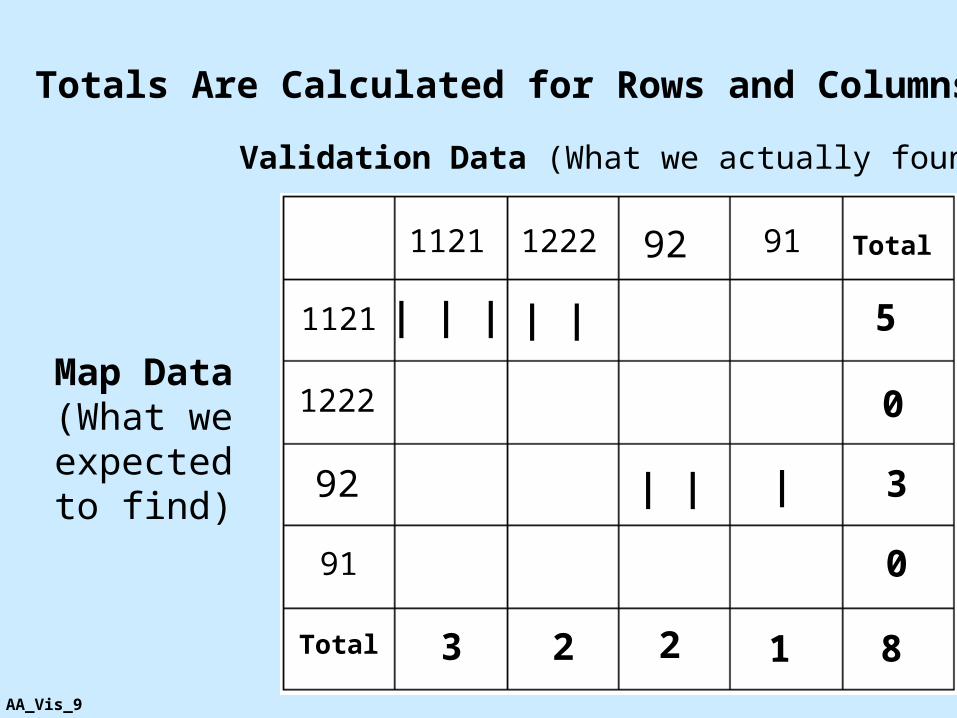
| | | | |
| | |
Totals Are Calculated for Rows and Columns
5
0
3
0
3 2 2 1 8AA_Vis_9
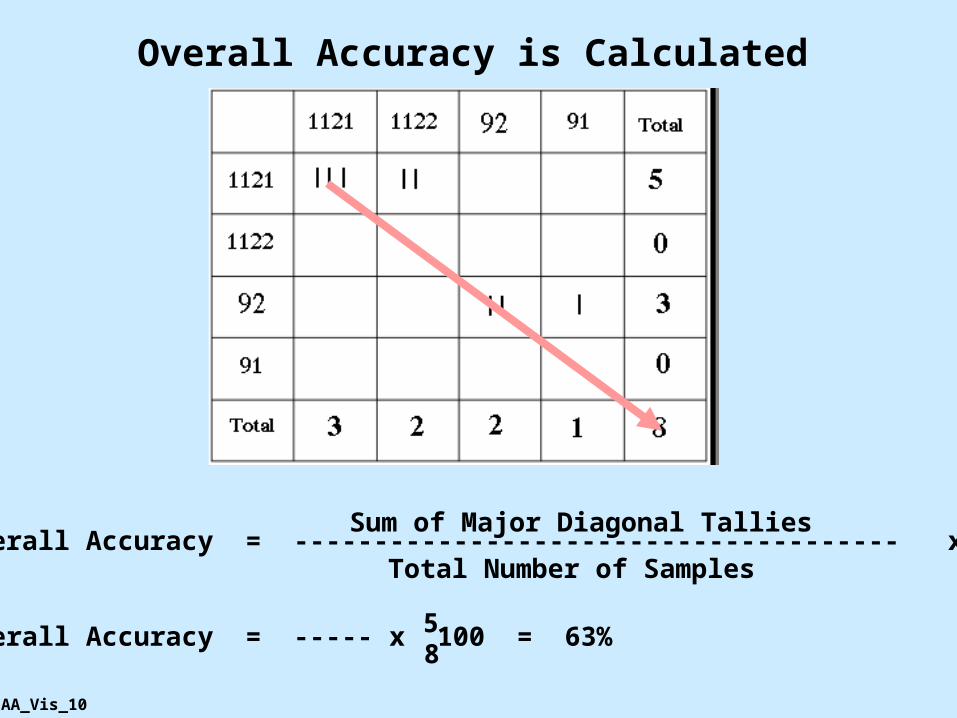
Overall Accuracy is Calculated
Overall Accuracy = -------------------------------------- x 100
Overall Accuracy = ----- x 100 = 63%
Sum of Major Diagonal Tallies
Total Number of Samples
58
AA_Vis_10
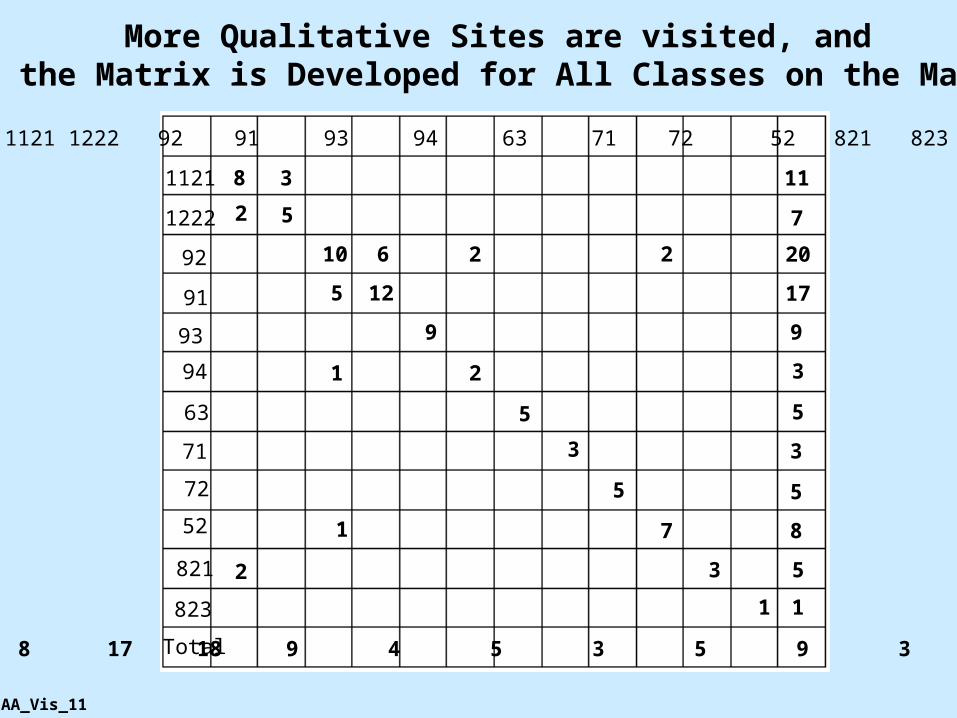
1121 1222 92 91 93 94 63 71 72 52 821 823 Total
1121
1222
92
More Qualitative Sites are visited, andthe Matrix is Developed for All Classes on the Map
91
93
Total
823
821
52
72
71
63
94
8 3
2 5
10 6
5 12
9
2
2
5
3
5
7
2
1
3
1
1
2
12 8 17 18 9 4 5 3 5 9 3 1 94
11
7
20
17
9
3
5
3
5
8
5
1
AA_Vis_11
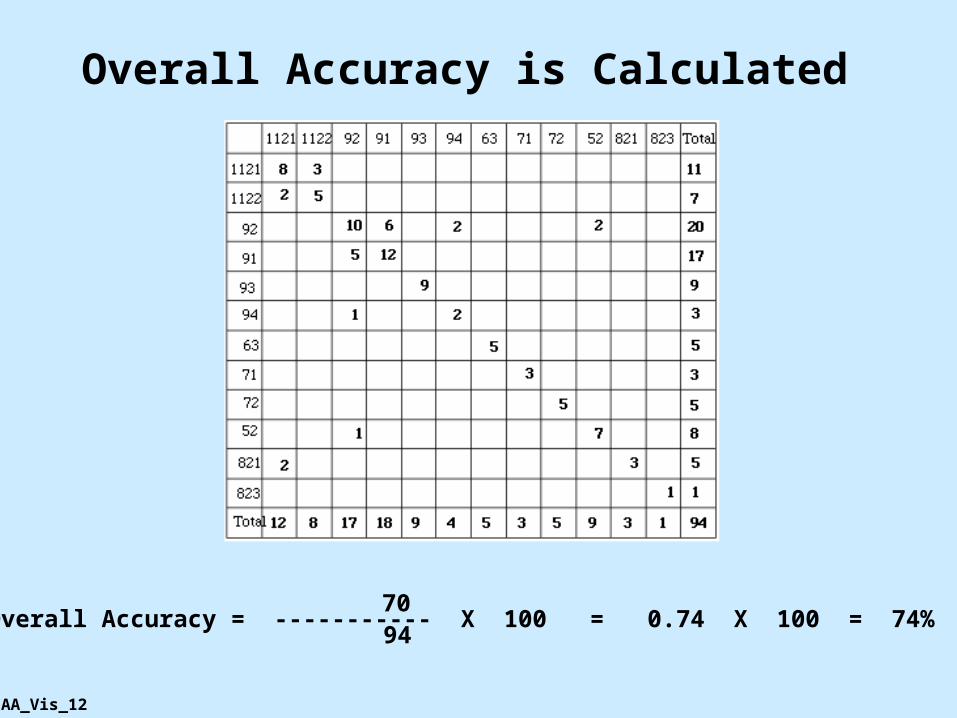
Overall Accuracy is Calculated
Overall Accuracy = ----------- X 100 = 0.74 X 100 = 74%7094
AA_Vis_12
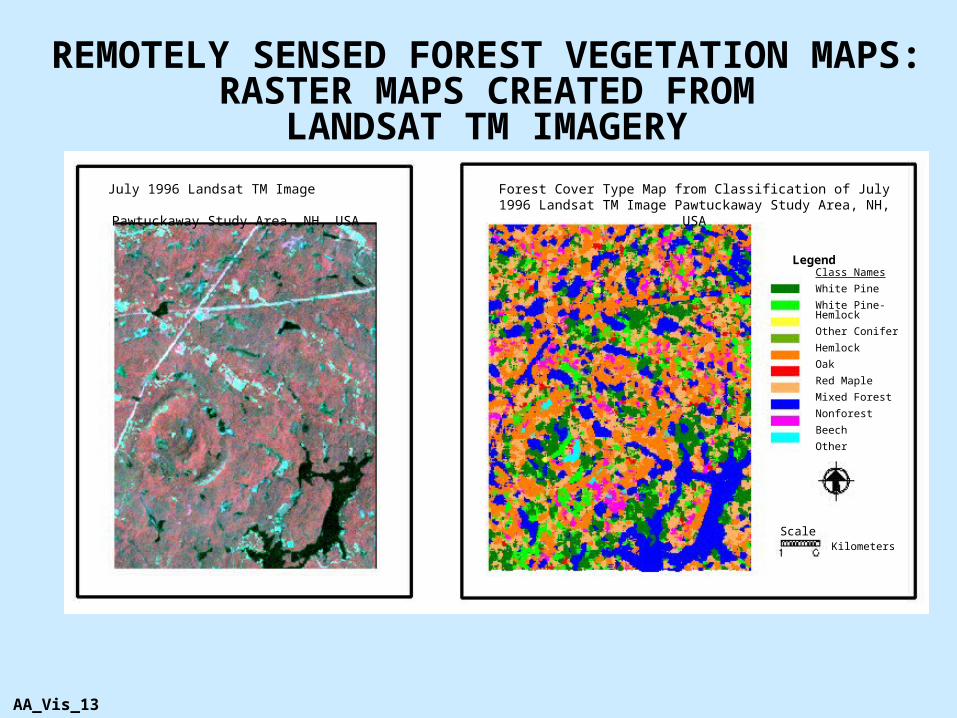
REMOTELY SENSED FOREST VEGETATION MAPS:
RASTER MAPS CREATED FROMLANDSAT TM IMAGERY
July 1996 Landsat TM Image Pawtuckaway Study Area, NH, USA
Forest Cover Type Map from Classification of July 1996 Landsat TM Image Pawtuckaway Study Area, NH, USA
LegendClass Names
White Pine
White Pine-Hemlock
Other Conifer
Hemlock
Oak
Red Maple
Mixed Forest
Nonforest
Beech
Other
ScaleKilometers
AA_Vis_13
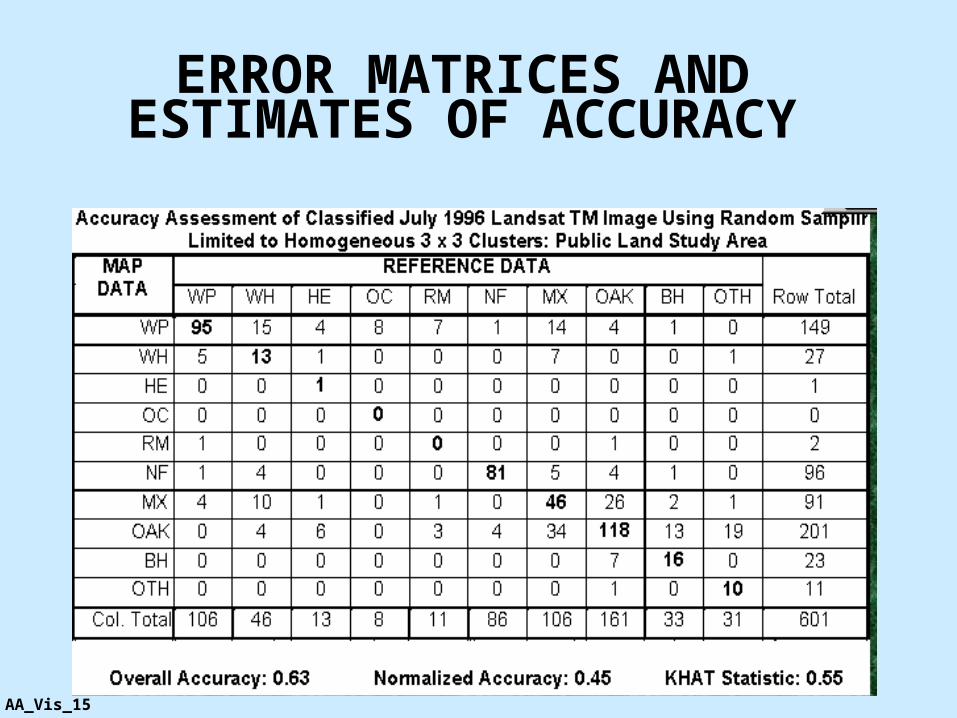
ERROR MATRICES ANDESTIMATES OF ACCURACY
AA_Vis_15