Embed Size (px)
Citation preview
Sustainability Peer Exchange Center for Environmental Excellence by AASHTO Summary Report
Appendices
Attachment A. Peer Exchange Participants
Attachment B. Participant Presentations
Attachment C. Example Sustainability Goals
Attachment D. Example Activities and Metrics
THIS PAGE INTENTIONALLY LEFT BLANK
A-1
Attachment A. Peer Exchange Participants Brian Alberts, Program Coordinator for Multi-State Technical Assistance, AASHTO [email protected]
Victor Austin, Community Planner, Office of Planning and Environment, Federal Transit Administration [email protected]
Marty Baker, Community Planner, Maryland Department of Transportation [email protected]
Thomas Baker, State Materials Engineer, Washington Department of Transportation [email protected]
J. Barry Barker, Executive Director, Transit Authority of River City [email protected]
K. Lynn Berry, Environmental Program Specialist, Federal Highway Administration [email protected]
Allen Biehler, AASHTO President; Secretary, Pennsylvania Department of Transportation [email protected]
Nancy Boyd, Deputy State Design Engineer, Washington Department of Transportation [email protected]
Mike Bruff, Manager, Transportation Planning, North Carolina Department of Transportation [email protected]
John Bukowski, Deputy Director, Office of Pavement Technology, Federal Highway Administration [email protected]
David Carlson, Transportation Conformity Team, Office of Project Development & Environmental Review, Federal Highway Administration [email protected]
Joe Casey, General Manager, Southeastern Pennsylvania Transportation Authority [email protected]
Chris Christopher, Director, Maintenance and Operations, Washington Department of Transportation [email protected]
Shannon Eggleston, Program Director for Environment, Director of Center for Environmental Excellence, AASHTO [email protected]
Gary Farnsworth, Area Manager, Oregon Department of Transportation [email protected]
A-2
Toby Fauver, Deputy Secretary for Local and Area Transportation, Pennsylvania Department of Transportation [email protected]
Damon Fordham, Program Manager for Environment, AASHTO [email protected]
Bill Frey, Bureau Chief, Construction, Illinois Department of Transportation [email protected]
Richard Gabel, Director, Office of Staff Services, Colorado Department of Transportation [email protected]
Steve Gaj, Office of Asset Management, Federal Highway Administration [email protected]
Shayne Gill, Program Manager for Passenger Rail and Aviation, AASHTO [email protected]
Charles Goodman, Director of Systems Planning, Office of Planning and Environment, Federal Transit Administration [email protected]
Don Halligan, Director of the Office of Planning and Capital Programming, Maryland Department of Transportation [email protected]
Connie Hill Galloway, Environmental Protection Specialist, Sustainable Transport and Climate Change Team, Federal Highway Administration [email protected]
Tina Hodges, Program Analyst, Office of Budget and Policy, Federal Transit Administration [email protected]
Matthew R. Hughes, Interim Bureau Chief of Personnel Management, Illinois Department of Transportation [email protected]
Denise W. King, Environmental Specialist, Federal Highway Administration – DelMar Division [email protected]
Margi Lifsey, Program Manager, Sustainability, Oregon Department of Transportation [email protected]
Lacy Love, Director, Asset Management, North Carolina Department of Transportation [email protected]
Tracey MacDonald, Statewide Planning Unit Manager, Colorado Department of Transportation [email protected]
Michelle Maggiore, Program Director for Planning and Policy, AASHTO [email protected]
A-3
Kate Mattice, Chief of Policy Review and Development, Office of Budget and Policy, Federal Transit Administration [email protected]
Jim McDonnell, Deputy Program Director for Engineering, AASHTO [email protected]
Gary R. McVoy, Director, Operations Division, New York Department of Transportation [email protected]
William Millar, American Public Transportation Association President [email protected]
Tim Neuman, Chief Highway Engineer, CH2M HILL [email protected]
Alicia Nolan, Federal Highway Administration – New York Division [email protected]
F. Yates Oppermann, Environmental Planner, Division of Transportation Development, Colorado Department of Transportation [email protected]
Kirsten Pennington, Regional Sustainability Manager, CH2M HILL [email protected]
Dante Perez-Bravo, Engineer, CH2M HILL [email protected]
Miriam Perry, Director, Public Transportation, North Carolina Department of Transportation [email protected]
Bill Petit, District Executive, District 1-0, Pennsylvania Department of Transportation [email protected]
Joshua Proudfoot, Principal, Good Company [email protected]
Robert Ritter, Team Leader – Federal Highway Administration [email protected]
Rodger Rochelle, Director, Transportation Program Management Unit, North Carolina Department of Transportation [email protected]
Sonal Sanghavi, Director, Office of Environmental Design, Maryland Department of Transportation [email protected]
Shari Schaftlein, Program/Policy Development Team Leader, Office of Project Development & Environmental Review, Federal Highway Administration [email protected]
Sam Seskin, Global Director of Transportation Planning, CH2M HILL [email protected]
A-4
Gloria Shepherd, Associate Administrator for Planning, Environment, and Realty, Federal Highway Administration [email protected]
Joshua Skov, Principal, Good Company [email protected]
Greg Slater, Director, Office of Planning and Preliminary Engineering, Maryland State Highway Administration, Maryland Department of Transportation [email protected]
Danielle Spila, Policy Director, Pennsylvania Department of Transportation [email protected]
John Sprowls, Community Planner, Office of Planning and Environment, Federal Transit Administration [email protected]
Jerry Stevenson, Federal Highway Administration – Illinois Division [email protected]
Scott Stitt, Acting Section Chief of Policies and Procedures, Illinois Department of Transportation [email protected]
Lori L. Sundstrom, Senior Program Officer, Transportation Research Board [email protected]
Karyn Vandervoort, Federal Highway Administration – Pennsylvania Division [email protected]
Aaron Weatherholt, Acting Bureau Chief, Operations, Illinois Department of Transportation [email protected]
Rich Weaver, Senior Program Manager- Planning and Programs [email protected]
Lynn Weiskopf, Director, Statewide Policy Development Bureau, New York Department of Transportation [email protected]
Megan White, Director, Environmental Services, Washington Department of Transportation [email protected]
Chris Woods, Federal Highway Administration – Oregon Division [email protected]
Jim Zufall, Section Manager, Materials and Geotechnical, Colorado Department of Transportation [email protected]

B-1
Attachment B. Participant Presentations
1
BLOCK
A Brief Introduction to Sustainabilityat AASHTO’s Sustainability Peer Exchange
Opening Remarks
Washington, DCMay 28, 2009
Joshua SkovGood Company
Eugene, OR
Overview
• Objectives of the gathering
• What is sustainability? And why?
2
Objectives of the gathering
• Hear a variety of DOT perspectives, experiences
• Breakout sessions– Best Practices: find out who’s doing what, identify
barriers/pitfalls and what is needed to go farther
– Defining and Communicating: define sustainability, discuss issues of communication and culture
– Measuring and Tracking Success: discuss key measures and elements to measure, mechanisms for accountability and ensuring performance
• Final discussion– Report back
– Brainstorm goals
– Integrate cross-cutting insights
What is sustainability?
• Definition: Meeting the needs of the present generation without compromising the ability of future generations to meet their needs.
• Definition: Simultaneously addressing social, economic, and environmental needs and constraints (“triple bottom line”).
• 4,000,000 other possibilities in Google
3
…and why?• But why “sustainability” as a buzzword?
– Not just “environment”, a word we know?
– Not just BMPs, a concept we’re familiar with?
• What is special about right now?– New “environmental” challenges related to human
needs (e.g., climate change)
– Transformation of the energy economy
– Big human changes (e.g., aging population)
Feel free to contact me:
Joshua Skov
(541) 341-GOOD (4663), ext. 211
Thank you!
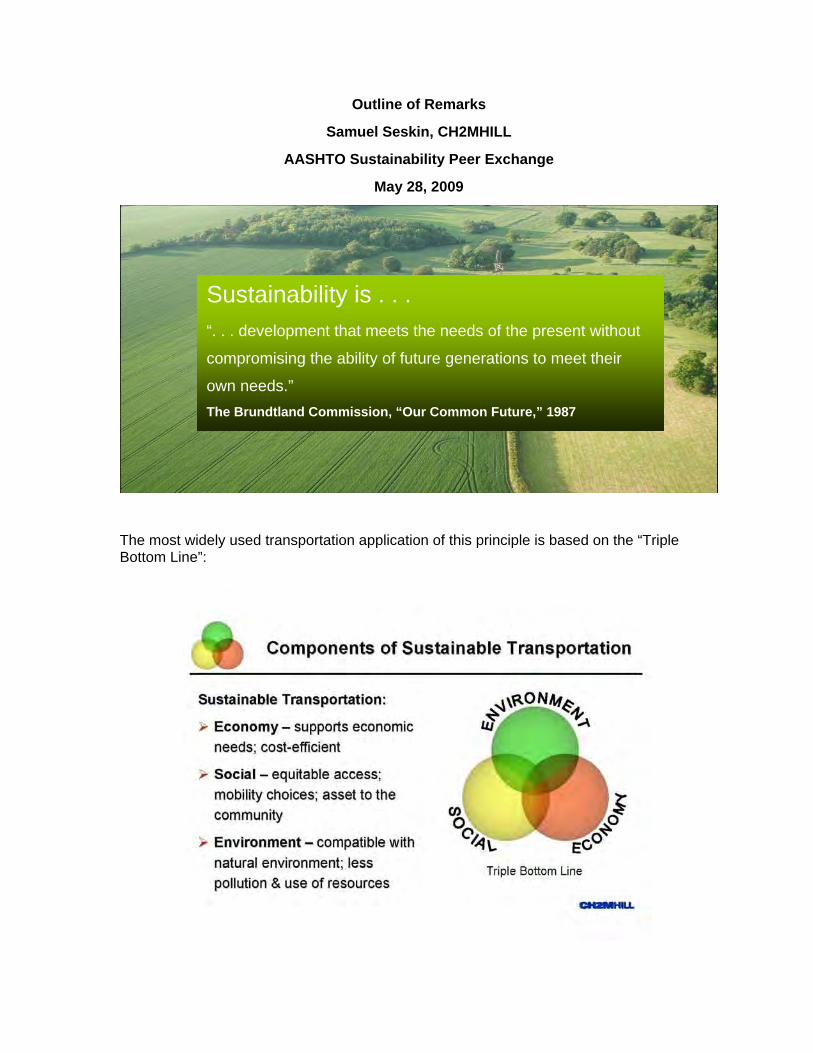
Outline of Remarks
Samuel Seskin, CH2MHILL
AASHTO Sustainability Peer Exchange
May 28, 2009
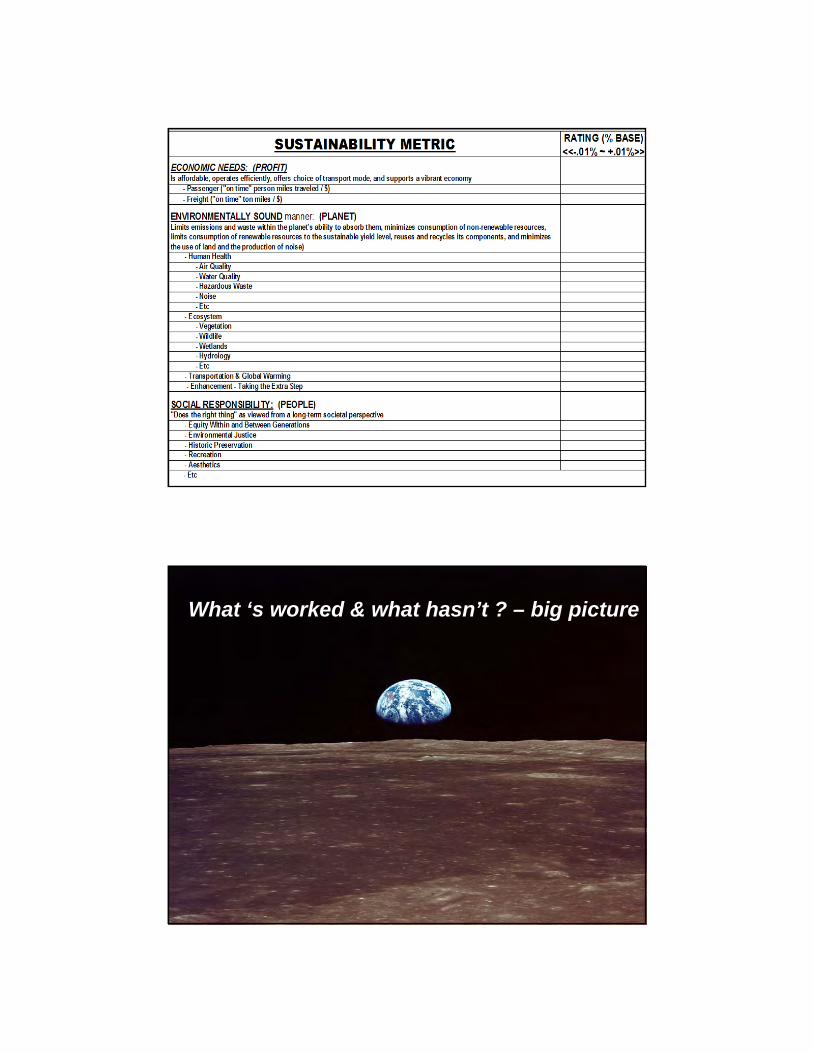
The most widely used transportation application of this principle is based on the “Triple Bottom Line”:
Sustainability is . . .
“. . . development that meets the needs of the present without
compromising the ability of future generations to meet their
own needs.”
The Brundtland Commission, “Our Common Future,” 1987
The comments that follow are based on the application of this concept to our work in transportation.
1. Transportation agencies provide goods and services that would not be fully provided in a pure free-market system, and therefore are largely provided by government. Roadways and related services generate benefits for everyone, in the form of mobility and access.
2. They also generate costs, for example pollution and noise, which are not in any one individual’s self interest to pay. Just as government has a responsibility to provide the goods, it has a corresponding responsibility to mitigate the costs. Otherwise these costs pass on to future generations, violating the central principle of stewardship and sustainability.
3. Estimates of these costs range in the hundreds of billions of dollars annually in the United States. (“The Social Costs of Motor Vehicle Use”, Mark A. Delucchi, University of California at Davis, Paper UCD-ITS-RP-97-12, 1997)
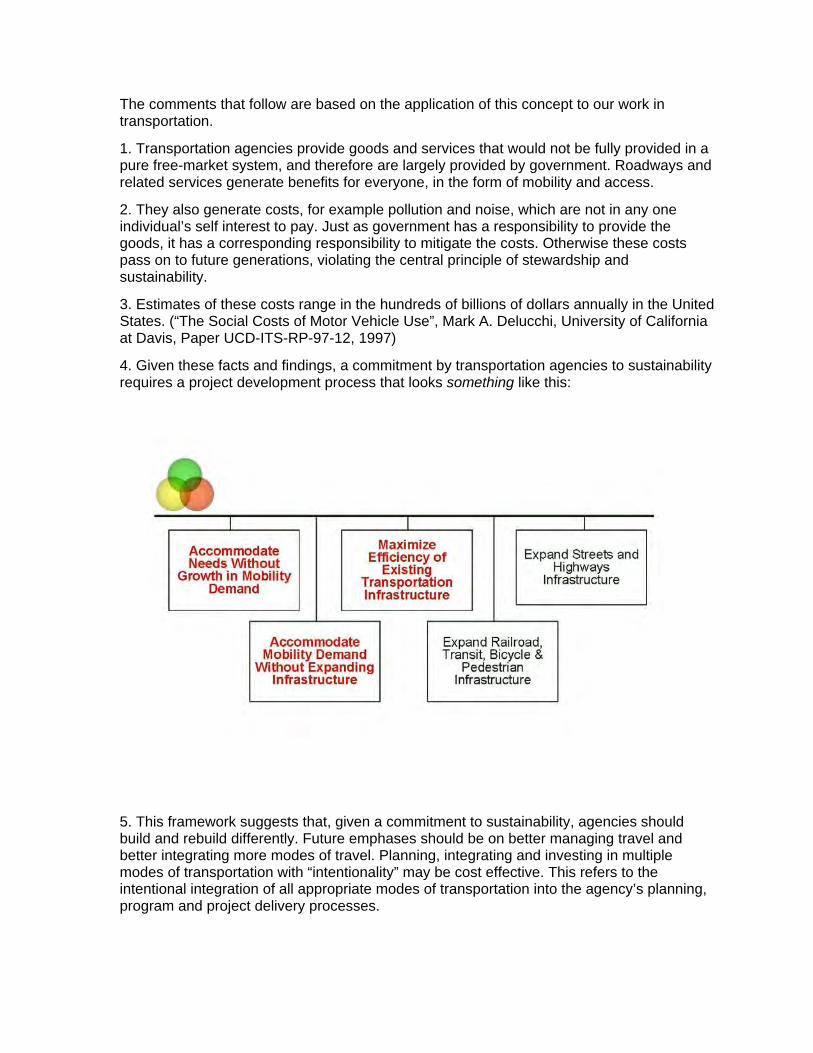
4. Given these facts and findings, a commitment by transportation agencies to sustainability requires a project development process that looks something like this:
5. This framework suggests that, given a commitment to sustainability, agencies should build and rebuild differently. Future emphases should be on better managing travel and better integrating more modes of travel. Planning, integrating and investing in multiple modes of transportation with “intentionality” may be cost effective. This refers to the intentional integration of all appropriate modes of transportation into the agency’s planning, program and project delivery processes.
6. A commitment to the principle of economic sustainability will require agencies to look more broadly at the value of transportation investments. “Value” refers both to current and future costs and benefits, using life cycle analysis techniques. Federal and other tools and methods exist to support this kind of decision making process. One such method is “Least Cost Planning”. (“Least Cost Planning: Principles, Applications and Issues, FHWA, 1995) Ample data exist to use this kind of analysis. Based on such analysis, managing demand in many circumstances may be more cost effective than increasing the supply of transportation.
7. A commitment to economic sustainability also will require examination of the way we pay for transportation programs and services. Since roadway transportation is largely a public good, more advanced user-pay approaches best suit our need to manage auto use sustainably. On the other hand, public transportation might be financed best through broad based taxes.
8. A commitment to social and environmental sustainability will require continued integration of a context-sensitive solutions approach to project development. This approach is designed to identify key stakeholder issues, typically related to social and/or environmental values. Attention to preserving or enhancing these values helps assure achievement of these elements of the Triple Bottom Line.
9. In summary, as representatives of an agency of government, your bottom line is everyone’s bottom line. Any type of management, accounting or decision process that falls short of meeting this standard may also fall short of meeting the Triple Bottom Line principle of sustainability. The challenge is to innovate, and to share innovations through peer exchanges such as this.
1
BLOCK
Sustainability:Program Development
May 28th, 2009
Joshua ProudfootGood Company
Eugene, OR
program elements
• management / governance• assessment / performance measures• planning • education• initiatives
2
management / governance
• executives• councils• managers
program
assessment / performance measurement
• audience & purpose• qualitative - “state of”
– policies / procedures– responsible parties
• quantitative - “how much of?”– footprinting
• data - available vs. perfect
program
3
planning
• goals• timeframes• strategies• roles
program
education
• big picture• for their role• suggestion box• cross pollination
program
4
initiatives
• by focus areas• momentum building• highest leverage• most important• direct control and shared control
program
Feel free to contact me:
Joshua Proudfoot
(541) 341-GOOD (4663), ext. 213
Thank you!
1
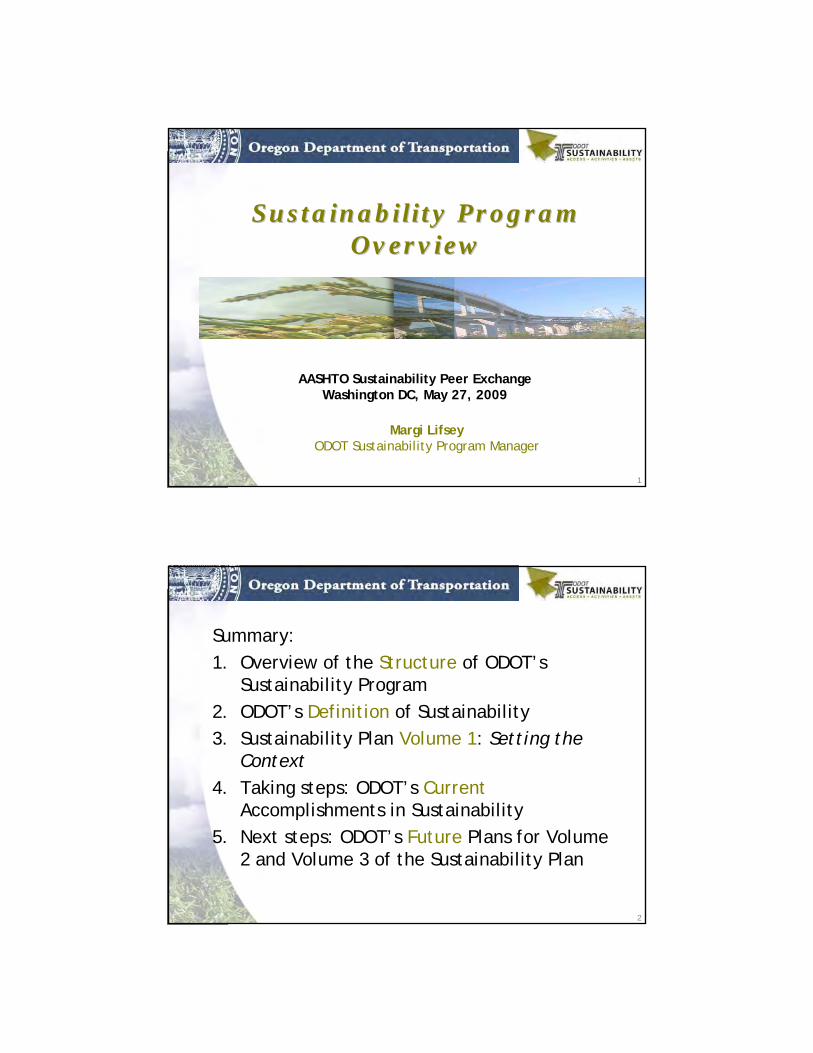
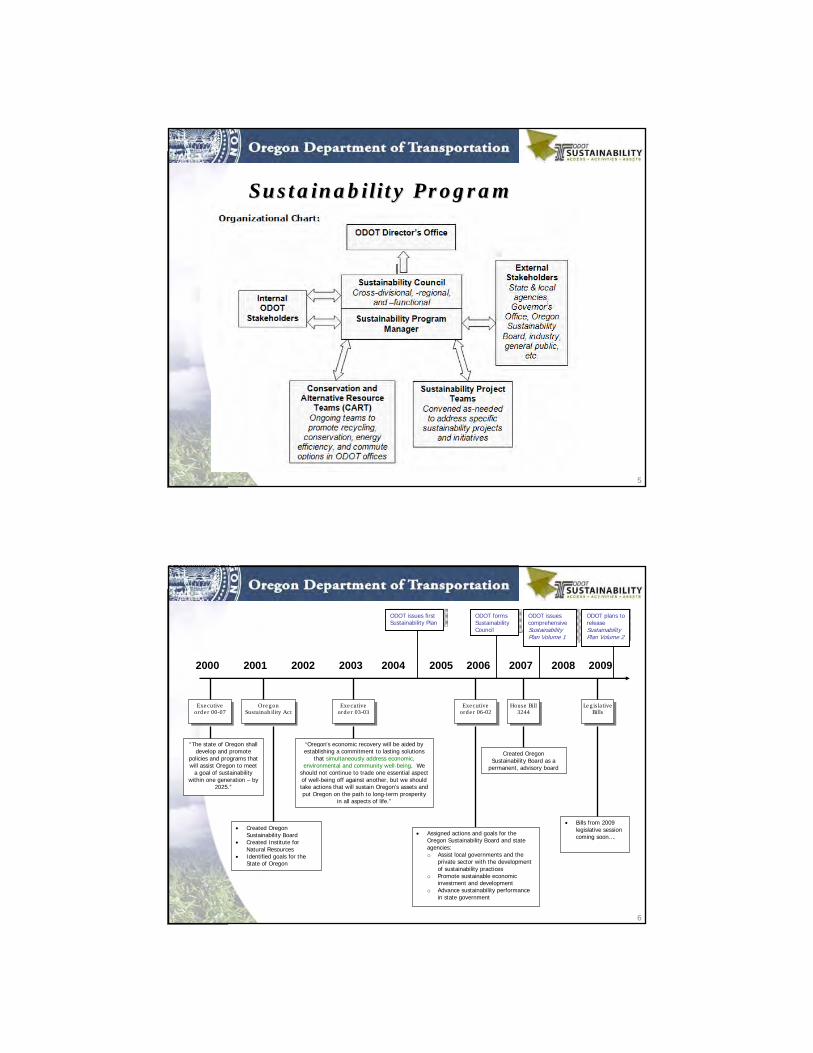
Sustainability Program Sustainability Program OverviewOverview
Margi LifseyODOT Sustainability Program Manager
AASHTO Sustainability Peer ExchangeWashington DC, May 27, 2009
2
Summary:1. Overview of the Structure of ODOT’s
Sustainability Program2. ODOT’s Definition of Sustainability 3. Sustainability Plan Volume 1: Setting the
Context4. Taking steps: ODOT’s Current
Accomplishments in Sustainability5. Next steps: ODOT’s Future Plans for Volume
2 and Volume 3 of the Sustainability Plan
3
4
5
Sustainability ProgramSustainability Program
6
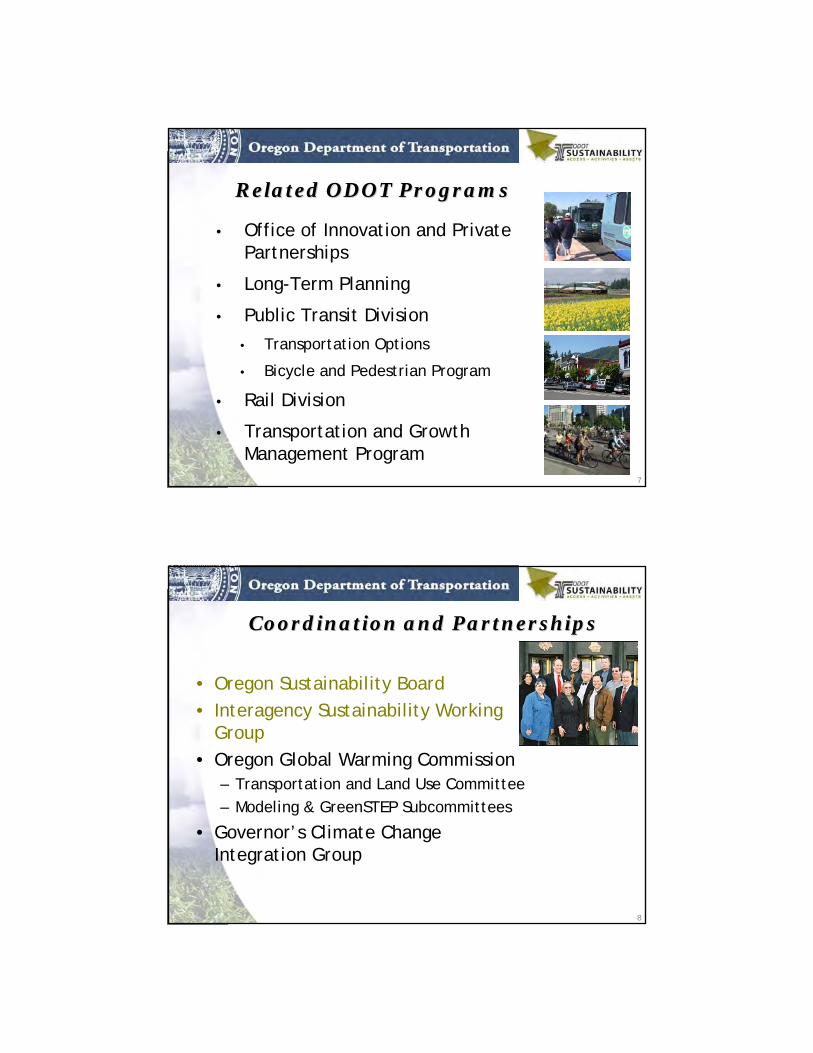
Exe cutive orde r 00-07
Ore gon Sustainab ility Act
Exe cutive orde r 03-03
“The state of Oregon shall develop and promote
policies and programs that will assist Oregon to meet
a goal of sustainability within one generation – by
2025.”
• Created Oregon Sustainability Board
• Created Institute for Natural Resources
• Identified goals for the State of Oregon
“Oregon's economic recovery will be aided by establishing a commitment to lasting solutions
that simultaneously address economic, environmental and community well-being. We
should not continue to trade one essential aspect of well-being off against another, but we should take actions that will sustain Oregon's assets and put Oregon on the path to long-term prosperity
in all aspects of life.”
2000 2001 2003 2006 2007
Exe cutive ord e r 06-02
House Bill 3244
2009
Le g islative Bills
• Assigned actions and goals for the Oregon Sustainability Board and state agencies: o Assist local governments and the
private sector with the development of sustainability practices
o Promote sustainable economic investment and development
o Advance sustainability performance in state government
Created Oregon Sustainability Board as a
permanent, advisory board
• Bills from 2009 legislative session coming soon….
ODOT issues comprehensive Sustainability Plan Volume 1
ODOT issues first Sustainability Plan
ODOT forms Sustainability Council
ODOT plans to release Sustainability Plan Volume 2
2002 2004 2005 2008
7
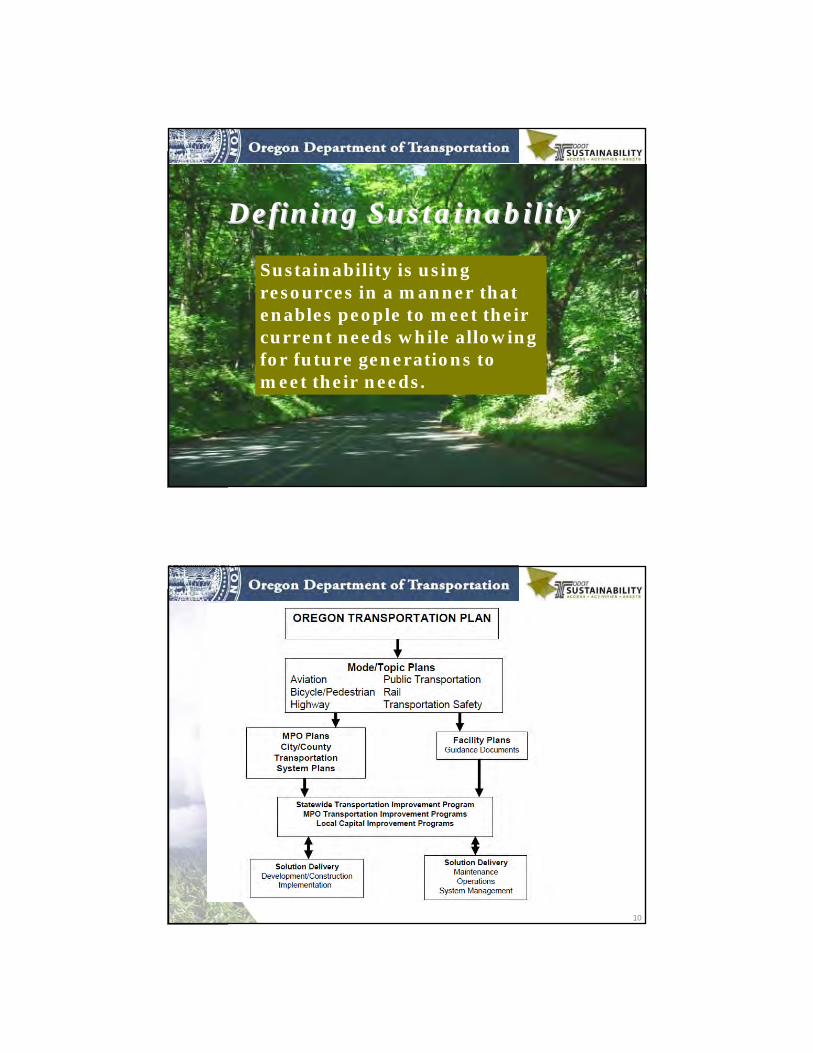
Related ODOT ProgramsRelated ODOT Programs
• Office of Innovation and Private Partnerships
• Long-Term Planning
• Public Transit Division
• Transportation Options
• Bicycle and Pedestrian Program
• Rail Division
• Transportation and Growth Management Program
8
Coordination and PartnershipsCoordination and Partnerships
• Oregon Sustainability Board• Interagency Sustainability Working
Group• Oregon Global Warming Commission
– Transportation and Land Use Committee– Modeling & GreenSTEP Subcommittees
• Governor’s Climate Change Integration Group
9
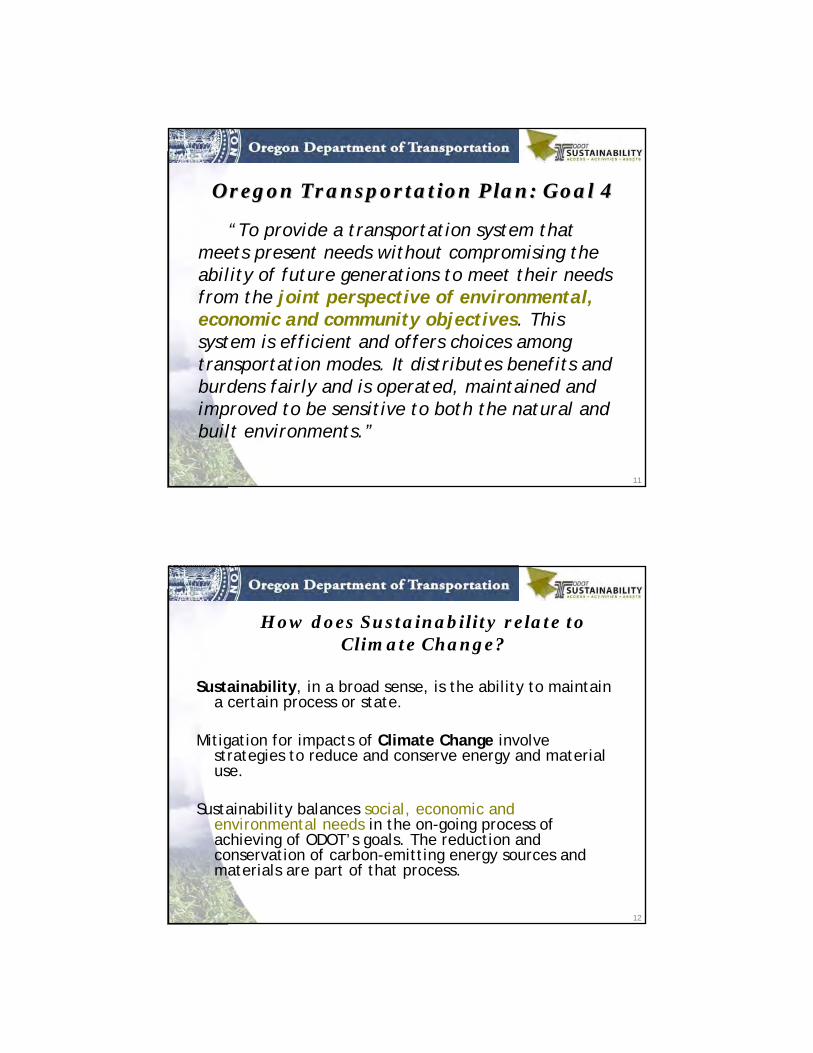
Defining SustainabilityDefining Sustainability
Sustainability is using resources in a manner that enables people to meet their current needs while allowing for future generations to meet their needs.
10
11
Oregon Transportation Plan: Goal 4Oregon Transportation Plan: Goal 4
“To provide a transportation system that meets present needs without compromising the ability of future generations to meet their needs from the joint perspective of environmental, economic and community objectives. This system is efficient and offers choices among transportation modes. It distributes benefits and burdens fairly and is operated, maintained and improved to be sensitive to both the natural and built environments.”
12
How does Sustainability relate to Climate Change?
Sustainability, in a broad sense, is the ability to maintain a certain process or state.
Mitigation for impacts of Climate Change involve strategies to reduce and conserve energy and material use.
Sustainability balances social, economic and environmental needs in the on-going process of achieving of ODOT’s goals. The reduction and conservation of carbon-emitting energy sources and materials are part of that process.
13
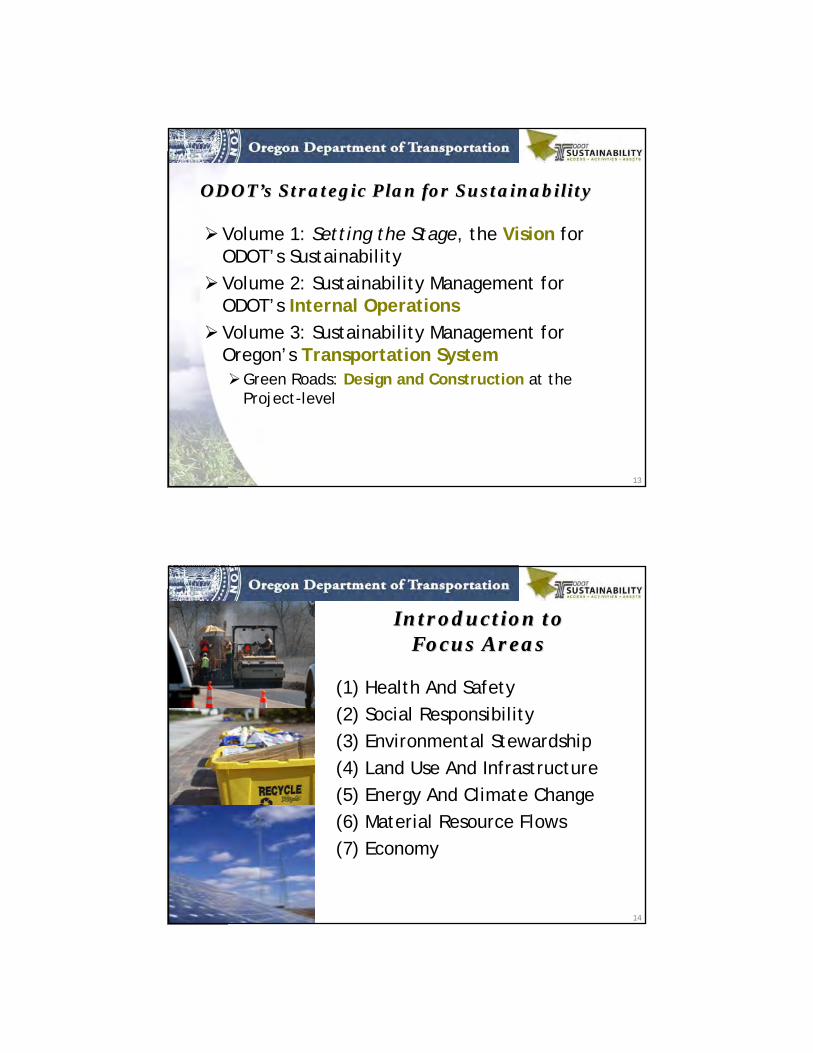
ODOTODOT’’s Strategic Plan for Sustainabilitys Strategic Plan for Sustainability
Volume 1: Setting the Stage, the Vision for ODOT’s SustainabilityVolume 2: Sustainability Management for ODOT’s Internal OperationsVolume 3: Sustainability Management for Oregon’s Transportation System
Green Roads: Design and Construction at the Project-level
14
Introduction to Introduction to Focus AreasFocus Areas
(1) Health And Safety(2) Social Responsibility(3) Environmental Stewardship(4) Land Use And Infrastructure(5) Energy And Climate Change(6) Material Resource Flows(7) Economy
15
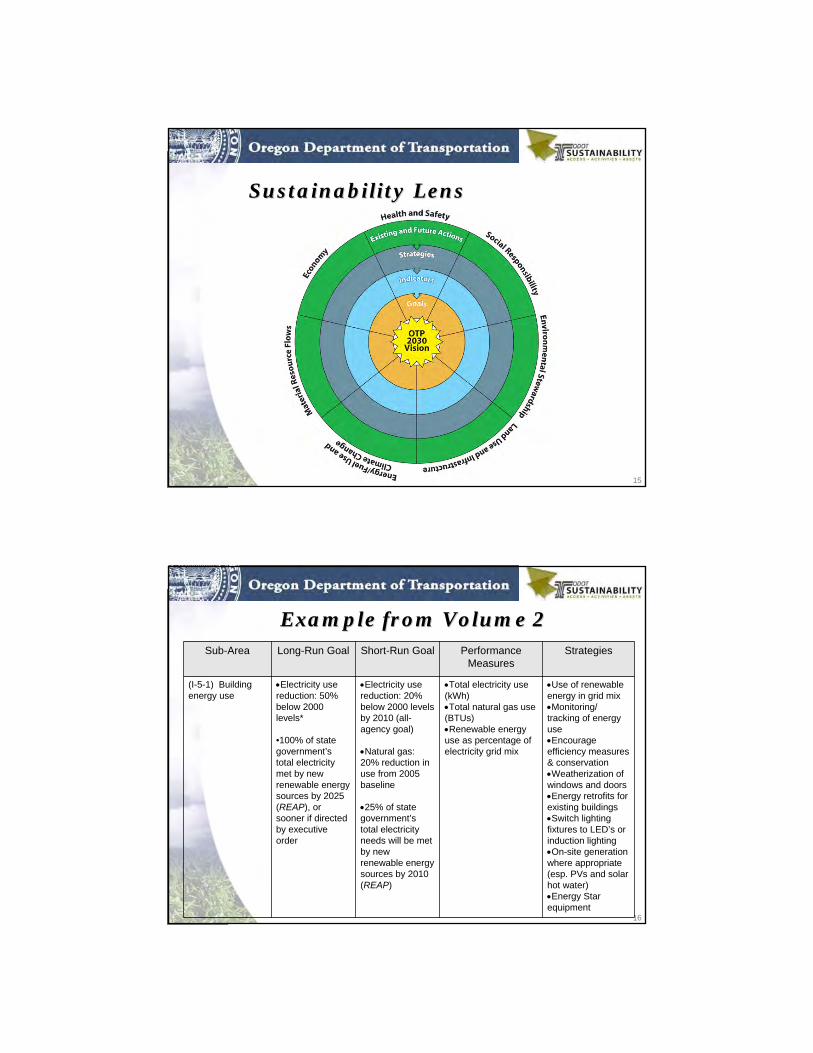
Sustainability LensSustainability Lens
16
Example from Volume 2Example from Volume 2Sub-Area Long-Run Goal Short-Run Goal Performance
MeasuresStrategies
(I-5-1) Building energy use
•Electricity use reduction: 50% below 2000 levels*
•100% of state government’s total electricity met by new renewable energy sources by 2025 (REAP), or sooner if directed by executive order
•Electricity use reduction: 20% below 2000 levels by 2010 (all-agency goal)
•Natural gas: 20% reduction in use from 2005 baseline
•25% of state government’s total electricity needs will be met by new renewable energy sources by 2010 (REAP)
•Total electricity use (kWh)•Total natural gas use (BTUs)•Renewable energy use as percentage of electricity grid mix
•Use of renewable energy in grid mix•Monitoring/ tracking of energy use •Encourage efficiency measures & conservation•Weatherization of windows and doors•Energy retrofits for existing buildings•Switch lighting fixtures to LED’s or induction lighting•On-site generation where appropriate (esp. PVs and solar hot water)•Energy Star equipment
17
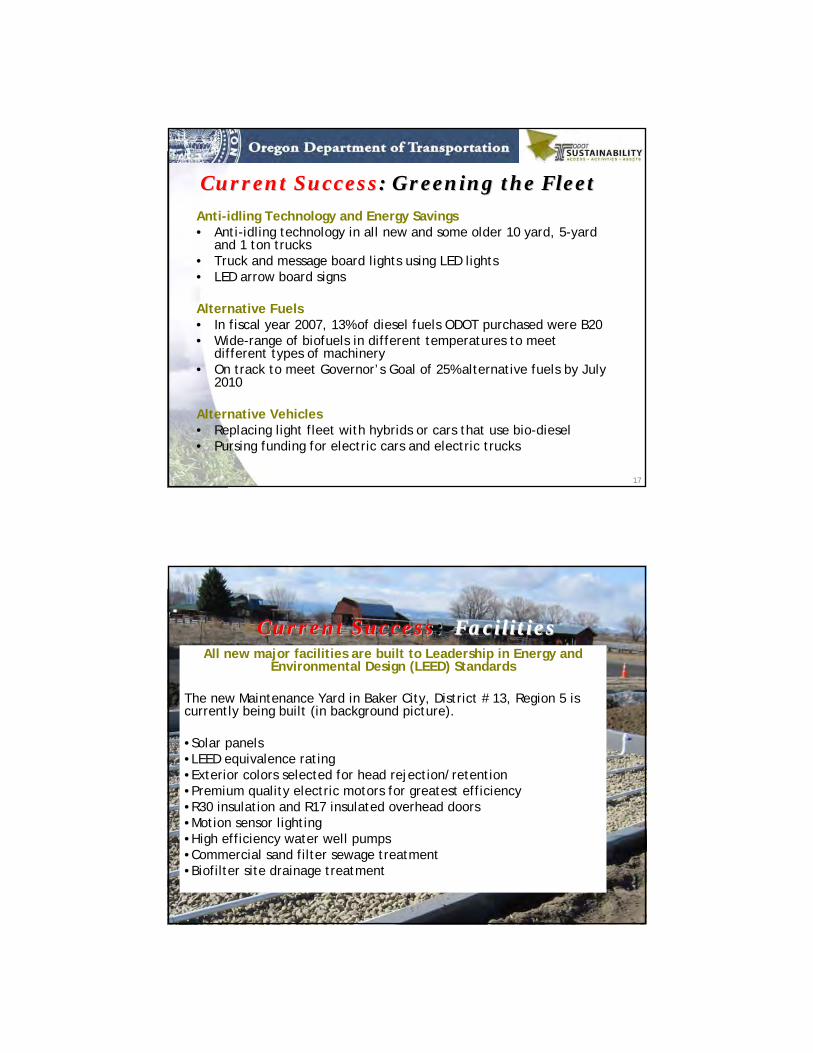
Current SuccessCurrent Success: Greening the Fleet: Greening the Fleet
Anti-idling Technology and Energy Savings• Anti-idling technology in all new and some older 10 yard, 5-yard
and 1 ton trucks• Truck and message board lights using LED lights• LED arrow board signs
Alternative Fuels• In fiscal year 2007, 13% of diesel fuels ODOT purchased were B20• Wide-range of biofuels in different temperatures to meet
different types of machinery• On track to meet Governor’s Goal of 25% alternative fuels by July
2010
Alternative Vehicles• Replacing light fleet with hybrids or cars that use bio-diesel• Pursing funding for electric cars and electric trucks
18
Current SuccessCurrent Success: : FacilitiesFacilitiesAll new major facilities are built to Leadership in Energy and
Environmental Design (LEED) Standards
The new Maintenance Yard in Baker City, District # 13, Region 5 is currently being built (in background picture).
•Solar panels•LEED equivalence rating•Exterior colors selected for head rejection/retention•Premium quality electric motors for greatest efficiency•R30 insulation and R17 insulated overhead doors•Motion sensor lighting•High efficiency water well pumps•Commercial sand filter sewage treatment•Biofilter site drainage treatment
19
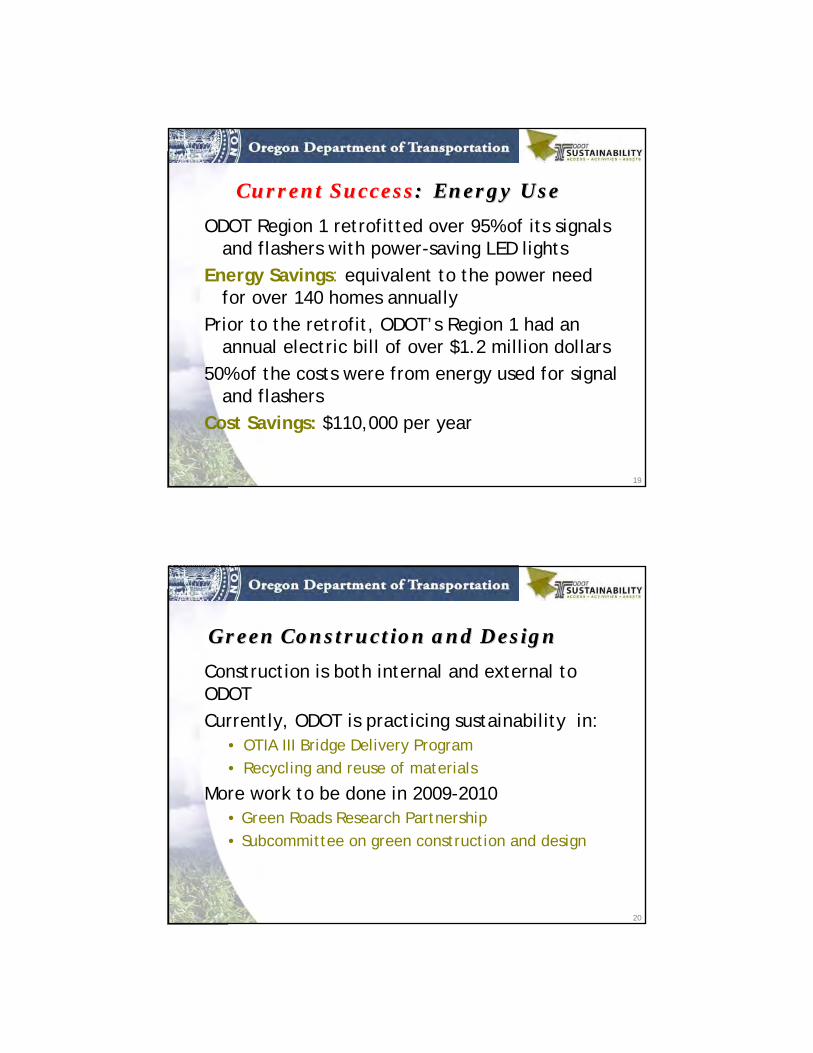
Current SuccessCurrent Success: Energy Use: Energy Use
ODOT Region 1 retrofitted over 95% of its signals and flashers with power-saving LED lights
Energy Savings: equivalent to the power need for over 140 homes annually
Prior to the retrofit, ODOT’s Region 1 had an annual electric bill of over $1.2 million dollars
50% of the costs were from energy used for signal and flashers
Cost Savings: $110,000 per year
20
Green Construction and DesignGreen Construction and Design
Construction is both internal and external to ODOTCurrently, ODOT is practicing sustainability in:
• OTIA III Bridge Delivery Program• Recycling and reuse of materials
More work to be done in 2009-2010• Green Roads Research Partnership• Subcommittee on green construction and design
21
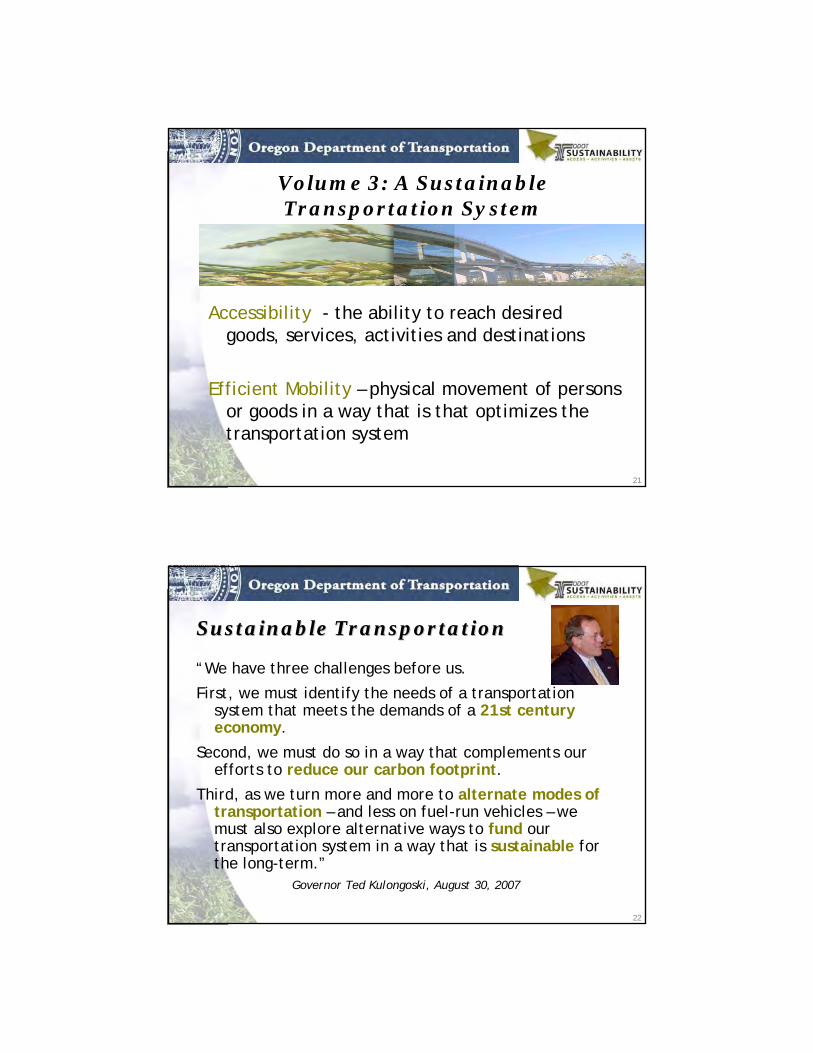
Volume 3: A Sustainable Transportation System
Accessibility - the ability to reach desired goods, services, activities and destinations
Efficient Mobility – physical movement of persons or goods in a way that is that optimizes the transportation system
22
Sustainable TransportationSustainable Transportation
“We have three challenges before us.
First, we must identify the needs of a transportation system that meets the demands of a 21st century economy.
Second, we must do so in a way that complements our efforts to reduce our carbon footprint.
Third, as we turn more and more to alternate modes of transportation – and less on fuel-run vehicles – we must also explore alternative ways to fund our transportation system in a way that is sustainable for the long-term.”
Governor Ted Kulongoski, August 30, 2007
23
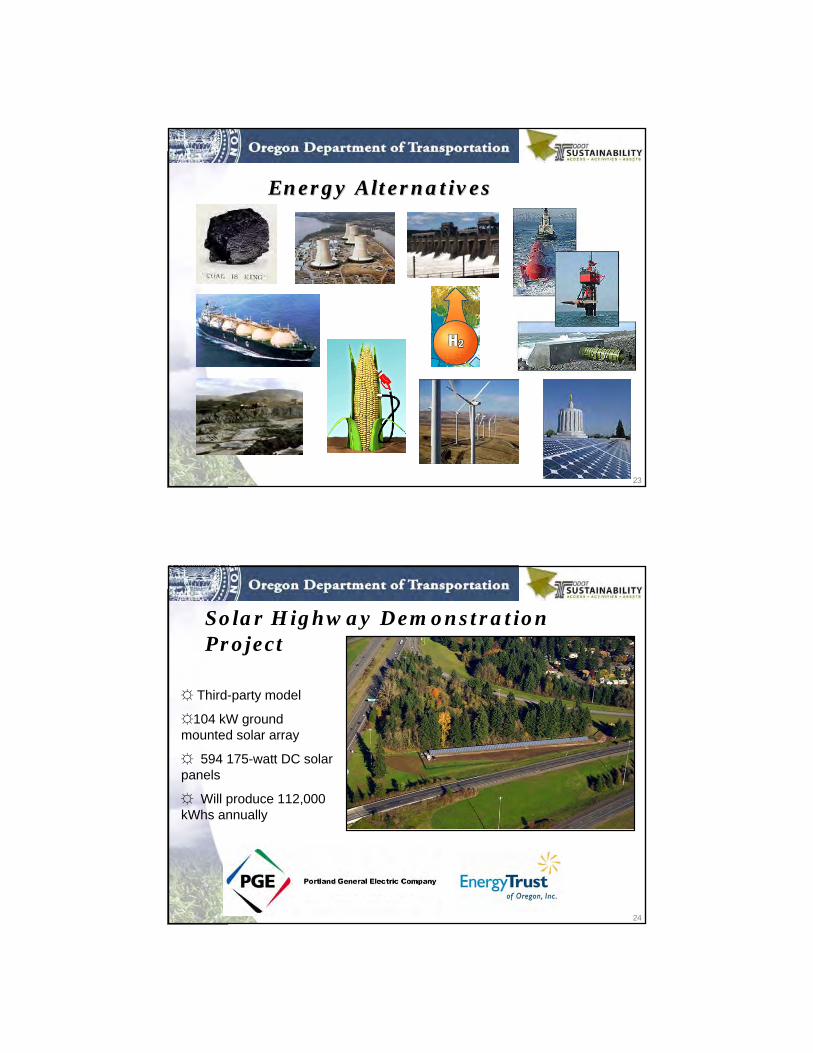
Energy AlternativesEnergy Alternatives
24
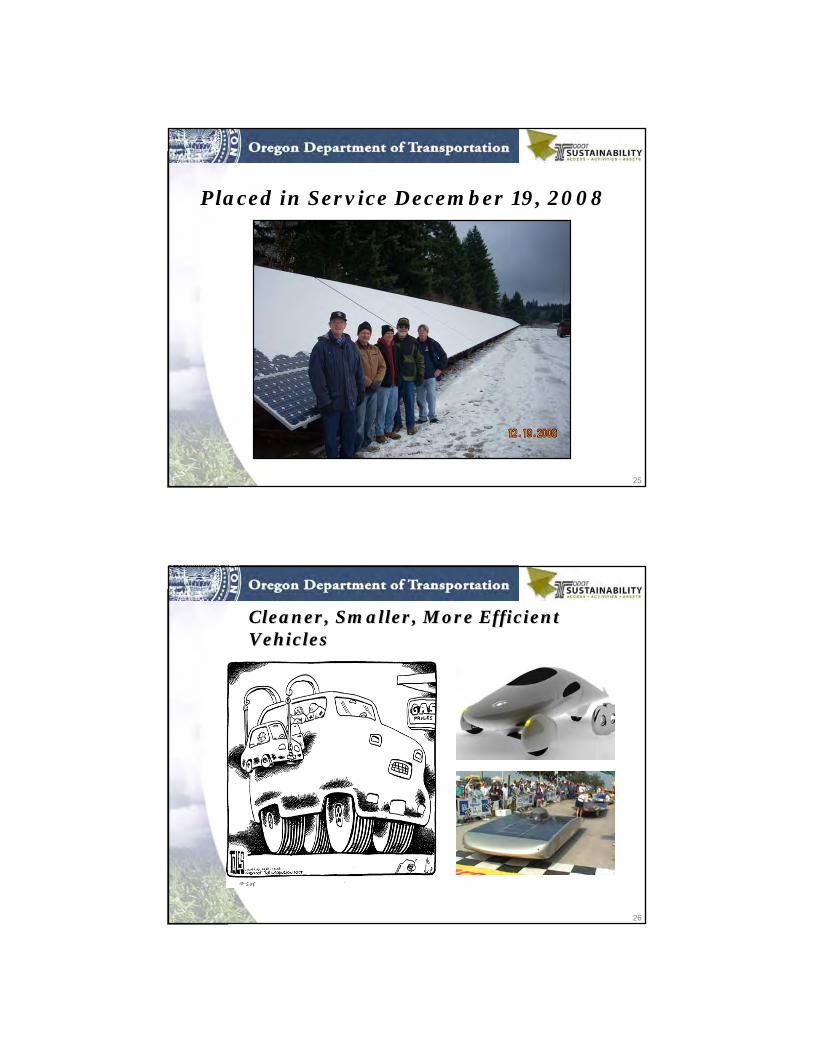
Solar Highway Demonstration Project
☼ Third-party model
☼104 kW ground mounted solar array
☼ 594 175-watt DC solar panels
☼ Will produce 112,000 kWhs annually
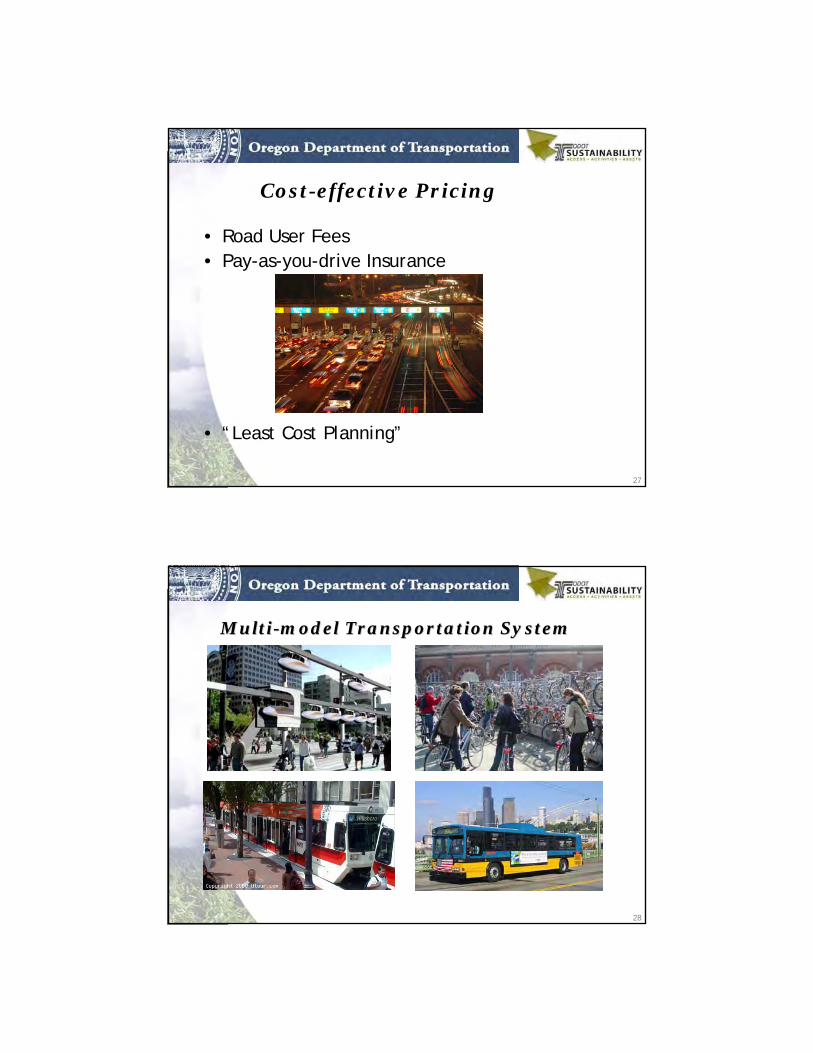
25
Placed in Service December 19, 2008
26
Cleaner, Smaller, More Efficient Cleaner, Smaller, More Efficient VehiclesVehicles
27
Cost-effective Pricing
• Road User Fees• Pay-as-you-drive Insurance
• “Least Cost Planning”
28
MultiMulti--model Transportation Systemmodel Transportation System
29
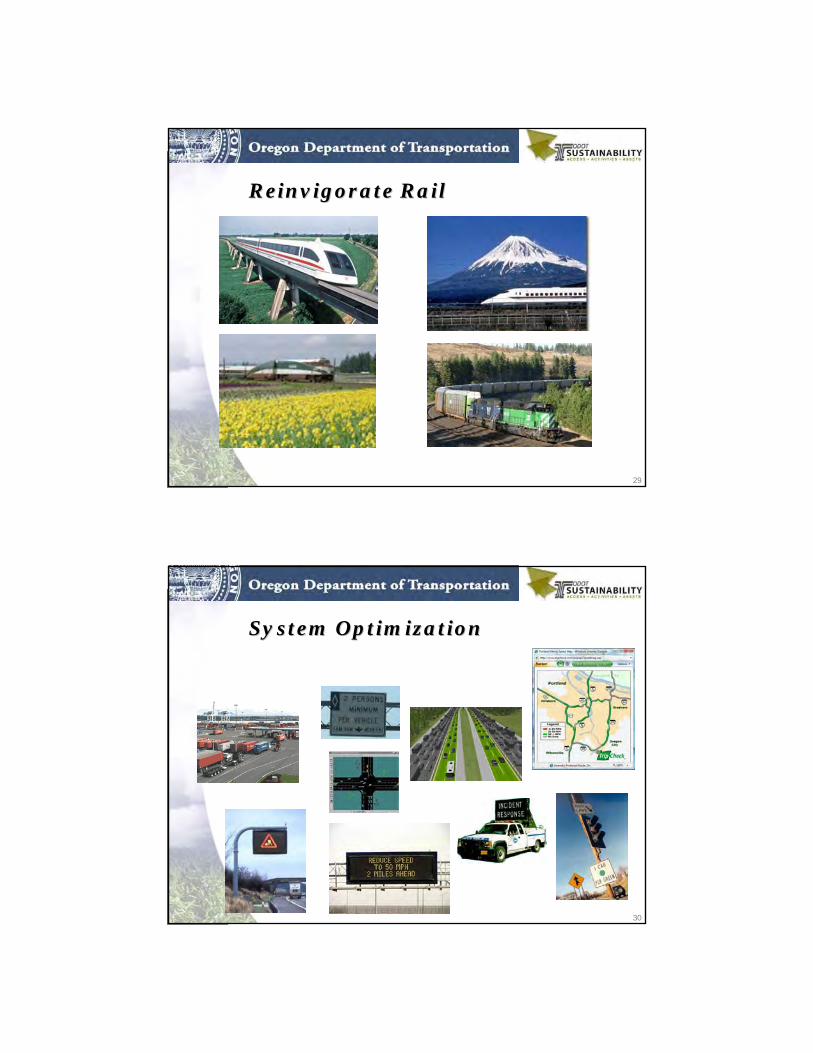
Reinvigorate RailReinvigorate Rail
30
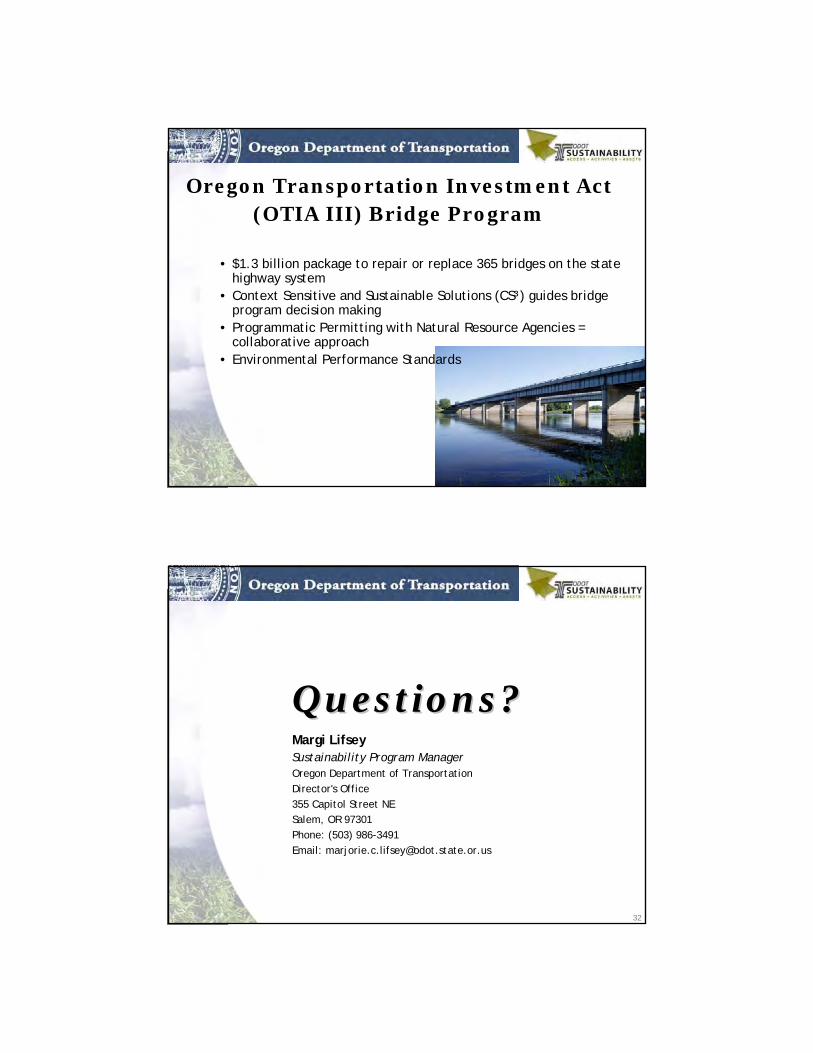
System OptimizationSystem Optimization
31
Oregon Transportation Investment Act (OTIA III) Bridge Program
• $1.3 billion package to repair or replace 365 bridges on the state highway system
• Context Sensitive and Sustainable Solutions (CS³) guides bridge program decision making
• Programmatic Permitting with Natural Resource Agencies = collaborative approach
• Environmental Performance Standards
32
Questions?Questions?Margi LifseySustainability Program ManagerOregon Department of TransportationDirector's Office355 Capitol Street NESalem, OR 97301Phone: (503) 986-3491Email: [email protected]
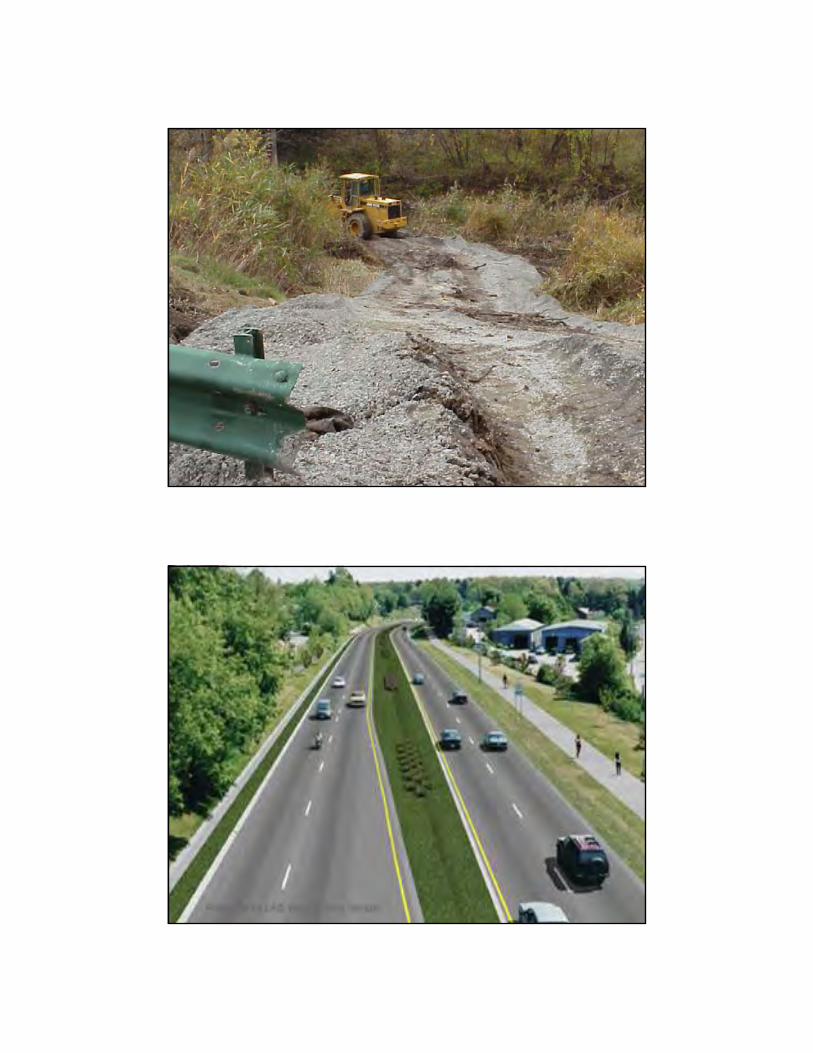
Sustainability in NYSDOT Sustainability in NYSDOT OperationsOperations
•• What should be in the program?What should be in the program?
•• What's worked / what hasnWhat's worked / what hasn‘‘t t -- global?global?
•• How far along is the Initiative?How far along is the Initiative?
•• What's worked / what hasn't What's worked / what hasn't -- NYSDOTNYSDOT
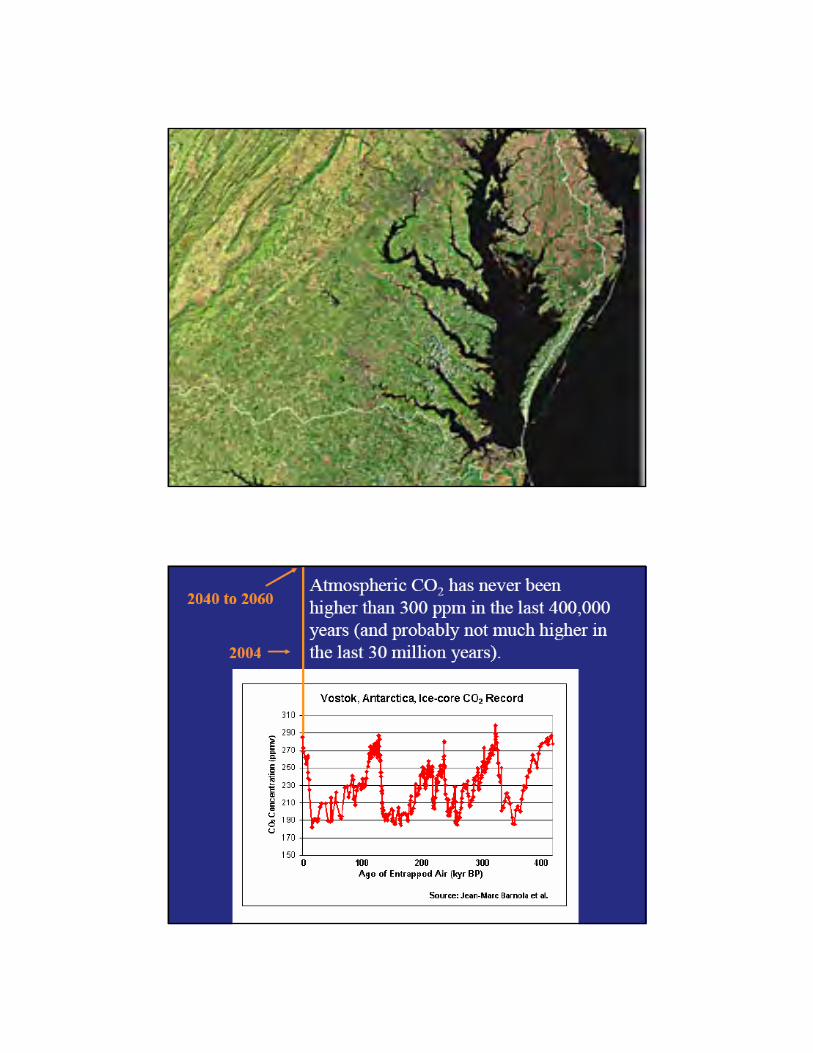
What should be in a sustainability program?
What ‘s worked & what hasn’t ? – big picture
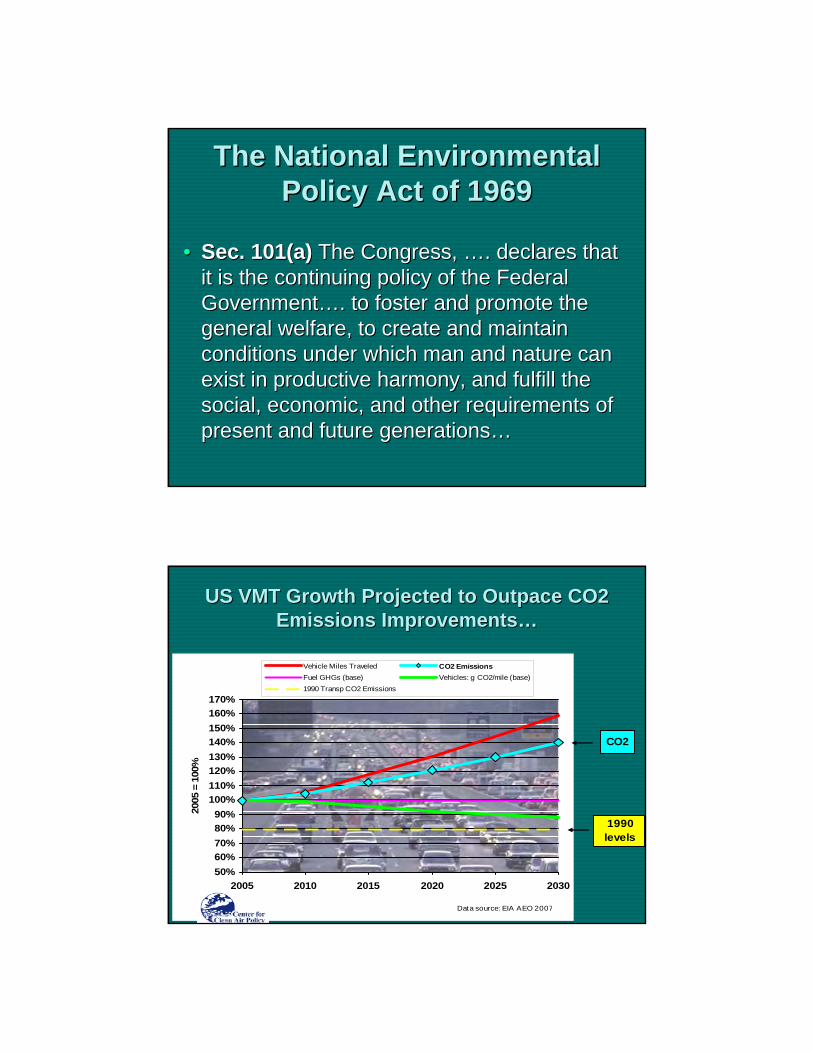
The National Environmental The National Environmental Policy Act of 1969Policy Act of 1969
•• Sec. 101(a) Sec. 101(a) The Congress, The Congress, ……. declares that . declares that it is the continuing policy of the Federal it is the continuing policy of the Federal GovernmentGovernment……. to foster and promote the . to foster and promote the general welfare, to create and maintain general welfare, to create and maintain conditions under which man and nature can conditions under which man and nature can exist in productive harmony, and fulfill the exist in productive harmony, and fulfill the social, economic, and other requirements of social, economic, and other requirements of present and future generationspresent and future generations……
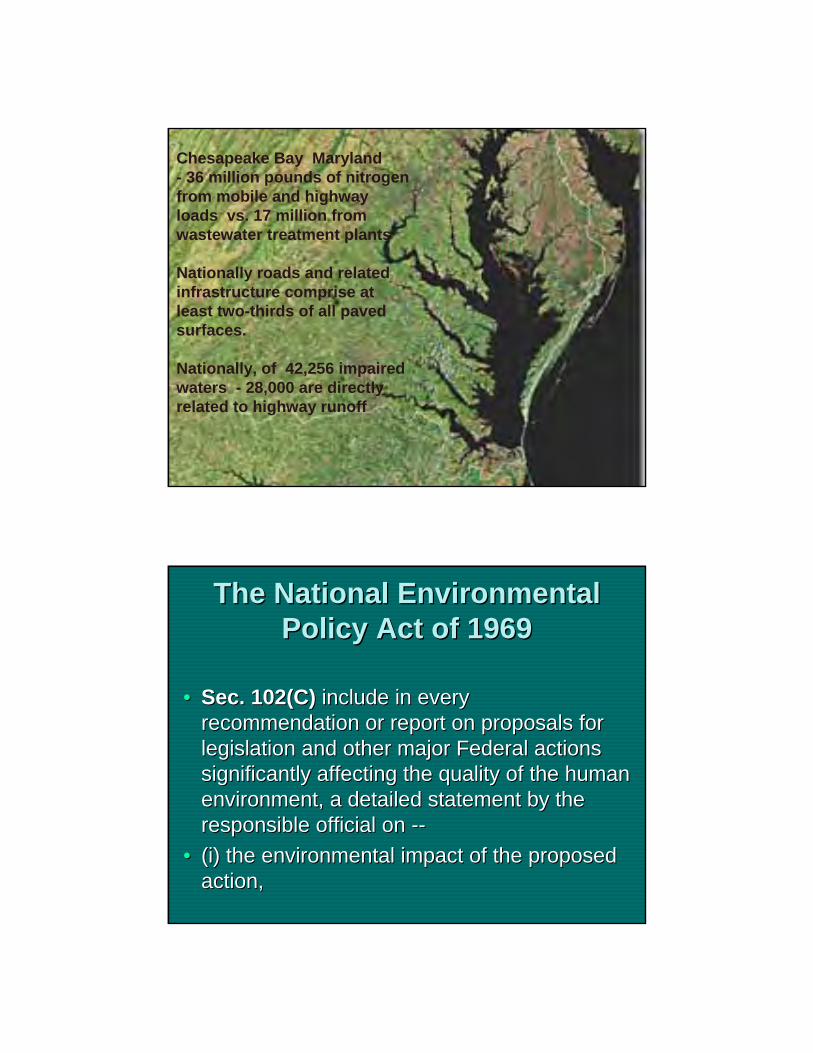
US VMT Growth Projected to Outpace CO2 US VMT Growth Projected to Outpace CO2 Emissions ImprovementsEmissions Improvements……
50%
60%
70%
80%
90%
100%
110%
120%
130%
140%
150%
160%
170%
2005 2010 2015 2020 2025 2030
2005
= 1
00%
Vehicle Miles Traveled CO2 Emissions
Fuel GHGs (base) Vehicles: g CO2/mile (base)
1990 Transp CO2 Emissions
Data source: EIA AEO 2007
CO2
1990 levels
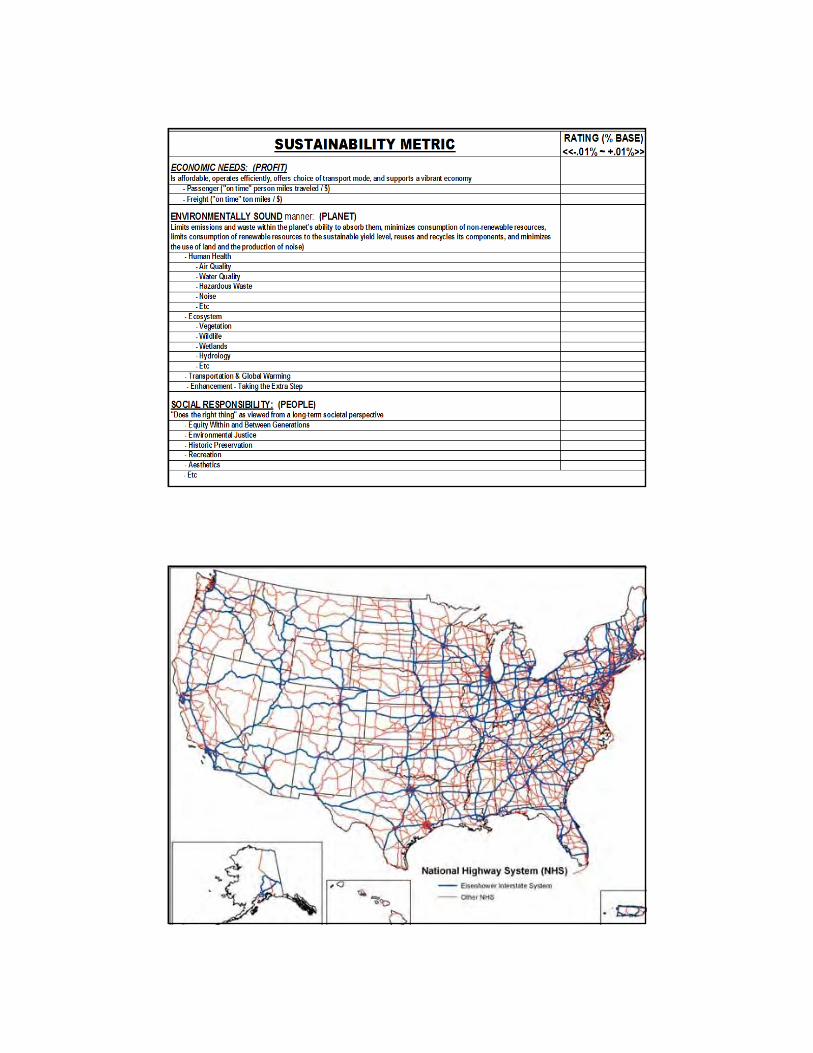
Chesapeake Bay Maryland - 36 million pounds of nitrogen from mobile and highway loads vs. 17 million from wastewater treatment plants
Nationally roads and related infrastructure comprise at least two-thirds of all paved surfaces.
Nationally, of 42,256 impaired waters - 28,000 are directly related to highway runoff
The National Environmental The National Environmental Policy Act of 1969Policy Act of 1969
•• Sec. 102(C) Sec. 102(C) include in every include in every recommendation or report on proposals for recommendation or report on proposals for legislation and other major Federal actions legislation and other major Federal actions significantly affecting the quality of the human significantly affecting the quality of the human environment, a detailed statement by the environment, a detailed statement by the responsible official on responsible official on ----
•• (i) the environmental impact of the proposed (i) the environmental impact of the proposed action,action,
••
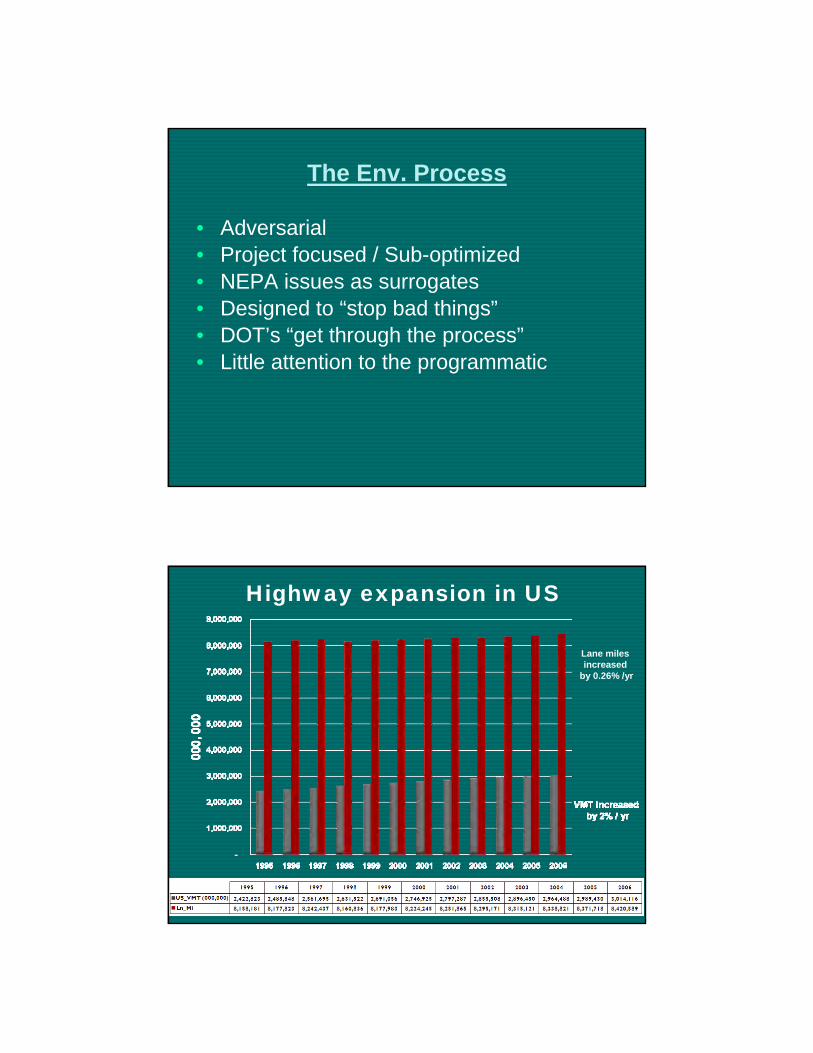
The Env. Process
• Adversarial • Project focused / Sub-optimized• NEPA issues as surrogates • Designed to “stop bad things”• DOT’s “get through the process”• Little attention to the programmatic
Lane miles increased
by 0.26% /yr
Highway expansion in US
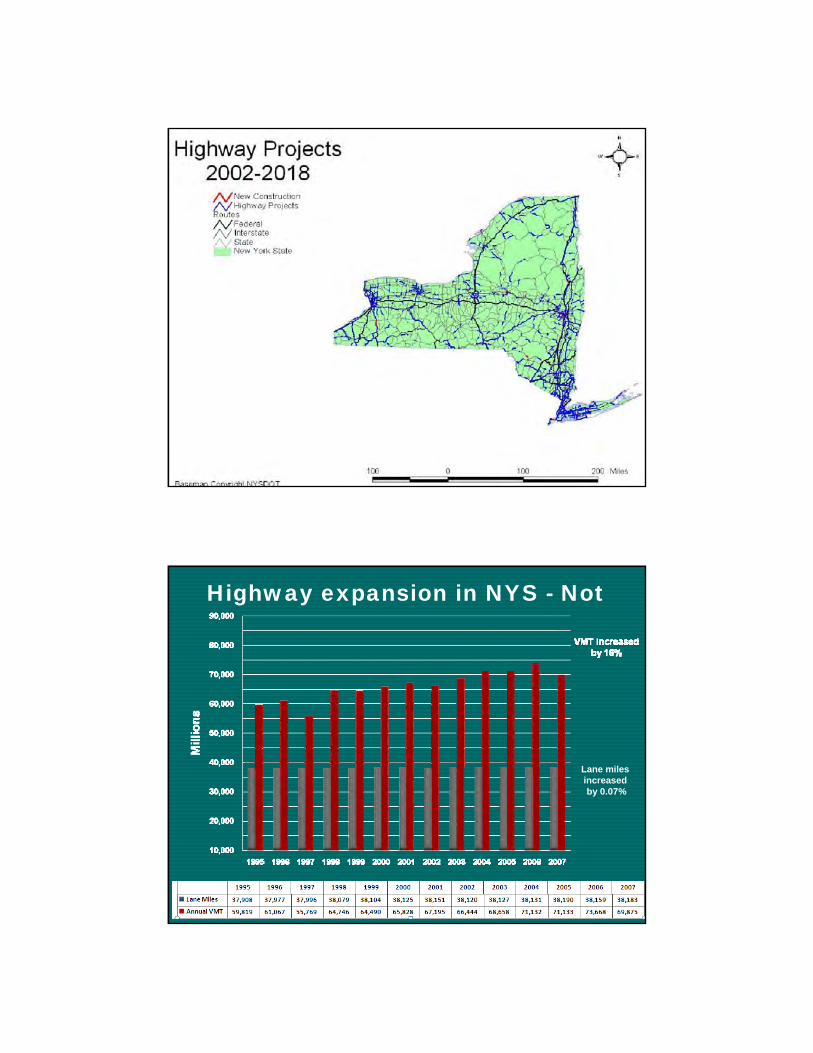
Lane miles increased by 0.07%
Highway expansion in NYS - Not
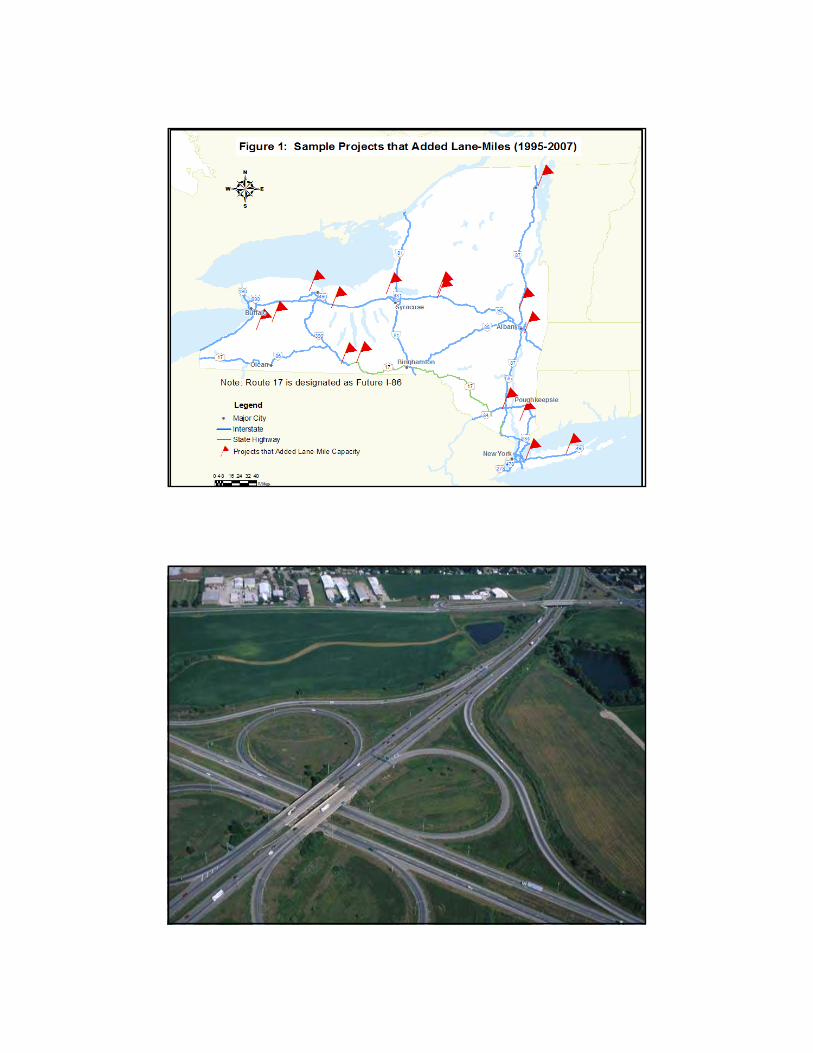
••
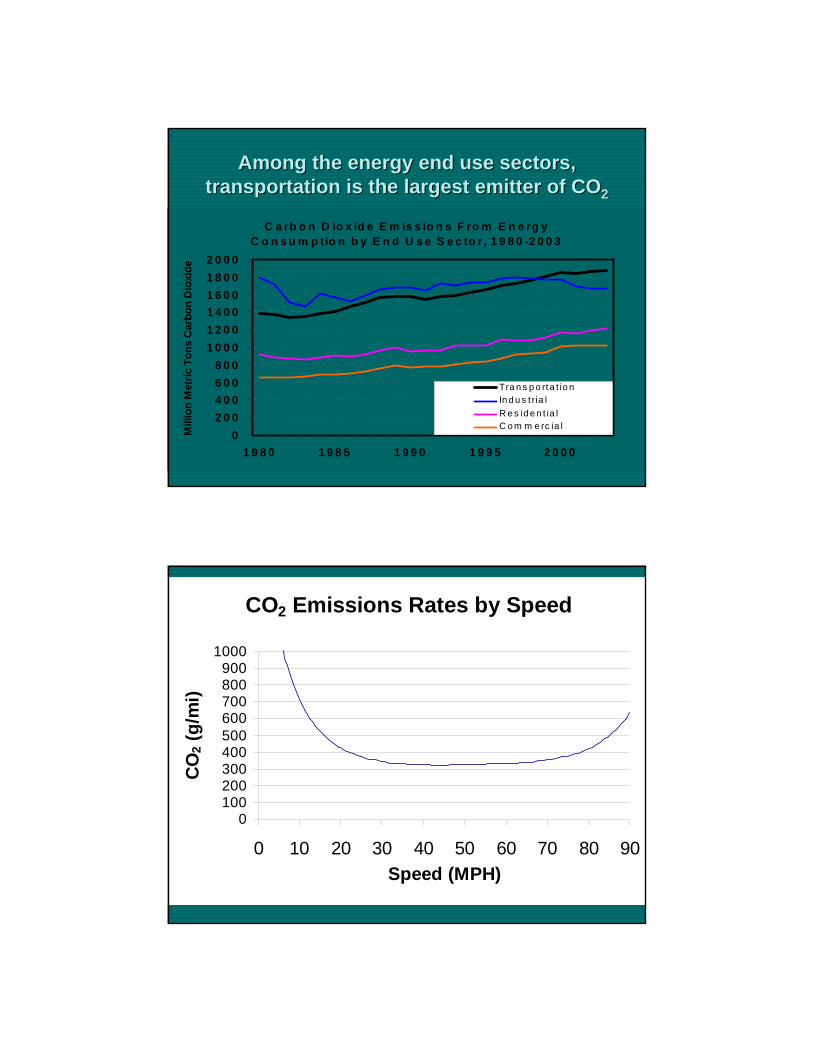
C a rb o n D io x id e E m is s io n s F ro m E n e rg y C o n s u m p tio n b y E n d U s e S e c to r, 1 9 8 0 -2 0 0 3
0
2 0 0
4 0 0
6 0 0
8 0 0
1 0 0 0
1 2 0 0
1 4 0 0
1 6 0 0
1 8 0 0
2 0 0 0
1 9 8 0 1 9 8 5 1 9 9 0 1 9 9 5 2 0 0 0
Mill
ion
Met
ric
To
ns
Car
bo
n D
ioxi
de
Tra n s p o rta t io nIn d u s t ria l
R e s id e n t ia lC o m m e rc ia l
Among the energy end use sectors, Among the energy end use sectors, transportation is the largest emitter of COtransportation is the largest emitter of CO22
CO2 Emissions Rates by Speed
0100200300400500600700800900
1000
0 10 20 30 40 50 60 70 80 90
Speed (MPH)
CO
2 (
g/m
i)
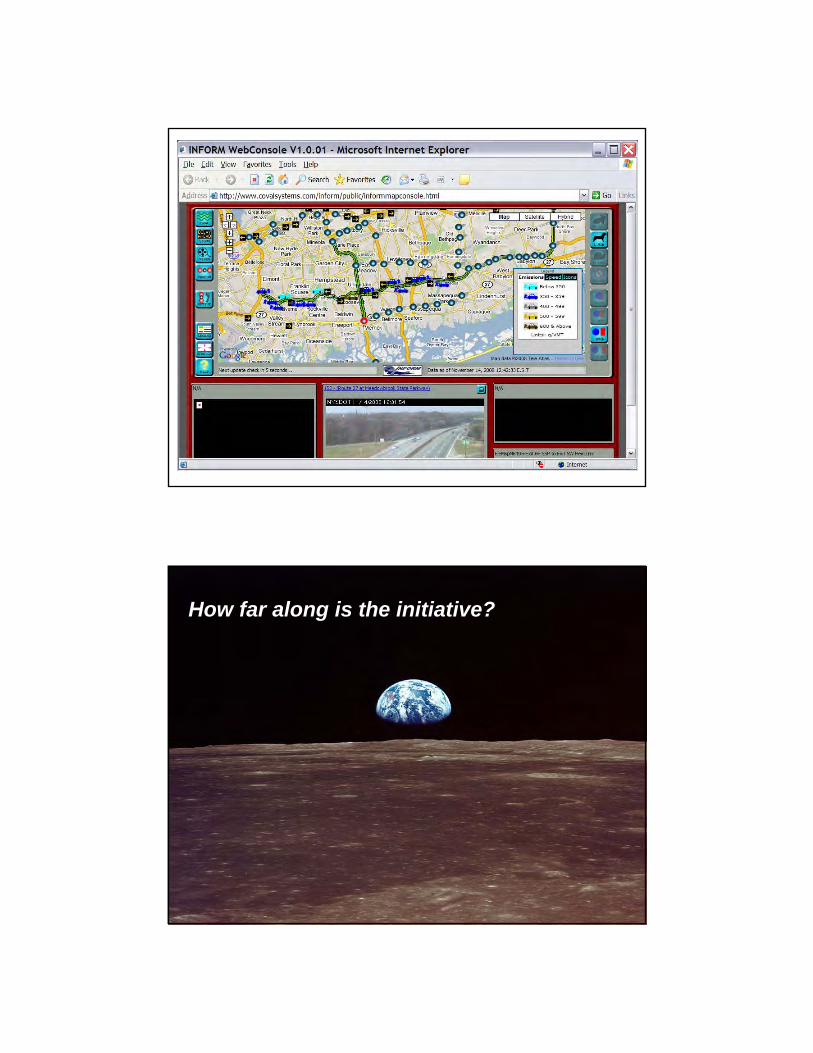
How far along is the initiative?
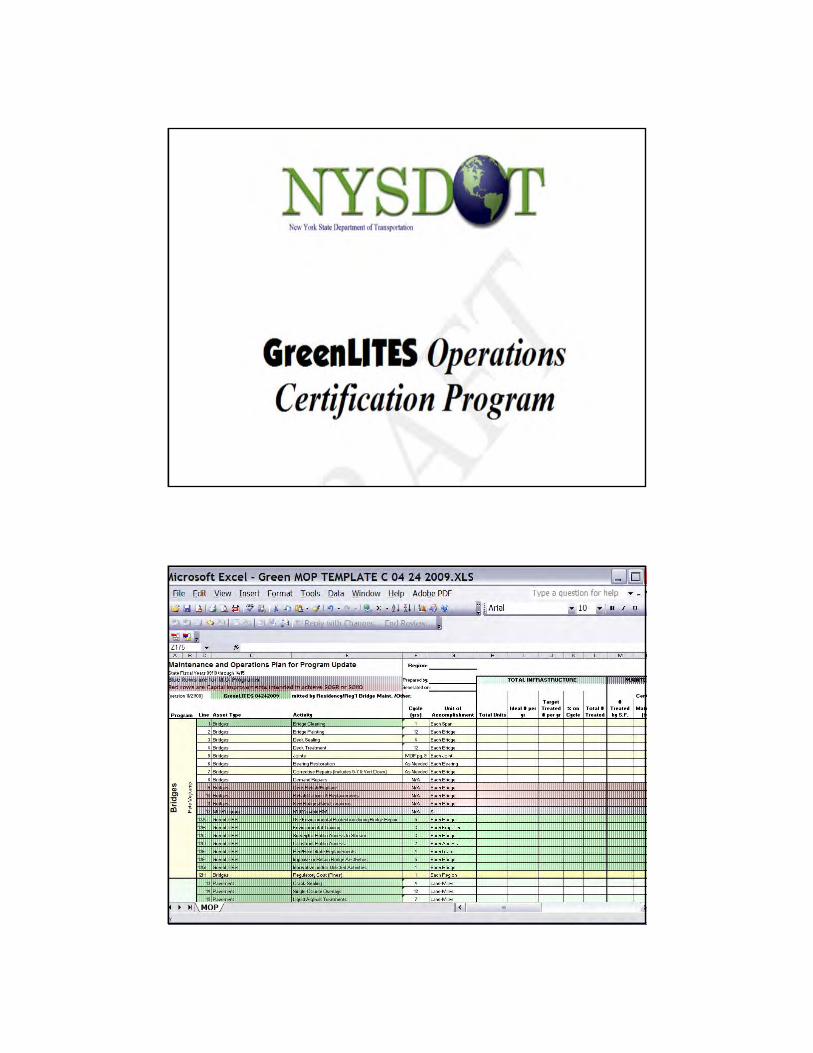
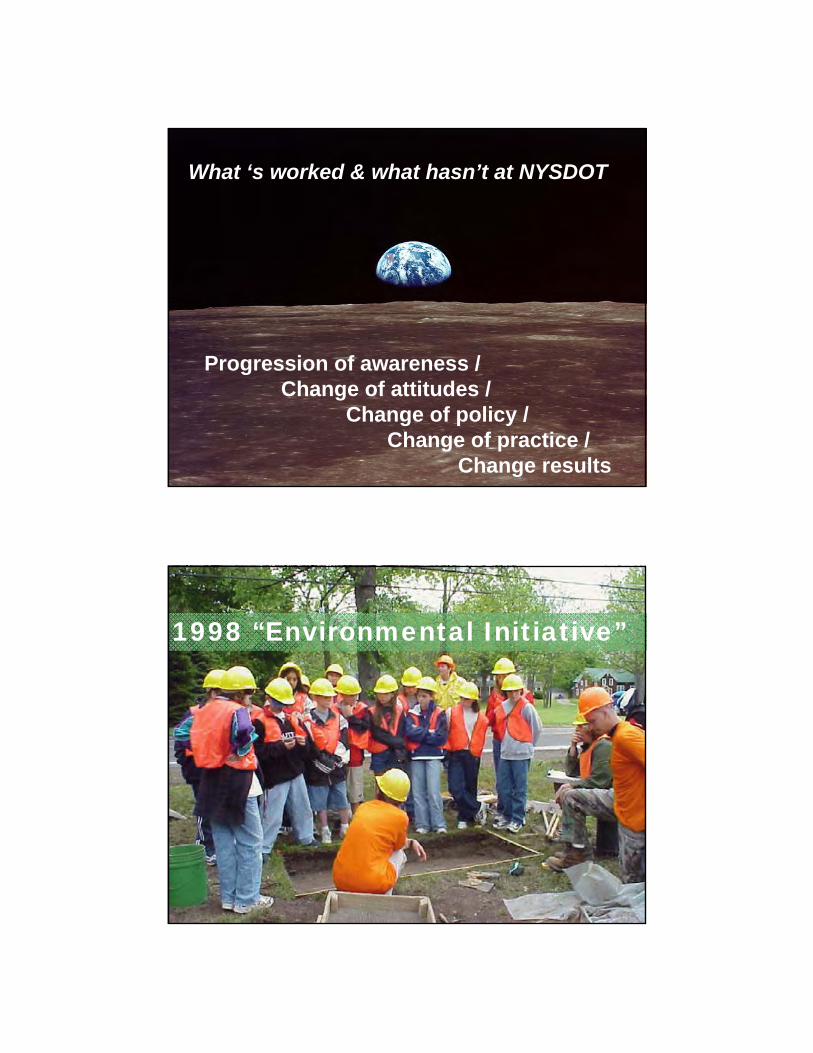
What ‘s worked & what hasn’t at NYSDOT
Progression of awareness / Change of attitudes /
Change of policy /Change of practice /
Change results
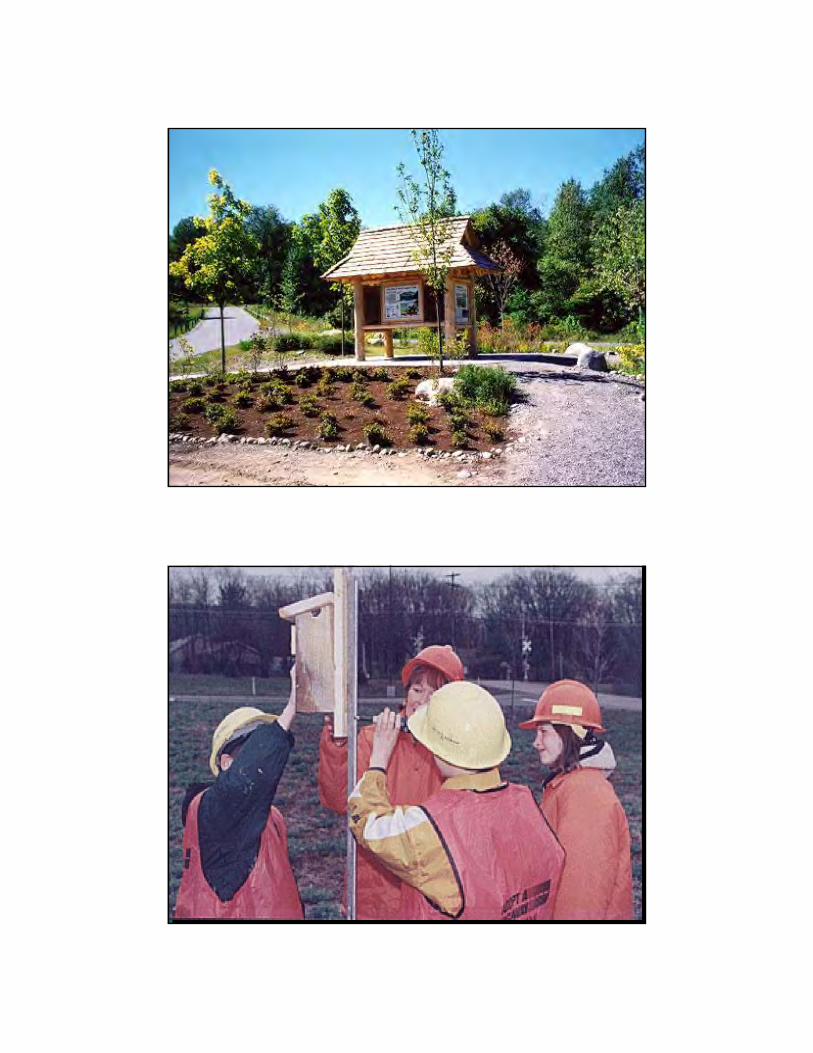
1998 “Environmental Initiative”
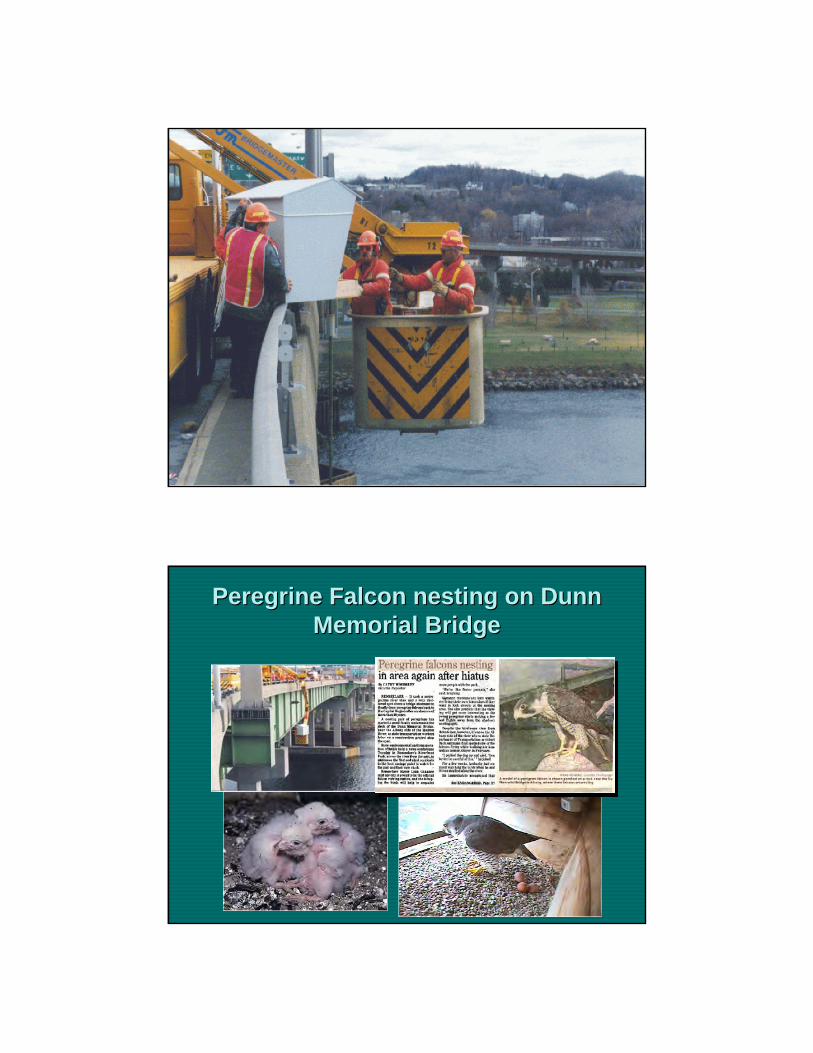
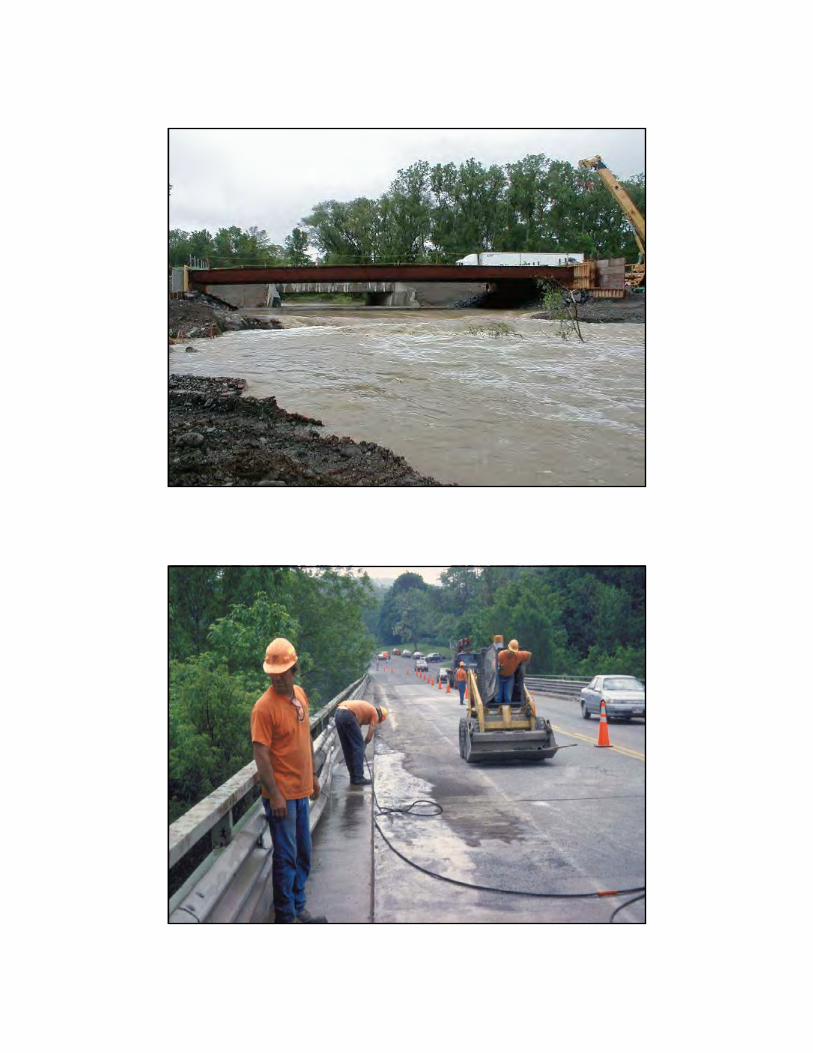
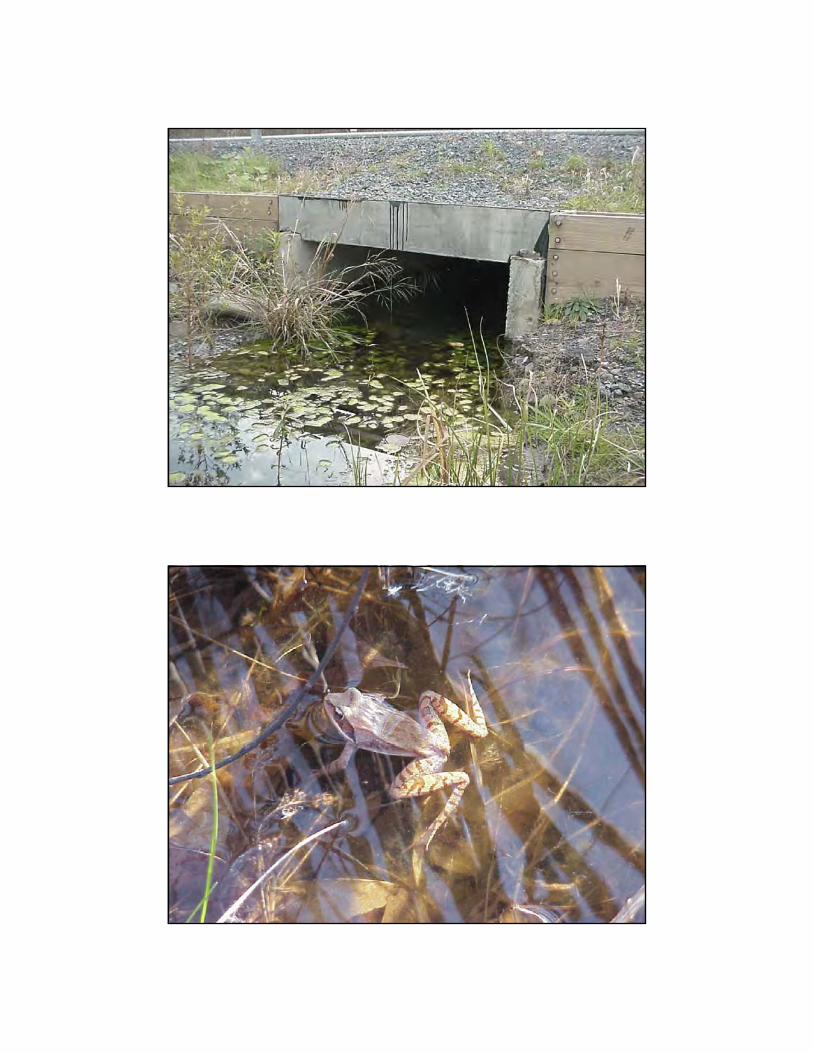
Peregrine Falcon nesting on Dunn Peregrine Falcon nesting on Dunn Memorial BridgeMemorial Bridge
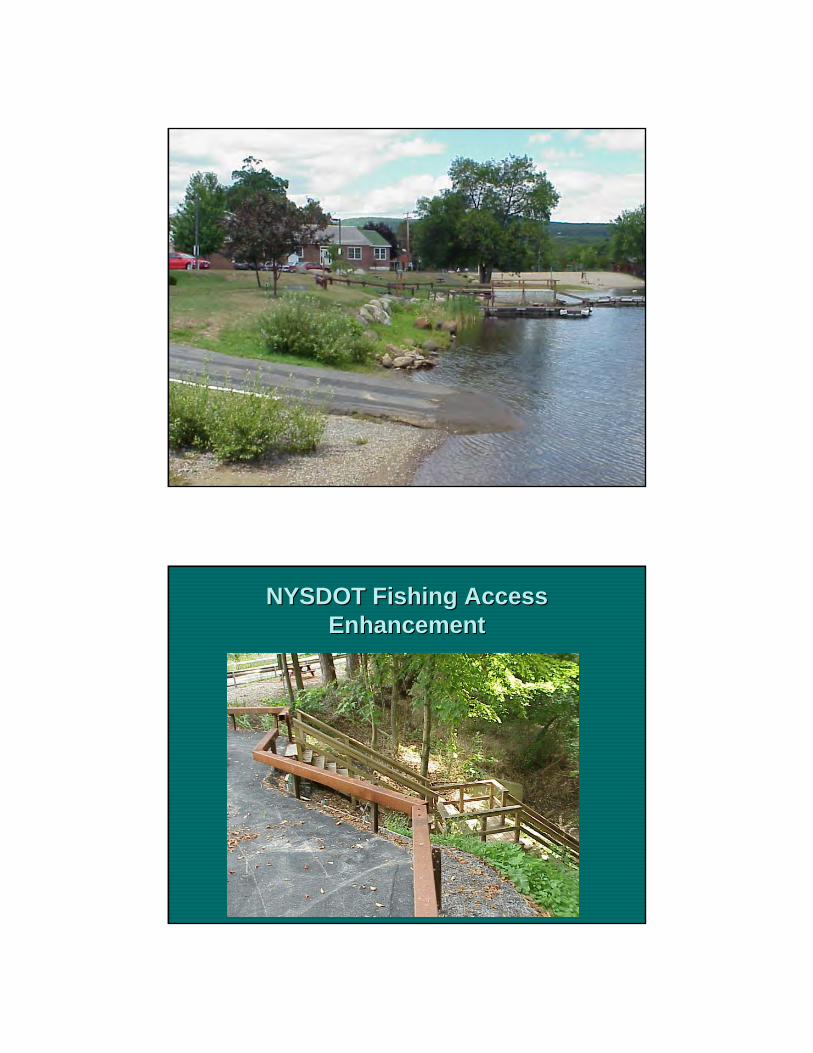
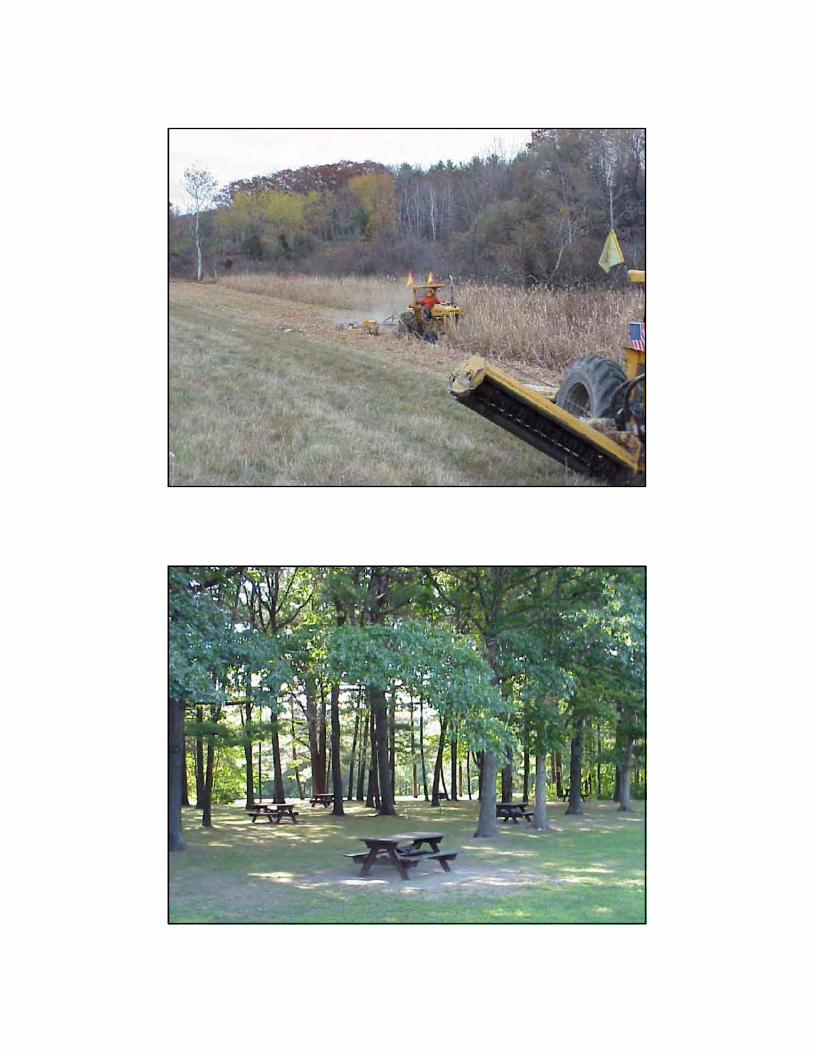
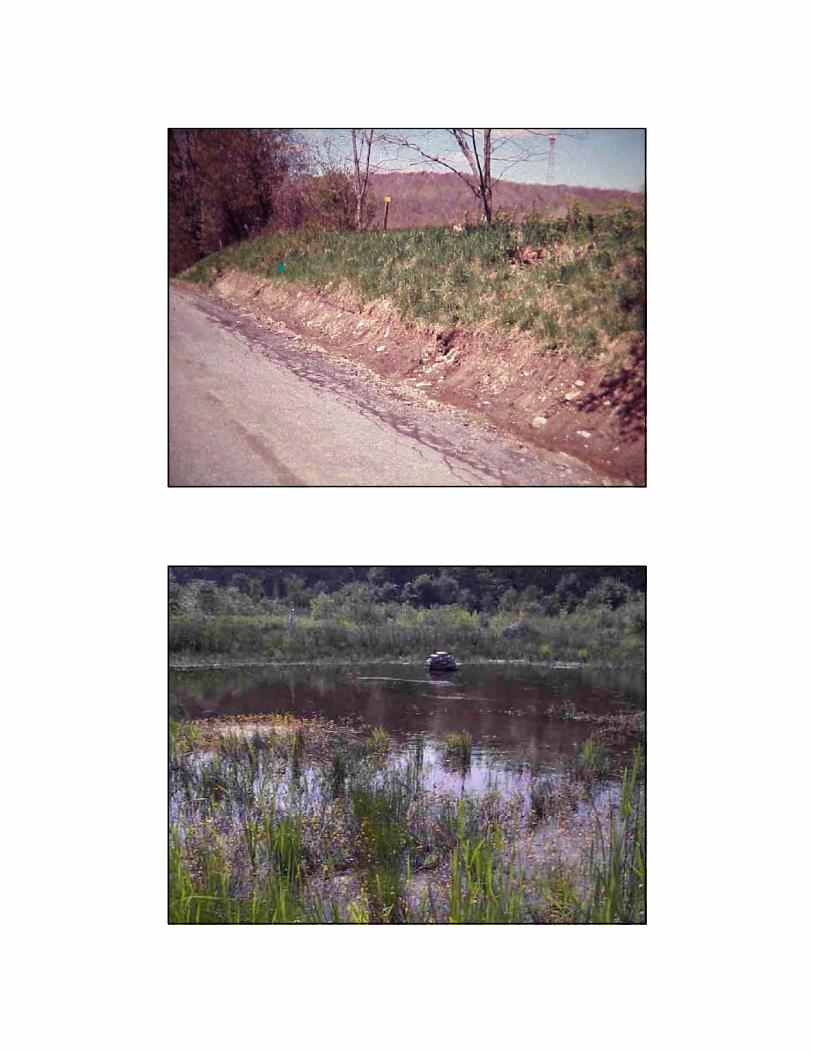
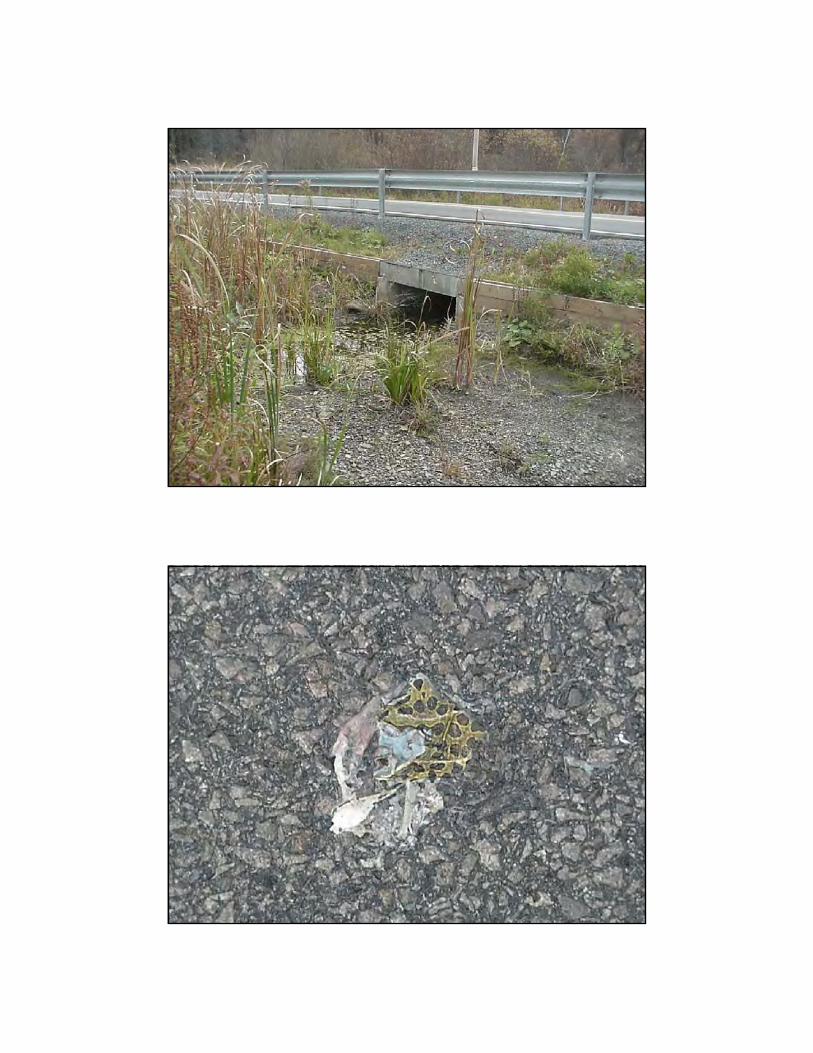
NYSDOT Fishing Access NYSDOT Fishing Access EnhancementEnhancement
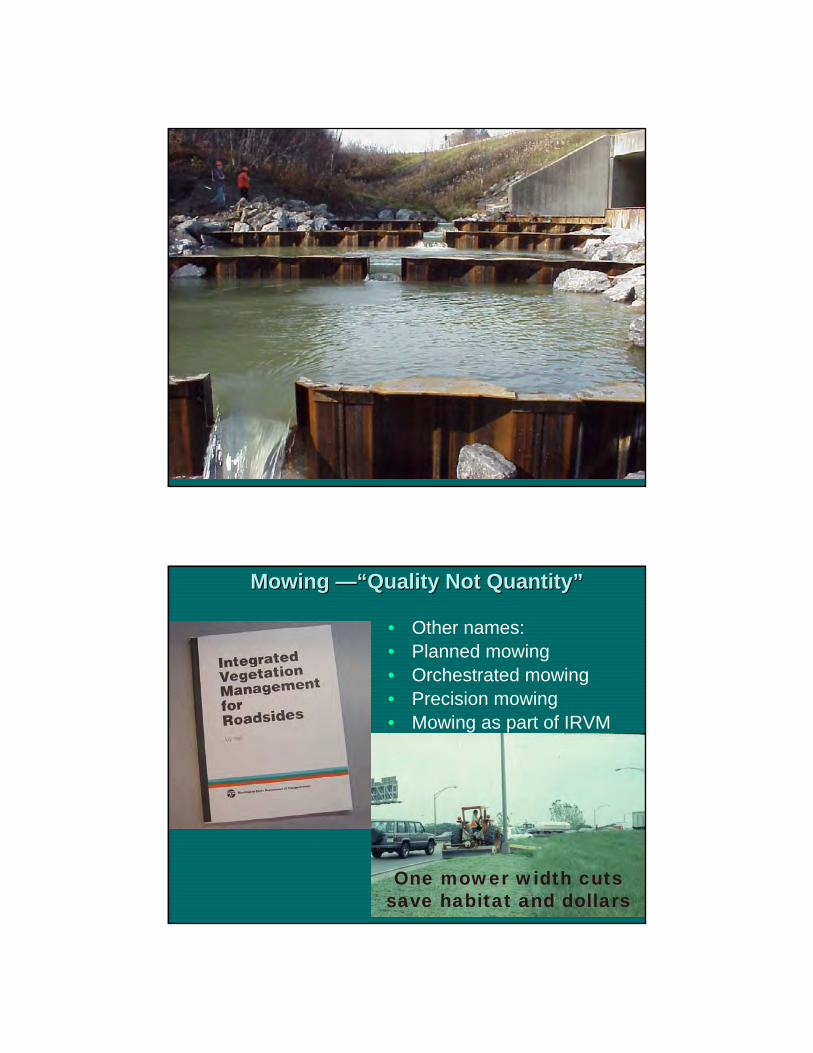
Mowing Mowing ——““Quality Not QuantityQuality Not Quantity””
One mower width cuts save habitat and dollars
• Other names: • Planned mowing • Orchestrated mowing • Precision mowing• Mowing as part of IRVM
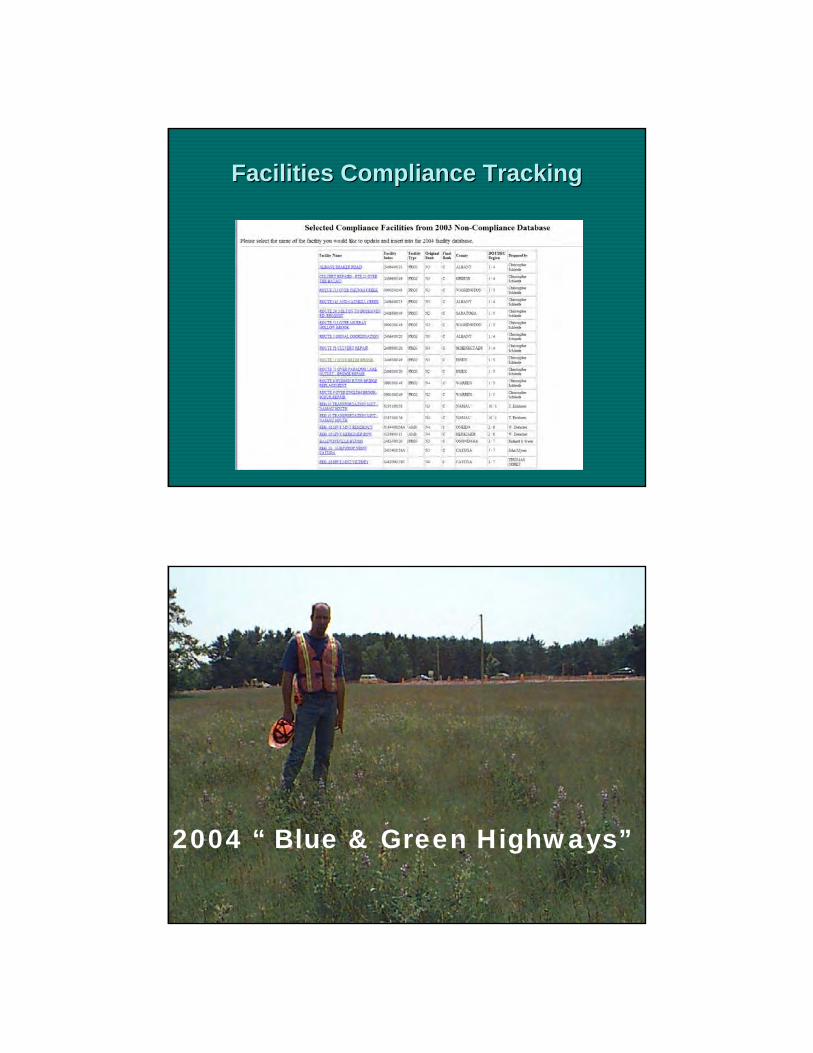
Facilities Compliance TrackingFacilities Compliance Tracking
2004 “ Blue & Green Highways”
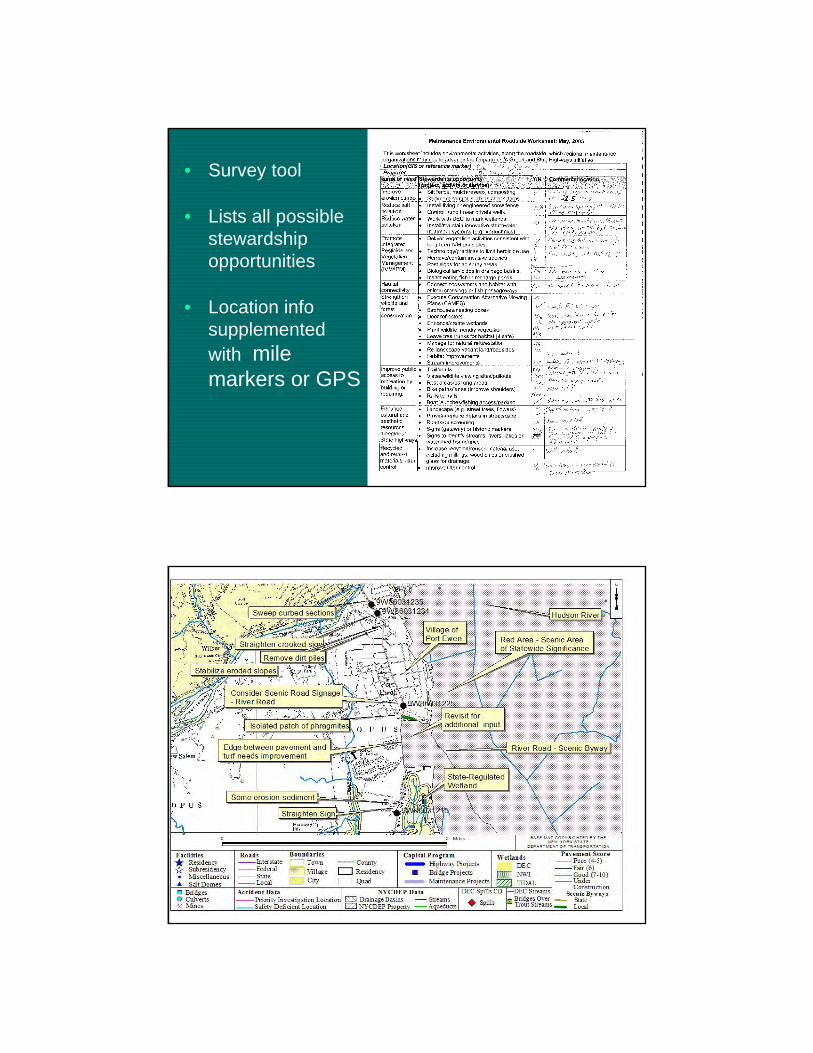
• Survey tool
• Lists all possible stewardship opportunities
• Location info supplemented with mile markers or GPS
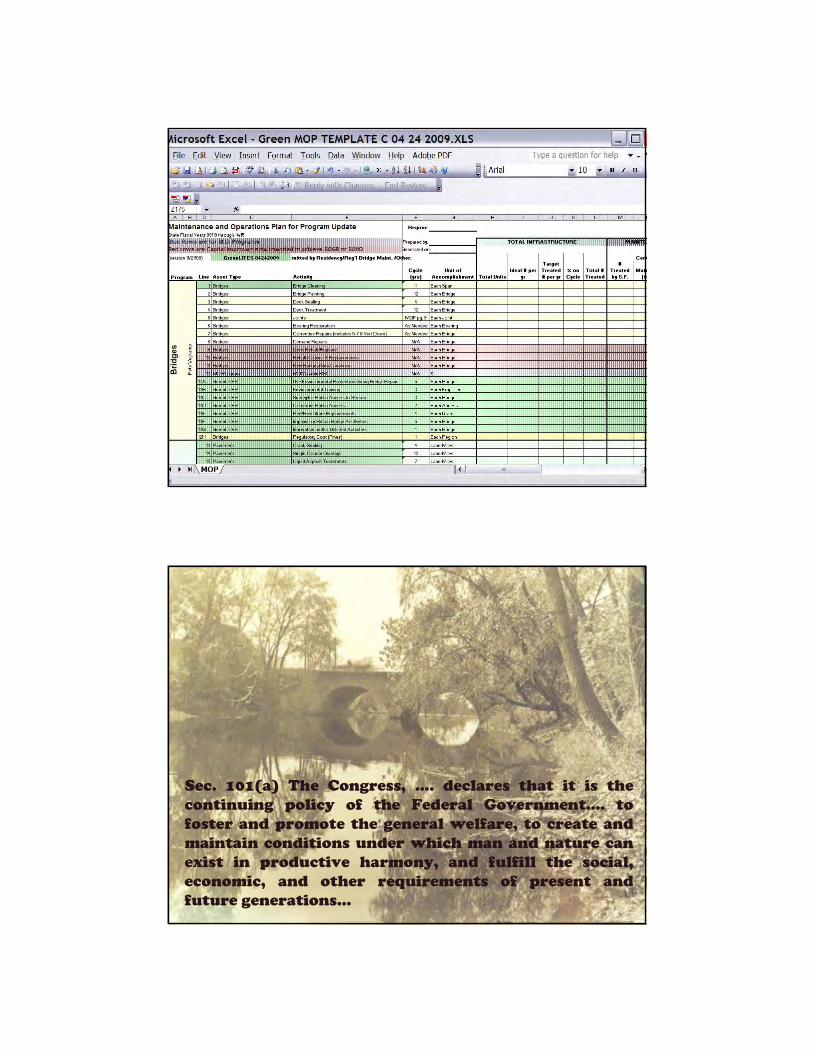
Sec. 101(a) The Congress, …. declares that it is the continuing policy of the Federal Government…. to foster and promote the general welfare, to create and maintain conditions under which man and nature can exist in productive harmony, and fulfill the social, economic, and other requirements of present and future generations…
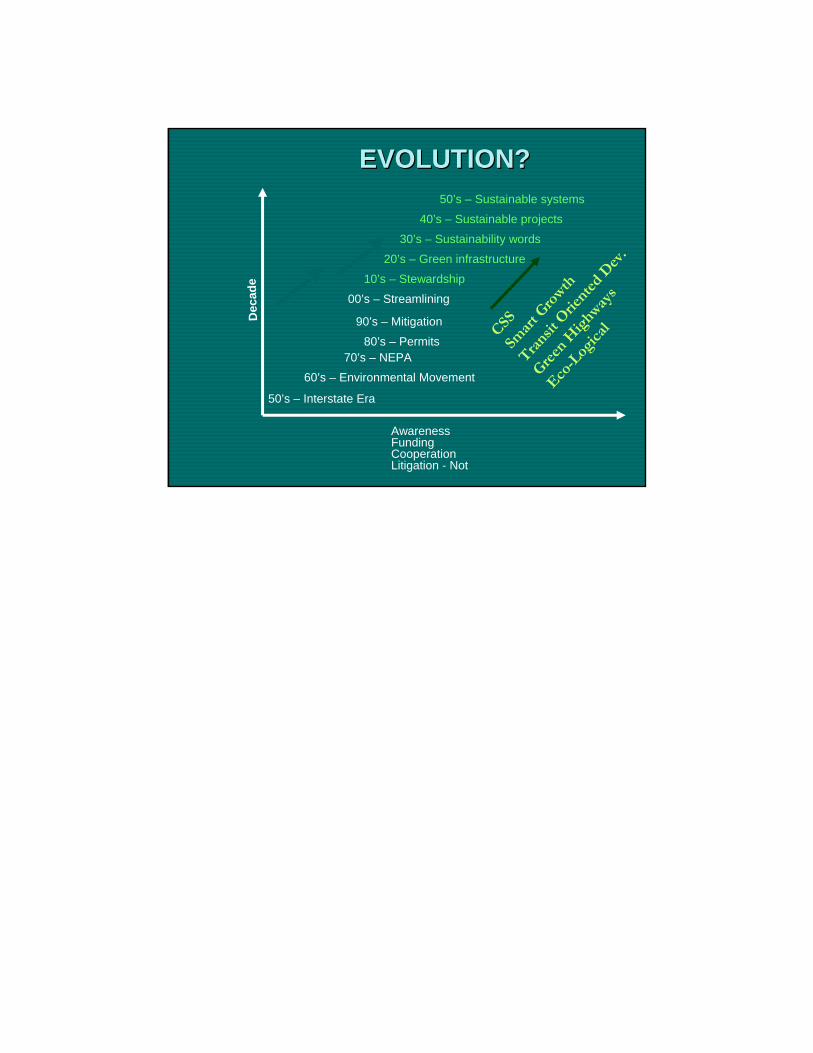
EVOLUTION?EVOLUTION?
▬▬►
▬▬►
Dec
ade
AwarenessFundingCooperationLitigation - Not
50’s – Interstate Era
60’s – Environmental Movement
70’s – NEPA80’s – Permits
90’s – Mitigation
00’s – Streamlining
10’s – Stewardship
20’s – Green infrastructure
30’s – Sustainability words
40’s – Sustainable projects
50’s – Sustainable systems
CSSSm
art G
rowth
Trans
it O
riente
d D
ev.
Green
Hig
hways
Eco-L
ogica
l
AASHTO Sustainability ConferenceMay 27, 2009
What is Smart Transportation?
Change at PennDOT
Smart Transportation In Action
1
All photographs and images from PennDOT, Glatting Jackson Kercher Anglin, Orth-Rodgers, or public domain, unless otherwise noted.
Content for Discussion
2
3
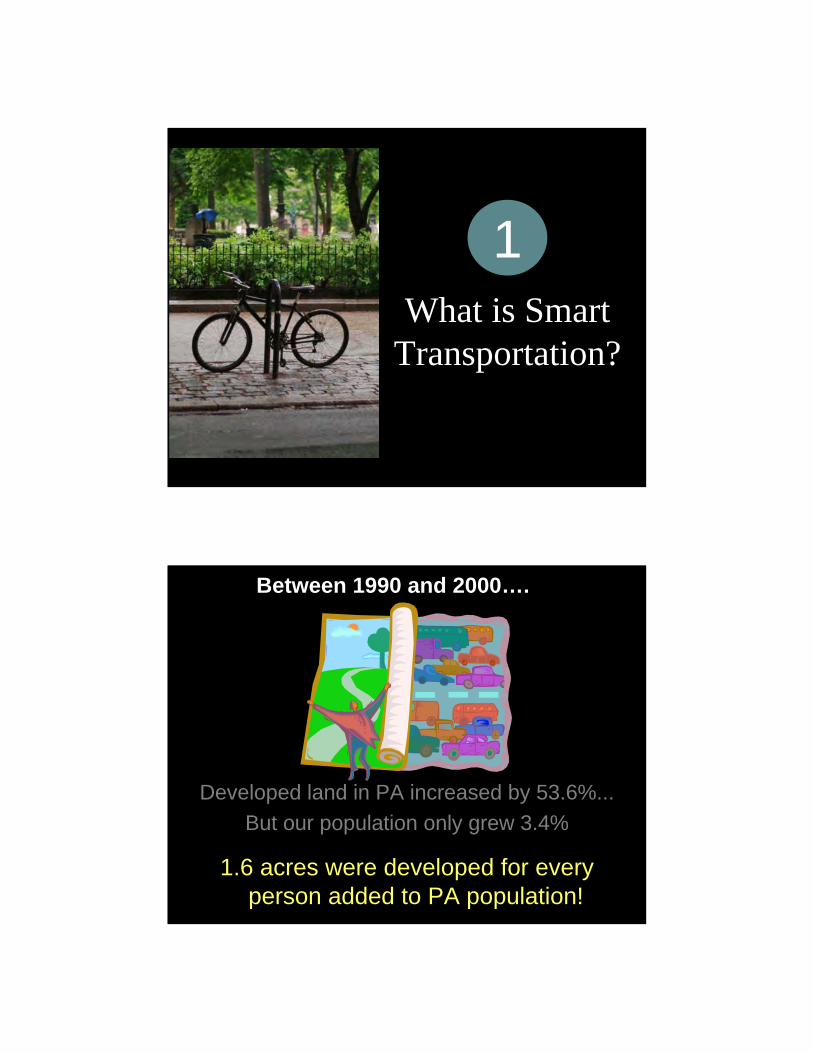
What is Smart Transportation?
1
Developed land in PA increased by 53.6%...
But our population only grew 3.4%
1.6 acres were developed for every person added to PA population!
Between 1990 and 2000….
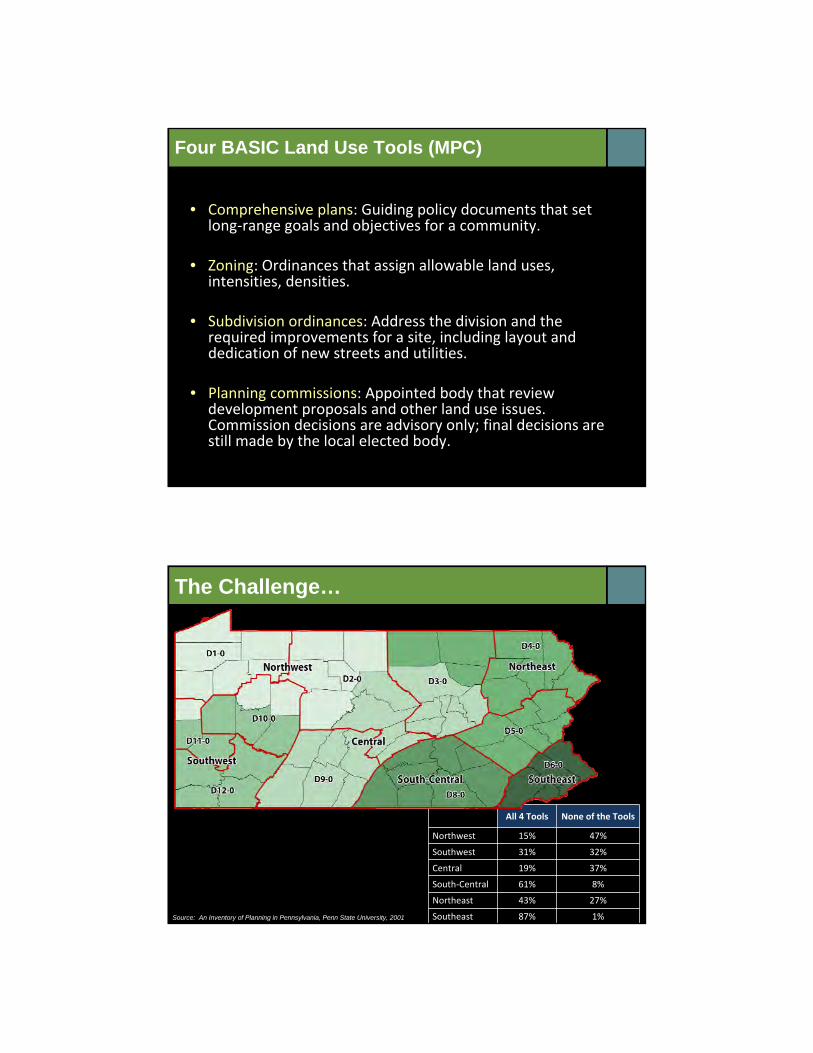
• Comprehensive plans: Guiding policy documents that set long‐range goals and objectives for a community.
• Zoning: Ordinances that assign allowable land uses, intensities, densities.
• Subdivision ordinances: Address the division and the required improvements for a site, including layout and dedication of new streets and utilities.
• Planning commissions: Appointed body that review development proposals and other land use issues. Commission decisions are advisory only; final decisions are still made by the local elected body.
Four BASIC Land Use Tools (MPC)
All 4 Tools None of the Tools
Northwest 15% 47%
Southwest 31% 32%
Central 19% 37%
South‐Central 61% 8%
Northeast 43% 27%
Southeast 87% 1%
The Challenge…
Source: An Inventory of Planning in Pennsylvania, Penn State University, 2001
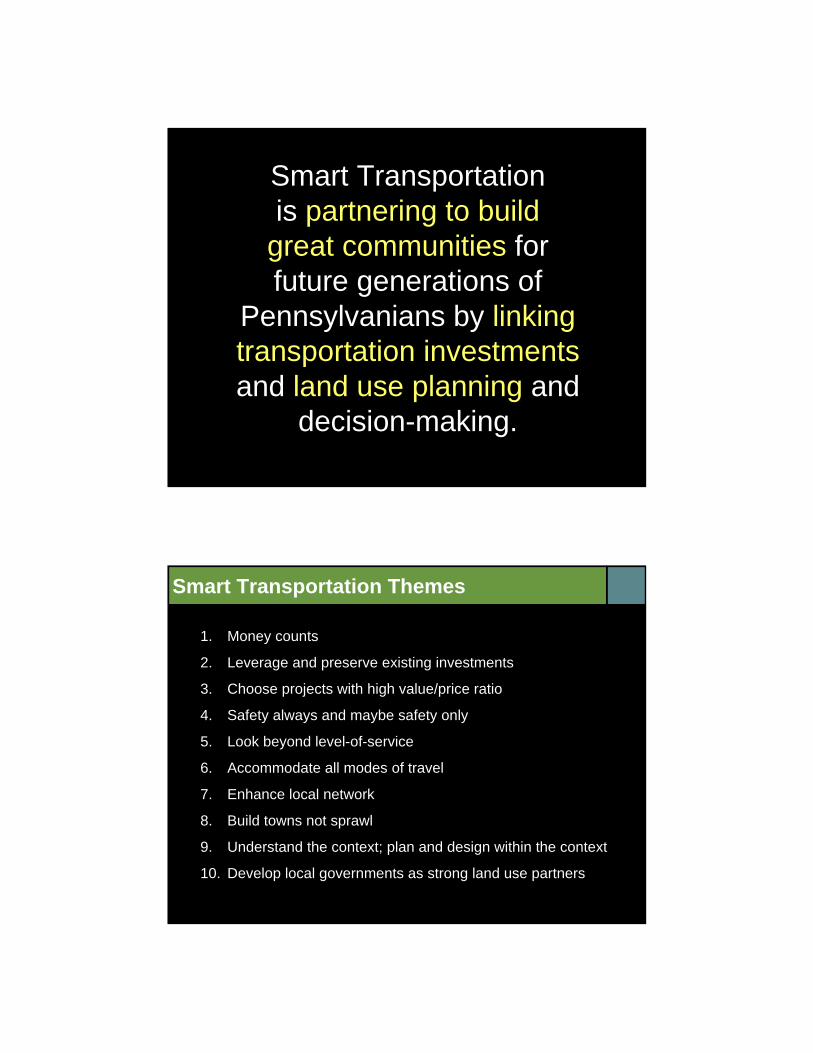
Smart Transportation is partnering to build
great communities for future generations of
Pennsylvanians by linking transportation investments and land use planning and
decision-making.
1. Money counts
2. Leverage and preserve existing investments
3. Choose projects with high value/price ratio
4. Safety always and maybe safety only
5. Look beyond level-of-service
6. Accommodate all modes of travel
7. Enhance local network
8. Build towns not sprawl
9. Understand the context; plan and design within the context
10. Develop local governments as strong land use partners
Smart Transportation Themes
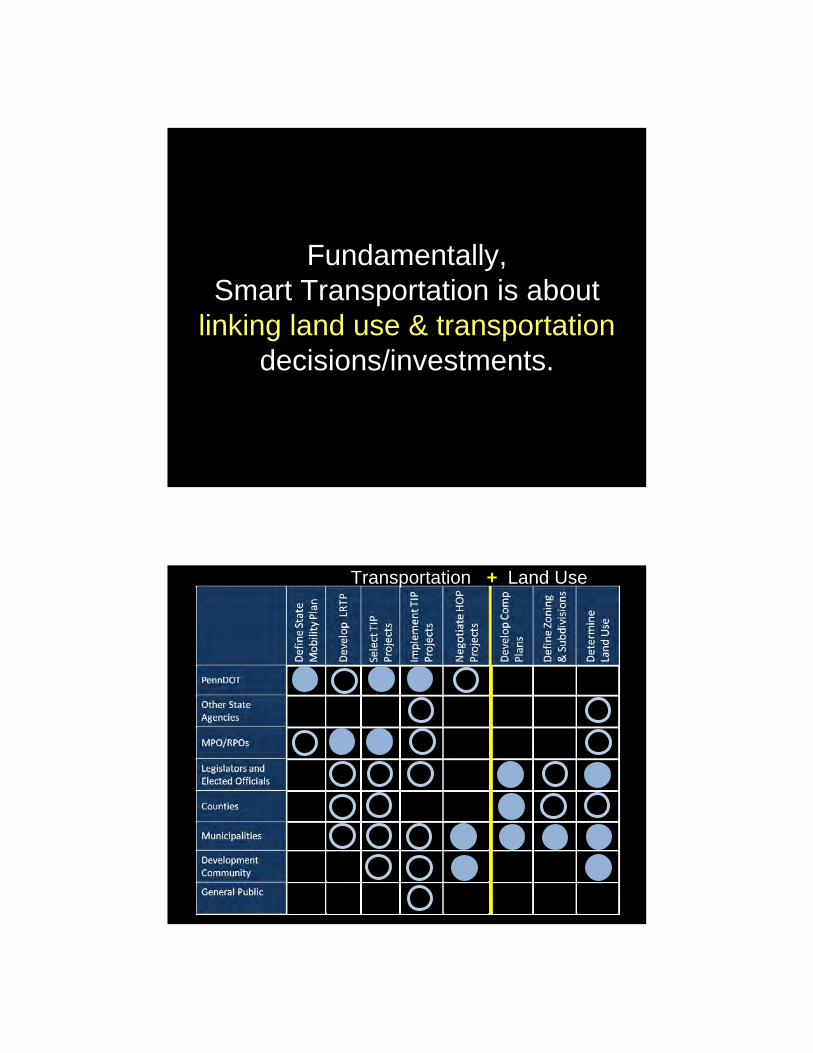
Fundamentally,Smart Transportation is about
linking land use & transportation decisions/investments.
Transportation + Land Use
Change at
PennDOT
2
Change at PennDOT
Process Knowledge
Partnerships
Rules
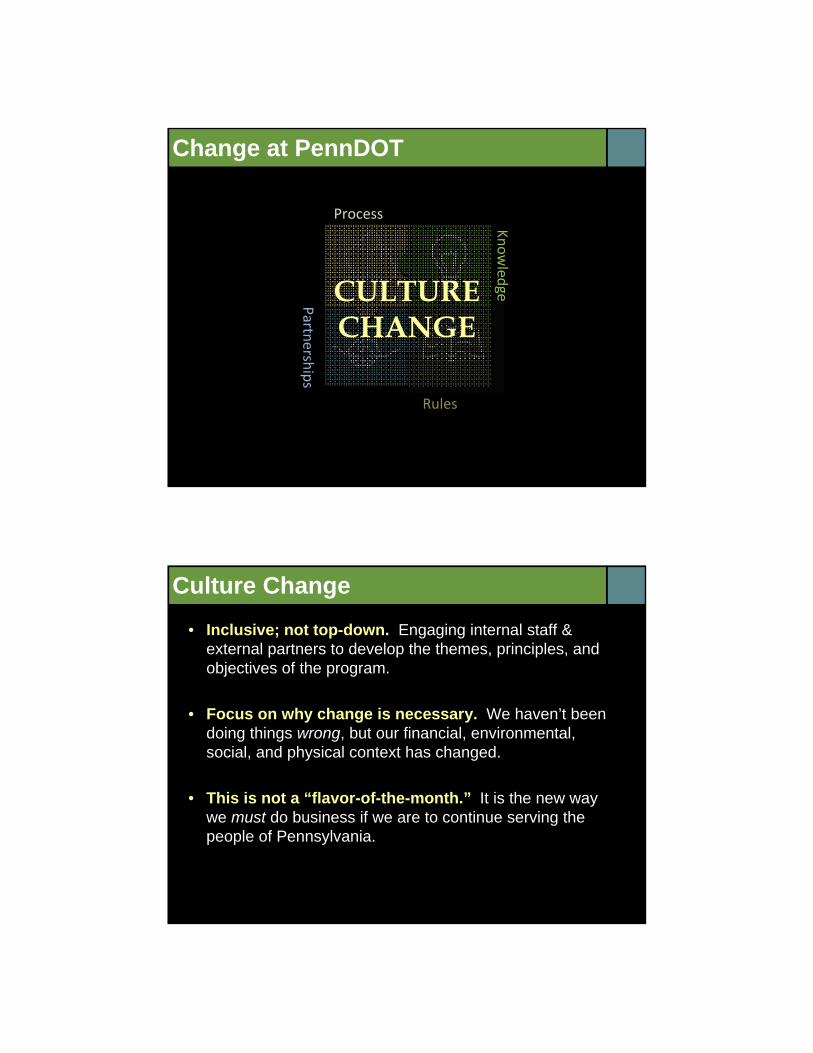
Change at PennDOT
Process
Knowledge
Partnerships
Rules
CULTURECHANGE
• Inclusive; not top-down. Engaging internal staff & external partners to develop the themes, principles, and objectives of the program.
• Focus on why change is necessary. We haven’t been doing things wrong, but our financial, environmental, social, and physical context has changed.
• This is not a “flavor-of-the-month.” It is the new way we must do business if we are to continue serving the people of Pennsylvania.
Culture Change
1. It is more costly.
2. It always requires design exceptions, which = failure.
3. It is not concerned with safety.
4. FHWA is not onboard.
5. This is just another temporary initiative that will disappear with the next
administration.
6. It does not apply to suburban or rural communities.
7. We cannot coordinate land use and transportation decisions.
8. It is just a way to save money (the inverse of #1!)
Top Myths About Smart Transportation…
Culture Change
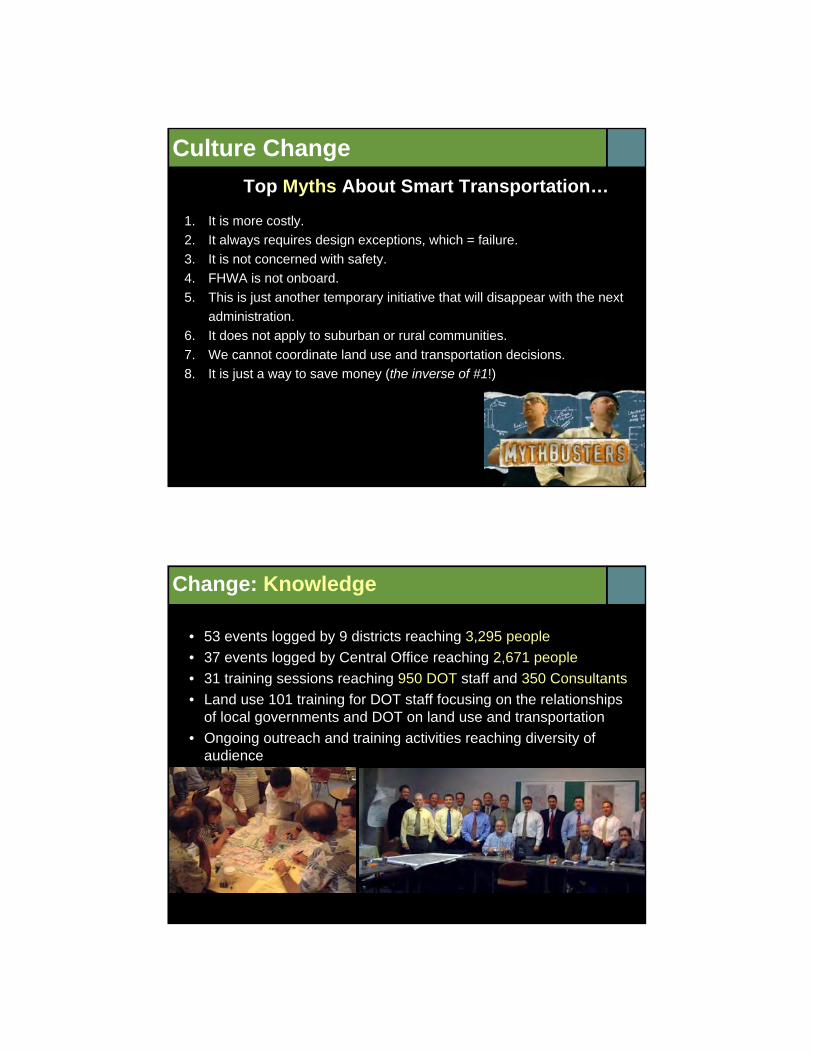
• 53 events logged by 9 districts reaching 3,295 people
• 37 events logged by Central Office reaching 2,671 people
• 31 training sessions reaching 950 DOT staff and 350 Consultants
• Land use 101 training for DOT staff focusing on the relationships of local governments and DOT on land use and transportation
• Ongoing outreach and training activities reaching diversity of audience
Change: Knowledge
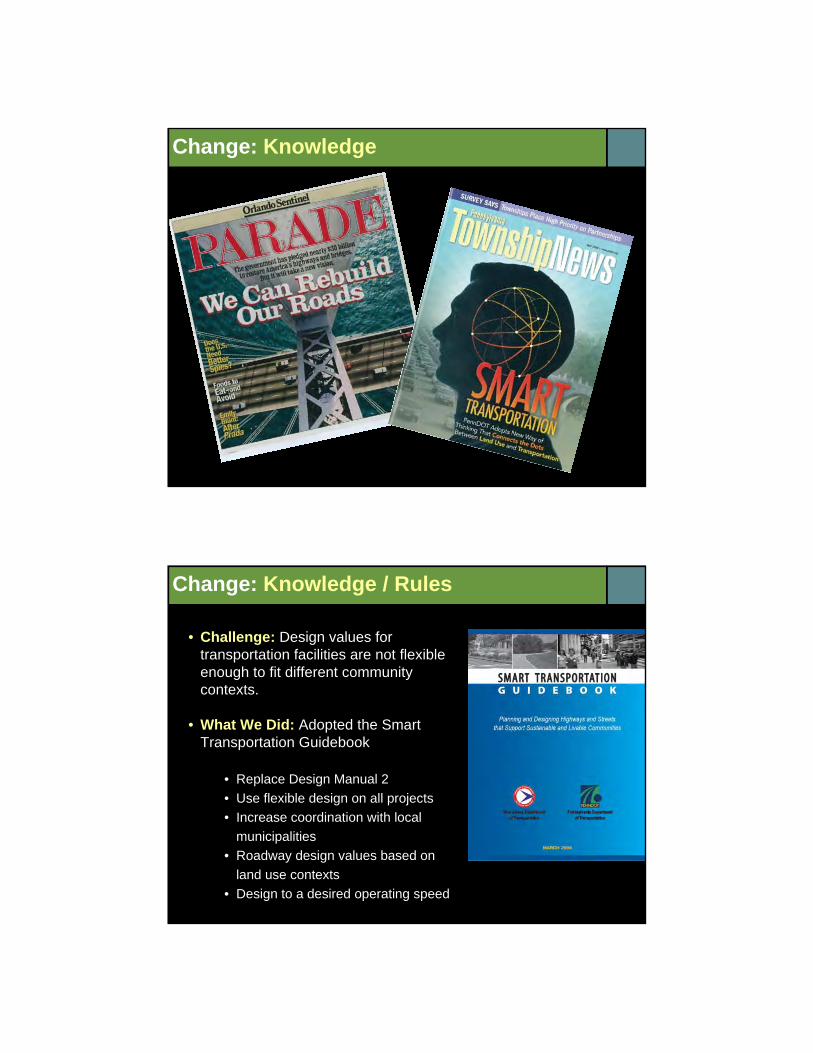
Change: Knowledge
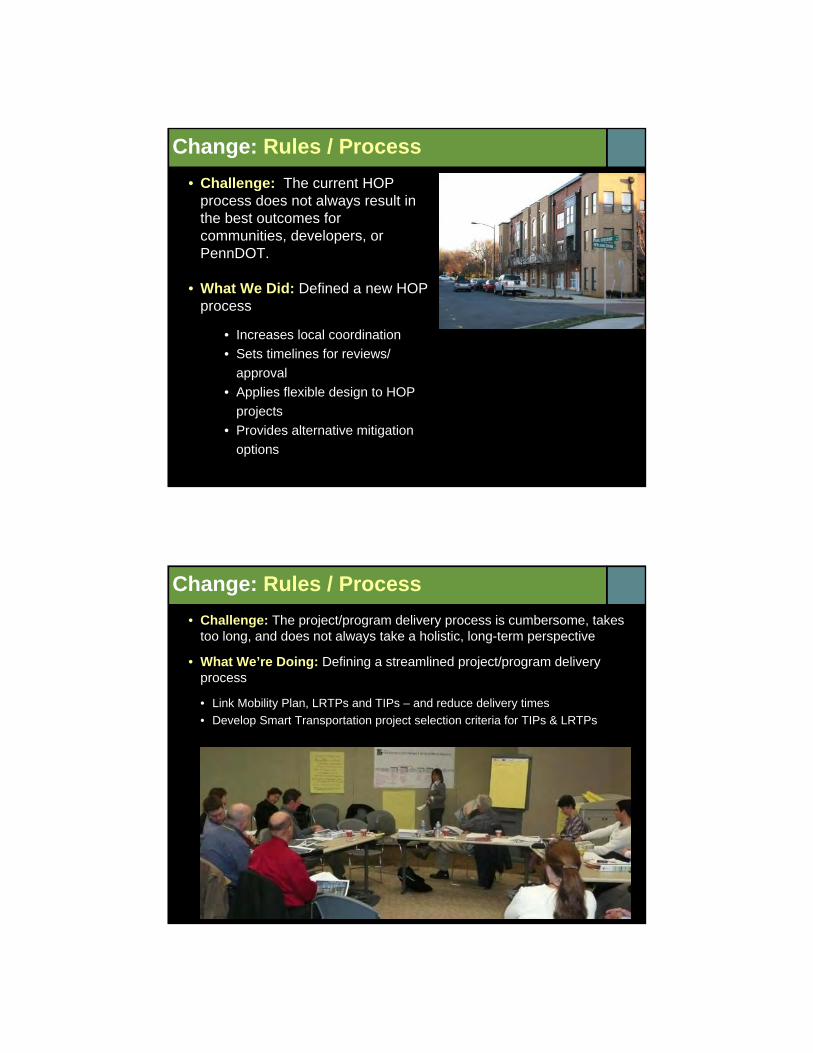
• Challenge: Design values for transportation facilities are not flexible enough to fit different community contexts.
• What We Did: Adopted the Smart Transportation Guidebook
• Replace Design Manual 2
• Use flexible design on all projects
• Increase coordination with local
municipalities
• Roadway design values based on
land use contexts
• Design to a desired operating speed
Change: Knowledge / Rules
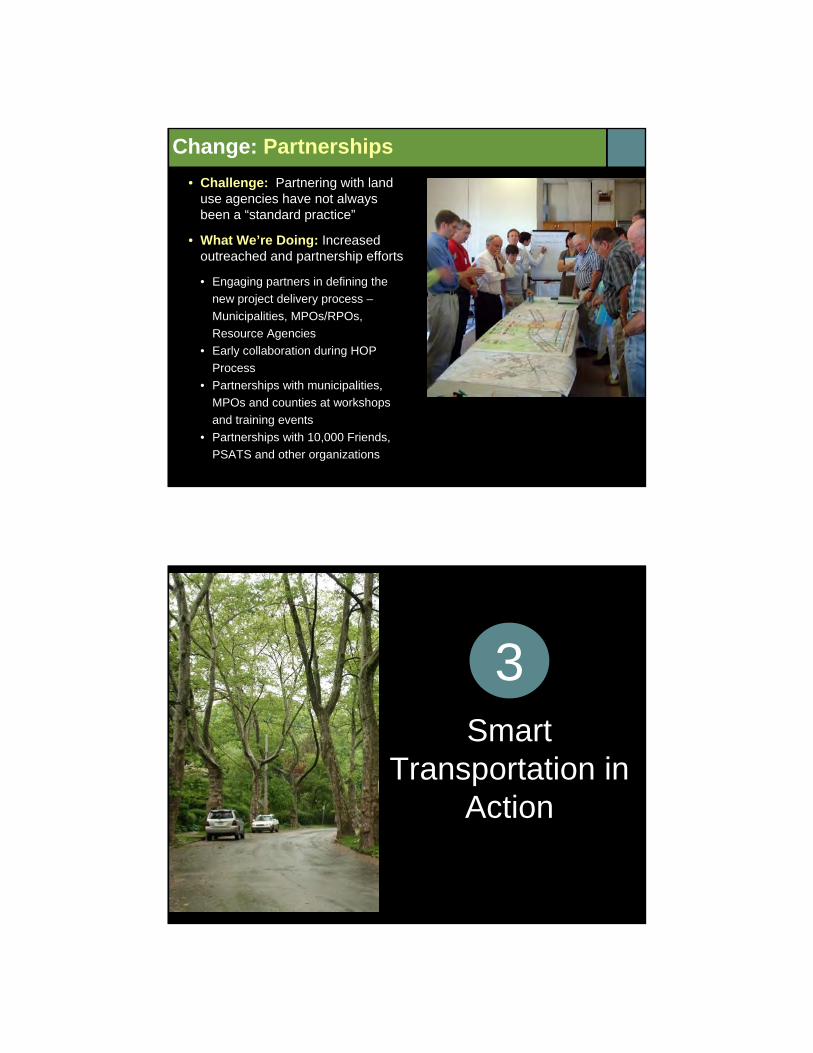
• Challenge: The current HOP process does not always result in the best outcomes for communities, developers, or PennDOT.
• What We Did: Defined a new HOP process
• Increases local coordination
• Sets timelines for reviews/
approval
• Applies flexible design to HOP
projects
• Provides alternative mitigation
options
Change: Rules / Process
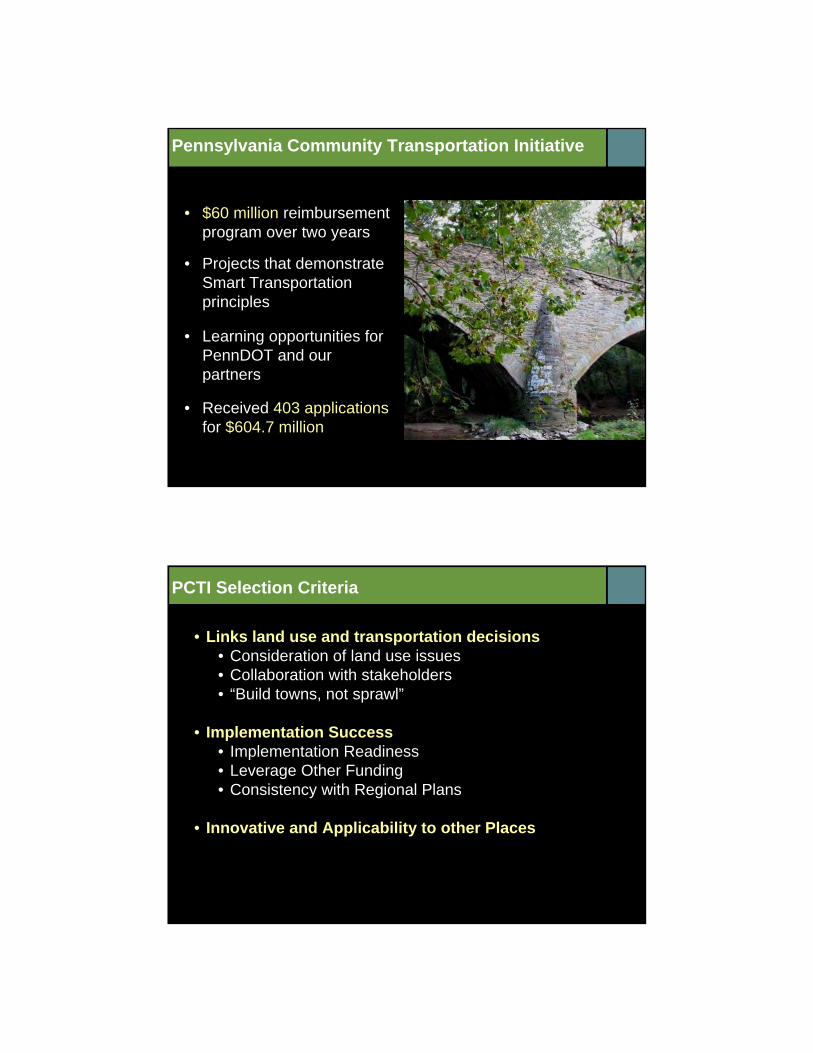
• Challenge: The project/program delivery process is cumbersome, takes too long, and does not always take a holistic, long-term perspective
• What We’re Doing: Defining a streamlined project/program delivery process
• Link Mobility Plan, LRTPs and TIPs – and reduce delivery times
• Develop Smart Transportation project selection criteria for TIPs & LRTPs
Change: Rules / Process
• Challenge: Partnering with land use agencies have not always been a “standard practice”
• What We’re Doing: Increased outreached and partnership efforts
• Engaging partners in defining the
new project delivery process –
Municipalities, MPOs/RPOs,
Resource Agencies
• Early collaboration during HOP
Process
• Partnerships with municipalities,
MPOs and counties at workshops
and training events
• Partnerships with 10,000 Friends,
PSATS and other organizations
Change: Partnerships
Smart Transportation in
Action
3
• $60 million reimbursement program over two years
• Projects that demonstrate Smart Transportation principles
• Learning opportunities for PennDOT and our partners
• Received 403 applications for $604.7 million
Pennsylvania Community Transportation Initiative
• Links land use and transportation decisions• Consideration of land use issues• Collaboration with stakeholders• “Build towns, not sprawl”
• Implementation Success• Implementation Readiness• Leverage Other Funding• Consistency with Regional Plans
• Innovative and Applicability to other Places
PCTI Selection Criteria
• Supporting Local Economic Development
• Encouraging Multi-modal Travel (through land use and transportation measures)
• Enhancing the Existing Transportation Network
• Improving Connectivity
• Supporting Transit-Oriented, Brownfield Developments
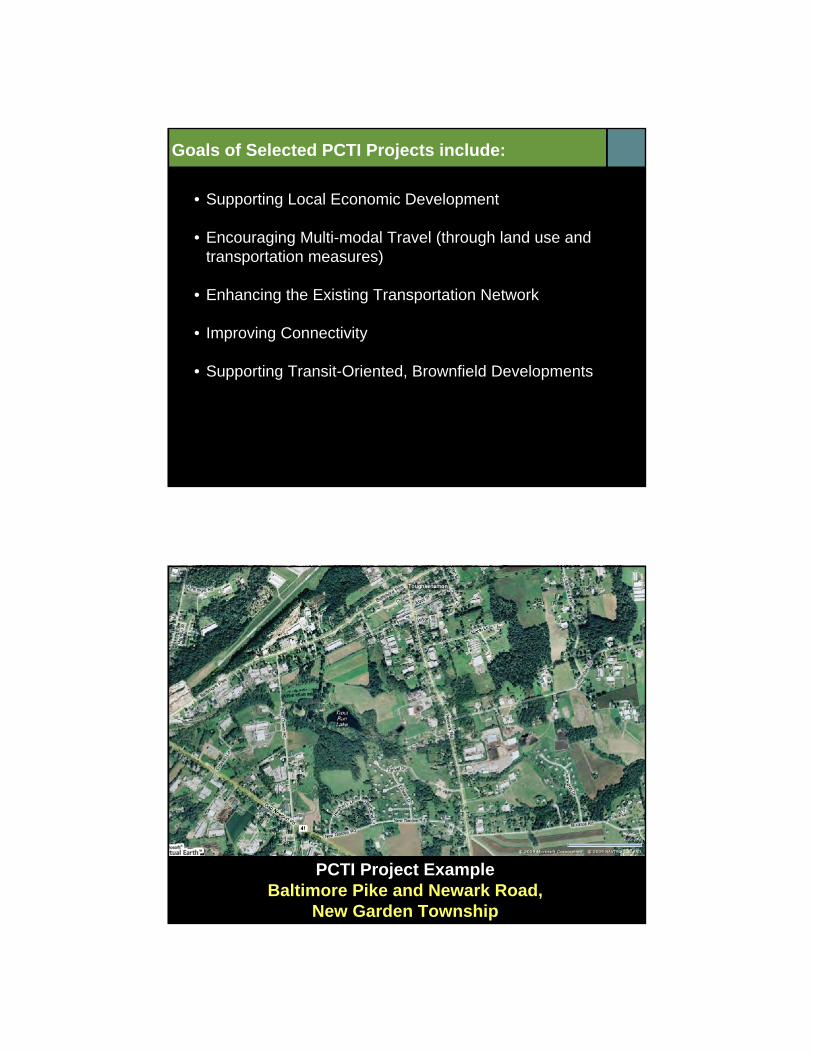
Goals of Selected PCTI Projects include:
PCTI Project ExampleBaltimore Pike and Newark Road,
New Garden Township
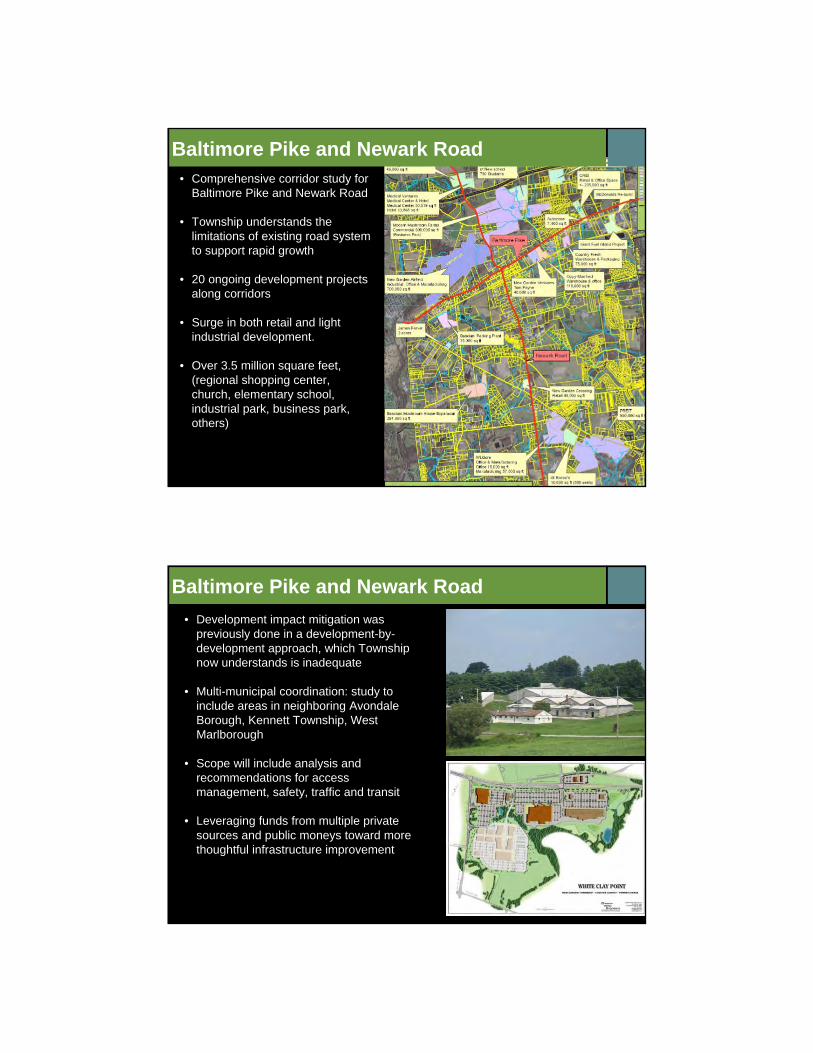
• Comprehensive corridor study for Baltimore Pike and Newark Road
• Township understands the limitations of existing road system to support rapid growth
• 20 ongoing development projects along corridors
• Surge in both retail and light industrial development.
• Over 3.5 million square feet, (regional shopping center, church, elementary school, industrial park, business park, others)
Baltimore Pike and Newark Road
• Development impact mitigation was previously done in a development-by-development approach, which Township now understands is inadequate
• Multi-municipal coordination: study to include areas in neighboring Avondale Borough, Kennett Township, West Marlborough
• Scope will include analysis and recommendations for access management, safety, traffic and transit
• Leveraging funds from multiple private sources and public moneys toward more thoughtful infrastructure improvement
Baltimore Pike and Newark Road
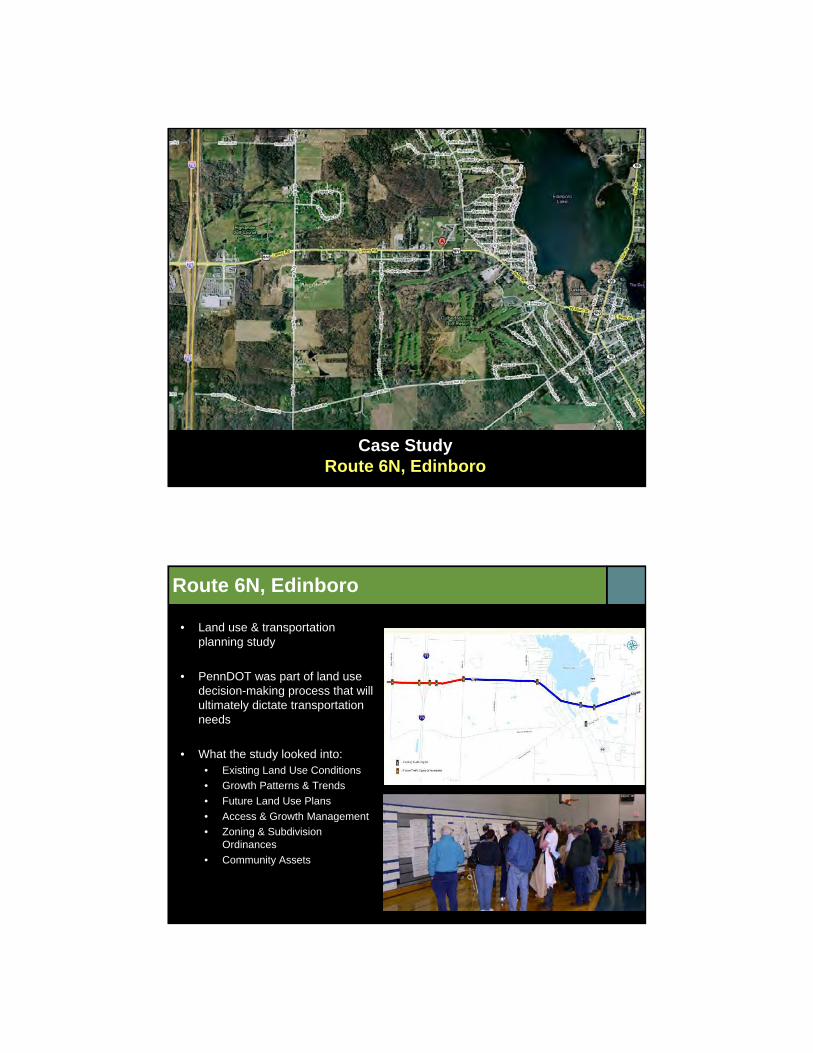
Case StudyRoute 6N, Edinboro
• Land use & transportation planning study
• PennDOT was part of land use decision-making process that will ultimately dictate transportation needs
• What the study looked into:• Existing Land Use Conditions
• Growth Patterns & Trends
• Future Land Use Plans
• Access & Growth Management
• Zoning & Subdivision Ordinances
• Community Assets
Route 6N, Edinboro
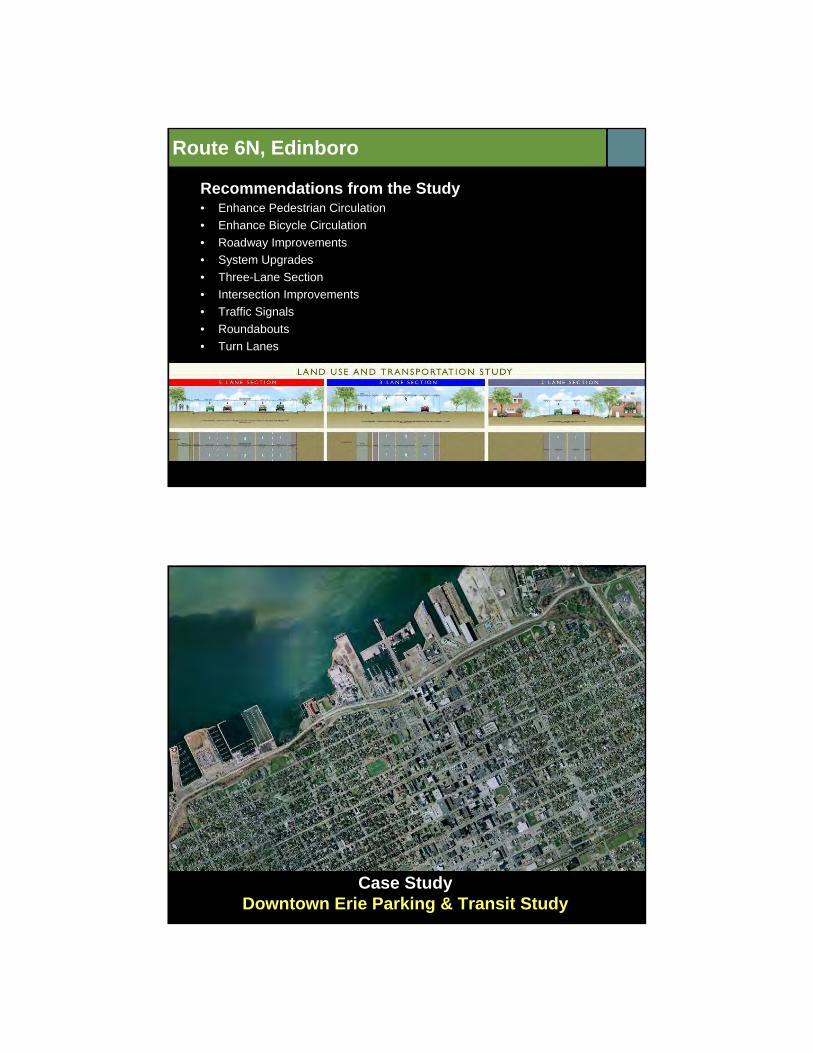
Recommendations from the Study• Enhance Pedestrian Circulation
• Enhance Bicycle Circulation
• Roadway Improvements
• System Upgrades
• Three-Lane Section
• Intersection Improvements
• Traffic Signals
• Roundabouts
• Turn Lanes
Route 6N, Edinboro
Case StudyDowntown Erie Parking & Transit Study
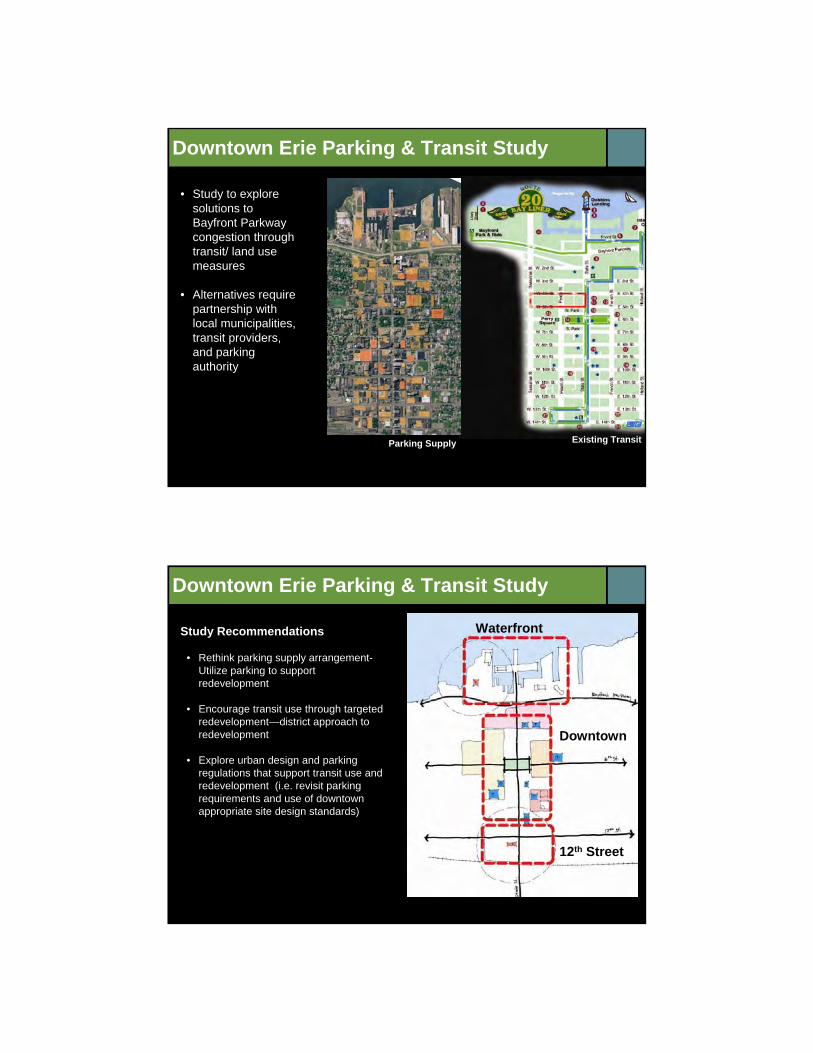
Downtown Erie Parking & Transit Study
• Study to explore solutions to Bayfront Parkway congestion through transit/ land use measures
• Alternatives require partnership with local municipalities, transit providers, and parking authority
Parking Supply Existing Transit
Study Recommendations
• Rethink parking supply arrangement-Utilize parking to support redevelopment
• Encourage transit use through targeted redevelopment—district approach to redevelopment
• Explore urban design and parking regulations that support transit use and redevelopment (i.e. revisit parking requirements and use of downtown appropriate site design standards)
12th Street
Downtown
Waterfront
Downtown Erie Parking & Transit Study
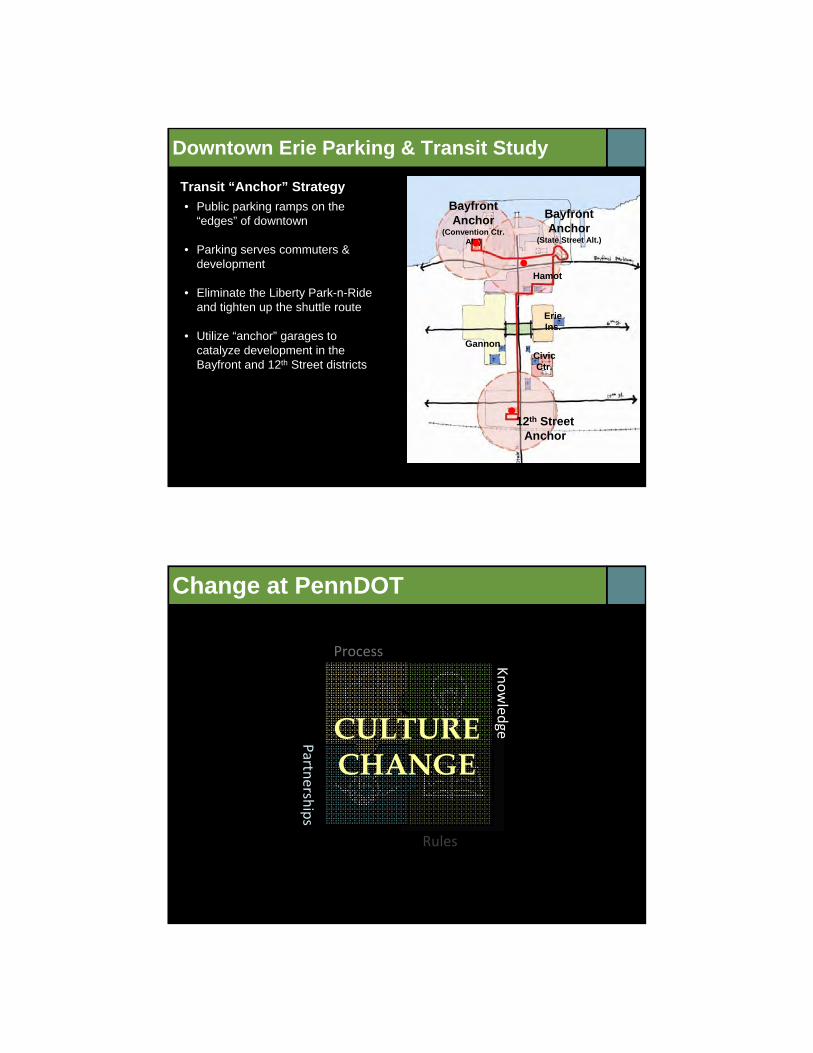
Transit “Anchor” Strategy
Bayfront Anchor
(Convention Ctr. Alt.)
12th Street Anchor
Hamot
Erie Ins.
GannonCivic Ctr.
• Public parking ramps on the “edges” of downtown
• Parking serves commuters & development
• Eliminate the Liberty Park-n-Ride and tighten up the shuttle route
• Utilize “anchor” garages to catalyze development in the Bayfront and 12th Street districts
Bayfront Anchor
(State Street Alt.)
Downtown Erie Parking & Transit Study
Change at PennDOT
Process
Knowledge
Partnerships
Rules
CULTURECHANGE
“The problems we have created cannot be solved with the same thinking that created them.”
Image Source: Library of Congress, Prints & Photographs Division. Original copyright expired.
www.smart-transportation.com
•1
Transit Authority of River City
AASHTO 2009
Transit Authority of River City
•2
TARC Mission
The Transit Authority of River City’s mission is to explore and implement transportation opportunities that enhance the social, economic and environmental well-being of the Greater Louisville community.
TARC At A Glance
• 16.4 million customers
• 12 million miles
• 52 routes in 5 counties
• 268 buses and trolleys
• 90 paratransit vehicles
• 690 team members
• 59,665 riders daily
•3
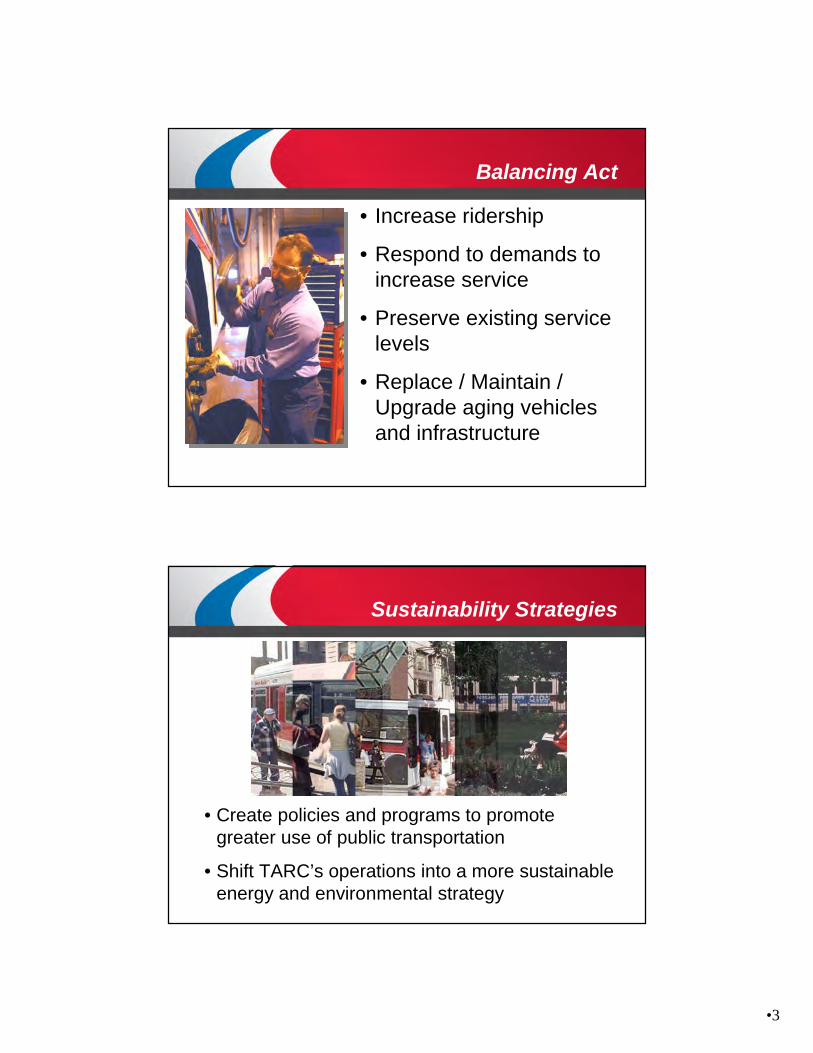
Balancing Act
• Increase ridership
• Respond to demands to increase service
• Preserve existing service levels
• Replace / Maintain / Upgrade aging vehicles and infrastructure
• Create policies and programs to promote greater use of public transportation
• Shift TARC’s operations into a more sustainable energy and environmental strategy
Sustainability Strategies
•4
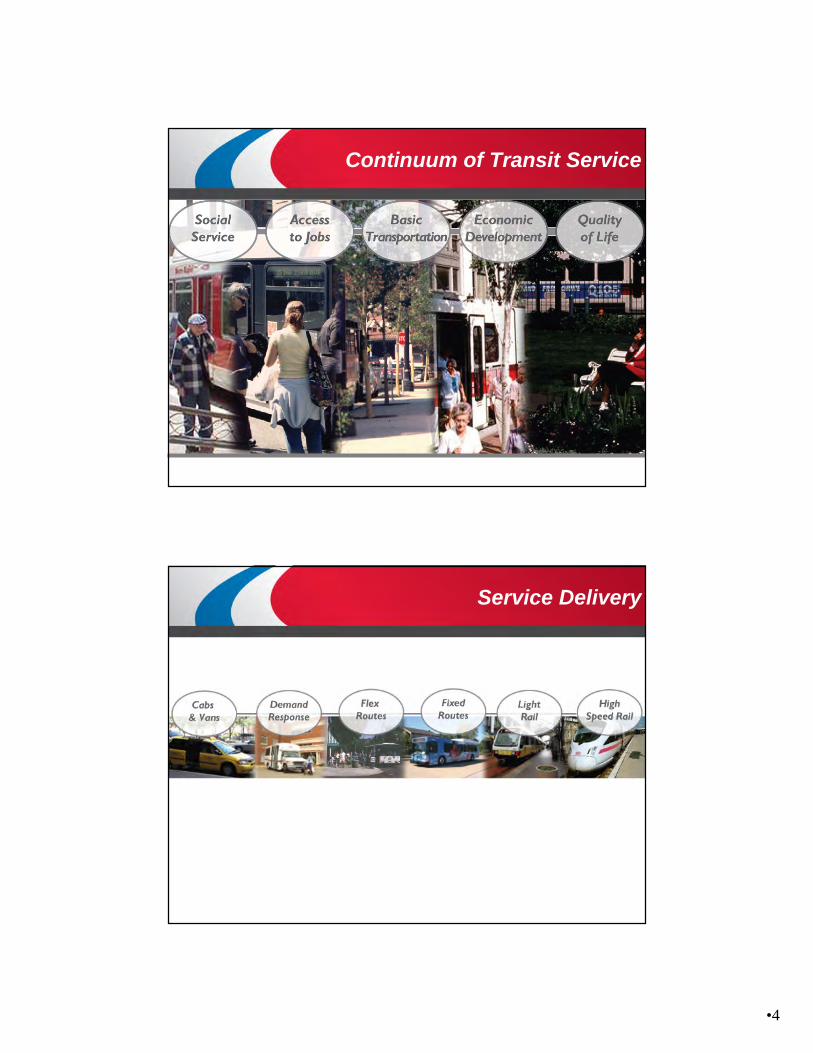
Continuum of Transit Service
Service Delivery
•5
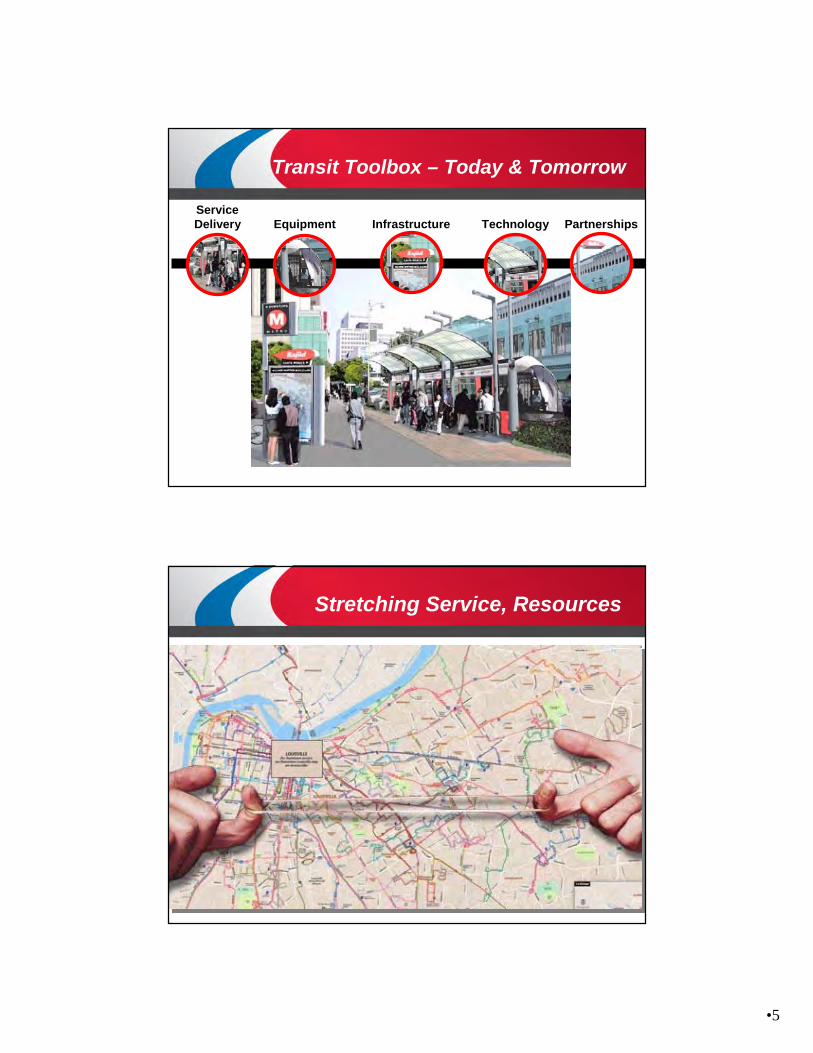
Equipment Infrastructure Technology PartnershipsServiceDelivery
Transit Toolbox – Today & Tomorrow
Stretching Service, Resources
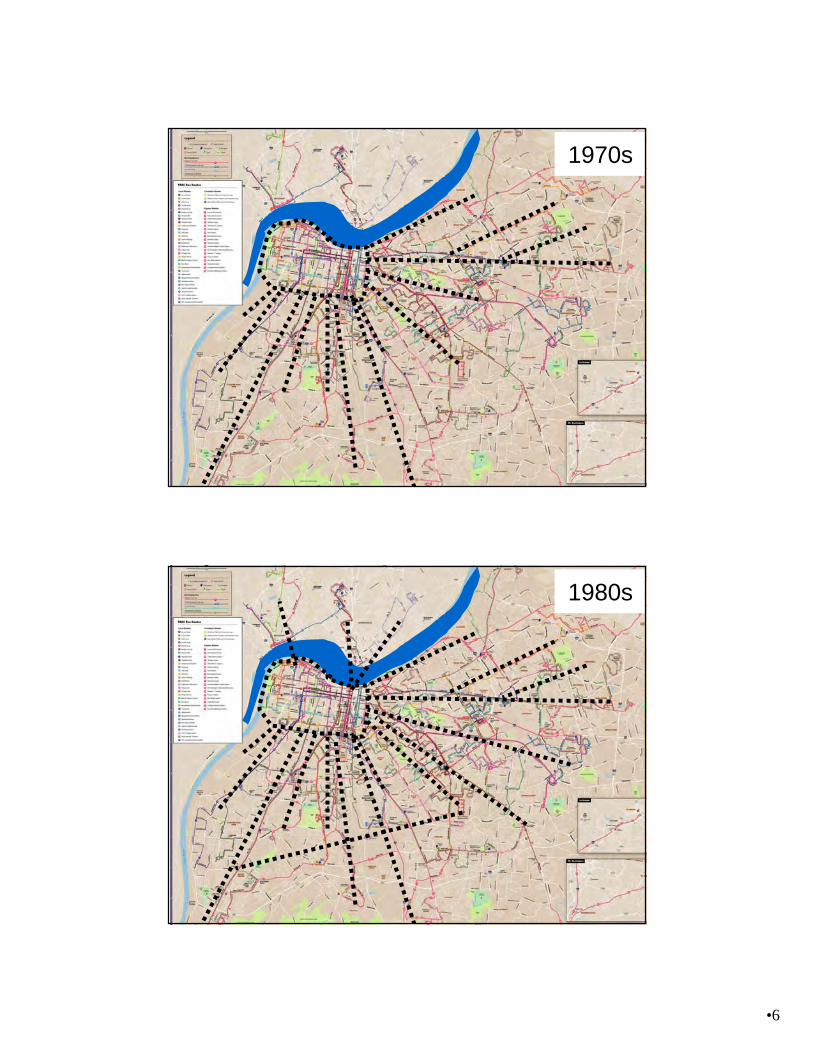
•6
1970s
1980s
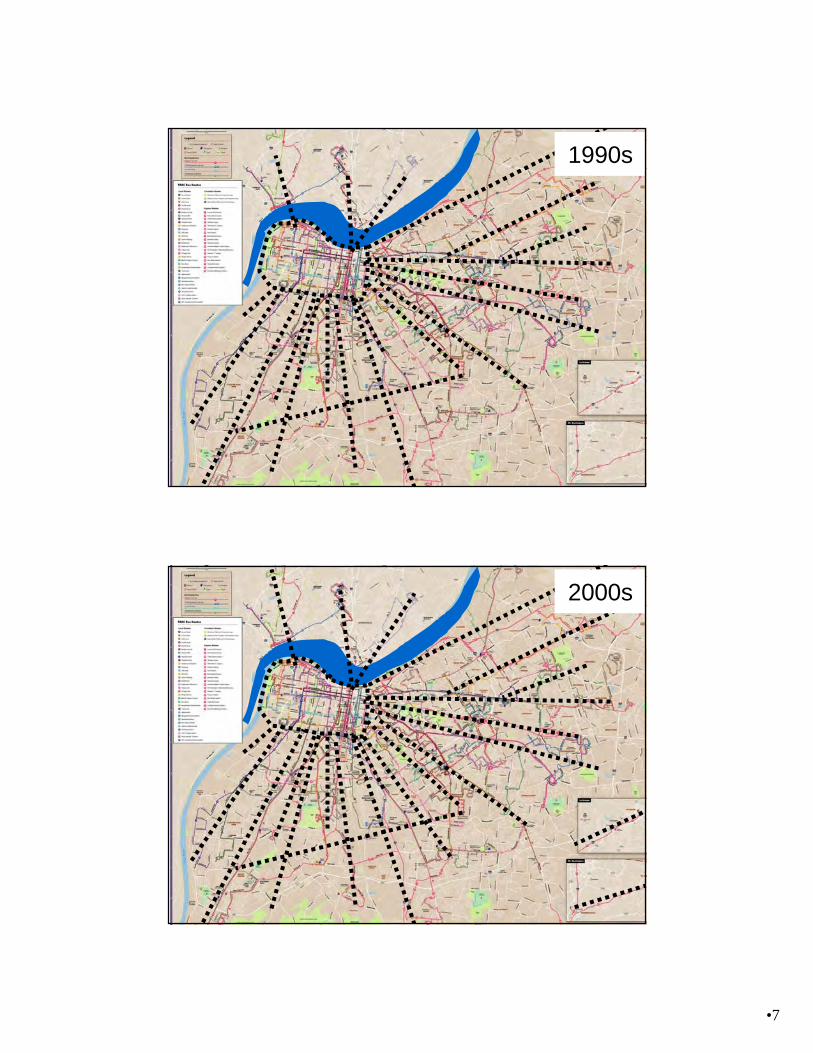
•7
1990s
2000s
•8
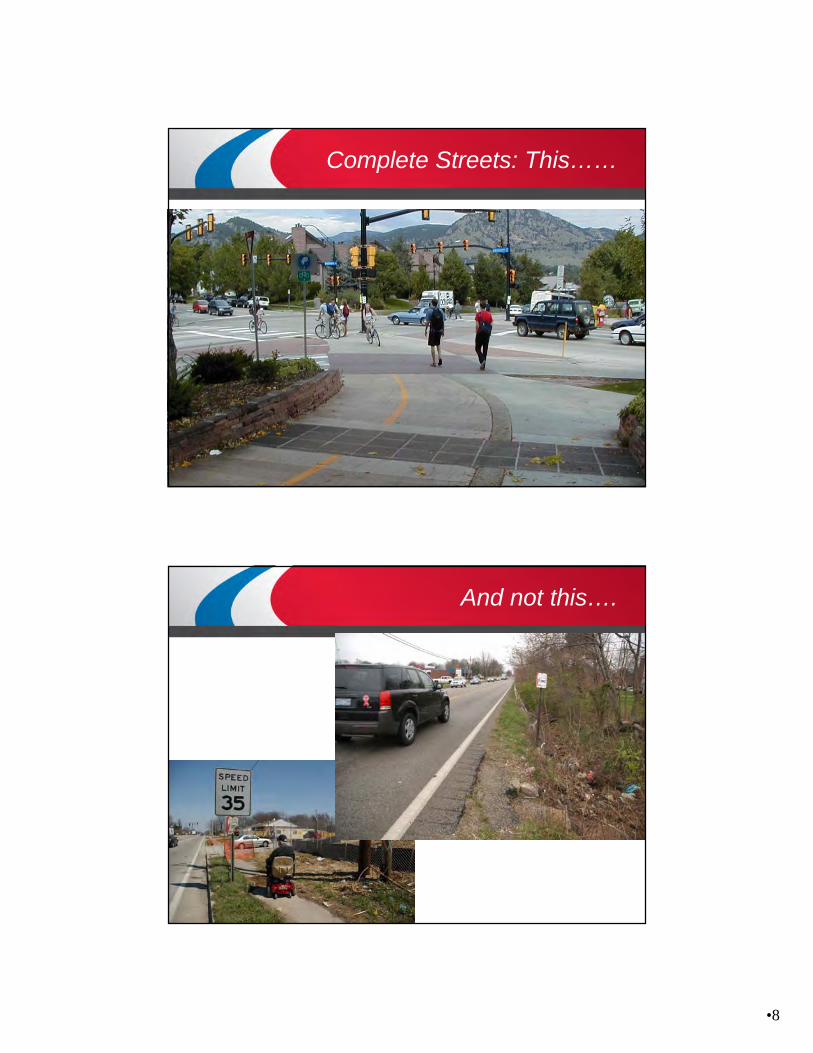
Complete Streets: This……
• TTI data
And not this….
•9
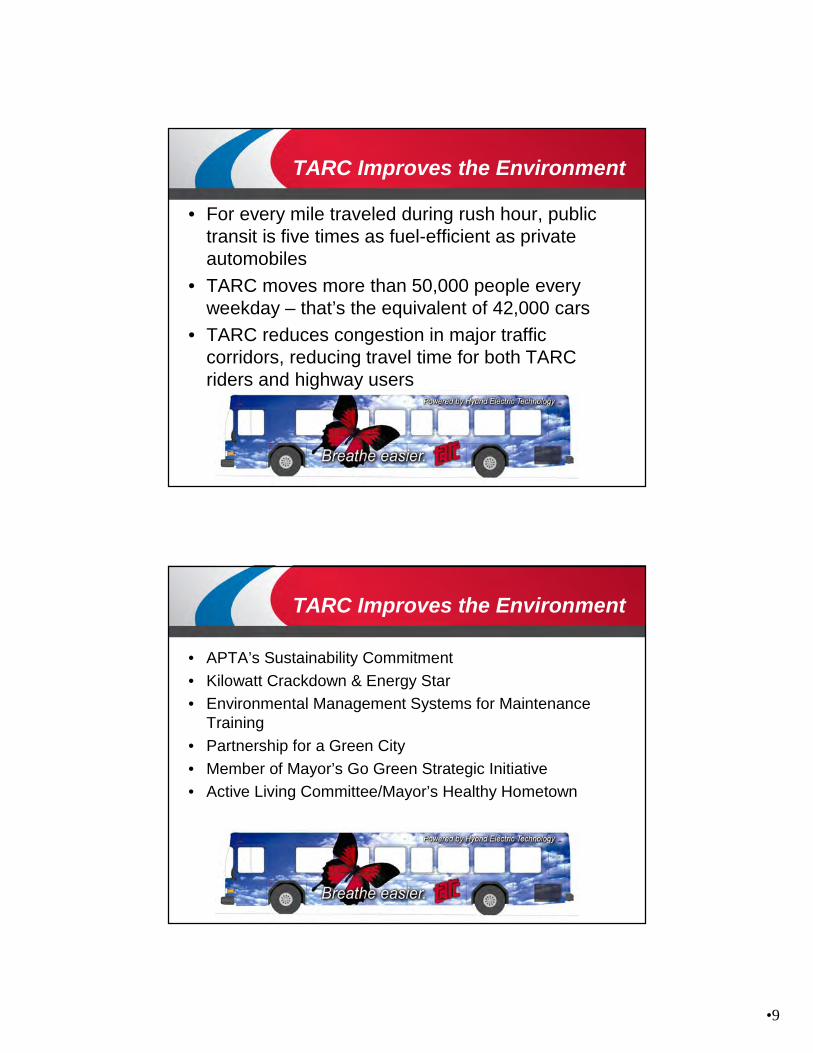
• For every mile traveled during rush hour, public transit is five times as fuel-efficient as private automobiles
• TARC moves more than 50,000 people every weekday – that’s the equivalent of 42,000 cars
• TARC reduces congestion in major traffic corridors, reducing travel time for both TARC riders and highway users
TARC Improves the Environment
• APTA’s Sustainability Commitment
• Kilowatt Crackdown & Energy Star
• Environmental Management Systems for Maintenance Training
• Partnership for a Green City
• Member of Mayor’s Go Green Strategic Initiative
• Active Living Committee/Mayor’s Healthy Hometown
TARC Improves the Environment
•10
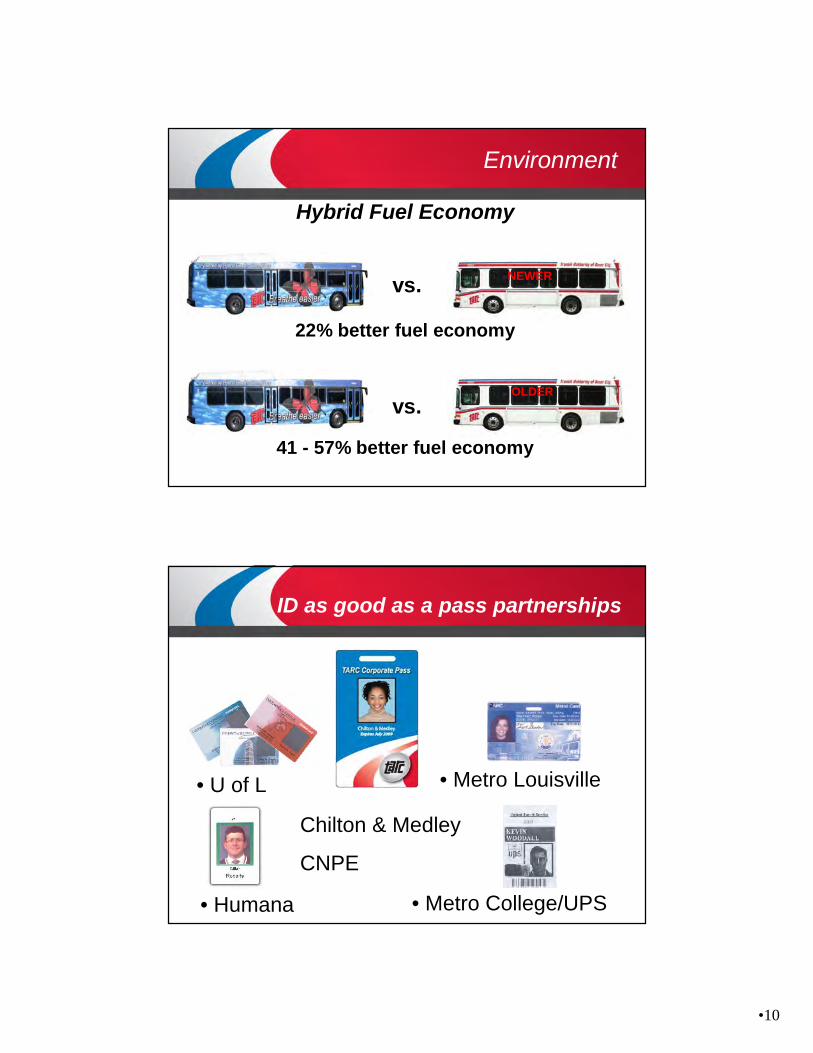
22% better fuel economy
41 - 57% better fuel economy
vs.
vs.NEWER
OLDER
Hybrid Fuel Economy
Environment
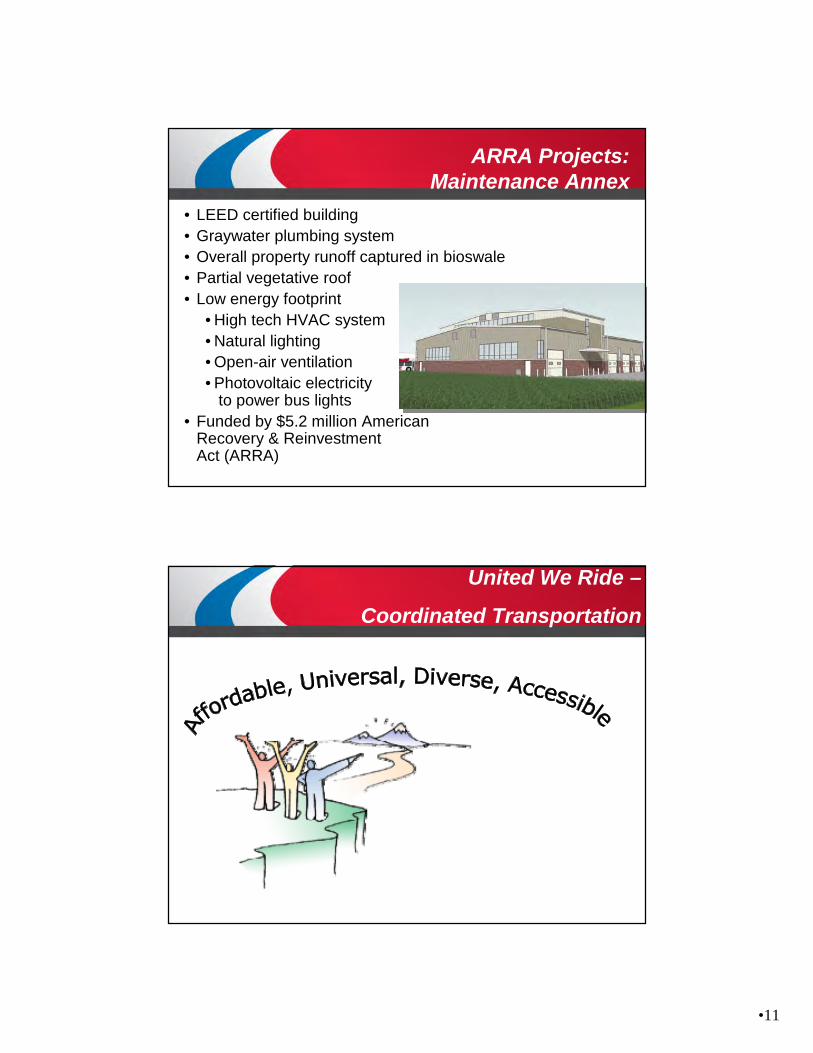
• Metro Louisville
• Metro College/UPS
• U of L
• Humana
ID as good as a pass partnerships
Chilton & Medley
CNPE
•11
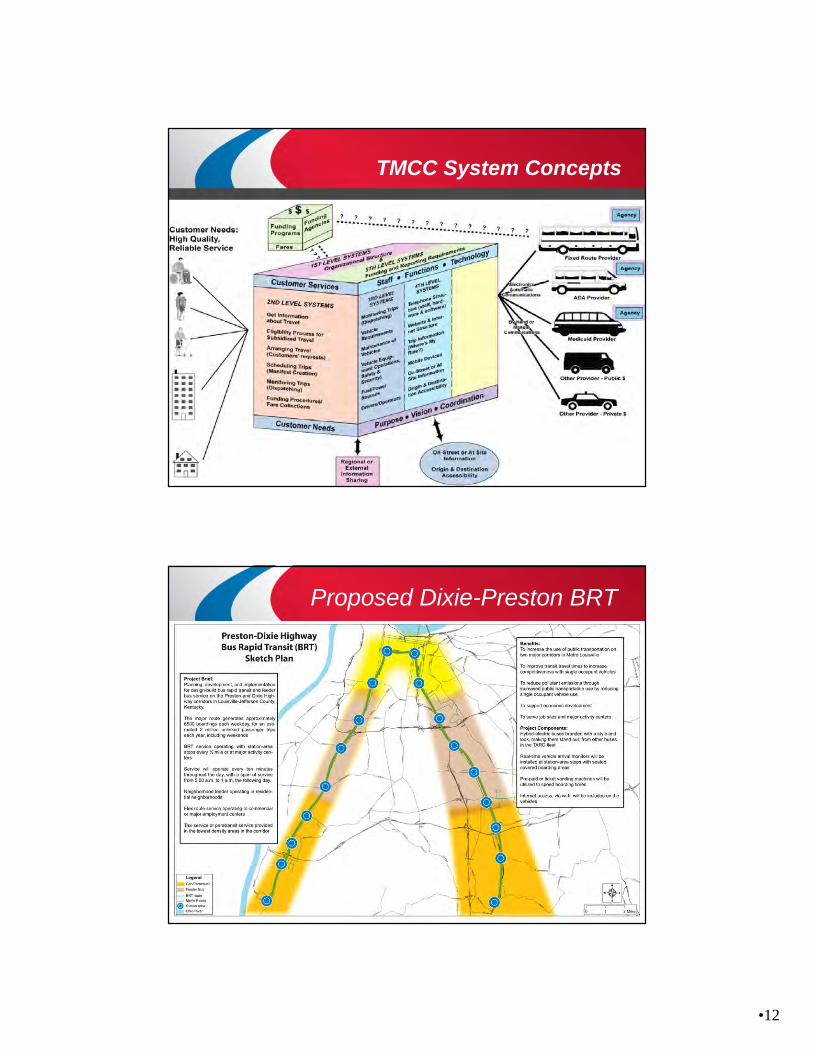
• LEED certified building• Graywater plumbing system• Overall property runoff captured in bioswale• Partial vegetative roof• Low energy footprint
• High tech HVAC system• Natural lighting• Open-air ventilation• Photovoltaic electricity
to power bus lights• Funded by $5.2 million American
Recovery & ReinvestmentAct (ARRA)
ARRA Projects:Maintenance Annex
United We Ride –
Coordinated Transportation
•12
TMCC System Concepts
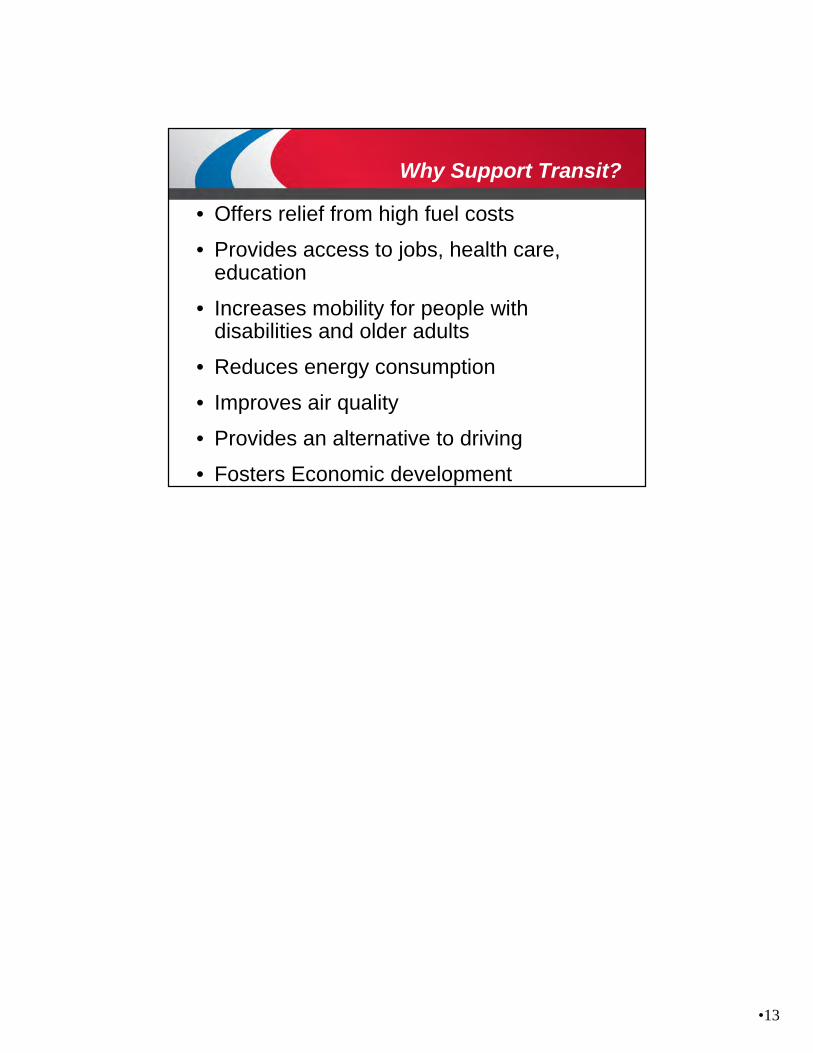
Proposed Dixie-Preston BRT
•13
Why Support Transit?
• Offers relief from high fuel costs
• Provides access to jobs, health care, education
• Increases mobility for people with disabilities and older adults
• Reduces energy consumption
• Improves air quality
• Provides an alternative to driving
• Fosters Economic development
1
Southeastern PennsylvaniaTransportation Authority
May 28, 2009
2
What is SEPTA?
Largest transit system in Pennsylvania; fifth largest in nation
Serves Bucks, Chester, Delaware, Montgomery and Philadelphia Counties (2,184 Square Miles, 3.9 Million Residents)
Operates extensive bus, subway, light rail, and regional rail network
Annual ridership exceeds 300 million trips
Established from bankrupt private transit companies
2
3
What is SEPTA?
Operates:117 Bus Routes8 Trolley (light rail) Lines3 Trackless Trolley Routes2 Subway/Elevated (heavy rail) Lines1 Interurban High-Speed Line (heavy rail)13 Regional Railroad (commuter rail) LinesShared Ride Service in the City of PhiladelphiaADA Paratransit service throughout the five-county regionSmall bus circulator and shuttle services connecting fixed route operations to business, health and educational centers, as well as to park and ride facilities.
4
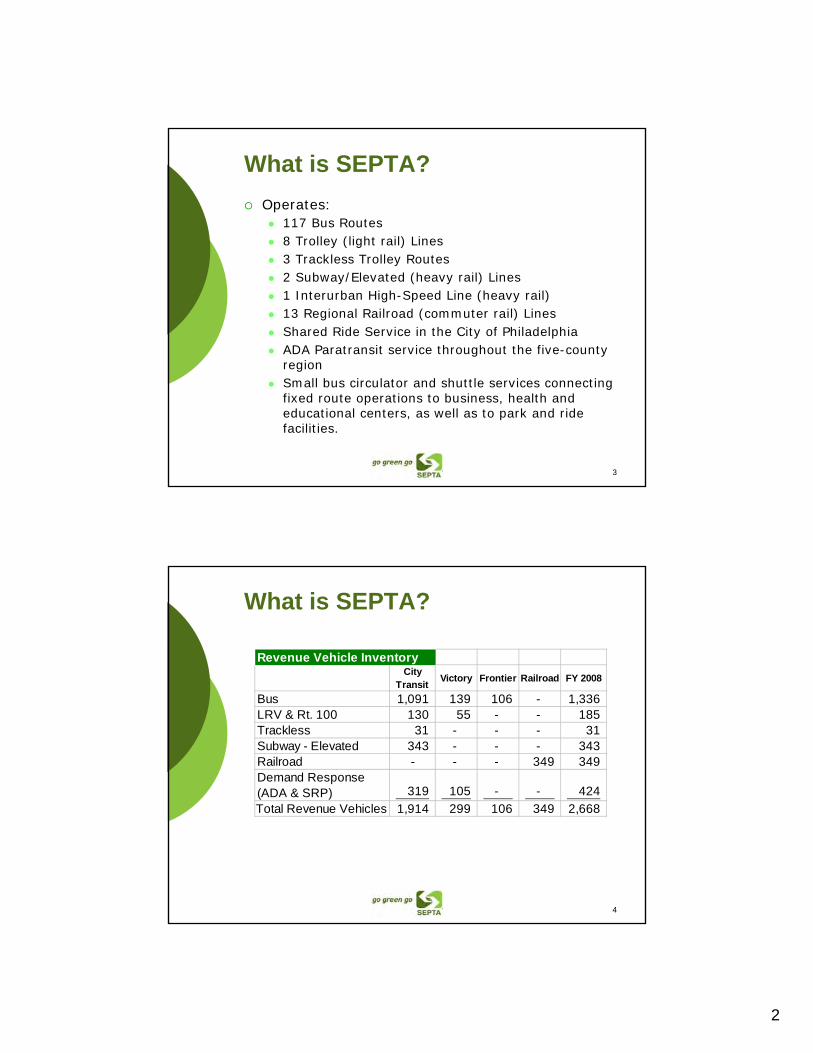
What is SEPTA?
Revenue Vehicle Inventory City
TransitVictory Frontier Railroad FY 2008
Bus 1,091 139 106 - 1,336 LRV & Rt. 100 130 55 - - 185 Trackless 31 - - - 31 Subway - Elevated 343 - - - 343 Railroad - - - 349 349 Demand Response (ADA & SRP) 319 105 - - 424
Total Revenue Vehicles 1,914 299 106 349 2,668
3
5
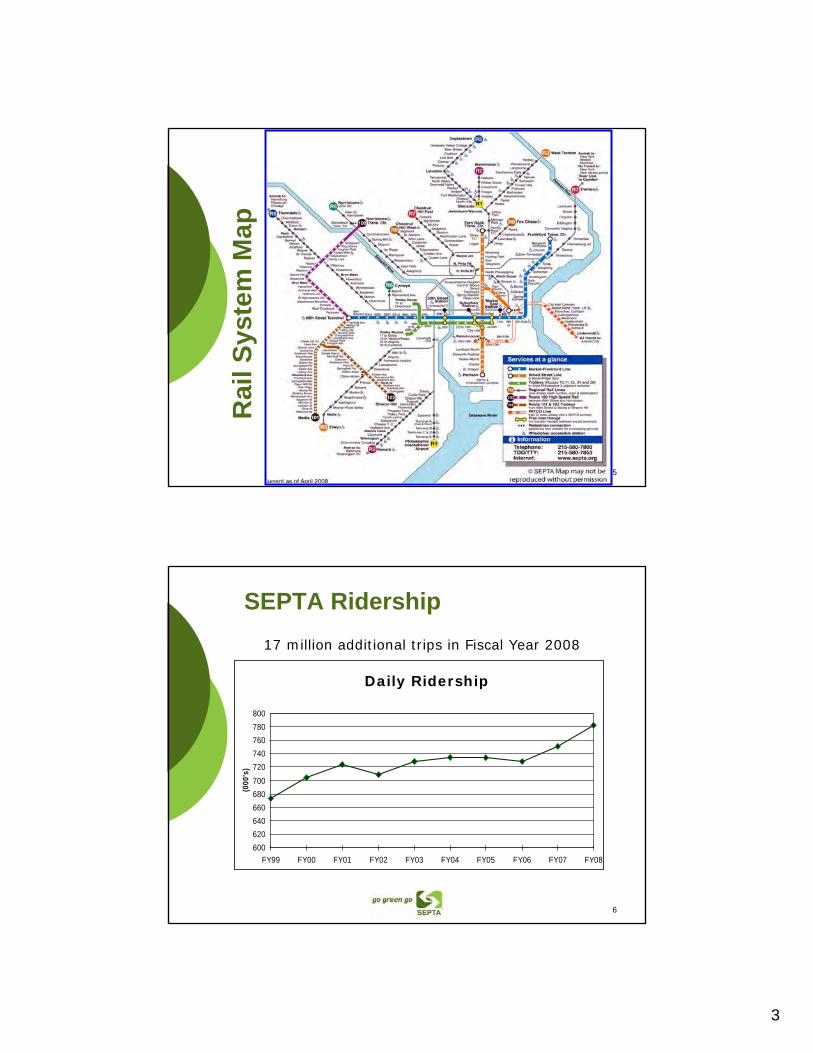
Rai
l Sys
tem
Map
6
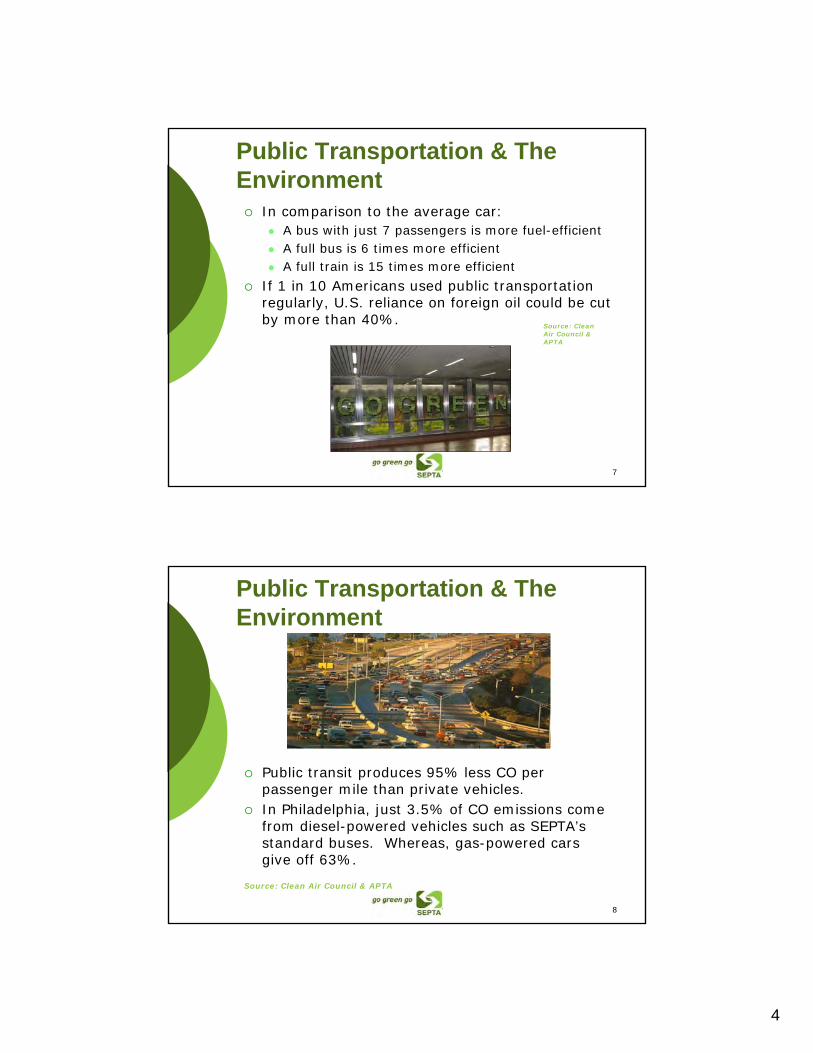
SEPTA Ridership
17 million additional trips in Fiscal Year 2008
600
620
640
660
680
700
720
740
760
780
800
FY99 FY00 FY01 FY02 FY03 FY04 FY05 FY06 FY07 FY08
(000
's)
Daily Ridership
4
7
Public Transportation & The Environment
In comparison to the average car:A bus with just 7 passengers is more fuel-efficientA full bus is 6 times more efficientA full train is 15 times more efficient
If 1 in 10 Americans used public transportation regularly, U.S. reliance on foreign oil could be cut by more than 40%.
Source: Clean Air Council & APTA
8
Public Transportation & The Environment
Public transit produces 95% less CO per passenger mile than private vehicles.In Philadelphia, just 3.5% of CO emissions come from diesel-powered vehicles such as SEPTA’sstandard buses. Whereas, gas-powered cars give off 63%.
Source: Clean Air Council & APTA
5
9
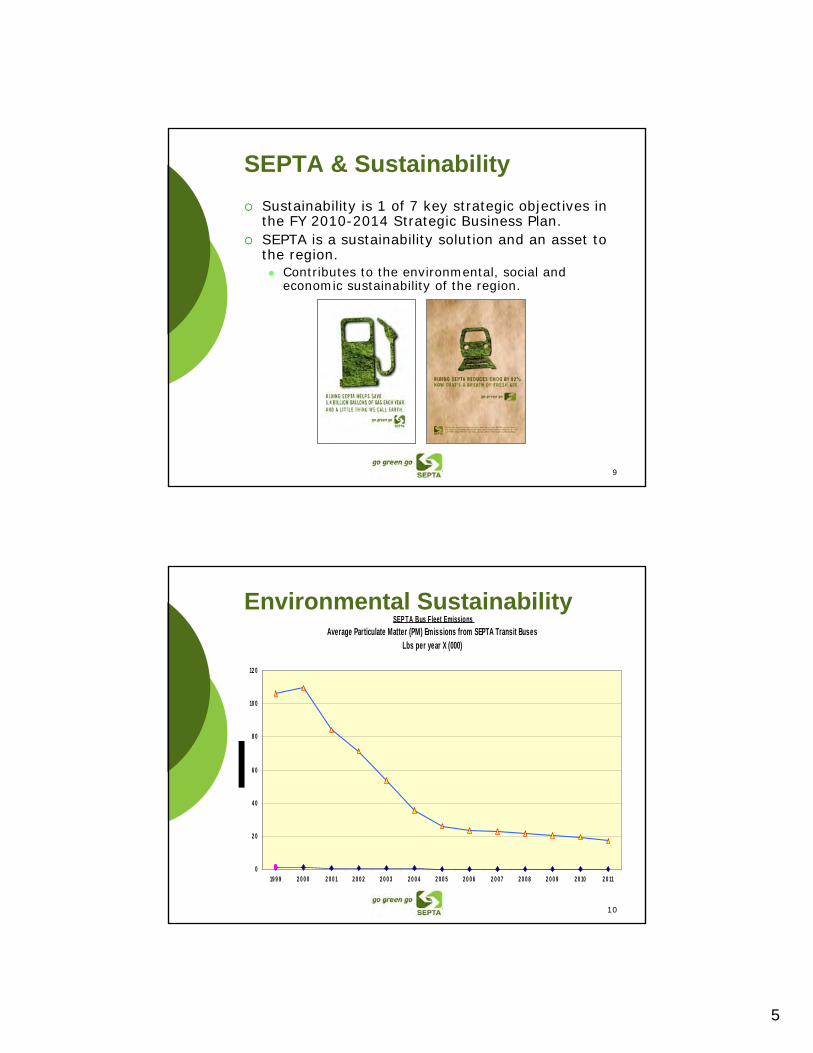
SEPTA & Sustainability
Sustainability is 1 of 7 key strategic objectives in the FY 2010-2014 Strategic Business Plan. SEPTA is a sustainability solution and an asset to the region.
Contributes to the environmental, social and economic sustainability of the region.
10
Environmental Sustainability SEP TA Bus Fleet Emissions
Average Particulate Matter (PM) Emissions from SEPTA Transit BusesLbs per year X (000)
0
2 0
4 0
6 0
8 0
10 0
12 0
19 9 9 2 0 0 0 2 0 0 1 2 0 0 2 2 0 0 3 2 0 0 4 2 0 0 5 2 0 0 6 2 0 0 7 2 0 0 8 2 0 0 9 2 0 10 2 0 11
6
11
Environmental SustainabilityImprovements in vehicle emissions due to:
Continued support to substantially reduce the age of the fleetReplacement of older buses with new buses that utilize significantly improved emission controlsRetrofitting existing fleets with improved emission control
Example: particulate filters
Purchase of low-sulfur fuel for all busesIntroduction of hybrid buses that reduce fuel consumption and in turn reduce emissions
12
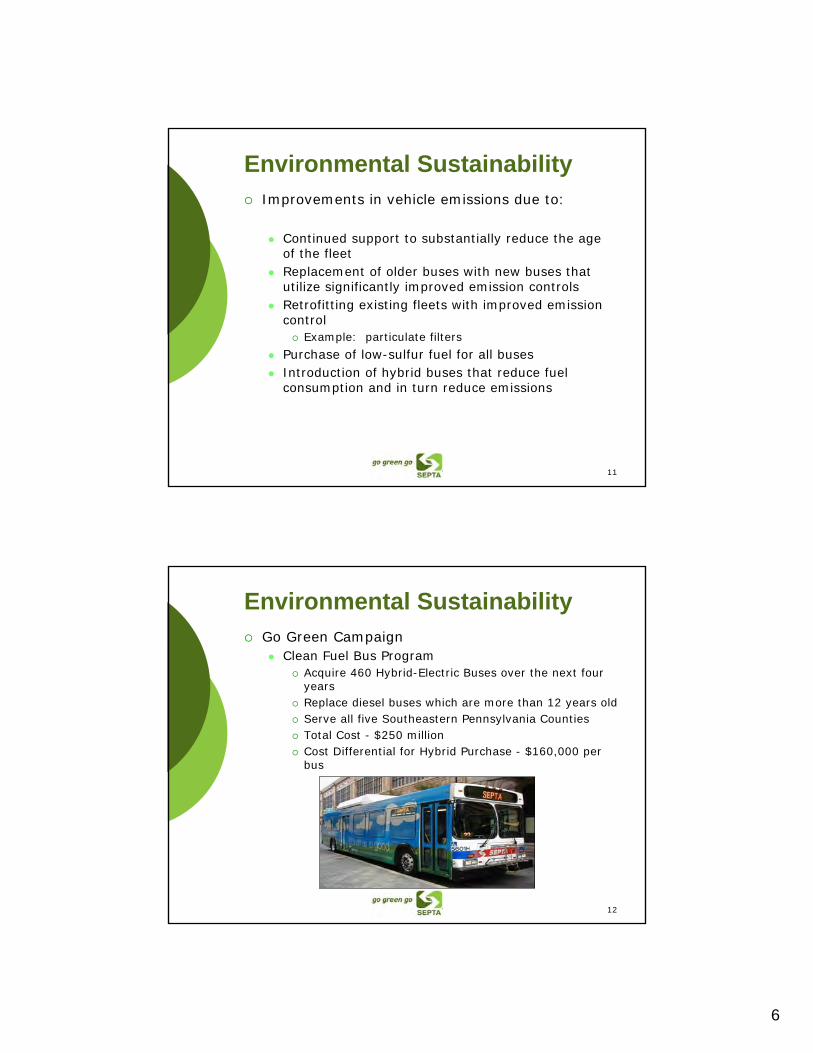
Environmental SustainabilityGo Green Campaign
Clean Fuel Bus ProgramAcquire 460 Hybrid-Electric Buses over the next four yearsReplace diesel buses which are more than 12 years oldServe all five Southeastern Pennsylvania CountiesTotal Cost - $250 millionCost Differential for Hybrid Purchase - $160,000 per bus
7
13
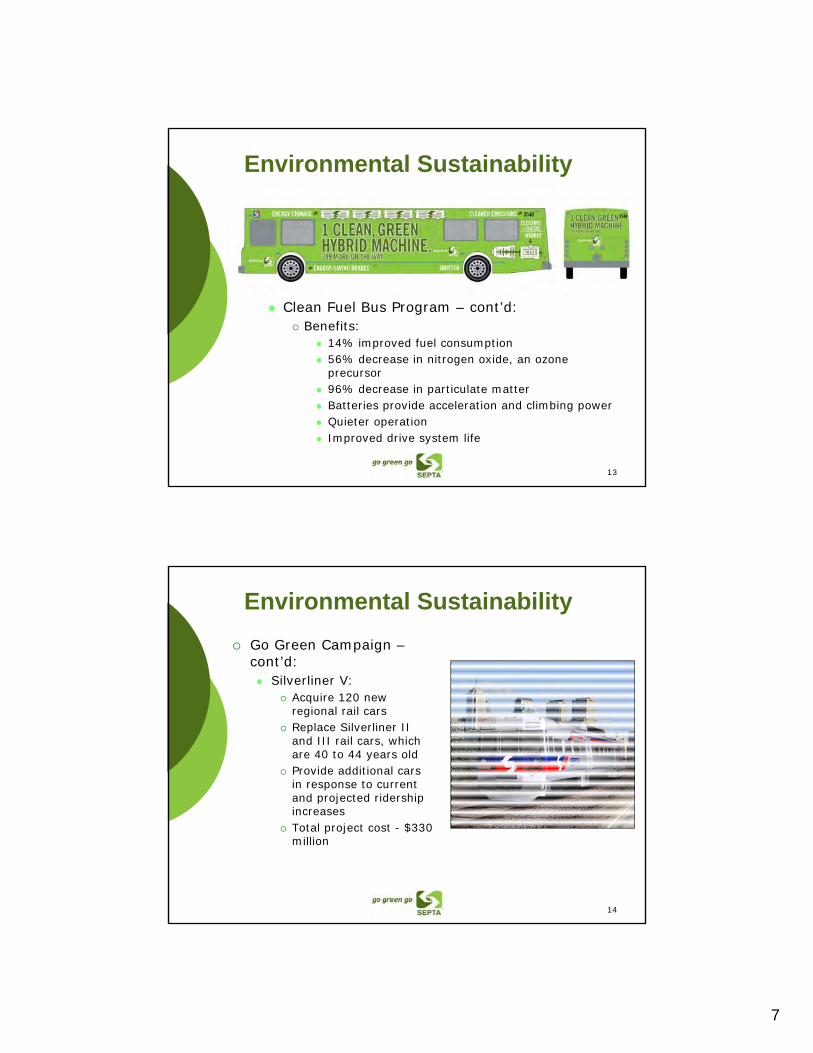
Environmental Sustainability
Clean Fuel Bus Program – cont’d:Benefits:
14% improved fuel consumption56% decrease in nitrogen oxide, an ozone precursor 96% decrease in particulate matterBatteries provide acceleration and climbing powerQuieter operationImproved drive system life
14
Environmental Sustainability
Go Green Campaign –cont’d:
Silverliner V:Acquire 120 new regional rail cars Replace Silverliner II and III rail cars, which are 40 to 44 years oldProvide additional cars in response to current and projected ridership increasesTotal project cost - $330 million
8
15
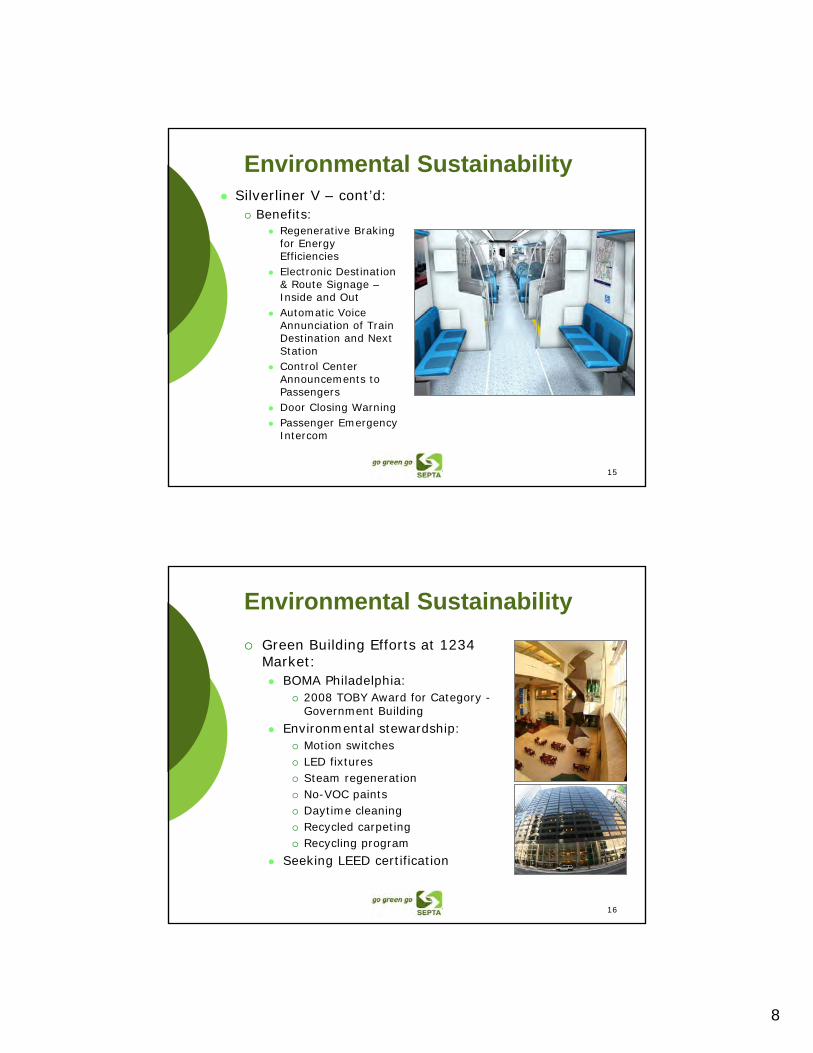
Environmental SustainabilitySilverliner V – cont’d:
Benefits:Regenerative Braking for Energy EfficienciesElectronic Destination & Route Signage –Inside and OutAutomatic Voice Annunciation of Train Destination and Next StationControl Center Announcements to PassengersDoor Closing WarningPassenger Emergency Intercom
16
Environmental Sustainability
Green Building Efforts at 1234 Market:
BOMA Philadelphia:2008 TOBY Award for Category -Government Building
Environmental stewardship:Motion switchesLED fixturesSteam regenerationNo-VOC paintsDaytime cleaningRecycled carpetingRecycling program
Seeking LEED certification
9
17
Environmental Sustainability
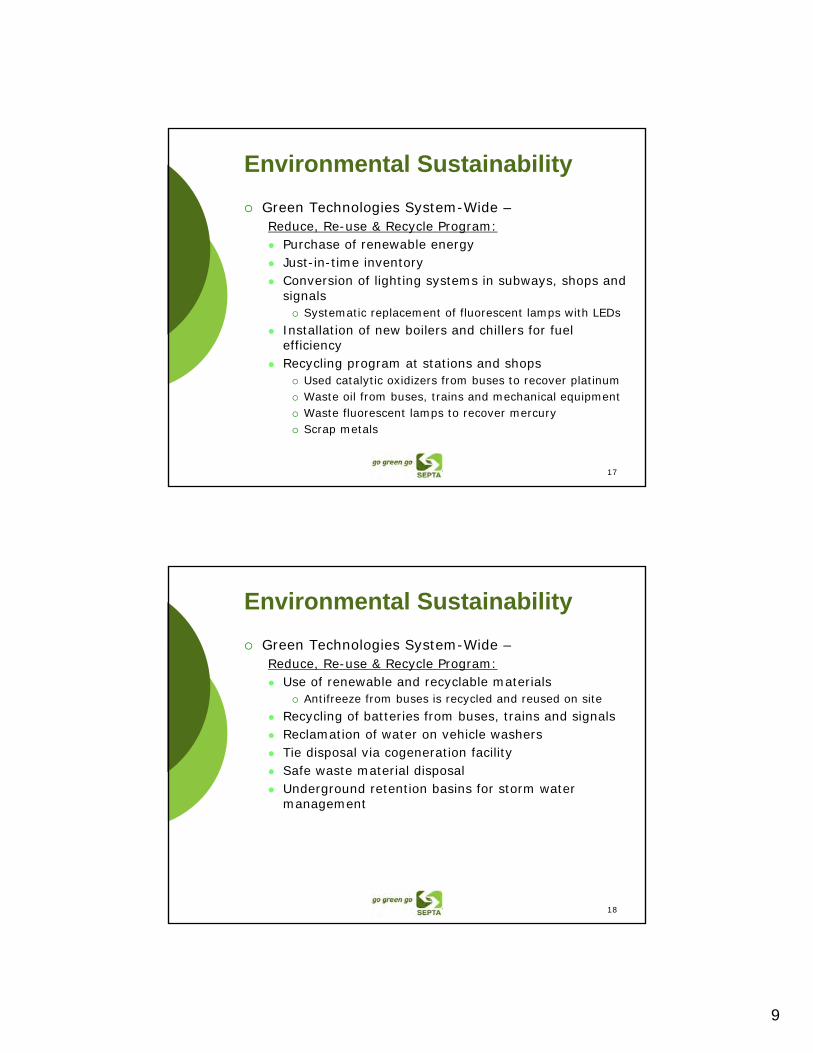
Green Technologies System-Wide –Reduce, Re-use & Recycle Program:
Purchase of renewable energyJust-in-time inventoryConversion of lighting systems in subways, shops and signals
Systematic replacement of fluorescent lamps with LEDs
Installation of new boilers and chillers for fuel efficiency Recycling program at stations and shops
Used catalytic oxidizers from buses to recover platinumWaste oil from buses, trains and mechanical equipmentWaste fluorescent lamps to recover mercuryScrap metals
18
Environmental Sustainability
Green Technologies System-Wide –Reduce, Re-use & Recycle Program:
Use of renewable and recyclable materialsAntifreeze from buses is recycled and reused on site
Recycling of batteries from buses, trains and signals Reclamation of water on vehicle washersTie disposal via cogeneration facilitySafe waste material disposalUnderground retention basins for storm water management
10
19
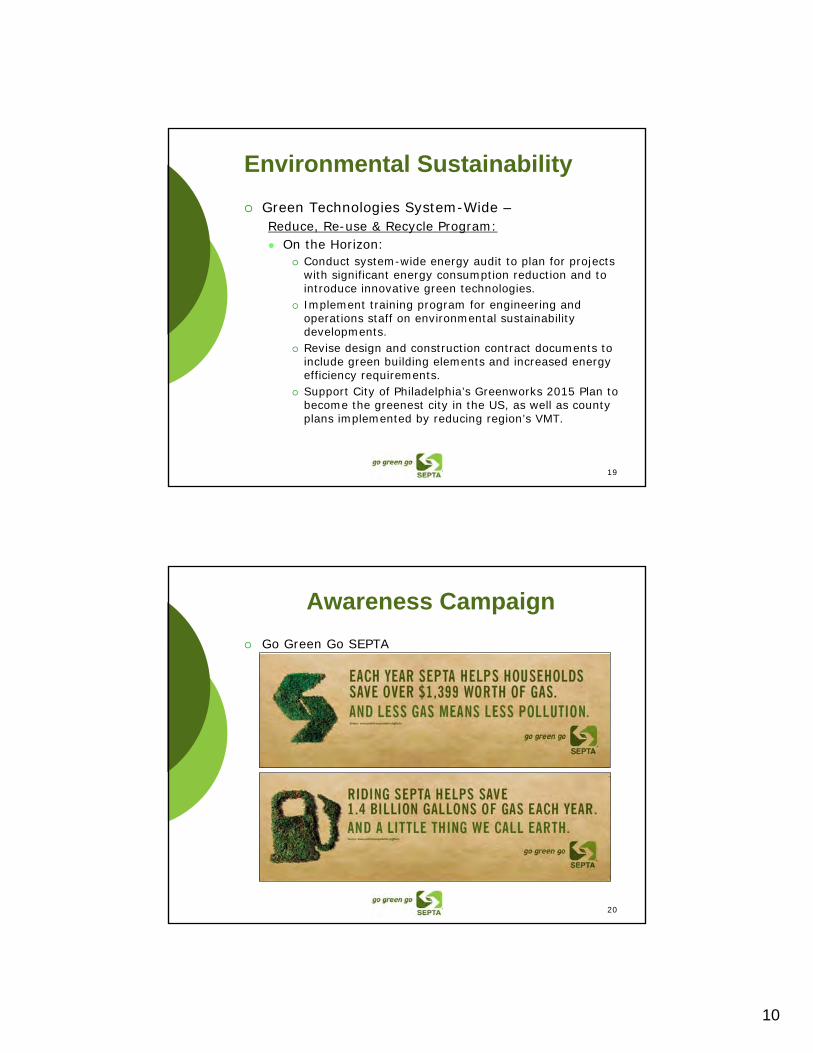
Environmental Sustainability
Green Technologies System-Wide –Reduce, Re-use & Recycle Program:
On the Horizon:Conduct system-wide energy audit to plan for projects with significant energy consumption reduction and to introduce innovative green technologies.Implement training program for engineering and operations staff on environmental sustainability developments. Revise design and construction contract documents to include green building elements and increased energy efficiency requirements.Support City of Philadelphia’s Greenworks 2015 Plan to become the greenest city in the US, as well as county plans implemented by reducing region’s VMT.
20
Awareness Campaign
Go Green Go SEPTA
11
21
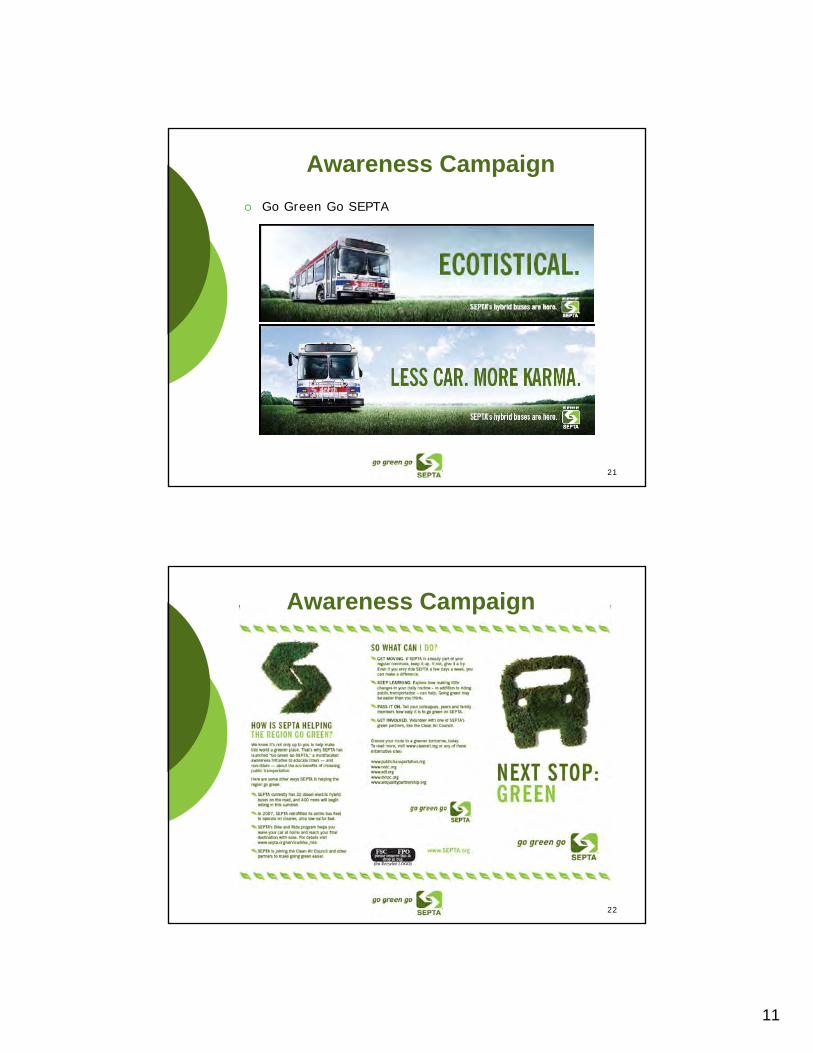
Awareness Campaign
Go Green Go SEPTA
22
Awareness Campaign
12
23
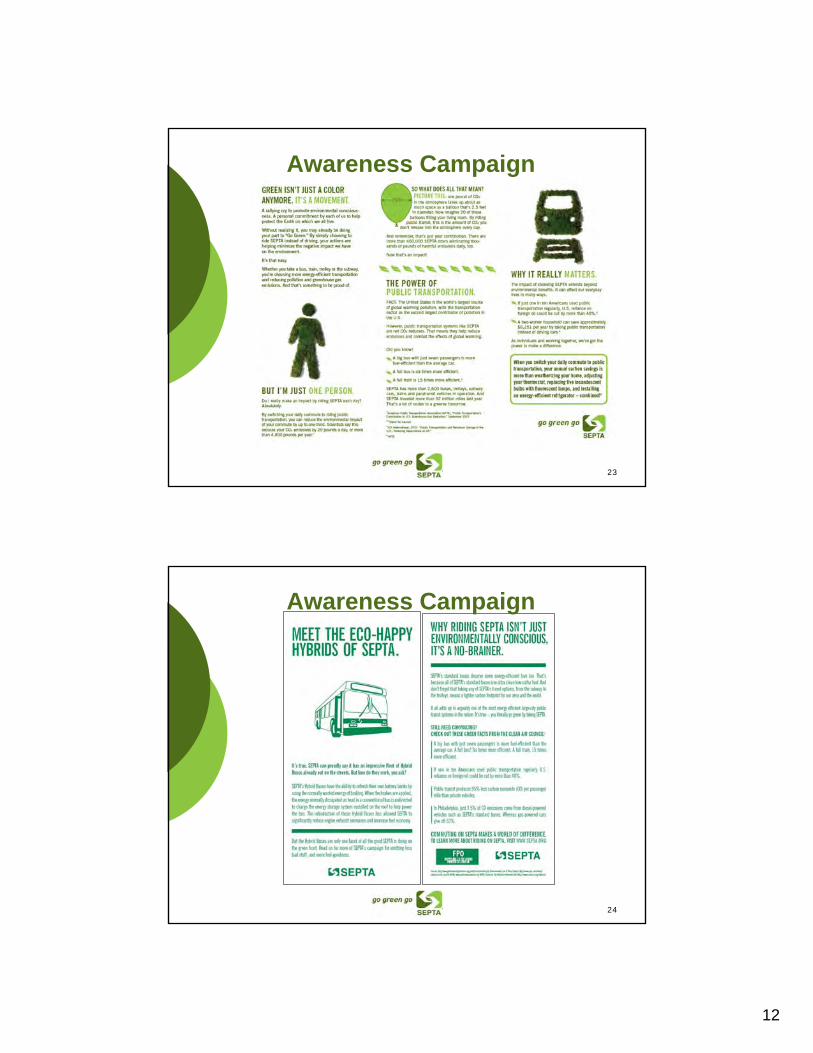
Awareness Campaign
24
Awareness Campaign
13
25
Questions & Answers
Thank you for your time.
C-1
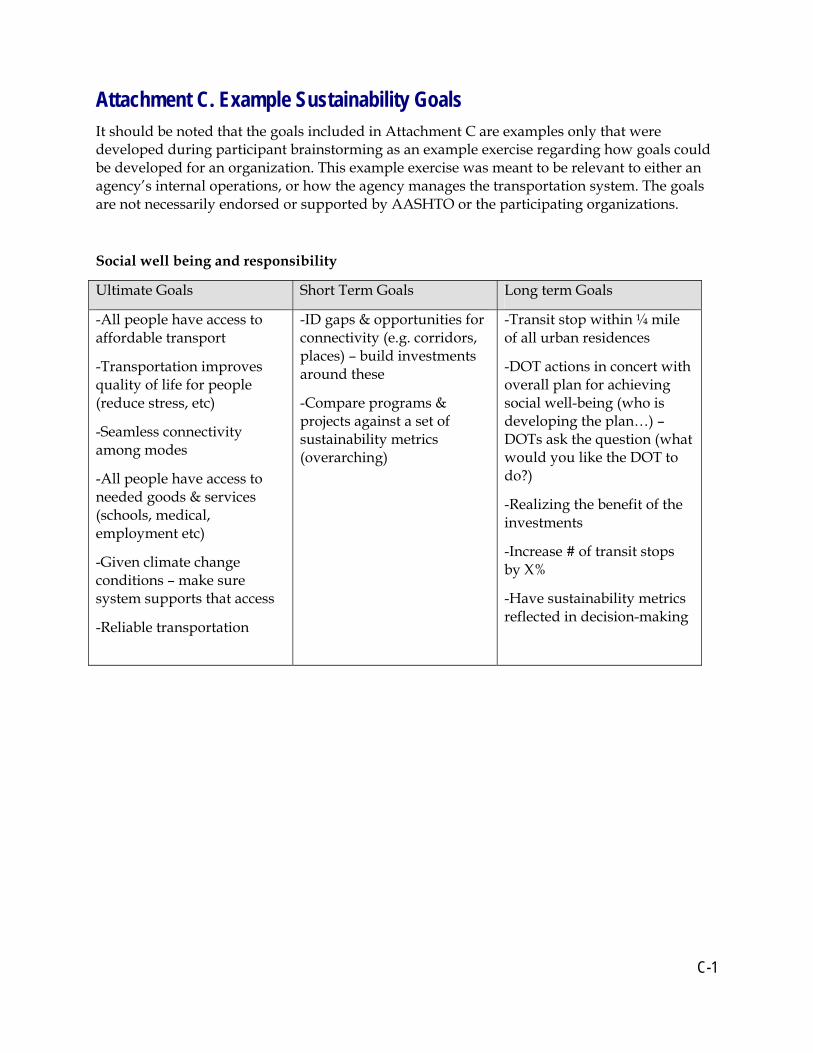
Attachment C. Example Sustainability Goals It should be noted that the goals included in Attachment C are examples only that were developed during participant brainstorming as an example exercise regarding how goals could be developed for an organization. This example exercise was meant to be relevant to either an agency’s internal operations, or how the agency manages the transportation system. The goals are not necessarily endorsed or supported by AASHTO or the participating organizations.
Social well being and responsibility
Ultimate Goals Short Term Goals Long term Goals
-All people have access to affordable transport
-Transportation improves quality of life for people (reduce stress, etc)
-Seamless connectivity among modes
-All people have access to needed goods & services (schools, medical, employment etc)
-Given climate change conditions – make sure system supports that access
-Reliable transportation
-ID gaps & opportunities for connectivity (e.g. corridors, places) – build investments around these
-Compare programs & projects against a set of sustainability metrics (overarching)
-Transit stop within ¼ mile of all urban residences
-DOT actions in concert with overall plan for achieving social well-being (who is developing the plan…) – DOTs ask the question (what would you like the DOT to do?)
-Realizing the benefit of the investments
-Increase # of transit stops by X%
-Have sustainability metrics reflected in decision-making
C-2
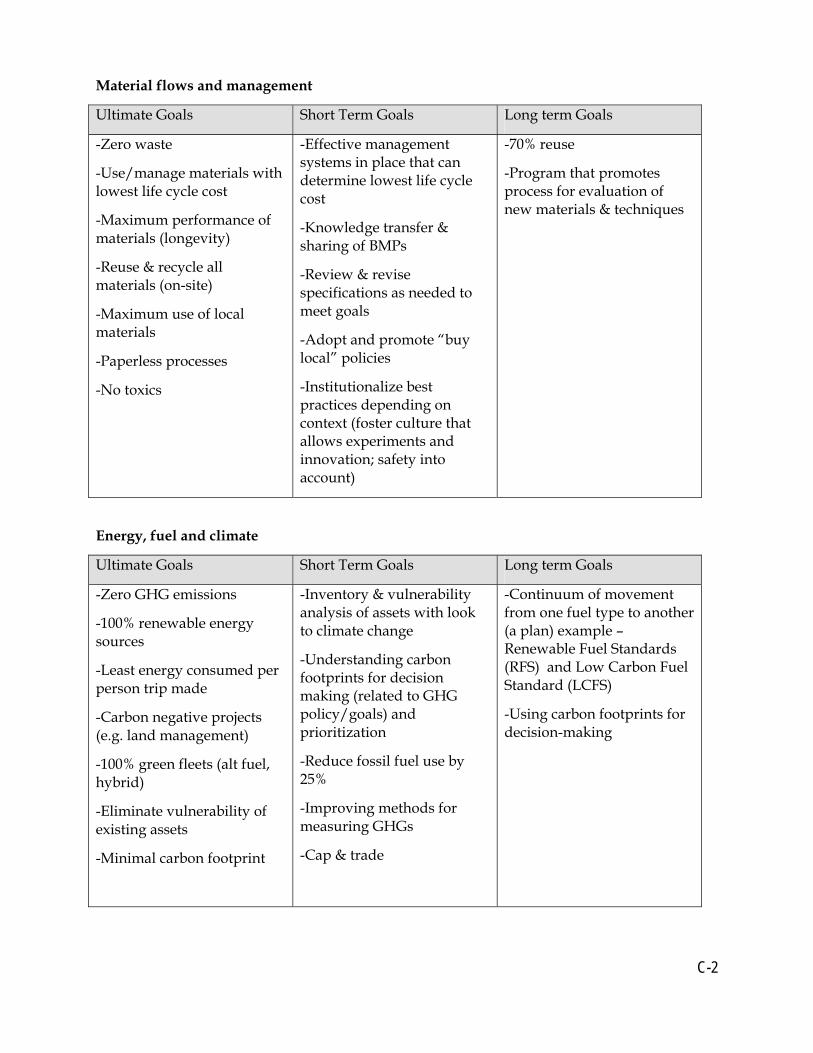
Material flows and management
Ultimate Goals Short Term Goals Long term Goals
-Zero waste
-Use/manage materials with lowest life cycle cost
-Maximum performance of materials (longevity)
-Reuse & recycle all materials (on-site)
-Maximum use of local materials
-Paperless processes
-No toxics
-Effective management systems in place that can determine lowest life cycle cost
-Knowledge transfer & sharing of BMPs
-Review & revise specifications as needed to meet goals
-Adopt and promote “buy local” policies
-Institutionalize best practices depending on context (foster culture that allows experiments and innovation; safety into account)
-70% reuse
-Program that promotes process for evaluation of new materials & techniques
Energy, fuel and climate
Ultimate Goals Short Term Goals Long term Goals
-Zero GHG emissions
-100% renewable energy sources
-Least energy consumed per person trip made
-Carbon negative projects (e.g. land management)
-100% green fleets (alt fuel, hybrid)
-Eliminate vulnerability of existing assets
-Minimal carbon footprint
-Inventory & vulnerability analysis of assets with look to climate change
-Understanding carbon footprints for decision making (related to GHG policy/goals) and prioritization
-Reduce fossil fuel use by 25%
-Improving methods for measuring GHGs
-Cap & trade
-Continuum of movement from one fuel type to another (a plan) example – Renewable Fuel Standards (RFS) and Low Carbon Fuel Standard (LCFS)
-Using carbon footprints for decision-making
C-3
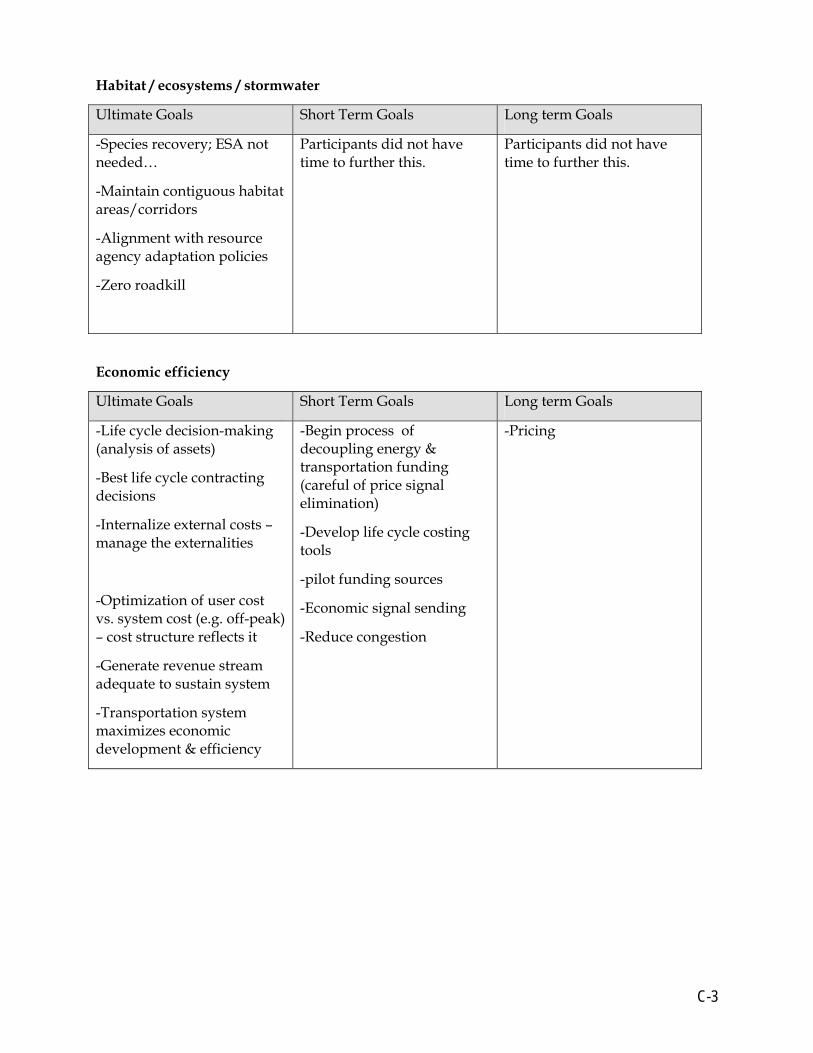
Habitat / ecosystems / stormwater
Ultimate Goals Short Term Goals Long term Goals
-Species recovery; ESA not needed…
-Maintain contiguous habitat areas/corridors
-Alignment with resource agency adaptation policies
-Zero roadkill
Participants did not have time to further this.
Participants did not have time to further this.
Economic efficiency
Ultimate Goals Short Term Goals Long term Goals
-Life cycle decision-making (analysis of assets)
-Best life cycle contracting decisions
-Internalize external costs – manage the externalities
-Optimization of user cost vs. system cost (e.g. off-peak) – cost structure reflects it
-Generate revenue stream adequate to sustain system
-Transportation system maximizes economic development & efficiency
-Begin process of decoupling energy & transportation funding (careful of price signal elimination)
-Develop life cycle costing tools
-pilot funding sources
-Economic signal sending
-Reduce congestion
-Pricing
C-4
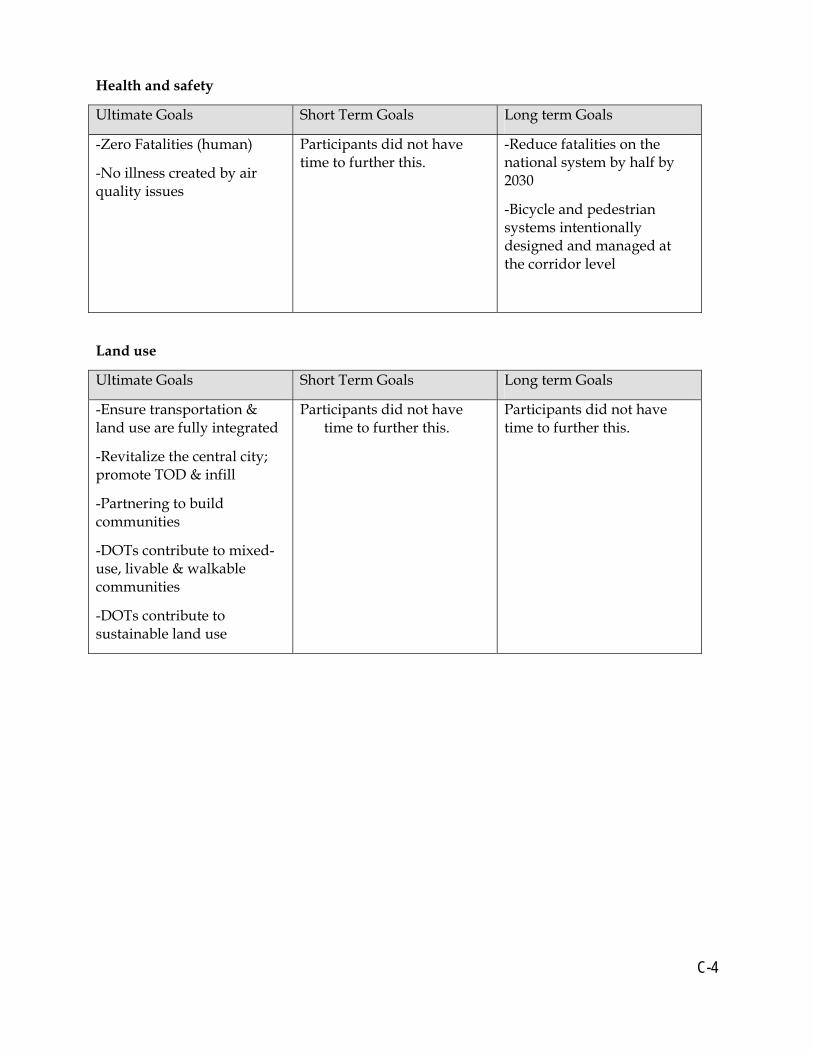
Health and safety
Ultimate Goals Short Term Goals Long term Goals
-Zero Fatalities (human)
-No illness created by air quality issues
Participants did not have time to further this.
-Reduce fatalities on the national system by half by 2030
-Bicycle and pedestrian systems intentionally designed and managed at the corridor level
Land use
Ultimate Goals Short Term Goals Long term Goals
-Ensure transportation & land use are fully integrated
-Revitalize the central city; promote TOD & infill
-Partnering to build communities
-DOTs contribute to mixed-use, livable & walkable communities
-DOTs contribute to sustainable land use
Participants did not have time to further this.
Participants did not have time to further this.
D-1
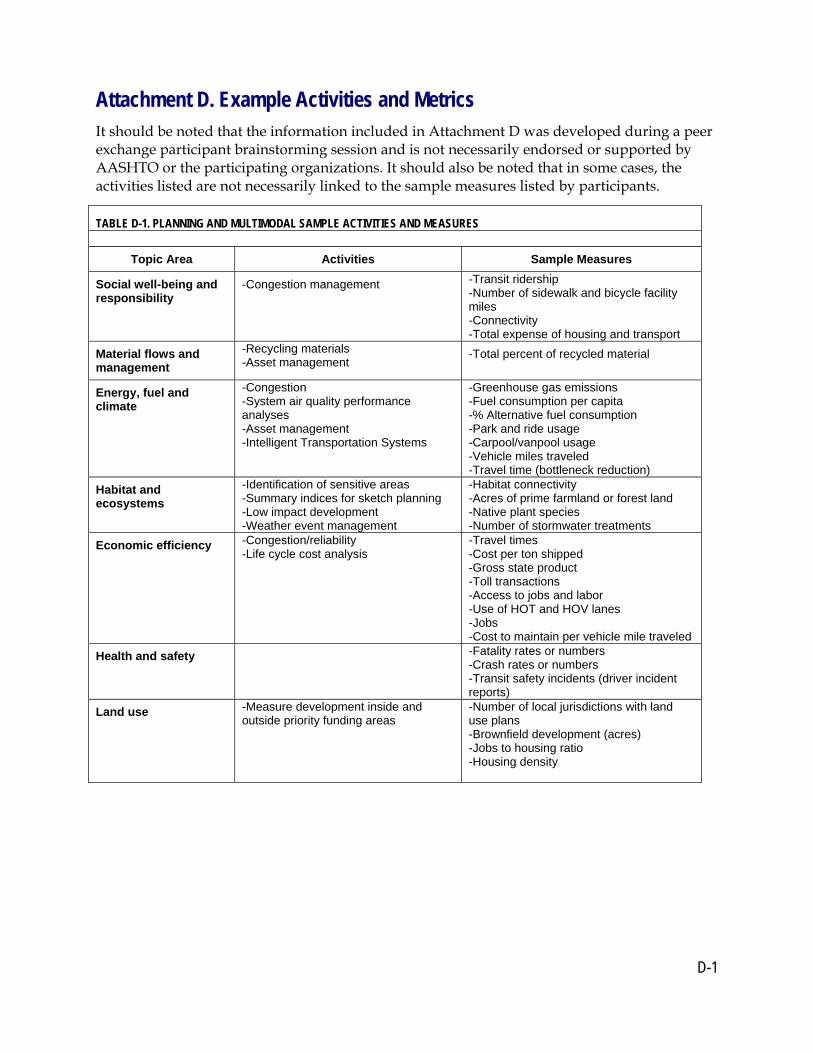
Attachment D. Example Activities and Metrics It should be noted that the information included in Attachment D was developed during a peer exchange participant brainstorming session and is not necessarily endorsed or supported by AASHTO or the participating organizations. It should also be noted that in some cases, the activities listed are not necessarily linked to the sample measures listed by participants.
TABLE D-1. PLANNING AND MULTIMODAL SAMPLE ACTIVITIES AND MEASURES
Topic Area Activities Sample Measures
Social well-being and responsibility
-Congestion management -Transit ridership -Number of sidewalk and bicycle facility miles -Connectivity -Total expense of housing and transport
Material flows and management
-Recycling materials -Asset management
-Total percent of recycled material
Energy, fuel and climate
-Congestion -System air quality performance analyses -Asset management -Intelligent Transportation Systems
-Greenhouse gas emissions -Fuel consumption per capita -% Alternative fuel consumption -Park and ride usage -Carpool/vanpool usage -Vehicle miles traveled -Travel time (bottleneck reduction)
Habitat and ecosystems
-Identification of sensitive areas -Summary indices for sketch planning -Low impact development -Weather event management
-Habitat connectivity -Acres of prime farmland or forest land -Native plant species -Number of stormwater treatments
Economic efficiency -Congestion/reliability -Life cycle cost analysis
-Travel times -Cost per ton shipped -Gross state product -Toll transactions -Access to jobs and labor -Use of HOT and HOV lanes -Jobs -Cost to maintain per vehicle mile traveled
Health and safety -Fatality rates or numbers -Crash rates or numbers -Transit safety incidents (driver incident reports)
Land use -Measure development inside and outside priority funding areas
-Number of local jurisdictions with land use plans -Brownfield development (acres) -Jobs to housing ratio -Housing density
D-2
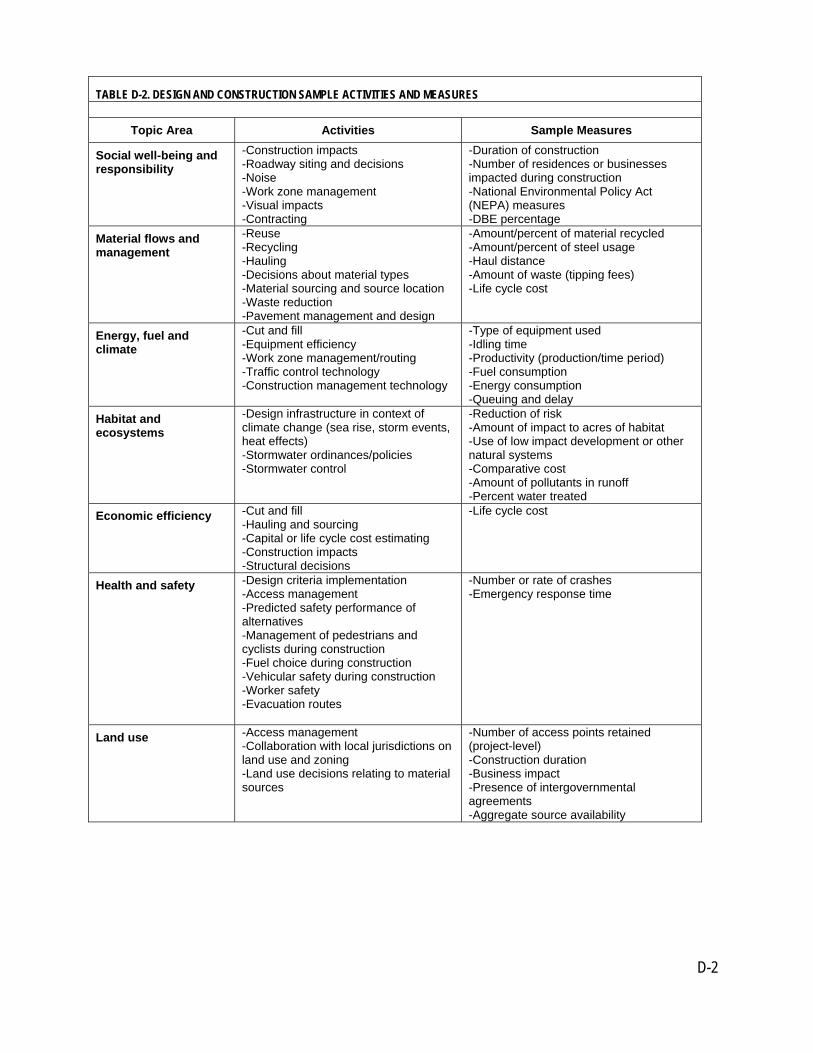
TABLE D-2. DESIGN AND CONSTRUCTION SAMPLE ACTIVITIES AND MEASURES
Topic Area Activities Sample Measures
Social well-being and responsibility
-Construction impacts -Roadway siting and decisions -Noise -Work zone management -Visual impacts -Contracting
-Duration of construction -Number of residences or businesses impacted during construction -National Environmental Policy Act (NEPA) measures -DBE percentage
Material flows and management
-Reuse -Recycling -Hauling -Decisions about material types -Material sourcing and source location -Waste reduction -Pavement management and design
-Amount/percent of material recycled -Amount/percent of steel usage -Haul distance -Amount of waste (tipping fees) -Life cycle cost
Energy, fuel and climate
-Cut and fill -Equipment efficiency -Work zone management/routing -Traffic control technology -Construction management technology
-Type of equipment used -Idling time -Productivity (production/time period) -Fuel consumption -Energy consumption -Queuing and delay
Habitat and ecosystems
-Design infrastructure in context of climate change (sea rise, storm events, heat effects) -Stormwater ordinances/policies -Stormwater control
-Reduction of risk -Amount of impact to acres of habitat -Use of low impact development or other natural systems -Comparative cost -Amount of pollutants in runoff -Percent water treated
Economic efficiency -Cut and fill -Hauling and sourcing -Capital or life cycle cost estimating -Construction impacts -Structural decisions
-Life cycle cost
Health and safety -Design criteria implementation -Access management -Predicted safety performance of alternatives -Management of pedestrians and cyclists during construction -Fuel choice during construction -Vehicular safety during construction -Worker safety -Evacuation routes
-Number or rate of crashes -Emergency response time
Land use -Access management -Collaboration with local jurisdictions on land use and zoning -Land use decisions relating to material sources
-Number of access points retained (project-level) -Construction duration -Business impact -Presence of intergovernmental agreements -Aggregate source availability
D-3
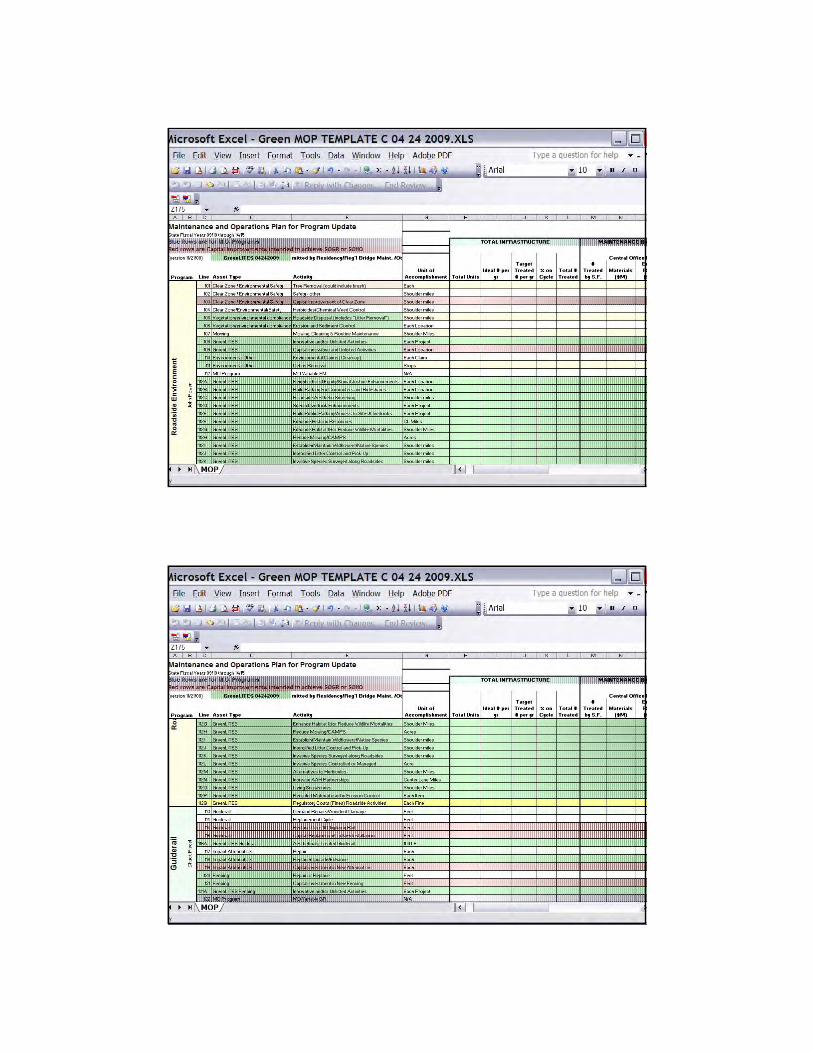
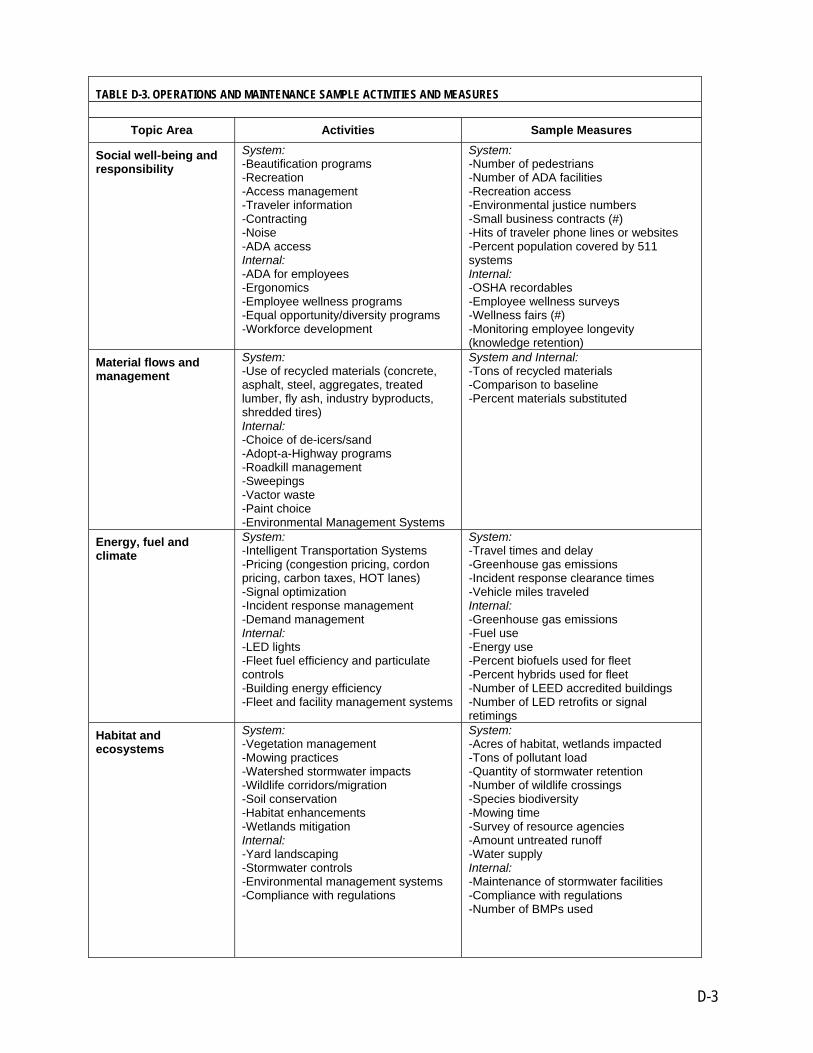
TABLE D-3. OPERATIONS AND MAINTENANCE SAMPLE ACTIVITIES AND MEASURES
Topic Area Activities Sample Measures
Social well-being and responsibility
System: -Beautification programs -Recreation -Access management -Traveler information -Contracting -Noise -ADA access Internal: -ADA for employees -Ergonomics -Employee wellness programs -Equal opportunity/diversity programs -Workforce development
System: -Number of pedestrians -Number of ADA facilities -Recreation access -Environmental justice numbers -Small business contracts (#) -Hits of traveler phone lines or websites -Percent population covered by 511 systems Internal: -OSHA recordables -Employee wellness surveys -Wellness fairs (#) -Monitoring employee longevity (knowledge retention)
Material flows and management
System: -Use of recycled materials (concrete, asphalt, steel, aggregates, treated lumber, fly ash, industry byproducts, shredded tires) Internal: -Choice of de-icers/sand -Adopt-a-Highway programs -Roadkill management -Sweepings -Vactor waste -Paint choice -Environmental Management Systems
System and Internal: -Tons of recycled materials -Comparison to baseline -Percent materials substituted
Energy, fuel and climate
System: -Intelligent Transportation Systems -Pricing (congestion pricing, cordon pricing, carbon taxes, HOT lanes) -Signal optimization -Incident response management -Demand management Internal: -LED lights -Fleet fuel efficiency and particulate controls -Building energy efficiency -Fleet and facility management systems
System: -Travel times and delay -Greenhouse gas emissions -Incident response clearance times -Vehicle miles traveled Internal: -Greenhouse gas emissions -Fuel use -Energy use -Percent biofuels used for fleet -Percent hybrids used for fleet -Number of LEED accredited buildings -Number of LED retrofits or signal retimings
Habitat and ecosystems
System: -Vegetation management -Mowing practices -Watershed stormwater impacts -Wildlife corridors/migration -Soil conservation -Habitat enhancements -Wetlands mitigation Internal: -Yard landscaping -Stormwater controls -Environmental management systems -Compliance with regulations
System: -Acres of habitat, wetlands impacted -Tons of pollutant load -Quantity of stormwater retention -Number of wildlife crossings -Species biodiversity -Mowing time -Survey of resource agencies -Amount untreated runoff -Water supply Internal: -Maintenance of stormwater facilities -Compliance with regulations -Number of BMPs used
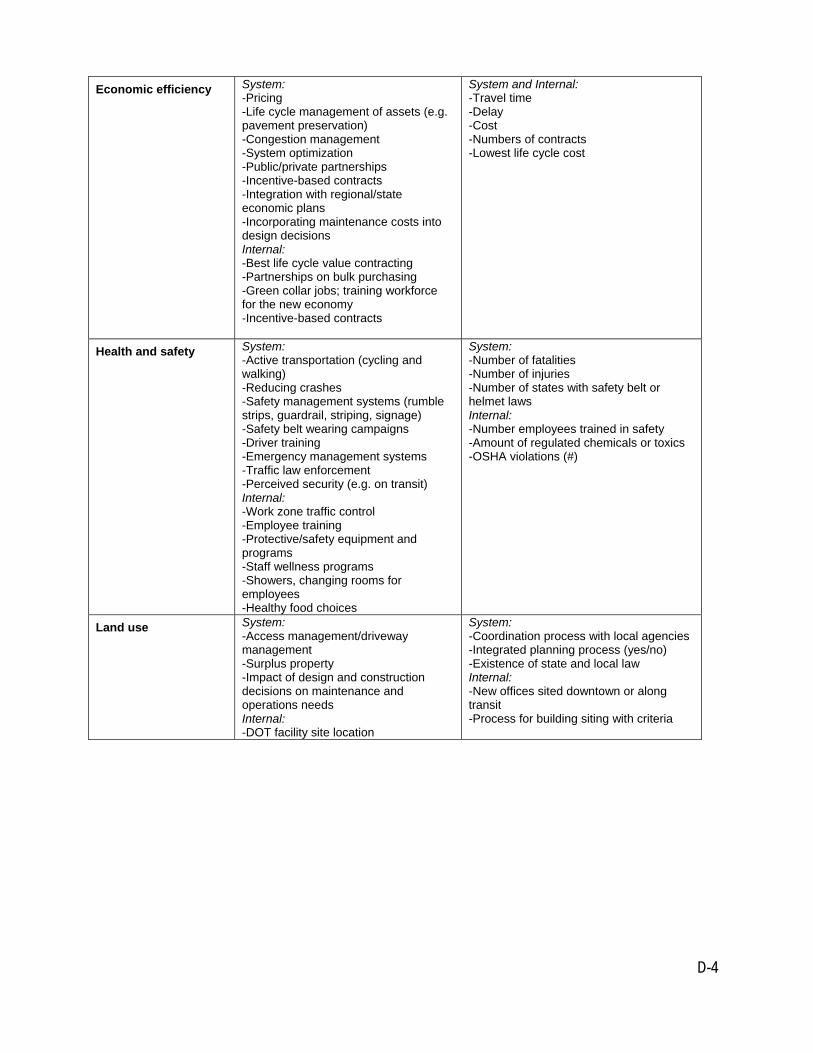
D-4
Economic efficiency System: -Pricing -Life cycle management of assets (e.g. pavement preservation) -Congestion management -System optimization -Public/private partnerships -Incentive-based contracts -Integration with regional/state economic plans -Incorporating maintenance costs into design decisions Internal: -Best life cycle value contracting -Partnerships on bulk purchasing -Green collar jobs; training workforce for the new economy -Incentive-based contracts
System and Internal: -Travel time -Delay -Cost -Numbers of contracts -Lowest life cycle cost
Health and safety System: -Active transportation (cycling and walking) -Reducing crashes -Safety management systems (rumble strips, guardrail, striping, signage) -Safety belt wearing campaigns -Driver training -Emergency management systems -Traffic law enforcement -Perceived security (e.g. on transit) Internal: -Work zone traffic control -Employee training -Protective/safety equipment and programs -Staff wellness programs -Showers, changing rooms for employees -Healthy food choices
System: -Number of fatalities -Number of injuries -Number of states with safety belt or helmet laws Internal: -Number employees trained in safety -Amount of regulated chemicals or toxics -OSHA violations (#)
Land use System: -Access management/driveway management -Surplus property -Impact of design and construction decisions on maintenance and operations needs Internal: -DOT facility site location
System: -Coordination process with local agencies -Integrated planning process (yes/no) -Existence of state and local law Internal: -New offices sited downtown or along transit -Process for building siting with criteria