Embed Size (px)
Citation preview
Illinois DOTFrom the AASHO Road Test
To 20 Years of Mechanistic Pavement Experience
……and Counting
David L. Lippert, PEBureau of Materials and Physical Research
Illi i D t t f T t tiIllinois Department of Transportation
Transportation Research Board87th Annual Meeting87 Annual Meeting
January 13, 2008
Outline• AASHO Road Test History• Illinois Adoption of MechanisticIllinois Adoption of Mechanistic • Current Updating Efforts
60708090
100
0102030405060
0 10 20 30 40 50
Probabilityof Failure, %
9-in CRCP without DC9-in CRCP with DC
0 10 20 30 40 50Cumulative ESALs, million
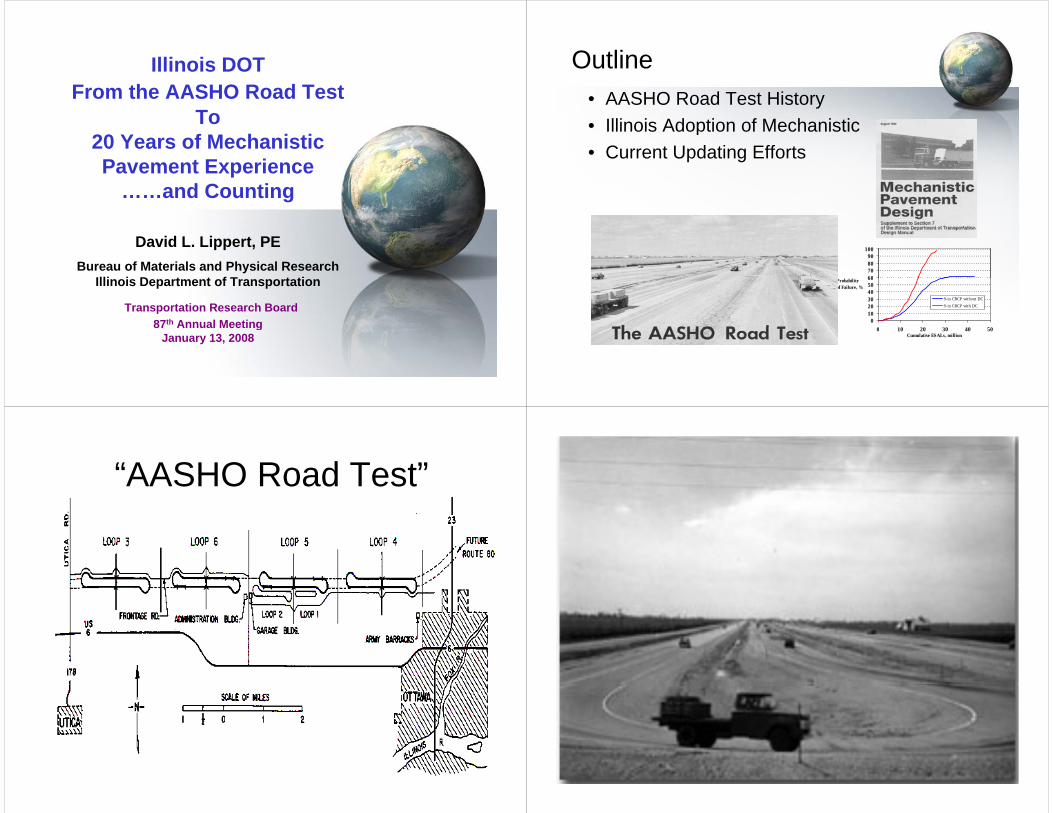
“AASHO Road Test”AASHO Road Test
LoadingLANE 1 LANE 2
Loading
LOOP
3 4 1 124 6 18 18
6 24 249 32 32
5 6 22 226 9 30 30
9 40 4012 48 486 9 30 30 12 48 48
2 Years = 1.1 Million Axle Loads
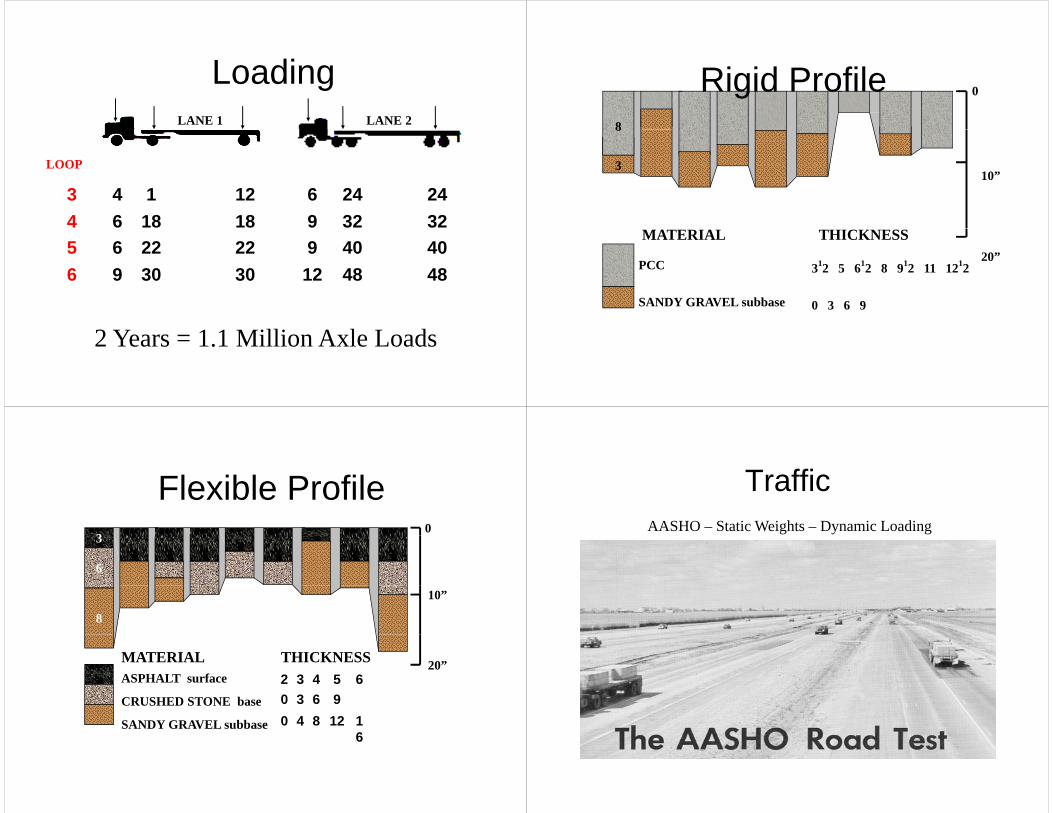
Rigid Profile 0
8
Rigid Profile
10”
8
310
312 5 612 8 912 11 121220”
THICKNESS
PCC
MATERIAL
0 3 6 9SANDY GRAVEL subbase
Flexible Profile0
3
Flexible Profile3
6
10”
8
ASPHALT surface 65432MATERIAL THICKNESS 20”
CRUSHED STONE base
SANDY GRAVEL subbase 16
128409630
6
TrafficTrafficAASHO – Static Weights – Dynamic Loading
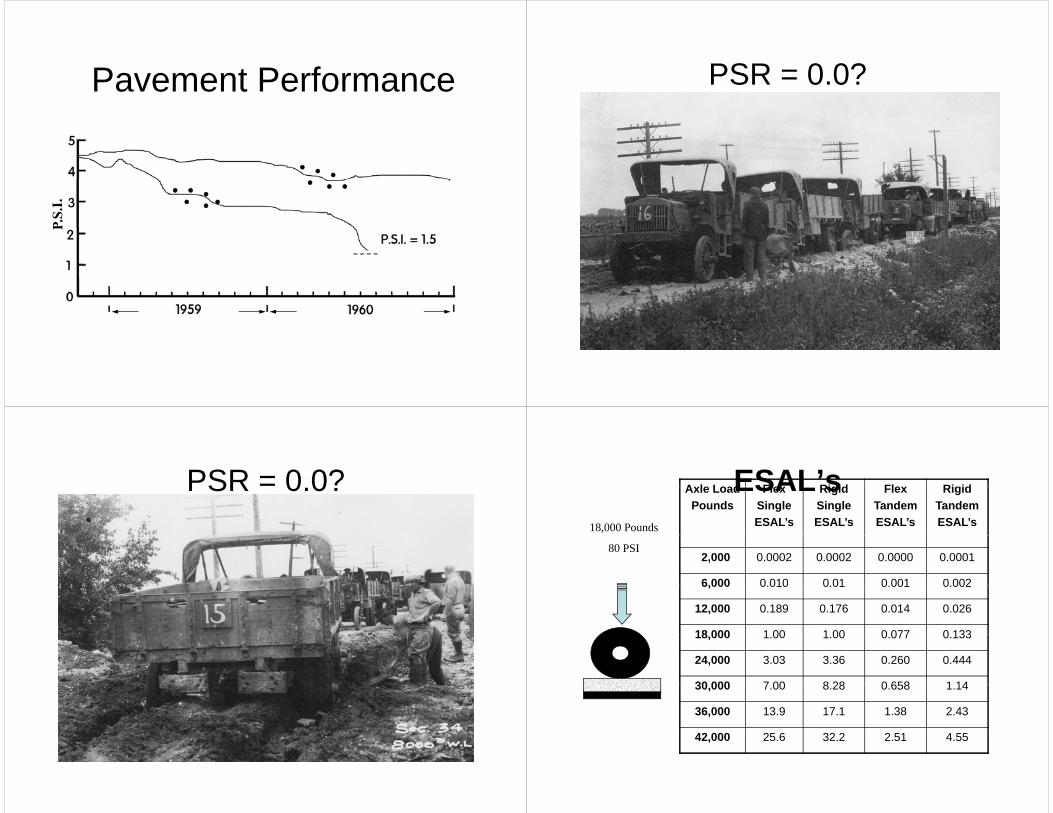
Pavement PerformancePavement Performance PSR = 0 0?PSR 0.0?
PSR = 0 0?PSR 0.0? A l L d Fl Ri id Fl Ri idESAL’s18,000 Pounds
Axle LoadPounds
FlexSingleESAL’s
RigidSingleESAL’s
FlexTandemESAL’s
RigidTandemESAL’s
ESAL s
80 PSI2,000 0.0002 0.0002 0.0000 0.0001
6,000 0 010 0 01 0 001 0 0026,000 0.010 0.01 0.001 0.002
12,000 0.189 0.176 0.014 0.026
18 000 1 00 1 00 0 077 0 13318,000 1.00 1.00 0.077 0.133
24,000 3.03 3.36 0.260 0.444
30 000 7 00 8 28 0 658 1 1430,000 7.00 8.28 0.658 1.14
36,000 13.9 17.1 1.38 2.43
42 000 25 6 32 2 2 51 4 5542,000 25.6 32.2 2.51 4.55
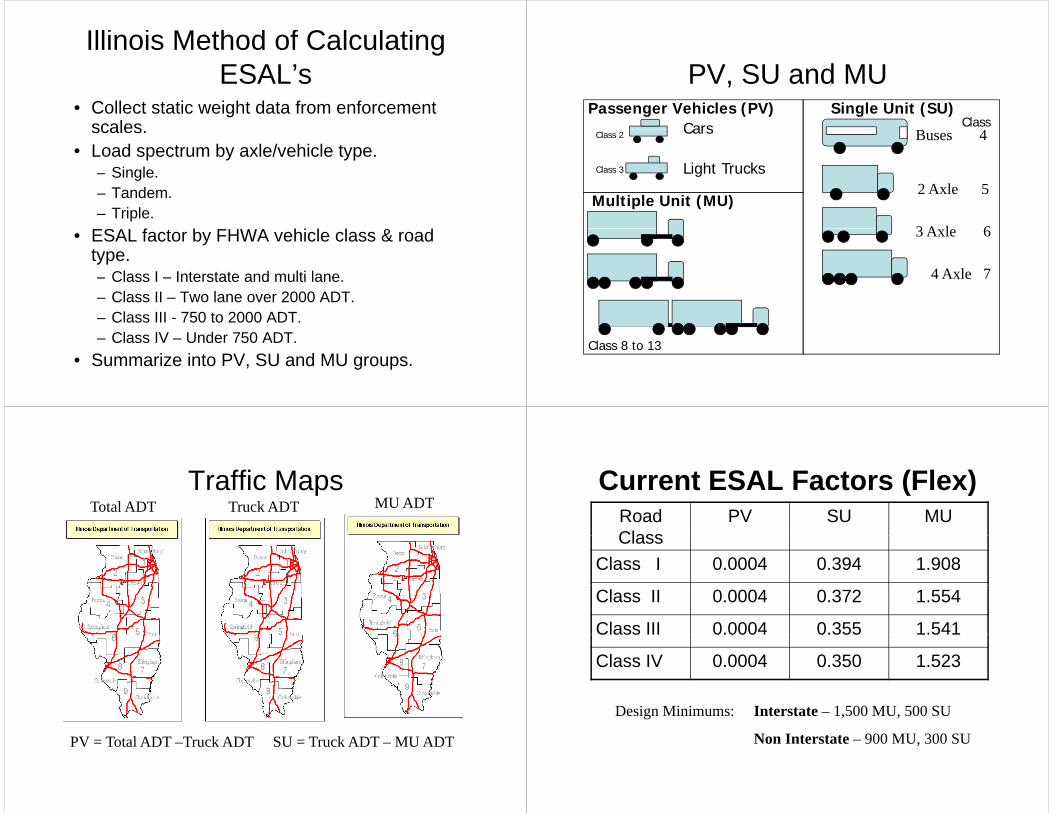
Illinois Method of Calculating ESAL’sESAL s
• Collect static weight data from enforcement scalesscales.
• Load spectrum by axle/vehicle type. – Single.g– Tandem. – Triple.S f &• ESAL factor by FHWA vehicle class & road
type.– Class I – Interstate and multi lane– Class I – Interstate and multi lane.– Class II – Two lane over 2000 ADT.– Class III - 750 to 2000 ADT.– Class IV – Under 750 ADT.
• Summarize into PV, SU and MU groups.
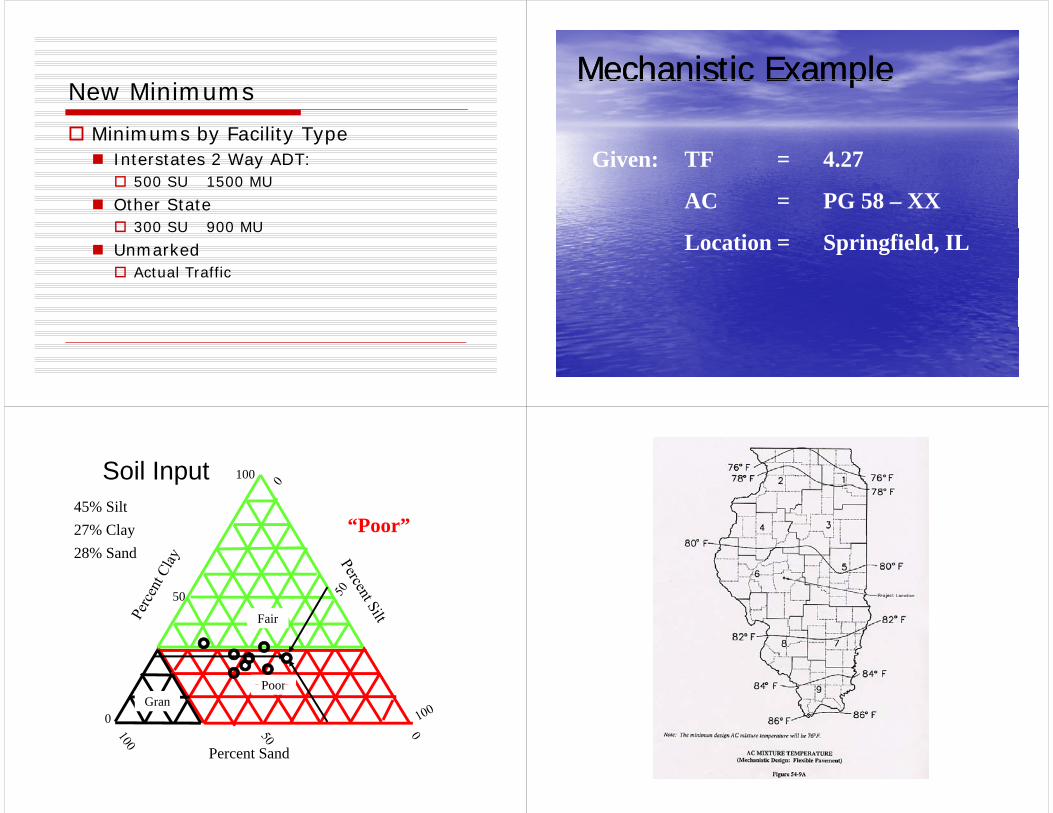
PV SU and MUPV, SU and MUPassenger Vehicles (PV)
CarsSingle Unit (SU)
ClassCars
Light Trucks
Buses 4Class 2
Class 3
2 Axle 5
3 A l 6
Multiple Unit (MU)
3 Axle 6
4 Axle 74 Axle 7
Class 8 to 13
Traffic MapsTraffic MapsTotal ADT MU ADTTruck ADT
PV = Total ADT –Truck ADT SU = Truck ADT – MU ADT
Current ESAL Factors (Flex)Current ESAL Factors (Flex)Road Class
PV SU MUClass
Class I 0.0004 0.394 1.908
Class II 0.0004 0.372 1.554
Class III 0.0004 0.355 1.541C ass 0 000 0 355 5
Class IV 0.0004 0.350 1.523
Design Minimums: Interstate – 1,500 MU, 500 SU
N I 900 MU 300 SUNon Interstate – 900 MU, 300 SU
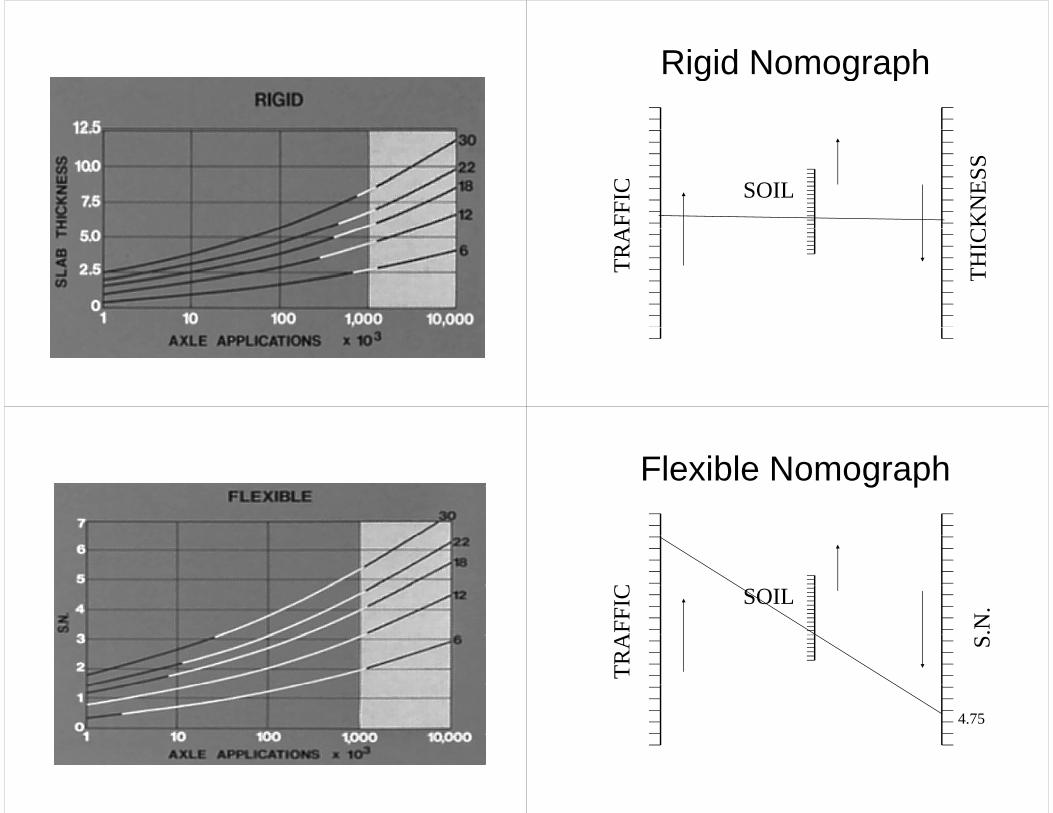
Rigid Nomographg g p
C SS
SOIL
AFF
IC
KN
E
TRA
THIC
T
Flexible Nomographg p
C
.N.
AFF
IC SOIL
S
TRA
4.75
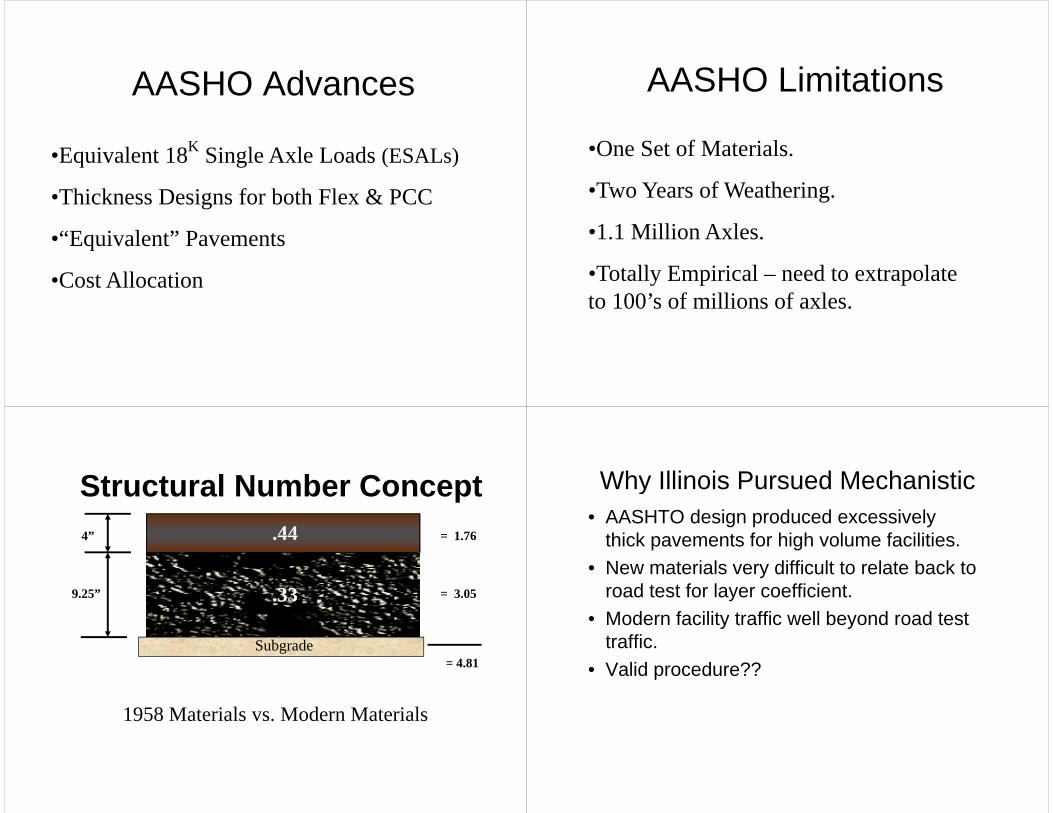
AASHO AdvancesAASHO Advances
•Equivalent 18K Single Axle Loads (ESALs)
•Thickness Designs for both Flex & PCC
•“Equivalent” Pavements
•Cost Allocation•Cost Allocation
AASHO LimitationsAASHO Limitations
•One Set of Materials.
•Two Years of Weathering.
1 1 Milli A l•1.1 Million Axles.
•Totally Empirical – need to extrapolateTotally Empirical need to extrapolate to 100’s of millions of axles.
Structural Number ConceptStructural Number Concept444” = 1 76.444 = 1.76
9.25” = 3.05.33
= 4.81Subgrade
1958 Materials vs. Modern Materials
Why Illinois Pursued MechanisticWhy Illinois Pursued Mechanistic• AASHTO design produced excessively
thi k t f hi h l f ilitithick pavements for high volume facilities.• New materials very difficult to relate back to
d t t f l ffi i troad test for layer coefficient.• Modern facility traffic well beyond road test
t ffitraffic. • Valid procedure??
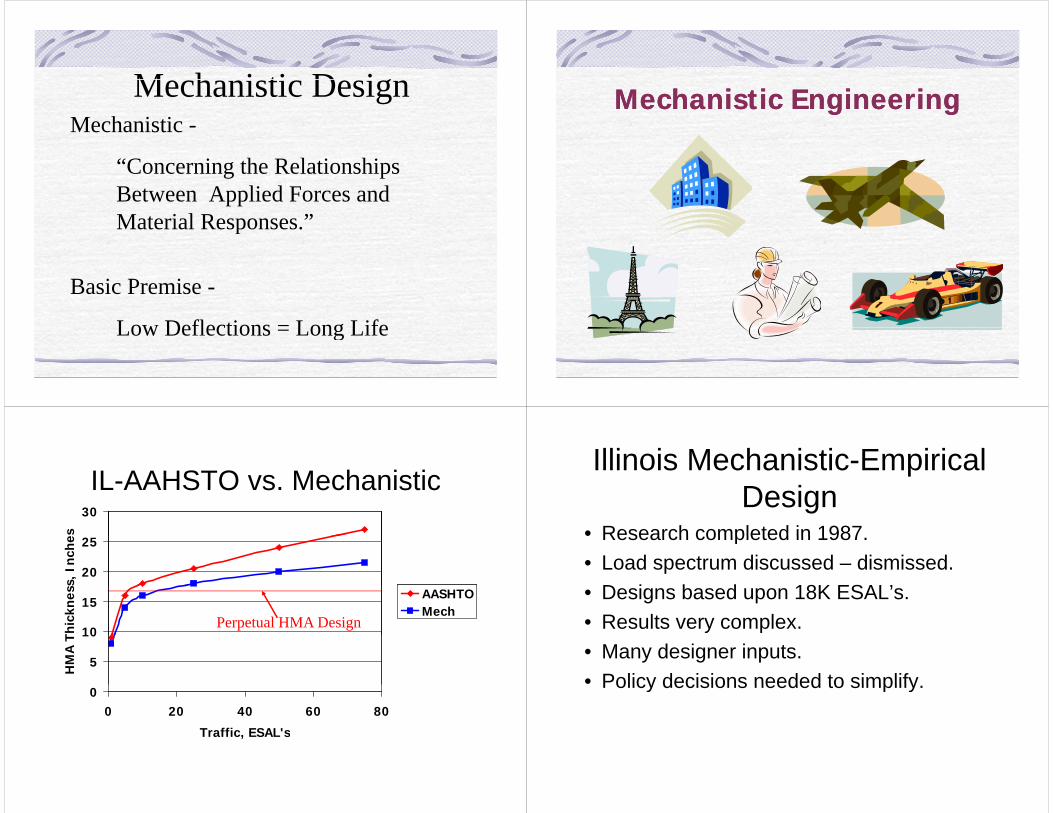
M h i ti D iMechanistic -
Mechanistic DesignMechanistic
“Concerning the Relationships Between Applied Forces and Material Responses.”Material Responses.
i iBasic Premise -
Low Deflections = Long LifeLow Deflections = Long Life
Mechanistic EngineeringMechanistic Engineering
IL-AAHSTO vs MechanisticIL AAHSTO vs. Mechanistic30
es
20
25
s, I
nche
10
15
Thic
knes
s
AASHTOMech
Perpetual HMA Design
5
10
HM
A T
00 20 40 60 80
Traffic ESAL'sTraffic, ESAL s
Illinois Mechanistic-Empirical D iDesign
• Research completed in 1987Research completed in 1987.• Load spectrum discussed – dismissed.
D i b d 18K ESAL’• Designs based upon 18K ESAL’s.• Results very complex. • Many designer inputs.• Policy decisions needed to simplifyPolicy decisions needed to simplify.
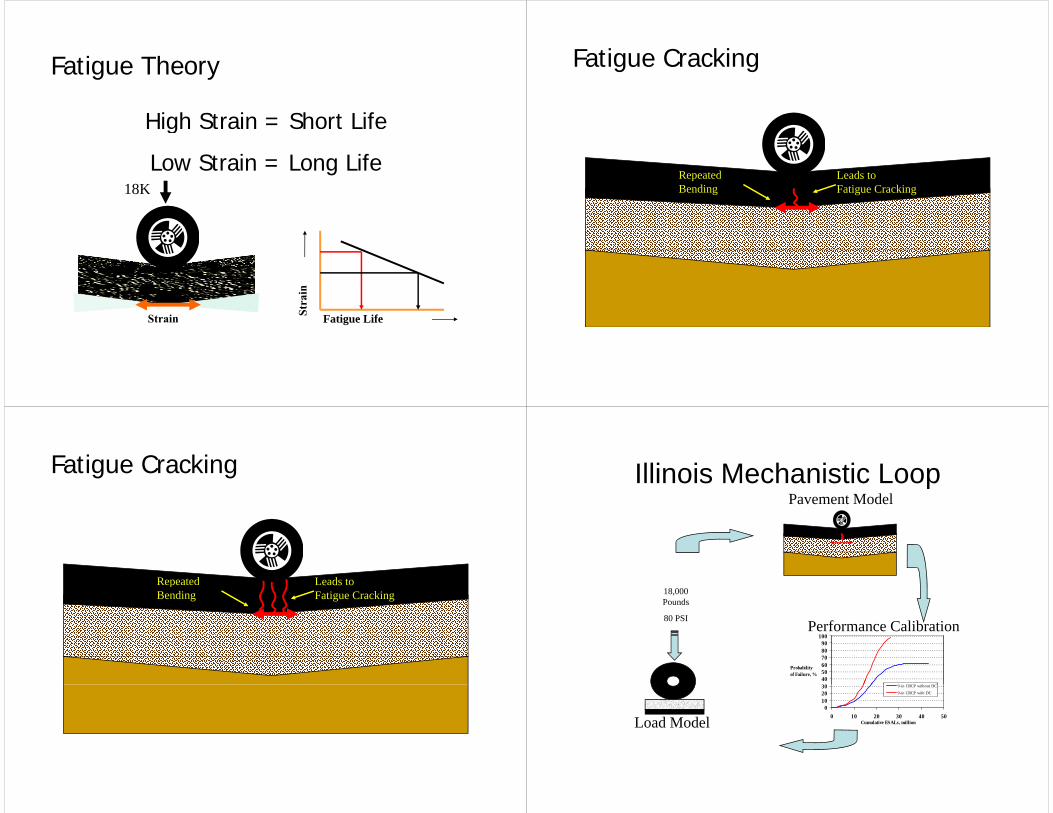
Fatigue Theory
High Strain = Short Lifeg
Low Strain = Long Life18K
Fatigue Life
Fatigue Cracking
Repeated Leads topBending
e ds oFatigue Cracking
Fatigue Cracking
Repeated Leads topBending
e ds oFatigue Cracking
Illinois Mechanistic Loop pPavement Model
18,000 Pounds
80 PSI
100Performance Calibration
405060708090
100
Probabilityof Failure, %
i i h
Load Model0
102030
0 10 20 30 40 50Cumulative ESALs, million
9-in CRCP without DC9-in CRCP with DC
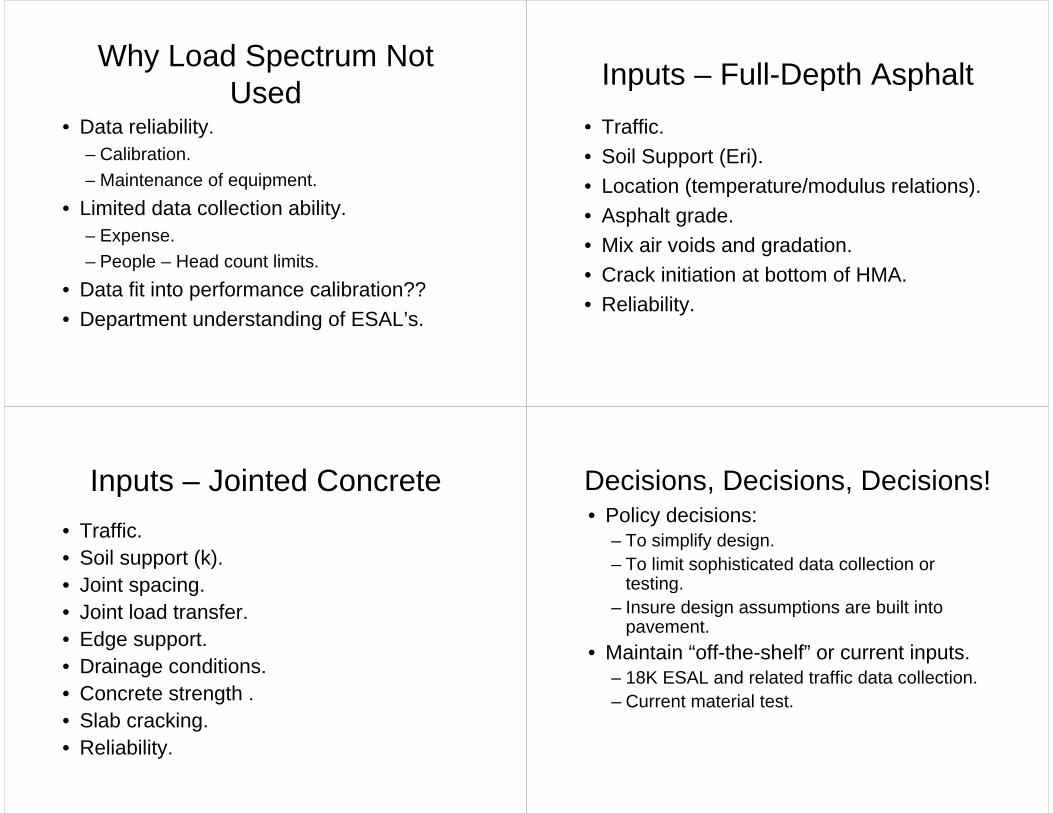
Why Load Spectrum Not Used
• Data reliabilityData reliability.– Calibration.
Maintenance of equipment– Maintenance of equipment.• Limited data collection ability.
– Expense.– People – Head count limits.
• Data fit into performance calibration??• Department understanding of ESAL’s.p g
Inputs – Full-Depth AsphaltInputs Full Depth Asphalt• TrafficTraffic.• Soil Support (Eri).
L ti (t t / d l l ti )• Location (temperature/modulus relations).• Asphalt grade.• Mix air voids and gradation.• Crack initiation at bottom of HMACrack initiation at bottom of HMA.• Reliability.
Inputs – Jointed ConcreteInputs Jointed Concrete• Traffic.Traffic.• Soil support (k).• Joint spacing• Joint spacing.• Joint load transfer.
Ed t• Edge support.• Drainage conditions.• Concrete strength .• Slab cracking.• Reliability.
Decisions Decisions Decisions!Decisions, Decisions, Decisions!• Policy decisions:
T i lif d i– To simplify design.– To limit sophisticated data collection or
testingtesting.– Insure design assumptions are built into
pavement.p• Maintain “off-the-shelf” or current inputs.
– 18K ESAL and related traffic data collection.– Current material test.
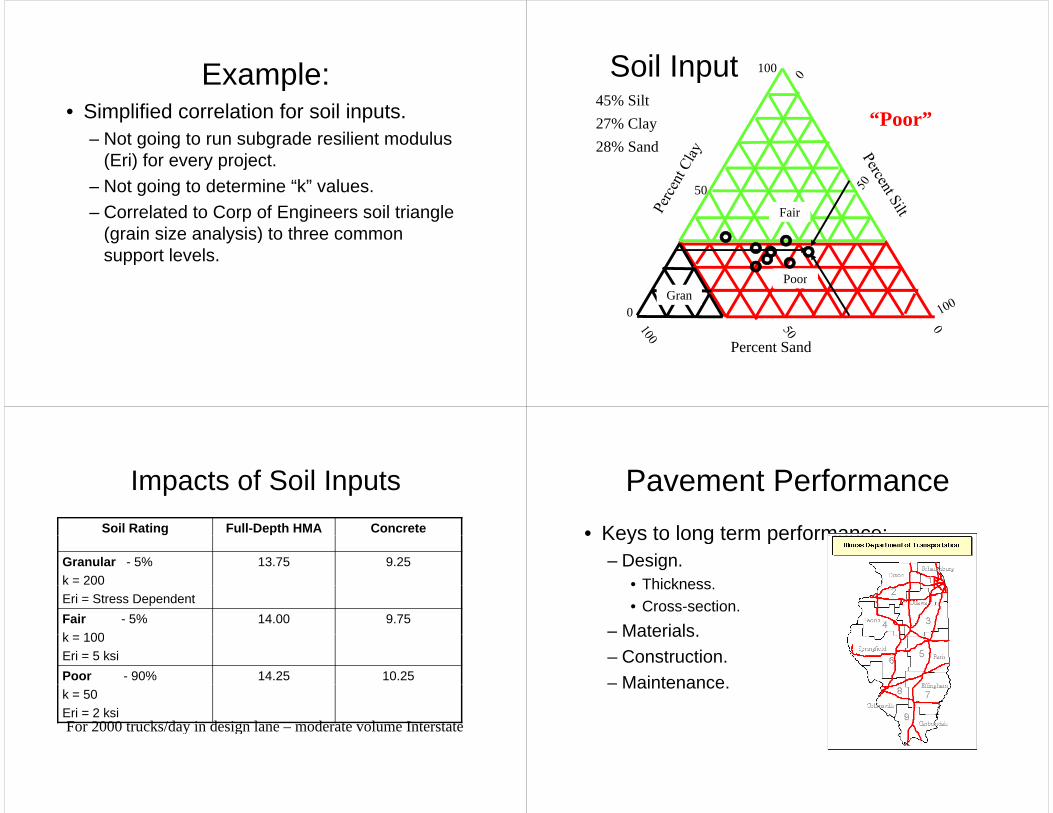
Example:Example:• Simplified correlation for soil inputs.
– Not going to run subgrade resilient modulus (Eri) for every project.
– Not going to determine “k” values.– Correlated to Corp of Engineers soil triangle
( i i l i ) t th(grain size analysis) to three common support levels.
Soil Input 100p
27% Clay45% Silt
“Poor”y28% Sand
50
Fair
Poor
0
PoorGran
Percent Sand
Impacts of Soil InputsImpacts of Soil InputsSoil Rating Full-Depth HMA Concrete
Granular - 5%k = 200
13.75 9.25
Eri = Stress DependentFair - 5%k 100
14.00 9.75k = 100Eri = 5 ksiPoor - 90% 14.25 10.25k = 50Eri = 2 ksiFor 2000 trucks/day in design lane – moderate volume Interstatey g
Pavement PerformancePavement Performance• Keys to long term performance:Keys to long term performance:
– Design.• Thickness• Thickness.• Cross-section.
– MaterialsMaterials.– Construction.– Maintenance– Maintenance.
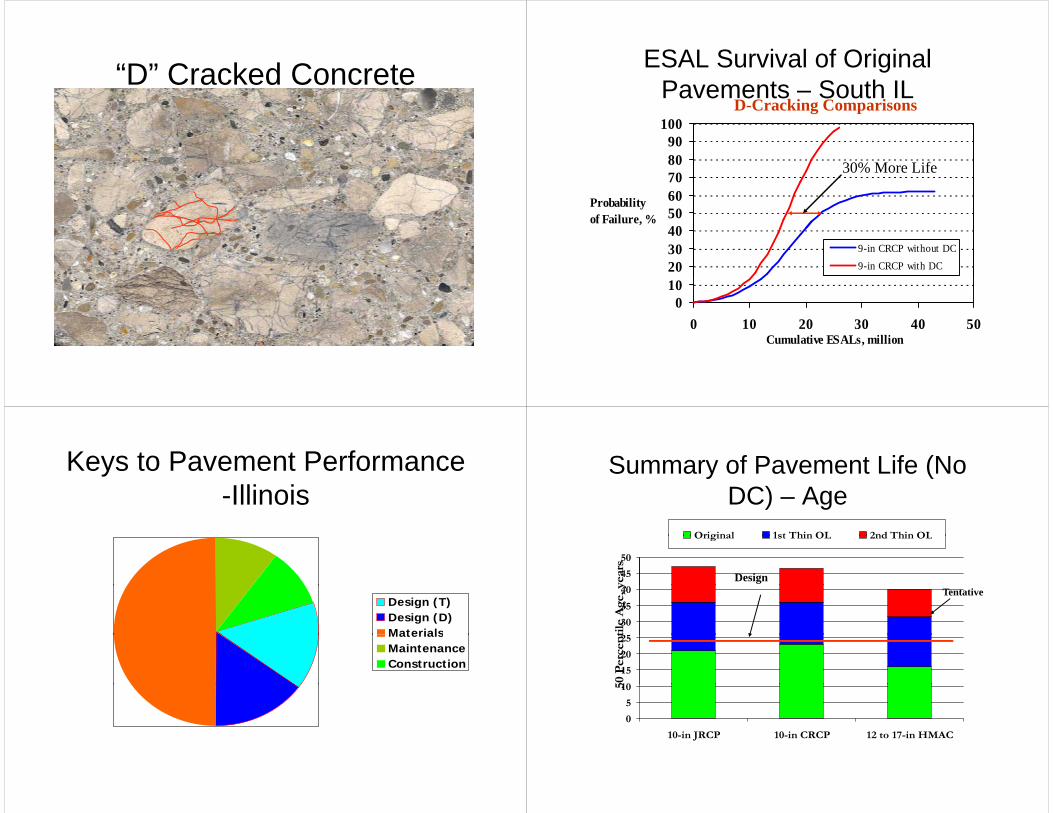
“D” Cracked ConcreteD Cracked Concrete ESAL Survival of Original P S h ILPavements – South IL100
D-Cracking Comparisons
708090
30% More Life
40506070
Probabilityof Failure, %
203040
9-in CRCP without DC9-in CRCP with DC
010
0 10 20 30 40 500 10 20 30 40 50Cumulative ESALs, million
Keys to Pavement Performance Illi i-Illinois
Design (T)Design (D)MaterialsMaterialsMaintenanceConstruction
Summary of Pavement Life (No DC) ADC) – Age
Original 1st Thin OL 2nd Thin OL
45
50
year
s
Original 1st Thin OL 2nd Thin OL
Design
30
35
40
tile
Ag
e, y Tentative
10
15
20
25
50 P
erce
nt
0
5
10
10 in JRCP 10 in CRCP 12 to 17 in HMAC
5
10-in JRCP 10-in CRCP 12 to 17-in HMAC
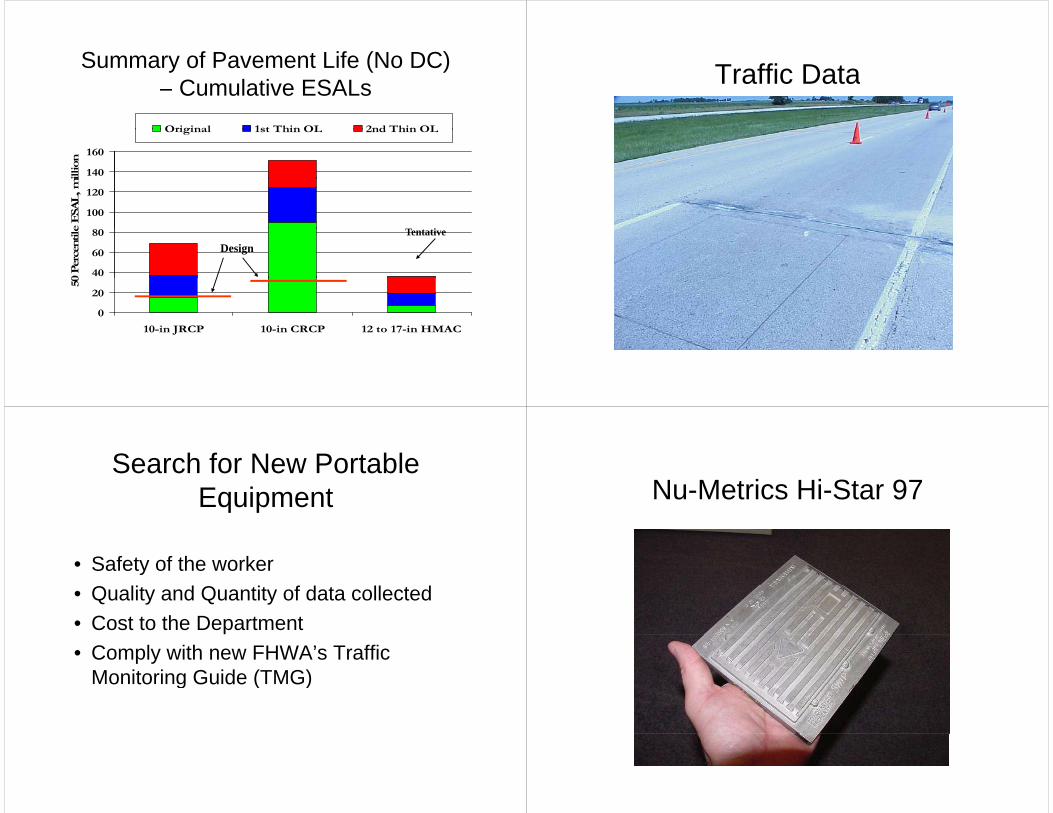
Summary of Pavement Life (No DC) C l ti ESAL– Cumulative ESALs
Original 1st Thin OL 2nd Thin OL
140
160
mill
ion
Original 1st Thin OL 2nd Thin OL
100
120
e E
SAL
, mi
i
40
60
80
0 Per
cent
ile TentativeDesign
0
20
10 i JRCP 10 i CRCP 12 t 17 i HMAC
50
10-in JRCP 10-in CRCP 12 to 17-in HMAC
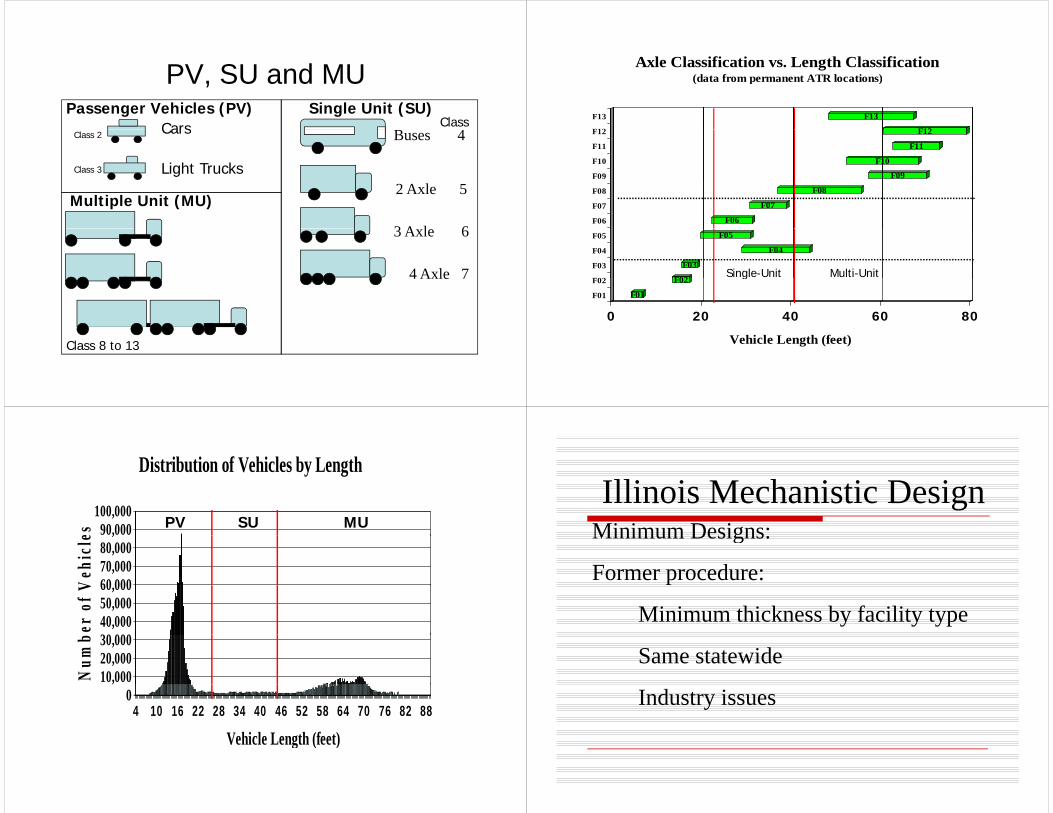
Traffic DataTraffic Data
Search for New Portable Equipment
• Safety of the worker• Quality and Quantity of data collected• Cost to the Department• Comply with new FHWA’s Traffic
Monitoring Guide (TMG) o to g Gu de ( G)
Nu Metrics Hi Star 97Nu-Metrics Hi-Star 97
PV SU and MUPV, SU and MUPassenger Vehicles (PV)
CarsSingle Unit (SU)
ClassCars
Light Trucks
Buses 4Class 2
Class 3
2 Axle 5
3 A l 6
Multiple Unit (MU)
3 Axle 6
4 Axle 74 Axle 7
Class 8 to 13
Axle Classification vs. Length Classification(data from permanent ATR locations)
F12
F13
F12
F13
(data from permanent ATR locations)
F09
F10
F11
F12
F09
F10
F11
F12
F06
F07
F08
F06
F07
F08
F02
F03
F04
F05
F02
F03
F04
F05
Single-Unit Multi-Unit
F01
F02
0 20 40 60 80
F01
F02g
Vehicle Length (feet)
Distribution of Vehicles by Length
90,000100,000
es
PV SU MU
60 00070,00080,000
,
Veh
icle
30 00040,00050,00060,000
er o
f V
10,00020,00030,000
Num
b
0,
4 10 16 22 28 34 40 46 52 58 64 70 76 82 88
V hi l L th (f t)Vehicle Length (feet)
Illi i M h i ti D iMinimum Designs:Illinois Mechanistic Design
Minimum Designs:
Former procedure:
Minimum thickness by facility type
Same statewide
Industry issues
New Minimums
Mi i b F ilit TMinimums by Facility TypeInterstates 2 Way ADT:
500 SU 1500 MU500 SU 1500 MU
Other State300 SU 900 MU300 SU 900 MU
UnmarkedActual Traffic
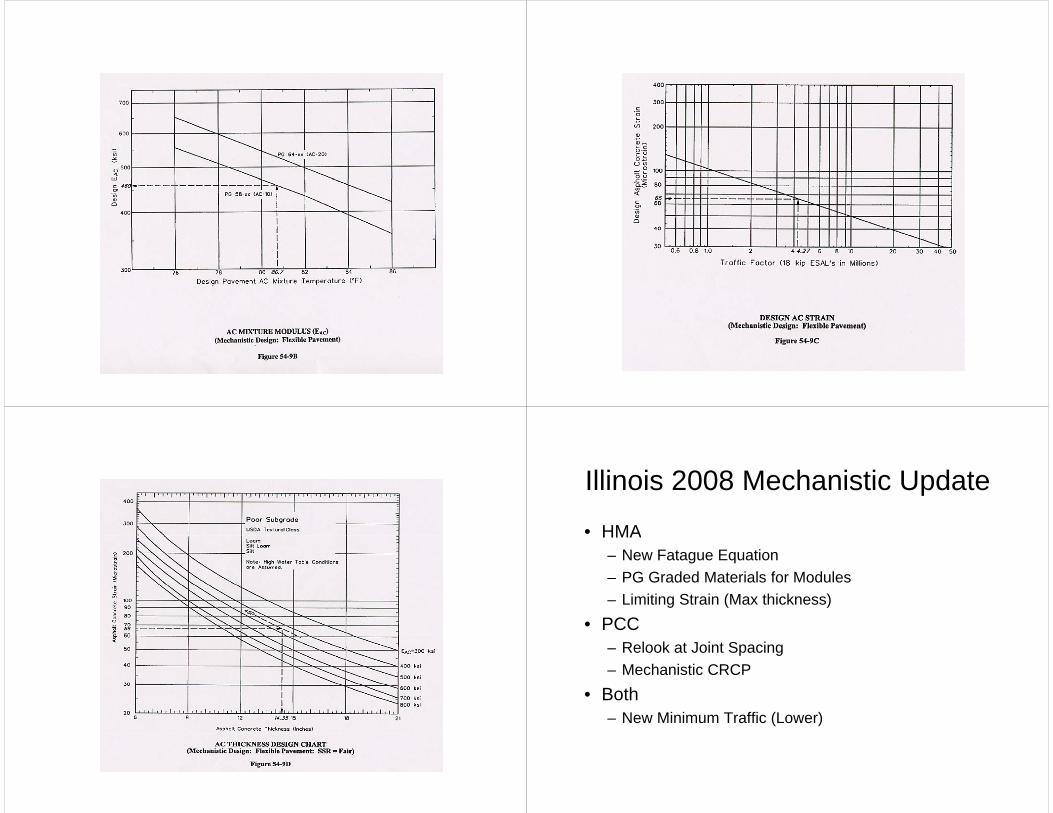
Mechanistic ExampleMechanistic ExampleMechanistic ExampleMechanistic Example
Given: TF = 4.27
AC = PG 58 – XX
Location = Springfield, IL
Soil Input 100
27% Clay45% Silt
“Poor”y28% Sand
50
Fair
Poor
0
PoorGran
Percent Sand
Illinois 2008 Mechanistic UpdateIllinois 2008 Mechanistic Update
• HMAHMA– New Fatague Equation– PG Graded Materials for Modules – Limiting Strain (Max thickness)
• PCC– Relook at Joint Spacing– Mechanistic CRCP
• Both– New Minimum Traffic (Lower)
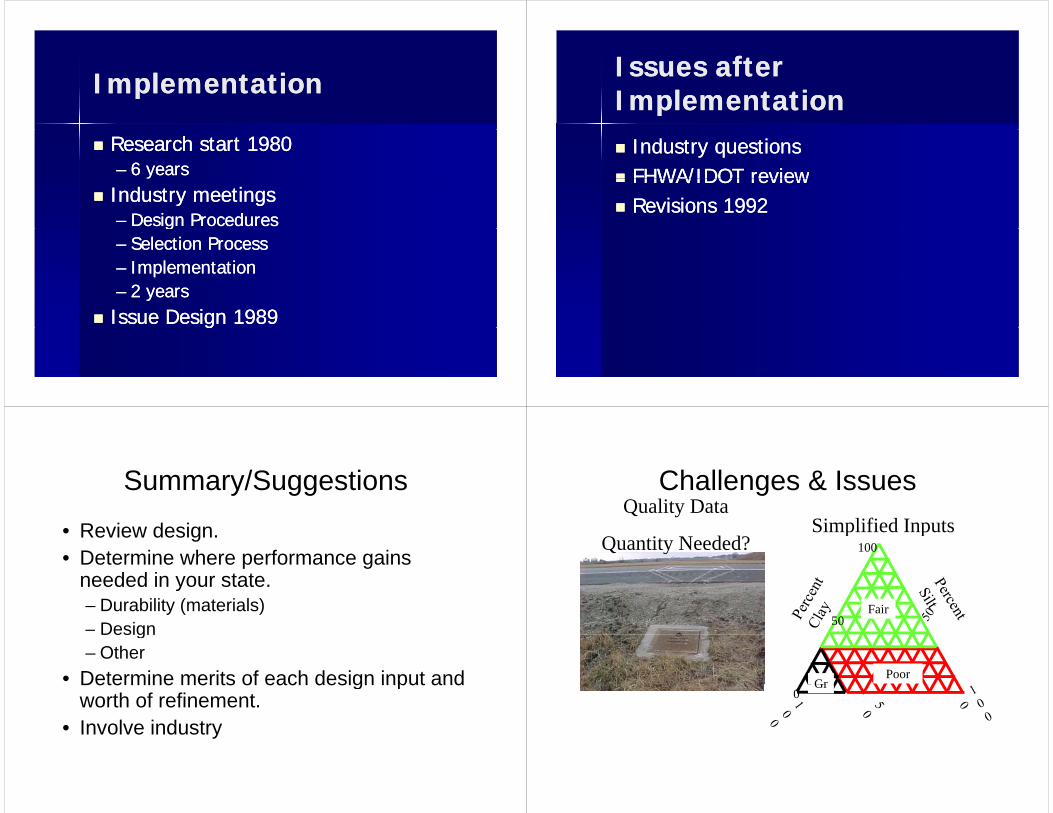
ImplementationImplementationImplementationImplementation
Research start 1980Research start 1980–– 6 years6 yearsIndustry meetingsIndustry meetings–– Design ProceduresDesign Proceduresgg–– Selection ProcessSelection Process–– ImplementationImplementation–– 2 years2 yearsIssue Design 1989Issue Design 1989gg
Issues after Issues after ImplementationImplementation
Industry questionsIndustry questionsFHWA/IDOT reviewFHWA/IDOT reviewFHWA/IDOT reviewFHWA/IDOT reviewRevisions 1992Revisions 1992
Summary/SuggestionsSummary/Suggestions
• Review design.Review design.• Determine where performance gains
needed in your state.needed in your state.– Durability (materials)– DesignDesign– Other
• Determine merits of each design input andDetermine merits of each design input and worth of refinement.
• Involve industryInvolve industry
Challenges & IssuesChallenges & IssuesQuality Data
i d dSimplified Inputs
Quantity Needed? 100p p
50Fair
PoorGr
0Gr
Questions?
Lincoln’s HomeLincoln’s HomeSpringfield, Illinois


![BIBLIOGRAPHY - Springer978-94-011-9685-7/1.pdf · BIBLIOGRAPHY [I] The AASHO Road Test. ... Vibrations of Mechanical Systems ... Vol. 1, 2. 4-th ed., Gostekhizdat,](https://img.pdfslide.us/doc/110x75/5aa796ed7f8b9a50528c95f7/bibliography-springer-978-94-011-9685-71pdfbibliography-i-the-aasho-road-test.jpg)