Embed Size (px)
Citation preview
14 wilmott magazine
Aaron Brown
A couple of issues back (“Try This at Home, Kids”) I extolled the benefits of behavioral economics experimen-tation. Not the stuff the professional academics do, although of course that
can be valuable, but doing it yourself. One observa-tion is worth a lot of reading. I described one of the four experiments I ran at the Global Association of Risk Professionals (GARP) annual convention in New York in March 2013. Today I’ll discuss anoth-er one. Donna Howe, Michael Miller, and Kent Osband were helpful co-presenters in this effort.
The main motivation was to teach the effects to the audience in a more meaningful way than reading a bunch of small print PowerPoint slides to them, before running out of time a third of the way through. We did the experiment, and then discussed both the academic literature on the sub-ject and our own group experience. A secondary motivation was to see how a group of professional risk managers behaved compared to the university sophomores and others whose results are docu-mented in the literature. I claim no scientific valid-ity to the results, participants were self-selected and may have known of the effects beforehand. No controls were employed, there was no blinding. I offer the results as anecdotal and suggestive only.
The audience was divided into 16 teams of four to six participants each (most teams had the full complement of six). I described a simple proce-dure, which I then performed at the front of the room, although the results were hidden. I rolled a standard six-sided die, then took that many black chips and put them in a hat. I added enough red
chips to make a total of six markers in the hat. On a computer display we went through the proce-dure slowly, step-by-step, without revealing the number on the die, and showed a few examples.
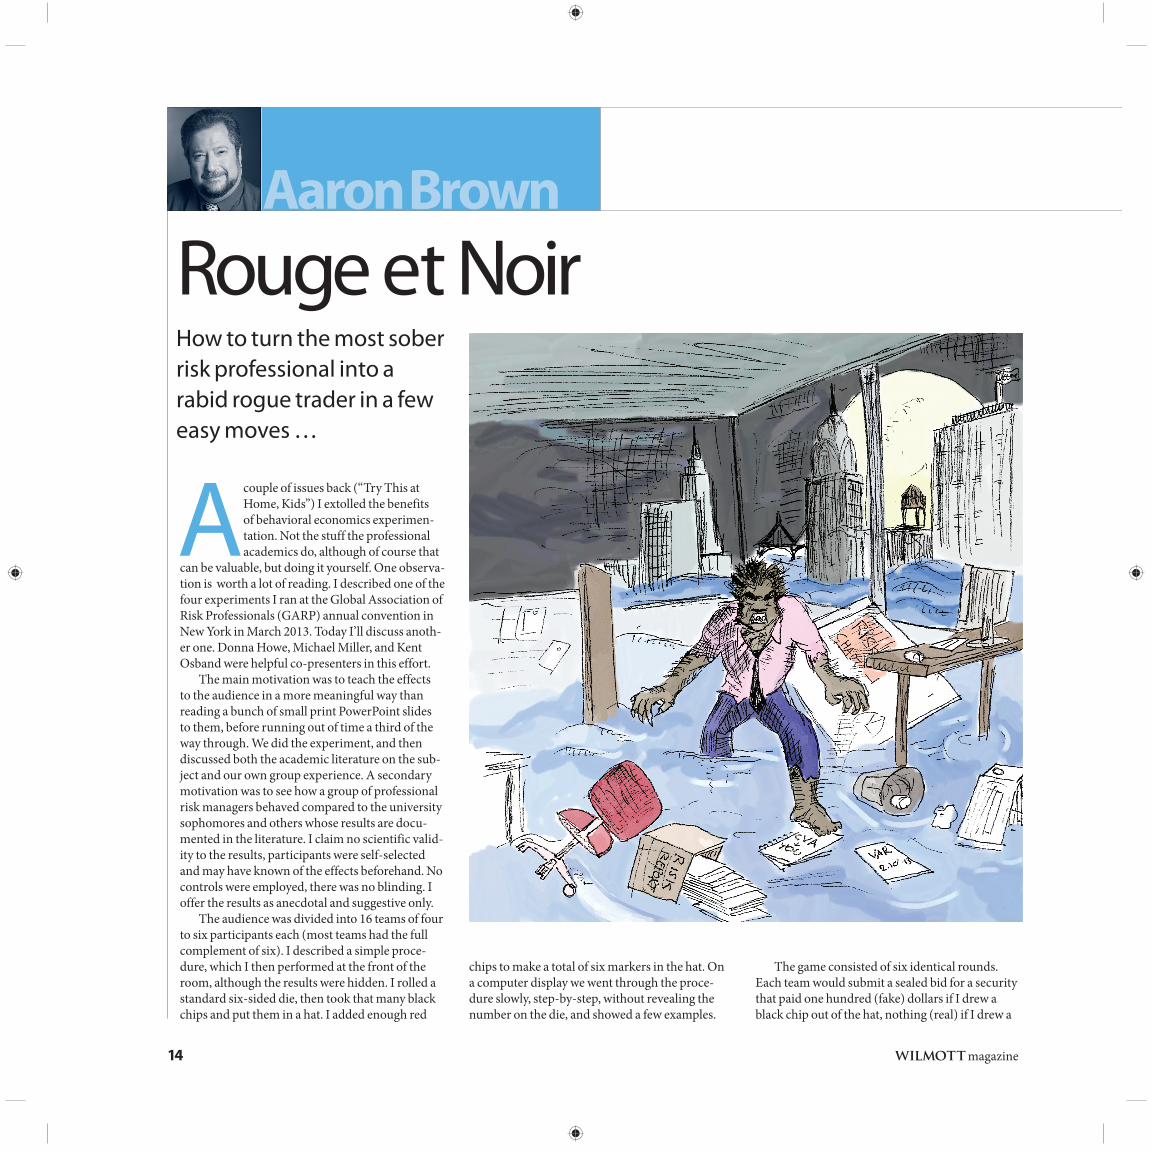
Rouge et NoirHow to turn the most sober risk professional into a rabid rogue trader in a few easy moves …
The game consisted of six identical rounds. Each team would submit a sealed bid for a security that paid one hundred (fake) dollars if I drew a black chip out of the hat, nothing (real) if I drew a
wilmott magazine 15
^
red chip. We took the median price and the eight teams that bid higher than the median bought one security (paying the median price in return for receiving $100 if a black chip was drawn), while the eight teams that bid lower than the median price sold the security (receiving the median price, but having to pay $100 if a black chip was drawn). A team that bid exactly the median had no trade.
Before getting into what happened at the GARP convention, take a moment to calculate the expected value of the security, given any previous sequence of black and red draws. If you like that sort of problem do it yourself, if not I’ll do it for you. But either way, pay attention to precisely how difficult the problem is. I calibrated the problem to be easy enough that I thought about half the people in the room could do it in the time allotted for the game, and therefore each group would likely have at least one person who could compute the answer. On the other hand, I wanted it hard enough that most people would be unsure of their answer, and lots of incorrect answers would fly around.
For the first draw, the answer is pretty easy. Call the number on the die D. Each of the values from 1 to 6 is equally likely for D, and the chance of drawing a black chip is D / 6. The average value for that is 3.5 / 6 = 0.5833, so the expected value of the security is $58.33.
The last draw is a little harder. Suppose B black chips have been drawn among the first five draws. If B = 0 then then last chip must be black, so the security’s expected value is $100. Otherwise there are two possi-bilities, D = B, in which case the last chip is red, or D = B + 1, in which case the last chip is black. If D = B, there were originally 6 – B red chips, the chance that one of them would be the last chip drawn was 1 – B / 6. If D = B +1, the chance that the last chip would be black was (B + 1) / 6. Since D = B and D = B + 1 were equally likely a priori, the posterior odds that D = B + 1 is [(B + 1) / 6] / [ 1 – B / 6 + (B + 1) / 6] = (B + 1) / 7. So the expected value of the security is $28.57 if B = 1, $42.86 if B = 2, $57.14 if B = 3, $71.43 if B = 4 and $85.71 if B = 5.
In between is a little harder still. You have to consider the cases from D = max(1, B) to D = 6 – R, where R is the number of red chips that have been drawn. For each one, you have to compute the conditional probability of observing B and R in the first B + R draws:
In each case, the probability of the next chip drawn being black is (D – B) / (6 – B – R). You multiply each conditional probability of observing B and R by the probability of the next chip being black given B and R, then divide by 7 / (B + R + 1), minus 1 if B = 0. This actually takes longer to write down than it takes to do, but it’s easy to make either a conceptual or arithmetic mistake.
The result is shown in Table 1. The first line, $58.33, represents the expected value for the first chip drawn. The second line to the left ($46.67)
represents the value if the first chip drawn is red, the value to the right ($66.67) represents the value if the first chip drawn is black. The triangle contin-ues in the same pattern, with the value after a red draw being shown at the left and the value after a black draw being shown at the right. The last line shows the value of the security after the first five chips have been drawn, conditional on having observed 0 ($100.00), 1 ($28.57) or more black chips among the first five.
If the draws to date contain zero or one red chip, drawing a black chip increases the value of the security, while drawing a red chip causes it to decline. But if you have drawn two or more red chips and no blacks, the pattern is reversed. This introduces a complexity into the bidding strategy.
However, note that there is no reason to worry about what other teams are doing. The proper strategy is to bid the expected value of the secu-rity. If the median bid is higher than the expected
value, you want to sell, and you do. If the median bid is lower than the expected value, you want to buy, and you do. You don’t get any better price if you guess how others will bid and adjust your bid to take advantage.
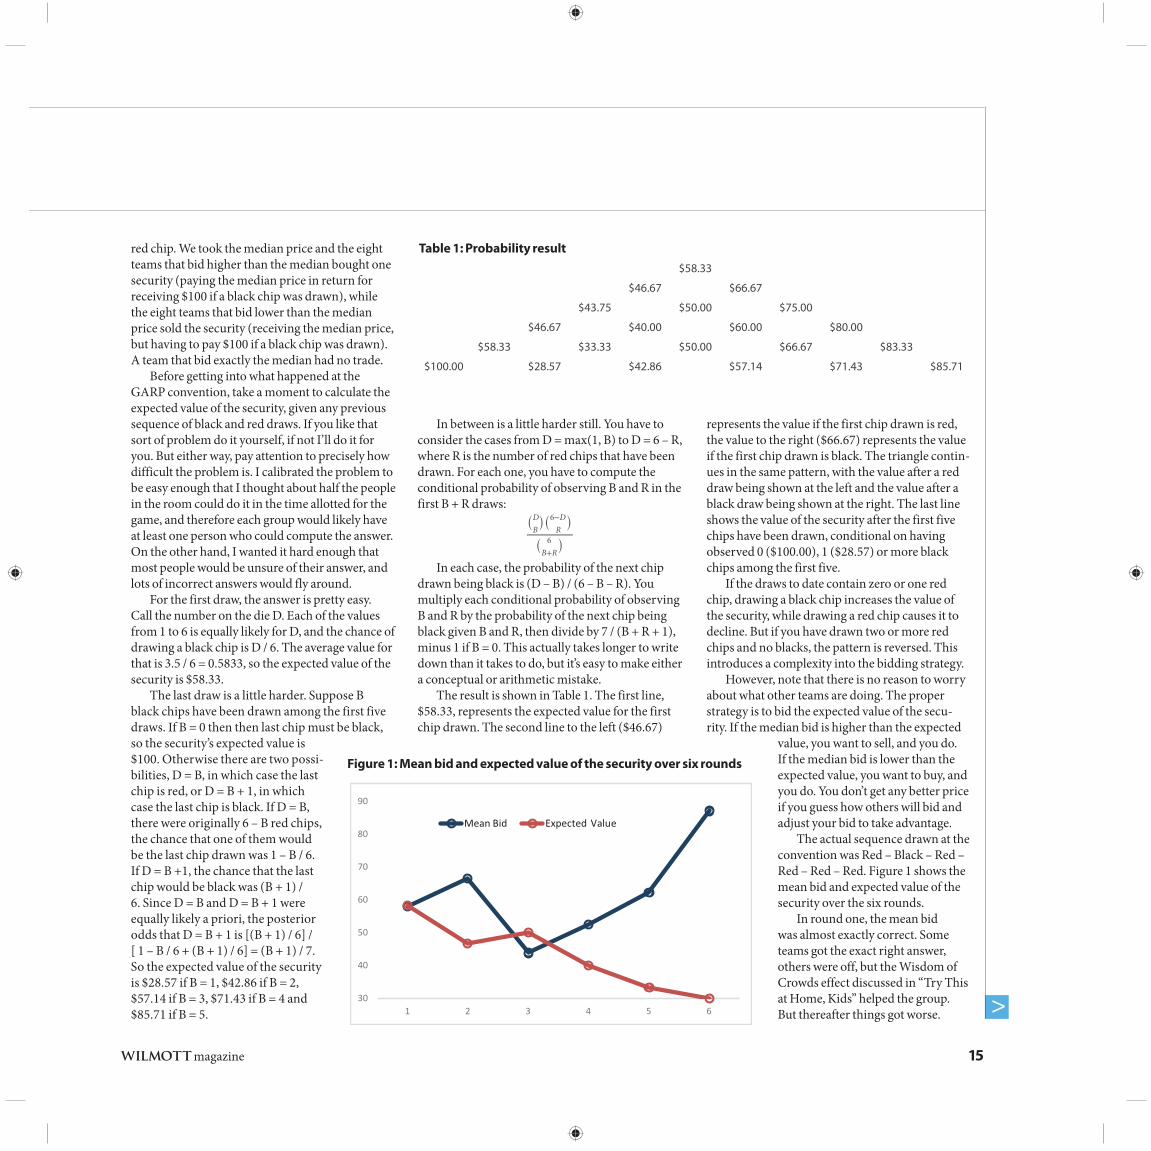
The actual sequence drawn at the convention was Red – Black – Red – Red – Red – Red. Figure 1 shows the mean bid and expected value of the security over the six rounds.
In round one, the mean bid was almost exactly correct. Some teams got the exact right answer, others were off, but the Wisdom of Crowds effect discussed in “Try This at Home, Kids” helped the group. But thereafter things got worse.
$58.33
$46.67 $66.67
$43.75 $50.00 $75.00
$46.67 $40.00 $60.00 $80.00
$58.33 $33.33 $50.00 $66.67 $83.33
$100.00 $28.57 $42.86 $57.14 $71.43 $85.71
Table 1: Probability result
30
40
50
60
70
80
90
Mean Bid Expected Value
1 2 3 4 5 6
Figure 1: Mean bid and expected value of the security over six rounds
One interesting thing is the mean of the group’s bids always moved in the opposite direction as the expected value. The first draw of a red chip decreased the expected value of the security for the next draw, but the average bid of the group increased. Then a black chip increased the value of the security, but the average bid decreased.
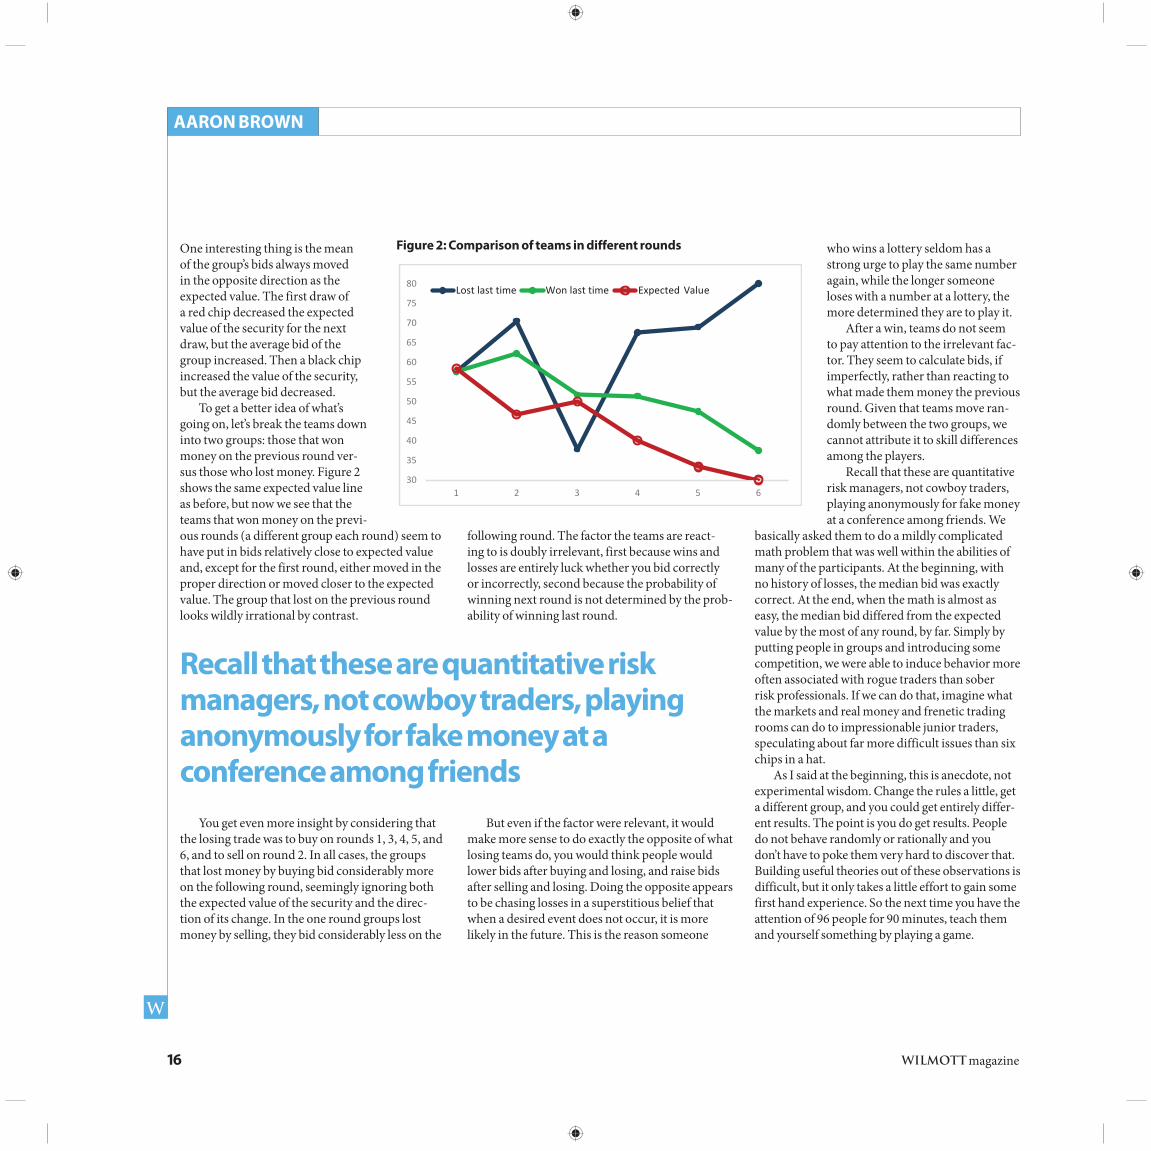
To get a better idea of what’s going on, let’s break the teams down into two groups: those that won money on the previous round ver-sus those who lost money. Figure 2 shows the same expected value line as before, but now we see that the teams that won money on the previ-ous rounds (a different group each round) seem to have put in bids relatively close to expected value and, except for the first round, either moved in the proper direction or moved closer to the expected value. The group that lost on the previous round looks wildly irrational by contrast.
You get even more insight by considering that the losing trade was to buy on rounds 1, 3, 4, 5, and 6, and to sell on round 2. In all cases, the groups that lost money by buying bid considerably more on the following round, seemingly ignoring both the expected value of the security and the direc-tion of its change. In the one round groups lost money by selling, they bid considerably less on the
following round. The factor the teams are react-ing to is doubly irrelevant, first because wins and losses are entirely luck whether you bid correctly or incorrectly, second because the probability of winning next round is not determined by the prob-ability of winning last round.
But even if the factor were relevant, it would make more sense to do exactly the opposite of what losing teams do, you would think people would lower bids after buying and losing, and raise bids after selling and losing. Doing the opposite appears to be chasing losses in a superstitious belief that when a desired event does not occur, it is more likely in the future. This is the reason someone
who wins a lottery seldom has a strong urge to play the same number again, while the longer someone loses with a number at a lottery, the more determined they are to play it.
After a win, teams do not seem to pay attention to the irrelevant fac-tor. They seem to calculate bids, if imperfectly, rather than reacting to what made them money the previous round. Given that teams move ran-domly between the two groups, we cannot attribute it to skill differences among the players.
Recall that these are quantitative risk managers, not cowboy traders, playing anonymously for fake money at a conference among friends. We
basically asked them to do a mildly complicated math problem that was well within the abilities of many of the participants. At the beginning, with no history of losses, the median bid was exactly correct. At the end, when the math is almost as easy, the median bid differed from the expected value by the most of any round, by far. Simply by putting people in groups and introducing some competition, we were able to induce behavior more often associated with rogue traders than sober risk professionals. If we can do that, imagine what the markets and real money and frenetic trading rooms can do to impressionable junior traders, speculating about far more difficult issues than six chips in a hat.
As I said at the beginning, this is anecdote, not experimental wisdom. Change the rules a little, get a different group, and you could get entirely differ-ent results. The point is you do get results. People do not behave randomly or rationally and you don’t have to poke them very hard to discover that. Building useful theories out of these observations is difficult, but it only takes a little effort to gain some first hand experience. So the next time you have the attention of 96 people for 90 minutes, teach them and yourself something by playing a game.
AARON BROWN
16 magazine
Recall that these are quantitative risk managers, not cowboy traders, playing anonymously for fake money at a conference among friends
30
35
40
45
50
55
60
65
70
75
80
1 2 3 4 5 6
Lost last time Won last time Expected Value
Figure 2: Comparison of teams in different rounds