Embed Size (px)
Citation preview

AAP 2018 Red Book
Tuberculosis: IGRAs and
Treatment of TB Infection
Jeffrey R. Starke, M.D.
Professor of Pediatrics
Baylor College of Medicine

Disclosures
Dr. Starke is a member of the
Data Safety Monitoring Board
of Otsuka Pharmaceuticals for
the pediatric studies of
delamanid, a new drug for
MDR-TB.

Objective
To review important changes in the
2018 American Academy of Pediatrics
Report of the Committee on Infectious
Diseases [the “Red Book”] about
childhood tuberculosis
Use of IGRAs
Treatment regimens for tuberculosis
infection
Rifampin dosing

A Case 12 yr. old girl from Mexico with IBD needs infliximab
TST is 0 mm; she is started on infliximab
She is lost to follow up, but shows up about a year
later with worsening IBD
The GI folks want to put her back on infliximab
A TST is done and there are 3 notes in the chart
about the results:
1. Nurse #1: “Negative”
2. Nurse #2: “Some induration, likely positive”
3. Pedi Resident: “Only redness, negative result”
Infliximab is started; 2 months later she presents with
fever, cough and cavitary tuberculosis
Number of positive TSTs previously seen by the
resident = 0

TB Epidemiology Studies
Consortium Research Update
on Latent Tuberculosis
Infection
Christine S. Ho, M.D., M.P.H.
CDC TBESC Project Officer
ACET Meeting
December 12, 2016

TBESC-II Collaborators
1. California Department of Public
Health
2. Denver Health and Hospitals
Authority
3. Duke University, North Carolina
4. Emory University, Atlanta
5. Hawaii Department of Health
6. Seattle-King County Health
Department
7. Maricopa County Health
Department
8. Maryland Department of Health
9. University of Florida
10. University of North Texas Health
Science Center
CDC-funded
collaboration
with health
departments,
academic
institutions,
and CDC

Which tests or test combinations can
best identify LTBI in specific high-risk
populations in the U.S.?
Can test characteristics be improved
By changing cutoff values?
By testing sequentially?
Which test best predicts progression to
TB?
Research Questions

Prospective cohort study
Enrolled from populations at high
risk of LTBI
Each enrollee tested for LTBI with
3 FDA-approved tests:
QuantiFERON (QFT) blood test
T-SPOT.TB (T-SPOT) blood test
Tuberculin skin test (TST)
Study Design
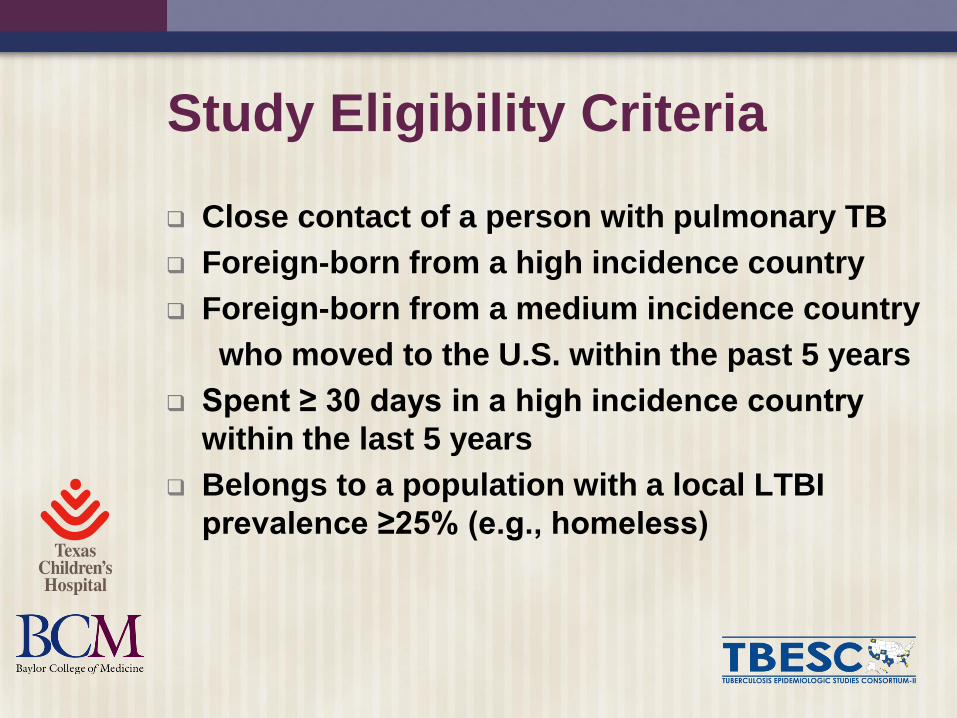
Close contact of a person with pulmonary TB
Foreign-born from a high incidence country
Foreign-born from a medium incidence country
who moved to the U.S. within the past 5 years
Spent ≥ 30 days in a high incidence country
within the last 5 years
Belongs to a population with a local LTBI
prevalence ≥25% (e.g., homeless)
Study Eligibility Criteria

Examine LTBI prevalence in our high risk
groups using single and combination test
results
Use latent class analysis (LCA) to
estimate the “true” prevalence of LTBI in
our study population, as well as test
sensitivities and specificities
Analysis on clean data from July 2012-
September 2014 dataset
Analytic Approach

TST :
5mm for HIV-infected persons, close
contacts
10 mm for recent immigrants, <5 years of
age, injection drug users
QFT : ≥ 0.35 IU/ml
TSPOT:
International: Positive: ≥ 6 spots
U.S.: Positive: ≥ 8 spots, borderline: 5-7
spots
Cut Points for Positive Tests

Characteristics of 11,962 TBESC Participants July 2012-September 2014
N %
Male 6,284 53
Foreign-born 9,643 81
BCG vaccination 6,332 53
HIV infection 1,460 12
Children < 5 years old 516 4.3
Median age (years, IQR) 31 (19, 46)

Single Test Prevalence for Foreign-Born, HIV-negative Persons,
by Age Group
0
5
10
15
20
25
30
35
40
45
50
< 5 years 5+ years
Pe
rce
nt p
ositiv
e
Age group
TST QFT
T-SPOT (Int) T-SPOT (US)

Test Characteristics by LCA
for Foreign-Born Participants >5 years (n=8,018)
LTBI prevalence 37.9% (32.6-42.9)
Sensitivity
TST 74.8% (67.2-82.4)
QFT 71.6% (63.3-79.9)
T-SPOT* 70.3% (61.4-79.1)
Specificity
TST 69.6% (67.7-71.4)
QFT 98.9% (97.8-99.9)
T-SPOT* 99.4% (98.6-100)
PPV
TST 60.0% (56.4-62.7)
QFT 97.6% (94.0-99.6)
T-SPOT* 98.6% (95.8-99.8)
NPV
TST 81.8% (78.5-91.1)
QFT 85.0% (73.8-89.3)
T-SPOT* 84.5% (77.8-91.0)
* For LCA we used ≥5 spots as a positive T-SPOT resultPPV = positive predictive value, true positive /true positive + false positive;
NPV= negative predictive value, true negative/true negative + false negative

What This Means for the Clinician: Population ≥5 Years at High Risk for LTBI
LTBI No LTBI
TST + 285 186 471
TST - 95 434 529
380 620 1000
• Sensitivity of 75%
• Specificity of 70%
Of 1000 people—
• 39% (186/471) with TST+
don’t have LTBI
• Positive predictive value (PPV)
is 61%
• 25% (95/380) of LTBI missed
Hypothetical cohort of 1000 foreign-born patients ≥5 years (38% LTBI prevalence)
LTBI No LTBI
IGRA+ 270 6 276
IGRA- 110 614 724
380 620 1000
• Sensitivity of 71%
• Specificity of 99%
Of 1000 people—
• 2% (6/276) with IGRA+ don’t
have LTBI
• PPV is 98%
• 29% (110/380) of LTBI missed

LTBI Test Characteristics by LCA
for Foreign-Born Children <5 Years (n=463)
LTBI prevalence 4.2% (1.9-6.7)
Sensitivity
TST 74.8% (67.2-82.4)
QFT 70.4% (54.4-86.1)
T-SPOT* 58.9% (42.5-75.7)
Specificity
TST 74.0% (69.7-78.0)
QFT 98.9% (97.7-99.9)
T-SPOT** 99.0% (98.1-99.9)
PPV*
TST 10.2% (5.0-16.9)
QFT 73.8% (43.3-95.5)
T-SPOT 71.9% (45.4-93.2)
NPV*
TST 98.3% (96.7-99.3)
QFT 98.7% (97.3-99.6)
T-SPOT 98.2% (96.5-99.4)
PPV = positive predictive value, true positive /true positive + false positive;
NPV= negative predictive value, true negative/true negative + false negative** For LCA we used ≥5 spots as a positive T-SPOT result

QFT
TSPOT
TST
LTBI Test Characteristics by LCA
in Foreign-Born Children <5 Years (n=463)
* For LCA we used ≥5 spots as a positive T-SPOT result

What This Means for the Clinician: Population < 5 Years at High Risk for LTBI
LTBI No LTBI
TST+ 30 284 314
TST- 10 676 686
40 960 1000
• Sensitivity of 74.8%
• Specificity of 74.0%
Of 1000 people—
• 90% (284/314) with TST+ don’t have LTBI
• Positive predictive value (PPV) is ~10%
(30/314)
• 25% (10/40) LTBI missed
Hypothetical cohort of 1000 foreign-born children < 5 yrs (4% LTBI prevalence)
QFT
• Sensitivity of 70.4%
• Specificity of 98.9%
Of 1000 people—
• 26% (10/38) with positive QFT
don’t have LTBI
• PPV is 74% (28/38)
• 30% (12/40) LTBI missed
T-SPOT
• Sensitivity of 58.9%
• Specificity of 99.0%
Of 1000 people—
• 29% (10/34) with positive T-SPOT don’t
have LTBI
• PPV is 71% (24/34)
• 40% (16/40) LTBI missed

Summary Foreign-born persons ≥5 years
TST was little better than a coin flip in predicting
who had LTBI
Both the QFT and TSPOT had high positive
predictive values of 97.6 and 98.6
Foreign-born persons <5 years
LTBI prevalence by LCA was 4%
For TST ≥ 10 mm as positive, the PPV was 10%;
almost all positive TST results were false positives
Our data support recommendations preferring
either serial testing (TST followed by a QFT/T-
SPOT) or use QFT/T-SPOT as the initial screening
test in foreign-born persons < 5 years

T-Spot.TB Data From Oxford Imm.Anna Mandalakas and Heather Highsmith
Anonymous data from ~ 44,000 T-Spot.TB results
No epidemiologic data available – cannot validate sensitivity,
specificity, PPV or NPV
Most invalid results from high nil response – higher in spring!
1.3% could not perform due to low lymphocyte counts

Question
If the IGRAs had come
first, and we were now
considering whether and
how to use the TST,
what would we say?


IGRAs AND THE 2018
AAP “RED BOOK” Can use IGRAs in immunocompetent children > 2
years of age [previously > 5 years of age] in all
situations when a TST would be used; some
experts down to 1 year of age
Particularly useful/preferred for children who
have received a BCG vaccination
Same recommendations as TST for risk factors
and frequency of testing
Use with caution in immunocompromised
children
Neither IGRAs nor the TST are perfect; always
need clinical judgment!

Change 5 y to 2 y in this table

IGRAs IN CHILDREN – SOME
CLINICAL ISSUESBCG-vaccinated child Strategy 1: TST: if negative, no more
testing; if positive, follow with an IGRA Strategy 2: Do only the IGRA Note: If TB exposure, child should be
considered infected if either test is positive
Child about to be immune compromised No TB risk factor: do either a TST or an
IGRA TB risk factor: do both a TST and an
IGRA and evaluate and treat if either test result is positive [RISK and BENEFIT]

Treatment of Tuberculosis Infection
in Children: 2015 Red Book 9H the preferred regimen
4R to be used only when there is
isoniazid resistance or intolerance;
“some experts would chose to treat
children younger than 12 years with 6R.”
3HP “should not be used routinely for
children younger than 12 years of age
but can be considered when the
likelihood of completing another
regimen is low.”

Villarino et al. JAMA Pediatr 2015; doi:10:1001/jamapediatrics.2014.3158
• Part of a larger trial of ~7,800 patients
• Included children ages 2 to 17 years
• 905 children evaluable for effectiveness
• 12 weekly doses of 3HP vs. 9 months daily doses of INH
• Completion rates: 3HP – 88% 9INH – 91%
• Development of TB: 3HP – 0/471 9INH – 3/434
• No child experienced hepatotoxicity, Grade 4 adverse event
• Grade 3 Adverse Effect: 3HP – 3 of 539 9INH – 1 of 493
Conclusion: 3HP was at least as effective, safe and had a
higher completion rate than 9 months of INH

Cruz and Starke. Completion rate and safety of tuberculosis infection
treatment with shorter regimens. Pediatrics 2018; 141: e20172838
Retrospective review of actual practice: N = 667
3HP: 283 4R: 132 9H: 252
Completion rates: 3HP: 97% 4R: 88%
9H completion: SAT: 53% ESAT: 76% DOPT: 89%
Multivariate analysis: completion associated with
DOPT, increasing age, absence of any AE
AEs were more common with 9H, including 2 children
with significant hepatotoxicity [none with 3HP or 4R]
One case of TB disease: 16 year old developed
culture confirmed pulmonary TB 7 months after
completing 3HP; great concern that she “cheeked”
and spit out the medications after the HCW left the
house


Gaensbauer et al. Pediatr Infect Dis J 2018; 37:224
• 4R [N=395] vs. 9H [N=779] from 2016 to 2015 in children
• Retrospective, nonrandomized observational study
• Drug toxicity [all dermatologic]: 4R – 1.5%, 9H-0.7% [NS]
• No known treatment failures
• Completion rates were higher when IGRA was used and when
known contact with a TB case was present

Gaensbauer et al. Pediatr Infect Dis J 2018; 37:224

4R Data from Dick Menzies’
Study
The AAP Red Book Committee was
shown the data but I am not allowed
to show it to you as it is, as yet,
unpublished and remains blinded
~ 400 children in 4R and 9H groups
4R well tolerated and higher
completion rates than 9H

Treatment of Tuberculosis Infection
in Children: 2018 Red Book
Order in the book and in the Table will
be 3HP, 4R, and 9H
Only limitation stated is that 3HP
cannot be used in children under 2
years of age because of lack of pK data
for rifapentine
Will not state a specific preference but
will say that “some experts” think that
3HP is the preferred regimen

Rifampin Dosing
Target serum concentration of 8μg/ml
CSF to serum ratio: 0.04-0.11
Schaaf et al, BMC Med, 2009: only 9% of children
achieved this level at 2 hrs post dose [South Africa]
Verhagen et al, Trop Med Int Health, 2012: only
23% of children achieved this level [Venezuela]
Savic et al, Clin Pharm Ther, 2015: study of pK of
rifampin and levofloxacin in adults and children with
TBM [Indonesia]
* Takes at least an oral dose of 30 mg/kg and
an IV dose of 15 mg/kg of rifampin to reach the target
AUC of 92 mg*h/L; even higher doses required to
ensure that every child reaches this exposure

Pullen et al: Pharmacokinetics of intravenous rifampin in
neonates. Ther Drug Monit 2006; 5:65421 neonates treated for Staphylococcus aureus infections

Pullen et al: Pharmacokinetics of intravenous rifampin in
neonates. Ther Drug Monit 2006; 5:65421 neonates treated for Staphylococcus aureus infections
Start of therapy Two Weeks

Treatment of Tuberculosis
Infection in Children: 2018 Red
Book: Rifampin Dosing
Standard Treatment
2015: 10-20 mg/kg/day
2018: 15-20 mg/kg/day
Infants, Toddlers and TBM [any age]
2015: 10-20 mg/kg/day
2018: 20-30 mg/kg/day

Summary
1. IGRAs routinely age 2 years and above;
some experts down to 1 year
2. 3HP [age 2 years and above], 4R and 9H
all acceptable regimens for treatment of
tuberculosis infection in children
3. Increases in recommended rifampin
doses: Routine: 15-20 mg/kg/d
Young Children: 20-30 mg/kg/d
TB Meningitis: 20-30 mg/kg/d