Embed Size (px)
Citation preview
Biochemical characterisation of Ideonella sakaiensis
and the influence of culture conditions on plastic
degradation
Master’s thesis 2019/20
Aalborg University Copenhagen
Author: Supervisor:
Božena Odobašić Cristiano Varrone
June 4th, 2020
II
Abstract
It has become apparent that the global reliance on plastic is not only due to the increased
commodification of modern society, but also due to practical applications which have become
too inextricably intwined in every industry. The global Covid-19 pandemic in 2020 has
particularly illustrated this. The solution to the plastic problem lies in a systematic overhaul of
international sustainability initiatives, waste management strategies, and prioritising recovery
of materials trapped in end-state plastic, as well as developing comprehensive complete
recycling systems.
With the discovery of microorganisms that are able to degrade plastic, an avenue of
sustainable recycling has opened for closing a loop on a circular economy system. One such
bacteria is Ideonella sakaiensis which produces a hydrolase capable of depolymerising PET,
aptly dubbed a PETase. In addition, with an MHETase which aids in converting dimers for
complete recovery of monomers, I. sakaiensis is able to efficiently degrade PET of varying
crystallinity, with a preference of low crystallinity PET.
In this work, the objective was to characterise growth conditions which would produce
reliable and reproducible set of methods to obtain the biggest biofilm growth, while
investigating how it affected the degradation of PET. The project did not fulfil the goals set
out, however, it concluded that the research is valuable even without the use of molecular
tools, in order to identify the base characteristics of the species, for comparative purposes as
well as better insight into the direction future research may go towards.

III
Acknowledgements
I would like to take this opportunity to acknowledge all of the people responsible for this
thesis coming to fruition. Firstly, I would like to thank my supervisor, Cristiano Varrone, for
the incredible amount of patience and willingness to provide guidance with anything I needed
with the project. Our research was cut short, but in the time, we had, I have learned a lot and
gained many valuable practical skills.
I would also like to thank our laboratory technician who was always forthcoming in listening
to my questions. The student assistant, Andrew Rennison, who was working on a project
parallel to mine and spent a considerable amount of time at the start sharing work with me and
sharing his extensive molecular biology knowledge. Without him the start would have been
filled with more uncertainty than it already was. I thank him from the bottom of my heart. All
of the Masters students who were in the laboratory with me, doing their own work, but always
lending support; we might have been doing completely different projects but we always had
words of wisdom and encouragement for each other. The exchange of information not only
between us as students but with other supervisors as well, has proven to be invaluable.
And finally, I would like to thank my family and friends who trusted in me and my dream to
study about a more sustainable world. As well as supporting me the entire duration of the
thesis programme.
IV
Table of Contents
1 Introduction ......................................................................................................................... - 1 -
1.1 Reliance on plastic ....................................................................................................... - 1 -
1.1.1 Types of plastic polymers and their uses .............................................................. - 2 -
1.1.2 The cost of convenience ........................................................................................ - 4 -
1.1.3 Modern waste treatment ........................................................................................ - 6 -
1.2 Alternative management strategies ............................................................................ - 12 -
1.2.1 Biodegradation .................................................................................................... - 14 -
1.2.2 Commonly used strains ....................................................................................... - 16 -
1.3 Ideonella sakaiensis ................................................................................................... - 17 -
1.3.1 I. sakaiensis PETase ............................................................................................ - 18 -
1.4 Biochemical characterisation ..................................................................................... - 21 -
1.4.1 Testing culture conditions ................................................................................... - 21 -
1.5 COVID-19 impact on global plastic consumption ..................................................... - 22 -
1.6 Research questions and project aims .......................................................................... - 24 -
2 Materials and Methods ...................................................................................................... - 25 -
2.1 Microbial strains ......................................................................................................... - 25 -
2.2 Culture activation ....................................................................................................... - 25 -
2.3 Solid and liquid media................................................................................................ - 26 -
2.3.1 LB media ............................................................................................................. - 26 -
2.3.2 YSV media .......................................................................................................... - 26 -
2.3.3 M9 and M9+ media ............................................................................................. - 27 -
2.4 Purifying and verifying the species ............................................................................ - 28 -
2.4.1 Solid media colony isolation ............................................................................... - 29 -
2.4.2 Verifying the species ........................................................................................... - 30 -
2.5 Creating PET powder ................................................................................................. - 30 -
2.6 Measuring OD600 ........................................................................................................ - 31 -
V
2.6.1 Preparing the microplate ..................................................................................... - 31 -
2.6.2 Microplate reader ................................................................................................ - 32 -
2.7 PET degradation experiments .................................................................................... - 32 -
2.7.1 Quantifying degradation ...................................................................................... - 33 -
2.7.2 Solvent experiments ............................................................................................ - 34 -
3 Results and discussion ....................................................................................................... - 35 -
3.1 Selection of liquid and solid media ............................................................................ - 35 -
3.2 Establishing biofilms .................................................................................................. - 37 -
3.2.1 PET bottle degradation experiments ................................................................... - 39 -
3.3 Optimisation of the PET powder production ............................................................. - 41 -
3.4 Determining comprehensive quantification of degradation of PET powder .............. - 43 -
3.4.1 BCA and enzyme assay experiments .................................................................. - 44 -
3.4.2 Solvent experiment .............................................................................................. - 48 -
3.5 I. sakaiensis experiments............................................................................................ - 49 -
4 Future perspectives ............................................................................................................ - 53 -
4.1 Project plans ............................................................................................................... - 53 -
4.2 PEF as a substitute for PET ........................................................................................ - 54 -
5 Conclusion ......................................................................................................................... - 55 -
6 Bibliography ...................................................................................................................... - 58 -
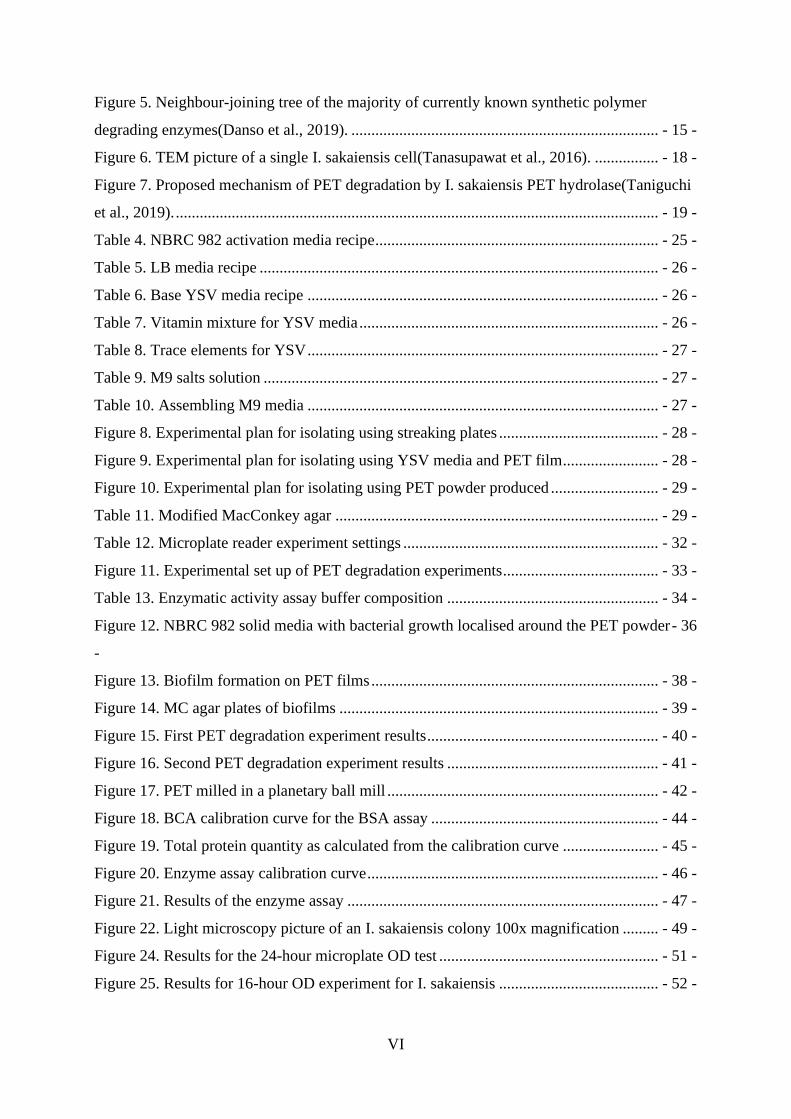
List of Figures and Tables
Table 1. Most common commercial plastics, their monomers and uses ............................... - 2 -
Figure 1. Top marine litter on European beaches, 2016(Editorial team, 2018) .................... - 4 -
Figure 2. Path of mismanaged waste into the ocean(Ritchie & Roser, 2020). ...................... - 5 -
Figure 3. Potential pathways of plastic in the environment(W. C. Li et al., 2016) ............... - 6 -
Table 2. SPI markers of plastic polymers for identification(Rahimi & Garciá, 2017) ......... - 7 -
Figure 4. The flow of plastic from production to waste(Ritchie & Roser, 2020). .............. - 11 -
Table 3. Biobased plastic alternatives(Ahmed et al., 2018) ................................................ - 13 -
VI
Figure 5. Neighbour-joining tree of the majority of currently known synthetic polymer
degrading enzymes(Danso et al., 2019). ............................................................................. - 15 -
Figure 6. TEM picture of a single I. sakaiensis cell(Tanasupawat et al., 2016). ................ - 18 -
Figure 7. Proposed mechanism of PET degradation by I. sakaiensis PET hydrolase(Taniguchi
et al., 2019). ......................................................................................................................... - 19 -
Table 4. NBRC 982 activation media recipe ....................................................................... - 25 -
Table 5. LB media recipe .................................................................................................... - 26 -
Table 6. Base YSV media recipe ........................................................................................ - 26 -
Table 7. Vitamin mixture for YSV media ........................................................................... - 26 -
Table 8. Trace elements for YSV ........................................................................................ - 27 -
Table 9. M9 salts solution ................................................................................................... - 27 -
Table 10. Assembling M9 media ........................................................................................ - 27 -
Figure 8. Experimental plan for isolating using streaking plates ........................................ - 28 -
Figure 9. Experimental plan for isolating using YSV media and PET film ........................ - 28 -
Figure 10. Experimental plan for isolating using PET powder produced ........................... - 29 -
Table 11. Modified MacConkey agar ................................................................................. - 29 -
Table 12. Microplate reader experiment settings ................................................................ - 32 -
Figure 11. Experimental set up of PET degradation experiments ....................................... - 33 -
Table 13. Enzymatic activity assay buffer composition ..................................................... - 34 -
Figure 12. NBRC 982 solid media with bacterial growth localised around the PET powder - 36
-
Figure 13. Biofilm formation on PET films ........................................................................ - 38 -
Figure 14. MC agar plates of biofilms ................................................................................ - 39 -
Figure 15. First PET degradation experiment results .......................................................... - 40 -
Figure 16. Second PET degradation experiment results ..................................................... - 41 -
Figure 17. PET milled in a planetary ball mill .................................................................... - 42 -
Figure 18. BCA calibration curve for the BSA assay ......................................................... - 44 -
Figure 19. Total protein quantity as calculated from the calibration curve ........................ - 45 -
Figure 20. Enzyme assay calibration curve ......................................................................... - 46 -
Figure 21. Results of the enzyme assay .............................................................................. - 47 -
Figure 22. Light microscopy picture of an I. sakaiensis colony 100x magnification ......... - 49 -
Figure 24. Results for the 24-hour microplate OD test ....................................................... - 51 -
Figure 25. Results for 16-hour OD experiment for I. sakaiensis ........................................ - 52 -
VII
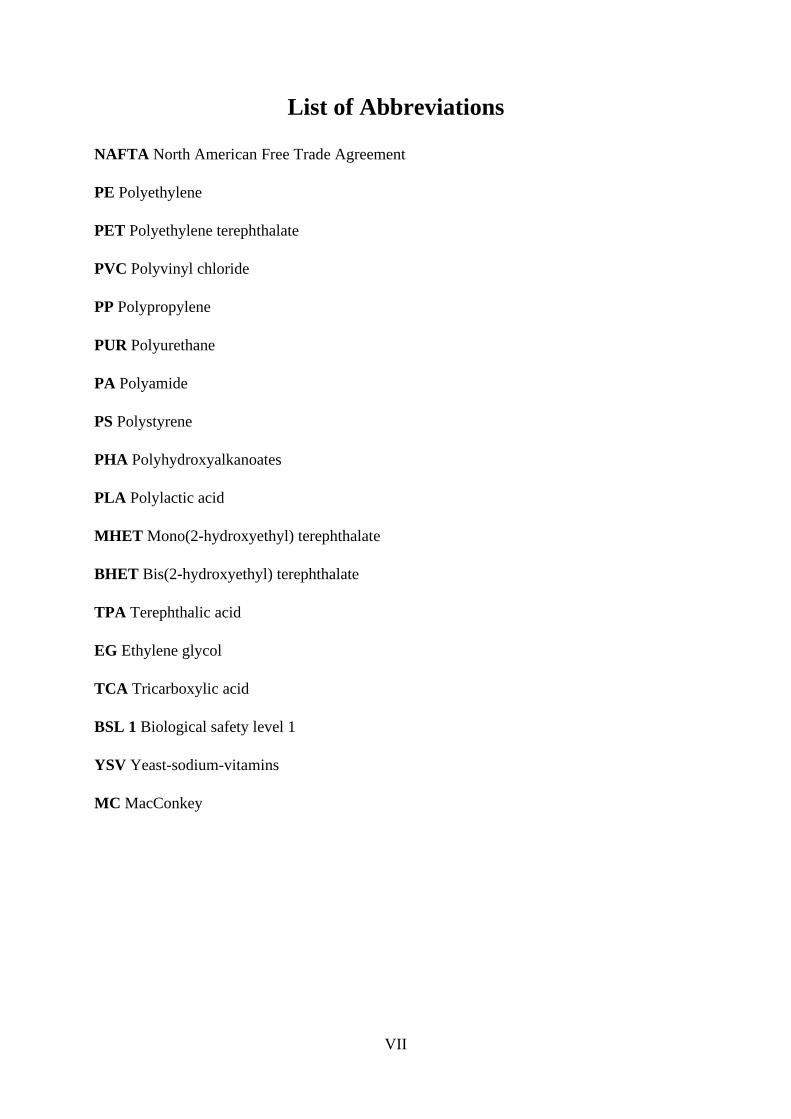
List of Abbreviations
NAFTA North American Free Trade Agreement
PE Polyethylene
PET Polyethylene terephthalate
PVC Polyvinyl chloride
PP Polypropylene
PUR Polyurethane
PA Polyamide
PS Polystyrene
PHA Polyhydroxyalkanoates
PLA Polylactic acid
MHET Mono(2-hydroxyethyl) terephthalate
BHET Bis(2-hydroxyethyl) terephthalate
TPA Terephthalic acid
EG Ethylene glycol
TCA Tricarboxylic acid
BSL 1 Biological safety level 1
YSV Yeast-sodium-vitamins
MC MacConkey
1 Introduction
1.1 Reliance on plastic
Modern society brings with itself a wide catalogue of conveniences as well as luxuries not
before experienced in human history. As more countries across the globe become more
industrialised, the necessity for plastic polymers rises. This does not only follow the
convenience aspect but improvement in sanitation, industry and all aspects of society. An
immediate association with plastic falls to the conveniences that surround us. Mainly these are
single use plastics, often linked to the food industry. Packaged foods and disposable cutlery
and beverage containers. However, plastic comes in the form of electronic devices heavily in
use today, toiletries, furniture, textiles, transportation devices and other miscellaneous objects.
Plastic permeates todays existence, partly due to being cheap to produce and the variety of
polymers mean that the use of it is widespread. The first synthetic polymer ever produced was
Bakelite in 1907 by Leo Baekeland(Powers, 1993). It was hailed in its time as a new and
exciting look into the future of humanity. It could be used to produce so many things, and
incorporate in already existing products to make them more resilient and more appealing.
After that initial discovery, it did not take long for other types of synthetic polymers to begin
widespread production. While it may be hailed a luxury, the way society has become reliant
on plastics, and unwilling to part with its many conveniences, an alternative would not
include removing plastic from all the aspects it is imbedded in. Finding more sustainable
counterparts, and the change of perception what the unmonitored use of it would mean for the
environment as a whole are more pertinent issues to address. With the raise in sanitation
standards and sterilisation technique in both food production as well as the health sector, these
pose large areas where single use plastic became almost an irreplaceable necessity. Nitrile and
rubber gloves which are single use and prevent any cross contamination, while generating a
large amount of waste. In the health sector, single use medical equipment brought with it
lowered infection rates, due to the ease of disposing of used equipment. However, this means
the medical system in conjunction with research laboratories produce an unprecedented
amounts of plastic waste, daily averaging 25% of all plastic waste produced in the
USA(Wagner, 2016).
- 2 -
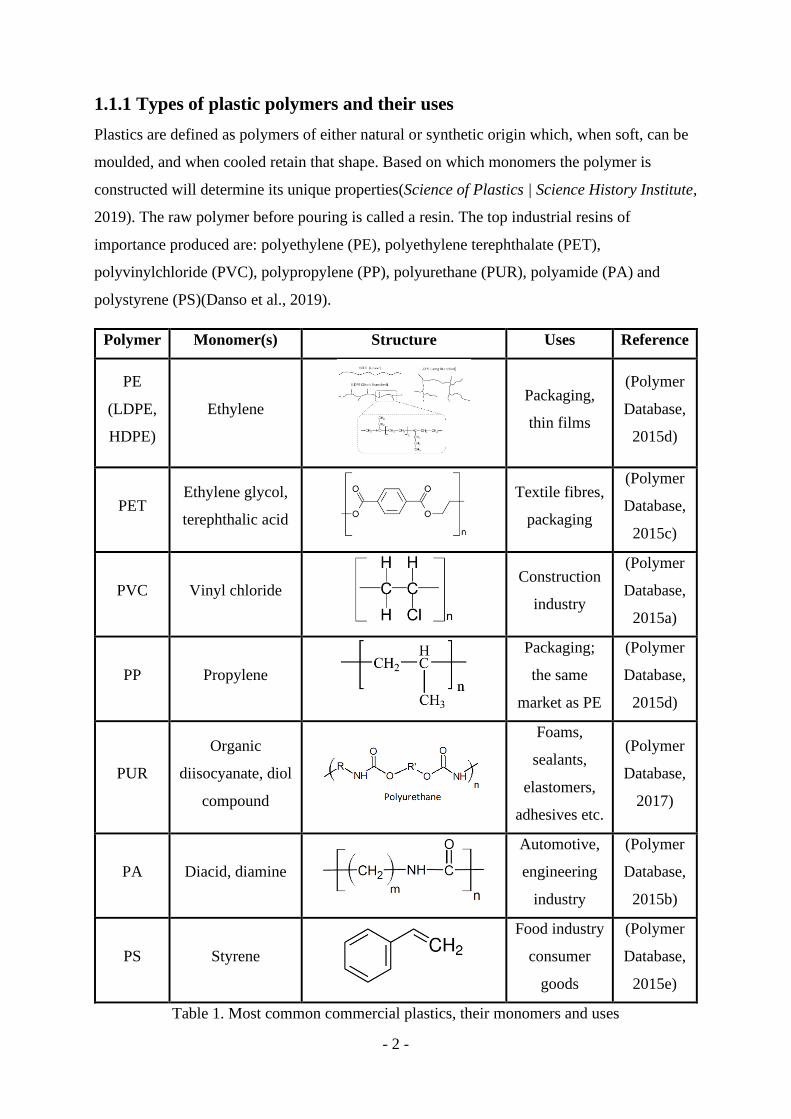
1.1.1 Types of plastic polymers and their uses
Plastics are defined as polymers of either natural or synthetic origin which, when soft, can be
moulded, and when cooled retain that shape. Based on which monomers the polymer is
constructed will determine its unique properties(Science of Plastics | Science History Institute,
2019). The raw polymer before pouring is called a resin. The top industrial resins of
importance produced are: polyethylene (PE), polyethylene terephthalate (PET),
polyvinylchloride (PVC), polypropylene (PP), polyurethane (PUR), polyamide (PA) and
polystyrene (PS)(Danso et al., 2019).
Polymer Monomer(s) Structure Uses Reference
PE
(LDPE,
HDPE)
Ethylene
Packaging,
thin films
(Polymer
Database,
2015d)
PET Ethylene glycol,
terephthalic acid
Textile fibres,
packaging
(Polymer
Database,
2015c)
PVC Vinyl chloride
Construction
industry
(Polymer
Database,
2015a)
PP Propylene
Packaging;
the same
market as PE
(Polymer
Database,
2015d)
PUR
Organic
diisocyanate, diol
compound
Foams,
sealants,
elastomers,
adhesives etc.
(Polymer
Database,
2017)
PA Diacid, diamine
Automotive,
engineering
industry
(Polymer
Database,
2015b)
PS Styrene
Food industry
consumer
goods
(Polymer
Database,
2015e)
Table 1. Most common commercial plastics, their monomers and uses
- 3 -
PE represents the most commonly used polymer on the market. Due to a large extent of the
market being taken by the packaging industry, and PE being the most versatile in terms of the
types of stable films able to be produced from it, it is highly valued. It most commonly is
produced in 3 formats: low-density polyethylene (LDPE), linear low-density polyethylene
(LLDPE) and high-density polyethylene (HDPE). They vary in their crystallinity, HDPE
being the more crystalline and the highest value PE. The higher crystallinity means it is more
durable and less likely to be affected by abiotic and biotic degradation(Polymer Database,
2015d).
PET is most commonly used in the production of bottles and the textile industries. Many
polyester labelled fibres are PET. It is a durable textile fibre with good moisture resistance
and low wear over time. It can be used in industry where it is reinforced with fiberglass,
graphite etc(Polymer Database, 2015c).
PVC comes in various forms. It is the third highest selling plastic in the world. It has poor
resistance to photo and thermal degradation. Therefore, additives are added to stabilise it. The
largest use of PVC is in the construction industry. PVC pipes, window parts, machine
extruded parts, and added to plasticisers to create plastisol which can then be moulded at
room temperature(Polymer Database, 2015a).
PP is the second most popular plastic polymer in industry use. It shares many similarities with
PE and its properties fall between those of LDPE and HDPE. It fulfils the gap for packaging
needed with the resistance and properties where PE cannot fulfil. It can withstand much
higher temperatures than PE and therefore is used to secure items that will experience more
thermal stress(Polymer Database, 2015d).
PUR is a polymer with a wide range of capabilities, based on which compounds are chosen to
create the backbone. Based on the combination of aromatic or aliphatic isocyanates; low
molecular weight or polymeric diols, the physical properties of the foams will be different.
Applications of PUR are for foams both industrial and household ones, adhesives, coatings,
sealants etc(Polymer Database, 2017).
PA are a group of polymers more readily used in the engineering industry. They are more
resistant to alkaline hydrolysis and have better resistance to organic solvents than PET. They
can withstand continuous use at below freezing temperatures and are heavily used in the
automotive industry. A popular PA, nylon, has been used in the textile industry for decades
- 4 -
before losing some market share to PET fibres as those are less wrinkle prone(Polymer
Database, 2015b).
PS is one of the largely used commodity plastics as it is cheap and easy to produce. The food
industry uses large amounts of PS for packaging, disposable cutlery, plastic cups etc. It is a
less readily recyclable plastic, and in its expendable polystyrene form, it takes up a lot of
space on landfills. It is in most cases produced as a single use plastic(Polymer Database,
2015e).
1.1.2 The cost of convenience
The various applications of plastic have led to a boom in production. As it is cheap and
versatile, the use of plastic is dominated globally. Due to the lack of marine conservation
research at the turn of the 21st century, there was a lack of data, how the waste produced from
the use of plastic would affect the worlds marine systems(Derraik, 2002). In 2006, the global
plastic production was 225 million Mt per year. Due to the global spread of factories and
different sorting and collection capabilities of plastic waste, the recovery of the waste
produced was varied(Barnes et al., 2009). The composition of waste generated globally is
around 10% in favour of plastic, while the marine litter and waste washing up on the beaches
is a disproportionate 50-80% of plastic(Derraik, 2002). This is prescribed to several factors.
The plastic produced for packaging is light-weight, and readily carried by the wind if not
properly secured. The lightweight nature of it also ensures it is buoyant and readily distributes
in water systems(Barnes et al., 2009).
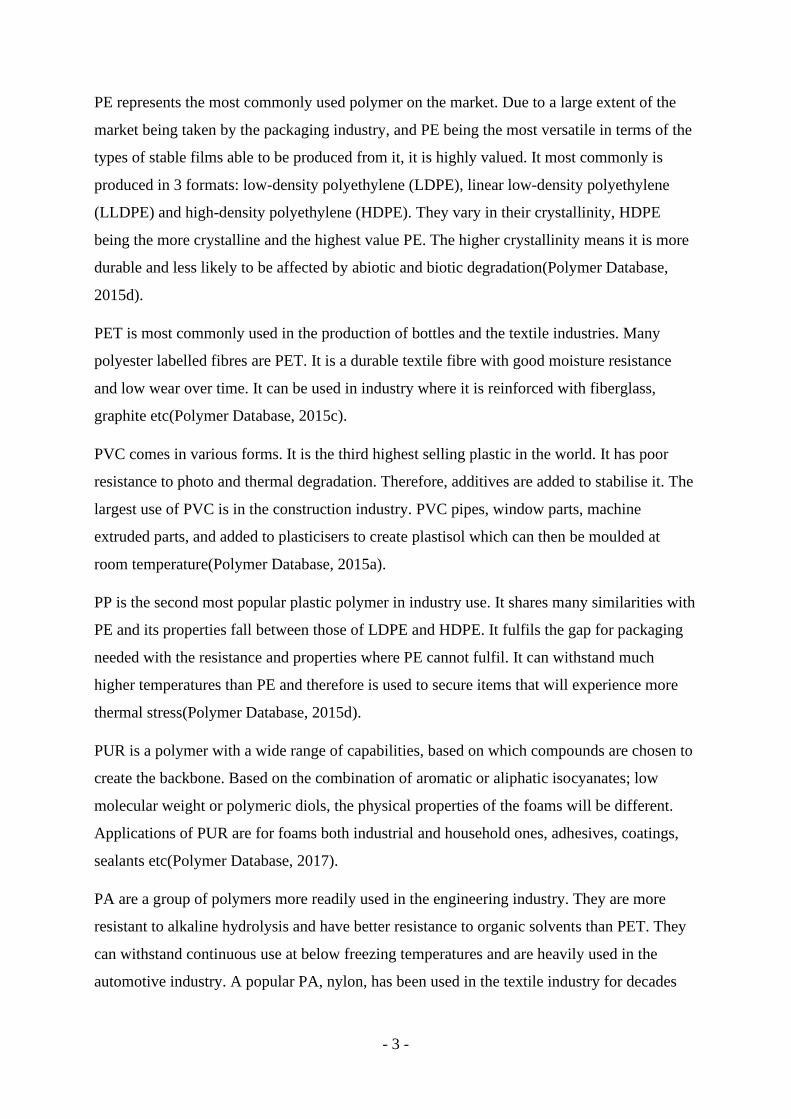
Figure 1. Top marine litter on European beaches, 2016(Editorial team, 2018)
- 5 -
This figure showcases the distribution of various litter on European beaches, 31.64% being
broadly plastic items(Editorial team, 2018). In 2012, the global resin production had risen to
288 million Mt per year, an increase of 620% from 1975. The largest sector to experience this
was packaging. The use and production of plastic keep increasing each year. The resulting
waste from this is proving to a large challenge. Mismanaged waste that occurs within 50km of
the coastline is the biggest problem. The highest concentration of global human population
lives in this area. 16 of the top 20 mismanaged waste producing countries are middle income
countries, which were rapidly industrialised, but with a slowly developing waste management
infrastructure(Jambeck et al., 2015). Global consumption puts the NAFTA area at
139kg/person, Western Europe 136kg/person and Asia(excluding Japan) 36kg/person(& A. C.
Horodytska, 2019). Consumption includes domestically produced as well as foreign imported
objects(Suranovic, 2005). This is important to highlight as the top global importer of PVC,
PP, PE, PA and PP resins are India and China. China holds 50% of the worlds PET resin
market. And while they produce the largest amounts, they also have the highest consumption.
The prediction models for helping lowering the mismanaged waste in the countries that have
the biggest problems are not accurate as there are too many variables that cannot be predicted
as economic states, political decisions and cultural circumstances(Jambeck et al., 2015).
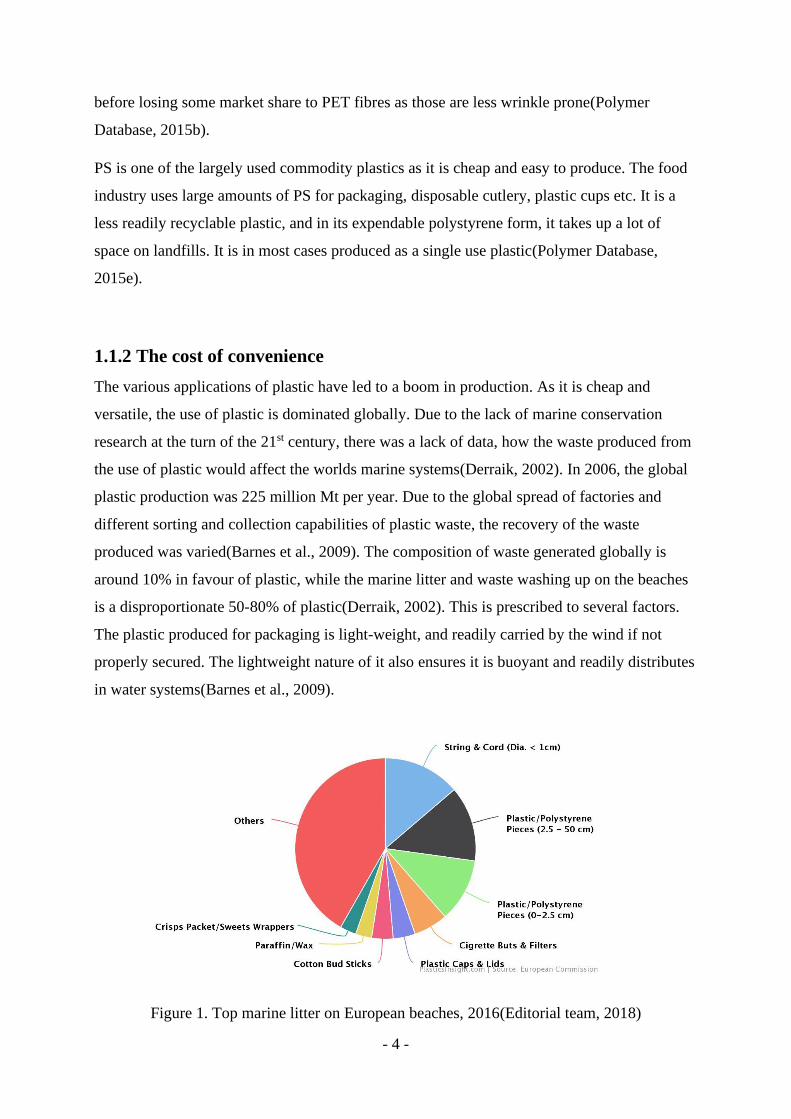
Figure 2. Path of mismanaged waste into the ocean(Ritchie & Roser, 2020).
- 6 -
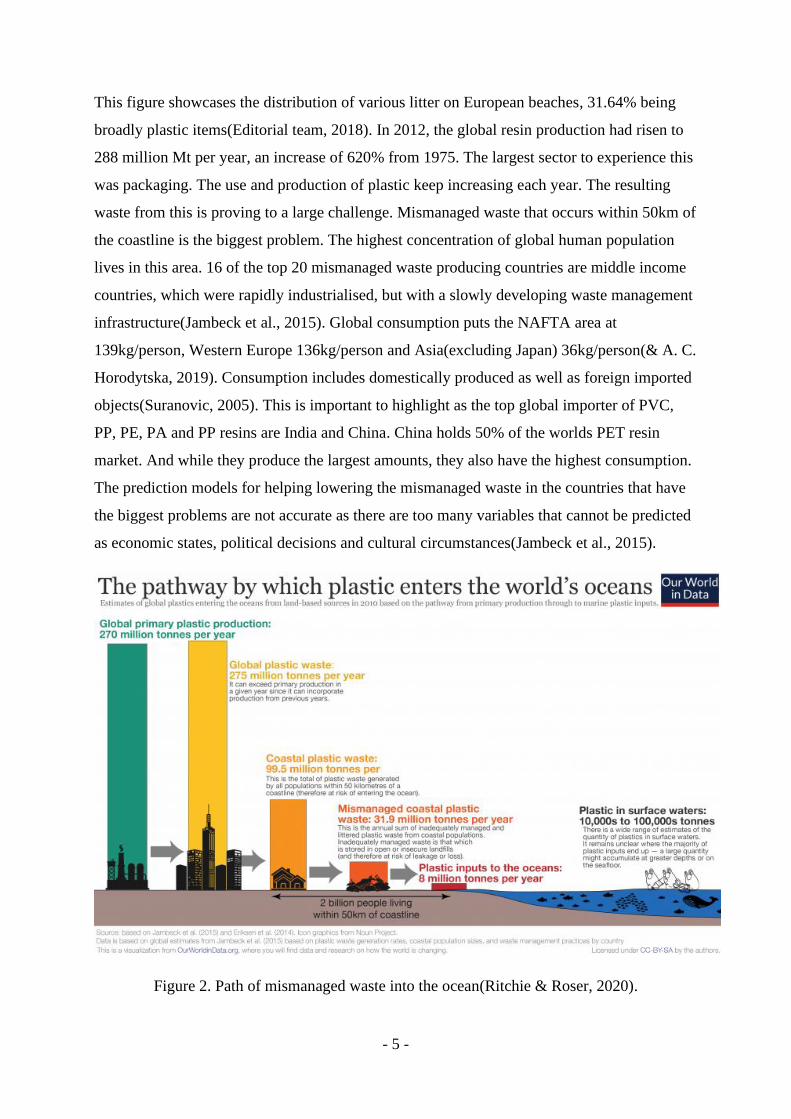
The mismanaged waste leeching into the water systems and settling in plastic islands floating
in the open oceans is broadly categorised in macro(>25mm) and microplastics. Macroplastic
is more regularly included in cleaning efforts as it is easily spotted and retrieved. It also poses
a larger danger for sea life as seabirds, cetaceans and fish ingest them whole. Microplastics
are primary and secondary. Primary microplastic are ones that were already produced in a
microscopic size. Scrubbers in cosmetics, some drug vectors and industrial air-blasting media.
And while modern water treatment removes 99% of these, the amount left in the effluent is
still significant due to the large amount present in the original stream. Secondary microplastic
is formed as abiotic and biotic factors fragment larger waste(W. C. Li et al., 2016).
Figure 3. Potential pathways of plastic in the environment(W. C. Li et al., 2016)
1.1.3 Modern waste treatment
As plastic production continues increasing, by 2050 it is predicted the accumulated waste
globally will reach 33 billion tons(Joo et al., 2018). Looking at PE degradation rates in a
landfill, it was calculated at about 0.5% of its mass per year. PE is the highest utilised plastic
- 7 -
in the world, and globally it is faced with a similar fate of ending up in a landfill(Palanisamy
et al., 2011).
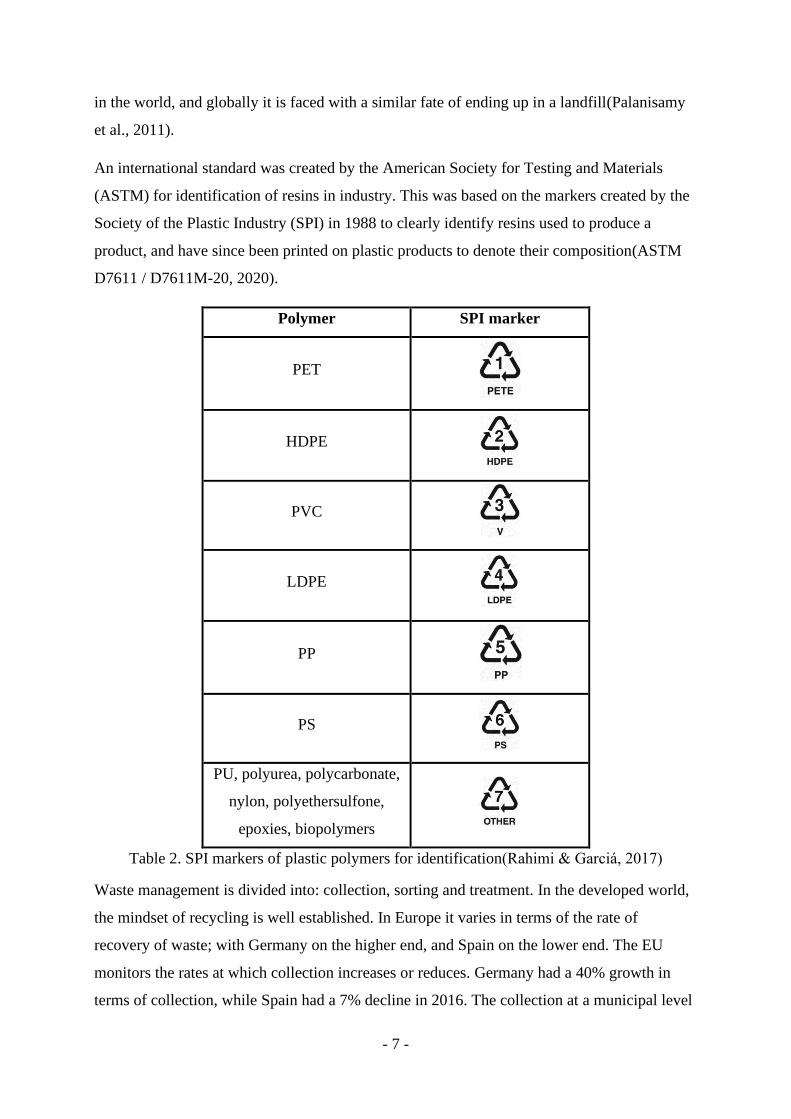
An international standard was created by the American Society for Testing and Materials
(ASTM) for identification of resins in industry. This was based on the markers created by the
Society of the Plastic Industry (SPI) in 1988 to clearly identify resins used to produce a
product, and have since been printed on plastic products to denote their composition(ASTM
D7611 / D7611M-20, 2020).
Polymer SPI marker
PET
HDPE
PVC
LDPE
PP
PS
PU, polyurea, polycarbonate,
nylon, polyethersulfone,
epoxies, biopolymers
Table 2. SPI markers of plastic polymers for identification(Rahimi & Garciá, 2017)
Waste management is divided into: collection, sorting and treatment. In the developed world,
the mindset of recycling is well established. In Europe it varies in terms of the rate of
recovery of waste; with Germany on the higher end, and Spain on the lower end. The EU
monitors the rates at which collection increases or reduces. Germany had a 40% growth in
terms of collection, while Spain had a 7% decline in 2016. The collection at a municipal level
- 8 -
involves sorting general waste in each household, the availability of different waste bins for
disposing of household waste, buy-back schemes for plastic bottles, and drop-off sites for
larger waste and waste that cannot be sorted in the common categories. Sorting is done at
material recovery facilities. The technologies used at these sites are: bag splitters, ballistic
separators, air separators and optical detection systems. Once there and sorted, based on the
type plastic, different recycling processes are applied. Thermoplastics such as polyesters are
ground or pulverised to then be extruded into pellets which can be reused. Others are
combusted. There are two methods of classifying the recycled plastic: the open and closed
loop. The closed loop method implies scrap from production is re-extruded and reused,
creating a higher-grade recycled product. In an open loop, the plastic had been used by a
consumer and has accumulated impurities, either intentionally or unintentionally introduced.
This plastic needs to be washed, filtered, or degassed first. The quality of this plastic
decreases with each processing step, and it cannot be recycled ad infinitum. Usually this
recycled plastic is later used for trash bags, pipes etc. As for PET, which is recycled at the
highest rate, as it is inert and recycles very well, similar products to its starting point may be
produced from it. Flexible plastics and mono-, and multi-layered plastic are more difficult to
recycle as the machinery is more optimised for hard plastic. Films are also quite often coupled
with aluminium and inks, and flexible plastics with inks and adhesives which require more
processing to prepare for pulverising it(O. Horodytska et al., 2019).
Based on the collection strategy of a given country, the sorting and processing process will be
more or less complex. If there are schemes for separate collections of drinking bottles, away
from other plastic waste, the processing will be more straightforward for the drinking bottle
waste. As it is known that the plastic in this waste is predominantly PET and PP, which are
recognised by IR sensors and sorted. For mixed waste, the detection of which plastic is
present is more complicated. If there is an automated system with an IR sensor, it may be
limited to reading the type of plastic that will be turned towards it at that moment and
disregard other plastic present in the waste. If the factory has human sorters, it can be more
precise however, it is more costly and time consuming. There is a distinct difference in
mechanical recycling, between what can be modelled and what is practically possible.
Multiple sensor systems exist for sorting through the different polymers: tribo-electric
separation, froth floatation, magnetic density separation, x-ray detection. These all require
different pre-treatment, and specialise for a specific polymer set, therefore might not be cost
effective to implement. One of the biggest challenges of mechanical recycling, is the
- 9 -
degradation of the plastic, both by abiotic factors such as UV, moisture, general mechanical
damage, and heat. All of these factors add to the disruption of the crystalline structure of the
polymers, decreasing their molecular weight. In the case of a mixed polymer waste, the
thermal processing is done at the temperature needed to process the most resistant polymer,
and as such, the others undergo higher thermal stress. PET recycling is the most common
“cover-all” recycling strategy, and particularly in Europe, 57% of PET was recycled in 2014.
This is due to comprehensive EU directives urging the collection and compensation for PET
bottles. The PET is heated between glass-transition and melting temperature in a process
called solid-state post-condensation. The mass is then reinforced with additives that are chain
extenders, and extruded for industrial use. The loop of product-waste-product requires a
design approach from the raw material constructed polymer, and then a new product made
with recycled material. This means optimising the starting product and recognising how the
changed recycled material may be utilised afterwards, as discussed before, not all recycled
material may be reused in the same capacity the virgin material was used for(Ragaert et al.,
2017).
There is another recycling strategy which is chemical recycling. Chemical recycling is
considered a tertiary method, with the closed and open loops with mechanical recycling being
the primary and secondary respectively. Chemical recycling aims to recover the monomers
that make up the polymer through processes such as pyrolysis. They are not considered as
scalable to industry as they require significant power outputs. PET and HDPE are the
polymers that are most frequently recycled, as others require sophisticated depolymerisation
technique. PET can be depolymerised via pyrolysis or chemolysis which can include acid
catalysts or not. The backbone is transesterified using ethylene glycol, methanol, water or
hydroxide. These processes require high temperature and pressure, and are often less efficient
if there is a presence of colourants in the feed. A future for chemical recycling would include
discovering catalytic reactions that do not require high temperatures and pressure to be
effective and applicable on an industrial scale(Rahimi & Garciá, 2017).
As previously discussed, the lack of municipal waste management infrastructure heavily
contributes to mismanaged waste in developing countries. It is more common for individual
members of society to organise efforts for collecting and sorting plastic waste by hand. PE
and PET is mechanically recycled using similar technology as the one in Europe as overseers
of these sorting operations are buying the technology for their use. Latin America is upping
the municipal engagement in waste management. Historically, more than half of plastic waste
- 10 -
that was meant for recycling was exported primarily to China. Since 1992, China has taken
cumulatively over 45% of global plastic waste produced. It is estimated that 111 million Mt of
plastic waste will be misplaced as a result of China instating an import ban on non-industrial
plastic waste in 2017. During a review, it became apparent that higher-income countries were
exporting up to 70% of plastic waste in 2016 to lower-income countries in East Asia and the
Pacific. The problem of mismanaged waste may not be the sole problem of lack of local
collection strategies, but a global “change of hands” and who holds the plastic waste at the
end of the chain(Brooks et al., 2018). Still however, China, with 260 million tons of
uncollected plastic waste contributes to 84% of global plastic pollution. This comes from both
poor enforcement of waste management strategies as well as China holding a large proportion
of the global population. The government has made efforts in bringing new waste
management laws however, there is a big discrepancy between the collection rate in urban and
rural areas. For urban areas it is 65% of plastic waste collected through official means, while
in rural areas it is 5%. In rural areas the plastic waste it put in wild landfills with no
supervision or burned in uncontrolled local fire pits. Pyrolysis and combusting waste are
something done in the developed world; however, these uncontrolled and unsupervised open
fires pose both a threat for the public health of the people in the surroundings as well as far
reaching pollution concerns. The low rates of recycling and the burning of waste are both an
indicator of the current economic model where plastic is produced from finite fossil fuel
- 11 -
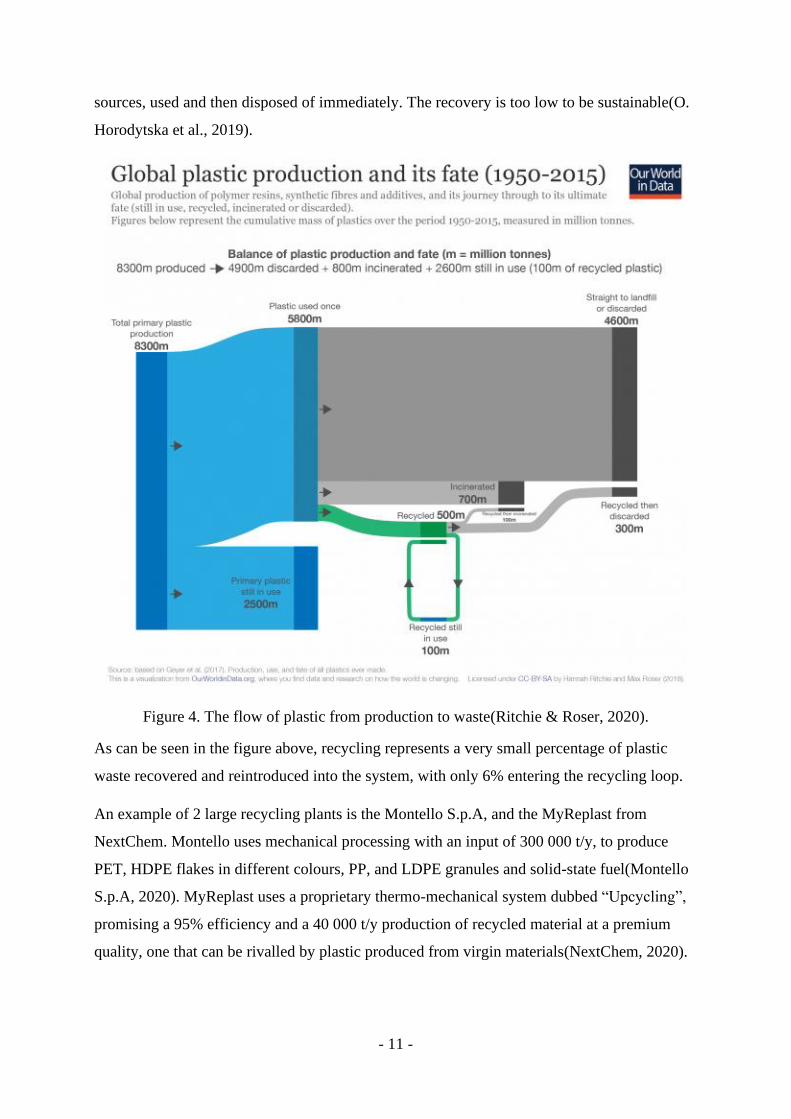
sources, used and then disposed of immediately. The recovery is too low to be sustainable(O.
Horodytska et al., 2019).
Figure 4. The flow of plastic from production to waste(Ritchie & Roser, 2020).
As can be seen in the figure above, recycling represents a very small percentage of plastic
waste recovered and reintroduced into the system, with only 6% entering the recycling loop.
An example of 2 large recycling plants is the Montello S.p.A, and the MyReplast from
NextChem. Montello uses mechanical processing with an input of 300 000 t/y, to produce
PET, HDPE flakes in different colours, PP, and LDPE granules and solid-state fuel(Montello
S.p.A, 2020). MyReplast uses a proprietary thermo-mechanical system dubbed “Upcycling”,
promising a 95% efficiency and a 40 000 t/y production of recycled material at a premium
quality, one that can be rivalled by plastic produced from virgin materials(NextChem, 2020).
- 12 -
1.2 Alternative management strategies
An alternative not only for the recycling system but the overall consumer mindset is necessary
as well. The linear path of producing, using and then immediately disposing of the plastic is
combining well with the widespread mismanaged waste ongoing globally, to produce a global
plastic waste crisis. Therefore, an alternative in the economic structure is also an area of
import for solving this problem. The new economic model would be of a circular economy,
where the used products would be recovered and reintroduced back into the circulation.
Recycling is trying to do this very thing, but the rates are too low for the current plastic use to
be considered circular. In 2018, the EU adopted a plan for circular economy and plastics were
recognised as a priority. A focus on recycling, sustainability and consumer and producer
responsibility were identified as key components for the plan to come to fruition(EU
(European Union), 2018). However, the EU directive from 2019 considers the responsibility
of the producer is more important than the behaviour of the consumer. While the municipal
waste management laws are made stricter, the directives made for industry highlight the
importance of increasing the proportion of recycled plastic that products need to have.
Elimination of unnecessary packaging as well as lowering the amount of fossil-based raw
material and instead using more biobased options. This highlighted that the consumer does
not bear sole responsibility for the pollution, but industry bears the brunt of the damage, and if
guidelines are not followed, they will be appropriately sanctioned. The EU has given clear
goals for 2025 and 2030 on how much recycled plastic needs to be included in the materials
produced. This equals 25% and 30% respectively for PET bottles produced in that time
period, as well as ensuring producers of the materials listed in the directive will bear the cost
of collecting, transporting and raising awareness as well as data collection as it pertains to
their products(EU (European Union), 2019).
A new system of a circular economy would include developing a new plastic economy, where
all levels from sourcing, production, collection and recovery of materials would need to be
redesigned. As the use of plastic is so prevalent globally, each country respectively would see
economic gain due to elimination of import of virgin materials or already made plastics for
their use. As discussed before the supply and production chains have become centralised to a
single region of Eastern Asia, and present a potential problem in case of global emergencies.
Denmark sees itself as a potential leader in this new circular economy system. A proposed 5
step system to: recycle all plastic waste, minimise or phase out plastic that cannot be recycled,
alternatives for plastic currently in use, reduce use of plastic that goes directly into the waste
- 13 -
stream and help create policies that can be implemented in the EU and globally as the plastic
problem is a global problem. The primary goals would focus on research and development of
both recycling and recovery strategies(Høngaard Andersen et al., 2019).
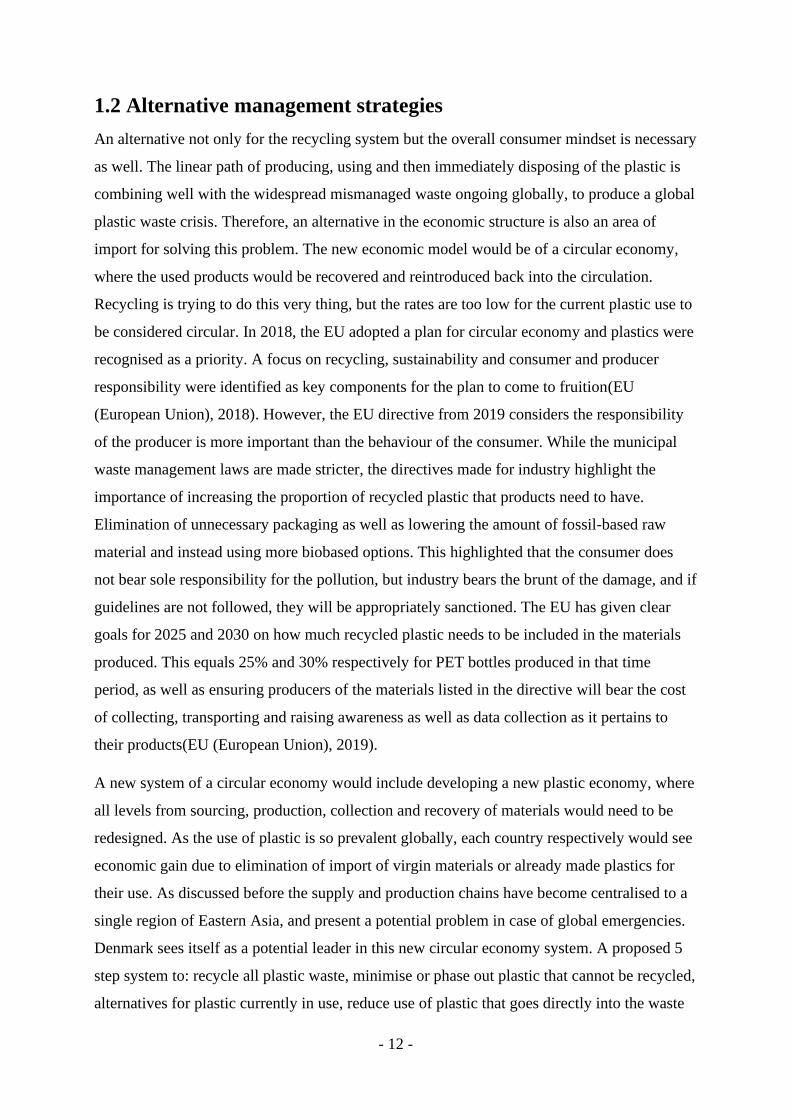
Another alternative is in terms of the plastic production itself. Constructing new polymers that
are biodegradable, use no or less fossil fuels for production but perform the same way as
conventionally used plastic.
Polymer Monomer(s) Structure Uses
PHA Hydroxy
fatty acids
Packaging,
paints, single
use medical
devices
PLA Lactic acid
Packaging,
coating
Starch/polyester
Starch;
dicarboxylic
acid; diol
Fibres
Starch/PE Starch;
ethylene
Highly
biodegradable
Starch/PVA Starch; vinyl
alcohol
Packaging,
agriculture
Table 3. Biobased plastic alternatives(Ahmed et al., 2018)
However, biobased plastics are not necessarily biodegradable. The addition of starch to
existing fossil based polymers makes the final product more readily biodegradable(Ahmed et
al., 2018).
- 14 -
1.2.1 Biodegradation
Biodegradation as a waste treatment strategy has become more popular in the last decade as
more knowledge is gained about the systems required for the degradation of various
polymers. However, the wide array of polymers available and disposed of, in addition to the
various additives to the plastic which make it resistant to microbial attacks, have made it so a
very specific set of enzymes are needed to be able to attack its structure. It has only been 6
decades since the global spread of mismanaged waste leaking into the environment, giving a
short time span in which, these enzymes could have evolved. Even in this short time span,
with the presence of microplastics which are already partially degraded due to UV
degradation, becoming more available to these enzymatic systems, and several species, both
fungal and bacterial, have been identified to be able to degrade a wide array of plastic
polymers. There enzymes work on a very simple principle of degrading the polymer into
mono- or dimers which are then uptaken by the cell and metabolised. However, due to the
resistant nature of these polymers: hydrophobicity, strong C-C bonds, high molecular weight,
- 15 -
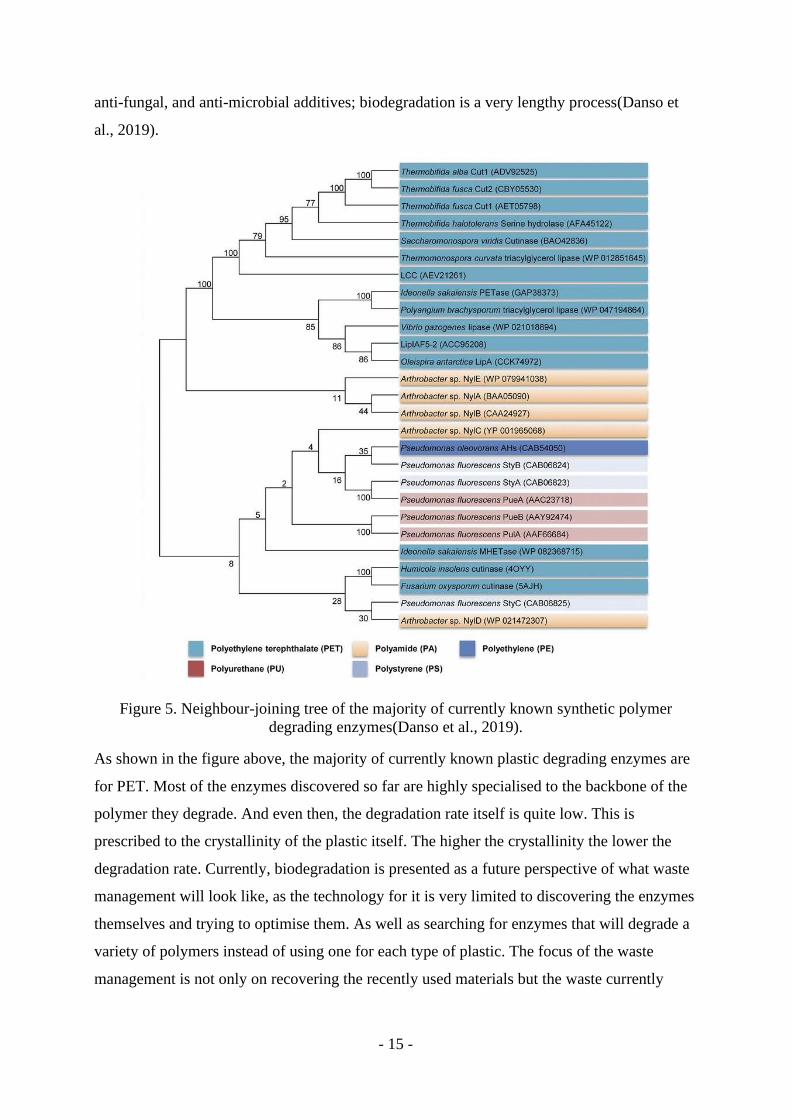
anti-fungal, and anti-microbial additives; biodegradation is a very lengthy process(Danso et
al., 2019).
Figure 5. Neighbour-joining tree of the majority of currently known synthetic polymer
degrading enzymes(Danso et al., 2019).
As shown in the figure above, the majority of currently known plastic degrading enzymes are
for PET. Most of the enzymes discovered so far are highly specialised to the backbone of the
polymer they degrade. And even then, the degradation rate itself is quite low. This is
prescribed to the crystallinity of the plastic itself. The higher the crystallinity the lower the
degradation rate. Currently, biodegradation is presented as a future perspective of what waste
management will look like, as the technology for it is very limited to discovering the enzymes
themselves and trying to optimise them. As well as searching for enzymes that will degrade a
variety of polymers instead of using one for each type of plastic. The focus of the waste
management is not only on recovering the recently used materials but the waste currently
- 16 -
polluting the oceans and rivers. And these are all mixed sources of plastic which over time
have degraded into microplastics and would be not cost or time effective to separate.
1.2.2 Commonly used strains
As can be seen in Figure 5. there are many bacterial and fungal strains already identified as
having synthetic polymer degrading enzymes. The most prominent are cutinases from
Thermobifida fusca and Fusarium solani(Eberl et al., 2009). F. solani has previously shown
the ability to hydrolise PET into its monomers using the cutinase(FsC)(Silva et al., 2005).
And in the same year, a cutinase(TfH) was discovered in T. fusca(Müller et al., 2005). Both
TfH and FsC are opportunistic in terms of attacking the amorphous segments of PET, and not
the highly crystalline area. Addition of plasticisers seems to add to the degradation ability of
these enzymes, as they reduce glass-transition temperature and contribute to greater chain
mobility(Eberl et al., 2009). TfCut2 is thermo stable, and able to operate at 65ºC, which is
near the PET glass-transition point, making it more available for degradation(Wei et al.,
2016). FsC has show degradation of PUR and polycaprolactone, even seen as the dominant
species residing on PUR surface(Pathak & Navneet, 2017). The cutinase from Humicola
insolens (HiC) which has also shown to be able to degrade low crystallinity PET, and a
recovery of 97% pure terephthalic acid was observed(Quartinello et al., 2017). HiC also
operates at 65ºC, and has shown greater degradation of powder that has smaller particle
size(Simone Weinberger et al., 2017). Leaf and branch compost cutinase (LCC) has shown
particularly high PET hydrolysis activity, and consistently shows higher performance than the
previously mentioned enzymes in terms of PET degradation. The native organism is not
known but it shares 46% identity with TfC in Thermobifida cellulosilytica. It reportedly
maintains 85% of function at 75ºC for 60 minutes. Due to its ability to reach temperatures
where PET is at glass-transition makes it highly efficient for hydrolysis. It is able to reach
~95% weight loss of a 1cm2 sheet of low crystallinity PET(Shirke et al., 2018). It seems that
across research, the high work temperature of enzymes, that contributes to increasing the
mobile amorphous fraction of PET, and therefore increasing the hydrolysis susceptibility is
one of the most important factors in PET degradation. However, the aging process of PET
caused by high temperatures creates micro-structures which show resistance to enzymatic
degradation. A mitigation strategy for this would include a catalyst added to the reaction
which would facilitate degradation before the formation of inaccessible components(Wei et
al., 2019)
- 17 -
1.3 Ideonella sakaiensis
I. sakaiensis is a gram-negative, aerobe; discovered in 2016, while screening for PET
degrading organisms. It was isolated as a bacterium that solely was thriving on the
degradation on PET films.
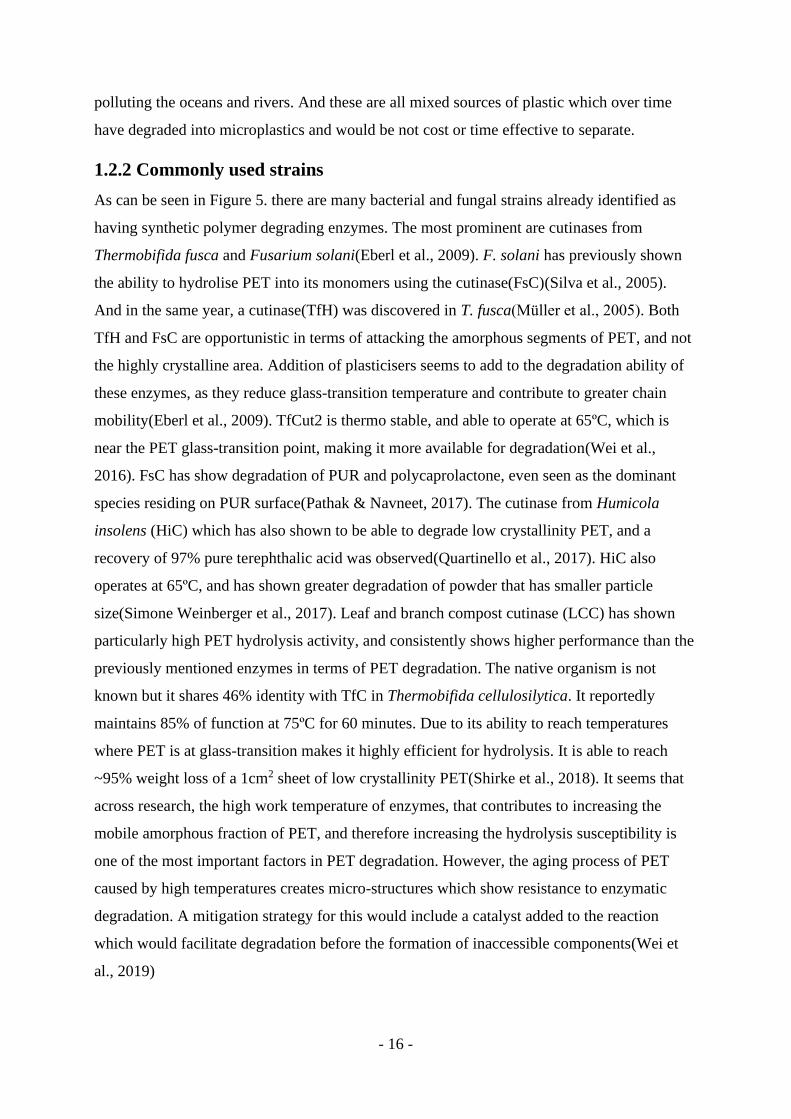
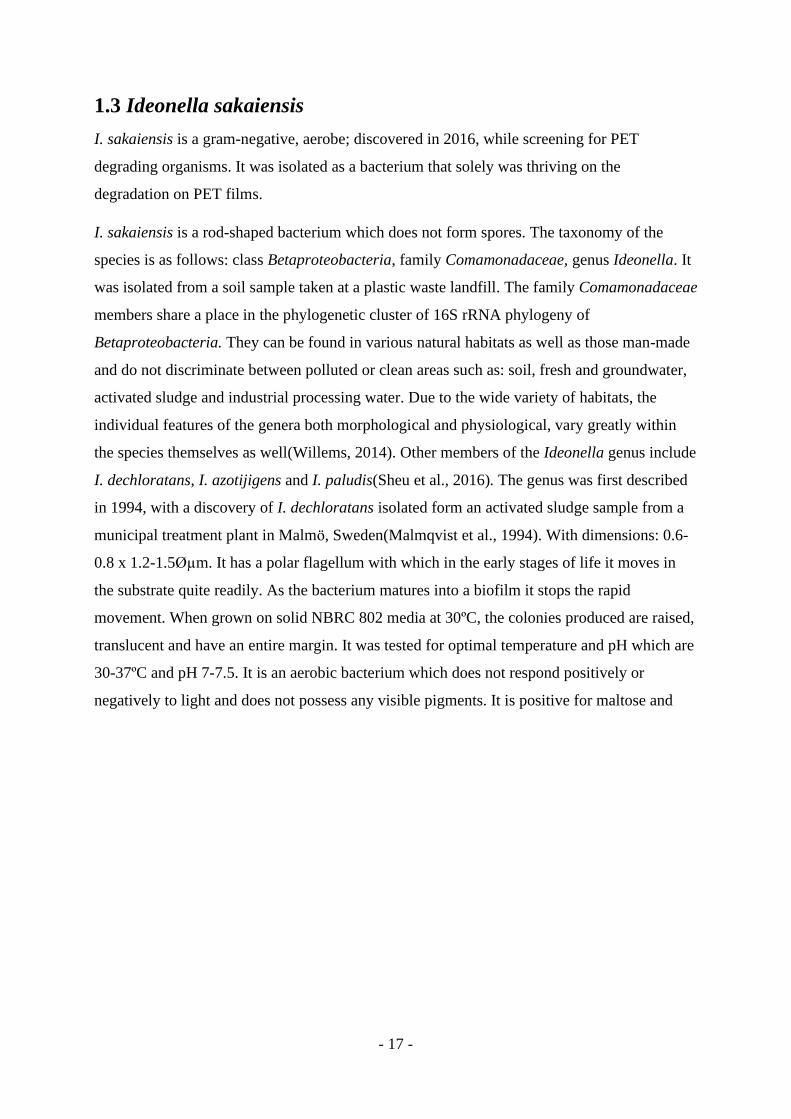
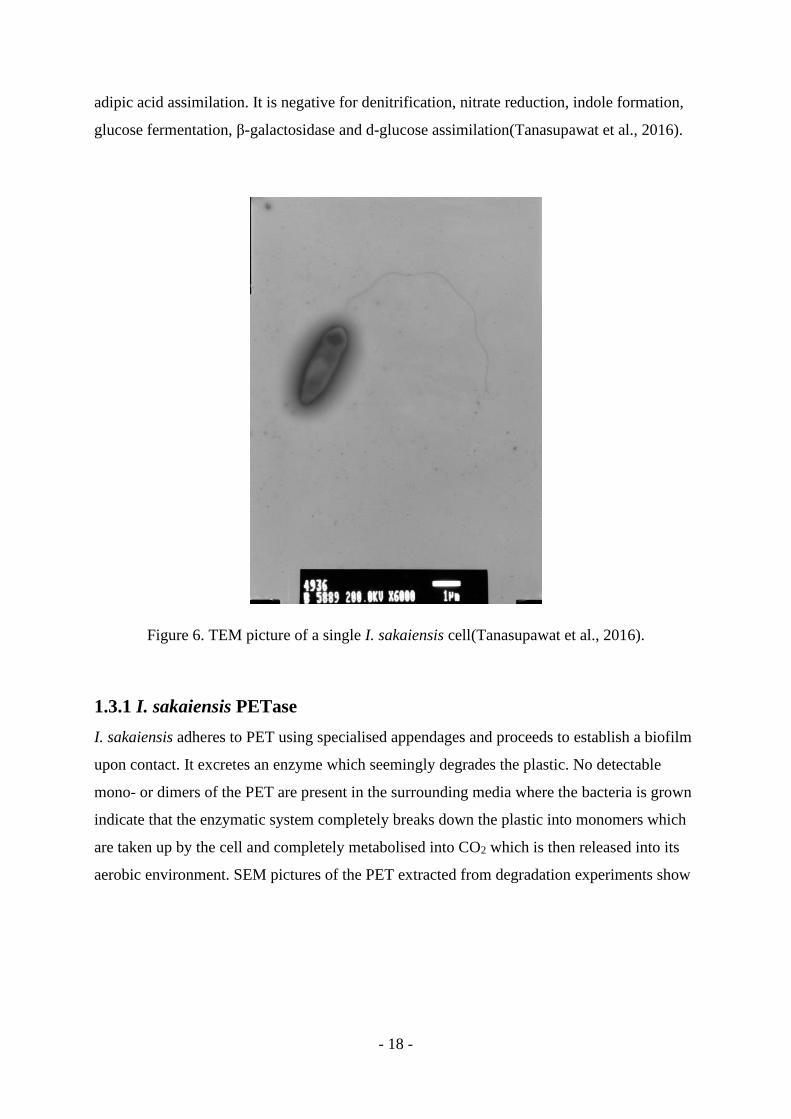
I. sakaiensis is a rod-shaped bacterium which does not form spores. The taxonomy of the
species is as follows: class Betaproteobacteria, family Comamonadaceae, genus Ideonella. It
was isolated from a soil sample taken at a plastic waste landfill. The family Comamonadaceae
members share a place in the phylogenetic cluster of 16S rRNA phylogeny of
Betaproteobacteria. They can be found in various natural habitats as well as those man-made
and do not discriminate between polluted or clean areas such as: soil, fresh and groundwater,
activated sludge and industrial processing water. Due to the wide variety of habitats, the
individual features of the genera both morphological and physiological, vary greatly within
the species themselves as well(Willems, 2014). Other members of the Ideonella genus include
I. dechloratans, I. azotijigens and I. paludis(Sheu et al., 2016). The genus was first described
in 1994, with a discovery of I. dechloratans isolated form an activated sludge sample from a
municipal treatment plant in Malmö, Sweden(Malmqvist et al., 1994). With dimensions: 0.6-
0.8 x 1.2-1.5صm. It has a polar flagellum with which in the early stages of life it moves in
the substrate quite readily. As the bacterium matures into a biofilm it stops the rapid
movement. When grown on solid NBRC 802 media at 30ºC, the colonies produced are raised,
translucent and have an entire margin. It was tested for optimal temperature and pH which are
30-37ºC and pH 7-7.5. It is an aerobic bacterium which does not respond positively or
negatively to light and does not possess any visible pigments. It is positive for maltose and
- 18 -
adipic acid assimilation. It is negative for denitrification, nitrate reduction, indole formation,
glucose fermentation, β-galactosidase and d-glucose assimilation(Tanasupawat et al., 2016).
Figure 6. TEM picture of a single I. sakaiensis cell(Tanasupawat et al., 2016).
1.3.1 I. sakaiensis PETase
I. sakaiensis adheres to PET using specialised appendages and proceeds to establish a biofilm
upon contact. It excretes an enzyme which seemingly degrades the plastic. No detectable
mono- or dimers of the PET are present in the surrounding media where the bacteria is grown
indicate that the enzymatic system completely breaks down the plastic into monomers which
are taken up by the cell and completely metabolised into CO2 which is then released into its
aerobic environment. SEM pictures of the PET extracted from degradation experiments show
- 19 -
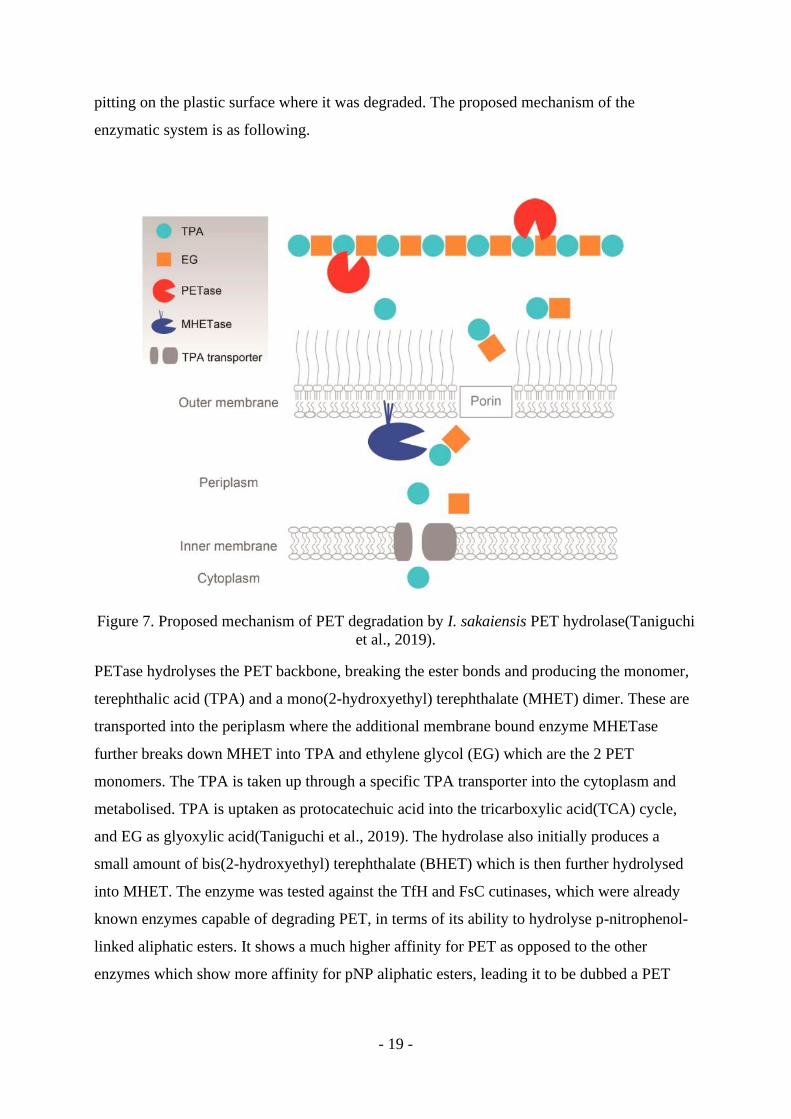
pitting on the plastic surface where it was degraded. The proposed mechanism of the
enzymatic system is as following.
Figure 7. Proposed mechanism of PET degradation by I. sakaiensis PET hydrolase(Taniguchi
et al., 2019).
PETase hydrolyses the PET backbone, breaking the ester bonds and producing the monomer,
terephthalic acid (TPA) and a mono(2-hydroxyethyl) terephthalate (MHET) dimer. These are
transported into the periplasm where the additional membrane bound enzyme MHETase
further breaks down MHET into TPA and ethylene glycol (EG) which are the 2 PET
monomers. The TPA is taken up through a specific TPA transporter into the cytoplasm and
metabolised. TPA is uptaken as protocatechuic acid into the tricarboxylic acid(TCA) cycle,
and EG as glyoxylic acid(Taniguchi et al., 2019). The hydrolase also initially produces a
small amount of bis(2-hydroxyethyl) terephthalate (BHET) which is then further hydrolysed
into MHET. The enzyme was tested against the TfH and FsC cutinases, which were already
known enzymes capable of degrading PET, in terms of its ability to hydrolyse p-nitrophenol-
linked aliphatic esters. It shows a much higher affinity for PET as opposed to the other
enzymes which show more affinity for pNP aliphatic esters, leading it to be dubbed a PET
- 20 -
hydrolase. In this way it presents a better option for PET degradation as it shows a better
affinity(Yoshida et al., 2016a).
In the scope of PET degradation by I. sakakiensis, the importance of MHETase cannot be
lessened. Systems that use the whole organism must take into account PETase and MHETase
as subsequent enzymes that work together to depolymerise PET to its monomers TPA and
EG. The interaction between the two opens avenues of research into creating new bioplastic
that will be more susceptible to these enzymatic systems, and produce materials that can be
put into a recycling system that will be highly efficient(Palm et al., 2019).
Studies of the structure of the protein have shown that it is not completely optimised for
degradation of crystalline PET. It has shown to be effective at degradation of polyethylene-
2,5-furandicarboxylate (PEF) which has emerged to the market as an attractive PET
substitution. This further opens venues for protein engineering of PETase as it pertains to its
structure and activity of the active site(Austin et al., 2018). However, PETase is heat-labile
and the direction of research currently is into changing the structure of the enzyme to make it
thermo-stabile at higher temperatures. The current working temperature is between 30-
37ºC(Taniguchi et al., 2019).
Newly published research compared the efficiency of the afore mentioned commonly used
cutinases TfF, LCC and IsPETase. LCC proved to have the highest degradation efficiency
with being reportedly 33 times more efficient. It was selected as the enzyme for modification.
Improving thermal stability was one of the main factors investigated. The resulting mutant
ICCG was optimised to have a 90% conversion depolymerisation after 10 hours of post-
consumer coloured PET. It was also show that micronisation of the samples and making the
surface area greater, contributed to the higher degradation rate. Resulting monomers could be
recovered at a 99.8% purity making them suitable for use of producing virgin PET. This
presents a closed loop in a circular economy system(Tournier et al., 2020).
Carbios, the company behind the ground-breaking research, is partnered with industry leaders
in PET bottle manufacturing and usage: Nestlé Waters, PepsiCo and Suntory Beverage &
Food Europe. With the new proprietary enzyme, and a deal with Novozymes A/S for enzyme
production, it is scheduled to open a large-scale industrial recycling plant by
2024/2025(Carbios, 2019).
- 21 -
1.4 Biochemical characterisation
The foundation of biochemical characterisation is establishing how a species behaves
similarly or dissimilarly to another one in terms of its metabolism. As methods for
identification skew more towards 16S rRNA molecular biology techniques, the biochemical
aspect becomes more of a feature for looking into how similar species evolved towards or
away from each other in terms of their unique features. At this point in time, with numerous
species discovered, based on their initial molecular identification, certain biochemical tests
are singled out to be performed as they are relevant. An enteric bacterium is more likely to be
tested for gelatine hydrolysis than a staphylococcus. It is a matter of previously acquired
knowledge, as to which tests will be performed in addition to any tests of interest based on
where the bacteria were isolated(Cowan et al., 2004). As was the case with I. sakaiensis
where a PET hydrolysis test was of importance for it.
Commercial kits are available were specific biochemical tests were selected as being relevant
to determining the specific species or generally determining certain metabolic features. These
range from testing the assimilation of certain carbon sources, presence of certain enzymes,
proteins and amino acids etc. These tests give very simple: positive, negative, or weakly
positive or negative results. They are not only for identification of novel bacteria but also
quick tests in hospital or industry settings to see if an organism of interest is present. In a
hospital setting these are used to quickly give a direction as to sterilisation and treatment
needed to be performed. And specialised tests for common bacteria that cause infection or are
contaminating production lines in for example the food industry(Betts, 2014).
1.4.1 Testing culture conditions
While biochemical characterisation yields the data on which condition a microorganism
grows in, and how it behaves in regards to its environment, to use this organism in a
laboratory or industry context, it is necessary to determine the optimal conditions under which
it operates. Initially tested, an organism may display a range of temperatures and pH under
which it will grow, however, if it is a bacteria or fungi that will be used for production or
degradation of a substance, it is imperative to establish an optimal growth media
environment(Cowan et al., 2004).
Culture conditions which are tested most frequently are: type of growth media, incubation
temperature and time, pH, salinity and agitation. These are first tested under a standard media
- 22 -
which the organism prefers for growth, from which the temperature, pH, salinity and agitation
can be tested. If a bacterium is needed for a specific purpose which can only be accomplished
with a very specific media, then tests can be made in parallel to see its response to multiple
variable change at the same time. For example, in case of I. sakaiensis where the degradation
of PET is tested, and PET is offered as a sole carbon source, a less nutritive media is
necessary as a starting point to insure the bacteria will not opt for a more easily accessible
carbon source available in a nutritive media such as NBRC 982. A high throughput method is
necessary in order to be able to test many variables changed at the same time. Using a
microplate reader is a faster way of testing many variables simultaneously.
An end goal of testing culture condition for any purpose would be getting a stable biomass
which can reliably be replicated over and over again. A starting point for any experimental
purpose, where an organism can be grown in a substantial amount in an expedient manner.
After which, it has defined parameters for growth, and any future use of it can begin with
these variables already recorded.
If, in the future, it is used for production, or degradation, how will the pH naturally change
due to something being consumed and a product being made needs to be taken into account.
This will give insight if a buffer is needed as a base for the growth media. Temperature will
not only affect the organism but the products as well, so if the bacteria may be a thermophile
and offer higher growth rates at hotter temperatures, there could be a risk of product
degradation. These become considerations from which the optimal conditions for its growth
can be used as a starting point and expanded upon.
1.5 COVID-19 impact on global plastic consumption
Following global lockdowns and complete staggering of international travel starting February
2020 due to a Covid-19 outbreak, a major industry in particular experienced an oversupply
and drastic decrease in demand; the crude oil industry. On April 20th 2020, the Western Texas
Intermediate (WTI) price for oil fell to -$36,98. This concerns low density crude oil-based
commodity for future stock contracts. This comes after Saudi Arabia and Russia increased
production to outcompete their market prices(van der Made, 2020a).
Meanwhile, personal protective equipment (PPE) became instrumental in the fight against the
pandemic. Masks, gowns, facial shields made primarily of PP, PE and PET fibres are used as
- 23 -
single-use plastics. Italy alone is predicted to go through 1 billion face masks, and 500 million
gloves each month during the lockdown. Face masks were not covered in the EU single-use
plastic directive, and therefore need to be monitored with increased scrutiny so they are
disposed of correctly(Montalto Monella, 2020).
Increased demand for PPE has led to the US Environmental Protection Agency (EPA) to
loosen their environmental protection regulations by issuing an enforced discretion policy.
The plastics industry has been exploiting the crisis both by calling for lowering of routine
monitoring, and using historically low oil prices for production of virgin plastic(van der
Made, 2020b). There is concern over reverting to old habits before the education of
decreasing single-use plastic started becoming effective. An additional worry is that the
plastic used during the crisis is inappropriate for recycling and therefore will need to be
burned in sterile conditions to not risk infection. This also being coupled with many recycling
operations being disrupted by the pandemic and lines being stopped. In case of recycling of
PPE, the recycling plants would have to apply appropriate sanitation standards to insure no
cross contamination will occur both between workers and onto the material produced(Sahni,
2020). In times before the pandemic, 85% of all medical waste was incinerated even as only
15% is considered a biohazard. The reason is identified as a lack of in-house segregation of
plastic waste. Inappropriate disposal of injection devices led to 33 800 HIV, 1,7 million
hepatitis B and 315 000 hepatitis C infections in 2010. A proposal for reducing the waste is
education of staff in reducing plastic use where possible and awareness of disposal, as well as
developing a comprehensive waste segregation(World Health Organisation (WHO), 2018).
The Covid-19 pandemic has overall lead to a decrease of the plastic additives industry profits
due to lowering of industry demand for certain products. However, the industry expects a full
recovery in the medium to long term future. New applications are considered for additives,
with plasticizers having the most substantial value-creation impact(Research and Markets,
2020).
One of the greatest revelations of the global pandemic was how vulnerable the oil industry
was, even with the global demand of PPE, it is expected that governments will start passing
stricter and stricter sustainability laws, not only on national but international basis as well.
The shift to renewable energy, and renewable materials, as well as research into recovery of
material trapped in waste, may lead to the peak demand of oil arriving a lot sooner than
predictions have been before(Sheppard, 2020).
- 24 -
1.6 Research questions and project aims
The research questions for this project are as follows:
• What media conditions are necessary for activation of I. sakaiensis overnight to reach
an OD greater than 1?
• What is the most reliable and consistently reproducible method for producing PET
powder in a small-scale laboratory setting?
• What are the methods for separating PET powder from biofilm, for comprehensive
degradation quantification?
The aim of this project was to find an optimum media for activating I. sakaiensis which will
produce a uniform biomass each time it was used, and the inoculum for each experiment can
be reliable and easily reproducible. The media would be modified and tested in terms of its
effect on plastic degradation. In the confines of this project it was PET as it is the preferred
plastic for this organism and it has the enzymes necessary for degradation. A method for easy
PET powder production would be established and a system for sieving the powder into
different size grades. These sizes would represent an additional variable that would change in
the plastic degradation experiments. A unified method for quantifying the degradation would
also be established starting from measuring the biomass, the total protein content, the
enzymatic activity, change in plastic weight, and finally the presence of monomers in the
culture media. This way it could be comprehensively tracked how the degradation happens
and at what rate.
- 25 -
2 Materials and Methods
The project was originally planned to focus very specifically to the development of an optimal
growth media for I. sakaiensis and the to continue to a large variety of experiment which
would test the culture conditions that would then measure how the degradation rate would
behave. However, due to some complications with a contaminated cryo stock of I. sakaiensis
which was noticed within the first week of the start of the project; the following methods
pertain more to the isolation of I. sakaiensis from the contaminant and subsequent testing of
different solid and liquid media for this purpose. As well as creating a method for producing
PET powder in-house.
2.1 Microbial strains
• Ideonella sakaiensis 201- F6, purchased previously (cryo stock contaminated); BSL 1
• Ideonella sakaiensis 201- F6, newly purchased from BCRC; BSL 1
2.2 Culture activation
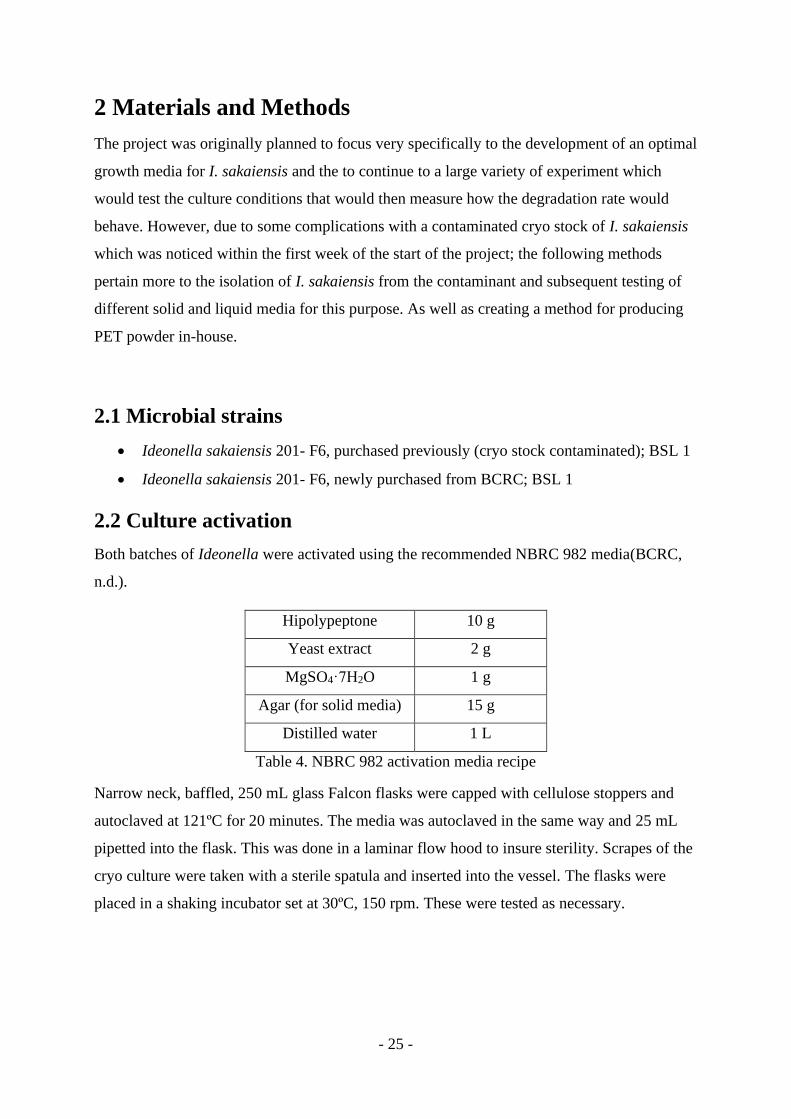
Both batches of Ideonella were activated using the recommended NBRC 982 media(BCRC,
n.d.).
Hipolypeptone 10 g
Yeast extract 2 g
MgSO4·7H2O 1 g
Agar (for solid media) 15 g
Distilled water 1 L
Table 4. NBRC 982 activation media recipe
Narrow neck, baffled, 250 mL glass Falcon flasks were capped with cellulose stoppers and
autoclaved at 121ºC for 20 minutes. The media was autoclaved in the same way and 25 mL
pipetted into the flask. This was done in a laminar flow hood to insure sterility. Scrapes of the
cryo culture were taken with a sterile spatula and inserted into the vessel. The flasks were
placed in a shaking incubator set at 30ºC, 150 rpm. These were tested as necessary.
- 26 -
2.3 Solid and liquid media
Previously stated, the I. sakaiensis arrived with a preferred activation media. The isolation
and optical density experiments utilised a variety of liquid and solid media with a range of
available nutrients.
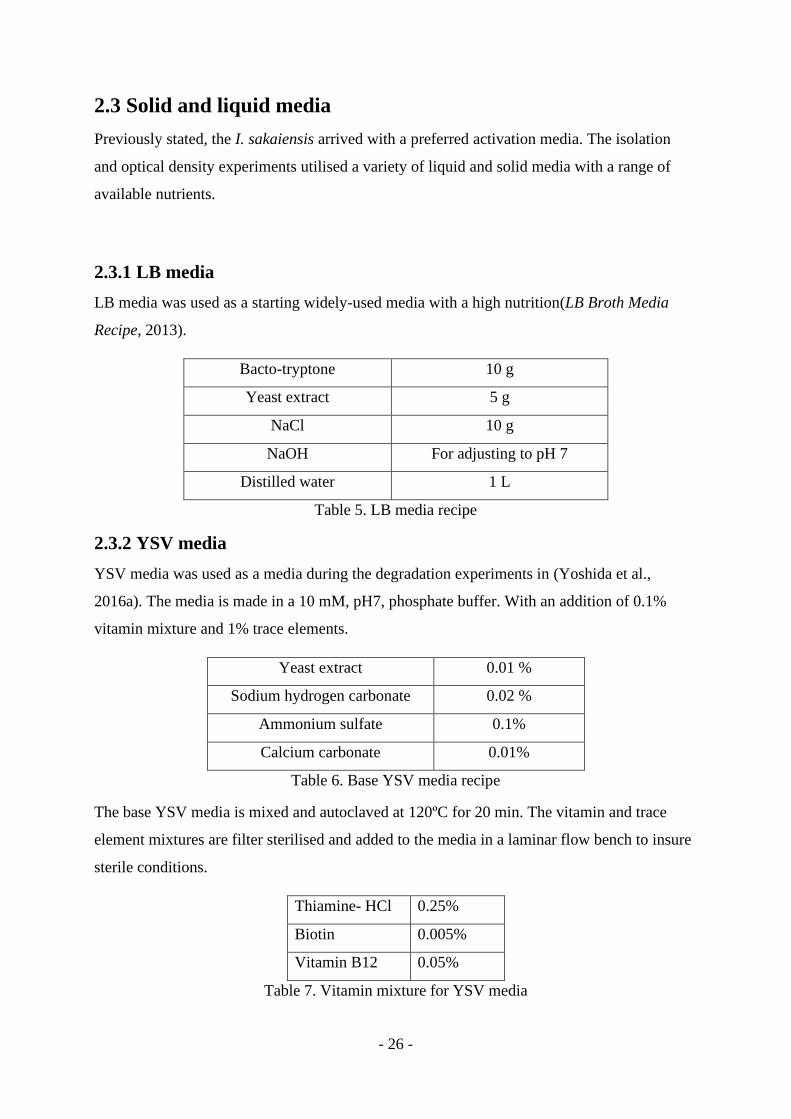
2.3.1 LB media
LB media was used as a starting widely-used media with a high nutrition(LB Broth Media
Recipe, 2013).
Bacto-tryptone 10 g
Yeast extract 5 g
NaCl 10 g
NaOH For adjusting to pH 7
Distilled water 1 L
Table 5. LB media recipe
2.3.2 YSV media
YSV media was used as a media during the degradation experiments in (Yoshida et al.,
2016a). The media is made in a 10 mM, pH7, phosphate buffer. With an addition of 0.1%
vitamin mixture and 1% trace elements.
Yeast extract 0.01 %
Sodium hydrogen carbonate 0.02 %
Ammonium sulfate 0.1%
Calcium carbonate 0.01%
Table 6. Base YSV media recipe
The base YSV media is mixed and autoclaved at 120ºC for 20 min. The vitamin and trace
element mixtures are filter sterilised and added to the media in a laminar flow bench to insure
sterile conditions.
Thiamine- HCl 0.25%
Biotin 0.005%
Vitamin B12 0.05%
Table 7. Vitamin mixture for YSV media
- 27 -
FeSO4·7H2O 0.1%
MgSO4·7H2O 0.1%
CuSO4·5H2O 0.01%
MnSO4·5H2O 0.01%
ZnSO4·7H2O 0.01%
Table 8. Trace elements for YSV
2.3.3 M9 and M9+ media
M9 is classified as a minimal media as it has a very low amount of carbon sources required
for bacterial growth(M9 Minimal Media Recipe ( 1000 Ml ), 2013). In this way it is a very
good media for selecting which carbon source will be selectively fed to the microorganism in
question. M9+ is the original M9 recipe with an addition of the trace element and vitamin
mixture from the YSV media. It provides a bridge between a low nutritive media, and a
minimal nutrition media.
Na2HPO4-7H2O 64 g
KH2PO4 15 g
NaCl 2.5 g
NH4Cl 5 g
Distilled water 1 L
Table 9. M9 salts solution
The M9 salts solution is autoclaved at 120ºC for 20 min before being added into the M9
media.
M9 salts solution 200 mL
Sterile 1M MgSO4 2 mL
Sterile 1M CaCl2 100 µL
Sterile distilled water Adjust to 1000 mL
Table 10. Assembling M9 media
For the M9+ media, the 1% trace element and 0.1% vitamin mixture are added after
autoclaving in addition to all the other constituents of the M9 media.
In order to create solid media of all the listed above, 1.5% of agar was added to each media
respectively. These served as parallel tests to see how I. sakaiensis responded to solid versus
liquid media.
- 28 -
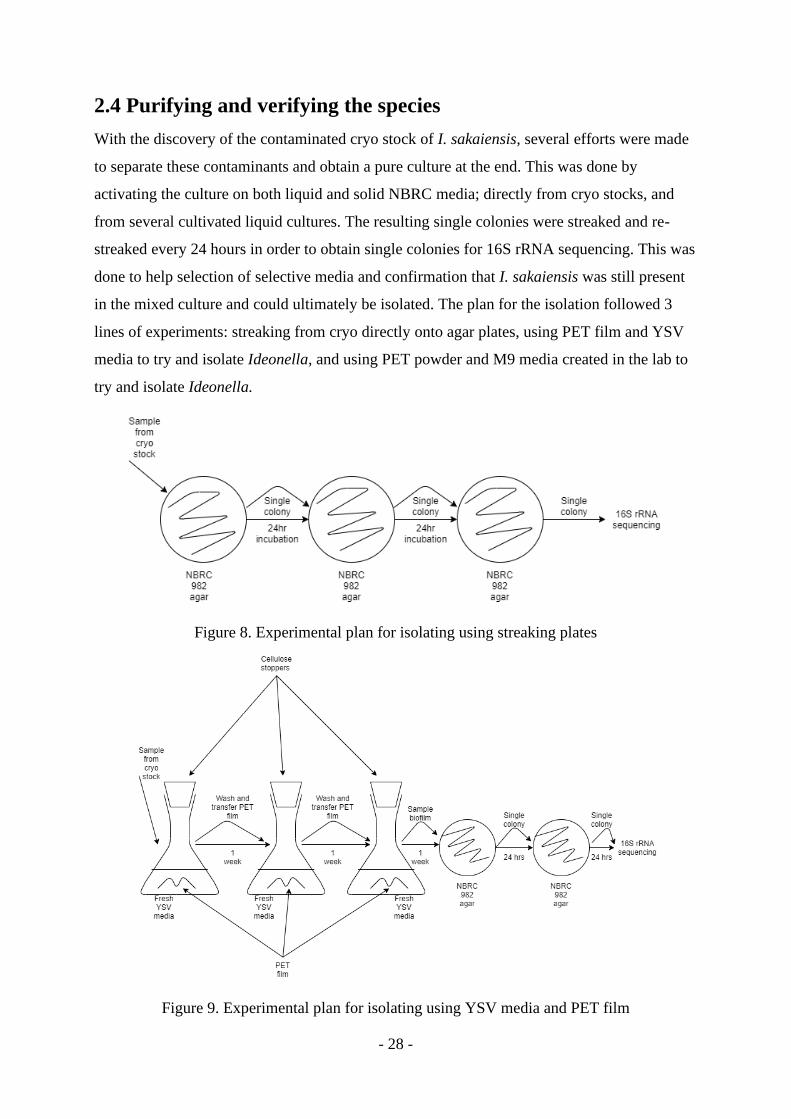
2.4 Purifying and verifying the species
With the discovery of the contaminated cryo stock of I. sakaiensis, several efforts were made
to separate these contaminants and obtain a pure culture at the end. This was done by
activating the culture on both liquid and solid NBRC media; directly from cryo stocks, and
from several cultivated liquid cultures. The resulting single colonies were streaked and re-
streaked every 24 hours in order to obtain single colonies for 16S rRNA sequencing. This was
done to help selection of selective media and confirmation that I. sakaiensis was still present
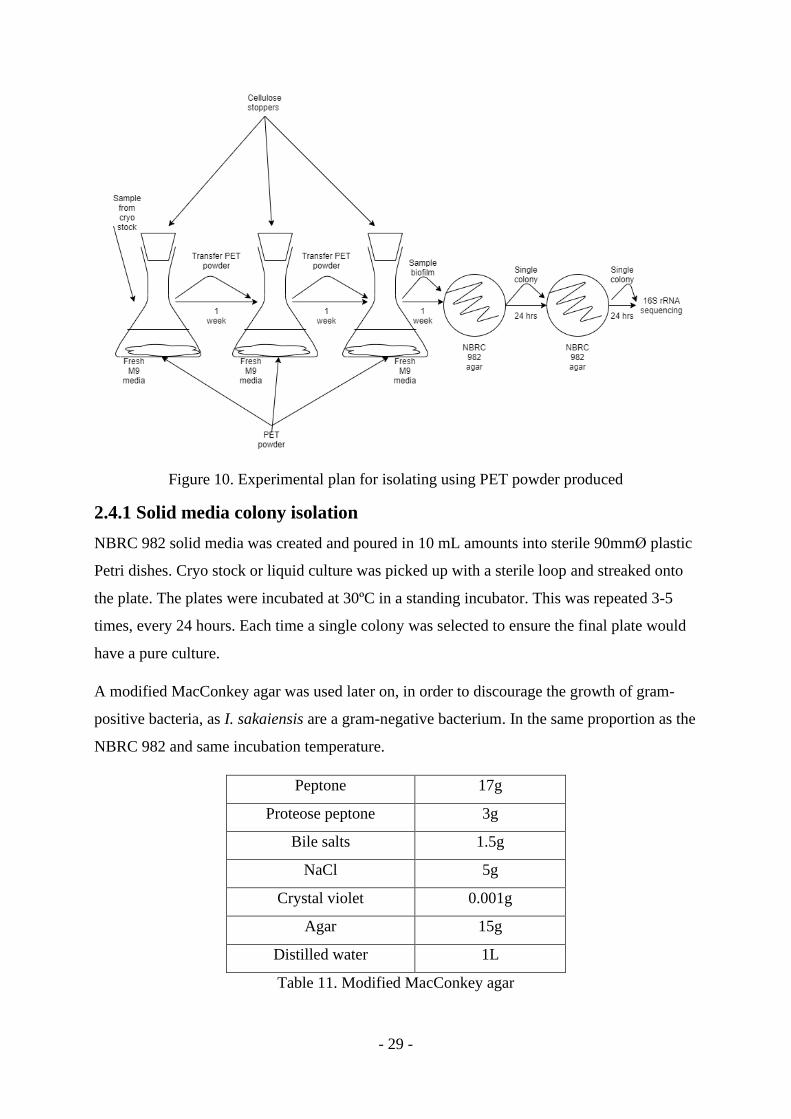
in the mixed culture and could ultimately be isolated. The plan for the isolation followed 3
lines of experiments: streaking from cryo directly onto agar plates, using PET film and YSV
media to try and isolate Ideonella, and using PET powder and M9 media created in the lab to
try and isolate Ideonella.
Figure 8. Experimental plan for isolating using streaking plates
Figure 9. Experimental plan for isolating using YSV media and PET film
- 29 -
Figure 10. Experimental plan for isolating using PET powder produced
2.4.1 Solid media colony isolation
NBRC 982 solid media was created and poured in 10 mL amounts into sterile 90mmØ plastic
Petri dishes. Cryo stock or liquid culture was picked up with a sterile loop and streaked onto
the plate. The plates were incubated at 30ºC in a standing incubator. This was repeated 3-5
times, every 24 hours. Each time a single colony was selected to ensure the final plate would
have a pure culture.
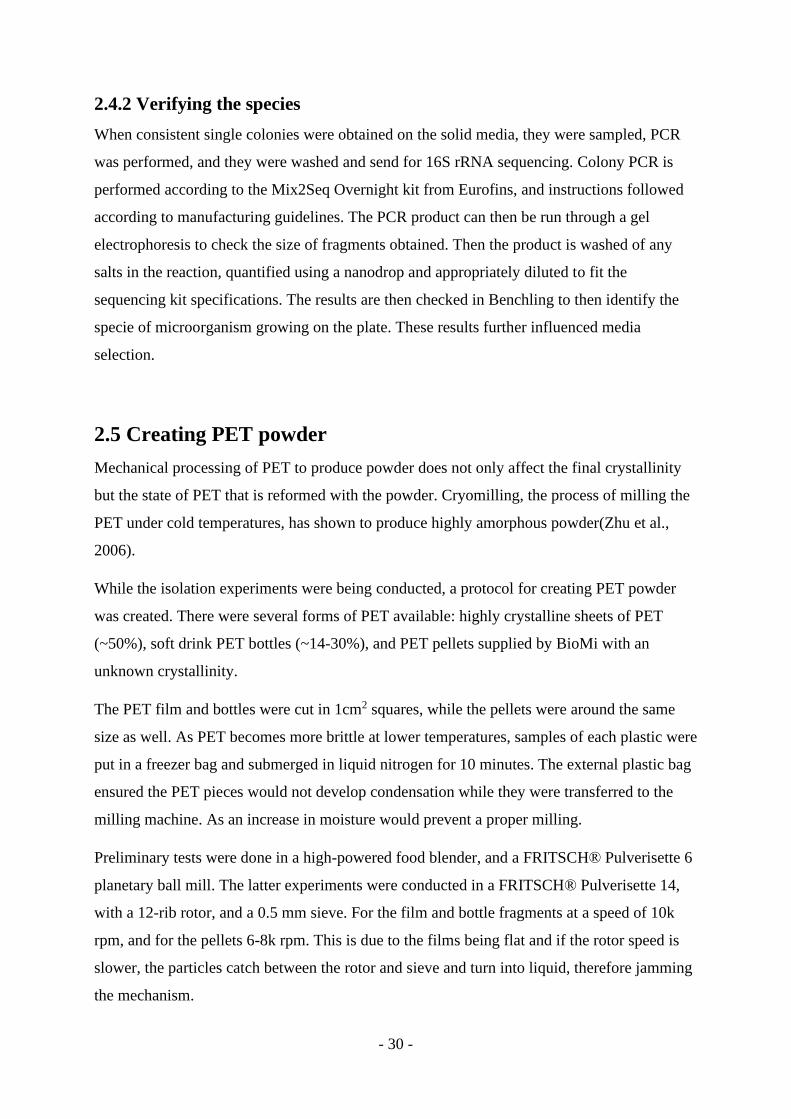
A modified MacConkey agar was used later on, in order to discourage the growth of gram-
positive bacteria, as I. sakaiensis are a gram-negative bacterium. In the same proportion as the
NBRC 982 and same incubation temperature.
Peptone 17g
Proteose peptone 3g
Bile salts 1.5g
NaCl 5g
Crystal violet 0.001g
Agar 15g
Distilled water 1L
Table 11. Modified MacConkey agar
- 30 -
2.4.2 Verifying the species
When consistent single colonies were obtained on the solid media, they were sampled, PCR
was performed, and they were washed and send for 16S rRNA sequencing. Colony PCR is
performed according to the Mix2Seq Overnight kit from Eurofins, and instructions followed
according to manufacturing guidelines. The PCR product can then be run through a gel
electrophoresis to check the size of fragments obtained. Then the product is washed of any
salts in the reaction, quantified using a nanodrop and appropriately diluted to fit the
sequencing kit specifications. The results are then checked in Benchling to then identify the
specie of microorganism growing on the plate. These results further influenced media
selection.
2.5 Creating PET powder
Mechanical processing of PET to produce powder does not only affect the final crystallinity
but the state of PET that is reformed with the powder. Cryomilling, the process of milling the
PET under cold temperatures, has shown to produce highly amorphous powder(Zhu et al.,
2006).
While the isolation experiments were being conducted, a protocol for creating PET powder
was created. There were several forms of PET available: highly crystalline sheets of PET
(~50%), soft drink PET bottles (~14-30%), and PET pellets supplied by BioMi with an
unknown crystallinity.
The PET film and bottles were cut in 1cm2 squares, while the pellets were around the same
size as well. As PET becomes more brittle at lower temperatures, samples of each plastic were
put in a freezer bag and submerged in liquid nitrogen for 10 minutes. The external plastic bag
ensured the PET pieces would not develop condensation while they were transferred to the
milling machine. As an increase in moisture would prevent a proper milling.
Preliminary tests were done in a high-powered food blender, and a FRITSCH® Pulverisette 6
planetary ball mill. The latter experiments were conducted in a FRITSCH® Pulverisette 14,
with a 12-rib rotor, and a 0.5 mm sieve. For the film and bottle fragments at a speed of 10k
rpm, and for the pellets 6-8k rpm. This is due to the films being flat and if the rotor speed is
slower, the particles catch between the rotor and sieve and turn into liquid, therefore jamming
the mechanism.
- 31 -
The collection of the particles is done with a stiff bristle brush, and it is mandatory to wear a
facemask to protect from inhaling the plastic dust. These powders may then be sorted in size
categories or kept as a singular multi-granule size powder. For separating it into different
sizes, steel mesh of several sizes was used: 2000 mm, 1000mm, 500 µm, 250 µm and 50 µm.
The separation process is tedious and long if done by hand and not with automated shaking
sieves. For this project it was done by hand. The powders are then labelled and stored
individually.
2.6 Measuring OD600
In order to optimise the time and amount of media that can be tested at one time, OD600
experiments were conducting using a BioTek® Epoch 2 microplate reader.
This is an indirect way of determining cell growth and from OD an approximate cell count
can be determined. For accurate reading, it is important to either measure dry cell weight of
the sample, or determine the colony-forming units (CFU) from agar plates.
This was not performed due to time constraints once the pure organism was obtained, but it
can be calculating by diluting OD readings to establish a correct base reading, plating the
sample and count the colonies formed.
2.6.1 Preparing the microplate
96-well microplates were used for this experiment. The working volume for each well was
200 µL. Each media was pipetted as a blank in triplicates, as well as the samples with I.
sakaiensis. The inoculum size was 10% or 20 µL. A culture was preactivated 24 hours in
advance in an NBRC 982 media in a 250 mL narrow necked, baffled Falcon flask. The OD600
was measured in a standard 1 mL UV/VIS spectrophotometer cuvette to check the optical
density and determine how many cells were contained in the media. This sample was then
diluted so the starting OD600 inside the microplate well would be around 0.1. As the media
used for experiments was lower in nutrients than the activation media, the samples of the
inoculum had to be washed.
This was done by taking 500 µL of the activation broth with grown cells and washing it 3
times with each corresponding media. The activation broth was put in a sterile 1.5 mL
- 32 -
Eppendorf tube and centrifuged at 4000 rpm for 5 minutes. The supernatant was taken out,
and the pellet was resuspended in the corresponding media. This was repeated 3 times to
ensure no leftover nutrients would interfere with the reading.
Appropriate amounts of media and inoculum were then pipetted into the microplate wells and
the plate was covered with a plastic film that was optically compatible with the reader.
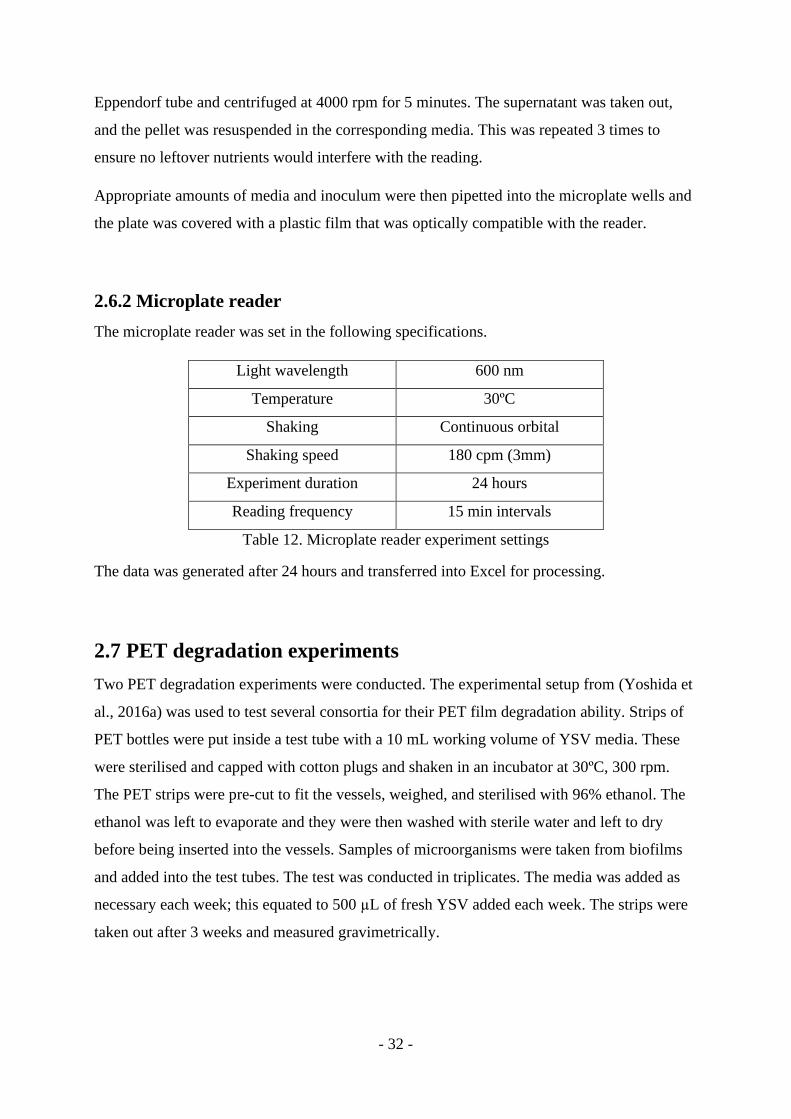
2.6.2 Microplate reader
The microplate reader was set in the following specifications.
Light wavelength 600 nm
Temperature 30ºC
Shaking Continuous orbital
Shaking speed 180 cpm (3mm)
Experiment duration 24 hours
Reading frequency 15 min intervals
Table 12. Microplate reader experiment settings
The data was generated after 24 hours and transferred into Excel for processing.
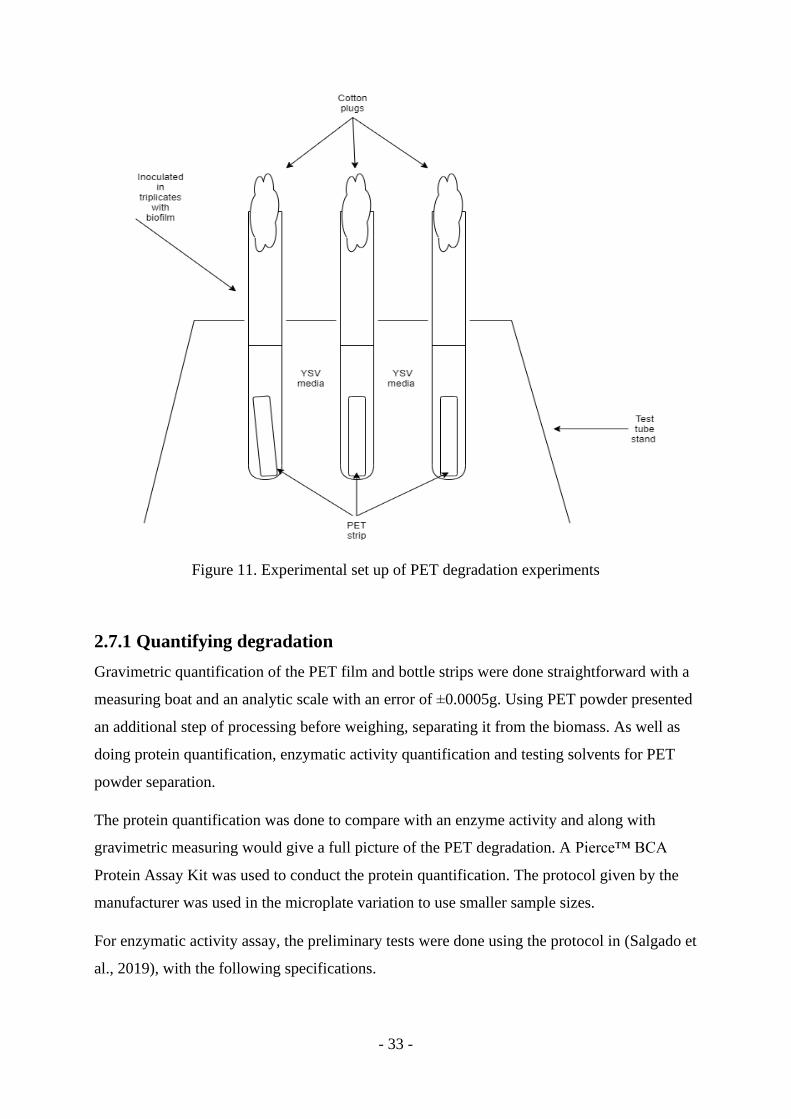
2.7 PET degradation experiments
Two PET degradation experiments were conducted. The experimental setup from (Yoshida et
al., 2016a) was used to test several consortia for their PET film degradation ability. Strips of
PET bottles were put inside a test tube with a 10 mL working volume of YSV media. These
were sterilised and capped with cotton plugs and shaken in an incubator at 30ºC, 300 rpm.
The PET strips were pre-cut to fit the vessels, weighed, and sterilised with 96% ethanol. The
ethanol was left to evaporate and they were then washed with sterile water and left to dry
before being inserted into the vessels. Samples of microorganisms were taken from biofilms
and added into the test tubes. The test was conducted in triplicates. The media was added as
necessary each week; this equated to 500 µL of fresh YSV added each week. The strips were
taken out after 3 weeks and measured gravimetrically.
- 33 -
Figure 11. Experimental set up of PET degradation experiments
2.7.1 Quantifying degradation
Gravimetric quantification of the PET film and bottle strips were done straightforward with a
measuring boat and an analytic scale with an error of ±0.0005g. Using PET powder presented
an additional step of processing before weighing, separating it from the biomass. As well as
doing protein quantification, enzymatic activity quantification and testing solvents for PET
powder separation.
The protein quantification was done to compare with an enzyme activity and along with
gravimetric measuring would give a full picture of the PET degradation. A Pierce™ BCA
Protein Assay Kit was used to conduct the protein quantification. The protocol given by the
manufacturer was used in the microplate variation to use smaller sample sizes.
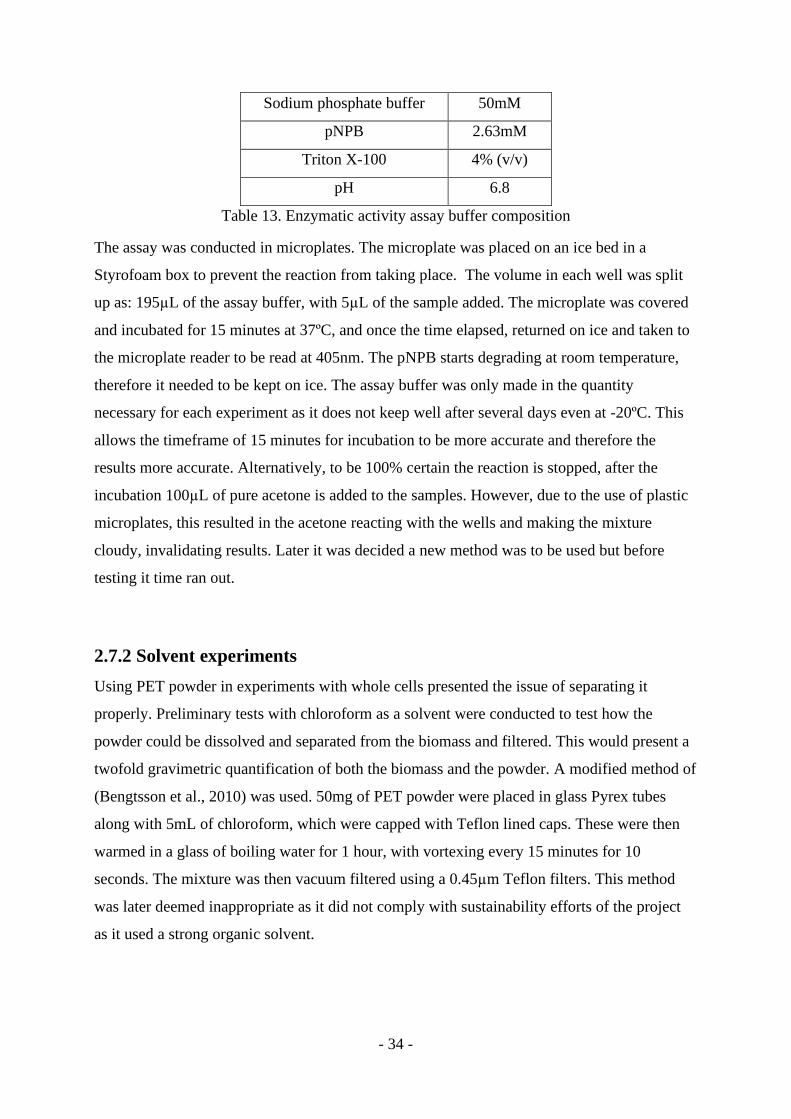
For enzymatic activity assay, the preliminary tests were done using the protocol in (Salgado et
al., 2019), with the following specifications.
- 34 -
Sodium phosphate buffer 50mM
pNPB 2.63mM
Triton X-100 4% (v/v)
pH 6.8
Table 13. Enzymatic activity assay buffer composition
The assay was conducted in microplates. The microplate was placed on an ice bed in a
Styrofoam box to prevent the reaction from taking place. The volume in each well was split
up as: 195µL of the assay buffer, with 5µL of the sample added. The microplate was covered
and incubated for 15 minutes at 37ºC, and once the time elapsed, returned on ice and taken to
the microplate reader to be read at 405nm. The pNPB starts degrading at room temperature,
therefore it needed to be kept on ice. The assay buffer was only made in the quantity
necessary for each experiment as it does not keep well after several days even at -20ºC. This
allows the timeframe of 15 minutes for incubation to be more accurate and therefore the
results more accurate. Alternatively, to be 100% certain the reaction is stopped, after the
incubation 100µL of pure acetone is added to the samples. However, due to the use of plastic
microplates, this resulted in the acetone reacting with the wells and making the mixture
cloudy, invalidating results. Later it was decided a new method was to be used but before
testing it time ran out.
2.7.2 Solvent experiments
Using PET powder in experiments with whole cells presented the issue of separating it
properly. Preliminary tests with chloroform as a solvent were conducted to test how the
powder could be dissolved and separated from the biomass and filtered. This would present a
twofold gravimetric quantification of both the biomass and the powder. A modified method of
(Bengtsson et al., 2010) was used. 50mg of PET powder were placed in glass Pyrex tubes
along with 5mL of chloroform, which were capped with Teflon lined caps. These were then
warmed in a glass of boiling water for 1 hour, with vortexing every 15 minutes for 10
seconds. The mixture was then vacuum filtered using a 0.45µm Teflon filters. This method
was later deemed inappropriate as it did not comply with sustainability efforts of the project
as it used a strong organic solvent.
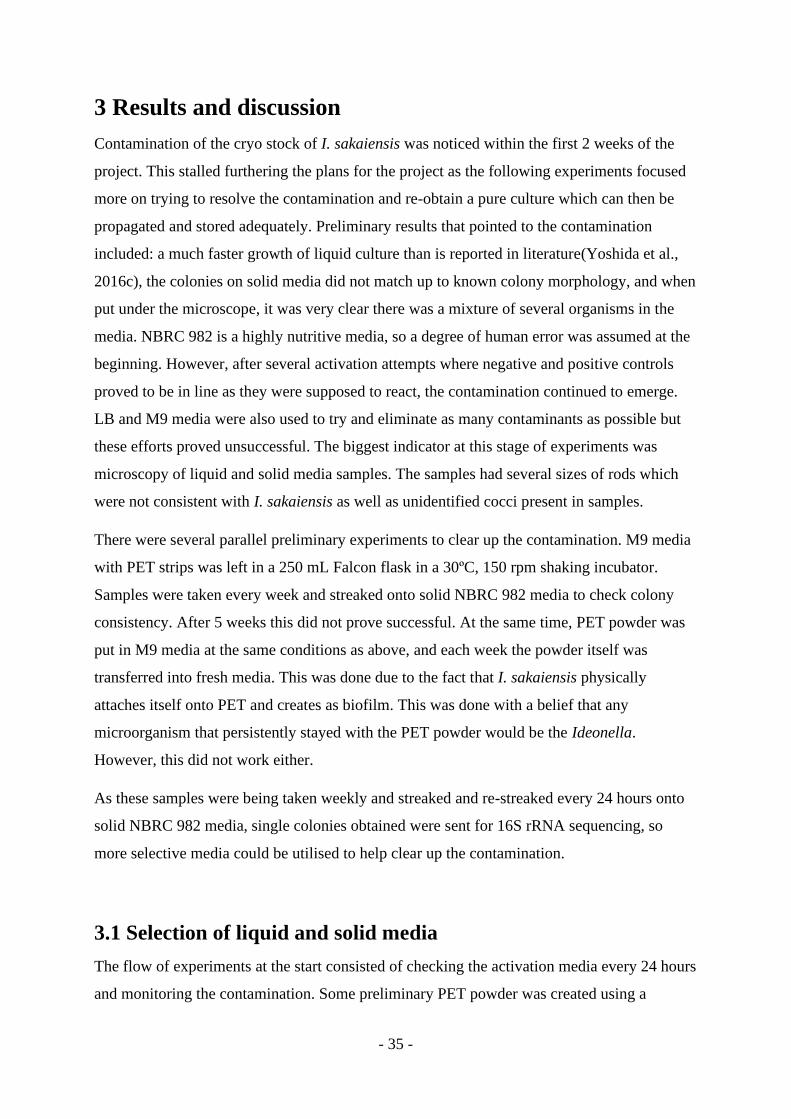
- 35 -
3 Results and discussion
Contamination of the cryo stock of I. sakaiensis was noticed within the first 2 weeks of the
project. This stalled furthering the plans for the project as the following experiments focused
more on trying to resolve the contamination and re-obtain a pure culture which can then be
propagated and stored adequately. Preliminary results that pointed to the contamination
included: a much faster growth of liquid culture than is reported in literature(Yoshida et al.,
2016c), the colonies on solid media did not match up to known colony morphology, and when
put under the microscope, it was very clear there was a mixture of several organisms in the
media. NBRC 982 is a highly nutritive media, so a degree of human error was assumed at the
beginning. However, after several activation attempts where negative and positive controls
proved to be in line as they were supposed to react, the contamination continued to emerge.
LB and M9 media were also used to try and eliminate as many contaminants as possible but
these efforts proved unsuccessful. The biggest indicator at this stage of experiments was
microscopy of liquid and solid media samples. The samples had several sizes of rods which
were not consistent with I. sakaiensis as well as unidentified cocci present in samples.
There were several parallel preliminary experiments to clear up the contamination. M9 media
with PET strips was left in a 250 mL Falcon flask in a 30ºC, 150 rpm shaking incubator.
Samples were taken every week and streaked onto solid NBRC 982 media to check colony
consistency. After 5 weeks this did not prove successful. At the same time, PET powder was
put in M9 media at the same conditions as above, and each week the powder itself was
transferred into fresh media. This was done due to the fact that I. sakaiensis physically
attaches itself onto PET and creates as biofilm. This was done with a belief that any
microorganism that persistently stayed with the PET powder would be the Ideonella.
However, this did not work either.
As these samples were being taken weekly and streaked and re-streaked every 24 hours onto
solid NBRC 982 media, single colonies obtained were sent for 16S rRNA sequencing, so
more selective media could be utilised to help clear up the contamination.
3.1 Selection of liquid and solid media
The flow of experiments at the start consisted of checking the activation media every 24 hours
and monitoring the contamination. Some preliminary PET powder was created using a
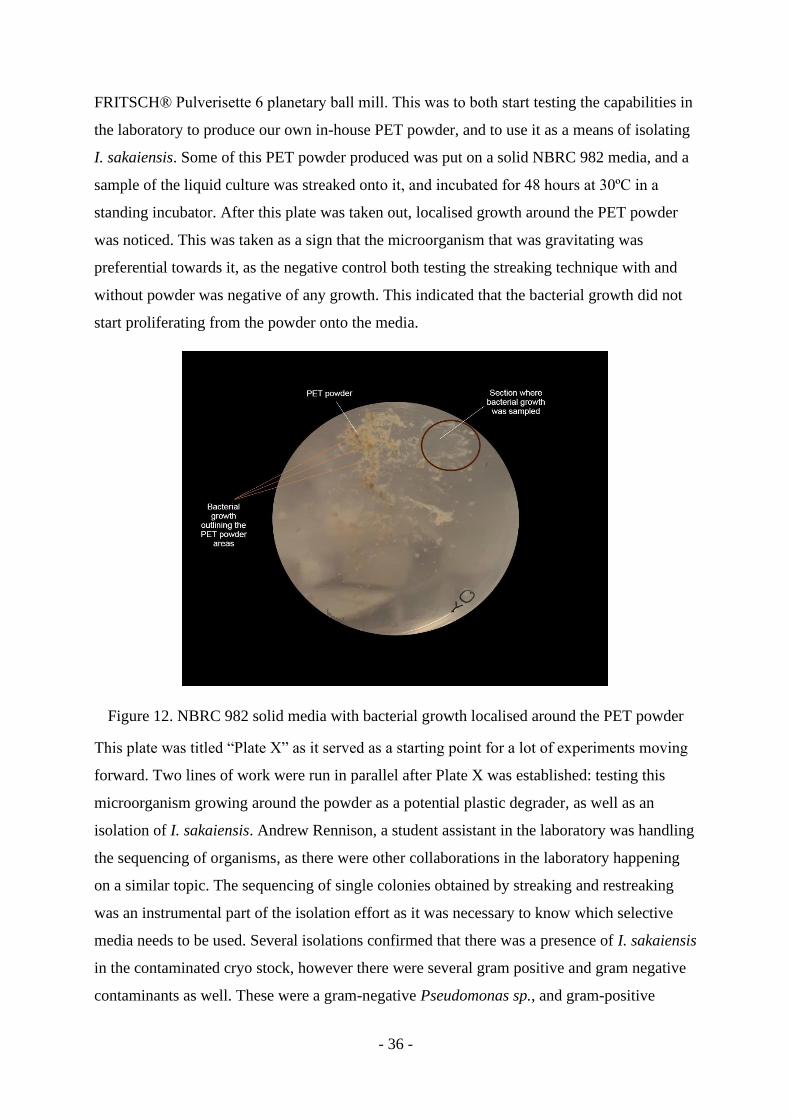
- 36 -
FRITSCH® Pulverisette 6 planetary ball mill. This was to both start testing the capabilities in
the laboratory to produce our own in-house PET powder, and to use it as a means of isolating
I. sakaiensis. Some of this PET powder produced was put on a solid NBRC 982 media, and a
sample of the liquid culture was streaked onto it, and incubated for 48 hours at 30ºC in a
standing incubator. After this plate was taken out, localised growth around the PET powder
was noticed. This was taken as a sign that the microorganism that was gravitating was
preferential towards it, as the negative control both testing the streaking technique with and
without powder was negative of any growth. This indicated that the bacterial growth did not
start proliferating from the powder onto the media.
Figure 12. NBRC 982 solid media with bacterial growth localised around the PET powder
This plate was titled “Plate X” as it served as a starting point for a lot of experiments moving
forward. Two lines of work were run in parallel after Plate X was established: testing this
microorganism growing around the powder as a potential plastic degrader, as well as an
isolation of I. sakaiensis. Andrew Rennison, a student assistant in the laboratory was handling
the sequencing of organisms, as there were other collaborations in the laboratory happening
on a similar topic. The sequencing of single colonies obtained by streaking and restreaking
was an instrumental part of the isolation effort as it was necessary to know which selective
media needs to be used. Several isolations confirmed that there was a presence of I. sakaiensis
in the contaminated cryo stock, however there were several gram positive and gram negative
contaminants as well. These were a gram-negative Pseudomonas sp., and gram-positive
- 37 -
Bacillus cereus. To help removing B. cereus, a modified MacConkey agar was used, which
contains Crystal violet which does not allow the growth of gram-positive bacteria. This was
later proved successful as single colonies which were sequenced as B. cereus, when
restreaked to the MC agar would not grow. To prevent the Pseudomonas sp. from growing,
adipic acid was used as a carbon source as I. sakaiensis has shown to be able to utilise it for
growth while Pseudomonas sp. mostly cannot(Tanasupawat et al., 2016). These efforts
ultimately had proved to not yield the results that was expected. While the modified MC agar
and addition of 1g/L of adipic acid as a carbon source helped with reducing contamination, I.
sakaiensis was not growing readily on it either. In February 2020, a new batch of I. sakaiensis
was ordered from BCRC in Taiwan.
3.2 Establishing biofilms
As mentioned, another line of experiments alongside sequencing and isolating the target
bacteria, was testing the microorganisms that started growing around the PET powder on
Plate X. 4 streaks were taken from the plate, and inoculated into a YSV media. Narrow
necked, baffled, 250 mL glass Falcon flasks, were autoclaved capped with cotton plugs. 25
mL of YSV media was pipetted and inoculated. These were shaken at 150 rpm at 30ºC
incubator. Cleaned strips of PET film were crimped to have folds and inserted into the media.
These were left for 1 weeks before checking them again. A biofilm started forming in the
folds of the PET film. During the first 3 weeks, the surrounding media was turning turbid,
therefore it was decided that each week, the strip would be taken out and transferred into a
fresh flask with fresh media. This was done by preparing the new flask and media in the same
way as the original one, preparing a sterile pair of angled forceps, 70% ethanol for sterilising
- 38 -
between samples, and sterile water and glass container to rinse the PET film. This was done to
ensure the only bacteria transferred would be the ones already forming biofilm on the plastic.
Figure 13. Biofilm formation on PET films
This process was repeated for 8 weeks. Every 2 weeks streaks of the biofilm were tested for
sequencing, however the only results obtained were that it was a mixed consortium of
Pseudomonas sp and Bacillus sp.
MC agar plates of the biofilms were produced in order to try and sequence the individual
Pseudomonas species; however, all of the results came back as overlapping. The reason for
this was to identify the individual components of the consortia to determine if the biofilm was
valuable for further investigating or if it is just a collection of cells surviving on the minimal
amount of yeast extract available in the YSV media.
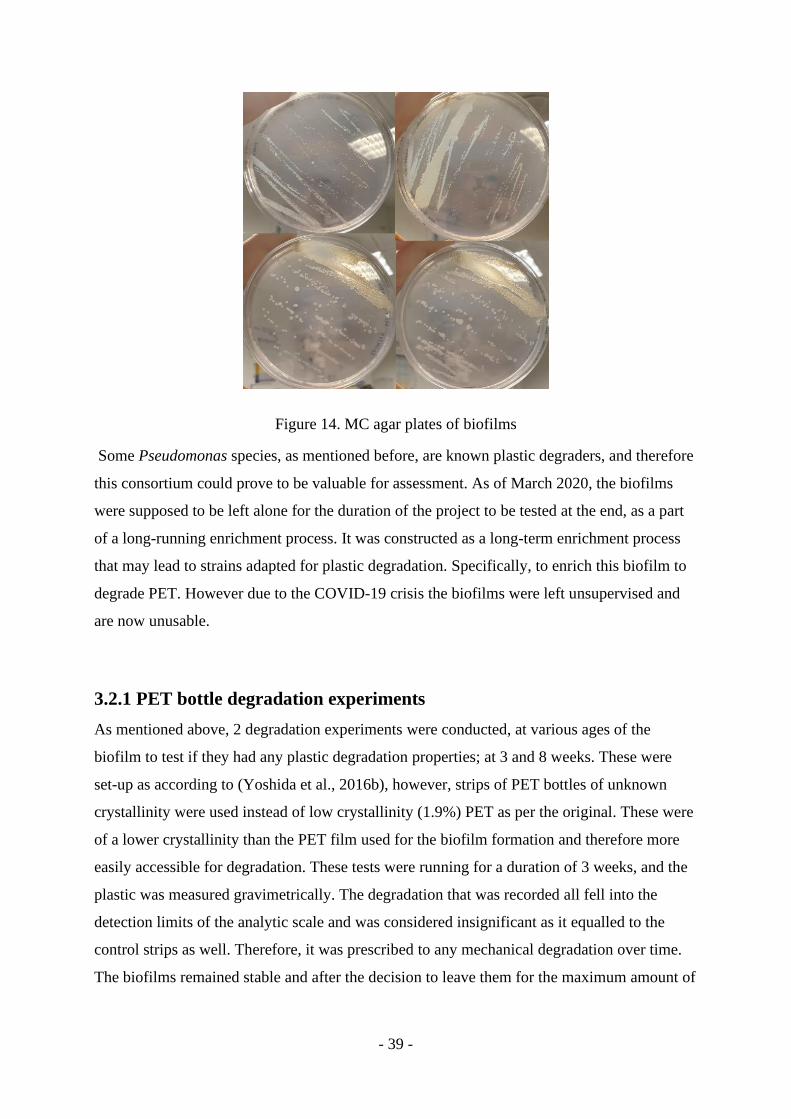
- 39 -
Figure 14. MC agar plates of biofilms
Some Pseudomonas species, as mentioned before, are known plastic degraders, and therefore
this consortium could prove to be valuable for assessment. As of March 2020, the biofilms
were supposed to be left alone for the duration of the project to be tested at the end, as a part
of a long-running enrichment process. It was constructed as a long-term enrichment process
that may lead to strains adapted for plastic degradation. Specifically, to enrich this biofilm to
degrade PET. However due to the COVID-19 crisis the biofilms were left unsupervised and
are now unusable.
3.2.1 PET bottle degradation experiments
As mentioned above, 2 degradation experiments were conducted, at various ages of the
biofilm to test if they had any plastic degradation properties; at 3 and 8 weeks. These were
set-up as according to (Yoshida et al., 2016b), however, strips of PET bottles of unknown
crystallinity were used instead of low crystallinity (1.9%) PET as per the original. These were
of a lower crystallinity than the PET film used for the biofilm formation and therefore more
easily accessible for degradation. These tests were running for a duration of 3 weeks, and the
plastic was measured gravimetrically. The degradation that was recorded all fell into the
detection limits of the analytic scale and was considered insignificant as it equalled to the
control strips as well. Therefore, it was prescribed to any mechanical degradation over time.
The biofilms remained stable and after the decision to leave them for the maximum amount of
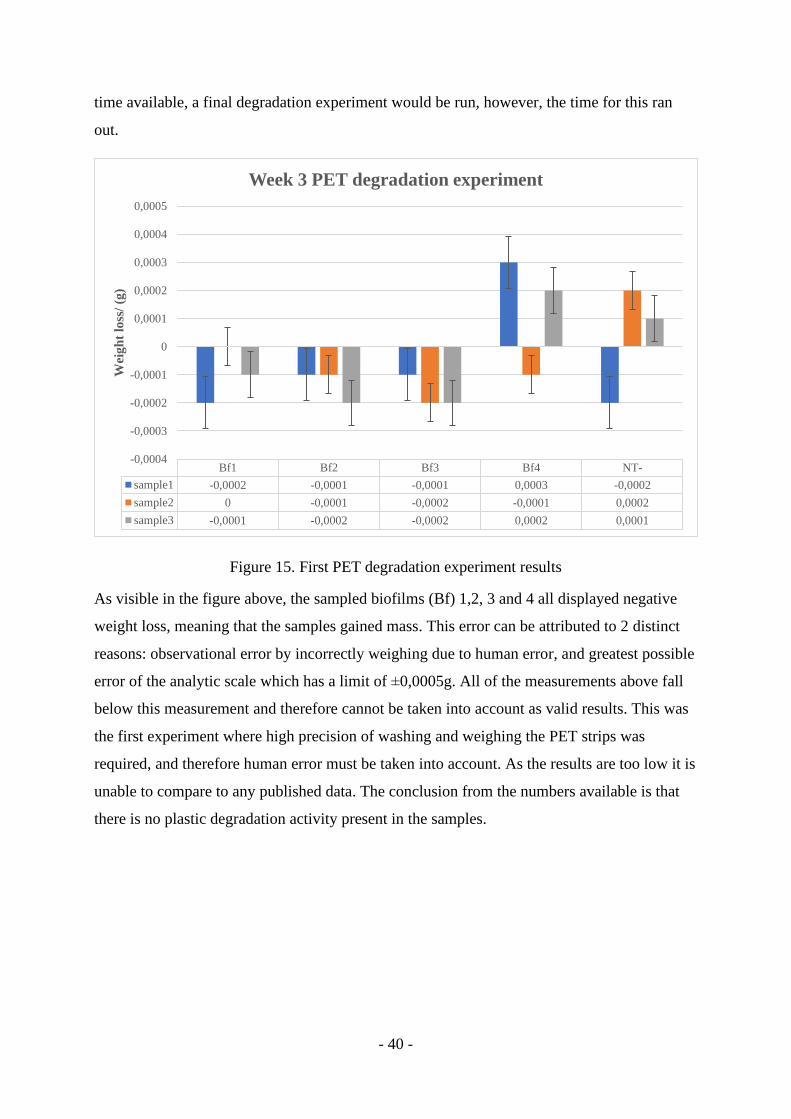
- 40 -
time available, a final degradation experiment would be run, however, the time for this ran
out.
Figure 15. First PET degradation experiment results
As visible in the figure above, the sampled biofilms (Bf) 1,2, 3 and 4 all displayed negative
weight loss, meaning that the samples gained mass. This error can be attributed to 2 distinct
reasons: observational error by incorrectly weighing due to human error, and greatest possible
error of the analytic scale which has a limit of ±0,0005g. All of the measurements above fall
below this measurement and therefore cannot be taken into account as valid results. This was
the first experiment where high precision of washing and weighing the PET strips was
required, and therefore human error must be taken into account. As the results are too low it is
unable to compare to any published data. The conclusion from the numbers available is that
there is no plastic degradation activity present in the samples.
Bf1 Bf2 Bf3 Bf4 NT-
sample1 -0,0002 -0,0001 -0,0001 0,0003 -0,0002
sample2 0 -0,0001 -0,0002 -0,0001 0,0002
sample3 -0,0001 -0,0002 -0,0002 0,0002 0,0001
-0,0004
-0,0003
-0,0002
-0,0001
0
0,0001
0,0002
0,0003
0,0004
0,0005
Wei
gh
t lo
ss/
(g)
Week 3 PET degradation experiment
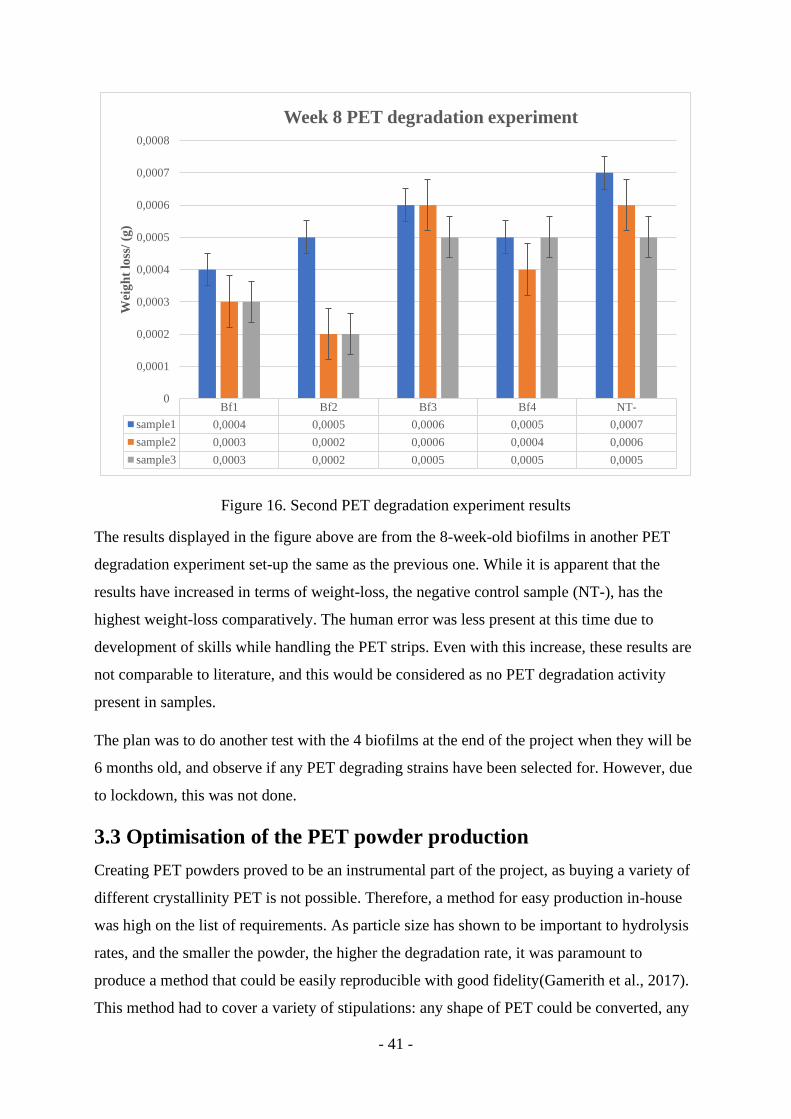
- 41 -
Figure 16. Second PET degradation experiment results
The results displayed in the figure above are from the 8-week-old biofilms in another PET
degradation experiment set-up the same as the previous one. While it is apparent that the
results have increased in terms of weight-loss, the negative control sample (NT-), has the
highest weight-loss comparatively. The human error was less present at this time due to
development of skills while handling the PET strips. Even with this increase, these results are
not comparable to literature, and this would be considered as no PET degradation activity
present in samples.
The plan was to do another test with the 4 biofilms at the end of the project when they will be
6 months old, and observe if any PET degrading strains have been selected for. However, due
to lockdown, this was not done.
3.3 Optimisation of the PET powder production
Creating PET powders proved to be an instrumental part of the project, as buying a variety of
different crystallinity PET is not possible. Therefore, a method for easy production in-house
was high on the list of requirements. As particle size has shown to be important to hydrolysis
rates, and the smaller the powder, the higher the degradation rate, it was paramount to
produce a method that could be easily reproducible with good fidelity(Gamerith et al., 2017).
This method had to cover a variety of stipulations: any shape of PET could be converted, any
Bf1 Bf2 Bf3 Bf4 NT-
sample1 0,0004 0,0005 0,0006 0,0005 0,0007
sample2 0,0003 0,0002 0,0006 0,0004 0,0006
sample3 0,0003 0,0002 0,0005 0,0005 0,0005
0
0,0001
0,0002
0,0003
0,0004
0,0005
0,0006
0,0007
0,0008
Wei
gh
t lo
ss/
(g)
Week 8 PET degradation experiment
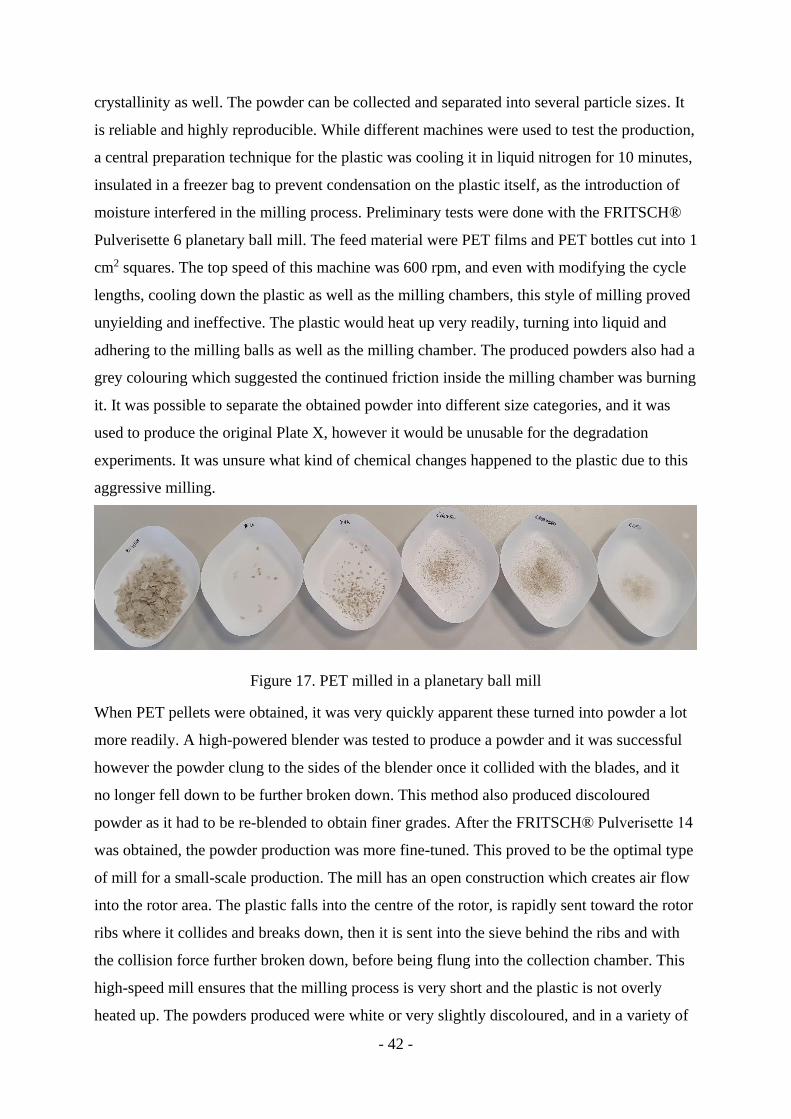
- 42 -
crystallinity as well. The powder can be collected and separated into several particle sizes. It
is reliable and highly reproducible. While different machines were used to test the production,
a central preparation technique for the plastic was cooling it in liquid nitrogen for 10 minutes,
insulated in a freezer bag to prevent condensation on the plastic itself, as the introduction of
moisture interfered in the milling process. Preliminary tests were done with the FRITSCH®
Pulverisette 6 planetary ball mill. The feed material were PET films and PET bottles cut into 1
cm2 squares. The top speed of this machine was 600 rpm, and even with modifying the cycle
lengths, cooling down the plastic as well as the milling chambers, this style of milling proved
unyielding and ineffective. The plastic would heat up very readily, turning into liquid and
adhering to the milling balls as well as the milling chamber. The produced powders also had a
grey colouring which suggested the continued friction inside the milling chamber was burning
it. It was possible to separate the obtained powder into different size categories, and it was
used to produce the original Plate X, however it would be unusable for the degradation
experiments. It was unsure what kind of chemical changes happened to the plastic due to this
aggressive milling.
Figure 17. PET milled in a planetary ball mill
When PET pellets were obtained, it was very quickly apparent these turned into powder a lot
more readily. A high-powered blender was tested to produce a powder and it was successful
however the powder clung to the sides of the blender once it collided with the blades, and it
no longer fell down to be further broken down. This method also produced discoloured
powder as it had to be re-blended to obtain finer grades. After the FRITSCH® Pulverisette 14
was obtained, the powder production was more fine-tuned. This proved to be the optimal type
of mill for a small-scale production. The mill has an open construction which creates air flow
into the rotor area. The plastic falls into the centre of the rotor, is rapidly sent toward the rotor
ribs where it collides and breaks down, then it is sent into the sieve behind the ribs and with
the collision force further broken down, before being flung into the collection chamber. This
high-speed mill ensures that the milling process is very short and the plastic is not overly
heated up. The powders produced were white or very slightly discoloured, and in a variety of
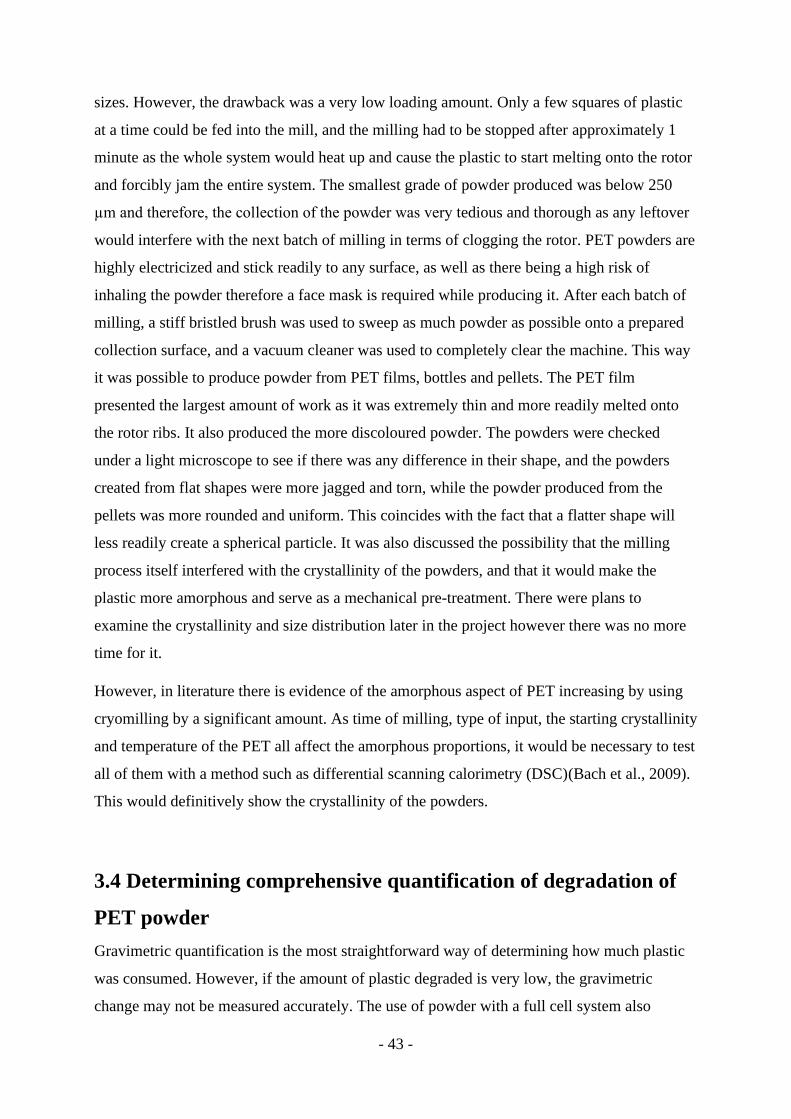
- 43 -
sizes. However, the drawback was a very low loading amount. Only a few squares of plastic
at a time could be fed into the mill, and the milling had to be stopped after approximately 1
minute as the whole system would heat up and cause the plastic to start melting onto the rotor
and forcibly jam the entire system. The smallest grade of powder produced was below 250
µm and therefore, the collection of the powder was very tedious and thorough as any leftover
would interfere with the next batch of milling in terms of clogging the rotor. PET powders are
highly electricized and stick readily to any surface, as well as there being a high risk of
inhaling the powder therefore a face mask is required while producing it. After each batch of
milling, a stiff bristled brush was used to sweep as much powder as possible onto a prepared
collection surface, and a vacuum cleaner was used to completely clear the machine. This way
it was possible to produce powder from PET films, bottles and pellets. The PET film
presented the largest amount of work as it was extremely thin and more readily melted onto
the rotor ribs. It also produced the more discoloured powder. The powders were checked
under a light microscope to see if there was any difference in their shape, and the powders
created from flat shapes were more jagged and torn, while the powder produced from the
pellets was more rounded and uniform. This coincides with the fact that a flatter shape will
less readily create a spherical particle. It was also discussed the possibility that the milling
process itself interfered with the crystallinity of the powders, and that it would make the
plastic more amorphous and serve as a mechanical pre-treatment. There were plans to
examine the crystallinity and size distribution later in the project however there was no more
time for it.
However, in literature there is evidence of the amorphous aspect of PET increasing by using
cryomilling by a significant amount. As time of milling, type of input, the starting crystallinity
and temperature of the PET all affect the amorphous proportions, it would be necessary to test
all of them with a method such as differential scanning calorimetry (DSC)(Bach et al., 2009).
This would definitively show the crystallinity of the powders.
3.4 Determining comprehensive quantification of degradation of
PET powder
Gravimetric quantification is the most straightforward way of determining how much plastic
was consumed. However, if the amount of plastic degraded is very low, the gravimetric
change may not be measured accurately. The use of powder with a full cell system also
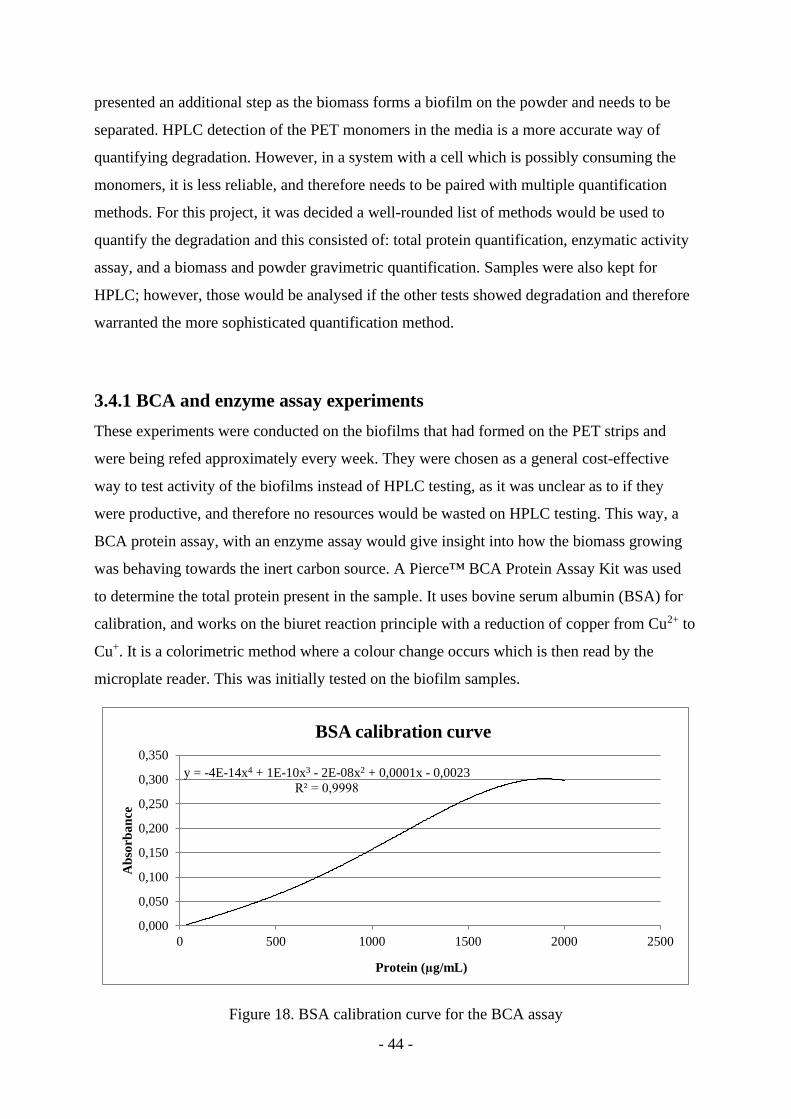
- 44 -
presented an additional step as the biomass forms a biofilm on the powder and needs to be
separated. HPLC detection of the PET monomers in the media is a more accurate way of
quantifying degradation. However, in a system with a cell which is possibly consuming the
monomers, it is less reliable, and therefore needs to be paired with multiple quantification
methods. For this project, it was decided a well-rounded list of methods would be used to
quantify the degradation and this consisted of: total protein quantification, enzymatic activity
assay, and a biomass and powder gravimetric quantification. Samples were also kept for
HPLC; however, those would be analysed if the other tests showed degradation and therefore
warranted the more sophisticated quantification method.
3.4.1 BCA and enzyme assay experiments
These experiments were conducted on the biofilms that had formed on the PET strips and
were being refed approximately every week. They were chosen as a general cost-effective
way to test activity of the biofilms instead of HPLC testing, as it was unclear as to if they
were productive, and therefore no resources would be wasted on HPLC testing. This way, a
BCA protein assay, with an enzyme assay would give insight into how the biomass growing
was behaving towards the inert carbon source. A Pierce™ BCA Protein Assay Kit was used
to determine the total protein present in the sample. It uses bovine serum albumin (BSA) for
calibration, and works on the biuret reaction principle with a reduction of copper from Cu2+ to
Cu+. It is a colorimetric method where a colour change occurs which is then read by the
microplate reader. This was initially tested on the biofilm samples.
Figure 18. BSA calibration curve for the BCA assay
y = -4E-14x4 + 1E-10x3 - 2E-08x2 + 0,0001x - 0,0023
R² = 0,9998
0,000
0,050
0,100
0,150
0,200
0,250
0,300
0,350
0 500 1000 1500 2000 2500
Ab
sorb
an
ce
Protein (µg/mL)
BSA calibration curve
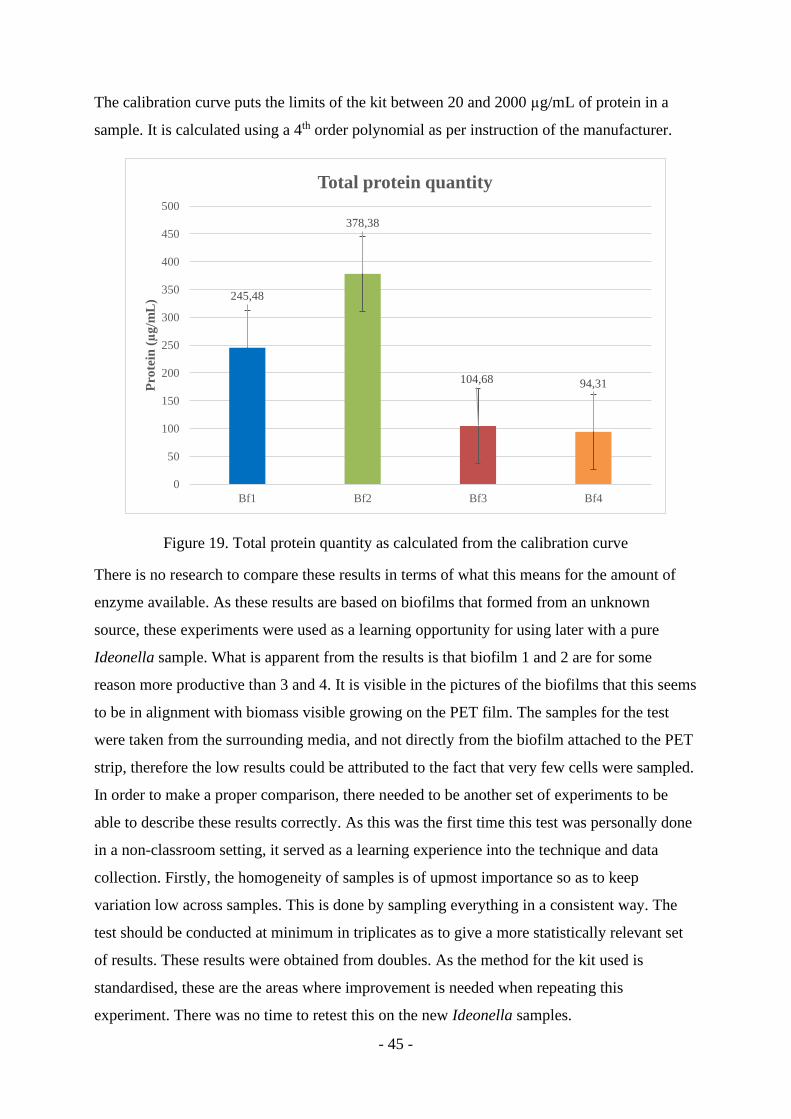
- 45 -
The calibration curve puts the limits of the kit between 20 and 2000 µg/mL of protein in a
sample. It is calculated using a 4th order polynomial as per instruction of the manufacturer.
Figure 19. Total protein quantity as calculated from the calibration curve
There is no research to compare these results in terms of what this means for the amount of
enzyme available. As these results are based on biofilms that formed from an unknown
source, these experiments were used as a learning opportunity for using later with a pure
Ideonella sample. What is apparent from the results is that biofilm 1 and 2 are for some
reason more productive than 3 and 4. It is visible in the pictures of the biofilms that this seems
to be in alignment with biomass visible growing on the PET film. The samples for the test
were taken from the surrounding media, and not directly from the biofilm attached to the PET
strip, therefore the low results could be attributed to the fact that very few cells were sampled.
In order to make a proper comparison, there needed to be another set of experiments to be
able to describe these results correctly. As this was the first time this test was personally done
in a non-classroom setting, it served as a learning experience into the technique and data
collection. Firstly, the homogeneity of samples is of upmost importance so as to keep
variation low across samples. This is done by sampling everything in a consistent way. The
test should be conducted at minimum in triplicates as to give a more statistically relevant set
of results. These results were obtained from doubles. As the method for the kit used is
standardised, these are the areas where improvement is needed when repeating this
experiment. There was no time to retest this on the new Ideonella samples.
245,48
378,38
104,68 94,31
0
50
100
150
200
250
300
350
400
450
500
Bf1 Bf2 Bf3 Bf4
Pro
tein
(µ
g/m
L)
Total protein quantity
- 46 -
The enzyme assay used was from (Salgado et al., 2019), and its purpose was to determine the
unites of enzyme per mL of solution. This, coupled with the BCA protein assay would give a
clearer picture into the activity of the biofilm growing on the PET strip. This enzyme assay
used was suggested as it had been used to determine esterase activity which would be present
if the biofilm was degrading the PET. The assay was colorimetric and functions on a principle
of cleaving the ester bond in the p-nitrophenyl butyrate(p-NPB) which was the substrate. This
would produce p-nitrophenol which colours yellow and can be detected with a microplate
reader.
Figure 20. Enzyme assay calibration curve
The calibration curve was created to measure between 10-100mM concentration of p-
nitrophenol. This was decided on after a discussion, both to test how the biofilms would react
to it, and to learn how to perform the method.
y = -5E-06x2 + 0,0012x - 0,0008
R² = 0,9951
0,000
0,010
0,020
0,030
0,040
0,050
0,060
0,070
0,080
0,090
0 20 40 60 80 100 120
Ab
sorb
an
ce
p-nitrophenol conc/ mM
Enzyme assay calibration
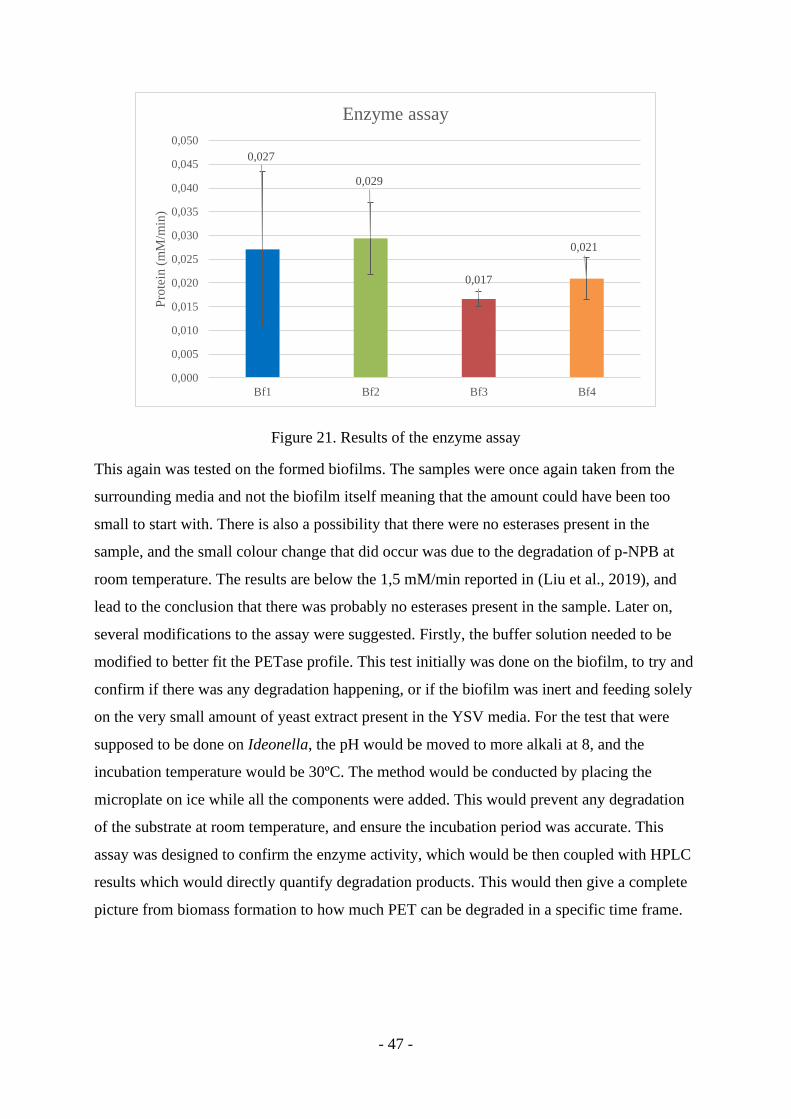
- 47 -
Figure 21. Results of the enzyme assay
This again was tested on the formed biofilms. The samples were once again taken from the
surrounding media and not the biofilm itself meaning that the amount could have been too
small to start with. There is also a possibility that there were no esterases present in the
sample, and the small colour change that did occur was due to the degradation of p-NPB at
room temperature. The results are below the 1,5 mM/min reported in (Liu et al., 2019), and
lead to the conclusion that there was probably no esterases present in the sample. Later on,
several modifications to the assay were suggested. Firstly, the buffer solution needed to be
modified to better fit the PETase profile. This test initially was done on the biofilm, to try and
confirm if there was any degradation happening, or if the biofilm was inert and feeding solely
on the very small amount of yeast extract present in the YSV media. For the test that were
supposed to be done on Ideonella, the pH would be moved to more alkali at 8, and the
incubation temperature would be 30ºC. The method would be conducted by placing the
microplate on ice while all the components were added. This would prevent any degradation
of the substrate at room temperature, and ensure the incubation period was accurate. This
assay was designed to confirm the enzyme activity, which would be then coupled with HPLC
results which would directly quantify degradation products. This would then give a complete
picture from biomass formation to how much PET can be degraded in a specific time frame.
0,027
0,029
0,017
0,021
0,000
0,005
0,010
0,015
0,020
0,025
0,030
0,035
0,040
0,045
0,050
Bf1 Bf2 Bf3 Bf4
Pro
tein
(m
M/m
in)
Enzyme assay
- 48 -
3.4.2 Solvent experiment
The purpose of the solvent experiment was to gravimetrically determine the degradation of
PET powder which would be used in future experiments. As well as quantifying the biomass
that would form around it. As other research has shown, the particle size of the PET is, next to
crystallinity, one of the most important factors in speeding up degradation. The smaller the
particle size, the higher the surface area for degradation, and also the higher the chance that
more of the crystalline structure was affected and become more amorphous, and therefore
more available. Due to the plan being to use cells in degradation experiments, and the fact that
I. sakaiensis forms a biofilm, there was an additional step needed to separate the biomass
from the PET powder. As shown in the powder production, the powder produced was as fine
as down to 50µm, and would not be visually distinguishable from the biomass surrounding it.
(Farzi et al., 2019) suggested using an organic solvent to separate PET powder from the
biomass. The organic solvent would disrupt the cell walls and leave the powder which would
be retained on the filter paper. There were several considerations to be had in this situation.
Firstly, organic solvents can dissolve PET. In this case, chloroform was used as it is a widely
available organic solvent in the laboratory, as opposed to the toluene suggested in the original
paper, and would give a starting point in testing other organic solvents. A simple test of just
the PET powder and chloroform was done as described in the methods, to test the recovery of
the powder and how it reacts with the powder in general. During the experiment, the PET
powder did not show signs of dissolving. A Teflon filter was used in conjunction with a
vacuum pump to filter the chloroform from the powder. The PET powder proved very
cumbersome to work with as it distributed along any surface it touches. It was difficult to
flush out from the glass container it was in with chloroform, and it was difficult to flush down
the sides of the filtering funnel. The test was conducted in triplicates and all of them had
issues in powder recovery. The necessity of working in a fume cupboard due to the toxicity of
chloroform, proved as unwieldly and restrictive. The powder was not recovered in a capacity
that can be quantified. And after the experiment it was decided that using an organic solvent
does not align with the sustainable goals of this project. As the waste produced would require
special management and would waste many resources. It was suggested that for further
experiments a different approach to separating the biomass from the PET powder could be
done with a simple lysing buffer that would not be in danger of reacting with the PET.
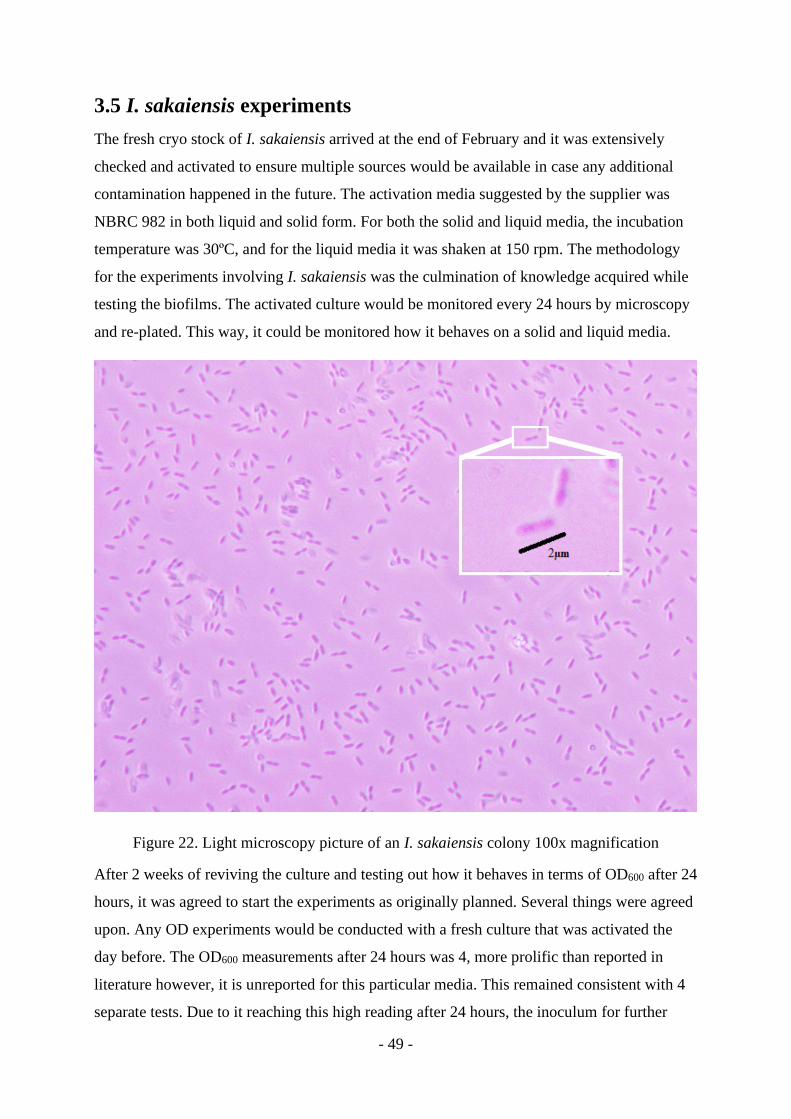
- 49 -
3.5 I. sakaiensis experiments
The fresh cryo stock of I. sakaiensis arrived at the end of February and it was extensively
checked and activated to ensure multiple sources would be available in case any additional
contamination happened in the future. The activation media suggested by the supplier was
NBRC 982 in both liquid and solid form. For both the solid and liquid media, the incubation
temperature was 30ºC, and for the liquid media it was shaken at 150 rpm. The methodology
for the experiments involving I. sakaiensis was the culmination of knowledge acquired while
testing the biofilms. The activated culture would be monitored every 24 hours by microscopy
and re-plated. This way, it could be monitored how it behaves on a solid and liquid media.
Figure 22. Light microscopy picture of an I. sakaiensis colony 100x magnification
After 2 weeks of reviving the culture and testing out how it behaves in terms of OD600 after 24
hours, it was agreed to start the experiments as originally planned. Several things were agreed
upon. Any OD experiments would be conducted with a fresh culture that was activated the
day before. The OD600 measurements after 24 hours was 4, more prolific than reported in
literature however, it is unreported for this particular media. This remained consistent with 4
separate tests. Due to it reaching this high reading after 24 hours, the inoculum for further
- 50 -
testing would be diluted to a 0.1 reading as a starting point. And with different liquid media
tested, the solid equivalent would be used as well. This way it could be monitored if the
morphology of cells changed depending on the availability of carbon sources in the media.
To be able to test multiple media over a short span of time, microplates were used. It was
possible to conduct 2 separate experiments. The first one ran for 24 hours, and the second for
16 hours as it was started the day before the lockdown officially started in Denmark. These
first experiments were done to determine which media I. sakaiensis could be activated in, in a
large enough number, and would be the activation media of choice moving forward.
Additional tests using PET powder in the liquid media were scheduled to see how that
affected the growth rate, but were unable to be conducted. All of the samples were tested in
triplicates, including every blank for each media type. These values were then subtracted from
the values given by samples in order to have a true reading of the samples.
In the first microplate experiment, 12 variations on media were tested. As addition to the
minimal medias, an addition of 1g/L of adipic acid, or maltose were added as that was stated
as 2 of the simple carbon sources I. sakaiensis can assimilate. The media were the following:
LB, NBRC 982, YSV, M9+, M9+ and adipic acid, M9+ and maltose, M9, M9 and adipic acid,
M9 and maltose, H2O, H2O and adipic acid and finally H2O and maltose. The microplate was
spun at 180 cpm, 30ºC, read at 600 nm every 15 minutes for 24 hours. The organism was
activated from a swab on a plate in liquid NBRC 982 24 hours before the start of the
experiment, when checked it had a reading of OD600 4. The inoculum was the calculated to
dilute down to 0.1 when added to the microplate wells. Inoculum size was 10% in a 200µL
working volume. This left 60% of headspace in each well. The microplate was covered in an
optically compatible anaerobic film. An aerobic film was tested with just water in the wells
and it obstructed the readings as it was not clear. Therefore, it was decided the headspace
available would be sufficient for the duration of the experiment. A sample of the activation
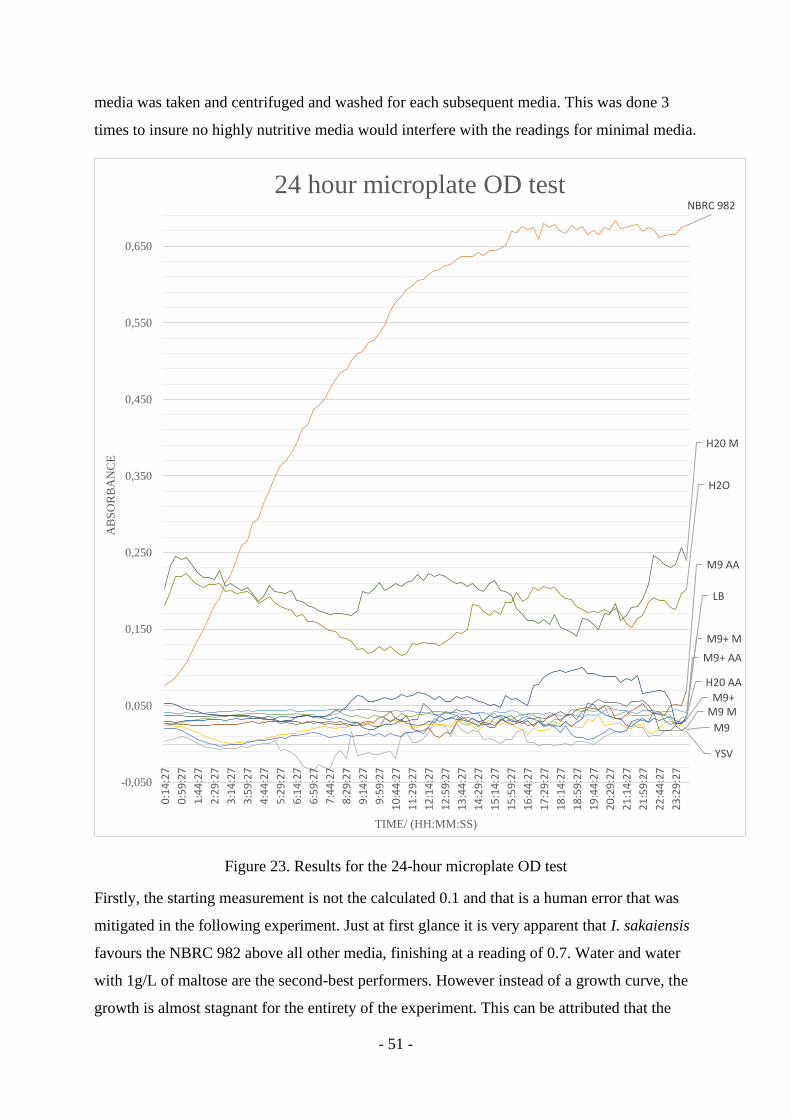
- 51 -
media was taken and centrifuged and washed for each subsequent media. This was done 3
times to insure no highly nutritive media would interfere with the readings for minimal media.
Figure 23. Results for the 24-hour microplate OD test
Firstly, the starting measurement is not the calculated 0.1 and that is a human error that was
mitigated in the following experiment. Just at first glance it is very apparent that I. sakaiensis
favours the NBRC 982 above all other media, finishing at a reading of 0.7. Water and water
with 1g/L of maltose are the second-best performers. However instead of a growth curve, the
growth is almost stagnant for the entirety of the experiment. This can be attributed that the
LB
NBRC 982
YSV
M9
M9+ AA
M9+ M
M9+
M9 AA
M9 M
H2O
H20 AA
H20 M
-0,050
0,050
0,150
0,250
0,350
0,450
0,550
0,650
0:1
4:2
7
0:5
9:2
7
1:4
4:2
7
2:2
9:2
7
3:1
4:2
7
3:5
9:2
7
4:4
4:2
7
5:2
9:2
7
6:1
4:2
7
6:5
9:2
7
7:4
4:2
7
8:2
9:2
7
9:1
4:2
7
9:5
9:2
7
10
:44
:27
11
:29
:27
12
:14
:27
12
:59
:27
13
:44
:27
14
:29
:27
15
:14
:27
15
:59
:27
16
:44
:27
17
:29
:27
18
:14
:27
18
:59
:27
19
:44
:27
20
:29
:27
21
:14
:27
21
:59
:27
22
:44
:27
23
:29
:27
AB
SO
RB
AN
CE
TIME/ (HH:MM:SS)
24 hour microplate OD test
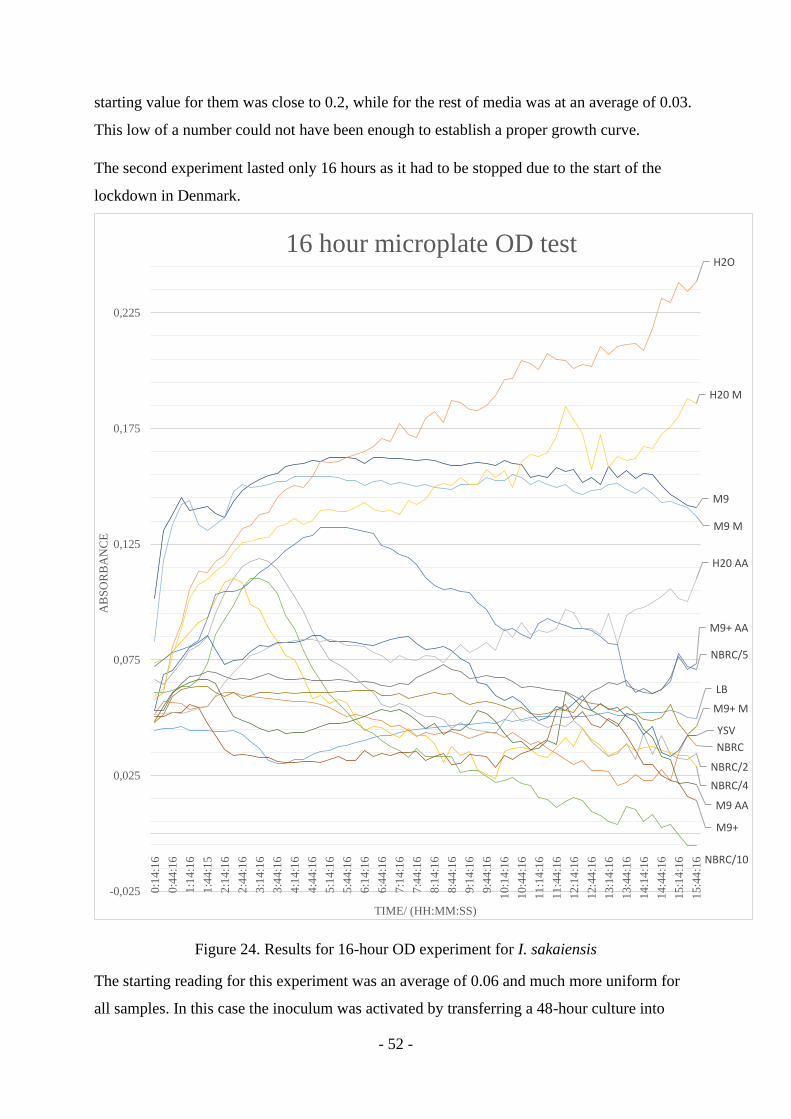
- 52 -
starting value for them was close to 0.2, while for the rest of media was at an average of 0.03.
This low of a number could not have been enough to establish a proper growth curve.
The second experiment lasted only 16 hours as it had to be stopped due to the start of the
lockdown in Denmark.
Figure 24. Results for 16-hour OD experiment for I. sakaiensis
The starting reading for this experiment was an average of 0.06 and much more uniform for
all samples. In this case the inoculum was activated by transferring a 48-hour culture into
LB
NBRC
NBRC/2
NBRC/4
NBRC/5
NBRC/10
YSV
M9+
M9+ AA
M9+ M
M9
M9 AA
M9 M
H2O
H20 AA
H20 M
-0,025
0,025
0,075
0,125
0,175
0,225
0:1
4:1
6
0:4
4:1
6
1:1
4:1
6
1:4
4:1
5
2:1
4:1
6
2:4
4:1
6
3:1
4:1
6
3:4
4:1
6
4:1
4:1
6
4:4
4:1
6
5:1
4:1
6
5:4
4:1
6
6:1
4:1
6
6:4
4:1
6
7:1
4:1
6
7:4
4:1
6
8:1
4:1
6
8:4
4:1
6
9:1
4:1
6
9:4
4:1
6
10:1
4:1
6
10:4
4:1
6
11:1
4:1
6
11:4
4:1
6
12:1
4:1
6
12:4
4:1
6
13:1
4:1
6
13:4
4:1
6
14:1
4:1
6
14:4
4:1
6
15:1
4:1
6
15:4
4:1
6
AB
SO
RB
AN
CE
TIME/ (HH:MM:SS)
16 hour microplate OD test
- 53 -
fresh NBRC 982 media and left for 24 hours. It had a reading of OD 4 the day of the
experiment. However, it seems to not have been as active. If this experiment was repeated the
activation would be done as it was done for the 24-hour experiment. As NBRC 982 was the
preferred media in the first experiment, this time it was diluted 2, 4, 5 and 10 times. This was
done to determine at which point Ideonella would maintain the growth but the media could be
diluted. It seems to increase in biomass for the first 3 hours when it peaks and starts a steep
decline. However, for the original NBRC it maintains the starting reading and starts to decline
after 2 hours. The inoculum for NBRC samples was not centrifuged and washed like the
others but taken directly from the activation vessel. This could have affected the reading as
some cell debris and inhibiting factors produced by the original media would not be washed
out. It seems to respond to the 2 times diluted media well however the 10 times diluted is not
significantly enough low to be discounted. These experiments would have to be repeated with
these corrections. The highest results this time come from the water and water with 1g/L
maltose samples. It seems to be able to sustain itself in just water very well, however, this can
be due to it being activated in a highly nutritive media for 24 hours previously. In this setup it
does not seem to respond positively to the YSV and minimum medias constructed. I.
sakaiensis was originally isolated from a soil sample on a plastic waste landfill. This would
imply a lack of nutrients available in its surroundings. An improvement to this experiment
would be the inclusion of CFU and dry cell weight to correctly identify the number of cells
present in a sample. OD in this case was used as a quick approximation from which other
experiments could be established.
4 Future perspectives
Due to the untimely end of the project, the future perspectives do not only reflect the
developments in the I. sakaiensis research, but what this project in particular was supposed to
develop into as well.
4.1 Project plans
This project was supposed to continue onto testing how particle size affects the degradation
rate. Previous research has shown that the smaller the size of the PET powder, the higher the
degradation rate, however, these studies were done using the purified PETase enzyme. This
project in particular would test how the rate would change when the whole organism was
- 54 -
utilised instead. The crystallinity of PET powder would also change based on what the
powder was made from. This would also give insight into how the degradation rate changed
based on crystallinity. This was again tested on the purified PETase, and it showed the lower
the crystallinity, the higher the degradation rate. Additionally, it was planned to test how
changing the pH and salinity of the media would affect the degradation rate. It was generally
acknowledged that increasing the biomass of I. sakaiensis would lead to a higher degradation
rate due to a higher number of biofilm constituents. Therefore, the research would focus on
optimising the growth conditions for the organism. As Ideonella forms biofilms, there were
plans on exploring how quorum sensing (QS) functions as a mechanism of social interaction
between bacteria, especially in biofilms(Y. H. Li & Tian, 2012). Research on QS would
provide insight into if the activity of the biofilm may be influenced to increase biodegradation
of PET. Finally, there were plans on looking into the exact mechanism with which I.
sakaiensis uses its special appendages to attach itself to the PET. In terms of how do they
form, and how the protein composition changes in the early and late stages of the biofilm.
This project would aim to make a more complete picture of how I. sakaiensis grows and can
be influenced to better degrade PET, without using molecular methods to enhance it.
4.2 PEF as a substitute for PET
PEF is a polyester equivalent to PET. It is constructed with 2,5-furandicarboxylic acid and
can be produced from polysaccharides and sugars. It may present a 100% bio-based polyester
as opposed to petrochemically produced PET. It has also proven to be both food safe, and
more appropriate for storing both carbonated and noncarbonated drinks(Hoppe et al., 2018).
PEF is also reported to be hydrolysed 1.7 times faster than PET. Alongside being more readily
hydrolysed, it seems to have a more gradual decrease in degradation and crystallinity rises as
opposed to PET which has a drastic fall in degradation as the crystallinity rises(S. Weinberger
et al., 2017).
Due to the structural similarities between PEF and PET it was hypothesised that IsPETase
may be able to hydrolyse it. And as expected, during experiments, it was not only able to
hydrolyse the amorphous regions of PET, it seemed to have an even greater effect on the PEF
samples(Austin et al., 2018).
Future perspectives of PEF would involve both optimising its production, while also focusing
on developing a polymer that would at the end of its life be more susceptible to enzymatic
degradation. And simultaneously, optimising enzymes that would more readily affect the
- 55 -
crystalline structure of the backbone. These lines of research are imperative in order to close
the circular economy loop.
As stated before, the future of research as it pertains to I. sakaiensis and PETase and
MHETase is leading towards using molecular biology tools in order to optimise degradation
ability. This includes improving thermal stability and affinity for substrate. As well as testing
which other polymers would also be affected by the enzymes. An important aspect of future
research is developing an enzyme with a new substrate in mind, a parallel research line of
creating new material which will then be processed by it. This way solving a problem before
it is created.
5 Conclusion
The goals this project set out to meet were not accomplished. Starting from the contamination
and trying to separate the I. sakaiensis from the numerous contaminants which did not work.
The biofilms that did form on the plastic were not confirmed to be plastic degraders, and by
the point the lockdown started, the decision was to leave them to enrich till the end of the
project, in hopes that they will produce an consortia of interest that would be enriched for
PET degradation. The true value of the experiments done in that time frame was the personal
development in terms of planning experiments, gaining practical understanding of making
media, plating technique, and efficiency of time. As well as updating the understanding of
classical techniques and how they can be used to compliment molecular techniques.
During this time, gaining better understanding into methods such as protein and enzyme
assays, and how the method changes based on the need of the project, and what parameters of
the method must change to fit the scope of the project. Some kits were standardised, such as
the BCA total protein assay, but personally conducting the tests was valuable experience. The
enzyme assay first suggested was due to it being widely used in the laboratory, but upon
experimenting with it, it was apparent it would have to be adapted to fit this project. However,
some parts were transferable in terms of handling, order of operations, and the importance of
precision and consistency were highlighted. The use of the microplate in these tests gave raise
to the idea of using the microplate reader to conduct a large series of OD tests using it as well.
As it would be possible to test many variables in a shorter amount of time. This means a
development of knowledge of the machines used in the laboratory as well.
- 56 -
Creating PET powder from an array of sources also proved a long process. This particular
aspect of the project involved research into specific chemistry and physics of polymers, how
they were affected by abiotic conditions and different mechanical forces. However, this also
involved research into the mechanics of different types of mills and the forces that they
exerted on specific material. This led to several conclusions. PET must be cooled to its brittle
point with liquid nitrogen in order to properly shatter when milled. This cooling process must
also be done in a way where the PET is not exposed to moisture as it will start absorbing it,
making it harder to mill. The mechanical forces produced by small scale mills are enough to
generate thermal friction that brought PET to its glass transition point and melted it onto the
sides of the milling components. A small-scale ball mill is an inappropriate type of mill to use
as it does not have the correct shearing forces necessary to mill plastic. PET powder sticks to
surfaces after it is milled, be it the surface of the mill itself, or any container it is deposited in,
making it extremely difficult to contain properly. The shape of the powder is determined by
the shape of the feedstock. If powder is produced from a film, it will come out more jagged,
but if it produced from pellets it will be more rounded. If the powder is improperly milled, it
will burn and turn a grey colour. And finally, the crystallinity of PET is affected by the
milling process. It needs to be retested after the powder is produced to ensure which
crystallinity was produced.
When the fresh batch of I. sakaiensis was acquired, it was very necessary to keep a number of
cryo stocks to insure there was always a pure culture available. As well as, each step of the
way, the culture would be streaked onto the plate, and it would be monitored for any
morphological changes. According to the OD test that were conducted on it, I. sakaiensis very
clearly prefers NBRC 982, which is the suggested activation media. However, it seems to
positively respond to water and water with added maltose, but these experiments must be
repeated to validate completely. Due to a small amount of data available, it is unclear if it
prefers this because it is an oligotroph that can survive in very low nutritive media, or simply
because the components of the minimal media used were actively impeding on its growth and
in water it was just surviving on leftover energy from the activation media. One would
suggest that water and additional carbon source with PET would be good enough for growths,
while the other suggests that the minimal media was impeding on growth and therefore
artificially enhancing the perception of water as a suitable media.
In conclusion, even as the goals of the project were not made, in the larger overview of the
topic of plastic waste management, a system using I. sakaiensis as a set-up for plastic
- 57 -
degradation, without any molecular biology tools used to enhance it in some way, is not a
sustainable system. The bacteria degrade the plastic by breaking it down into monomers and
then utilising the monomers for its own metabolism, and producing CO2 as an end product.
This does not align with a circular economy plan, as the bacteria does not produce monomers
that are released into the media and can be collected. The cell system should be explored fully
to uncover all the details on how it operates, and give insight into how it can be enhanced for
the purpose of obtaining the monomers. As plastic production shows no signs of stopping,
providing the market with monomers extracted from plastic that was already created, is an
example of a circular economy system that will ultimately present a more sustainable
approach to an industry that is so fully integrated into and integral for the functioning of
modern society.
- 58 -
6 Bibliography
Ahmed, T., Shahid, M., Azeem, F., Rasul, I., Shah, A. A., Noman, M., Hameed, A., Manzoor,
N., Manzoor, I., & Muhammad, S. (2018). Biodegradation of plastics: current scenario
and future prospects for environmental safety. In Environmental Science and Pollution
Research (Vol. 25, Issue 8, pp. 7287–7298). https://doi.org/10.1007/s11356-018-1234-9
ASTM D7611 / D7611M-20. (2020). Standard Practice for Coding Plastic Manufactured
Articles for Resin Identification (Patent No. CS Number Code 83.140.01 (Rubber and
plastic products in general)). https://doi.org/10.1520/D7611_D7611M-20
Austin, H. P., Allen, M. D., Donohoe, B. S., Rorrer, N. A., Kearns, F. L., Silveira, R. L.,
Pollard, B. C., Dominick, G., Duman, R., Omari, K. El, Mykhaylyk, V., Wagner, A.,
Michener, W. E., Amore, A., Skaf, M. S., Crowley, M. F., Thorne, A. W., Johnson, C.
W., Lee Woodcock, H., … Beckham, G. T. (2018). Characterization and engineering of
a plastic-degrading aromatic polyesterase. Proceedings of the National Academy of
Sciences of the United States of America, 115(19), E4350–E4357.
https://doi.org/10.1073/pnas.1718804115
Bach, C., Dauchy, X., & Etienne, S. (2009). Characterization of poly(ethylene terephthalate)
used in commercial bottled water. IOP Conference Series: Materials Science and
Engineering, 5. https://doi.org/10.1088/1757-899X/5/1/012005
Barnes, D. K. A., Galgani, F., Thompson, R. C., & Barlaz, M. (2009). Accumulation and
fragmentation of plastic debris in global environments. Philosophical Transactions of the
Royal Society B: Biological Sciences, 364(1526), 1985–1998.
https://doi.org/10.1098/rstb.2008.0205
BCRC. (n.d.). BCRC Strain Collection. Retrieved April 28, 2020, from
https://catalog.bcrc.firdi.org.tw/BcrcContent?bid=81045
Bengtsson, S., Pisco, A. R., Johansson, P., Lemos, P. C., & Reis, M. A. M. (2010). Molecular
weight and thermal properties of polyhydroxyalkanoates produced from fermented sugar
molasses by open mixed cultures. Journal of Biotechnology, 147(3–4), 172–179.
https://doi.org/10.1016/j.jbiotec.2010.03.022
- 59 -
Betts, R. (2014). The Food Safety Modernization Act — Global Impacts for Microbiological
Food Safety. Culture, 36(1), 6.
http://tools.thermofisher.com/content/sfs/brochures/Culture-36-1-FSMA-
Microbiological-Impacts-LT2215A.pdf
Brooks, A. L., Wang, S., & Jambeck, J. R. (2018). The Chinese import ban and its impact on
global plastic waste trade. Science Advances, 4(6), eaat0131.
https://doi.org/10.1126/sciadv.aat0131
Carbios. (2019). Nestlé Waters, PepsiCo and Suntory Beverage & Food Europe join
consortium founded by Carbios and L’Oréal to support the world’s first enzymatic
technology for the recycling of plastics. Carbios News, 1–4. Retrieved May 29,2020,
from, https://carbios.fr/en/nestle-waters-pepsico-and-suntory-beverage-food-europe-join-
consortium-founded-by-carbios-and-loreal-to-support-the-worlds-first-enzymatic-
technology-for-the-recycling-of-plastic/
Cowan, S. T., Barrow, G. I., Steel, K. J., & Feltham, R. K. A. (2004). Cowan and Steel’s
Manual for the Identification of Medical Bacteria (G. I. Barrow & R. K. A. Feltham
(Eds.); Revised Th). Cambridge University Press.
https://books.google.dk/books?id=ZAZ-zI_PCqcC
Danso, D., Chow, J., & Streita, W. R. (2019). Plastics: Environmental and biotechnological
perspectives on microbial degradation. Applied and Environmental Microbiology,
85(19), 1–14. https://doi.org/10.1128/AEM.01095-19
Derraik, J. G. B. (2002). The pollution of the marine environment by plastic debris: A review.
In Marine Pollution Bulletin (Vol. 44, Issue 9, pp. 842–852).
https://doi.org/10.1016/S0025-326X(02)00220-5
Eberl, A., Heumann, S., Brückner, T., Araujo, R., Cavaco-Paulo, A., Kaufmann, F., Kroutil,
W., & Guebitz, G. M. (2009). Enzymatic surface hydrolysis of poly(ethylene
terephthalate) and bis(benzoyloxyethyl) terephthalate by lipase and cutinase in the
presence of surface active molecules. Journal of Biotechnology, 143(3), 207–212.
https://doi.org/10.1016/j.jbiotec.2009.07.008
Editorial team. (2018). Plastics Insight. Retrieved April 29, 2020, from
https://www.plasticsinsight.com/top-marine-litter-items-found-in-european-beaches-
2016/
- 60 -
EU (European Union). (2018). COMMUNICATION FROM THE COMMISSION TO THE
EUROPEAN PARLIAMENT, THE COUNCIL, THE EUROPEAN ECONOMIC AND
SOCIAL COMMITTEE AND THE COMMITTEE OF THE REGIONS A European
Strategy for Plastics in a Circular Economy. https://ec.europa.eu/environment/circular-
economy/pdf/plastics-strategy.pdf
EU (European Union). (2019). DIRECTIVE (EU) 2019/904 OF THE EUROPEAN
PARLIAMENT AND OF THE COUNCIL of 5 June 2019 on the reduction of the impact
of certain plastic products on the environment. In Official Journal of the European
Union 155 (Vol. 155, Issue June, pp. 1–19). https://eur-lex.europa.eu/legal-
content/EN/TXT/PDF/?uri=CELEX:32019L0904&from=EN
Farzi, A., Dehnad, A., & Fotouhi, A. F. (2019). Biodegradation of polyethylene terephthalate
waste using Streptomyces species and kinetic modeling of the process. Biocatalysis and
Agricultural Biotechnology, 17(October 2018), 25–31.
https://doi.org/10.1016/j.bcab.2018.11.002
Gamerith, C., Zartl, B., Pellis, A., Guillamot, F., Marty, A., Acero, E. H., & Guebitz, G. M.
(2017). Enzymatic recovery of polyester building blocks from polymer blends. Process
Biochemistry, 59, 58–64. https://doi.org/10.1016/j.procbio.2017.01.004
Høngaard Andersen, P., Duvold, T., Frølund, B., Lüneborg, J., Toft-Petersen, K.,
Vanthournout, H., & Witte, C. (2019). THE NEW PLASTICS ECONOMY:A Research,
Innovation, and Business opportunity for Denmark (Issue January).
https://innovationsfonden.dk/sites/default/files/2019-01/new-plastics-report-jan16-2019-
vf.pdf
Hoppe, M., Voogt, P. De, & Franz, R. (2018). Oligomers in polyethylene furanoate-
identification and quantification approach via lc-uv lc-ms response ratio. Food Additives
and Contaminants - Part A Chemistry, Analysis, Control, Exposure and Risk Assessment,
35(11), 2244–2255. https://doi.org/10.1080/19440049.2018.1523576
Horodytska, & A. C. (2019). Plastic Waste Management: Current Status and Weaknesses.
Handbook of Environmental Chemistry. https://doi.org/10.1007/698
Horodytska, O., Cabanes, A., & Fullana, A. (2019). Plastic Waste Management: Current
Status and Weaknesses. In The Handbook of Environmental Chemistry (pp. 1–18).
Springer, Berlin, Heidelberg. https://doi.org/10.1007/698_2019_408
- 61 -
Jambeck, J. R., Geyer, R., Wilcox, C., Siegler, T. R., Perryman, M., Andrady, A., Narayan,
R., & Law, K. L. (2015). Plastic waste inputs from land into the ocean. Science,
347(6223), 768–771. https://doi.org/10.1126/science.1260352
Joo, S., Cho, I. J., Seo, H., Son, H. F., Sagong, H. Y., Shin, T. J., Choi, S. Y., Lee, S. Y., &
Kim, K. J. (2018). Structural insight into molecular mechanism of poly(ethylene
terephthalate) degradation. Nature Communications, 9(1).
https://doi.org/10.1038/s41467-018-02881-1
LB Broth Media Recipe. (2013). Retrieved April 23, 2020. from
http://www.thelabrat.com/protocols/11.shtml
Li, W. C., Tse, H. F., & Fok, L. (2016). Plastic waste in the marine environment: A review of
sources, occurrence and effects. In Science of the Total Environment (Vols. 566–567, pp.
333–349). Elsevier B.V. https://doi.org/10.1016/j.scitotenv.2016.05.084
Li, Y. H., & Tian, X. (2012). Quorum sensing and bacterial social interactions in biofilms.
Sensors, 12(3), 2519–2538. https://doi.org/10.3390/s120302519
Liu, C., Shi, C., Zhu, S., Wei, R., & Yin, C. C. (2019). Structural and functional
characterization of polyethylene terephthalate hydrolase from Ideonella sakaiensis.
Biochemical and Biophysical Research Communications, 508(1), 289–294.
https://doi.org/10.1016/j.bbrc.2018.11.148
M9 Minimal Media Recipe ( 1000 ml ). Retrieved April 20, 2020, from
http://www.thelabrat.com/protocols/m9minimal.shtml
Malmqvist, Å., Welander, T., Moore, E., Ternström, A., Molin, G., & Stenström, I. M.
(1994). Ideonella dechloratans gen.nov., sp.nov., a New Bacterium Capable of Growing
Anaerobically with Chlorate as an Electron Acceptor. Systematic and Applied
Microbiology, 17(1), 58–64. https://doi.org/10.1016/S0723-2020(11)80032-9
Montalto Monella, L. (2020). Will plastic pollution get worse after the COVID-19 pandemic?
Euronews. Retrieved June 1, 2020, from, https://www.euronews.com/2020/05/12/will-
plastic-pollution-get-worse-after-the-covid-19-pandemic
Montello S.p.A. (n.d.). Packaging selection plant - Montello S.p.A. Retrieved June 2, 2020,
from http://www.montello-spa.it/packaging-selection-plant/?lang=en
- 62 -
Müller, R. J., Schrader, H., Profe, J., Dresler, K., & Deckwer, W. D. (2005). Enzymatic
degradation of poly(ethylene terephthalate): Rapid hydrolyse using a hydrolase from T.
fusca. Macromolecular Rapid Communications, 26(17), 1400–1405.
https://doi.org/10.1002/marc.200500410
NextChem. (n.d.). MyReplast Upcycling | Nextchem. Retrieved June 2, 2020, from
https://nextchem.it/what-we-do/technologies/myreplast-cycling
Palanisamy, N., Ragunathan, R., Pandiyaraj, K. N., & Muralidharan, V. S. (2011).
Investigation on biodegradability of polyethylene by Bacillus cereus strain Ma-Su
isolated from compost. International Research Journal of Microbiology (IRJM), 2(8),
292–302.
Palm, G. J., Reisky, L., Böttcher, D., Müller, H., Michels, E. A. P., Walczak, M. C., Berndt,
L., Weiss, M. S., Bornscheuer, U. T., & Weber, G. (2019). Structure of the plastic-
degrading Ideonella sakaiensis MHETase bound to a substrate. Nature Communications,
10(1), 1–10. https://doi.org/10.1038/s41467-019-09326-3
Pathak, V. M., & Navneet. (2017). Review on the current status of polymer degradation: a
microbial approach. Bioresources and Bioprocessing, 4(1).
https://doi.org/10.1186/s40643-017-0145-9
Polymer Database. (2015a). Properties of Chloropolymers. Polymer Properties Database.
Retrieved April 30, from, https://polymerdatabase.com/polymer classes/Polychloroolefin
type.html
Polymer Database. (2015b). Properties of Polyamides. Polymer Properties Database.
Retrieved April 30, from, https://polymerdatabase.com/polymer classes/Polyamide
type.html
Polymer Database. (2015c). Properties of Polyesters. Polymer Properties Database. Retrieved
April 30, from, https://polymerdatabase.com/polymer classes/Polyester type.html
Polymer Database. (2015d). Properties of Polyolefins. Polymer Properties Database.
Retrieved April 30, from, https://polymerdatabase.com/polymer classes/Polyolefin
type.html#PP
- 63 -
Polymer Database. (2015e). Properties of Polystyrene. Polymer Properties Database.
Retrieved April 30, from, https://polymerdatabase.com/polymer classes/Polystyrene
type.html
Polymer Database. (2017). Properties of Polyurethane. Polymer Properties Database.
Retrieved April 30, from, https://polymerdatabase.com/polymer classes/Polyurethane
type.html
Powers, V. (1993). A National Historic Chemical Landmark The Bakelizer. American
Chemical Society National Historic Chemical Landmarks, 1–2.
https://www.acs.org/content/acs/en/education/whatischemistry/landmarks/bakelite.html#
citation
Quartinello, F., Vajnhandl, S., Volmajer Valh, J., Farmer, T. J., Vončina, B., Lobnik, A.,
Herrero Acero, E., Pellis, A., & Guebitz, G. M. (2017). Synergistic chemo‐enzymatic
hydrolysis of poly(ethylene terephthalate) from textile waste. Microbial Biotechnology,
10(6), 1376–1383. https://doi.org/10.1111/1751-7915.12734
Ragaert, K., Delva, L., & Van Geem, K. (2017). Mechanical and chemical recycling of solid
plastic waste. Waste Management, 69, 24–58.
https://doi.org/10.1016/j.wasman.2017.07.044
Rahimi, A. R., & Garciá, J. M. (2017). Chemical recycling of waste plastics for new materials
production. Nature Reviews Chemistry, 1, 1–11. https://doi.org/10.1038/s41570-017-
0046
Research and Markets. (2020). Global Plastic Additives Market Size Forecast to 2028 -
Trends, Analysis and Outlook by Type, Application, and Geography. Retrieved June 2,
2020, from, https://www.researchandmarkets.com/reports/5028501/global-plastic-
additives-market-size-forecast-
to?utm_source=dynamic&utm_medium=BW&utm_code=6vrl75&utm_campaign=1395
006+-
+Global+Plastic+Additives+Market%3A+Size%2C+Trends+and+Impact+of+COVID-
19+on+Revenue
Ritchie, H., & Roser, M. (2020). Plastic Pollution. In OurWorldInData.org (pp. 115–147).
Retrieved May 5, 2020, from, https://doi.org/10.1142/9781786347435_0005
- 64 -
Sahni, A. (2020). Could COVID-19 worsen the global plastic waste problem? - CGTN.
CGTN. Retrieved June 2, 2020, from, https://news.cgtn.com/news/2020-04-23/Could-
COVID-19-worsen-the-global-plastic-waste-problem--PJmOzLhZYY/index.html
Salgado, V., Fonseca, C., Lopes da Silva, T., Roseiro, J. C., & Eusébio, A. (2019). Isolation
and Identification of Magnusiomyces capitatus as a Lipase-Producing Yeast from Olive
Mill Wastewater. Waste and Biomass Valorization, 1–15.
https://doi.org/10.1007/s12649-019-00725-7
Science of Plastics | Science History Institute. (2019). Science History. Retrieved May 2,
2020, from, https://www.sciencehistory.org/science-of-plastics
Sheppard, D. (2020). Pandemic crisis offers glimpse into oil industry’s future. Financial
Times. Retrieved June 3, 2020, from, https://www.ft.com/content/99fc40be-83aa-11ea-
b872-8db45d5f6714
Sheu, S. Y., Chen, Z. H., Young, C. C., & Chen, W. M. (2016). Ideonella paludis sp. nov.,
isolated from a marsh. International Journal of Systematic and Evolutionary
Microbiology, 66(2), 1052–1057. https://doi.org/10.1099/ijsem.0.000832
Shirke, A. N., White, C., Englaender, J. A., Zwarycz, A., Butterfoss, G. L., Linhardt, R. J., &
Gross, R. A. (2018). Stabilizing Leaf and Branch Compost Cutinase (LCC) with
Glycosylation: Mechanism and Effect on PET Hydrolysis. Biochemistry, 57(7), 1190–
1200. https://doi.org/10.1021/acs.biochem.7b01189
Silva, C. M., Carneiro, F., O’Neill, A., Fonseca, L. P., Cabral, J. S. M., Guebitz, G., &
Cavaco-Paulo, A. (2005). Cutinase - A new tool for biomodification of synthetic fibers.
Journal of Polymer Science, Part A: Polymer Chemistry, 43(11), 2448–2450.
https://doi.org/10.1002/pola.20684
Suranovic, S. (2005). Finance: Chapter 5-3: The Role of Imports in the National Income
Identity. Retrieved April 20, 2020, from, http://internationalecon.com/Finance/Fch5/F5-
3.php
Tanasupawat, S., Takehana, T., Yoshida, S., Hiraga, K., & Oda, K. (2016). Ideonella
sakaiensis sp. nov., isolated from a microbial consortium that degrades poly(ethylene
terephthalate). International Journal of Systematic and Evolutionary Microbiology,
66(8), 2813–2818. https://doi.org/10.1099/ijsem.0.001058
- 65 -
Taniguchi, I., Yoshida, S., Hiraga, K., Miyamoto, K., Kimura, Y., & Oda, K. (2019).
Biodegradation of PET: Current Status and Application Aspects. ACS Catalysis, 9(5),
4089–4105. https://doi.org/10.1021/acscatal.8b05171
Tournier, V., Topham, C. M., Gilles, A., David, B., Folgoas, C., Moya-Leclair, E., Kamionka,
E., Desrousseaux, M. L., Texier, H., Gavalda, S., Cot, M., Guémard, E., Dalibey, M.,
Nomme, J., Cioci, G., Barbe, S., Chateau, M., André, I., Duquesne, S., & Marty, A.
(2020). An engineered PET depolymerase to break down and recycle plastic bottles.
Nature, 580(7802), 216–219. https://doi.org/10.1038/s41586-020-2149-4
van der Made, J. (2020a). Does the oil price rollercoaster spell the end of US fracking? Rfi.
Retrieved May 31, 2020, from, http://www.rfi.fr/en/economy/20200425-does-the-oil-
price-rollercoaster-spell-the-end-of-us-fracking-shale-coronavirus-opec
van der Made, J. (2020b). Tsunami of plastic threatens post-Covid-19 world. Rfi. Retrieved
May 31, 2020, from, http://www.rfi.fr/en/business/20200428-coronavirus-environment-
plastic-increase-world-oil-production-crisis
Wagner, R. (2016). Plastics and sustainability: A valuation of environmental benefits, costs
and opportunities for continuous improvement. Web Coating and Handling Conference
2016, WCHC 2016, 1, 210–221. www.trucost.com
Wei, R., Breite, D., Song, C., Gräsing, D., Ploss, T., Hille, P., Schwerdtfeger, R., Matysik, J.,
Schulze, A., & Zimmermann, W. (2019). Biocatalytic Degradation Efficiency of
Postconsumer Polyethylene Terephthalate Packaging Determined by Their Polymer
Microstructures. Advanced Science, 6(14), 1900491.
https://doi.org/10.1002/advs.201900491
Wei, R., Oeser, T., Schmidt, J., Meier, R., Barth, M., Then, J., & Zimmermann, W. (2016).
Engineered bacterial polyester hydrolases efficiently degrade polyethylene terephthalate
due to relieved product inhibition. Biotechnology and Bioengineering, 113(8), 1658–
1665. https://doi.org/10.1002/bit.25941
Weinberger, S., Haernvall, K., Scaini, D., Ghazaryan, G., Zumstein, M. T., Sander, M., Pellis,
A., & Guebitz, G. M. (2017). Enzymatic surface hydrolysis of poly(ethylene furanoate)
thin films of various crystallinities. Green Chemistry, 19(22), 5381–5384.
https://doi.org/10.1039/c7gc02905e
- 66 -
Weinberger, Simone, Canadell, J., Quartinello, F., Yeniad, B., Arias, A., Pellis, A., &
Guebitz, G. (2017). Enzymatic Degradation of Poly(ethylene 2,5-furanoate) Powders and
Amorphous Films. Catalysts, 7(11), 318. https://doi.org/10.3390/catal7110318
Willems, A. (2014). The family Comamonadaceae. In E. Rosenberg, E. F. DeLong, S. Lory,
E. Stackebrandt, & F. Thompson (Eds.), The Prokaryotes: Alphaproteobacteria and
Betaproteobacteria (Vol. 9783642301). Springer Berlin Heidelberg.
https://doi.org/10.1007/978-3-642-30197-1_238
World Health Organisation (WHO). (2018). Health-care waste. https://www.who.int/news-
room/fact-sheets/detail/health-care-waste
Yoshida, S., Hiraga, K., Takehana, T., Taniguchi, I., Yamaji, H., Maeda, Y., Toyohara, K.,
Miyamoto, K., Kimura, Y., & Oda, K. (2016a). A bacterium that degrades and
assimilates poly(ethylene terephthalate). Science, 351(6278), 1196–1199.
https://doi.org/10.1126/science.aad6359
Yoshida, S., Hiraga, K., Takehana, T., Taniguchi, I., Yamaji, H., Maeda, Y., Toyohara, K.,
Miyamoto, K., Kimura, Y., & Oda, K. (2016b). Supplementary Materials for A
bacterium that degrades and assimilates poly(ethylene terephthalate). Science, 351, 1196.
https://doi.org/10.1126/science.aad6359
Yoshida, S., Hiraga, K., Takehana, T., Taniguchi, I., Yamaji, H., Maeda, Y., Toyohara, K.,
Miyamoto, K., Kimura, Y., & Oda, K. (2016c). Response to Comment on “a bacterium
that degrades and assimilates poly(ethylene terephthalate).” Science, 353(6301), 759–
759. https://doi.org/10.1126/science.aaf8625
Zhu, Y. G., Li, Z. Q., Zhang, D., & Tanimoto, T. (2006). Structural changes in poly(ethylene
terephthalate) induced by cryomilling and ambimilling. Journal of Polymer Science, Part
B: Polymer Physics, 44(6), 986–993. https://doi.org/10.1002/polb.20749


![Aalborg Universitet Arcform Allsopp, Benjamin Brink · Arcform Benjamin Brink Allsopp[0000-0002-6992-9171] Aalborg University Copenhagen, Copenhagen SV, Denmark ben@it.edu Abstract](https://img.pdfslide.us/doc/110x75/5fcfec2a97eb46632253265a/aalborg-universitet-arcform-allsopp-benjamin-brink-arcform-benjamin-brink-allsopp0000-0002-6992-9171.jpg)