Embed Size (px)
Citation preview
Aalborg Universitet
Validation of Hydrodynamic Numerical Model of a Pitching Wave Energy Converter
López, Maria del Pilar Heras; Thomas, Sarah; Kramer, Morten Mejlhede
Published in:12th EWTEC - Proceedings of the 12th European Wave and Tidal Energy Conference
Publication date:2017
Document VersionPublisher's PDF, also known as Version of record
Link to publication from Aalborg University
Citation for published version (APA):López, M. D. P. H., Thomas, S., & Kramer, M. M. (2017). Validation of Hydrodynamic Numerical Model of aPitching Wave Energy Converter. In 12th EWTEC - Proceedings of the 12th European Wave and Tidal EnergyConference: 27th Aug -1st Sept 2017, Cork, Ireland [1185] Technical Committee of the European Wave andTidal Energy Conference. European Wave and Tidal Energy Conference Series, No. 2017, Vol.. 12
General rightsCopyright and moral rights for the publications made accessible in the public portal are retained by the authors and/or other copyright ownersand it is a condition of accessing publications that users recognise and abide by the legal requirements associated with these rights.
? Users may download and print one copy of any publication from the public portal for the purpose of private study or research. ? You may not further distribute the material or use it for any profit-making activity or commercial gain ? You may freely distribute the URL identifying the publication in the public portal ?
Take down policyIf you believe that this document breaches copyright please contact us at [email protected] providing details, and we will remove access tothe work immediately and investigate your claim.
Downloaded from vbn.aau.dk on: April 04, 2020
Validation of Hydrodynamic Numerical Model of a
Pitching Wave Energy Converter
Pilar Heras
Dept. of Civil Engineering,
Aalborg University
Floating Power Plant A/S
Sarah Thomas
Floating Power Plant A/S
Morten Kramer
Dept. of Civil Engineering,
Aalborg University
Abstract—Validation of numerical model is essential in thedevelopment of new technologies. Commercial software andcodes available simulating wave energy converters (WECs) havenot been proved to work for all the available and upcomingtechnologies yet. The present paper presents the first stages ofthe validation process of a hydrodynamic numerical model fora pitching wave energy converter. The development of dry tests,wave flume and wave basin experiments are going to be explained,lessons learned shared and results presented.
Index Terms—WEC, wave flume, wave basin, modelling, vali-dation
NOMENCLATURE
A∞ Infinite-frequency Added Mass
B Radiation Damping
C Stiffness
COBx Centre of Buoyancy x coordinate
COGx Centre of Gravity x coordinate
Fb Buoyancy Force
Fexc Excitation Force
Fg Gravity Force
Frad Radiation Force
g Gravity
K Kernel coefficient
M Mass Matrix
t Time
V Volume
ζa Wave amplitude
ρ Density
ω Angular frequency
x(t) Displacement
x(t) Velocity
x(t) Acceleration
I. INTRODUCTION
Significant hydrodynamic interactions occur when bodies
are located close to the ocean surface. For the cases when
linear potential theory is not suitable, numerical models that
consider non-linearities are needed. Commercial software still
have not been validated for enough wave energy devices,
since wave energy is not a mature technology and the lack
of published experimental data is a drawback. Yet numerical
models to estimate loads and motions are essential to bring
wave energy solutions and hybrid devices involving wave
energy to a commercial maturity. This paper presents the early
stages of validation of a F model of a pitching wave energy
converter.
The case study is Floating Power Plant’s wave energy
converter. Floating Power Plant’s device is a semisubmersible
moored platform that hosts one wind turbine and four WECs
(Ref. [1]). The WECs are moving in pitch motion around a
shaft and are located in close proximity either to the main
hull of the platform or to another WEC. This multi-body in-
teraction will show a very interesting hydrodynamic behaviour.
A single scaled WEC has been tested at the facilities of
Aalborg University, in Denmark. Wave flume and wave basin
experiments have been developed with several hydrostatic
cases, surrounding substructures and two different incident
wave angles.
The importance of the input parameters to the model will
be discussed and conclusions drawn.
II. HYDRODYNAMIC NUMERICAL MODEL DESCRIPTION
The forces acting on the wave energy converter are:
• Excitation forces, which are forces on the floating body
when it is restrained from motion and subjected to waves.
• Added mass forces due to having to accelerate the water
along with the floater.
• Damping forces due to the oscillations creating outgoing
waves which radiate energy away from the floater.
• Restoring forces due to bringing the buoyancy/weight
equilibrium back to the floater.
The above forces can be assembled into an equation of
motion:
[
M +A(ω)]
x+B(ω)x+ Cx = Fexc(ω) (1)
Assuming x = aeiωt, Eq.1 can be solved for a and the
response amplitude operator (RAO) is then:
RAO(ω) =a
ζa=
Fexc
C − (M +A(ω))ω2 + iB(ω)ω(2)
11185-
Proceedings of the 12th European Wave and Tidal Energy Conference 27th Aug -1st Sept 2017, Cork, Ireland
ISSN 2309-1983 Copyright © European Wave and Tidal Energy Conference 2017
2017
In the time domain, the model solves the dynamic equation
of motion for a single degree of freedom implementing in
Simulink the following equation:
x =Fexc + Frad + Fb + Fg
M +A∞
(3)
Further details about the forces and equations can be found
in Ref. [2].
A common approach is to use a hybrid frequency-time do-
main model based on Cummins equation with hydrodynamic
inputs coming from linear wave theory (Ref. [3] and Ref. [4]).
WAMIT has been used to obtain the hydrodynamic coefficients
for a range of possible angles of motion, then by interpolation,
the model takes as inputs the coefficients corresponding to
the actual floater position. Later on, linear viscous forces will
be considered to simulate friction effects. The values of the
viscous coefficients have been tuned to match experimental
results.
In the time domain model the radiation force has been
included as a memory function approximated using Prony’s
method (Ref. [5]).
Frad = −A∞x(t)−
∫ t
0
K(t− τ)x(τ)dτ (4)
Also, the buoyancy force is calculated as:
Fb = −ρ · g · V · COBx (5)
And similarly the gravity force is determined by:
Fg = M · g · COGx (6)
III. EXPERIMENTAL INPUTS TO THE NUMERICAL MODEL
A general overview of the experiments is going to be
explained, see Ref. [6] and Ref. [7] for further details.
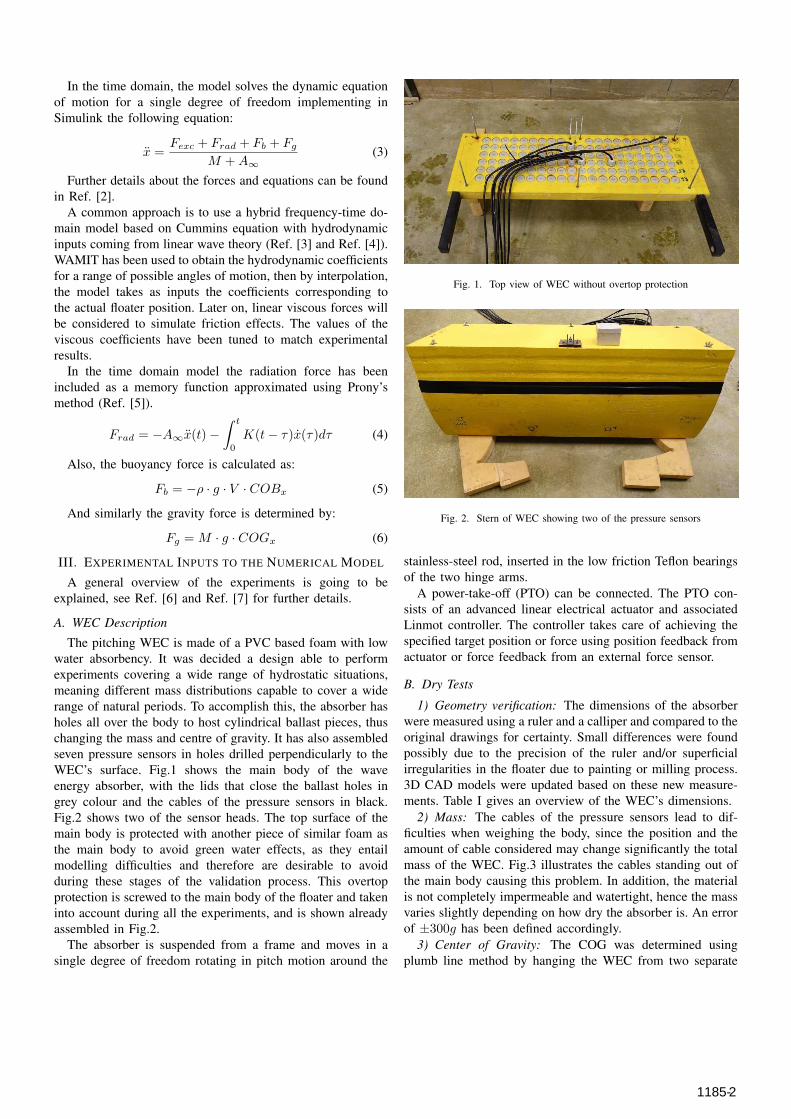
A. WEC Description
The pitching WEC is made of a PVC based foam with low
water absorbency. It was decided a design able to perform
experiments covering a wide range of hydrostatic situations,
meaning different mass distributions capable to cover a wide
range of natural periods. To accomplish this, the absorber has
holes all over the body to host cylindrical ballast pieces, thus
changing the mass and centre of gravity. It has also assembled
seven pressure sensors in holes drilled perpendicularly to the
WEC’s surface. Fig.1 shows the main body of the wave
energy absorber, with the lids that close the ballast holes in
grey colour and the cables of the pressure sensors in black.
Fig.2 shows two of the sensor heads. The top surface of the
main body is protected with another piece of similar foam as
the main body to avoid green water effects, as they entail
modelling difficulties and therefore are desirable to avoid
during these stages of the validation process. This overtop
protection is screwed to the main body of the floater and taken
into account during all the experiments, and is shown already
assembled in Fig.2.
The absorber is suspended from a frame and moves in a
single degree of freedom rotating in pitch motion around the
Fig. 1. Top view of WEC without overtop protection
Fig. 2. Stern of WEC showing two of the pressure sensors
stainless-steel rod, inserted in the low friction Teflon bearings
of the two hinge arms.
A power-take-off (PTO) can be connected. The PTO con-
sists of an advanced linear electrical actuator and associated
Linmot controller. The controller takes care of achieving the
specified target position or force using position feedback from
actuator or force feedback from an external force sensor.
B. Dry Tests
1) Geometry verification: The dimensions of the absorber
were measured using a ruler and a calliper and compared to the
original drawings for certainty. Small differences were found
possibly due to the precision of the ruler and/or superficial
irregularities in the floater due to painting or milling process.
3D CAD models were updated based on these new measure-
ments. Table I gives an overview of the WEC’s dimensions.
2) Mass: The cables of the pressure sensors lead to dif-
ficulties when weighing the body, since the position and the
amount of cable considered may change significantly the total
mass of the WEC. Fig.3 illustrates the cables standing out of
the main body causing this problem. In addition, the material
is not completely impermeable and watertight, hence the mass
varies slightly depending on how dry the absorber is. An error
of ±300g has been defined accordingly.
3) Center of Gravity: The COG was determined using
plumb line method by hanging the WEC from two separate
21185-

TABLE IMAIN WEC DIMENSIONS
Width 1145.0 mm
Length of main body 343.5 mm
Length of hinge arms 228.5 mm
Height 423.0 mm
Fig. 3. Experimental method to calculate centre of gravity
points in two different positions and drawing vertical lines
passing through the hanging point (Fig.3). As the figure
illustrates, a laser was used to define the two vertical lines that
define the COG at the cross point. A human error of ±3mm
on both horizontal and vertical coordinates of the centre of
gravity was accepted for this method.
4) Moment of Inertia: The moment of inertia was deter-
mined using two methods. Firstly, with free oscillations in air
and using the well-known pendulum equation. And secondly,
applying fast enforced oscillations in air with the actuator.
C. Wave Flume and Wave Basin Experiments
The setup in the flume is shown in Fig.4. A piston type
wave generator on the left-hand side generates the waves and
an absorbing beach is placed on the right end. The absorber
and the wave reference point was placed approximately in
the middle of the flume, 10.25 m from the mean position of
the wave generator. Thirteen wave gauges were distributed
throughout the flume as shown in Fig.5. The setup with
multiple wave gauges allows for accurately separating incident
and reflected waves.
In the wave basin a bottom box, which is a type of
surrounding substructure tested together with the WEC, was
placed in the middle of the basin with the front side placed
4.86 m from the wave generator paddles, see Fig.6. A beach
consisting of sea stones was absorbing the waves behind the
device. Waves were generated using the software Awasys. The
active absorption option was not used as reflection effects in
the basin were much smaller than in the flume, and also a more
accurate repeatability could be achieved in the basin when not
in use the active absorption.
Tests performed for different ballast cases and set-ups in
both wave flume and wave basin consisted of:
• Waves in empty facilities to perform reflection analysis.
• Decay tests.
• Regular waves with and without PTO.
• Irregular waves with and without PTO.
When simulating sea waves in flumes or basins, incident
waves are affected by reflected waves. When it comes to
validation of a numerical model, separating these two concepts
is important. In order to know the incident and reflected waves
at the reference location the following procedure was used:
1) Waves were generated and measured in the flume and
basin with the WEC out of the water.
2) A wave analysis was performed to separate incident and
reflected waves.
3) The same waves were repeated with the device in
position, thereby getting measurements from the device.
The software ”Awasys” from Aalborg University was used
for wave generation including active absorption, and ”Wave-
Lab” for wave analysis. With WaveLab, performs a non-linear
reflection analysis taking into account the propagation speed of
the waves in a non-linear way. With this method was possible
to get results of simultaneous water surface elevation at the
selected location and pitch motion of the device.
1) Set-ups description: The WEC case study is the model-
scale version of a wave energy converter that will be installed
together with other three devices in a semi-submersible plat-
form for a wind turbine. Hence, the WEC will interact with a
surrounding structure. In this stage, this multi-body problem
has been simplified to the cases of a single WEC interacting
with different fixed surrounding structures.
In the wave flume:
• Single WEC moving in pitch (Fig.7).
• Single WEC moving in pitch with fixed submerged
structure.
And in wave basin:
• Single WEC moving in pitch (Fig.8).
• Single WEC moving in pitch with fixed submerged
structure.
• Single WEC moving in pitch with fixed submerged
structure and short side walls (Fig.9).
Fig. 7. Front view of WEC in wave flume
31185-

Fig. 4. Setup in the wave flume, measures in metres, birds eye view. The wave generator is on left and the beach (the honeycomb structure) is to the right.Location of the wave gauges is shown with small dots. The solid body in the centre represents the absorber.
Fig. 5. Position of the wave gauges labelled from 1 to 13, bird’s eye view. Measures in metres.
Fig. 6. Drawing showing position of bottom box in wave basin, bird’s eyeview, wave incidence 0 degrees, measures in mm.
2) Data acquisition: Data from the following sensors were
collected:
• Pressure sensors on absorber and surrounding fixed struc-
ture.
• Wave gauges.
• Motion of WEC by a MTI sensor, particularly angular
position.
• Wave trigger signal, which provides information about
Fig. 8. Experimental setup of single WEC in wave basin
the starting time of the generator (used to synchronize
data).
• Actuator position from Linmot system.
• Forces from the sensor by the electrical cylinder, i.e. the
control force.
• Forces and moments from the 6-axis force sensor.
D. WEC position and rest angles
When the floater is in the rest position, the rest angle is
measured using several methods:
• Linmot sensor, measuring the position of the power take
off actuator.
41185-

Fig. 9. Experimental setup of single WEC with surrounding structure in wavebasin
Fig. 10. Experimental data of decay tests of single WEC in wave basin
• MTI sensor, which gives a direct angular measurement.
• A ruler to calculate the position geometrically using the
distance from the hinge point and from the top of the
converter to the water surface.
• Level app for smartphone.
The rest position is used to correct the mass and centre of
gravity and analyse the hydrostatics. It is important to keep
the water level constant, ±1mm difference in water depth
changes the body position ±1degree. Since the objective is
the validation of the numerical model, the highest accuracy
level of the input data is needed.
E. Decay Tests
During decay tests, the absorber is moved away from its
static position and released suddenly in calm water. When the
absorber is released, it goes back to equilibrium after some
oscillations. The oscillations are damped out relatively quickly
and waves are radiated away from the absorber, this means
that the potential energy disappears with the wave radiation.
An example of a set of decay tests in wave basin is given in
Fig.10.
F. Repeatability of experiments
One way to make certain that the experiments are performed
correctly and results are reliable is by repeatability. In this
section, a further analysis of the set of decay tests shown in
Fig.10 is going to be done as example of consistency.
TABLE IIDECAY TESTS ANALYSIS
Decay nr. T(s) ζ
1 1.19 0.19
2 1.20 0.20
3 1.21 0.20
4 1.23 0.21
5 1.24 0.21
6 1.24 0.20
Mean 1.22 0.20
Fig. 11. Experimental decay data with calculated logarithmic decrement
A zoom in on the two first decay experiments is plotted
in Fig.11 and Fig.12. For the same hydrostatic conditions is
expected to get similar natural periods, damping ratios and rest
angles, therefore a logarithmic decrement can be calculated
to be suitable for all the experiments. As Table.II shows, a
good agreement is achieved and the logarithmic decrement
calculated from the mean values of the table is applicable for
any of those experiments, as it is seen in the figures mentioned
before.
IV. HYDRODYNAMIC INPUTS TO THE NUMERICAL MODEL
This section highlights the effect of the surrounding fixed
structure affects on the hydrodynamic coefficients of the WEC
due to the interaction between bodies.
Fig. 12. Experimental decay data for a different starting point with calculatedlogarithmic decrement
51185-

Fig. 13. Non-dimensional hydrodynamic coefficients for single WEC in waveflume and wave basin
Fig. 14. Non-dimensional added mass coefficients for different set-ups inwave basin
Results of the hydrodyamic coefficients simulated for the
WEC in wave flume and wave basin with the same water
depth and no other surrounding body are shown in Fig.13.
For low frequencies, added mass coefficients are larger in the
wave basin, even though this difference gets reduced when
increasing the wave frequency. However, damping coefficients
are greater in wave flume than in wave basin, but the difference
is also reduced for higher wave frequencies.
Now a comparison of three different set-ups in the wave
basin is presented. The different configurations are:
• Setup 1. Single WEC
• Setup 2. WEC with bottom fixed structure.
• Setup 3. WEC with bottom fixed structure and short side
walls.
The third option is the most similar case to the full-scale
configuration. However, for validation is important the build-
up of the method and its analysis at every stage.
As shown before, discrepancy in the coefficients is larger for
low frequencies in the case of added mass, see Fig.14. Impor-
tant interactions occur with the side walls that make the added
mass to be at least double than when the configuration does
not include walls. The multi-body interaction makes damping
coefficients larger for the intermediate range of frequencies,
see Fig.15. According to this study, the wave energy converter
performance is hugely affected by its surroundings.
Fig.16 shows the influence of the side walls. The wave basin
set-up that includes short walls is compared to wave flume
simulations, which can be considered as a configuration with
Fig. 15. Non-dimensional damping coefficients for different set-ups in wavebasin
Fig. 16. Walls effect on hydrodynamic coefficients
long side walls. The non-dimensional coefficients change a lot
depending on the frequency range.
To sum up, a deeper study to get a better understanding of
the interactions between bodies moving in close proximity is
needed.
V. EXPERIMENTAL RESULTS
A. Importance on the multi-body interaction
Based on the differences in hydrodynamic coefficients for
the different set-ups tested, a different performance of the
WEC is expected. This statement is reasserted through ex-
periments in this section.
Fig.17 shows the response amplitude operator obtained with
regular and irregular waves for the device in the wave flume.
The blue line refers to the single WEC, and the red line is used
for the WEC with the bottom fixed surrounding structure. As it
is shown, this interaction between bodies results on an optimal
performance of the device for a wider range of wave periods.
The response amplitude operator of the single WEC in the
wave basin and for the same water depth is presented in Fig.18,
the RAO of the single WEC with bottom fixed surrounding
structure in Fig.19 and finally a set-up that includes the sur-
rounding structure plus side walls in Fig.20. The importance of
the set-ups is evident, since there are changes in the amplitude
of the motion, natural period and the width of the interval
where the motion responses are larger.
61185-

Fig. 17. Wave flume experiments with 0.65m depth for single WEC andWEC with surrounding bottom substructure
Fig. 18. Wave basin experiments with 0.65m depth for WEC with surroundingbottom substructure.
Fig. 19. Wave basin experiments with 0.65m depth for WEC with surroundingbottom substructure and side walls.
Fig. 20. Walls effect on hydrodynamic coefficients
Fig. 21. Response Amplitude Operator of single WEC in wave flume. (Solidline corresponds to numerical model and markers to experimental data)
VI. RESULTS
A. Response Amplitude Operator
In this section a frequency domain analysis is presented.
The response amplitude operator (RAO) has been calculated in
several cases to determine the likely behaviour of the converter
when operating. Experimental data is used as comparison and
to draw conclusions.
The RAOs of the single WEC are presented in Fig.21 and
Fig.22.
Lastly, in Fig.23 experimental results for the setup with the
bottom fixed substructure in wave flume are plotted together
with the calculated RAO.
All the calculated solutions overestimate the pitch motion
of the device, this is mainly due that no non-linearities have
been included in the numerical model yet. However, natural
frequencies seem to match and so does the shape of the curve
when the fixed substructure is considered.
B. Decay Tests
Even though the model does not include any non-linearity
yet, simulations of decay tests can be done since for decay tests
no waves are needed. Fig.24 presents a decay tests with the
model with and without friction. The friction effect has been
included just as a linear force, that is a constant times velocity
71185-
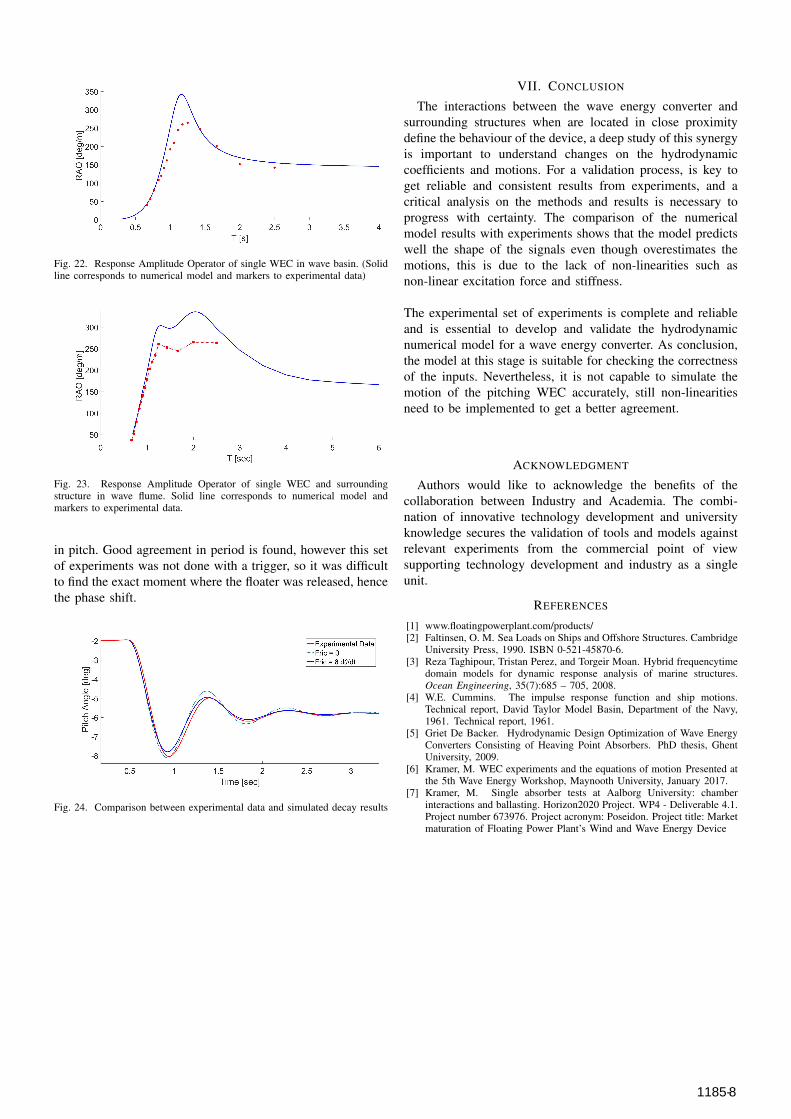
Fig. 22. Response Amplitude Operator of single WEC in wave basin. (Solidline corresponds to numerical model and markers to experimental data)
Fig. 23. Response Amplitude Operator of single WEC and surroundingstructure in wave flume. Solid line corresponds to numerical model andmarkers to experimental data.
in pitch. Good agreement in period is found, however this set
of experiments was not done with a trigger, so it was difficult
to find the exact moment where the floater was released, hence
the phase shift.
Fig. 24. Comparison between experimental data and simulated decay results
VII. CONCLUSION
The interactions between the wave energy converter and
surrounding structures when are located in close proximity
define the behaviour of the device, a deep study of this synergy
is important to understand changes on the hydrodynamic
coefficients and motions. For a validation process, is key to
get reliable and consistent results from experiments, and a
critical analysis on the methods and results is necessary to
progress with certainty. The comparison of the numerical
model results with experiments shows that the model predicts
well the shape of the signals even though overestimates the
motions, this is due to the lack of non-linearities such as
non-linear excitation force and stiffness.
The experimental set of experiments is complete and reliable
and is essential to develop and validate the hydrodynamic
numerical model for a wave energy converter. As conclusion,
the model at this stage is suitable for checking the correctness
of the inputs. Nevertheless, it is not capable to simulate the
motion of the pitching WEC accurately, still non-linearities
need to be implemented to get a better agreement.
ACKNOWLEDGMENT
Authors would like to acknowledge the benefits of the
collaboration between Industry and Academia. The combi-
nation of innovative technology development and university
knowledge secures the validation of tools and models against
relevant experiments from the commercial point of view
supporting technology development and industry as a single
unit.
REFERENCES
[1] www.floatingpowerplant.com/products/[2] Faltinsen, O. M. Sea Loads on Ships and Offshore Structures. Cambridge
University Press, 1990. ISBN 0-521-45870-6.[3] Reza Taghipour, Tristan Perez, and Torgeir Moan. Hybrid frequencytime
domain models for dynamic response analysis of marine structures.Ocean Engineering, 35(7):685 – 705, 2008.
[4] W.E. Cummins. The impulse response function and ship motions.Technical report, David Taylor Model Basin, Department of the Navy,1961. Technical report, 1961.
[5] Griet De Backer. Hydrodynamic Design Optimization of Wave EnergyConverters Consisting of Heaving Point Absorbers. PhD thesis, GhentUniversity, 2009.
[6] Kramer, M. WEC experiments and the equations of motion Presented atthe 5th Wave Energy Workshop, Maynooth University, January 2017.
[7] Kramer, M. Single absorber tests at Aalborg University: chamberinteractions and ballasting. Horizon2020 Project. WP4 - Deliverable 4.1.Project number 673976. Project acronym: Poseidon. Project title: Marketmaturation of Floating Power Plant’s Wind and Wave Energy Device
81185-