Embed Size (px)
Citation preview
Aalborg Universitet
Traffic Light Detection
Philipsen, Mark Philip; Jensen, Morten Bornø; Møgelmose, Andreas; Moeslund, Thomas B.;Trivedi, Mohan M.Published in:2015 IEEE 18th International Conference on Intelligent Transportation Systems (ITSC 2015)
DOI (link to publication from Publisher):10.1109/ITSC.2015.378
Publication date:2015
Document VersionAccepted author manuscript, peer reviewed version
Link to publication from Aalborg University
Citation for published version (APA):Philipsen, M. P., Jensen, M. B., Møgelmose, A., Moeslund, T. B., & Trivedi, M. M. (2015). Traffic Light Detection:A Learning Algorithm and Evaluations on Challenging Dataset. In 2015 IEEE 18th International Conference onIntelligent Transportation Systems (ITSC 2015): Proceedings (pp. 2341-2345). [7313470] IEEE. I E E EIntelligent Transportation Systems Conference. Proceedings, DOI: 10.1109/ITSC.2015.378
General rightsCopyright and moral rights for the publications made accessible in the public portal are retained by the authors and/or other copyright ownersand it is a condition of accessing publications that users recognise and abide by the legal requirements associated with these rights.
? Users may download and print one copy of any publication from the public portal for the purpose of private study or research. ? You may not further distribute the material or use it for any profit-making activity or commercial gain ? You may freely distribute the URL identifying the publication in the public portal ?
Take down policyIf you believe that this document breaches copyright please contact us at [email protected] providing details, and we will remove access tothe work immediately and investigate your claim.
Downloaded from vbn.aau.dk on: juni 16, 2018
Traffic Light Detection: A Learning Algorithm and Evaluations onChallenging Dataset
Mark P. Philipsen1,2, Morten B. Jensen1,2,Andreas Møgelmose1, Thomas B. Moeslund1, and Mohan M. Trivedi2
Abstract— Traffic light recognition (TLR) is an integral partof any intelligent vehicle, which must function in the existinginfrastructure. Pedestrian and sign detection have recently seengreat improvements due to the introduction of learning baseddetectors using integral channel features. A similar push havenot yet been seen for the detection sub-problem of TLR, wheredetection is dominated by methods based on heuristic models.
Evaluation of existing systems is currently limited primarilyto small local datasets. In order to provide a common basis forcomparing future TLR research an extensive public databaseis collected based on footage from US roads. The databaseconsists of both test and training data, totaling 46,418 framesand 112,971 annotated traffic lights, captured in continuoussequences under a varying light and weather conditions.
The learning based detector achieves an AUC of 0.4 and 0.32for day sequence 1 and 2, respectively, which is more than anorder of magnitude better than the two heuristic model-baseddetectors.
I. INTRODUCTION
Recognition of traffic lights (TLs) is an integral part ofDriver Assistance Systems (DAS) in the transitional periodbetween manually controlled cars and a fully autonomousnetwork of cars. Currently the focus of research in computervision systems for vehicles is divided in two. Major industrialresearch groups, such as Daimlar and Google, are invest-ing heavily in autonomous vehicles and attempt to makecomputer vision based system for the existing infrastructure.Other research done by academic institutions, such as theLISA lab at UC San Diego and LaRA at ParisTech, aretargeting DAS, which is already available to consumers insome high-end models. Existing commercial DAS capabil-ities include, warning of impending collisions, emergencybreaking, automatic lane changing, keeping the advertisedspeed limit, and adaptive cruise control. For all parts of DASthe urban environment posses a lot of challenges, especiallyto the systems that rely on computer vision. One of the mostimportant challenge here is detecting and recognizing TLs atintersections. Ideally, the TLs should be able to communicateboth visually and using radio communication. However,this requires investments in infrastructure, something that isusually not a high priority.
When some form of computer controlled automationis involved with dangerous objects such as cars, safetyand reliability is of utmost importance. The worst casescenarios would be a false positive from e.g. a tail light
1Visual Analysis of People Laboratory, Aalborg University, 9000 Aal-borg, Denmark.
2Computer Vision and Robotics Research Laboratory, UC San Diego, LaJolla, CA 92093-0434, USA
resulting in the assistance system determining that a redlight is imminent when it is not the case and unnecessarilydistracting the driver, or worse affecting the driver toperform an emergency braking operation. Most currentresearch is focused on detection and recognition duringday time with plenty of light, which makes it much easierto reject false positives, from e.g. tail lights, street lightsand various reflections. An exception is a system proposedby Google in [1], where a prior map of the location ofTLs makes it possible for their system to achieve solidperformance even at night. The same system is able toreduce the number of false positives substantially when itknows where the traffic signal should, and should not be.
Inspiration for further improvements can be found by look-ing at research done on similar computer vision problems.For sign recognition [2], [3] explain how the focus has shiftedfrom heuristic model-based detection to learning based ap-proaches and the problem is considered solved on a subset ofsigns. The same is the case with pedestrian detection, where[4] shows how a learning based detectors based on IntegralChannel Features (ICF) or the even faster and slightly betterAggregated Channel Features (ACF) outperform the otherapproaches. While research on sign and pedestrian detectionhas mostly moved on, the same is not the case for TLdetection where the majority rely on some sort of colorand/or shape filter for detection.
Research related to pedestrian and traffic signs havebenefited greatly from high amount of public datasetsmade available through various benchmarks, such as theKITTI Vision Benchmark Suite[5] and VIVA Challenge [6].Currently only one public TL dataset is available, which isthe dataset published by LaRA at ParisTech. The datasetconsist of 11,179 frames from a 8min and 49sec longdrive in Paris. In order to provide a common basis forcomparing future TLR research an extensive public databaseis collected based on footage from US roads captured undervarying light and weather conditions. Each test sequenceconsists of a continuous drive in an urban environmentproviding lots of frames with and without TLs.
The purpose of this paper is to compare two heuristicTL detection methods to a state-of-the-art learning baseddetector relying on ACF. Learning based detectors relyingon Haar features have been applied in earlier research [7],[8], [9], without much success. This is therefore the firstsuccessful learning based detector applied to the TL detec-

tion problem. Evaluation and comparison between the threeapproaches is done on daytime sequences from the extensiveand difficult LISA Traffic Light Database. The contributionsare thus threefold:
1) First successful application of a state-of-the-art learn-ing based detector for TL detection.
2) Comparison between two heuristic TL detection ap-proaches and a learning based detector using ACF.
3) Introduce the first evaluation based on the public LISATraffic Light Database.
The paper is organized as follows: Relevant research issummarized in section II. In section III we present theproposed methods, followed by evaluation of the TL detec-tors in section IV. Finally, section V rounds of with someconcluding remarks.
II. RELATED WORK
Recent work published in the area of traffic light recog-nition is reviewed, before developing a traffic recognitionsystem to be used for DAS. For a more extensive overviewof the TLR domain, we refer to [10].
A. Traffic Light Recognition
Common for [11], [9], [12] is a TL detector which reliespurely on intensity from grayscale images. This has theadvantage of being more robust to color distortion. Areasbrighter than their surroundings are segmented using thewhite top-hat mophology operation, which leads to an initialhigh number of candidates. False candidates are filteredout based on shape information. Specifically, rejection isdone based on criteria such as, dimension ratio, the BLOBbeing free of holes and approximately convex. Furthermore,the areas of BLOBs are compared to the areas of regionsgrown from extrema in the original grayscale image. This isespecially effective for removing false candidates big brightareas such as the sky. This detector relies heavily on acompetent classifier for further rejection and state estimation,since the number of false candidates is very high and colorinformation is not available. The detector manages to find90% of all TLs in the testset.
[13] begins by detecting the vanishing line and therebyreducing the search area considerably, relying on the as-sumption that TLs will only appear above this line. Theythen apply the the white top-hat operation as [11], [9],[12] did, on the intensity channel V from a HSV image.What is left is filter based on statistical measurements ofthe hue and saturation ranges of red and green lights. Allpixels outside these ranges are rejected while the remainingpixels are selected as candidates. Remaining BLOBs arefiltered based on size and height-width ratio. They thenlook for black bounding boxes around the BLOBs based ongradient information and the blackness of the inside of boxcandidates. Their system reaches an accuracy of 85%.
[14] extracts candidate BLOBs from RGB images byapplying a color distance transform proposed in [15]. Thetransform emphasizes the chosen color in an intensity im-age, which is thresholded to remove to suppressed colors.
This is followed by shape filtering to reduce noise usingwidth/height ratio and the solidity of BLOBs. The solidityis calculated based on the ratio between the area of theBLOB and it’s bounding box. When evaluating their system,they count a success if the TL was detected just once inthe sequence, this allows them to reach a detection rate of93,53%.
III. METHODS
In this section all of the methods which are used in theproposed system are presented. The section is divided intotwo subsection. In the first subsection the learning baseddetector is described. The second subsection explains thetracking used for improving the output of the detector.
A. Learning based detection
In this subsection we apply the successful ACF detectorto the TL detection problem. The learning based detectionis similar to the approach seen in [16] for traffic signs. Weuse the Matlab toolbox provided by [17]. The learning baseddetection system is described in the following three parts:
1) Features: The learning based detector is based onfeatures from 10 channels as described in [18]. A channelrefers to a representation of the input image. The 10 differentchannels include 6 gradient histogram channels, 1 for unori-ented gradient magnitude, and 3 for the channels in the CIE-LUV color space. In each channel, small rectangular blocksare used as features. These features are evaluated using amodified AdaBoost classifier with depth-2 decision trees asweak learners.
2) Training: Training is done using 14,106 positive TLsamples with a resolution of 20x40 and 42,125 negativesamples from 200 carefully selected frames without TLs.In Figure 1 four examples of the positives used for thelearning based detector are seen. Similarly, Figure 2 showstwo examples of frames used for negatives.
(a) (b) (c) (d)
Fig. 1: Positive samples for learning based detector.
The classifier is trained with Adaboost based on thefeatures extracted from the positive samples. We train 4cascade stages, 1st stage consists of 10 weak learners, 2ndstages of 100, 3rd stage of 1000, and 4th stage of 20000.In the 4th stage, the training algorithm convergent at 3136weak learners.
3) Detection: We use a 20x40 sliding window across anintegral image of each of the 10 channels in the test image.
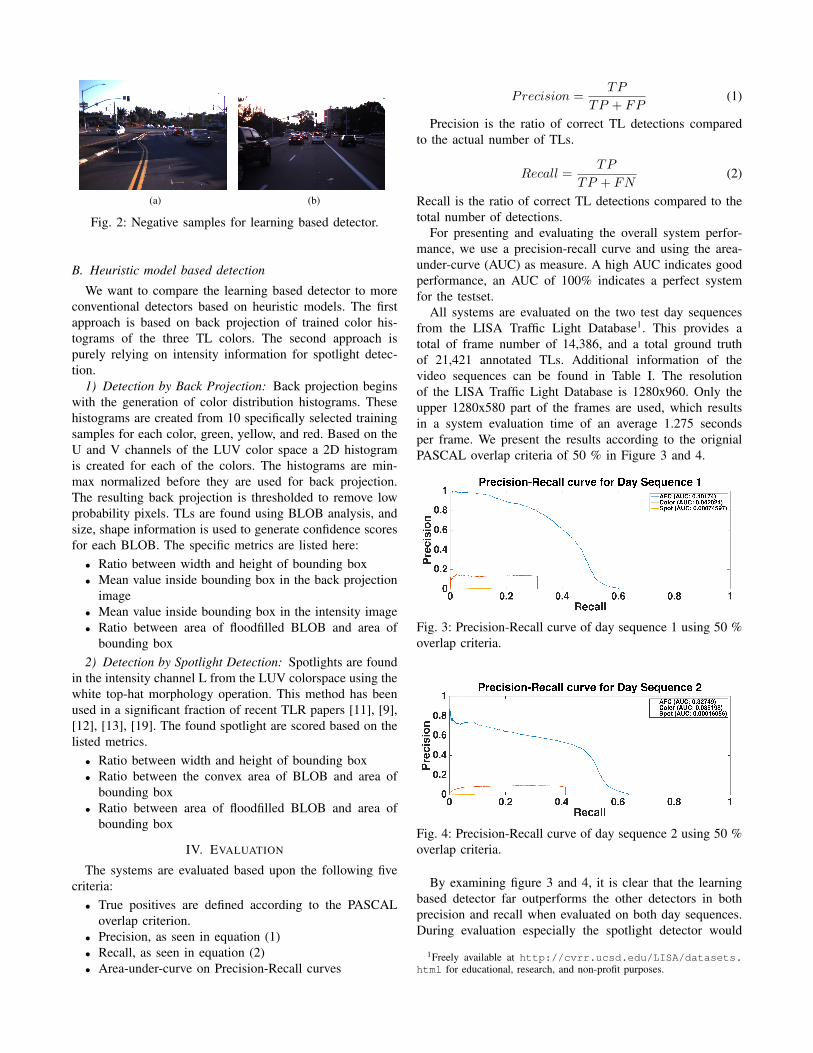
(a) (b)
Fig. 2: Negative samples for learning based detector.
B. Heuristic model based detection
We want to compare the learning based detector to moreconventional detectors based on heuristic models. The firstapproach is based on back projection of trained color his-tograms of the three TL colors. The second approach ispurely relying on intensity information for spotlight detec-tion.
1) Detection by Back Projection: Back projection beginswith the generation of color distribution histograms. Thesehistograms are created from 10 specifically selected trainingsamples for each color, green, yellow, and red. Based on theU and V channels of the LUV color space a 2D histogramis created for each of the colors. The histograms are min-max normalized before they are used for back projection.The resulting back projection is thresholded to remove lowprobability pixels. TLs are found using BLOB analysis, andsize, shape information is used to generate confidence scoresfor each BLOB. The specific metrics are listed here:
• Ratio between width and height of bounding box• Mean value inside bounding box in the back projection
image• Mean value inside bounding box in the intensity image• Ratio between area of floodfilled BLOB and area of
bounding box2) Detection by Spotlight Detection: Spotlights are found
in the intensity channel L from the LUV colorspace using thewhite top-hat morphology operation. This method has beenused in a significant fraction of recent TLR papers [11], [9],[12], [13], [19]. The found spotlight are scored based on thelisted metrics.
• Ratio between width and height of bounding box• Ratio between the convex area of BLOB and area of
bounding box• Ratio between area of floodfilled BLOB and area of
bounding box
IV. EVALUATION
The systems are evaluated based upon the following fivecriteria:
• True positives are defined according to the PASCALoverlap criterion.
• Precision, as seen in equation (1)• Recall, as seen in equation (2)• Area-under-curve on Precision-Recall curves
Precision =TP
TP + FP(1)
Precision is the ratio of correct TL detections comparedto the actual number of TLs.
Recall =TP
TP + FN(2)
Recall is the ratio of correct TL detections compared to thetotal number of detections.
For presenting and evaluating the overall system perfor-mance, we use a precision-recall curve and using the area-under-curve (AUC) as measure. A high AUC indicates goodperformance, an AUC of 100% indicates a perfect systemfor the testset.
All systems are evaluated on the two test day sequencesfrom the LISA Traffic Light Database1. This provides atotal of frame number of 14,386, and a total ground truthof 21,421 annotated TLs. Additional information of thevideo sequences can be found in Table I. The resolutionof the LISA Traffic Light Database is 1280x960. Only theupper 1280x580 part of the frames are used, which resultsin a system evaluation time of an average 1.275 secondsper frame. We present the results according to the orignialPASCAL overlap criteria of 50 % in Figure 3 and 4.
Fig. 3: Precision-Recall curve of day sequence 1 using 50 %overlap criteria.
Fig. 4: Precision-Recall curve of day sequence 2 using 50 %overlap criteria.
By examining figure 3 and 4, it is clear that the learningbased detector far outperforms the other detectors in bothprecision and recall when evaluated on both day sequences.During evaluation especially the spotlight detector would
1Freely available at http://cvrr.ucsd.edu/LISA/datasets.html for educational, research, and non-profit purposes.
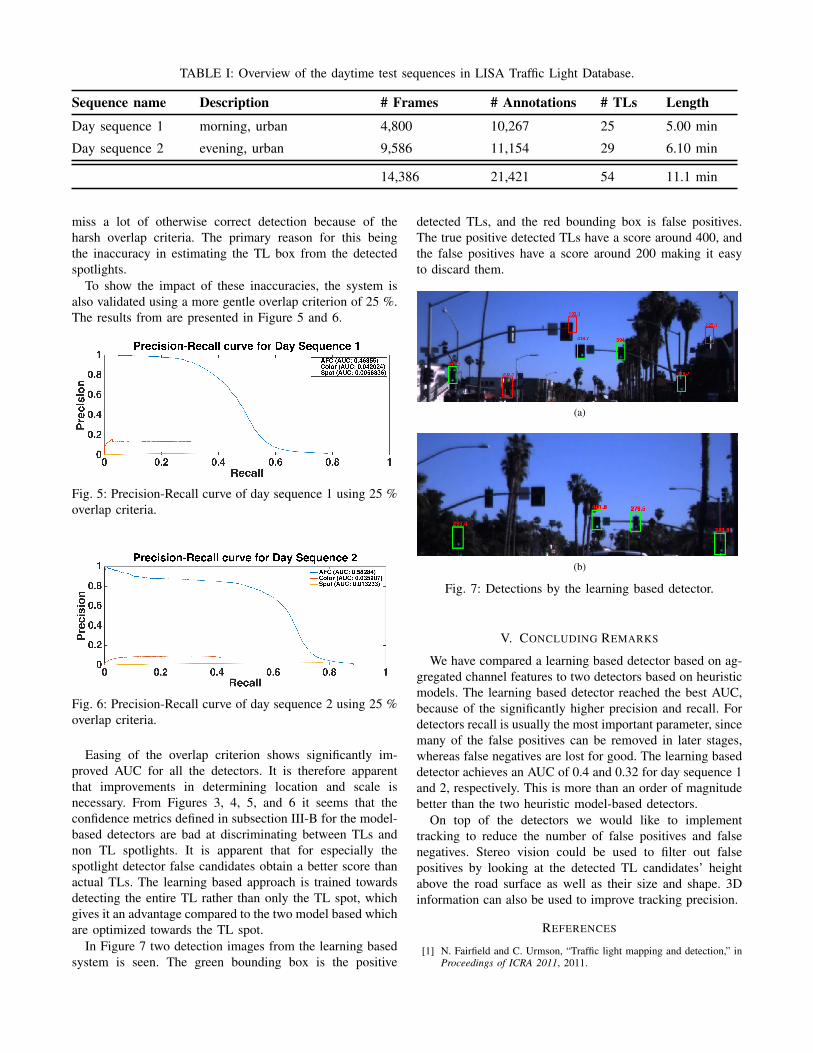
TABLE I: Overview of the daytime test sequences in LISA Traffic Light Database.
Sequence name Description # Frames # Annotations # TLs Length
Day sequence 1 morning, urban 4,800 10,267 25 5.00 min
Day sequence 2 evening, urban 9,586 11,154 29 6.10 min
14,386 21,421 54 11.1 min
miss a lot of otherwise correct detection because of theharsh overlap criteria. The primary reason for this beingthe inaccuracy in estimating the TL box from the detectedspotlights.
To show the impact of these inaccuracies, the system isalso validated using a more gentle overlap criterion of 25 %.The results from are presented in Figure 5 and 6.
Fig. 5: Precision-Recall curve of day sequence 1 using 25 %overlap criteria.
Fig. 6: Precision-Recall curve of day sequence 2 using 25 %overlap criteria.
Easing of the overlap criterion shows significantly im-proved AUC for all the detectors. It is therefore apparentthat improvements in determining location and scale isnecessary. From Figures 3, 4, 5, and 6 it seems that theconfidence metrics defined in subsection III-B for the model-based detectors are bad at discriminating between TLs andnon TL spotlights. It is apparent that for especially thespotlight detector false candidates obtain a better score thanactual TLs. The learning based approach is trained towardsdetecting the entire TL rather than only the TL spot, whichgives it an advantage compared to the two model based whichare optimized towards the TL spot.
In Figure 7 two detection images from the learning basedsystem is seen. The green bounding box is the positive
detected TLs, and the red bounding box is false positives.The true positive detected TLs have a score around 400, andthe false positives have a score around 200 making it easyto discard them.
(a)
(b)
Fig. 7: Detections by the learning based detector.
V. CONCLUDING REMARKS
We have compared a learning based detector based on ag-gregated channel features to two detectors based on heuristicmodels. The learning based detector reached the best AUC,because of the significantly higher precision and recall. Fordetectors recall is usually the most important parameter, sincemany of the false positives can be removed in later stages,whereas false negatives are lost for good. The learning baseddetector achieves an AUC of 0.4 and 0.32 for day sequence 1and 2, respectively. This is more than an order of magnitudebetter than the two heuristic model-based detectors.
On top of the detectors we would like to implementtracking to reduce the number of false positives and falsenegatives. Stereo vision could be used to filter out falsepositives by looking at the detected TL candidates’ heightabove the road surface as well as their size and shape. 3Dinformation can also be used to improve tracking precision.
REFERENCES
[1] N. Fairfield and C. Urmson, “Traffic light mapping and detection,” inProceedings of ICRA 2011, 2011.
[2] A. Mogelmose, D. Liu, and M. M. Trivedi, “Traffic sign detection forus roads: Remaining challenges and a case for tracking,” in IntelligentTransportation Systems (ITSC), IEEE. IEEE, 2014, pp. 1394–1399.
[3] M. Mathias, R. Timofte, R. Benenson, and L. Van Gool, “Traffic signrecognition - how far are we from the solution?” in ICJNN, 2013.
[4] P. Dollar, R. Appel, S. Belongie, and P. Perona, “Fast feature pyramidsfor object detection,” PAMI, 2014.
[5] A. Geiger, P. Lenz, and R. Urtasun, “Are we ready for autonomousdriving? the kitti vision benchmark suite,” in Conference on ComputerVision and Pattern Recognition (CVPR), 2012.
[6] Laboratory for Intelligent and Safe Automobiles UC San Diego.(2015) Vision for intelligent vehicles and applications (viva)challenge. [Online]. Available: http://cvrr.ucsd.edu/vivachallenge/
[7] U. Franke, D. Pfeiffer, C. Rabe, C. Knoeppel, M. Enzweiler, F. Stein,and R. Herrtwich, “Making bertha see,” in Computer Vision Workshops(ICCVW), IEEE, 2013, pp. 214–221.
[8] F. Lindner, U. Kressel, and S. Kaelberer, “Robust recognition of trafficsignals,” in Intelligent Vehicles Symposium, IEEE, 2004, pp. 49–53.
[9] R. Charette and F. Nashashibi, “Traffic light recognition using imageprocessing compared to learning processes,” in Intelligent Robots andSystems, IEEE/RSJ. IEEE, 2009, pp. 333–338.
[10] M. P. Philipsen, M. B. Jensen, M. M. Trivedi, A. Møgelmose,and T. B. Moeslund, “Vision for looking at traffic lights: Issues,survey, and perspectives,” in Intelligent Transportation Systems, IEEETransactions [In submission]. IEEE, 2015.
[11] G. Trehard, E. Pollard, B. Bradai, and F. Nashashibi, “Tracking bothpose and status of a traffic light via an interacting multiple modelfilter,” in Information Fusion (FUSION). IEEE, 2014, pp. 1–7.
[12] R. de Charette and F. Nashashibi, “Real time visual traffic lightsrecognition based on spot light detection and adaptive traffic lightstemplates,” in Intelligent Vehicles Symposium, IEEE, 2009.
[13] Y. Zhang, J. Xue, G. Zhang, Y. Zhang, and N. Zheng, “A multi-featurefusion based traffic light recognition algorithm for intelligent vehicles,”in Control Conference (CCC), 2014 33rd Chinese. IEEE, 2014.
[14] H.-K. Kim, Y.-N. Shin, S.-g. Kuk, J. H. Park, and H.-Y. Jung, “Night-time traffic light detection based on svm with geometric momentfeatures,” World Academy of Science, Engineering and Technology76th, pp. 571–574, 2013.
[15] A. Ruta, Y. Li, and X. Liu, “Towards real-time traffic sign recognitionby class-specific discriminative features,” 2009.
[16] A. Mogelmose, D. Liu, and M. Trivedi, “Traffic sign detection for u.s.roads: Remaining challenges and a case for tracking,” in IntelligentTransportation Systems (ITSC), IEEE, 2014, pp. 1394–1399.
[17] P. Dollar, “Piotr’s Computer Vision Matlab Toolbox (PMT),” http://vision.ucsd.edu/∼pdollar/toolbox/doc/index.html.
[18] P. Dollar, Z. Tu, P. Perona, and S. Belongie, “Integral channelfeatures.” in BMVC, vol. 2, 2009, p. 5.
[19] D. Nienhuser, M. Drescher, and J. Zollner, “Visual state estimation oftraffic lights using hidden markov models,” in Intelligent Transporta-tion Systems (ITSC), IEEE. IEEE, 2010, pp. 1705–1710.