Embed Size (px)
Citation preview
Aalborg Universitet
Optimal placement, sizing, and daily charge/discharge of battery energy storage in lowvoltage distribution network with high photovoltaic penetration
Jannesar, Mohammad Rasol ; Sedighi, Alireza; Savaghebi, Mehdi; Guerrero, Josep M.
Published in:Applied Energy
DOI (link to publication from Publisher):10.1016/j.apenergy.2018.06.036
Publication date:2018
Document VersionEarly version, also known as pre-print
Link to publication from Aalborg University
Citation for published version (APA):Jannesar, M. R., Sedighi, A., Savaghebi, M., & Guerrero, J. M. (2018). Optimal placement, sizing, and dailycharge/discharge of battery energy storage in low voltage distribution network with high photovoltaic penetration.Applied Energy, 226, 957-966. https://doi.org/10.1016/j.apenergy.2018.06.036
General rightsCopyright and moral rights for the publications made accessible in the public portal are retained by the authors and/or other copyright ownersand it is a condition of accessing publications that users recognise and abide by the legal requirements associated with these rights.
- Users may download and print one copy of any publication from the public portal for the purpose of private study or research. - You may not further distribute the material or use it for any profit-making activity or commercial gain - You may freely distribute the URL identifying the publication in the public portal -
Take down policyIf you believe that this document breaches copyright please contact us at [email protected] providing details, and we will remove access tothe work immediately and investigate your claim.
1
Optimal Placement, Sizing, and Daily Charge/Discharge of Battery
Energy Storage in Low Voltage Distribution Network with High
Photovoltaic Penetration
Mohammad Rasol Jannesara, Alireza Sedighia*, Mehdi Savaghebib, Josep M. Guerrerob
E-Mail: [email protected], [email protected], [email protected], [email protected] a. Department of Electrical Engineering, Yazd University, Yazd, Iran
b. Department of Energy Technology, Aalborg University, Aalborg, Denmark
* Corresponding author
Abstract:
Proper installation of rooftop photovoltaic generation in distribution networks can
improve voltage profile, reduce energy losses, and enhance the reliability. But, on
the other hand, some problems regarding harmonic distortion, voltage magnitude,
reverse power flow, and energy losses can arise when photovoltaic penetration is
increased in low voltage distribution network. Local battery energy storage system
can mitigate these disadvantages and as a result, improve the system operation.
For this purpose, battery energy storage system is charged when production of
photovoltaic is more than consumers’ demands and discharged when consumers’
demands are increased. Since the price of battery energy storage system is high,
economic, environmental, and technical objectives should be considered together
for its placement and sizing. In this paper, optimal placement, sizing, and daily (24
hours) charge/discharge of battery energy storage system are performed based on
a cost function that includes energy arbitrage, environmental emission, energy
losses, transmission access fee, as well as capital and maintenance costs of battery
energy storage system. All simulations are carried out in DIgSILENT and MATLAB
linked together. Results show that by using the proposed approach, overvoltage
2
and energy losses are decreased, reverse power flow is prevented, environmental
emission is reduced, and economic profit is maximized.
Keywords: Photovoltaic (PV), Battery energy storage system (BESS), Distribution network,
Optimal planning and operation, high penetration.
1. Introduction
Recently, utilization of renewable energy sources (RES) in electrical networks is
getting inevitable due to the global energy tension and environmental concerns of
fossil-fuel-based electricity generation [1].
Photovoltaic (PV) generation is growing very fast while its cost is dropping rapidly
[2]. Single phase rooftop PVs (<10 kW) owned by utility customers are being
installed in low voltage (LV) distribution networks. The penetration of such PV
systems is increased in many places throughout the world, including Iran, due to
solar radiation, gradual elimination of energy subsidies, and government
incentives.
Utilizing PV systems can help to reduce the dependence on conventional power
plants, improve voltage profile, and decrease energy losses [3]. However, in the
case of high PV penetration in LV distribution network, reverse power flow may
occur when the PV production exceeds the consumers’ load [4]. This situation may
lead to overvoltage, increase of total harmonic distortion (THD) and fault current,
blinding of protection and false tripping, risk of islanding operation [5], and
decrease reliability [6].
3
To reduce the negative impacts of high PV penetration, there are two main
approaches including conventional (commercially available) and emerging
mitigation methods [1]. Reconductoring and on-load tap changing (OLTC) are
examples of conventional methods. Emerging methods include reactive power
(VAR) control by PV inverters, distributed energy storage systems, coordinated
control between utility equipment and PV inverters, installation of devices such as
dynamic voltage restorer (DVR) and distributed static compensator (DSTATCOM),
etc.
Negative impacts of high PV penetration such as increased voltage magnitude,
reverse power flow, and energy losses can be mitigated by optimal placement,
sizing and/or charge/discharge scheduling of battery energy storage system
(BESS). In this regard, many researchers have studied proper installation of energy
storage in distribution networks with high PV penetration. In [7], optimal daily
energy profiles of storage systems co-located with PV generation are calculated
and it is shown that significant control abilities in peak shaving, voltage stability,
and reducing distribution losses can be achieved. Optimal sizing of battery energy
storage co-located with PV is evaluated in [8] for the goals such as voltage
regulation. In another study, a coordinated hierarchical control scheme is
presented for static synchronous compensators (STATCOM) and BESS in order to
mitigate the overvoltage problem, but, cost/benefit analysis is not performed for
the BESS [9]. Cost/benefit analysis is performed in [10] to determine the optimal
location and size (without optimal operation) of community energy storage (CES)
by considering energy arbitrage, peak power generation, energy loss reduction,
upgrade deferral of transmission and distribution (T&D) systems, CO2 emission
4
reduction, and reactive power support. BESS is applied in [11] for peak shaving
and smoothing the distribution load profile. To achieve these goals, a real time
control is developed which performs smoothing and peak shaving, simultaneously.
In [11], the economic purpose (price arbitrage) is not considered, therefore, BESS
charge/discharge is only calculated for peak shaving. Authors of [12] proposed an
algorithm that is capable of integrating sizing, placement, and operational
strategies of BESS taking into account energy losses, but, without considering
environmental emission. The minimum energy storage required to be installed in
LV grid to prevent the overvoltage is calculated in [13]; optimal sizing and
placement of BESS is calculated, but, daily charge/discharge is not considered.
Authors of [14] proposed optimal sizing (without sitting) of BESS in the residential
LV distribution network for peak shaving, valley filling, load balancing, and
management of distributed RES. In [15], sizing energy storage based on Open
Distribution Simulator (OpenDSS) is proposed, but, optimal sizing, sitting, and
charge/discharge are not done simultaneously. Authors of [16] proposed a new
framework to integrate CES units in an existing residential community system with
rooftop PV units. In [16], the location, sizing, and operational characteristics of CES
are calculated to minimize the annual energy loss, enhance load following control,
and improve the voltage profile, respectively. In [17], a coordinated control of
distributed BESS with traditional voltage regulators including the OLTC and step
voltage regulators (SVR) is proposed, but, environmental effects are not analyzed.
Authors of [18] discussed optimal sizing and operation of BESS to contribute to
local distribution network operation through peak shaving, voltage control, and
levelling out power production from RES. The work in [19], optimizes the size of
5
BESS based on a cost/benefit analysis when BESS is applied for voltage regulation
and peak load shaving, but, optimal charge/discharge is not taken into account.
Optimal planning and operation of energy storage is performed in [20] for peak
shaving, reducing reverse power flow, and energy price arbitrage in distribution
network with high penetration of RES, but, voltage regulation is not taken into
account. In [21], the storage is utilized to compensate long-term and short-term
voltage variations originated from sudden change of PV output. The strategy of
charge/discharge is presented without any optimization. Authors of [22]
determined the soft open point (SOP) of distribution network with the aim of
optimal operation of energy storage to mitigate overvoltage arising from high RES
penetration. A method is proposed in [23] to optimize the location and size of the
distributed energy storage system (DESS). The optimization function is based on
best economical investment without considering energy price arbitrage. In [24], by
considering high RES penetration, optimal sizing and operation of BESS is
proposed to maximize the house independence from the grid and minimize the
power flow peaks from and to the grid. An optimization method is developed in
[25] for allocation of BESS in distribution system considering capital, land-of-use,
and installation costs without taking into account the benefit of energy price
arbitrage. Authors of [26] proposed an optimal planning approach for distributed
energy storage to achieve better economic solution considering total power losses,
but, without analyzing environmental effects. In [27], an optimization model is
presented to minimize the net present value (NPV) of BESS and energy losses
while reduction of environmental emission is not considered. Optimal location,
capacity, and power rating of batteries are calculated in [28] to determine the
6
economic technology by considering high RES penetration. Authors of [29]
presented a strategy for optimal integration of BESSs by considering voltage
regulation and loss reduction without taking into account the benefit of energy
price arbitrage. An approach for proper utilization of the energy storage system to
mitigate the effects of intermittent nature of PV has been presented in [30], but,
optimal BESS planning is not included.
In the present work, it is assumed that distribution system operator (DSO) has got
the ownership of BESS. Optimal placement, sizing, and operation of BESS are taken
into account in LV distribution network considering high PV penetration. Optimal
planning and operation of BESS is performed based on a cost function in order to
make the BESS installation economical. In addition, sizing and sitting are done
simultaneously with daily charge/discharge. Also, the objectives including energy
price arbitrage, transmission access fee, energy losses, and environmental
emission are taken into account simultaneously. The objective (cost) function
consists of these objectives, and capital and maintenance costs of BESS. In this
objective function, loss reduction and environmental benefits are converted to
economic benefits. Other technical goals including reverse power flow and voltage
regulation are considered as constraints.
Benefits of energy price arbitrage, environmental emission, and transmission
access fee are maximized when BESS is charged in low energy price, emission rate,
and transmission access fee and discharged while these rates are high. On the
other hand, overvoltages that occur due to high penetration of PV are decreased by
charging the BESS when PV systems produce maximum energy. Therefore, the
7
optimal charge/discharge of BESS is complicated. In this paper, an auxiliary
objective function is defined for increasing energy price arbitrage, reducing
transmission access fee and environmental emission, and mitigating undesired
impacts of high PV penetration by considering BESS constraints.
DIgSILENT and MATLAB are linked together because modeling of network
equipment such as transformer, feeder, load, and power flow study are more
accurate and realistic in DIgSILENT while MATLAB provides more powerful
optimization tools.
2. BESS modeling
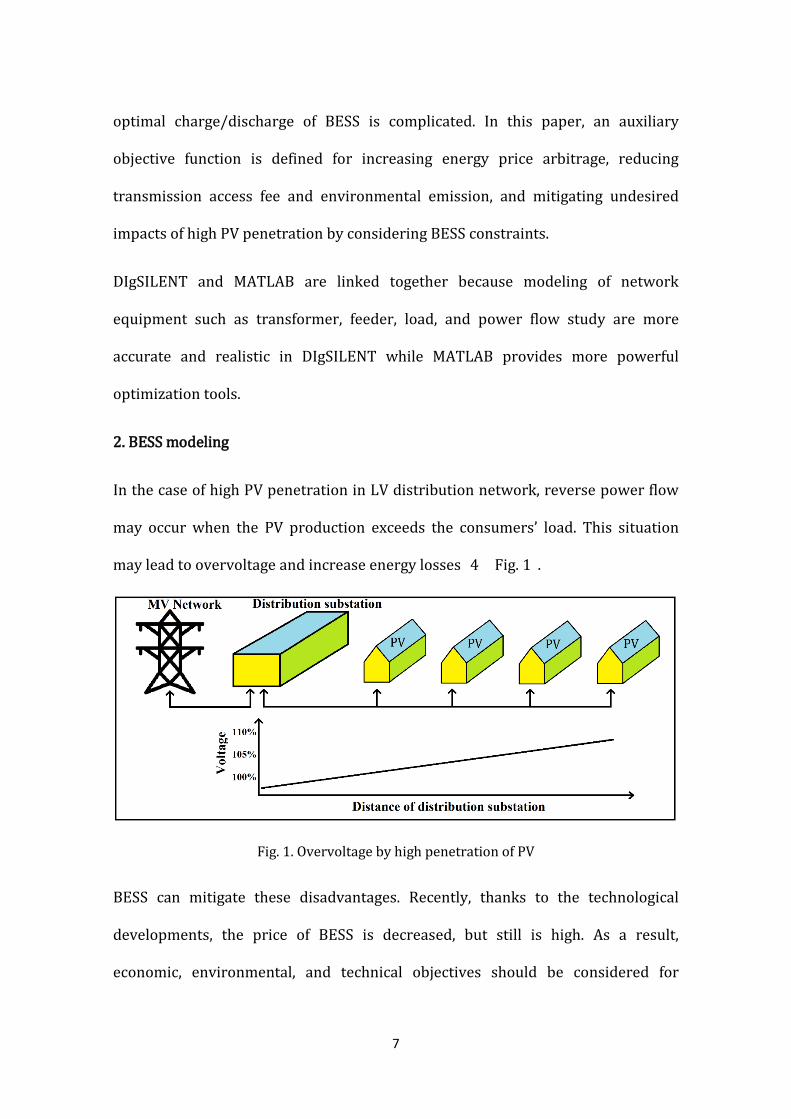
In the case of high PV penetration in LV distribution network, reverse power flow
may occur when the PV production exceeds the consumers’ load. This situation
may lead to overvoltage and increase energy losses [4] (Fig. 1).
Fig. 1. Overvoltage by high penetration of PV
BESS can mitigate these disadvantages. Recently, thanks to the technological
developments, the price of BESS is decreased, but still is high. As a result,
economic, environmental, and technical objectives should be considered for
8
planning and operation of BESS, in order to ensure its affordable utilization. Also, it
should be noted that storing energy may take several hours. Furthermore, BESS
should charge and discharge during each day. As a result, BESS needs to have
features such as efficiency [31], low self-discharge, high cycle life, and low price.
Among popular BESS, the main drawback of Lead-acid batteries is their limited
cycle life and the main disadvantage of Nickel–cadmium (Ni–Cd) cells is the
presence of toxic heavy metal Cadmium [32]. Lithium-ion (Li-ion) batteries are
mainly an option in short time scale applications, due to their relatively high daily
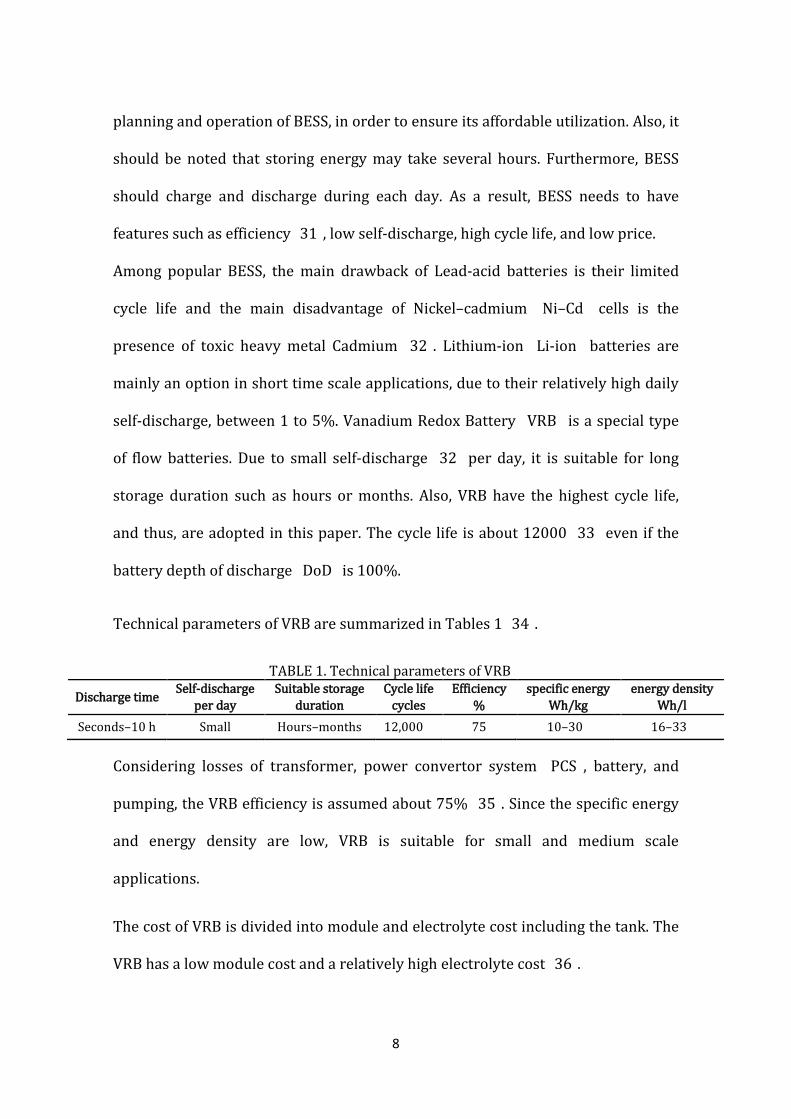
self-discharge, between 1 to 5%. Vanadium Redox Battery (VRB) is a special type
of flow batteries. Due to small self-discharge [32] per day, it is suitable for long
storage duration such as hours or months. Also, VRB have the highest cycle life,
and thus, are adopted in this paper. The cycle life is about 12000 [33] even if the
battery depth of discharge (DoD) is 100%.
Technical parameters of VRB are summarized in Tables 1 [34].
TABLE 1. Technical parameters of VRB
Discharge time Self-discharge per day
Suitable storage duration
Cycle life (cycles)
Efficiency (%)
specific energy (Wh/kg)
energy density (Wh/l)
Seconds–10 h Small Hours–months 12,000+ 75 10–30 16–33
Considering losses of transformer, power convertor system (PCS), battery, and
pumping, the VRB efficiency is assumed about 75% [35]. Since the specific energy
and energy density are low, VRB is suitable for small and medium scale
applications.
The cost of VRB is divided into module and electrolyte cost including the tank. The
VRB has a low module cost and a relatively high electrolyte cost [36].
9
2.1. Capital and Maintenance Cost
BESS cost consists of capital and maintenance costs. Capital cost includes battery
and power electronic system price. This cost is shown in (1)
CBESS = �CSSmax + CWSWmax� (1)
where CS includes PCS and balance of plant (BOP) costs. Smax is maximum power
of BESS, CWS is the battery cost, and Wmax is the maximum energy capacity of BESS.
The PCS cost consists of the power converter, breaker, transformer, and all
equipment necessary for serving the load and isolating the BESS. The BOP cost
includes grid connection at the point of common coupling (PCC), land, and
improvements (e.g., access, services, etc.) [37].
Maintenance and operating cost is shown in (2)
CM&O = (CMfSmax + CMvWmax) (2)
where CMf and CMv are the fixed and variable costs for maintenance and operation.
Fixed operation and management costs include projected annual costs for BESS
parts and labor, annual property taxes, and insurance. These costs for the PCS
include standby losses and VRB maintenance in accordance with vendor
recommendations. Variable operation and management costs include standby
losses [37].
Maintenance activities include confirming the operability of system protective
devices, calibrating sensors and instrumentation, inspecting for unusual vibrations,
noise or odors, inspecting for abnormal conditions of connecting cables and piping,
inspecting insulation resistance, servicing the battery controller, pumps, fans, and
other system components [37].
10
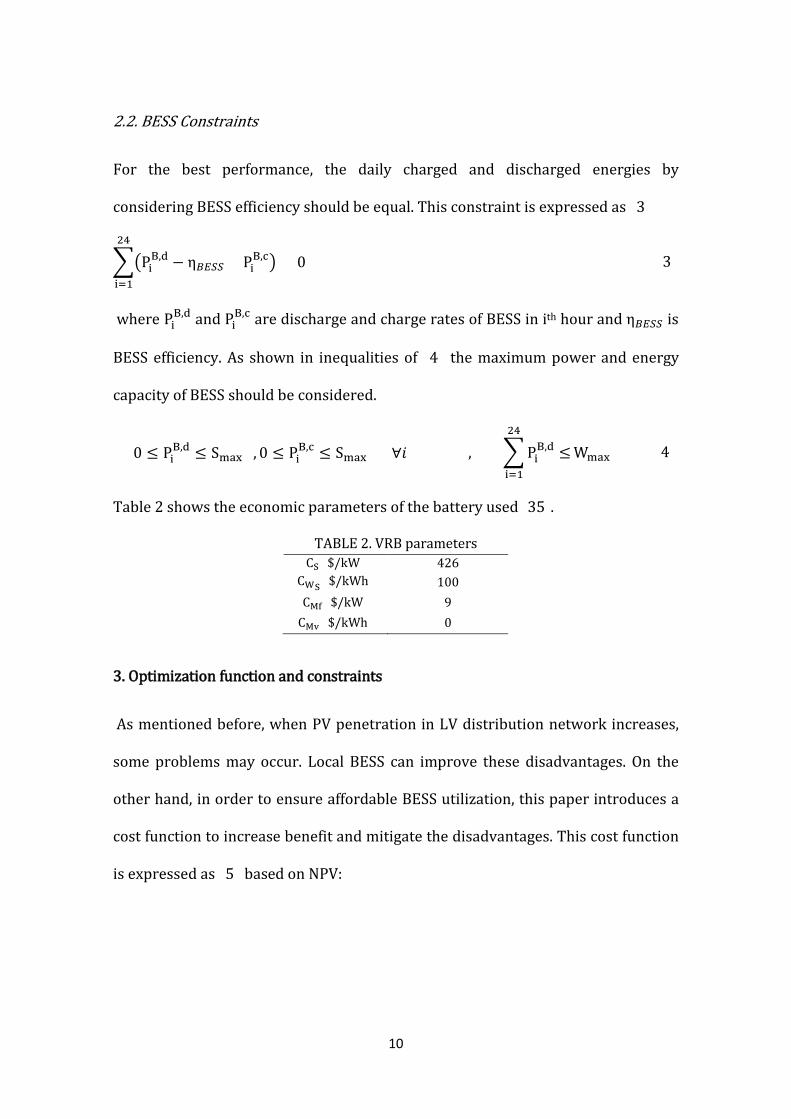
2.2. BESS Constraints
For the best performance, the daily charged and discharged energies by
considering BESS efficiency should be equal. This constraint is expressed as (3)
��PiB,d − η𝐵𝐵𝐵𝐵𝐵𝐵𝐵𝐵 × Pi
B,c�24
i=1
= 0 (3)
where PiB,d and Pi
B,c are discharge and charge rates of BESS in ith hour and η𝐵𝐵𝐵𝐵𝐵𝐵𝐵𝐵 is
BESS efficiency. As shown in inequalities of (4) the maximum power and energy
capacity of BESS should be considered.
Table 2 shows the economic parameters of the battery used [35].
TABLE 2. VRB parameters CS ($/kW) 426
CWS ($/kWh) 100 CMf ($/kW) 9
CMv ($/kWh) 0
3. Optimization function and constraints
As mentioned before, when PV penetration in LV distribution network increases,
some problems may occur. Local BESS can improve these disadvantages. On the
other hand, in order to ensure affordable BESS utilization, this paper introduces a
cost function to increase benefit and mitigate the disadvantages. This cost function
is expressed as (5) based on NPV:
0 ≤ PiB,d ≤ Smax , 0 ≤ Pi
B,c ≤ Smax ∀𝑖𝑖 , � PiB,d ≤
24
i=1
Wmax (4)
11
where BARB is energy price arbitrage benefit, BENV, BLOSS, and BTRANS are the
profit of reducing environmental emissions, energy losses, and transmission access
fee, respectively. As explained later, energy price arbitrage, environmental
emission, and energy losses reductions are defined as daily profits which are
multiplied by 365 to calculate the annual benefit. Similarly, since transmission
access fee is set monthly, its benefit is multiplied by 12 to provide the annual profit.
CM&O is the maintenance and operation cost. Since BESS benefits and costs occur
during the planning and operation horizon (here, N=25 years with respect to PV
life expectancy [38] and BESS cycle life [33]), its value is multiplied by � 1+ir1+dr
�n
to
calculate the present value. ir and dr are inflation and discount rates (respectively
equal to 1.5% and 9% [39]) and n is the year that these benefits and costs occur.
CBESS is the capital cost. In order to optimize these benefits and costs more
accurately, in this economic objective function, environmental benefit (BENV) and
technical benefit (BLOSS) are converted to economic benefits by rates of damage
cost for emission and daily energy price (these rates are defined in Sections 3.2 and
3.4). In the following section, these benefits and costs are introduced.
3.1. Benefit of Energy Price Arbitrage
Energy price in restructured distribution systems is different for different periods;
therefore, distribution company should charge and discharge BESS in low and high
energy price, respectively to ensure a cost-effective BESS installation. The benefit
𝐶𝐶𝐶𝐶 = � �[(BARB + BENV + BLOSS) × 365 + BTRANS × 12 − CM&O] × �1 + ir1 + dr
�n
�N
n=1
− CBESS
(5)
12
of energy price arbitrage is expressed as (6), where prEN,i is the hourly energy
price.
BARB = � ��PiB,d − Pi
B,c� × prEN,i �24
𝑖𝑖=1
(6)
3.2. Benefit of Environmental Emission Reduction
Traditional power plants are important sources for greenhouse (CO2, CH4, and
N2O) and toxic gases (SO2, NO2, and CO) [40]. Damage cost of power plant air
pollutant covers health and environmental effects [41]. In this paper, climate
changes are considered to model the damage cost of environmental emission. Most
damages of climate changes are referred to CO2 [42]. Damage cost for CO2 can be
divided into market and nonmarket impacts [43]. In this paper, it is assumed that
damage cost for CO2 is equal to 0.0257 $𝑘𝑘𝑘𝑘
[44]. CO2 emission rate from marginal
power plants is different for different hours of the day (see Fig. 2). BESS could be
charged at the time of base load, i.e. less emission rate, and discharged in peak load
to reduce environmental emission. On the other hand, PVs reduce greenhouse gas
emission [45]. Therefore, emission rate of PV as a clean power plant can be set to
zero. By increasing PV penetration, reverse power flow occurs in some hours. As
previously mentioned, reverse power flow is prevented by optimization constraint.
For this purpose, BESS should be charged in the periods with reverse power flow
(i.e. charging with zero emissions rates in the time of surplus PV generation).
Therefore, this energy does not cause environmental emission. As a result, the
benefit can be expressed as
13
BENV = � ��PiB,d − Pi
B,c + Pirev� × EMIrate,i × prENV�
24
𝑖𝑖=1
(7)
where Pirev is hourly reverse power flow (divided by the number of batteries)
before optimization, EMIrate,i is hourly CO2 emission rate for typical operation
schedule of power plants in a day, and prENV is the damage cost of CO2 emission.
3.3. Benefit of Transmission Access Fee
In deregulated power systems, distribution company should pay the transmission
access fee for using transmission equipment. Transmission access fee varies at
different hours of a day. Distribution company could charge and discharge BESS
respectively in low and high access fees. Similar to benefit of environmental
emission, no transmission access fee should be paid for BESS charging by reverse
power. This benefit is expressed as below
BTRANS = � ��PiB,d − Pi
B,c + Pirev� × prTRANS,i�
24
𝑖𝑖=1
(8)
where prTRANS,i is hourly transmission access fee considered as the average value
per month.
3.4. Benefit of Loss Reduction
When PV penetration is increased, the local energy production may be more than
consumers’demand. As a result, power is reversed to the transmission network
and voltage magnitude and energy losses may be increased. To cope with this
problem, BESS is charged when production of PV is more than consumers’demand
and discharged when consumers’ demand is increased. This benefit can be
modeled as (9)
14
BLOSS = ��PLOSS_LESSi × prEN,i�24
𝑖𝑖=1
(9)
where PLOSS_LESSi is hourly loss reduction in a day.
3.5. Technical Constraints
Technical constraints include voltage magnitude of the distribution system buses
and reverse power flows expressed as (10)
0.95 < 𝑉𝑉𝑖𝑖𝑘𝑘 < 1.05 ∀𝑖𝑖, ∀𝑘𝑘 ∈ 𝑁𝑁𝑏𝑏 , 𝑃𝑃𝑖𝑖
𝑎𝑎𝑎𝑎𝑎𝑎 ≤ 0 ∀𝑖𝑖 (10)
where 𝑉𝑉𝑖𝑖𝑘𝑘 is per unit phase 𝑎𝑎 bus voltage at node 𝑘𝑘 of the studied network with 𝑁𝑁𝑏𝑏
nodes and hour 𝑖𝑖 of a day. Also, 𝑃𝑃𝑖𝑖𝑎𝑎𝑎𝑎𝑎𝑎 is phase 𝑎𝑎 active power of distribution
transformer (MV/LV) at hour 𝑖𝑖 of a day (i.e. active power should be negative which
is equal to power consumption).
4. Optimal management approach
A solution method that combines the genetic algorithm with linear programing
method (GALP) is proposed in this paper to find the optimal solution for number,
placement, sizing, and scheduling of BESS [35]. In [35], GA is used to transform the
cost function to an LP that can be solved by Simplex Method. GA and LP are run
only in MATLAB. Modeling of network equipment such as transformer, feeder,
load, and power flow study are more accurate and realistic in DIgSILENT than
MATLAB. In addition, since data exchange between these two applications is time
consuming, running GA in DIgSILENT increases the speed of optimization. Also,
running LP in MATLAB is simpler than DIgSILENT. Therefore, in the present paper,
GA and system modeling are performed in DIgSILENT and LP is run in MATLAB.
15
These software programs are linked together and results of one are used by the
other.
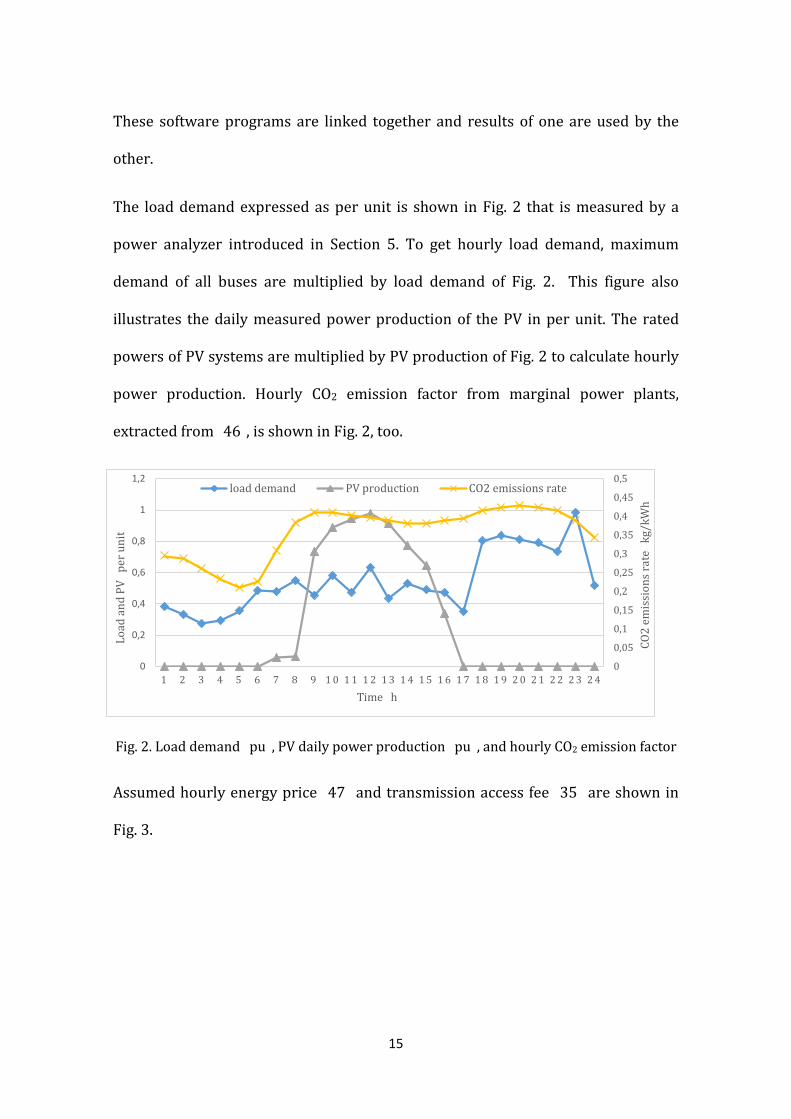
The load demand expressed as per unit is shown in Fig. 2 that is measured by a
power analyzer introduced in Section 5. To get hourly load demand, maximum
demand of all buses are multiplied by load demand of Fig. 2. This figure also
illustrates the daily measured power production of the PV in per unit. The rated
powers of PV systems are multiplied by PV production of Fig. 2 to calculate hourly
power production. Hourly CO2 emission factor from marginal power plants,
extracted from [46], is shown in Fig. 2, too.
Fig. 2. Load demand (pu), PV daily power production (pu), and hourly CO2 emission factor
Assumed hourly energy price [47] and transmission access fee [35] are shown in
Fig. 3.
0
0,05
0,1
0,15
0,2
0,25
0,3
0,35
0,4
0,45
0,5
0
0,2
0,4
0,6
0,8
1
1,2
1 2 3 4 5 6 7 8 9 1 0 1 1 1 2 1 3 1 4 1 5 1 6 1 7 1 8 1 9 2 0 2 1 2 2 2 3 2 4
CO2
emis
sion
s rat
e (k
g/kW
h)
Load
and
PV
(per
uni
t)
Time (h)
load demand PV production CO2 emissions rate
16
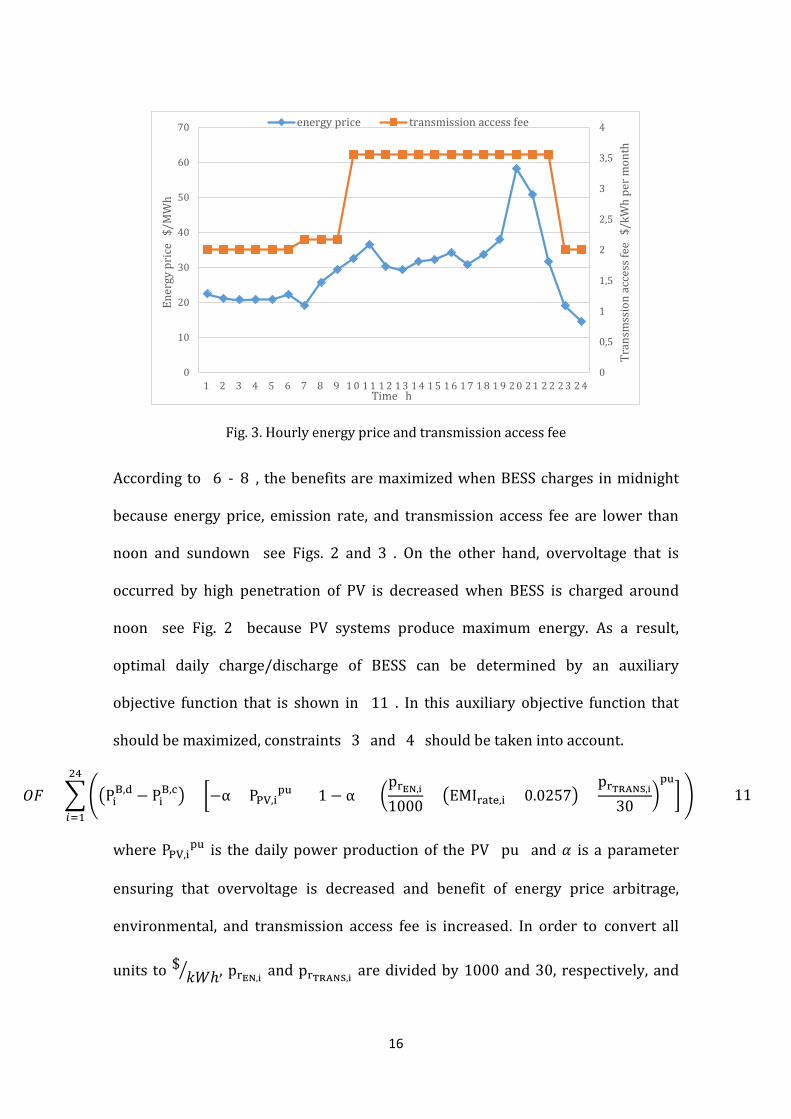
Fig. 3. Hourly energy price and transmission access fee
According to (6)-(8), the benefits are maximized when BESS charges in midnight
because energy price, emission rate, and transmission access fee are lower than
noon and sundown (see Figs. 2 and 3). On the other hand, overvoltage that is
occurred by high penetration of PV is decreased when BESS is charged around
noon (see Fig. 2) because PV systems produce maximum energy. As a result,
optimal daily charge/discharge of BESS can be determined by an auxiliary
objective function that is shown in (11). In this auxiliary objective function that
should be maximized, constraints (3) and (4) should be taken into account.
𝐹𝐹𝐶𝐶 = � ��PiB,d − Pi
B,c� × �−α × PPV,ipu + (1 − α) × �
prEN,i
1000+ �EMIrate,i × 0.0257� +
prTRANS,i
30�
pu� �
24
𝑖𝑖=1
(11)
where PPV,ipu is the daily power production of the PV (pu) and 𝛼𝛼 is a parameter
ensuring that overvoltage is decreased and benefit of energy price arbitrage,
environmental, and transmission access fee is increased. In order to convert all
units to $ 𝑘𝑘𝑘𝑘ℎ� , prEN,i and prTRANS,i are divided by 1000 and 30, respectively, and
0
0,5
1
1,5
2
2,5
3
3,5
4
0
10
20
30
40
50
60
70
1 2 3 4 5 6 7 8 9 1 0 1 1 1 2 1 3 1 4 1 5 1 6 1 7 1 8 1 9 2 0 2 1 2 2 2 3 2 4
Tran
smss
ion
acce
ss fe
e ($
/kW
h pe
r mon
th)
Ener
gy p
rice
($/M
Wh)
Time (h)
energy price transmission access fee
17
EMIrate,i is multiplied by 0.0257 (i.e. damage cost for CO2). With 𝛼𝛼 = 1 the
weighting factor of energy price, emission rate, and transmission access fee factor
is equal to zero, therefore BESS will be scheduled based on the PV production.
Because of negative sign in front of PV production factor, in order to maximize
auxiliary objective function, BESS is scheduled in the opposite of PV production to
charge surplus PV production. Thus, with 𝛼𝛼 = 1, only overvoltage is reduced. With
𝛼𝛼 = 0, the weighting factor of PV production is equal to zero. Therefore, because of
positive sign in front of (1-α), BESS is scheduled to reduce emission rate and
transmission access fee and increase energy price arbitrage. The optimal 𝛼𝛼 is
calculated between 0 and 1 based on objective functions (5) and (11).
In the first step of solving method, GA is run in DIgSILENT program language
(DPL) and initial values of Smax, Wmax, and 𝛼𝛼 are determined and fed to MATLAB.
Then, an auxiliary objective function that is shown in (11) is solved by the LP with
considering constraints (3) and (4), therefore, optimal daily charge/discharge of
BESS are calculated and fed to DIgSILENT. In the next step, number and placement
of BESS are determined by GA in DPL. Then, the cost function of (5) is calculated
considering the voltage magnitude and reverse power flow constraint obtained by
unbalanced 3 phase load flow in DIgSILENT. This procedure continues for a preset
maximum number of iteration (30 here). The flowchart of this method is shown in
Fig. 4.
18
Fig. 4. Optimization flowchart
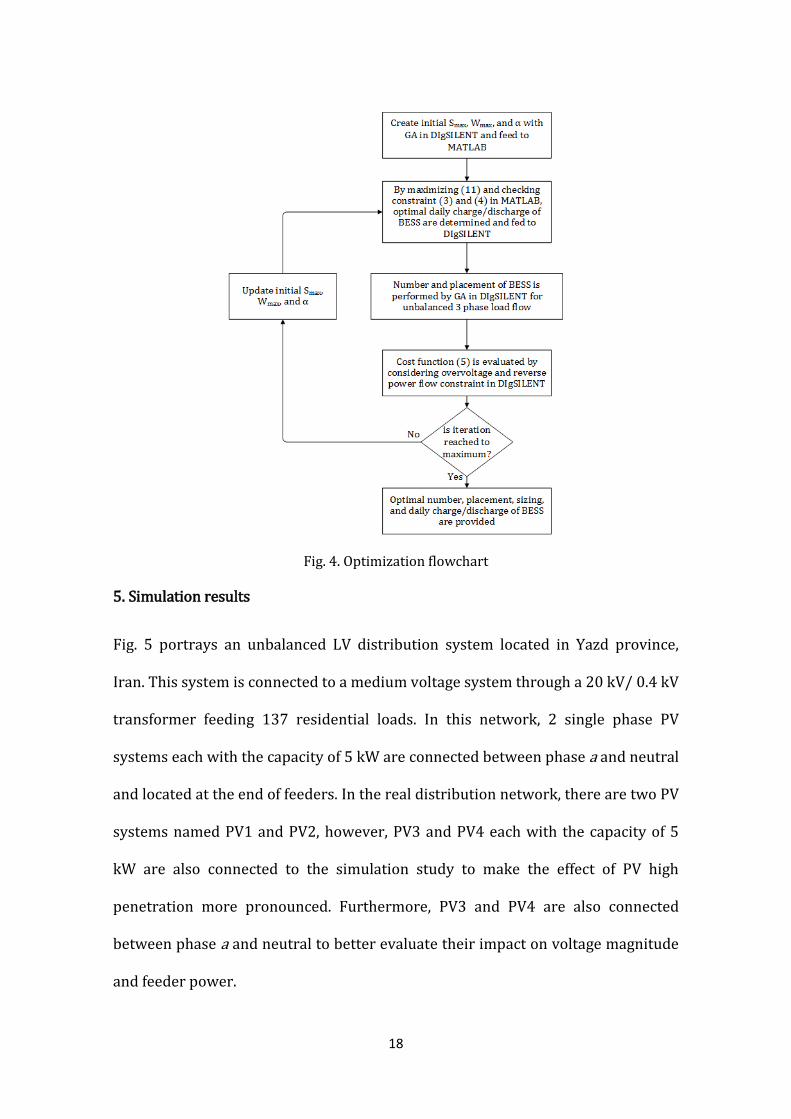
5. Simulation results
Fig. 5 portrays an unbalanced LV distribution system located in Yazd province,
Iran. This system is connected to a medium voltage system through a 20 kV/ 0.4 kV
transformer feeding 137 residential loads. In this network, 2 single phase PV
systems each with the capacity of 5 kW are connected between phase a and neutral
and located at the end of feeders. In the real distribution network, there are two PV
systems named PV1 and PV2, however, PV3 and PV4 each with the capacity of 5
kW are also connected to the simulation study to make the effect of PV high
penetration more pronounced. Furthermore, PV3 and PV4 are also connected
between phase a and neutral to better evaluate their impact on voltage magnitude
and feeder power.
19
In the simulation study, the impact of PV penetration increased to 93% (20 kW) is
evaluated; PV penetration is defined as the ratio of total PV rating power to
maximum apparent power of load. In this regard, note that total maximum active
and reactive load for phase a of the distribution transformer is 19.6 kW and 9
kVAr, equal to 21.6 kVA.
Fig. 5. Unbalanced LV distribution system located in Yazd province, Iran
In order to analyze the impact of PV on this distribution network, three power
analyzers (CHAUVIN-ARNOUX C.A 8335) are used for measurement of PV1 and
PV2 production as well as the imported active power at LV side of distribution
transformer (phases a and b) within 10 days. The measured per unit data are
shown in Fig. 6.
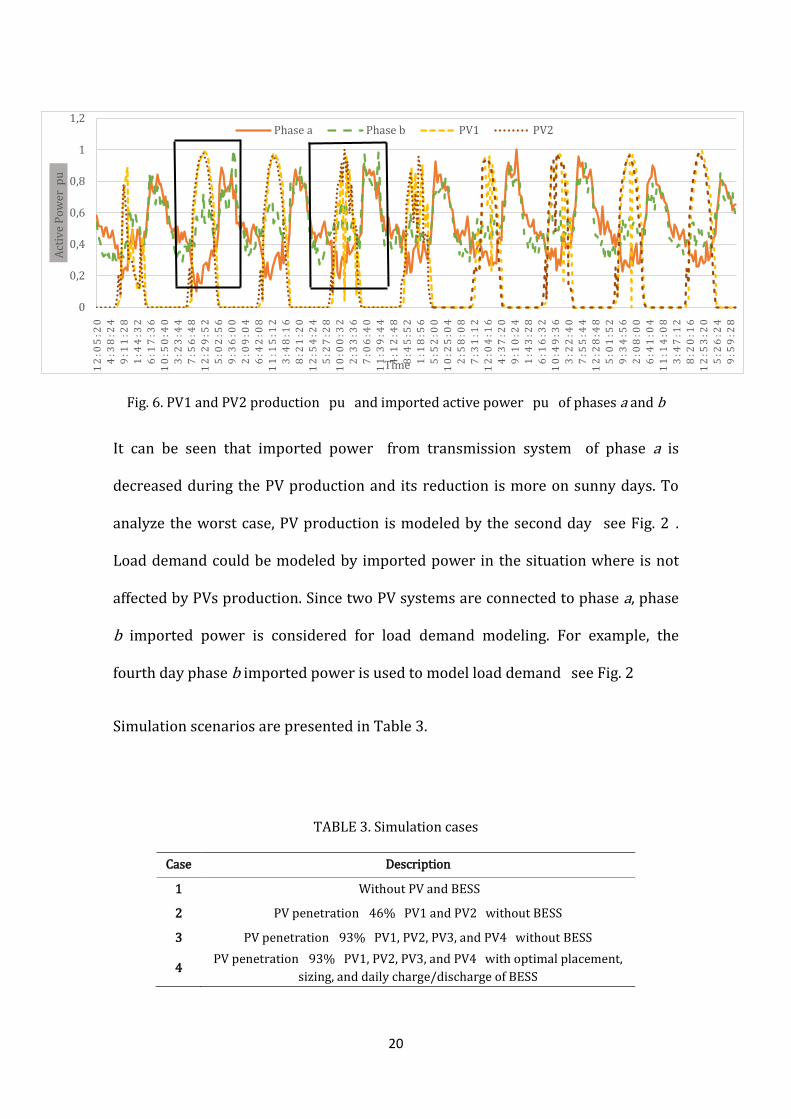
20
Fig. 6. PV1 and PV2 production (pu) and imported active power (pu) of phases a and b
It can be seen that imported power (from transmission system) of phase a is
decreased during the PV production and its reduction is more on sunny days. To
analyze the worst case, PV production is modeled by the second day (see Fig. 2).
Load demand could be modeled by imported power in the situation where is not
affected by PVs production. Since two PV systems are connected to phase a, phase
b imported power is considered for load demand modeling. For example, the
fourth day phase b imported power is used to model load demand (see Fig. 2)
Simulation scenarios are presented in Table 3.
TABLE 3. Simulation cases
Case Description
1 Without PV and BESS
2 PV penetration=46% (PV1 and PV2) without BESS
3 PV penetration=93% (PV1, PV2, PV3, and PV4) without BESS
4 PV penetration=93% (PV1, PV2, PV3, and PV4) with optimal placement,
sizing, and daily charge/discharge of BESS
0
0,2
0,4
0,6
0,8
1
1,2
12
:05
:20
4
:38
:24
9
:11
:28
1
:44
:32
6
:17
:36
1
0:5
0:4
0
3:2
3:4
4
7:5
6:4
8
12
:29
:52
5
:02
:56
9
:36
:00
2
:09
:04
6
:42
:08
1
1:1
5:1
2
3:4
8:1
6
8:2
1:2
0
12
:54
:24
5
:27
:28
1
0:0
0:3
2
2:3
3:3
6
7:0
6:4
0
11
:39
:44
4
:12
:48
8
:45
:52
1
:18
:56
5
:52
:00
1
0:2
5:0
4
2:5
8:0
8
7:3
1:1
2
12
:04
:16
4
:37
:20
9
:10
:24
1
:43
:28
6
:16
:32
1
0:4
9:3
6
3:2
2:4
0
7:5
5:4
4
12
:28
:48
5
:01
:52
9
:34
:56
2
:08
:00
6
:41
:04
1
1:1
4:0
8
3:4
7:1
2
8:2
0:1
6
12
:53
:20
5
:26
:24
9
:59
:28
Activ
e Po
wer
(pu)
Time
Phase a Phase b PV1 PV2
21
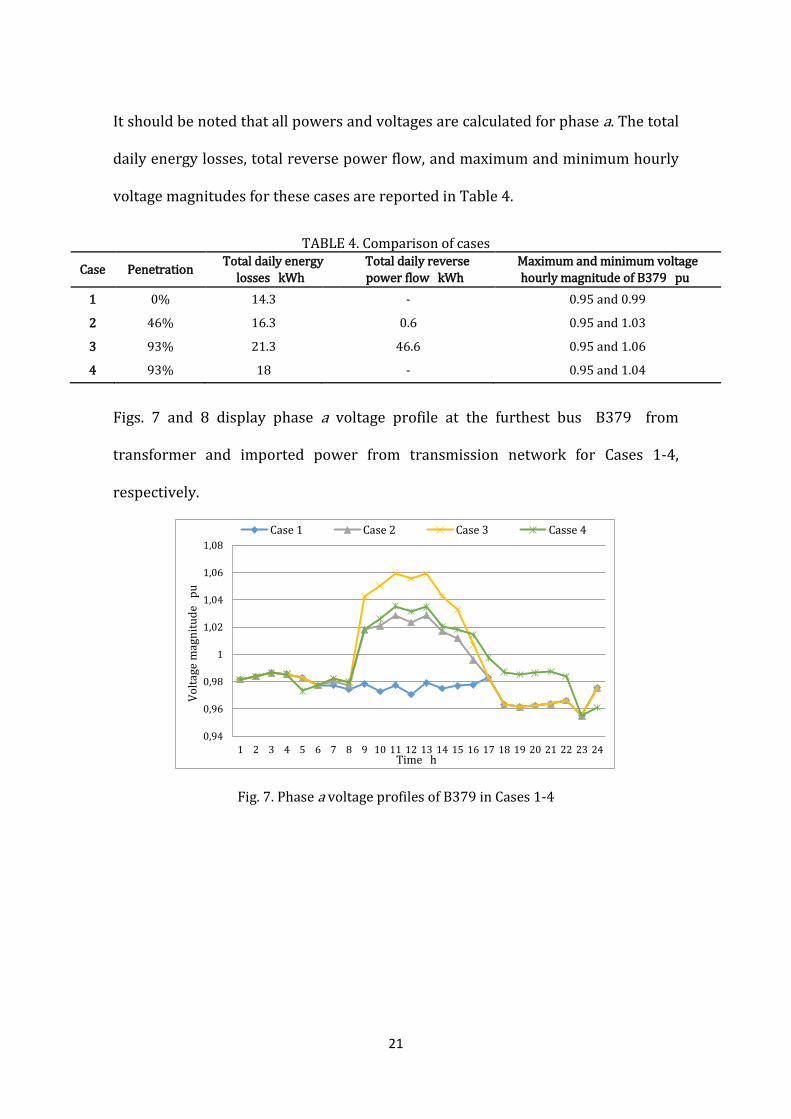
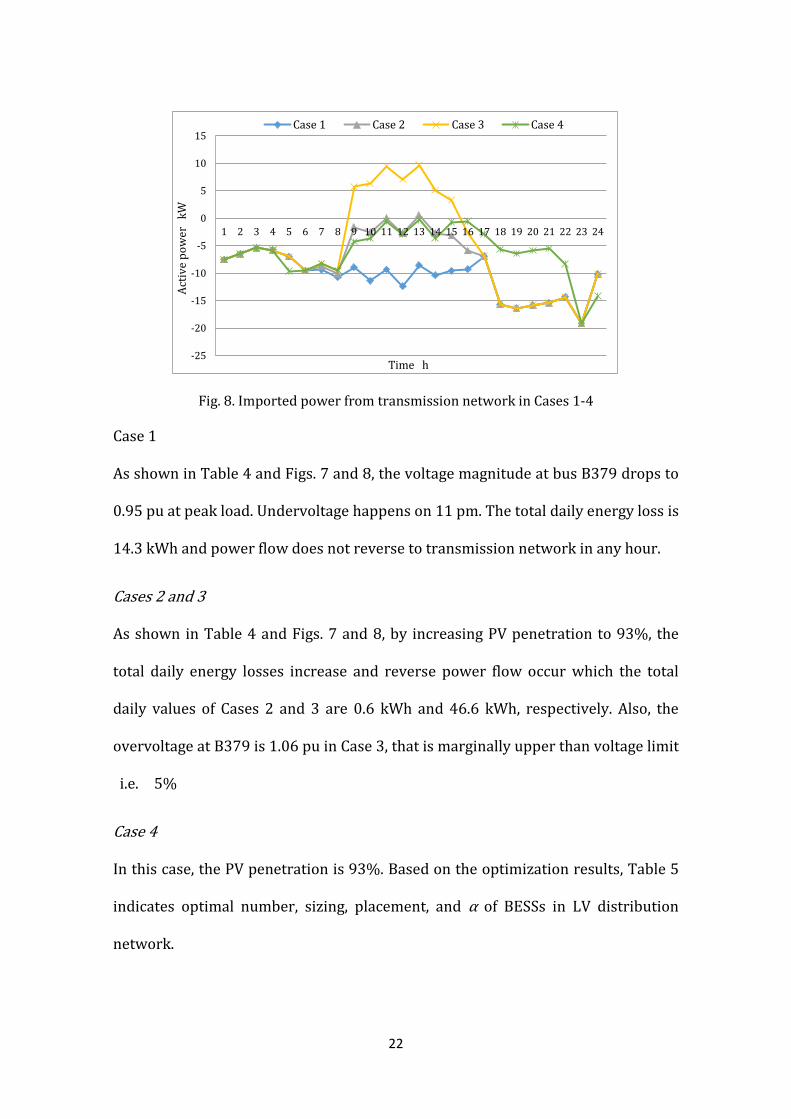
It should be noted that all powers and voltages are calculated for phase a. The total
daily energy losses, total reverse power flow, and maximum and minimum hourly
voltage magnitudes for these cases are reported in Table 4.
TABLE 4. Comparison of cases Case Penetration Total daily energy
losses (kWh) Total daily reverse power flow (kWh)
Maximum and minimum voltage hourly magnitude of B379 (pu)
1 0% 14.3 - 0.95 and 0.99
2 46% 16.3 0.6 0.95 and 1.03
3 93% 21.3 46.6 0.95 and 1.06
4 93% 18 - 0.95 and 1.04
Figs. 7 and 8 display phase a voltage profile at the furthest bus (B379) from
transformer and imported power from transmission network for Cases 1-4,
respectively.
Fig. 7. Phase a voltage profiles of B379 in Cases 1-4
0,94
0,96
0,98
1
1,02
1,04
1,06
1,08
1 2 3 4 5 6 7 8 9 10 11 12 13 14 15 16 17 18 19 20 21 22 23 24
Volta
ge m
agni
tude
(pu)
Time (h)
Case 1 Case 2 Case 3 Casse 4
22
Fig. 8. Imported power from transmission network in Cases 1-4
Case 1
As shown in Table 4 and Figs. 7 and 8, the voltage magnitude at bus B379 drops to
0.95 pu at peak load. Undervoltage happens on 11 pm. The total daily energy loss is
14.3 kWh and power flow does not reverse to transmission network in any hour.
Cases 2 and 3
As shown in Table 4 and Figs. 7 and 8, by increasing PV penetration to 93%, the
total daily energy losses increase and reverse power flow occur which the total
daily values of Cases 2 and 3 are 0.6 kWh and 46.6 kWh, respectively. Also, the
overvoltage at B379 is 1.06 pu in Case 3, that is marginally upper than voltage limit
(i.e. +5%)
Case 4
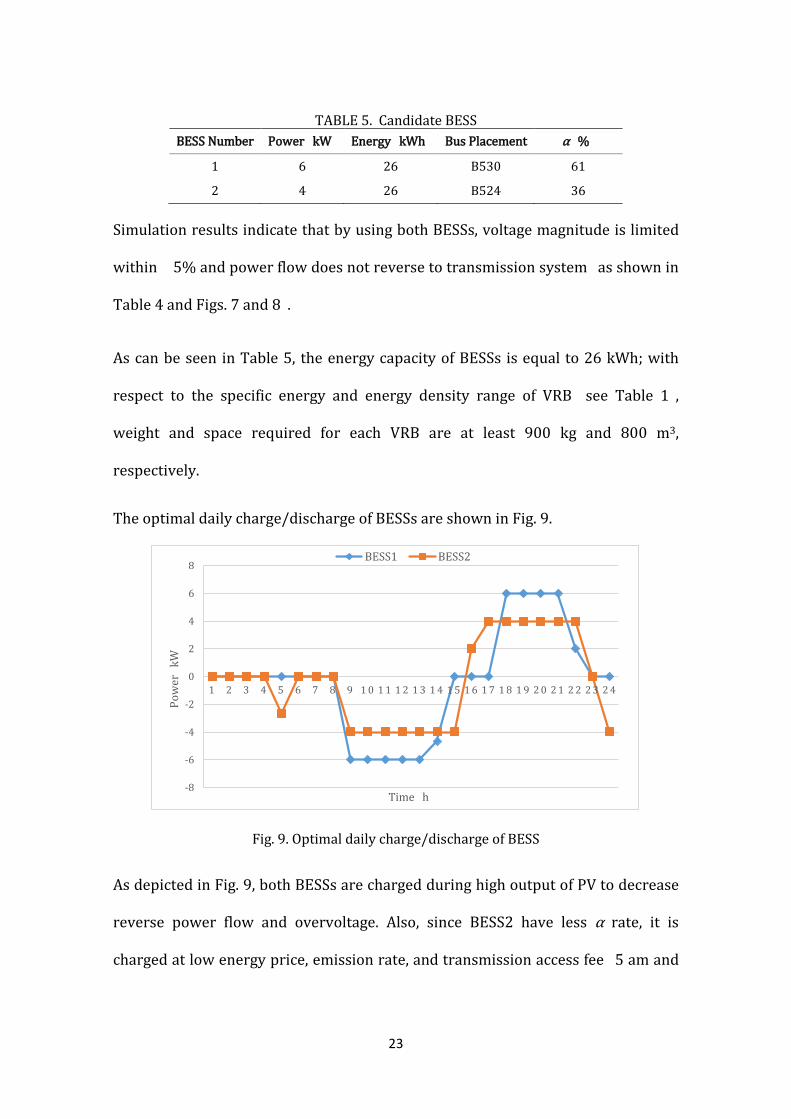
In this case, the PV penetration is 93%. Based on the optimization results, Table 5
indicates optimal number, sizing, placement, and α of BESSs in LV distribution
network.
-25
-20
-15
-10
-5
0
5
10
15
1 2 3 4 5 6 7 8 9 10 11 12 13 14 15 16 17 18 19 20 21 22 23 24
Activ
e po
wer
(kW
)
Time (h)
Case 1 Case 2 Case 3 Case 4
23
TABLE 5. Candidate BESS BESS Number Power (kW) Energy (kWh) Bus Placement α (%)
1 6 26 B530 61
2 4 26 B524 36
Simulation results indicate that by using both BESSs, voltage magnitude is limited
within ±5% and power flow does not reverse to transmission system (as shown in
Table 4 and Figs. 7 and 8).
As can be seen in Table 5, the energy capacity of BESSs is equal to 26 kWh; with
respect to the specific energy and energy density range of VRB (see Table 1),
weight and space required for each VRB are at least 900 kg and 800 m3,
respectively.
The optimal daily charge/discharge of BESSs are shown in Fig. 9.
Fig. 9. Optimal daily charge/discharge of BESS
As depicted in Fig. 9, both BESSs are charged during high output of PV to decrease
reverse power flow and overvoltage. Also, since BESS2 have less α rate, it is
charged at low energy price, emission rate, and transmission access fee (5 am and
-8
-6
-4
-2
0
2
4
6
8
1 2 3 4 5 6 7 8 9 1 0 1 1 1 2 1 3 1 4 1 5 1 6 1 7 1 8 1 9 2 0 2 1 2 2 2 3 2 4
Pow
er (k
W)
Time (h)
BESS1 BESS2

24
24 am) to maximize net benefit. On the other hand, BESS1 is only charged when PV
production is high because of the higher α rate compared with BESS2.
Furthermore, both BESSs are discharged at high energy price, emission rate, and
transmission access fee to maximize the net benefit. Also, due to the BESS losses,
the charged energy is more than discharged energy; accordingly if the BESS
efficiency increases, the economic profit will be higher. As a result, in addition to
self-discharge, cost, and cycle life of BESS, efficiency is an important factor in
choosing battery type.
It can be inferred from Fig. 7 that in Case 4 during PV production, voltage
magnitude is lower than Case 3 and stays within allowable limit due to proper
charging of BESS. Undervoltages at 5 am and 24 am are more pronounced in Case 4
compared to Case 3 because BESS2 is charged in these hours to increase economic
benefit. However, these undervoltages are within allowable limit. On the other
hand, voltage magnitude in Case 4 during peak load, is higher than Case 3. As a
result, the voltage profile in Case 4 is smoother than that of Case 3. In Fig. 10,
hourly voltage magnitudes of some buses in Case 4 are shown.
25
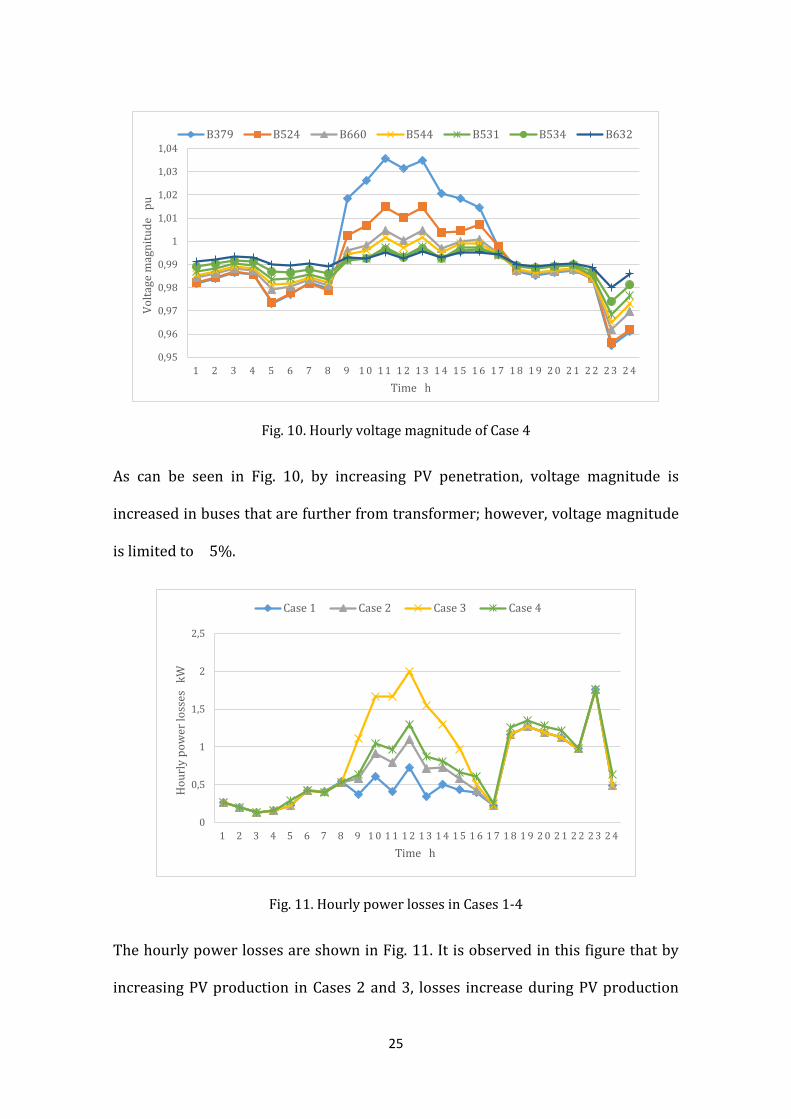
Fig. 10. Hourly voltage magnitude of Case 4
As can be seen in Fig. 10, by increasing PV penetration, voltage magnitude is
increased in buses that are further from transformer; however, voltage magnitude
is limited to ±5%.
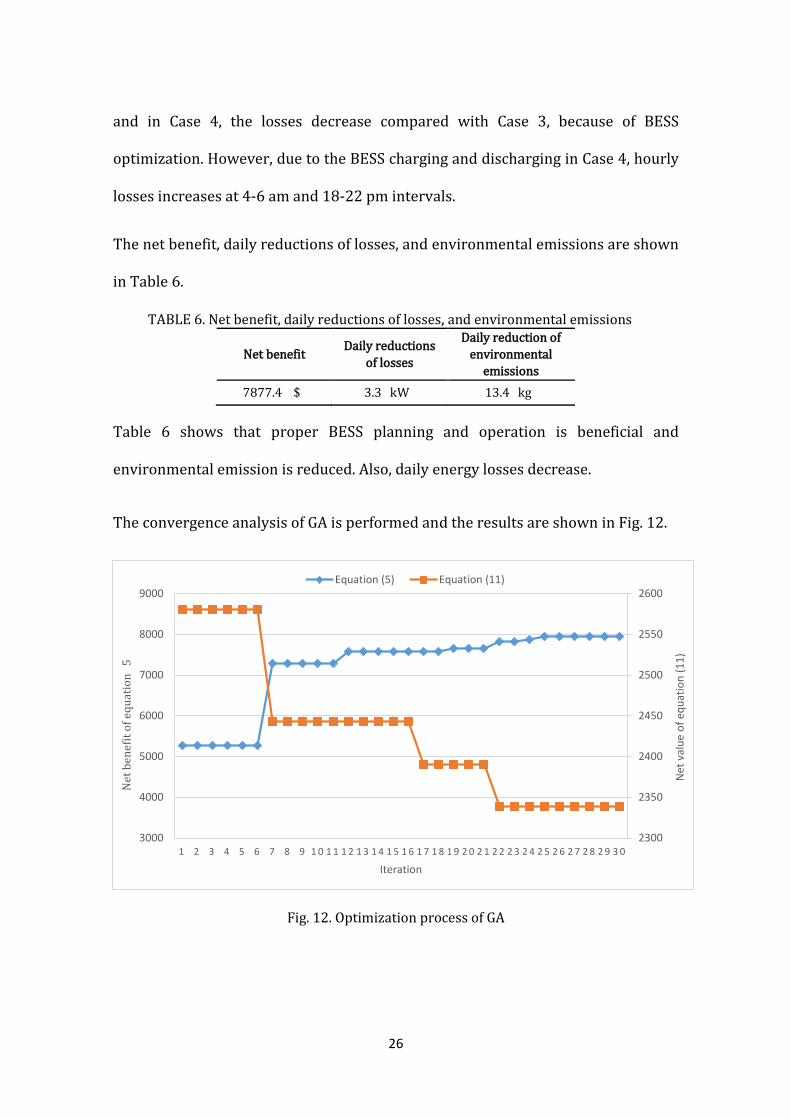
Fig. 11. Hourly power losses in Cases 1-4
The hourly power losses are shown in Fig. 11. It is observed in this figure that by
increasing PV production in Cases 2 and 3, losses increase during PV production
0,95
0,96
0,97
0,98
0,99
1
1,01
1,02
1,03
1,04
1 2 3 4 5 6 7 8 9 1 0 1 1 1 2 1 3 1 4 1 5 1 6 1 7 1 8 1 9 2 0 2 1 2 2 2 3 2 4
Volta
ge m
agni
tude
(pu)
Time (h)
B379 B524 B660 B544 B531 B534 B632
0
0,5
1
1,5
2
2,5
1 2 3 4 5 6 7 8 9 1 0 1 1 1 2 1 3 1 4 1 5 1 6 1 7 1 8 1 9 2 0 2 1 2 2 2 3 2 4
Hou
rly
pow
er lo
sses
(kW
)
Time (h)
Case 1 Case 2 Case 3 Case 4
26
and in Case 4, the losses decrease compared with Case 3, because of BESS
optimization. However, due to the BESS charging and discharging in Case 4, hourly
losses increases at 4-6 am and 18-22 pm intervals.
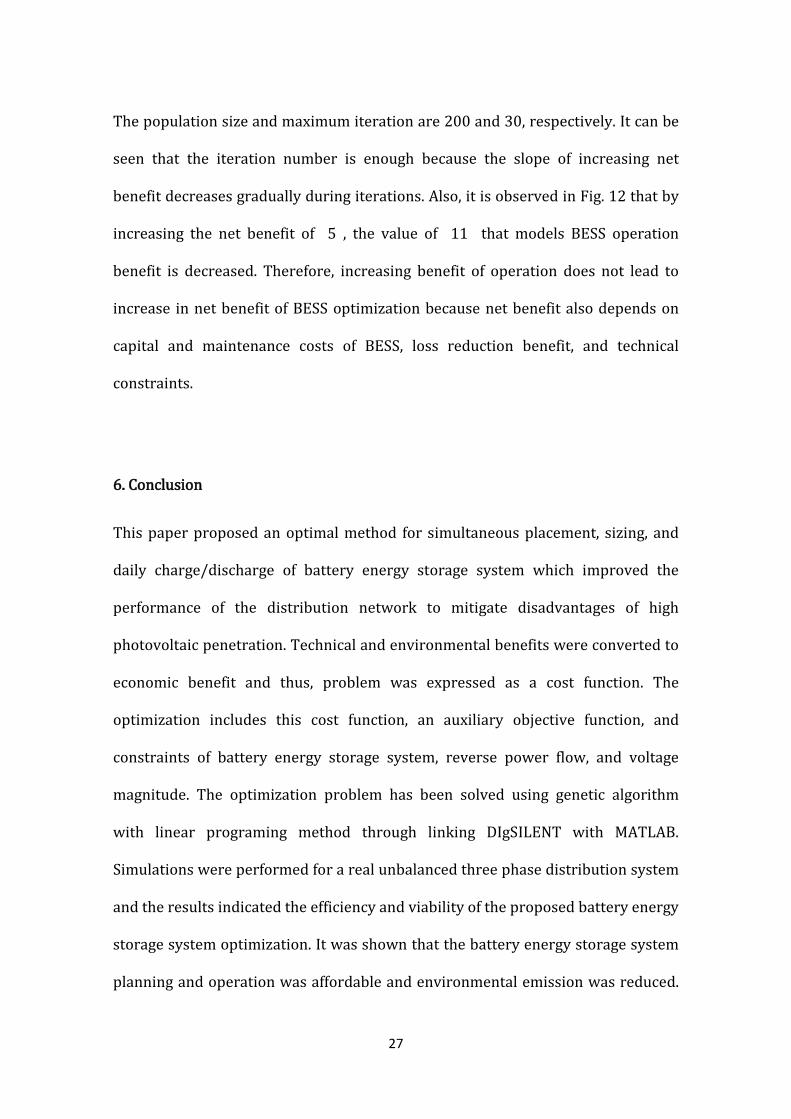
The net benefit, daily reductions of losses, and environmental emissions are shown
in Table 6.
TABLE 6. Net benefit, daily reductions of losses, and environmental emissions
Net benefit Daily reductions of losses
Daily reduction of environmental
emissions 7877.4 ($) 3.3 (kW) 13.4 (kg)
Table 6 shows that proper BESS planning and operation is beneficial and
environmental emission is reduced. Also, daily energy losses decrease.
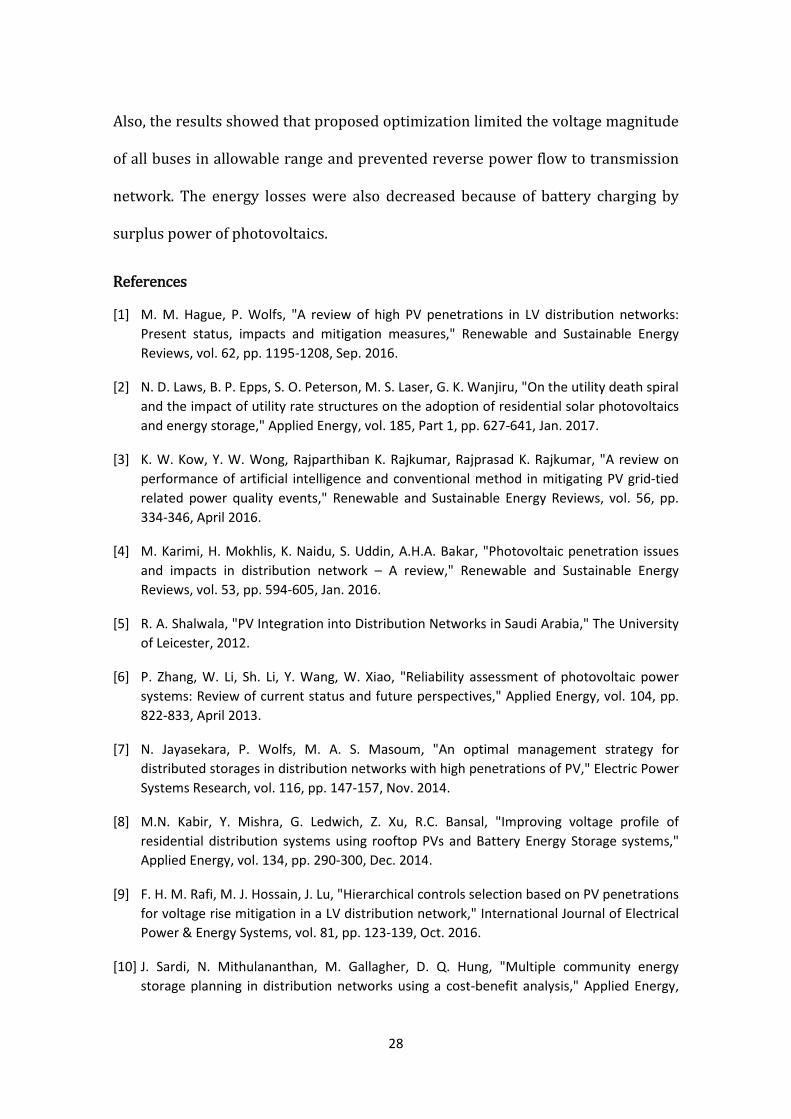
The convergence analysis of GA is performed and the results are shown in Fig. 12.
Fig. 12. Optimization process of GA
2300
2350
2400
2450
2500
2550
2600
3000
4000
5000
6000
7000
8000
9000
1 2 3 4 5 6 7 8 9 1 0 1 1 1 2 1 3 1 4 1 5 1 6 1 7 1 8 1 9 2 0 2 1 2 2 2 3 2 4 2 5 2 6 2 7 2 8 2 9 3 0
Net
val
ue o
f equ
atio
n (1
1)
Net
ben
efit
of e
quat
ion
(5)
Iteration
Equation (5) Equation (11)
27
The population size and maximum iteration are 200 and 30, respectively. It can be
seen that the iteration number is enough because the slope of increasing net
benefit decreases gradually during iterations. Also, it is observed in Fig. 12 that by
increasing the net benefit of (5), the value of (11) that models BESS operation
benefit is decreased. Therefore, increasing benefit of operation does not lead to
increase in net benefit of BESS optimization because net benefit also depends on
capital and maintenance costs of BESS, loss reduction benefit, and technical
constraints.
6. Conclusion
This paper proposed an optimal method for simultaneous placement, sizing, and
daily charge/discharge of battery energy storage system which improved the
performance of the distribution network to mitigate disadvantages of high
photovoltaic penetration. Technical and environmental benefits were converted to
economic benefit and thus, problem was expressed as a cost function. The
optimization includes this cost function, an auxiliary objective function, and
constraints of battery energy storage system, reverse power flow, and voltage
magnitude. The optimization problem has been solved using genetic algorithm
with linear programing method through linking DIgSILENT with MATLAB.
Simulations were performed for a real unbalanced three phase distribution system
and the results indicated the efficiency and viability of the proposed battery energy
storage system optimization. It was shown that the battery energy storage system
planning and operation was affordable and environmental emission was reduced.
28
Also, the results showed that proposed optimization limited the voltage magnitude
of all buses in allowable range and prevented reverse power flow to transmission
network. The energy losses were also decreased because of battery charging by
surplus power of photovoltaics.
References
[1] M. M. Hague, P. Wolfs, "A review of high PV penetrations in LV distribution networks: Present status, impacts and mitigation measures," Renewable and Sustainable Energy Reviews, vol. 62, pp. 1195-1208, Sep. 2016.
[2] N. D. Laws, B. P. Epps, S. O. Peterson, M. S. Laser, G. K. Wanjiru, "On the utility death spiral and the impact of utility rate structures on the adoption of residential solar photovoltaics and energy storage," Applied Energy, vol. 185, Part 1, pp. 627-641, Jan. 2017.
[3] K. W. Kow, Y. W. Wong, Rajparthiban K. Rajkumar, Rajprasad K. Rajkumar, "A review on performance of artificial intelligence and conventional method in mitigating PV grid-tied related power quality events," Renewable and Sustainable Energy Reviews, vol. 56, pp. 334-346, April 2016.
[4] M. Karimi, H. Mokhlis, K. Naidu, S. Uddin, A.H.A. Bakar, "Photovoltaic penetration issues and impacts in distribution network – A review," Renewable and Sustainable Energy Reviews, vol. 53, pp. 594-605, Jan. 2016.
[5] R. A. Shalwala, "PV Integration into Distribution Networks in Saudi Arabia," The University of Leicester, 2012.
[6] P. Zhang, W. Li, Sh. Li, Y. Wang, W. Xiao, "Reliability assessment of photovoltaic power systems: Review of current status and future perspectives," Applied Energy, vol. 104, pp. 822-833, April 2013.
[7] N. Jayasekara, P. Wolfs, M. A. S. Masoum, "An optimal management strategy for distributed storages in distribution networks with high penetrations of PV," Electric Power Systems Research, vol. 116, pp. 147-157, Nov. 2014.
[8] M.N. Kabir, Y. Mishra, G. Ledwich, Z. Xu, R.C. Bansal, "Improving voltage profile of residential distribution systems using rooftop PVs and Battery Energy Storage systems," Applied Energy, vol. 134, pp. 290-300, Dec. 2014.
[9] F. H. M. Rafi, M. J. Hossain, J. Lu, "Hierarchical controls selection based on PV penetrations for voltage rise mitigation in a LV distribution network," International Journal of Electrical Power & Energy Systems, vol. 81, pp. 123-139, Oct. 2016.
[10] J. Sardi, N. Mithulananthan, M. Gallagher, D. Q. Hung, "Multiple community energy storage planning in distribution networks using a cost-benefit analysis," Applied Energy,
29
vol. 190, pp. 453-463 , March 2017.
[11] E. Reihani, R. Ghorbani, "Load commitment of distribution grid with high penetration of photovoltaics (PV) using hybrid series-parallel prediction algorithm and storage," Electric Power Systems Research, vol. 131, pp. 224-230, Feb. 2016.
[12] E. Grover-Silva, R. Girard, G. Kariniotakis, "Optimal sizing and placement of distribution grid connected battery systems through an SOCP optimal power flow algorithm," Applied Energy, vol. 2198, pp. 385-393, June 2018.
[13] S. Hashemi, J. Ostergaard, Y. Guangya, "A Scenario-Based Approach for Energy Storage Capacity Determination in LV Grids With High PV Penetration," IEEE Transactions on Smart Grid, vol. 5, no. 3, pp. 1514-1522, May 2014.
[14] Ch. J. Bennett, R. A. Stewart, J. W. Lu, "Development of a three-phase battery energy storage scheduling and operation system for low voltage distribution networks," Applied Energy, vol. 146, pp. 122-134, May 2015.
[15] Q. Li, R. Ayyanar and V. Vittal, "Convex Optimization for DES Planning and Operation in Radial Distribution Systems with High Penetration of Photovoltaic Resources," IEEE Transactions on Sustainable Energy, vol. 7, no. 3, pp. 985-995, July 2016.
[16] J. Sardi, N. Mithulananthan, D. Q. Hung, "Strategic allocation of community energy storage in a residential system with rooftop PV units," Applied Energy, vol. 206, pp. 159-171, Nov. 2017.
[17] L. Xiaohu, A. Aichhorn, L. Liming, L. Hui, "Coordinated Control of Distributed Energy Storage System With Tap Changer Transformers for Voltage Rise Mitigation Under High Photovoltaic Penetration," IEEE Transactions on Smart Grid, vol. 3, no. 2, pp. 897-906, June 2012.
[18] P.F. Lyons, N.S. Wade, T. Jiang, P.C. Taylor, D. Miller, "Design and analysis of electrical energy storage demonstration projects on UK distribution networks," Applied Energy, vol. 137, pp. 677-691, Jan. 2015.
[19] Y. Yang, H. Li, A. Aichhorn, J. Zheng, M. Greenleaf, "Sizing Strategy of Distributed Battery Storage System With High Penetration of Photovoltaic for Voltage Regulation and Peak Load Shaving," IEEE Transactions on Smart Grid, vol. 5, no. 2, pp. 982-991, Mar 2014.
[20] Kh. Mahani, F. Farzan, M. A. Jafari, "Network-aware approach for energy storage planning and control in the network with high penetration of renewables," Applied Energy, vol. 195, pp. 974-990, Juan 2017.
[21] M. J. E. Alam, K. M. Muttaqi, D. Sutanto, "Mitigation of Rooftop Solar PV Impacts and Evening Peak Support by Managing Available Capacity of Distributed Energy Storage Systems," IEEE Transactions on power systems, vol. 28, no. 4, Nov. 2013.
[22] H. Jia, Ch. Wanga, P. Lia, J. Zhaoa, G. Songa, J. Wub, "Quantified flexibility evaluation of soft open points to improve distributed generator penetration in active distribution
30
networks based on difference-of-convex programming," Applied Energy, vol. 218, pp. 338-348, May 2018.
[23] M. Chen, G. Zou, X. Jin, Zh. Yao, Y. Liu, H. Yin, "Optimal Allocation method on Distributed Energy Storage System in Active Distribution Network," Energy Procedia, vol. 141, no. 4, pp. 525-531, Dec. 2017.
[24] J. M. Santos, P. S. Moura, A. T. de Almeida, "Technical and economic impact of residential electricity storage at local and grid level for Portugal," Applied Energy, vol. 128, pp. 254-264, Sep. 2014.
[25] O. Babacan, W. Torre, J. Kleissl, "Siting and sizing of distributed energy storage to mitigate voltage impact by solar PV in distribution systems," Solar Energy, vol. 146, pp. 199-208, April. 2017.
[26] L. Bai, T. Jiang, F. Li, H. Chen, X. Li, "Distributed energy storage planning in soft open point based active distribution networks incorporating network reconfiguration and DG reactive power capability," Applied Energy, vol. 210, pp. 1082-1091, Jan. 2018.
[27] J. Xiao, Z. Zhang, L. Bai and H. Liang, "Determination of the optimal installation site and capacity of battery energy storage system in distribution network integrated with distributed generation," IET Generation, Transmission & Distribution, vol. 10, no. 3, pp. 601-607, Feb. 2016.
[28] M. Daghi, M. Sedghi, A. Ahmadian, M. Aliakbar-Golkar, "Factor analysis based optimal storage planning in active distribution network considering different battery technologies," Applied Energy, vol 183, pp. 456-469, Dec. 2016.
[29] N. Jayasekara, M. A. S. Masoum and P. J. Wolfs, "Optimal Operation of Distributed Energy Storage Systems to Improve Distribution Network Load and Generation Hosting Capability," IEEE Transactions on Sustainable Energy, vol. 7, no. 1, pp. 250-261, Jan. 2016.
[30] A. Nagarajan and R. Ayyanar, "Design and Strategy for the Deployment of Energy Storage Systems in a Distribution Feeder with Penetration of Renewable Resources," IEEE Transactions on Sustainable Energy, vol. 6, no. 3, pp. 1085-1092, July 2015.
[31] M. Aneke, M. Wang, "Energy storage technologies and real life applications – A state of the art review," Applied Energy, vol. 179, pp. 350-377, Oct. 2016.
[32] A. Oudalov, D. Chartouni, C. Ohler, G. Linhofer, "Value Analysis of Battery Energy Storage Applications in Power Systems," Power Systems Conference and Exposition, pp. 2206–2211, Oct. 29 2006 - Nov. 1 2006.
[33] M. Beaudin, H. Zareipour, A. Schellenberglabe, W. Rosehart, "Energy storage for mitigating the variability of renewable electricity sources: An updated review," Energy for Sustainable Development, vol. 14, no. 4, pp. 302-314, Dec. 2010.
[34] H. Chen, Th. N. Cong, W. Yang, Ch. Tan, Y. Ding, "Progress in electrical energy storage system: A critical review," Progress in Natural Science, vol. 19, no. 3, pp. 291-312, march
31
2009 .
[35] R. C. Leou, "An economic analysis model for the energy storage system applied to a distribution substation," International Journal of Electrical Power & Energy Systems, vol. 34, no. 1, pp. 132-137, Jan. 2012.
[36] F. D. González, A. Sumper, O. G. Bellmunt, R. V. Robles, "A review of energy storage technologies for wind power applications," Renewable and Sustainable Energy Reviews, Vol. 16, no. 4, pp. 2154-2171, May 2012.
[37] "EPRI-DOE Handbook Supplement of Energy Storage for Grid Connected Wind Generation Applications," Technical Update, Dec. 2004.
[38] "Electricity cost from Renewable Energy Technologies in Egypt," Fraunhofer Institute for Solar Energy System ISE, Dec. 2016.
[39] F. A. Chacra, P. Bastard, G. Fleury and R. Clavreul, "Impact of energy storage costs on economical performance in a distribution substation," IEEE Transactions on Power Systems, vol. 20, no. 2, pp. 684-691, May 2005.
[40] "Valuation of the external costs and benefits to health and environment of waste management options," Final report for Defra by Enviros Consulting Limited in association with EFTEC, Dec. 2004.
[41] A. Rabl, J. V. Spadaro, A. Zoughaib, "Environmental Impacts and Costs of Solid Waste: A Comparison of Landfill and Incineration," Waste Management & Research, vol. 26, pp. 147-162, April 2008.
[42] "Transportation Cost and Benefit Analysis: Techniques, Estimates and Implications," Victoria Transport Policy Institute, Oct. 2016.
[43] "Economic and Social Dimensions of Climate Change," Intergovernmental Panel on Climate Change (IPCC), 1996.
[44] L. Dobes, J. Leung and G. Argyrous, "Social cost-benefit analysis in Australia and New Zealand: the state of current practice and what needs to be done," ANU Press, 2016.
[45] D. Burtt, P. Dargusch, "The cost-effectiveness of household photovoltaic systems in reducing greenhouse gas emissions in Australia: Linking subsidies with emission reductions," Applied Energy, vol. 148, pp. 439-448, June 2015.
[46] A. Talaei, K. Begg and T. Jamasb, "The Large Scale Roll-Out of Electric Vehicles: The Effect on the Electricity Sector and CO2 Emissions," EPRG Working Paper 1222, Oct. 2012.
[47] M. Alamaniotis, Ni. Gatsis, L. H. Tsoukalas, "Virtual Budget: Integration of electricity load and price anticipation for load morphing in price-directed energy utilization," Electric Power Systems Research, vol. 158, pp. 284-296, May 2018.