Embed Size (px)
Citation preview
Aalborg Universitet
Effects of noise overexposure on distortion product otoacoustic emissions
De Toro, Miguel Angel Aranda
Publication date:2011
Document VersionEarly version, also known as pre-print
Link to publication from Aalborg University
Citation for published version (APA):de Toro, M. A. A. (2011). Effects of noise overexposure on distortion product otoacoustic emissions: Auditoryhazard from impulsive occupational exposures. Aalborg Universitet: Acoustics, Department of ElectronicSystems, Aalborg University.
General rightsCopyright and moral rights for the publications made accessible in the public portal are retained by the authors and/or other copyright ownersand it is a condition of accessing publications that users recognise and abide by the legal requirements associated with these rights.
? Users may download and print one copy of any publication from the public portal for the purpose of private study or research. ? You may not further distribute the material or use it for any profit-making activity or commercial gain ? You may freely distribute the URL identifying the publication in the public portal ?
Take down policyIf you believe that this document breaches copyright please contact us at [email protected] providing details, and we will remove access tothe work immediately and investigate your claim.
Downloaded from vbn.aau.dk on: marts 27, 2018
THESIS FOR THE DEGREE OF DOCTOR OF PHILOSOPHY
Effects of noise overexposure on distortion
product otoacoustic emissions
– Auditory hazard from impulsive occupational exposures –
Miguel Angel Aranda de Toro
Section of AcousticsDepartment of Electronic Systems
Aalborg UniversityAalborg, Denmark 2010

2

Preface
This thesis is submitted to the Faculty of Engineering and Science at Aalborg Uni-versity in partial fulfillment of the requirements for the Ph.D. degree. The work hasbeen carried out in the time period October 2005–2008 at the Section of Acoustics,Department of Electronic Systems, Aalborg University.
The thesis is organized as an accumulation of papers consisting of two journalpapers and one conference paper. The thesis starts with a general description ex-plaining the scope of the investigation, the background theory supporting this workand the experimental approach. The main results are also presented and discussed.The papers are included at the end of the thesis.
Financial support by the STVF framework programme 97011320 Research inhuman sound perception - with special reference to electroacoustic applications -sponsored by the Danish National Research Council, is sincerely acknowledged.
I would like to express my most sincere gratitude to the following people whosupported me during my PhD work: First of all, to my supervisor professor DorteHammershøi for her extraordinary ability to challenge myself both professionally andpersonally. For her constant guidance, scientific and technical expertise, discussionsand sincere criticism. Secondly, to my co-supervisor associate professor RodrigoOrdonez who has supervised my work since my early days as a master studentat Aalborg University. From Rodrigo I admire his scientific curiosity, his passionand academic enthusiasm. I always enjoyed the discussions with Rodrigo becausehe always came up with new perspectives that sharpened up my own knowledge.Special thanks to associate professor Karen Reuter. This work would not have beenpossible without her previous and invaluable work on otoacoustic emissions. I alsothank Karen for her remarkable experience and helpful advices.
Special thanks to all the staff at the Section of Acoustics at Aalborg University,also those who left. I was a foreigner studying abroad but I always felt at home.
Special thanks to Mette Billeskov and Lone Engen for their fantastic and efficientadministrative work, and most importantly for always having such an honest andwarm smile so early in the mornings. I also thank Claus Vestergaard and PeterDissing for their immediate and most appreciated technical help in the laboratory.Special thanks also to the three members of the assessment committee for theirhelpful comments.
Finally, I would like to thank all the subjects who participated in the experimentsfor their constant positive attitude
Miguel Angel Aranda de Toro
Copenhagen, 2010
3

4
List of papers
∙ PAPER I:M. A. Aranda de Toro, R. Ordonez, K. Reuter and D. Hammershøi,Recovery of distortion product otoacoustic emissions after a 2-kHz monauralsound-exposure in humans: effects on fine structures. Accepted for publicationat the Journal of the Acoustical Society of America with manuscript numberMS# 10-08995R (accepted 30th of September, 2010).
∙ PAPER II: M. A. Aranda de Toro, R. Ordonez, K. Reuter and D. Ham-mershøi, Is it necessary to penalize impulsive noise +5 dB due to higher riskof hearing damage?. Submitted for publication to the Journal of the Acous-tical Society of America and currently in the second revision process withmanuscript number MS# 10-08966R (last submitted 24th of September 2010).
∙ PAPER III: M. A. Aranda de Toro, R. Ordonez and D. Hammershøi, Opti-mization of distortion product otoacoustic emission (DPOAE) measurementswith the system ILO96, Proceedings of 19th International Congress on Acous-tics -ICA07-, Madrid: Spanish Acoustical Society, volume ID0943, 92–104(2007).
5

6

Summary
Industrial workers are often exposed to noise levels that can damage their hearing.The risk of noise-induced hearing loss (NIHL) can be predicted according to theInternational Standard ISO 1999:1990. Unfortunately, the validity of the methodestablished by the standard to correctly predict the risk of hearing loss for all typesof noise exposures is still under question.
One controversial aspect refers to noises of impulsive character. The currentconception is that the risk of NIHL from all types of existing noise in industrialenvironments can be predicted on an energy basis. For this reason, the standardestablishes the same assessment method for all types of noise, also impulsive, basedon readings of the total A-weighted acoustic energy of the noise within the durationof the exposure (LAeq,T ), normalized to a normal working day of eight hours LEX,8ℎ.Several studies have shown that for equal amounts of energy impulsive noise maybe more dangerous for our hearing than continuous noise. For this reason, ISO1999:1990 allows adding a +5 dB penalty when measuring noises of impulsive char-acter based on the presumption that they might pose a higher hazard of hearingloss. Nevertheless, the penalty is a precautionary measure and currently there isnot enough systematic data to demonstrate its validity –nor to determine whetherall types of impulse noise must be penalized.
The evaluation of hearing ability and diagnosis of hearing loss is typically per-formed with standardized pure-tone audiometries. However, otoacoustic emissions(OAEs) may provide a more sensitive diagnosis tool to evaluate risk of NIHL. Lon-gitudinal and cross-sectional studies have shown that OAEs can diminish beforehearing levels in populations exposed to high levels of noise – which suggests thatchanges in the properties of OAEs could be preclinical indicators of NIHL. Un-fortunately, our understanding of OAEs is not complete and researchers are stillinvestigating how to optimize OAE measurements in order to provide the maximuminformation regarding the healthy functioning of the inner ear and its vulnerabilityto noise.
In the present dissertation, 16 normal-hearing human subjects were exposed tomoderate noise-stimuli under laboratory conditions in two different experiments.The effect of the noise stimuli on the hearing of the subjects was monitored withmeasurements of distortion-product otoacoustic emissions (DPOAEs). The exper-iments were restricted to evaluate temporary changes on the characteristics of theDPOAEs - and therefore reversible. The underlying mechanisms between temporaryand permanent auditory changes are likely to be physiologically different. For thisreason, our results cannot be directly extrapolated to prolonged exposures in realindustrial settings. However, the presence of a higher temporary change in one ofthe stimuli may be indicative of a higher risk of NIHL.
The experiments had the following purposes:
1. To investigate the validity of the +5 dB for impulsiveness for predicting risk
7

8
of NIHL. Subjects were exposed for 10 minutes to two types of binauralindustrial-recordings: (1) a continuous broad-band noise normalized to LEX,8ℎ =80 dBA; and (2) the combination of the previous stimulus with an impulsivenoise normalized to LEX,8ℎ = 75 + 5dBpenalty = 80 dBA (peak level 117 dBCand repetition rate of 0.5 impacts per second). DPOAEs were measured ina broad frequency range before and in the following 90 minutes after the ex-posure. The assumption is that, if the penalty is correct, both stimuli mayproduce a similar effect on the DPOAEs.
2. To investigate methodological aspects of DPOAE measurements that mightimprove hearing diagnosis and detection of hearing loss. In particular, it wasstudied whether the fine structures of the DPOAE are systematically affectedafter a tonal overexposure; and whether the evaluation of the fine structuresmight provide more information about the vulnerability of the inner ear thanthe DPOAE level alone. Subjects were exposed monaurally during 10 minutesto a 2 kHz tone normalized to an exposure level LEX,8ℎ of 80 dBA. DPOAEswere measured before and in the following 70 minutes after the exposure. Theexperimental protocol allowed measurements with high time and frequencyresolution in a 1/3 octave-band centered at 3 kHz.
The results indicate that:
1. The continuous exposure had a bigger impact on DPOAE levels, with a maxi-mum DPOAE shift of approximately 5 dB in the frequency range 2−3.15 kHzduring the first 10 minutes of the recovery. No evident DPOAE shift is seenfor the impulsive+continuous exposure. The results indicate that the penaltyoverestimated the effects on DPOAE levels and support the conception thatthe risk of hearing loss from low-level impulses may be predicted on an equal-energy basis.
2. The fine structures of the DPOAE are highly individual and no systematicchange was observed after noise overexposure. Therefore, the evaluation ofthe fine structures might not be a better indicator of risk of hearing loss. Onthe contrary, the differences across subjects can complicate the interpretationand comparison of results.

Resume
Virkningerne ved overeksponering for støj pa Distortion
Product Otoacoustic Emissions – Risikoen for høreskaderved eksponeringer for impulsstøj pa arbejdspladsen
Industriarbejdere er ofte udsat for støjniveauer, der kan beskadige deres hørelse.Risikoen for støj induceret høretab (noise-induced hearing loss, NIHL) kan bestemmesi henhold til den internationale standard ISO 1999:1990. Desværre er gyldighedenaf metoden, til korrekt at kunne forudsige risikoen for høretab af alle typer af støj,stadig ikke verificeret.
Et kontroversielt aspekt omhandler støj af impulsiv karakter. Den nuværendeopfattelse er, at risikoen for NIHL som følge af alle former for eksisterende støj iindustrielle miljøer kan estimeres ud fra en energi basis. Derfor er der indført enstandardmetode til vurdering af alle typer af støj, inklusiv impulsiv støj. Dissemalinger er baseret pa den samlede A-vgtede lydenergi af støjen i varigheden afeksponeringen (LAeq,T ), som er normaliseret til en normal arbejdsdag pa otte timerLEX,8ℎ. Flere undersøgelser har vist, at for lige store mængder af energi, impulsstøjkan være mere farlig for vores hørelse end kontinuerlig støj. Af den grund tilladerISO 1999:1990 at tilfje en +5 dB straf, nar der males lyde af impulsiv karakterbaseret pa den formodning at den impulsive lyd udgør en større farer for høretab .Ikke desto mindre er sanktionen en forebyggende foranstaltning, da der i øjeblikketikke foreligger tilstrækkelig systematiske data til at pavise +5 dB straffens gyldighed.Eller til at afgøre, om alle typer af impuls støj skal straffes.
Evalueringen af hørelsen og diagnosticeringen af høretab bliver typisk udfrt medden standardiserede ren-tone audiometri. Men den seneste indførelse af otoakustiskeemissioner (OAE) kan give en mere følsom diagnosticering til evaluering af risikoenfor NIHL. Forløbsundersøgelser og tværsnits studier har vist at OAE kan formindskefr audiogrammet hos grupper der er udsat for høje støjniveauer - hvilket antyder atændringer i karakteren af det indre øre kan være prækliniske indikatorer pa NIHL.Desværre er, vores forstaelse af OAE mangelfuld, og forskningen er stadig igang medat undersøge, hvordan man kan optimere OAE malinger. Hensigten er at give debedst mulige oplysninger om den sunde funktion af det indre øre og dens sarbarhedover for støj.
I den foreliggende afhandling blev, 16 normalt hørende forsøgspersoner, udsatfor moderat støj-stimuli under laboratorieforhold ved to forskellige forsøg. Effek-ten af støj-stimulien pa hørelsen hos forsøgspersonen blev overvaget med malingeraf distortion-product otoacoustic emissions (DPOAEs). Eksperimenterne var be-grænset til at evaluere midlertidige ændringer i karakteristikaene af DPOAEs - ogvar derfor reversible. De underliggende mekanismer mellem midlertidige og per-manente auditive forandringer er sandsynligvis fysiologisk forskellige. Derfor kanvores resultater ikke ekstrapoleres til vedvarende eksponering i virkelige industrielle
9
10
miljøer. Ikke desto mindre, kan tilstedeværelse af en høj midlertidig forandring i enaf stimuliene være en indikator pa en højere risiko for NIHL.
Forsøgene havde følgende formal:
1. At undersøge, om antagelsen af at impulsiv industriel støj kan udgøre en størrerisiko for høretab end kontinuerlig støj med samme energiniveau. Forsøgspersonerneblev i 10 minutter udsat for to typer af binaural optagelser: (1) en kontin-uerlig bredt bandet støj normaliseret til LEX,8ℎ = 80 dBA, og en (2) kombi-nation af den tidligere stimulus med støj af impulsiv karakter normaliseret tilLEX,8ℎ = 75 + 5dBstraf = 80 dBA. (peak niveau 117 dBC og en gentagelsesrate pa 0.5 slag pr sekund). DPOAEs blev ma lt i et bredt frekvens omrade førog i de efterfølgende 90 minutter efter eksponeringen. Antagelsen er, at hvisstraffen er korrekt, vil begge stimuli producere den samme effekt pa DPOAEs.
2. At undersøge de metodologiske aspekter af DPOAE malinger, som kunneforbedre diagnoseringen og pavisningen af høretab. Især blev det undersøgt,om finstrukturen i DPOAE bliver systematisk pavirket efter en tonal overek-sponering, og om evalueringen af finstrukturen kan give flere oplysninger omsarbarheden i det indre øre end paDPOAE niveauet alene. Forsøgspersonerneblev i 10 minutter udsat for 2 kHz tone normaliseret til et eksponeringsniveauLEX,8ℎ = 80 dBA. DPOAE blev malt før og i de efterfølgende 70 minutterefter eksponeringen. Den eksperimentelle protokol tillod malinger med meden høj tids- og frekvensopløsning i en 1/3 oktavband centreret til 3 kHz.
Resultaterne indikerer, at:
1. +5 dB straffen overvurderede effekten pa DPOAE niveauerne, og resultaternekan bedre sammenlignes i forhold til deres totale akustiske energi. Det er ioverenstemmelse med den nuværende opfattelse af, at risikoen for høretab fralav niveau impulser, kan forudsiges pa samme energi basis.
2. Finstrukturen i DPOAE er meget individuel, og ingen systematiske ændringerblev observeret efter støj overeksponering. Derfor er evalueringen af finstruk-turen maske ikke en bedre indikator for risikoen for høretab. Tværtimod kanforskellene pa tværs af forsøgspersonerne komplicere fortolkningen og sammen-ligningen af resultaterne.
Contents
Preface 3
List of papers 5
Summary 7
Resume 9
Contents 12
1 Introduction 13
1.1 Do we measure impulsive noise correctly? . . . . . . . . . . . . . . . . 14
1.1.1 The +5 dB penalty for impulsiveness . . . . . . . . . . . . . . 15
1.1.2 Needs of future research . . . . . . . . . . . . . . . . . . . . . 16
1.2 Importance of OAEs for the assessment of NIHL . . . . . . . . . . . . 16
1.3 Goal of the study . . . . . . . . . . . . . . . . . . . . . . . . . . . . . 18
2 Background and theory 21
2.1 Auditory effects of impulsive noise . . . . . . . . . . . . . . . . . . . . 21
2.1.1 Peak level . . . . . . . . . . . . . . . . . . . . . . . . . . . . . 22
2.1.2 A and B-duration . . . . . . . . . . . . . . . . . . . . . . . . . 23
2.1.3 Rise time . . . . . . . . . . . . . . . . . . . . . . . . . . . . . 24
2.1.4 Repetition rate . . . . . . . . . . . . . . . . . . . . . . . . . . 24
2.1.5 Number of impulses . . . . . . . . . . . . . . . . . . . . . . . . 24
2.1.6 Spectral content . . . . . . . . . . . . . . . . . . . . . . . . . . 25
2.2 Alternate metrics for impulsive noise exposures . . . . . . . . . . . . 26
2.2.1 Cumulative crest factor . . . . . . . . . . . . . . . . . . . . . . 26
2.2.2 Kurtosis . . . . . . . . . . . . . . . . . . . . . . . . . . . . . . 27
2.2.3 The AHAAH model . . . . . . . . . . . . . . . . . . . . . . . 28
2.2.4 Applicability of AHAAH for occupational impulsive noises . . 30
2.3 Otoacoustic emissions . . . . . . . . . . . . . . . . . . . . . . . . . . . 31
2.3.1 OAE vs. hearing thresholds . . . . . . . . . . . . . . . . . . . 31
2.3.2 Types of OAE . . . . . . . . . . . . . . . . . . . . . . . . . . . 31
2.3.3 Distortion product otoacoustic emissions . . . . . . . . . . . . 32
2.3.4 Influence of the primary levels L1/L2 in the assessment of NIHL 35
2.3.5 Effect of impulsive noise on DPOAEs . . . . . . . . . . . . . . 36
2.3.6 Choice of DPOAE over TEOAE . . . . . . . . . . . . . . . . . 37
11
12 CONTENTS
3 Methods 393.1 Methodological overview . . . . . . . . . . . . . . . . . . . . . . . . . 393.2 Pure-tone audiometry and middle-ear test . . . . . . . . . . . . . . . 403.3 DPOAE assessment . . . . . . . . . . . . . . . . . . . . . . . . . . . . 403.4 Selection of noise stimuli . . . . . . . . . . . . . . . . . . . . . . . . . 45
3.4.1 Choice of exposure level . . . . . . . . . . . . . . . . . . . . . 453.4.2 Choice of stimuli duration . . . . . . . . . . . . . . . . . . . . 453.4.3 Noise stimuli CONT and IMP+CONT . . . . . . . . . . . . . 463.4.4 Binaural recordings, sound processing and reproduction . . . . 473.4.5 Choice of impulsive characteristics . . . . . . . . . . . . . . . . 483.4.6 Binaural vs monaural noise exposures . . . . . . . . . . . . . . 52
3.5 Calibration of noise exposures . . . . . . . . . . . . . . . . . . . . . . 52
4 Main results and analysis 554.1 Results from PAPER 1 . . . . . . . . . . . . . . . . . . . . . . . . . . 55
4.1.1 Group-average DPOAE shift . . . . . . . . . . . . . . . . . . . 554.1.2 Comparison of pre-exposure and final DPOAE levels . . . . . 574.1.3 Stability of primary levels . . . . . . . . . . . . . . . . . . . . 59
4.2 Results from PAPER 2 . . . . . . . . . . . . . . . . . . . . . . . . . . 594.2.1 Comparison of pre-exposure and final DPOAE levels . . . . . 614.2.2 Stability of primary levels . . . . . . . . . . . . . . . . . . . . 63
5 Overall discussion and conclusion 655.1 Influence of sound overexposure on DPOAE fine structures . . . . . . 655.2 Comparison of temporary changes on DPOAEs . . . . . . . . . . . . 65
5.2.1 Comparison of recovery functions . . . . . . . . . . . . . . . . 685.2.2 Estimation of maximum TTS . . . . . . . . . . . . . . . . . . 71
5.3 Implications for noise standards . . . . . . . . . . . . . . . . . . . . . 715.4 Future Work . . . . . . . . . . . . . . . . . . . . . . . . . . . . . . . . 72
I PAPERS 87
PAPER I 89
PAPER II 97
PAPER III 109
Chapter 1
Introduction
Noise-induced hearing loss (NIHL) is a permanent hearing impairment resultingfrom prolonged exposure to high levels of noise. In this way, NIHL is cumulativeover a lifetime and it is not reversible by any presently available medical or surgicaltreatment. The degree of hearing loss can range from mild to profound and may alsoresult in tinnitus. Hearing impairment has a major impact on one’s communicationability and even mild impairment may adversely affect the quality of life. Yet NIHLis in theory preventable. Unfortunately, our modern lifestyle places many peopleat risk as we are often exposed to high levels of noise; either wanted –e.g., musicconcerts and portable music players– or unwanted –e.g., industrial machinery andtraffic noise.
When the noise exposures occur at the workplace they are formally known asoccupational noise exposures, and they constitute the most common source of NIHL.The World Health Organization reported in 2004 that NIHL from occupationalexposures is still one of the most prominent and most recognized occupational diseasein all regions of the world (Concha-Barrientos et al., 2004). Both in United Statesand Europe 30 million people are exposed to potentially hazardous levels of noise,and worldwide the numbers are from 400 to 500 million. In addition, the EuropeanAgency for Safety and Health at Work estimates that the cost of hearing loss fromnoise in Europe represents about 10% of total compensation cost for occupationaldiseases (Schneider et al., 2005).
The risk of NIHL is generally predicted according to the available noise standards(ISO 1999:1990; American National Standard ANSI S3.44-1996; OSHA 29 CFR1910.95; NIOSH Publication No. 98-126). The standards are based on the cur-rent scientific knowledge regarding the functioning of the auditory system and itsvulnerability to noise overexposure. Unfortunately, current scientific knowledge isinsufficient to predict individual risk of hearing loss to a given exposure. For thisreason, the standards establish a statistical method to estimate the percentage ofpeople that might develop a hearing loss due to prolonged exposures to noises ofdifferent levels.
The current conception is that NIHL is a function of the total acoustical energythat reaches the inner ear throughout its life time. In this way, the standards pro-pose a unified measurement method based on readings of the equivalent A-weightedlevel LAeq, and duration of the exposure within a normal working day of eight hoursLEX,8ℎ. The method is based on the equal-energy hypothesis (EEH), which postu-lates that (1) noise exposures with the same A-weighted equivalent level (LAeq) mayproduce similar effects on our hearing independently of their temporal and spectralproperties; and (2) hearing loss is proportional to the acoustic energy received by
13

14 CHAPTER 1. INTRODUCTION
the ear. Therefore, an exposure to a particular noise level for one hour will resultin the same hearing loss as an exposure for two hours to a noise level which is 3 dBlower than the original level1 (Burns and Robinson, 1970; Martin, 1976).
Several longitudinal studies with industrial workers have demonstrated that theEEH provides a reasonable estimate of the risk of hearing loss in most industrial en-vironments with continuous-type noise, i.e., noise with negligibly small fluctuationsof level within the period of observation (e.g. Passchier-Vermeer, 1968, 1977; Burnsand Robinson, 1970; Johnson, 1973; Cohen et al., 1972). In addition, an importantadvantage of the standardized method is its simplicity – i.e., the risk of hearingloss is assessed with readings of one single number (LEX,8ℎ), which facilitates theinterpretation and comparison of results. Another advantage is that measurementsof A-weighted levels do not require neither complex nor expensive instrumentation.
1.1 Do we measure impulsive noise correctly?
Opposite to continuous noise, industrial noise can also be of impulsive character.Impulse noise is defined as a rapid, often large change in the instantaneous soundpressure over a short period of time, typically less than one second (NIOSH Publi-cation No. 98-126)2.
Noise standards establish that the EEH can be applied to all types of occupa-tional exposures without hearing protection; also those of impulsive character aslong as the C-weighted peak level does not exceed 140 dBC3. In this way, the as-sessment of occupational noise exposures becomes greatly simplified. However, it isstill not clear whether the EEH can correctly predict the risk of hearing loss fromimpulsive exposures. The few available demographic field-studies investigating theeffects of impulsive noise on the hearing of industrial workers have shown conflict-ing results, both in favor and against the applicability of the EEH for impulsivenoises. On the one hand, there are studies that reported that the hearing losses ofworkers exposed to noise levels with impulsive components were higher than pre-dicted according to the EEH. These studies were conducted with workers in steelconstruction (Passchier-Vermeer, 1971); building construction (Voigt et al., 1980);drop-forge industry (Sulkowski and Lipowczan, 1982; Surovov et al., 2001); and anautomobile manufacturing plant (Thiery and Meyer-Bisch, 1988).
1This is known as the “3-dB exchange rate” and it is widely accepted internationally. The 3-dBexchange rate is the method most firmly supported by the scientific evidence for assessing hearingimpairment as a function of noise level and duration. However, some countries may use a morepermissive exchange rate of 5 dB depending on their legislation. One of the arguments in favor ofthe 5-dB exchange rate is that noise exposures in many industrial environments are interrupted,i.e., there are resting periods in between exposures, which may allow the hearing of the workersto recover partially or completely. Although an exchange rate of 3-dB would be overprotective intruly intermittent situations, a 5-dB exchange rate would be underprotective in most others. Forthis reason, some noise standards like NIOSH Publication No. 98-126 have stopped using the 5-dBexchange rate and adopted the 3-dB rule.
2The term impulse (or impulsive) refers to the time characteristics of the acoustic signal. Fur-ther, impulsive noises can also be classified according to their generation mechanism as explosive
noise or impact noise. Explosive noise is defined as a rapid expansion of gas, such as from dis-charges of weapons or explosions. On the other hand, impact noise is generated by the collision oftwo or more solid objects, like hammering.
3Noise standards adopted the use of C-weighted peak values in order to specify the frequencyresponse of the instrument and eliminate very low frequency impulses and sounds. Without spec-ifying the low end cutoff frequency of the instrumentation, measurements with different devicescould vary greatly (Kardous et al., 2005).

1.1. DO WE MEASURE IMPULSIVE NOISE CORRECTLY? 15
On the other hand, there are studies in the same industrial areas that reportedthat the hearing loss of workers exposed to impulsive noises could be predictedaccording to the EEH (Atherley and Martin, 1971; Guberan et al., 1971; Tayloret al., 1984). These contradictory results suggest that, up to certain limits, theEEH can be equally applied to impulsive and non-impulsive noises. Unfortunately,we simply do not have enough systematic data to delineate the range of conditionswhere the EEH is appropriate.
Another uncertainty regarding the effects of impulsive sounds on hearing refersto the combination of impulsive and continuous noise. In most industrial settingsimpulsive noise can occur simultaneously with other types of continuous backgroundnoise. Some researchers have suggested that this combination may have a synergisticeffect in the inner ear. This is, the interaction of the two of them may pose a higherhazard to hearing than the sum of their individual contributions. However, thishypothesis is based on animal studies in which chinchillas were exposed to noisesexceeding the properties of typical industrial settings – both in intensity and dura-tion (Hamernik et al., 1974; Hamernik and Henderson, 1976). When the exposurelevels are comparable with those found in many common industrial environmentsthe synergism seems to disappear (Hamernik et al., 1981). Currently, whether theeffects of combined exposures are additive or synergistic is still unknown.
1.1.1 The +5 dB penalty for impulsiveness
ISO 1999:1990 prescribes the same assessment method for impulsive and non-impulsivenoises up to 140 dBC. Nevertheless, the standard allows adding a +5 dB penalty tothe measured LAeq if a noise is of impulsive character based on the presumption thatit might pose a higher risk of hearing loss. In this way, the standard considers thatthe risk of NIHL of such an impulsive exposure may be comparable to that from acontinuous-type noise which is +5 dB higher in level.
The penalty is based on the available demographic studies showing that thehearing levels of workers exposed to widely fluctuating noises developed significantlylarger losses (approximately 5 dB higher at 4 kHz) than workers exposed to moresteady levels (Passchier-Vermeer, 1968; Taylor and Pelmear, 1976; Voigt et al., 1980).For this reason, ISO 1999:1990 states: “The prediction method presented is basedprimarily on data collected with essentially broad-band steady non-tonal noise. Theapplication of the data base to tonal or impulsive/impact noise represents the bestavailable extrapolation. Some users may, however, want to consider tonal noiseand/or impulsive/impact noise about as harmful as a steady non-tonal noise that isapproximately 5 dBA higher in level.”
ISO 1999:1990 establishes that the penalty can be applied not only to impul-sive noises but also to sounds with a prominent tonal component. However, ISO1999:1990 does not specify when to penalize a given noise, neither for impulsivenessnor for tonality and the decision is left to the criteria of the observer. This uncer-tainty could lead to an overestimation of the auditory hazard, leading to excessivelyconservative legislation; or to an underestimation of the auditory hazard resultingin greater hearing loss on the exposed population.
The 5 dB penalty is a precautionary measure and there is not yet enough empir-ical data to validate the penalty. In fact, the maximum penalty for impulsivenesscan vary up to 7 dB between countries depending on their noise legislation. Somecountries like Denmark provide more specific guidelines regarding the applicability

16 CHAPTER 1. INTRODUCTION
of the penalty. Thus, the Danish Working Environment Authority4 establishes thata +5dB penalty must be added when measuring noises of impulsive character withpeak levels higher than 115 dBC (or dBA) more than once per minute (Arbejdstil-synet, 2003). It also establishes that the +5 dB penalty can be applied to noiseswith a clear tonal component. However, no precise guidelines are given in this case.
1.1.2 Needs of future research
Since 1960, extensive research mostly from animal studies has investigated thosecharacteristics of impulsive exposures that may be hazardous for our hearing (for areview of the studies see Henderson and Hamernik, 1986). In addition, several inves-tigators have proposed new exposure metrics to better quantify impulsive exposuresin relation to their risk of hearing loss (Price, 2007; Hamernik et al., 2003; Seixaset al., 2005b; Stark and Pekkarinen, 1987, see section 2.1). However, there is notyet any clear defensible evidence to reject the current assessment methods estab-lished by the noise standards; nor to separate impulsive and continuous noise fromoccupational environments –and their effects– as long as the C-weighted peak leveldoes not exceed approximately 140 dB (Von Gierke et al., 1982). Peak levels abovethis value may damage our hearing instantly, and the effects cannot be predictedwith the EEH. This level is known as the critical level and it is further explained insection 2.1.1.
The debate regarding the correct assessment of impulsive noise is still open, andit is internationally agreed among experts that future research should consider thefollowing issues (Kardous et al., 2005):
∙ Instruments and standards for measurement and evaluation of impulsive soundsmust be revised.
∙ An international consensus on a damage-risk criterion for impulsive sounds isneeded.
∙ More studies should be performed with an emphasis on either field surveys ofexposure levels at the workplace and audiological data collection from humansubjects.
∙ It is necessary to reach an international consensus on descriptors for impulsivesounds and procedures for applying results from tests on animals to modelsfor the effect of impulsive sounds on hearing impairment of humans.
∙ It is necessary to examine the destructive or metabolic effects of impulsivesounds on the inner ear.
∙ It is necessary to investigate whether the combination of impulsive and con-tinuous noise might have a synergistic effect on the auditory system.
1.2 Importance of otoacoustic emissions in the as-
sessment of NIHL
Several methods exist to assess hearing function and detect NIHL. The most com-mon is the traditional pure-tone audiometry consisting of estimations of hearing
4www.arbejdstilsynet.dk
1.2. IMPORTANCE OF OAES FOR THE ASSESSMENT OF NIHL 17
thresholds; i.e., the minimum sound level that a person can hear at given frequen-cies. However, otoacoustic emissions (OAEs) may provide a better diagnosis toolto study the vulnerability of the inner ear to noise overexposure, and to detect andprevent early hearing-loss.
OAEs reflect the status of the cochlea in the inner ear. It is commonly acceptedthat OAEs are a sensitive indicator of the physiological activity of the outer hair-cells (OHCs) in the cochlea. The role of the OHCs is essential for a healthy hearing.Unfortunately, they are also the most vulnerable part of the ear in response tonoise and it is commonly agreed that the onset and gradual development of NIHL ismainly a consequence of OHC loss (Saunders et al., 1991). For this reason OAEs areextremely valuable in the assessment of NIHL – because OAEs reflect vulnerabilityof the inner ear after acoustic overexposure due to metabolic changes in the OHCs(Kemp, 1986; Probst et al., 1991). Besides, OAEs are objective –i.e., no activereponse from the subject is necessary for their assessment. This is a significantadvantage over behavioral audiometry, as for measurements of hearing thresholdsthe concentration of the subject may be a critical factor influencing the variabilityof the results.
Most of what is known about the effect of long-term occupational noise expo-sures on the human auditory system is based on audiometric measurements evalu-ating temporary (TTS) or permanent hearing-threshold shifts (PTS). Some of thesestudies are also the basis of the current noise legislation (e.g. Passchier-Vermeer,1968, 1977; Burns and Robinson, 1970; Johnson, 1973). However, longitudinal andcross-sectional studies have shown that OAEs can diminish before hearing levelsin populations exposed to high levels of noise (LePage and Murray, 1993; LePageet al., 1993; Murray and LePage, 1993; Miller et al., 2006; Hamernik and Qiu, 2000;Prasher and Sulkowski, 1999; Marshall et al., 2009; Attias et al., 2001; Engdahlet al., 1996; Seixas et al., 2005a; Miller et al., 2004; Konopka et al., 2005; Attiaset al., 1995). From this studies it is generally accepted that OAEs may be moresensitive than traditional pure-tone audiometries to detect incipient NIHL. One ofthe reasons for the purported added sensitivity of OAEs refers to OHC redundancy.There is physiological evidence for OHC redundancy in animals, such that onlysome OHCs are required for normal hearing (e.g., Altschuler, 1992). This redun-dancy provides some protection from noise-induced damage, and it is only whencritical number of OHCs are damaged that hearing suffers. LePage et al. (1993)suggested that because OAEs are a direct consequence of OHC activity, the lossof some OHCs is likely to be measurable with OAEs before being measurable withan audiogram. In this way, the OHC redundancy theory suggests that changes inOAEs could be preclinical indicators of NIHL.
Currently, OAEs cannot replace traditional pure-tone audiometries to diagnoseNIHL, and the audiogram is still considered the gold standard, to which OAE mea-surements are compared. Rather, OAEs are a complementary measurement. Oneof the reasons for this is that our understanding of OAEs is not complete and re-searchers are still investigating how to optimize OAE measurements in order toprovide the maximum information regarding the healthy functioning of the innerear and its vulnerability. At present, there is no standardized method regulatingthe use of OAEs for the detection of NIHL and researchers from all over the worldmight be using different measurement protocols in their investigations. This in-consistency makes very difficult the comparison and interpretation of results fromdifferent studies.
The literature regarding the effect of impulsive sounds on the OAEs of humans
18 CHAPTER 1. INTRODUCTION
is still sparse and it has mostly focused on military settings (Marshall et al., 2001;Attias et al., 2001; Engdahl et al., 1996; Konopka et al., 2005; Miller et al., 2004). Inthese studies, OAEs were used to detect incipient hearing loss in military personnelexposed to impulsive noise from fire weapons and artillery. Changes in the propertiesof the OAEs were detected, whereas no change in hearing thresholds was observed(see section 2.3.5). Results from these studies are extremely valuable –as they helpus to understand how PTS develops in humans. However, they also have somelimitations. One limitation is that it is difficult to control all the variables in theexperiment and it is not possible to perform measurements comparable in qualityto those made in the laboratory. Thus, it is very difficult to understand from thesestudies how the different characteristics of impulsive sounds may influence the riskof NIHL. Another limitation is that the results cannot be extrapolated to industrialenvironments because peak levels from weapons are generally above 140 dBC, andhence, beyond the scope of ISO 1999:1990.
To our knowledge, there are no controlled laboratory-studies that have system-atically investigated the effects of industrial impulsive noise on the OAEs of humansubjects. This type of data may provide a valuable insight into the hazardous prop-erties of impulsive noise on our hearing. Laboratory studies on humans are restrictedto evaluate temporary changes on the auditory system. The underlying mechanismsbetween temporary and permanent shifts are likely to be physiologically different,both for hearing thresholds (Saunders et al., 1985) and OAEs (Lapsley Miller andMarshall, 2006). In this sense, TTS and PTS appear to be produced by differentmechanisms (Nordmann et al., 2000) with TTS due to inactivation of mechano-electrical transduction (MET) channels at the apex of OHCs (Patuzzi, 1998) whilePTS involves hair cell death due to free radicals (Samson et al., 2008). For this rea-son, results from laboratory studies cannot be expected to generalize to prolongedexposures from real-life situations. However, the presence of a temporal shift may beunderstood as a warning sign, indicating that there might be a risk of a permanenthearing loss for prolonged exposures.
Two types of OAEs have been extensively used for the assessment of NIHL:transient-evoked otoacoustic emissions (TEOAEs) and distortion-product otoacous-tic emissions (DPOAEs). In the present study DPOAEs are chosen for the evaluationof changes in the inner ear of human subjects. This choice is argumented in section2.3.6.
1.3 Goal of the study
The present dissertation investigates the effect of acoustic overexposure on theDPOAEs of human subjects. Two different experiments were performed. The ex-periments are presented in detail in two different journal papers in pages 87 and 97respectively. In the following, the experiments are referred to as PAPER I and IIand they had the following purposes:
PAPER I: Recovery of distortion product otoacoustic emissions after a 2-kHzmonaural sound-exposure in humans: effects on fine structures
To investigate methodological aspects of DPOAE measurements that might im-prove hearing diagnosis and detection of hearing loss. In particular, it is studiedwhether the fine structures of the DPOAE (explained in section 2.3.3) are system-atically affected after a moderate tonal overexposure, and whether the evaluation of

1.3. GOAL OF THE STUDY 19
the characteristics of the fine structures might provide more information about thevulnerability of the cochlea and detection of incipient hearing loss.
PAPER II: Is it necessary to penalize impulsive noise +5 dB due to higher risk ofhearing damage?
To investigate the validity of the +5 dB for impulsiveness established by ISO1999:1990 for predicting risk of NIHL. Human subjects were exposed under labo-ratory conditions to two different noise stimuli. One of the stimuli was penalized+5 dB for impulsiveness as specified by the Danish Working Environment Authority(Arbejdstilsynet, 2003). The purpose was to investigate whether there is a differencein the temporary changes from the two stimuli, which may be indicative of a higherrisk of NIHL. The assumption is that, if the penalty is correct, both stimuli mayproduce a similar effect on the DPOAEs.
It is also the purpose of both experiments to provide human data reflecting theauditory hazard from overexposures to different noise stimuli and their effects onDPOAEs. This is particularly important in the case of impulsive noise, as most ofthe literature regarding the effects of impulsive noise on hearing is based on animalstudies, and the results can not be extrapolated directly to humans.
The rest of the present dissertation is organized as follows: chapter 2 presents themost relevant theory setting the scientific basis of our investigation. A descriptionof the methods, i.e., selection of noise stimuli and OAE assessment, are presented inchapter 3. The main results are shown in chapter 4. For a more detailed analysis anddiscussion of individual data, please refer to the corresponding papers. A generaldiscussion can be found in chapter 5.
The methodological protocol for the assessment of DPOAE is explained in aconference paper in page 109.

20 CHAPTER 1. INTRODUCTION

Chapter 2
Background and theory
This chapter presents the most relevant theory establishing the scientific basis forthis thesis. The chapter starts with a review of the current knowledge regardingrisk of hearing damage from impulsive noise. It is explained why impulsive noisemay be more dangerous for our hearing than non-impulsive noise as well as currentalternate metrics for the assessment of impulsive noise exposures. Next, the chaptercontinues with a description of OAEs and their validity to assess the vulnerabilityof the cochlea to noise overexposure.
2.1 Auditory effects of impulsive noise
High-intensity impulsive sounds are considered to be more dangerous to hearingthan continuous sounds (Henderson and Hamernik, 1986; Stark et al., 2003). Oneexplanation is that the auditory system may respond differently to impulsive noisethan to continuous noise.
First, the stapedius-reflex muscle in the middle ear provides no protection againsta sudden impulsive sound. The stapedius reflex attenuates loud sounds before theyreach the cochlea, and thereby, the risk of noise-induced hearing loss is reduced. Forpure tones, sound levels above 75 dB HL will activate the reflex. The reflex protectsmainly against sounds in the low frequency range, whilst sounds above 2 kHz arenegligibly affected. At maximum contraction of the reflex, the attenuation providedis around 20dB at low frequencies. The contraction of the muscle does not appearimmediately when a loud sound occurs, but with a latency of at least 10-20 ms. Forthis reason, impulsive noises may escape the protective effect of the reflex, and reachthe cochlea without attenuation (Arlinger, 1993).
Secondly, the spectral energy of an impulse is often broadly distributed across awide range of frequencies. Therefore, high-level impulsive noise may have a directdamaging impact over a broad region of the basilar membrane (Dunn et al., 1991).
The physical properties of an impulse are characterized by the peak level, riseand decay time, repetition rate of the impulse, number of impulses and spectralcontent. Several studies have indicated that these parameters might be critical inthe development of hearing loss (for a review see Henderson and Hamernik, 1986).Understanding the effects of the aforementioned parameters on the auditory systemis complicated as the parameters can vary over a very wide range. Besides, it is verydifficult to study the influence of individual parameters in laboratory experimentsbecause the manipulation of one parameter may also influence the others. Forexample, a variation in the decay time of an impulse may affect the energy content in
21
22 CHAPTER 2. BACKGROUND AND THEORY
a particular frequency range. Next, the main parameters characterizing an impulseand their influence in the development of NIHL are presented.
2.1.1 Peak level
The peak pressure-level is one of the key parameters in the development of NIHL.The current conception is that the higher the peak level, the higher the risk of dam-age. Unfortunately, there is not a simple relationship between the amplitude of animpulse and either cochlear damage or hearing loss. Currently, it is believed thatthere might be two different mechanisms of damage depending on the intensity ofthe peak level. The mechanisms are classified as metabolic change and mechani-cal damage. An excellent review and tutorial regarding the two mechanisms andanatomical injuries in the inner ear after acoustic overexposure is given by Saunderset al. (1991, 1985); Henderson and Hamernik (1986) and Schmiedt (1984). Next,the most important findings are briefly presented.
Metabolic changes
Metabolic changes have a gradual onset and they refer to those changes that affectthe vital functions of the outer and inner hair cells (OHC and IHC). The changesmay be temporal for moderate exposures. Temporal changes are not completelyunderstood but may include vascular changes, metabolic exhaustion, and chemicalchanges within the hair cells. There is also evidence of a decrease in the stiffnessof the stereocilia (the hair bundles at the top of the hair cells). This decrease instereocilia stiffness may lead to a decrease in the coupling of sound energy to thehair cells, which thereby alters hearing sensitivity (Cody and Russell, 1986).
Repeated exposure to noise may gradually cause permanent NIHL. In this type ofinjury, a few scattered OHC may be damaged with each exposure. With continuedexposure, the number of damaged hair cells increases. Damage to the stereociliais often the first change. Once destroyed, the sensory cells are not replaced. Forprolonged intense-exposures the degeneration of hair cells may continue. Once asufficient number of hair cells are lost, the nerve fibers of that region also degenerate.The extent to which these neural changes contribute to NIHL is not clear (Hamerniket al., 1993, 1989).
Mechanical damage
Opposite to metabolic changes, mechanical damage may occur instantly. Mechanicaldamage is irreversible and it might lead to direct PTS. Virtually all the structuresof the ear can be damaged, in particular the organ of Corti. Typical mechanicaldamage includes dislocation of the ossicles, rapture of the tympanic membrane,destruction of OHC/IHCs and changes in the morphological properties of the innerear, among others (Saunders et al., 1991).
The critical level
According to literature, there is a certain peak level that marks the transition be-tweenmetabolic changes and directmechanical damage in the cochlea (Ahroon et al.,1993; Qiu et al., 1986; Roberto et al., 1985). This level is known as the critical level.
2.1. AUDITORY EFFECTS OF IMPULSIVE NOISE 23
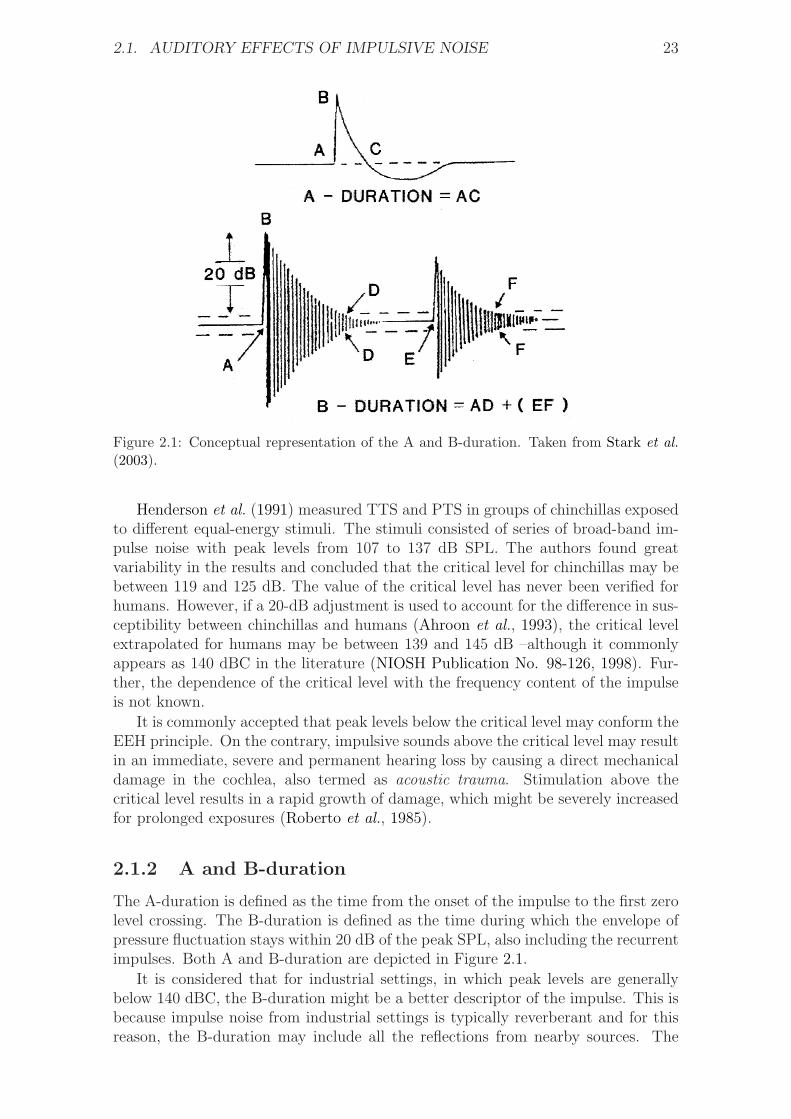
Figure 2.1: Conceptual representation of the A and B-duration. Taken from Stark et al.
(2003).
Henderson et al. (1991) measured TTS and PTS in groups of chinchillas exposedto different equal-energy stimuli. The stimuli consisted of series of broad-band im-pulse noise with peak levels from 107 to 137 dB SPL. The authors found greatvariability in the results and concluded that the critical level for chinchillas may bebetween 119 and 125 dB. The value of the critical level has never been verified forhumans. However, if a 20-dB adjustment is used to account for the difference in sus-ceptibility between chinchillas and humans (Ahroon et al., 1993), the critical levelextrapolated for humans may be between 139 and 145 dB –although it commonlyappears as 140 dBC in the literature (NIOSH Publication No. 98-126, 1998). Fur-ther, the dependence of the critical level with the frequency content of the impulseis not known.
It is commonly accepted that peak levels below the critical level may conform theEEH principle. On the contrary, impulsive sounds above the critical level may resultin an immediate, severe and permanent hearing loss by causing a direct mechanicaldamage in the cochlea, also termed as acoustic trauma. Stimulation above thecritical level results in a rapid growth of damage, which might be severely increasedfor prolonged exposures (Roberto et al., 1985).
2.1.2 A and B-duration
The A-duration is defined as the time from the onset of the impulse to the first zerolevel crossing. The B-duration is defined as the time during which the envelope ofpressure fluctuation stays within 20 dB of the peak SPL, also including the recurrentimpulses. Both A and B-duration are depicted in Figure 2.1.
It is considered that for industrial settings, in which peak levels are generallybelow 140 dBC, the B-duration might be a better descriptor of the impulse. This isbecause impulse noise from industrial settings is typically reverberant and for thisreason, the B-duration may include all the reflections from nearby sources. The
24 CHAPTER 2. BACKGROUND AND THEORY
A-duration, on the other hand, is considered more adequate for the characterizationof high-level impulse sounds in free field, like those typically present in the military.
The number of experiments studying the influence of the B-duration on thedevelopment of hearing loss is sparse. Tremolires and Hetu (1980) and Yakamuraet al. (1980) investigated in similar experiments the influence of the B-duration onthe development of TTS in human subjects. Basically, both experiments exposedsubjects to noise stimuli with the same peak level but different B-duration, whilemeasuring the growth of TTS at particular frequencies. They concluded that thelonger the B-duration of the impulse, the higher the risk of hearing loss. However,the following observations can be made to their conclusion:
1. Manipulating the B-duration of an impulse may also have an effect on its spec-tral properties. Therefore, the higher TTS measured at a particular frequencymay have been due to a higher energy content in that frequency range.
2. Even though noise exposures had the same peak level, a longer B-duration im-plies more acoustic energy. Therefore, perhaps the differences in the measuredTTS could have also been predicted according to the EEH principle.
2.1.3 Rise time
The rise time is defined as the time, in seconds, that an impulse takes to rise from10% to 90% of its maximum absolute value of the sound pressure.
There are almost no studies that have systematically investigated the hazardousproperties of the rise time of occupational impulsive noise on humans. This type ofdata is difficult to collect due to technical limitations of the reproduction system,the loudspeaker being the weakest element. Thus, it is very difficult to have anaccurate reproduction and control of a given rise time for high-level peaks. To ourknowledge the only available study is the one by Tremolires and Hetu (1980). Theyreported that the rise time did not appear to be a relevant factor in the developmentof hearing loss. Their conclusion is based on the fact that three different impulsivestimuli produced a similar amount of TTS on the hearing of the subjects, despitehaving a different rise time.
2.1.4 Repetition rate
Several human and animal studies have shown that for equal energy exposuresthe repetition rate might be a critical factor in the development of hearing loss(Tremolires and Hetu, 1980; Danielson et al., 1991; Henderson et al., 1991). Theliterature suggests that this effect is due to two important factors that vary withtime: the acoustic reflex of the middle ear and the rate of recovery following animpulse. The current conception is that a series of impulses with a repetition rateof approximately one impact per second is the most dangerous for our hearing. Thisis because impulses within this range are not attenuated by the middle-ear reflex,and pose the highest rate of acoustic stress to the inner ear.
2.1.5 Number of impulses
The Committee on Hearing, Bioacoustics, and Biomechanics (CHABA) of the U. S. Na-tional Research Council proposed the first damage-risk criterion (DRC) in 1968 for

2.1. AUDITORY EFFECTS OF IMPULSIVE NOISE 25
impulsive noise (CHABA, 1968). This DRC considered the total number of im-pulses within an exposure a critical parameter in the development of hearing loss.The CHABA criterion allowed 100 impulses per day at 140 dBA, or 1000 per dayat 130 dBA, or 10.000 per day at 120 dBA. However, these limits were more an“educated guess” based on the relatively few experimental results and observationsthat were available at that time. For this reason, the CHABA criterion is no longervalid and it is recognized now that the CHABA criterion was inadequate and over-simplified.
Currently, there are no limitations regarding the maximum number of impulsesthat a person can be exposed to within a normal working day of eight hours, as longas they do not exceed a certain peak level. ISO 1999:1990 establishes a maximumpeak level of 140 dBC based on the concept of the critical level. However, somecountries may have more restrictive limits based on their legislation. In France, forexample, the maximum peak level is set to 135 dBA.
2.1.6 Spectral content
For impulses with peak levels above the critical level, the spectral content of theimpulse seems to be crucial for the frequency specificity of hearing loss. Pattersonet al. (1993) exposed groups of chinchillas to different types of narrow-band impulsescontaining the same energy but concentrated at different frequencies. Peak levelswere above the estimated critical level of the chinchilla. Their results showed thathearing hazard based on estimations of PTS is closely related to the spectral contentof the impulse. Besides, low-frequency impulses were less dangerous than impulseswith mid-range frequencies. The authors concluded that low-frequency impulsesare less hazardous than predicted by A-weighted sound exposure level. In addition,audiometric data from military settings have shown that the hazard to hearing posedby exposure to impulse noise is strongly influenced by the spectral distribution ofthe energy of the impulse (NATO, 1987; CHABA, 1992).
In industrial environments, whether the spectral content of impulsive noise iscritical for the development of hearing loss is still not clear. Bruel (1977) stressedthat current noise standards -based on measurements of A-weighted levels- may beinaccurate to account for the spectral differences of impulsive and continuous noise.The main concern is that the A-weighting is an approximation of the equal-loudnesscontour at 40 dB above threshold. This fact, per se, introduces two conflicting issues:(1) at higher levels the equal-loudness contours become flatter; and (2) the equal-loudness contours are based on loudness estimation of pure tones. Therefore, theA-weighting may not be accurate to describe the frequency-dependent sensitivity ofour hearing for high-level impulsive sounds. Nor to account for their risk of hearingdamage. Bruel (1977) also emphasized that the majority of industrial noise has ahigher intensity in the 250–500 Hz frequency range, whereas short duration peakscontain a significant amount of energy in the 4–6 kHz frequency region. Becausethe frequencies in the 4–6 kHz are also amplified in the outer and middle ear, theshort duration peaks may play a dominant role in contributing preferential damagein this range.
Tambs et al. (2006) compared the frequency specificity of NIHL across the range250–8000 Hz and the extent to which the patterns of frequency-specific auditorythreshold shifts differ between occupational noise and impulse noise from shooting.A total of 51975 subjects participated in the study. Subjects underwent a pure-toneaudiometry together with a questionnaire about their noise exposure history and

26 CHAPTER 2. BACKGROUND AND THEORY
other risk factors. Data from pure-tone audiometries were classified in groups ac-cording to age, gender, type and duration of exposure. The results indicated that formen above 65 years, the effects of impulsive noise were strongest at 3000–8000 Hzand varied little within this frequency range, with a maximum shift of approxi-mately 8 dB; whereas occupational noise had a higher impact at 3000–4000 Hz witha 13 dB shift at 3000Hz. These results suggest that high-peak impulse noise mayhave a bigger impact on high frequencies than occupational noise in general. Theyalso suggest that there is an overlapping range at 3000-4000 Hz in which the cochleais more vulnerable to NIHL for all types of noise exposure. However, the follow-ing observations can be done to their study: first, the comparison of hearing lossfrom occupational noise and impulses from weapons is not straightforward, as theirdestructive mechanisms on the auditory system are essentially different. Second,occupational exposures also included sources of impact noises such as riveting andhammering, although at lower intensity levels than impulses from shooting. This factmay have biased the results and the overlapping frequency range at 3000–4000 Hzmay be due to the common action of impulsive noises in that area.
The similarities in the frequency-specific hearing loss between continuous andimpulsive noise have been reported by other longitudinal studies on workers fromdifferent industrial areas (Passchier-Vermeer, 1968; Ceypek et al., 1973; Sulkowskiand Lipowczan, 1982; Taylor et al., 1984). From these studies, it is commonly agreedthat the development of hearing loss seems to be more intense during the first 10years of exposure, with the highest PTS between 4-6 kHz for both types of noise.However, it is still not clear whether the development of hearing loss is faster forimpulsive sounds.
2.2 Alternate metrics for impulsive noise expo-
sures
Several researchers have proposed alternate metrics to better evaluate the auditoryhazard of impulsive exposures. These alternate metrics do not intend to replace thecurrent assessment method proposed by the standards, but rather to complement itand provide a better insight in the evaluation of NIHL.
2.2.1 Cumulative crest factor
Stark and Pekkarinen (1987) proposed a statistical method to describe the impulsivecharacteristics of a noise. The method is known as the cumulative crest factorand it allows classification of noise environments into impulsive or non-impulsive.According to the method, a noise environment is considered impulsive when thedifference between the peak and RMS levels of a sound pressure is equal to orgreater than 15 dB. The expression is given by
LAp − LAS ≥ 15dB (2.1)
The expression is simply an A-weighted crest factor, where LAp is the A-weightedpeak level and LAS is the A-weighted RMS-level measured with “slow” time con-stant. The numerical value of 15 dB was accepted in the resolution of the Interna-tional Symposium on the Effects of Impulse Noise on Hearing (Lahti and Starck,1980). This criterion value corresponds to the averaging time of the ear so that the
2.2. ALTERNATE METRICS FOR IMPULSIVE NOISE EXPOSURES 27
loudness perception of impulsive sounds matches the loudness of continuous sounds,and it is determined to be approximately 35 ms (Bruel, 1977).
The difference between LAp and LAS varies randomly in industrial noise. There-fore, the method calculates the cumulative distribution function, which consists oncalculations of the crest factor at small intervals of time. In this way, the methoddetermines the percentage of time in the sample noise exceeding 15 dB. However,the method does not establish a fence value regarding the percentage of time thatthe crest factor must exceed 15 dB for a noise to be considered impulsive. Therefore,rather than indicating that the method allows classification of noise environmentsinto impulsive/non-impulsive, it would be more precise to state that noise environ-ments are classified from highly to barely impulsive.
Stark et al. (2003) studied whether the hearing loss developed by forest andshipyard workers could be predicted according to ISO 1999:1990. Both acousticenvironments were very complex, with random incidences of impulses combinedwith background noise. They used the cumulative crest factor to study the degreeof impulsiveness of the noise environments. They concluded that the hearing lossdeveloped by forest workers in a non-impulsive environment could be predictedaccording to the standard; whereas shipyard workers in an impulsive environmentdeveloped a higher hearing loss that could not be predicted with the standard.The authors suggested that the cumulative crest factor might be an appropriatecomplementary method to identify hazardous impulsive environments that mightlead to a higher hearing loss than predicted according to ISO 1999:1990. Similarresults were obtained by Surovov et al. (2001) in a study with forge hammeringworkers.
Unfortunately, at present there is not enough data to illustrate how the riskof hearing loss may depend on the overall level of the noise and its crest factor.For this reason, the method is more used as a warning sign to indicate that if anoise environment has clear impulsive content, the risk of hearing loss may not becorrectly predicted according to the EEH.
2.2.2 Kurtosis
Erdreich (1986) proposed the kurtosis metric (�) as a statistical descriptor of im-pulsiveness. Basically, the kurtosis calculates the peakedness of a sound based on itsamplitude distribution. The analysis is done by dividing the time-pressure soundsignal in small analysis windows. The advantage of the kurtosis over other the cu-mulative crest factor is that all peaks are accounted for in the calculation and thatthe relative difference between peak and background level is also incorporated; whilethe cumulative crest factor only computes the maximum peak level in a given timeframe.
The kurtosis is calculated as the ratio of the fourth moment of the amplitude dis-tribution to the squared second moment of the distribution in the analysis window.Thus for a window with N samples from x1 to xN ,
fourth moment, m4 =1
N
N∑
i=1
(xi − x)4 (2.2)
and
28 CHAPTER 2. BACKGROUND AND THEORY
second moment, m2 =1
N
N∑
i=1
(xi − x)2 (2.3)
The kurtosis (�) is given by,
� = m4/m22 (2.4)
A pure continuous noise (Gaussian) will have a kurtosis value of � = 3; whilepurely impulsive sounds (non-Gaussian) may reach values of � > 100.
Audiometric and histological1 experiments with chinchillas have suggested thatthe kurtosis metric might be a better descriptor of risk of hearing loss for impulsivenoise (Hamernik et al., 2003, 1993). In these experiments groups of chinchillas wereexposed to different types of noise from continuous to impulsive (3 < � < 105)with equal energy. The noise stimuli were designed artificially so that they all hadthe same spectrum. The results indicated that permanent auditory effects of theexposures (PTS) were higher as � increased; i.e., as the noise stimulus became moreimpulsive, and the PTS reached an asymptote at � ≈ 40 . The authors concludedthat the kurtosis might be an important variable to assess risk of hearing damagefrom industrial environments. They also emphasized the limitations of the EEHfor the assessment of impulsive noises. However, the following observations can bemade to their conclusions: (1) the noise exposures were very unrealistic comparedto real-life situations, as they consisted of uninterrupted exposures during five days;and (2) noise stimuli had peak levels in the range of 104–130 dB. Considering thatthe critical level for the chinchilla is approximately 120 dB, the authors may havecompared audiometric data from groups with mixed metabolic (and only metabolic)changes and metabolic+mechanical damage in the inner ear.
In the same manner as the cumulative crest factor, it is still not known how thedegree of hearing loss may depend on the kurtosis of an impulsive signal and itsoverall exposure level.
2.2.3 The AHAAH model
The Auditory Hazard Assessment Algorithm for the Human (AHAAH) is a theo-retically based mathematical model of the ear designed to predict hazard of high-level acoustic impulses using computer-simulation techniques (Price and Kalb, 1991;Price, 2007). The AHAAH model was developed by the U. S. Army in order to pre-dict risk of hearing loss from military weapons. Peak levels typically encountered inmilitary settings can be in the range of 130–190 dB in free field, and the assessmentof hearing hazard from these extreme exposures is full of difficulties for the followingreasons:
∙ Technical limitations of the instrumentation for the assessment of high-intensitypeak levels.
∙ Lack of knowledge about the destructive mechanisms of the inner ear fromhigh-intensity sounds.
∙ Difficulties to correctly document the wide range of noise exposures in militarysettings and verify the validity of the existing damage-risk criteria (CHABA,
1Histological: Referring to the microscopic structure of organic tissues.
2.2. ALTERNATE METRICS FOR IMPULSIVE NOISE EXPOSURES 29
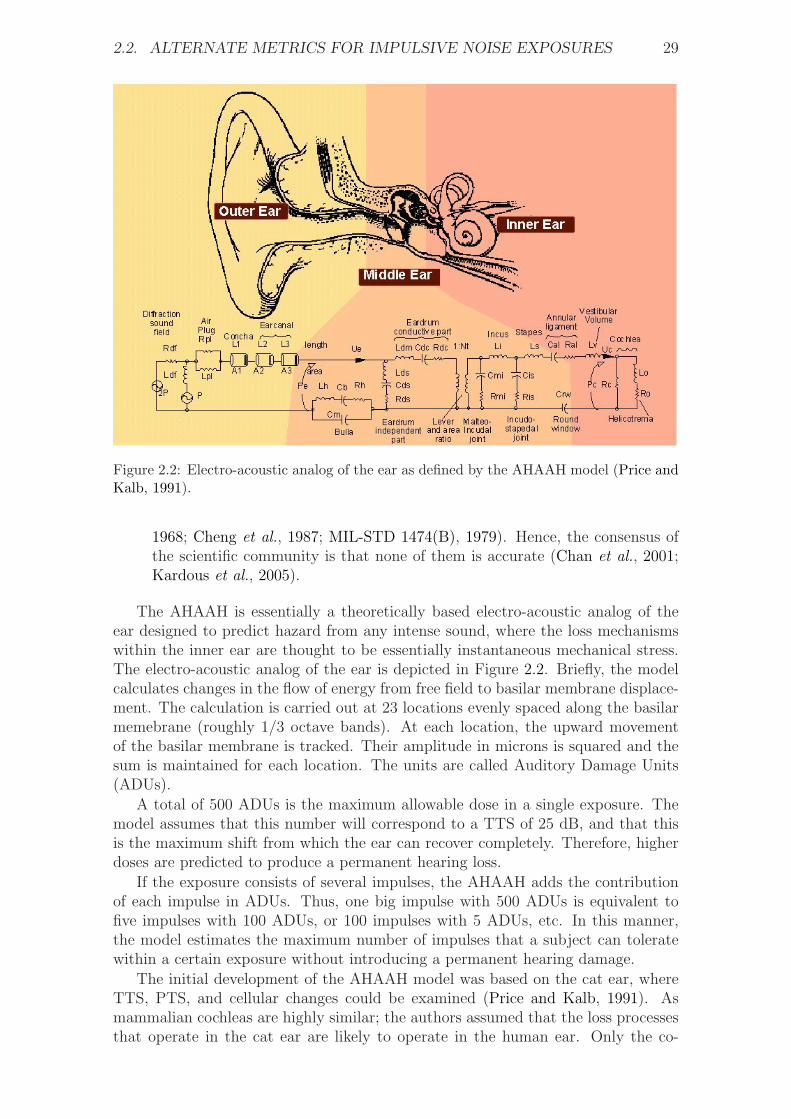
Figure 2.2: Electro-acoustic analog of the ear as defined by the AHAAH model (Price andKalb, 1991).
1968; Cheng et al., 1987; MIL-STD 1474(B), 1979). Hence, the consensus ofthe scientific community is that none of them is accurate (Chan et al., 2001;Kardous et al., 2005).
The AHAAH is essentially a theoretically based electro-acoustic analog of theear designed to predict hazard from any intense sound, where the loss mechanismswithin the inner ear are thought to be essentially instantaneous mechanical stress.The electro-acoustic analog of the ear is depicted in Figure 2.2. Briefly, the modelcalculates changes in the flow of energy from free field to basilar membrane displace-ment. The calculation is carried out at 23 locations evenly spaced along the basilarmemebrane (roughly 1/3 octave bands). At each location, the upward movementof the basilar membrane is tracked. Their amplitude in microns is squared and thesum is maintained for each location. The units are called Auditory Damage Units(ADUs).
A total of 500 ADUs is the maximum allowable dose in a single exposure. Themodel assumes that this number will correspond to a TTS of 25 dB, and that thisis the maximum shift from which the ear can recover completely. Therefore, higherdoses are predicted to produce a permanent hearing loss.
If the exposure consists of several impulses, the AHAAH adds the contributionof each impulse in ADUs. Thus, one big impulse with 500 ADUs is equivalent tofive impulses with 100 ADUs, or 100 impulses with 5 ADUs, etc. In this manner,the model estimates the maximum number of impulses that a subject can toleratewithin a certain exposure without introducing a permanent hearing damage.
The initial development of the AHAAH model was based on the cat ear, whereTTS, PTS, and cellular changes could be examined (Price and Kalb, 1991). Asmammalian cochleas are highly similar; the authors assumed that the loss processesthat operate in the cat ear are likely to operate in the human ear. Only the co-

30 CHAPTER 2. BACKGROUND AND THEORY
efficients in the equations were changed to reflect the differences in physical sizesbetween the two. Initially it was assumed that the model would have to be ad-justed to improve the fit of the data in human ears, but the available studies withhuman volunteers have shown good correspondence between the hearing loss dataand the model’s predictions (Price, 2007). For this reason, the model has stayed inits original form.
The AHAAH model still needs to be validated with more human data fromreal-life situations. Nevertheless, there is a great expectation among the scientificcommunity in the development of the AHAAH model as it has the potential toserve as an international design standard for weapons, and to provide damage orrisk criteria for intense impulses of industrial origin (Kardous et al., 2005). Recently,the AHAAH model has been incorporated by automotive companies to assess riskof hearing damage from airbags, which can reach peak levels up to 170 dB in theear of the vehicle occupant (Rouhana et al., 2005).
More information about the AHAAH as well as a free version of the software canbe found at the official website of the U.S. Army2.
2.2.4 Applicability of AHAAH for occupational impulsivenoises
It is not clear yet whether the AHAAH can be used to predict risk of hearing damagecaused by impulsive sounds from occupational exposures (Kardous et al., 2005). Themain reason is that the model is intended to work with peak levels above the criticallevel, and to account mainly for mechanical changes in the inner ear; while peaklevels from industrial environments are typically below the critical level and theyare assumed to produce mainly metabolic changes. Therefore, the AHAAH modelmay not predict accurately hearing damage from occupational impulsive noises.
In the following, some of the limitations that the AHAAH introduces to accountfor metabolic changes in the inner ear are explained.
Although the AHAAH accounts for the effect of the acoustic reflex of the middleear, it only considers two options: either ON, e.g., the muscle is fully contractedbefore the arrival of the impact; or OFF, the muscle is deactivated and it contractsreflexively in response to the impulse. For estimations of the hazard from repeatedexposures to the same impulse, the model simply adds the hazard (in ADUs) of eachindividual exposure. While this might hold for the assessment of direct mechanicaldamage from high-intensity peak levels, it might no be true in the case of occu-pational exposures to a series of impulses. In this case the AHAAH model mightoverestimate the hazard for two reasons:
1. For repetitions of impulses the AHAAH does not consider that the reflex mus-cle may be partially activated when an impulse arrives; which might attenuatesound transmission to the inner ear and, therefore, result in a protective effect(Henderson and Hamernik, 1986; Arlinger, 1993).
2. The AHAAH does not consider that the temporary spacing between impulsesmay allow the ear some time to recover.
Another limitation is that the AHAAH estimates risk of mechanical damagebased on measurements of the displacement of the basilar membrane in ADUs.
2http://www.arl.army.mil

2.3. OTOACOUSTIC EMISSIONS 31
However, it does not account for metabolic exhaustion of the outer hair cells (OHC),which could be a better indicator of risk of hearing loss from occupational exposures.Finally, it is not clear whether the model can predict risk of hearing loss from com-binations of impulsive and continuous noise, as typically encountered in industrialenvironments. For these reasons, there is still some skepticism to use the AHAAHfor the assessment of occupational NIHL (Kardous et al., 2005).
2.3 Otoacoustic emissions
Otoacoustic emissions (OAEs) are sounds generated by the inner ear as part of thenormal hearing process. These sounds can be detected in the ears of mammals,including humans. OAEs can be recorded with a sensitive microphone fitted intothe ear canal of the subject. In this way their assessment is objective, innocuousand non-intrusive.
It is believed that OAEs are a byproduct of the active amplification processwithin the cochlea (Kemp, 2002). During this process the OHCs enhance the vi-bration of narrow regions of the basilar membrane (BM), which improves low-levelsensitivity and refines the frequency selectivity of the mechanical vibrations of thecochlea. A consequence of the process is that some of the acoustic energy travelsbackwards through the middle ear from the cochlea. This energy will make the tym-panic membrane vibrate and, therefore, radiate sound into the ear canal in the formof OAEs. An unobstructed ear canal and a healthy middle ear are necessary for acorrect detection of OAE levels. The OHCs are an essential part of this process.For this reason, it is commonly accepted that OAEs are a sensitive indicator of thephysiological activity of the OHCs in the inner ear (Probst et al., 1991).
2.3.1 OAE vs. hearing thresholds
The presence of OAE is interpreted as a sign of healthy hearing. This statementholds for population studies for which it has been shown that the presence of OAEsis related to normal hearing thresholds; whereas reduced OAE levels correlate toelevated hearing thresholds (e.g., Collet et al., 1990; Desai et al., 1999; Lonsbury-Martin et al., 1991; Reuter and Hammershøi, 2007). For individual diagnosis OAEmeasurements might not be sufficient to infer that a subject has normal hearing.
Hitherto, it is not possible to predict hearing thresholds based on OAE mea-surements (e.g., Gaskill and Brown, 1990, 1993). One explanation is that OAE andhearing levels involve two different auditory mechanisms. On the one hand, OAEsdo not provide information about the hearing beyond the cochlea; whereas hearingthresholds are the result of a cognitive process that depends not only on the cochlearstatus but also on the further processing. For this reason, OAE measurements can-not be considered a hearing test. Instead, OAEs are an objective test of cochlearfunction.
2.3.2 Types of OAE
OAEs can occur either spontaneously or in response to an acoustic stimulus. Theformer are called spontaneous otoacoustic emissions (SOAEs) and the latter evokedotoacoustic emissions (EOAEs).
SOAEs occur in the absence of any intentional stimulation of the ear. Thepresence of SOAEs is usually considered to be a sign of cochlear health, but the
32 CHAPTER 2. BACKGROUND AND THEORY
absence of SOAEs is not necessarily a sign of abnormality. In fact, their prevalenceis about 40-60% of normal hearing people and for this reason, SOAEs have little ornone clinical application.
There are several techniques for the analysis of EOAEs. The two types mostwidely used are distortion product otoacoustic emissions (DPOAEs) and transientevoked otoacoustic emissions (TEOAEs). DPOAEs are the ones used in this thesisand they are further explained in section 2.3.3.
TEOAEs are evoked by a click stimulus which excites a broad region of thebasilar membrane. Depending on the measurement device several types of stimuliare used, such as broad-band clicks, tone pips or tone bursts among others. Themeasurement procedure typically consists of repetitions of the preset stimulus. Then,the delayed cochlear responses in the ear canal are acquired and accumulated in amemory bank in order to enhance the detection of the small cochlear signals againstthe background noise.
TEOAEs are considered the most complex type of emission, and recent experi-ments suggest that TEOAE response might contain not only TEOAE components,but also distortion products and spontaneous emissions (Kalluri and Shera, 2001).TEOAEs are not normally seen in people with a hearing loss greater than 30 dB HL.
Currently, TEOAEs are clinically applied for the early detection of hearing lossin newborn and infants. Furthermore, there is a great international interest in theirincorporation as part of a universal neonatal screening-program (Joint Committeeon Infant Hearing, 2007).
2.3.3 Distortion product otoacoustic emissions
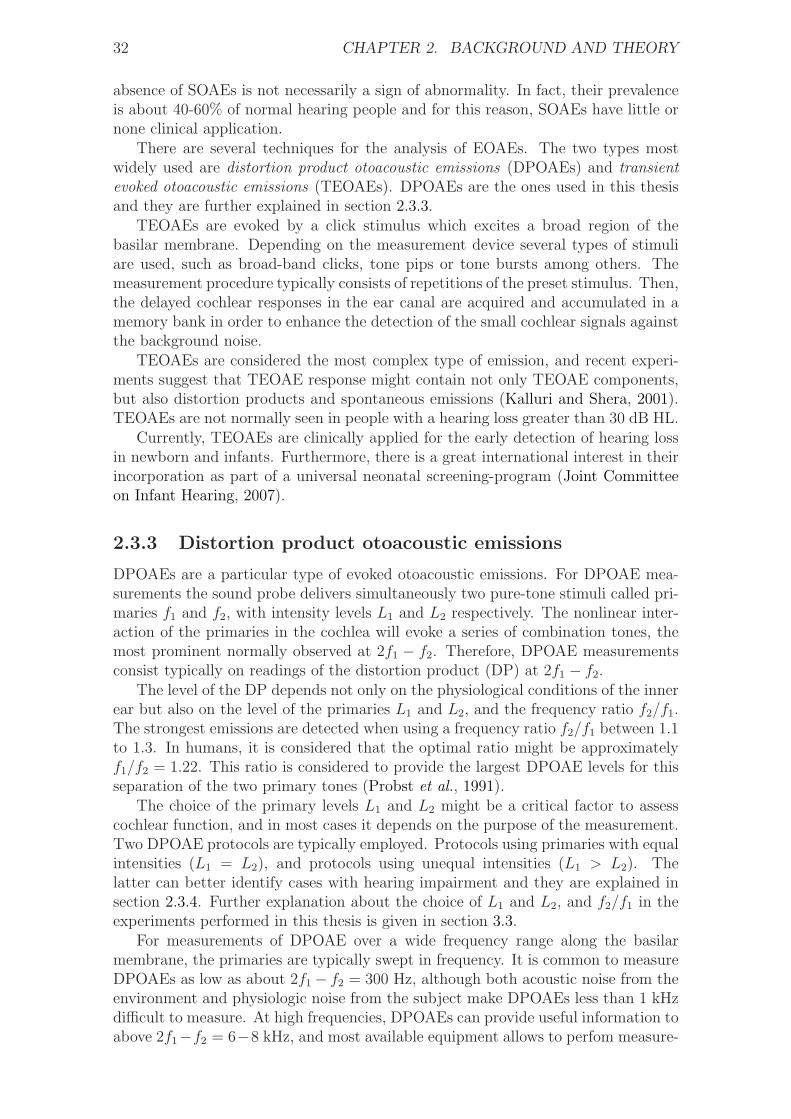
DPOAEs are a particular type of evoked otoacoustic emissions. For DPOAE mea-surements the sound probe delivers simultaneously two pure-tone stimuli called pri-maries f1 and f2, with intensity levels L1 and L2 respectively. The nonlinear inter-action of the primaries in the cochlea will evoke a series of combination tones, themost prominent normally observed at 2f1 − f2. Therefore, DPOAE measurementsconsist typically on readings of the distortion product (DP) at 2f1 − f2.
The level of the DP depends not only on the physiological conditions of the innerear but also on the level of the primaries L1 and L2, and the frequency ratio f2/f1.The strongest emissions are detected when using a frequency ratio f2/f1 between 1.1to 1.3. In humans, it is considered that the optimal ratio might be approximatelyf1/f2 = 1.22. This ratio is considered to provide the largest DPOAE levels for thisseparation of the two primary tones (Probst et al., 1991).
The choice of the primary levels L1 and L2 might be a critical factor to assesscochlear function, and in most cases it depends on the purpose of the measurement.Two DPOAE protocols are typically employed. Protocols using primaries with equalintensities (L1 = L2), and protocols using unequal intensities (L1 > L2). Thelatter can better identify cases with hearing impairment and they are explained insection 2.3.4. Further explanation about the choice of L1 and L2, and f2/f1 in theexperiments performed in this thesis is given in section 3.3.
For measurements of DPOAE over a wide frequency range along the basilarmembrane, the primaries are typically swept in frequency. It is common to measureDPOAEs as low as about 2f1 − f2 = 300 Hz, although both acoustic noise from theenvironment and physiologic noise from the subject make DPOAEs less than 1 kHzdifficult to measure. At high frequencies, DPOAEs can provide useful information toabove 2f1−f2 = 6−8 kHz, and most available equipment allows to perfom measure-

2.3. OTOACOUSTIC EMISSIONS 33
Figure 2.3: Conceptual diagram of the generation of the DPOAE fine structures accordingto the two-source model.
ments up to this limit, which is constrained primarily by the technical limitationsof the loudspeakers (Robinette and Glattke, 2000).
Fine structures of the DPOAE
When DPOAE measurements are performed with sufficiently high frequency resolu-tion, the 2f1−f2 acoustic distortion product can show a particular pattern character-ized by a series of amplitude peaks and valleys across frequency with peak-to-valleyamplitude ratios as great as 20 dB (Gaskill and Brown, 1990; He and Schmiedt,1993; Heitmann et al., 1996; Reuter and Hammershøi, 2006) and a periodicity of3/32 octaves (He and Schmiedt, 1993) This distinct characteristic in DPOAE levelswith small frequency intervals is known as fine structures. Similar fine structureshave been observed in hearing thresholds. However, it is not clear whether there isa unequivocal relation between the two (Talmadge et al., 1998).
The reason for the fine structures is not completely understood but it is widelyaccepted that they reflect the interaction of two components: (1) the distortioncomponent generated in the overlap region of the two-stimulus tones – which ap-proximates to the region of f2; and (2) the reflection component generated at the2f1 − f2 place. The DPOAE measured in the ear canal is assumed to be the vec-tor sum of contributions arising from the f2 and 2f1 − f2 region (see Figure 2.3).The two components interfere with each other constructively or destructively, andas consequence, large level differences for small frequency intervals can be shown inthe DPOAE. This hypothesis is known as the two-source model (Shaffer et al., 2003;Mauermann et al., 1999,b).
The distortion and reflection component may arise by two fundamentally differ-ent mechanisms within the cochlea: (1) nonlinear distortion; and (2) linear coherentreflection (for a detail description see Shera and Guinan, 1999). Nonlinear dis-tortion arises from the action of the cochlear amplifier producing a wave-relatedmechanical interaction on the basilar membrane and depends on inherent physiolog-ical nonlinearities of the cochlear amplifier. Because this mechanism is associatedwith the traveling wave, it has historically been called a wave-fixed phenomenon(Kemp, 1986). In contrast, the reflection mechanism, often denoted as a place-fixedphenomenon, involves reflection of energy from inhomogeneities that are distributed

34 CHAPTER 2. BACKGROUND AND THEORY
1.25 1.6 2 2.5 3.15 4 5−5
0
5
10
15
DP
OA
E [
dB
]
Fgmean
[kHz]
High−res
Low−res
Figure 2.4: Example of a DPOAE measurement performed with low (Low-res) and highfrequency-resolution (High-res). The fine structures are revealed for the High-res mea-surement.
randomly, but fixed in position, along the cochlear partition (Zweig and Shera, 1995).Although the nature of these inhomogeneities is not known, they are conceptual-ized as impedance irregularities or spatial corrugations in the cochlear mechanics oranatomy. Variation in the number and spacing of outer hair cells in primates hasbeen suggested as an example of a micromechanical irregularity that could lead toreflection of energy. Such irregularities create reflections from multiple sites thatsum with different phases. Only those reflections that sum constructively and arisefrom the tip of the basilar membrane excitation pattern in an active cochlea willhave sufficient amplitude to be recorded in the ear canal as an emission (Zweig andShera, 1995).
Figure 2.4 shows an example of a DPOAE measurement performed both withlow and high frequency-resolution. The DPOAE data is plotted as a function of thegeometric mean of the primaries (Fgmean =
√f1 ⋅ f2). The fine structures are re-
vealed for the measurement with high frequency-resolution. DPOAE measurementswith low frequency-resolution can yield misleading interpretations because (1) theycan fail to reveal changes in the properties of the fine structures that might be asign of incipient hearing loss; and (2) the experimenter does not know whether aDP point -either with low or high-level- might fall into a minimum or maximum ofthe fine structures.
Measurement of the DPOAE fine structures are relatively time consuming. Sofar they have mainly been used for research purposes, usually selecting young sub-jects with normal hearing. For subjects of different age, the fine structure might beobservable whenever the acoustic distortion-product is measurable, and its sharp-ness, defined as the peak-to-peak frequency distance, seems to be independent ofage and hearing loss (He and Schmiedt, 1996).
Some authors suggest that the presence of fine structures is a property of thehealthy ear and therefore their evaluation may reveal more information about thestate of hearing than the DPOAE level alone – e.g., the fine structures reappearafter a sudden hearing loss (Mauermann et al., 1999b); and are reduced after as-pirin consumption (Rao et al., 1996). Other authors claim that the high variabilityusually seen in the pattern of the fine structures complicates the interpretation and

2.3. OTOACOUSTIC EMISSIONS 35
comparison of results across subjects (Shaffer, 2008; Heitmann et al., 1996). Particu-larly critical is that the pattern of the fine structures get shifted along the frequencyaxis when the primary levels L1 and L2 are varied (He and Schmiedt, 1997) or thefrequency ratio f2/f1 is changed (Mauermann et al., 1999; He and Schmiedt, 1997).This stimulus-dependent frequency shift complicates the comparison of DPOAEgrowth functions with audiometric thresholds and it might be responsible for thelack of correlation between DPOAEs and hearing thresholds reported by many re-searchers (Shaffer et al., 2003; Heitmann et al., 1996). For this reason, these authorsare favorable to exclude the fine structures from the assessment.
At present, it is not clear whether the evaluation of the fine structures of theDPOAE might be critical for the detection of incipient hearing loss. Most of the ex-periments studying vulnerability of DPOAEs to noise exposures are performed withlow frequency-resolution, insufficient to detect the fine structures of the DPOAE.Conclusions from these studies might have overlooked some important properties ofthe cochlea which are a sign of incipient hearing damage.
Two studies have investigated whether there are systematic changes in the DPOAEfine structures of humans after acoustic overexposure (Engdahl and Kemp, 1996;Reuter et al., 2007). Both used a monaural narrow-band sound-exposure and mon-itored the fine structures at specific times during the recovery. Their results showthat the most affected frequency range was located 1/2-octave above the exposure–similar to the 1/2-octave shift seen in TTS experiments. However, they reporteddifferent effects in the fine structures. Engdahl and Kemp (1996) found for theirtwo subjects that the maximum to minimum ratio of the fine structure decreased,and the whole pattern shifted toward lower frequencies after the exposure. Reuteret al. (2007) found for their 16 subjects that the effects were highly individual andno systematic change was observed –i.e., some subjects showed an increase in thedepth of the fine structures while others showed a decrease, with no systematic shiftin frequency.
2.3.4 Influence of the primary levels L1/L2 in the assessmentof NIHL
Several researchers have investigated the influence of the primary levels (L1/L2) inorder to find the most sensitive set of values to reveal changes in the characteristicsof DPOAEs after noise overexposure. The current conception is that DPOAE levelsshow the greatest amplitude reduction when using low stimulus levels, with L1 > L2
(Sutton et al., 1994; Engdahl and Kemp, 1996; Gaskill and Brown, 1990; Hauser andProbst, 1991; Whitehead et al., 1995; Marshall et al., 2001). This effect is attributedto the highest functional activity of the OHCs for low-level stimulating tones.
Sutton et al. (1994) examined the effects of primary levels and ratio (L1/L2 =60/60, 55/55, 60/30, and 55/30 dB SPL) for DPOAEs following a three-minutetonal monaural exposure to a 105 dB SPL tone at 2.8 kHz in 14 subjects. Theyreported that the combination L1/L2 =55/30 dB SPL was the most sensitive tooverexposure effects. Four subjects received the same noise exposure a second timewith hearing thresholds measured instead of DPOAEs. The time course of therecovery for DPOAEs (L1/L2 =55/30 dB SPL) and TTS were very similar. Thatis to say, subjects whose TTS was greatest displayed the greatest DPOAE loss;whereas for subjects whose TTS was unaffected there was no apparent DPOAEshift. These similarities suggest that with the appropriate parameters DPOAEs canbe as sensitive to TTS as pure-tone audiometry.

36 CHAPTER 2. BACKGROUND AND THEORY
In a similar experiment, Engdahl and Kemp (1996) exposed two subjects to a1/3-octave narrow-band noise centered at 2 kHz during 10 minutes, and measuredinput/ouput (I/O) functions with L2 ranging from 50 to 75 dB SPL in steps of 5 dB.L1 was always 10 dB higher than L2. DPOAEs were measured with f2 fixed near3 kHz (1/2-octave above the noise exposure) and a frequency ratio f2/f1 of 1.22.In agreement with Sutton et al. (1994), they found that the DPOAE amplitudereduction was greatest at low stimulus levels. They also noted that the DPOAErecovery functions were similar to TTS recovery functions in other studies.
Further, DPOAEs have been used as a screening tool to differentiate normal-hearing from impaired ears. Also in this case, researchers have reported a highersuccess when using primary levels with L1 > L2 (Marshall et al., 2001). Stoveret al. (1996) reported that optimal L2 levels for separating normal-hearing fromhearing-impaired ears were in the 50-60 dB SPL range, with L1 − L2 = 10 dB.
2.3.5 Effect of impulsive noise on DPOAEs
Several animal studies have investigated the effects of industrial impulsive noise onDPOAEs. Results from animal studies cannot be extrapolated directly to humans.However, animal studies have remarkable advantages over human studies as they al-low not only to use more severe exposure conditions but also to study morphological3
and histopathological4 changes in the inner ear.Emmerich et al. (2000b) exposed six groups of guinea pigs to six different realistic-
type industrial noises ranging from continuous to impulsive. Continuous noise stim-uli consisted of broad-band noise, low and mid-frequency noise. All stimuli had thesame energy. DPOAEs (L1 = L2 = 70 dB SPL) were measured in a broad-band fre-quency range before and after the noise exposures. Their results showed that for thecase of impulsive noise, DPOAE levels were significantly reduced in a broad-bandfrequency range, which were in good agreement with OHC loss. However, for thecase of continuous noise, DPOAE levels were diminished according to the spectralcontent of the stimuli but with lesser coincidence of OHC loss. They concluded thatdifferent types of industrial noise tend to produce typical changes on DPOAE levels,being the impulsive type the most hazardous.
In addition, animal studies have shown that exposures to industrial impulsivenoise can strongly damage OHCs, while the IHCs may remain intact (Emmerichet al., 2000b,a). It has also been reported that for PTS below 25 dB, often there isno correlation between OHC loss and decrease of DPOAE level. However, for moresevere permanent changes (PTS > 25 dB) there is a good correspondence betweenthe two (Hamernik and Qiu, 2000). These observations suggest that more studiesare necessary in order to understand how changes observed on DPOAEs (and OAEsin general) may relate to permanent hearing damage.
For humans, the literature regarding the effect of impulsive sounds on OAEs(either DPOAE or TEOAE) is still sparse and it has mostly focused on military set-tings (Marshall et al., 2001; Attias et al., 2001; Engdahl et al., 1996; Konopka et al.,2005; Miller et al., 2004). Marshall et al. (2001) measured audiometric thresholds,DPOAEs (L1/L2 =59/50 and 65/45 dB SPL) and TEOAEs (74 dB pSPL click) in285 U.S. Marine Corps recruits before and three weeks after exposure to impulse-noise military weapons. Peak levels ranged from 149 to 157 dB peak SPL. Audio-
3Morphological : Referring to the form and structure of organisms.4Histophatology : The study of the microscopic anatomical changes in diseased tissue of an
organism.

2.3. OTOACOUSTIC EMISSIONS 37
metric thresholds were measured at 0.5, 1, 2, 3, 4 and 6 kHz. OAEs were monitoredin a similar frequency-range with low frequency-resolution. The results show thatOAE levels (DPOAE and TEOAE) were significantly reduced after noise exposure,whereas no significant change was found for hearing thresholds. The authors con-cluded that OAEs were a more sensitive indicator of incipient hearing loss thanaudiometric thresholds. They also reported that for individual ears, subjects withlow-level or absent OAEs before exposure were more likely to show a significantthreshold shift after exposure to impulsive sounds. Similar findings were reportedby Attias et al. (2001). However, in this case the noise exposures were not docu-mented, which makes very difficult to conclude which characteristics of the impulsiveexposures led to an increased NIHL.
An observation to the studies above is that perhaps longitudinal studies tend toshow that OAEs have greater sensitivity to detect NIHL than hearing thresholdsbecause pure-tone audiometries are performed with standard procedures. In theseprocedures, hearing thresholds may be determined in steps of 5 dB HL –excessiveto detect immediate changes. Therefore, it can be argued that OAEs may be moresensitive than hearing thresholds to detect noise-induced damage when measuredin the field, but it cannot be concluded that OAEs are more sensitive than hear-ing thresholds per se. For instance, laboratory studies have shown a more directrelationship between temporary changes in OAEs and hearing thresholds (TTS),which in part may be due to using higher-resolution Bekesy audiometry (Marshallet al., 2001). Similarities have also been observed in the frequency specificity andtime course of the recovery of TTS (e.g., Marshall et al., 2001; Engdahl and Kemp,1996; Emmerich et al., 2000b; Reuter et al., 2007). These similarities suggest thatthe underlying mechanisms behind changes in OAEs and hearing levels are closelyrelated.
2.3.6 Choice of DPOAE over TEOAE
Both DPOAE and TEOAE have been successfully used to assess risk of NIHL,although literature is more extensive for DPOAE studies (for a review see Marshallet al., 2001). However, at present there are not enough data to conclude which oneof them is superior in detecting incipient damage in the inner ear.
The comparison between DPOAEs and TEOAEs in the assessment of risk ofhearing loss is not straightforward as the results may depend on the set of parameterschosen for the measurements (L1/L2 for DPOAEs and peak level pSPL of the clickstimulus for TEOAEs). It might be for this reason that some authors have reportedthat TEOAE might be a better indicator of NIHL (Reshef et al., 1993; Attias et al.,1995; Prasher and Sulkowski, 1999); while other studies suggest that there is acertain range of parameters for which DPOAEs and TEOAEs perform similarly(Attias, 2000; Marshall et al., 1998; Marshall and Heller, 1998).
Of special attention are the studies by Marshall et al. in which they compared theperformance of DPOAE and TEOAE with TTS following a monaural tonal exposureof 2 kHz (105 dB SPL half-octave narrow-band noise at 1.414 kHz center frequency)in two different experiments with 14 human subjects. In the first experiment theauthors measured TTS and DPOAE amplitude shifts interleaved along the samerecovery function (Marshall et al., 1998). DPOAE stimulus levels were L1/L2 =70/60 dB SPL and L1/L2 = 65/45 dB SPL. The authors found a strong relationshipbetween TTS and DPOAE amplitude shifts, as well as in the temporal characteristicsof the recovery, particularly for the DPOAE stimulus L1/L2 = 65/45 dB SPL. They
38 CHAPTER 2. BACKGROUND AND THEORY
repeated the same experiment but using TEOAE instead of DPOAE (Marshall andHeller, 1998). TEOAEs were measured at 74 dB pSPL. Eight subjects participatedalso in the previous experiment, which allowed a better comparison of DPOAEs andTEOAEs. The authors found a strong relationship between TTS and TEOAE alsoin this case. When comparing the results from the eight subjects who participatedin both experiments the authors reported that the maximum shift of both DPOAEand TEOAE was half an octave above the center frequency of the tonal exposure.They concluded that the underlying mechanism for amplitude shifts in DPOAE andTEOAE is closely linked to the underlying mechanism for TTS.
Knight and Kemp (2000) indicated that the issue is not to choose betweenDPOAEs and TEOAEs, but rather to decide what underlying physiological mech-anisms are being targeted and to attempt to choose the stimulus parameters ac-cordingly (Knight and Kemp, 2000). In the present dissertation, one of the mainobjectives was to continue with the research performed at the Section of Acousticsof Aalborg University regarding the evaluation of NIHL with DPOAEs and improveour understanding of the properties and generation mechanisms of the fine structuresof the DPOAE. It is for this reason that DPOAEs were chosen over TEOAEs.

Chapter 3
Methods
3.1 Methodological overview
Experiments were done at the Section of Acoustics1 of Aalborg University (AAU2)and they were approved by the Danish National Ethical Committee on BiomedicalResearch Ethics (CVK3). All sessions were conducted in a double-walled, sound-isolated audiometry-chamber which complies with the background noise require-ments stated in ISO 8253-1:1989. The experimental protocol in both experimentswas similar. A total of 16 normal-hearing subjects participated in each experi-ment. The screening for normal hearing consisted of measurements of pure-toneaudiometry, tympanometry and middle-ear reflex activity. Subjects also underwentan interview in order to obtain more information about their noise exposure history,previous hearing problems and reaction to noise, e.g., annoyance or headaches. Onlysubjects who reported neither known incidents of excessive noise exposures nor ab-normal reactions to noise were allowed to participate. A pure-tone audiometry wasperformed at the end of each experimental session to verify that the hearing of thesubjects recovered completely.
Subjects were exposed to a particular noise stimuli for 10 minutes via a pair ofheadphones model Sennheiser HDA 200. DPOAEs were measured before and afterthe noise exposure. DPOAEs were measured only in one ear -either left or right-which was balanced across subjects.
The main differences between the experiments consisted of:
∙ PAPER I: subjects were exposed to a monaural pure tone of 2 kHz (LEX,8ℎ
=80 dBA). In the following, this stimulus is referred to as TONE. DPOAEswere measured during the following 70 minutes after the exposure. The proto-col allowed to monitor the fine structures of the DPOAE in a 1/3-octave bandcentered at 3 kHz.
∙ PAPER II: subjects were exposed to two types of binaural industrial-recordingsin two different sessions: (1) a continuous broad-band noise normalized toLEX,8ℎ = 80 dBA (crest factor CF = 13 and kurtosis � = 3); and (2) thecombination of the previous stimulus (scaled down in level) with an impulsivenoise normalized to LEX,8ℎ = 75 + 5dBpenalty = 80 dBA (Lpeak = 117 dBC;repetition rate of 0.5 impacts per second, CF = 25, � = 32). Both noise
1http://www.es.aau.dk/sections/acoustics/2http://en.aau.dk/3Den Centrale Videnskasbetiske Komite – http://www.cvk.sum.dk
39

40 CHAPTER 3. METHODS
stimuli were bandpass filtered from 100 Hz to 16 kHz. In the following, thestimuli are referred to as CONT and IMP+CONT respectively. DPOAEswere measured in a broad frequency range (1.25< Fgmean[kHz]< 5) during thefollowing 90 minutes of recovery after the exposure.
3.2 Pure-tone audiometry and middle-ear test
Pure-tone audiometries were measured using the commercial audiometer MadsenOrbiter 922 and the audiometric headphones Telephonic TDH39. The left ear wastested first. Hearing thresholds were determined in a frequency range from 250Hzto 8 kHz in octave intervals by using the ascending method, which complies with thenorms for automatic audiometries ISO 8253-1:1989. Tympanometries and stapedius-reflex tests were performed with the Interacoustics impedance audiometer AT235.
3.3 DPOAE assessment
A new methodological protocol was programmed with the commercial system ILO96from Otodynamics4 by using the DPOAE macro operating mode. The protocol al-lows DPOAE measurements with a higher time and frequency resolution, and moreprogramming flexibility than the one used in previous experiments at Aalborg Uni-versity (Reuter and Hammershøi, 2006, 2007; Reuter et al., 2007). This is partic-ularly important in order to monitor sudden changes during the recovery processof DPOAEs after noise overexposure. The DPOAE-macro mode allows the user toprogram the operations to be performed by the system by writing a function calledmacro. The following parameters can be programmed: up to 16 user-defined pairsof primaries f1 and f2; level of the primaries L1/L2; frequency ratio f2/f1; averagingtime per primaries presentation; and measurement time in loop-mode.
The main advantage of the DPOAE-macro mode for the assessment of DPOAErecovery is that the measurement process becomes highly automated, and data ac-quisition can be performed in a loop-mode without interruptions. However, it hasthe limitation that it only allows programming a maximum of 16 user-defined pairsof primaries f1 and f2. Therefore, our measurements in both experiments are limitedto this number of primaries.
Although chronologically the implementation of the DPOAE-macro mode wasperformed first, it is presented in PAPER III due to its minor relevance to understandPAPERS I and II.
Individual macros were programmed for each subject. The only difference be-tween macros is the presentation order of the primaries, which was counter-balancedacross subjects by means of a Latin-square design.
Choice of primary levels and ratio
In both experiments, DPOAE measurements were performed using a ratio of f2/f1 =1.22. This ratio was chosen as it may provide the largest DPOAE levels acrosssubjects (Probst et al., 1991). The primary levels were set to L1/L2 = 65/45 dB.This choice is a compromise between:
4http://www.otodynamics.com/
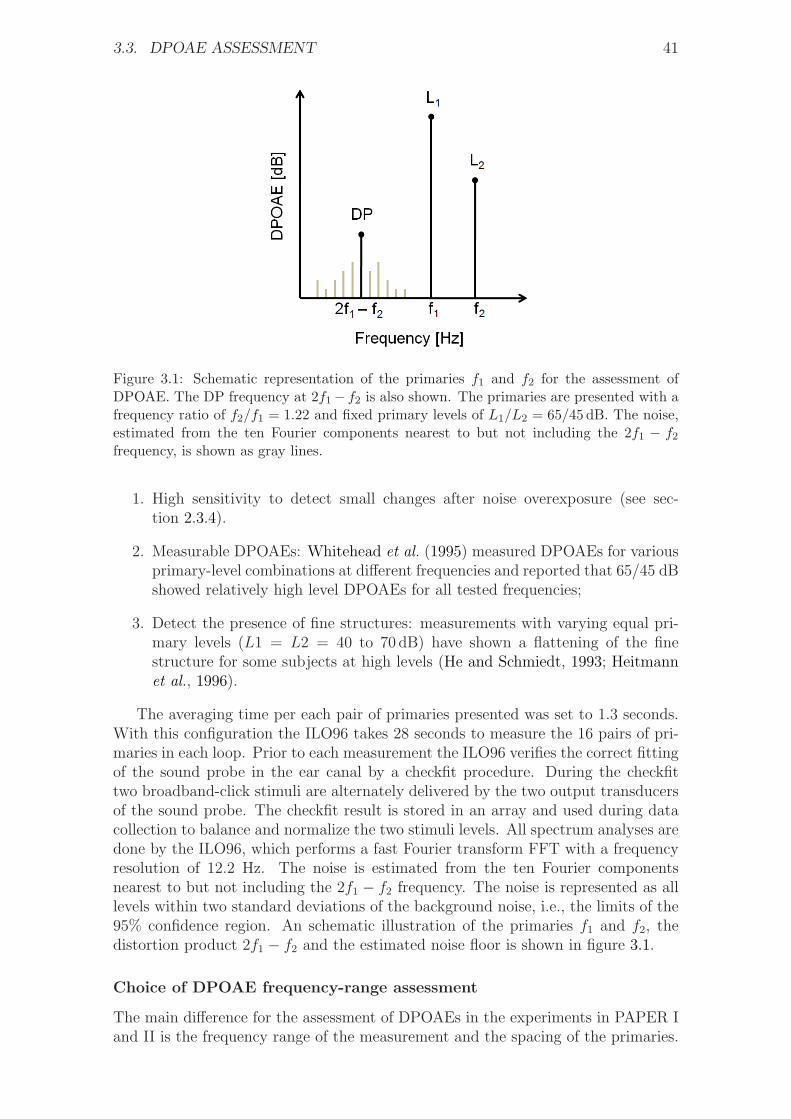
3.3. DPOAE ASSESSMENT 41
Figure 3.1: Schematic representation of the primaries f1 and f2 for the assessment ofDPOAE. The DP frequency at 2f1− f2 is also shown. The primaries are presented with afrequency ratio of f2/f1 = 1.22 and fixed primary levels of L1/L2 = 65/45 dB. The noise,estimated from the ten Fourier components nearest to but not including the 2f1 − f2frequency, is shown as gray lines.
1. High sensitivity to detect small changes after noise overexposure (see sec-tion 2.3.4).
2. Measurable DPOAEs: Whitehead et al. (1995) measured DPOAEs for variousprimary-level combinations at different frequencies and reported that 65/45 dBshowed relatively high level DPOAEs for all tested frequencies;
3. Detect the presence of fine structures: measurements with varying equal pri-mary levels (L1 = L2 = 40 to 70 dB) have shown a flattening of the finestructure for some subjects at high levels (He and Schmiedt, 1993; Heitmannet al., 1996).
The averaging time per each pair of primaries presented was set to 1.3 seconds.With this configuration the ILO96 takes 28 seconds to measure the 16 pairs of pri-maries in each loop. Prior to each measurement the ILO96 verifies the correct fittingof the sound probe in the ear canal by a checkfit procedure. During the checkfittwo broadband-click stimuli are alternately delivered by the two output transducersof the sound probe. The checkfit result is stored in an array and used during datacollection to balance and normalize the two stimuli levels. All spectrum analyses aredone by the ILO96, which performs a fast Fourier transform FFT with a frequencyresolution of 12.2 Hz. The noise is estimated from the ten Fourier componentsnearest to but not including the 2f1 − f2 frequency. The noise is represented as alllevels within two standard deviations of the background noise, i.e., the limits of the95% confidence region. An schematic illustration of the primaries f1 and f2, thedistortion product 2f1 − f2 and the estimated noise floor is shown in figure 3.1.
Choice of DPOAE frequency-range assessment
The main difference for the assessment of DPOAEs in the experiments in PAPER Iand II is the frequency range of the measurement and the spacing of the primaries.

42 CHAPTER 3. METHODS
f1 f2 2f1 − f2 Fgmean f2/f1
2441 2979 1903 2697 1,22
2478 3027 1929 2739 1,22
2527 3076 1978 2788 1,21
2563 3125 2001 2830 1,21
2600 3174 2026 2873 1,22
2637 3223 2051 2915 1,22
2686 3271 2101 2964 1,21
2722 3320 2124 3006 1,22
2759 3369 2149 3049 1,22
2808 3430 2186 3103 1,22
2856 3479 2233 3152 1,21
2893 3528 2258 3195 1,21
2930 3577 2283 3237 1,22
2966 3625 2307 3279 1,22
3015 3674 2356 3328 1,21
3052 3723 2381 3371 1,22
Table 3.1: Frequency value [Hz] of the 16 pairs of primaries f1 and f2 used in the firstexperiment (PAPER I). Their distortion product 2f1 − f2, geometric mean Fgmean, andfrequency ratio f2/f1 are also shown. For some primaries the frequency ratio is 1.21instead of the programmed value of 1.22. This is due to limitations of the measuringsystem ILO96 – i.e., the ILO96 presents primaries at discrete frequencies with a minimumresolution of 12 Hz. Thus, when the system presents f1 it selects the value of f2 that willyield the closest value to 1.22.
In the first experiment (PAPER I), DPOAE measurements are performed in anarrow-band frequency range with high frequency-resolution. It was expected thata tonal exposure would produce the highest impact on the basilar membrane 1/2-octave above the exposure frequency. This phenomenom, known as the half-octaveshift, was first observed by Davis et al. (1950) when measuring TTS on humansubjects and they reported that the predominant hearing loss resulting from expo-sure to sufficiently intense pure tones is one-half to one octave above the stimu-lating frequency. Several researchers have confirmed the half-octave shift in experi-ments assessing TTS (Ordonez, 2005) and PTS after tonal or narrow-band exposures(Mills et al., 1979). The half-octave shift has also been observed for measurementsof DPOAE and TEOAE (Engdahl and Kemp, 1996; Reuter et al., 2007; Marshallet al., 2001). However, in this case the authors have reported that OAE levels maybe reduced in a broader frequency range than the one typically seen in TTS mea-surements. The authors attribute this difference to the higher sensitivity of OAEsto detect early hearing loss.
The stimulus used in PAPER I consisted of a pure tone of 2 kHz. Hence,DPOAEs were measured in a frequency range centered at 3 kHz (Fgmean) –i.e.,half-octave above the exposure tone. As the purpose of the experiment was tomonitor the fine structures of the DPOAE, the frequency range was covered by 16equally-spaced pairs of primaries with a frequency resolution of 48 Hz. With thisconfiguration the frequency range covered approximately a 1/3-octave band centeredat 3 kHz. Table 3.1 shows the frequency value of the 16 pairs of primaries.

3.3. DPOAE ASSESSMENT 43
A tonal exposure was chosen in a effort to minimize the region of the basilarmembrane affected after overexposure. Further, it was decided to use a pure toneof 2 kHz based on the results of a pilot test, in which a pure tone of 1 kHz was usedinstead. Two normal-hearing subjects participated in the pilot test. One of theirears was exposed to a pure tone of 1 kHz during 10 minutes. The exposure level wasnormalized to LEX,8ℎ = 80 dBA, which corresponds to an Lear,10min of 96.2 dBA mea-sured at the blocked-entrance ear canal according to ISO 11904-1:2002. DPOAEswere measured before and during the following 20 minutes after the exposure ina frequency range centered at 1.5 kHz (half-octave above the exposure frequency)with the DPOAE-macro mode. The results showed that DPOAEs from both sub-jects had a poor S/N in the measured frequency range. The low S/N was due to lowDPOAE levels –which may be due to the particular physiological hearing conditionof the subjects– and also a high background noise during the measurements. A lowS/N may be detrimental for the analysis of the results. This is particularly criticalfor the minima of the fine structures, as they might appear below the backgroundnoise and therefore, influence their analysis. Therefore, it was decided to use apure tone of 2 kHz instead in an attempt to increase the S/N ratio during DPOAEmeasurements. This decision is based on the following considerations:
1. The high background noise in DPOAE measurements is typically seen at lowfrequencies. This noise is attributed not only to acoustic noise from the envi-ronment but also to physiological noise from the subject due to breathing, swal-lowing and/or heartbeats among others. Thus, it was expected that DPOAEmeasurements in a higher frequency range will be less affected by backgroundnoise.
2. Results from Reuter and Hammershøi (2006) corresponding to the averageof 50 normal-hearing subjects show that DPOAE levels are lower in the lowfrequency-range. Thus, it was expected that subjects will show higher DPOAElevels at higher frequencies.
Only one of the subjects in the pilot test showed an evident DPOAE decrementafter exposure. It was also observed that for this subject DPOAEs recovered grad-ually after the exposure. However, DPOAEs did not recover completely by the endof the observation period of 20 minutes, as they were still approximately 2 dB belowpre-exposure levels. For this reason, it was decided to increase the observation pe-riod in the formal experiment to a duration of 70 minutes in order to allow completerestitution of DPOAE levels. For this subject, DPOAEs were measured again thenext day and they were fully recovered. Finally, none of the subjects in the pilottest had measurable fine structures.
In the second experiment (PAPER II) it was expected that the broadband noisestimuli CONT and IMP+CONT would have an impact on a wide region of thebasilar membrane. Hence, DPOAE measurements were performed in the frequencyrange 1282 < Fgmean[Hz] < 4695 with a frequency resolution of eight points peroctave. This frequency range is a compromise between measuring DPOAEs in abroad region while avoiding low S/N at lower frequencies, and a poor probe fittingat high frequencies. Nevertheless, it was anticipated that subjects may show lowerS/N at lower frequencies for the reasons explained in the previous section.
Table 3.2 shows the frequency value of the 16 pairs of primaries.
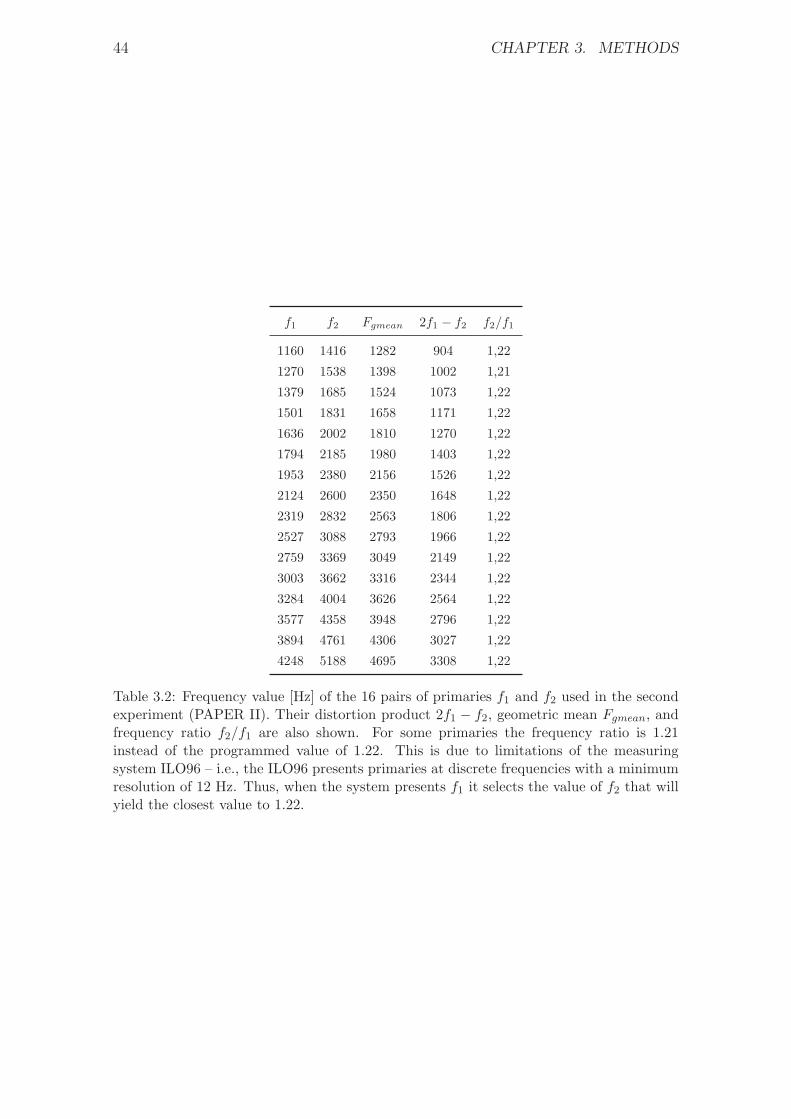
44 CHAPTER 3. METHODS
f1 f2 Fgmean 2f1 − f2 f2/f1
1160 1416 1282 904 1,22
1270 1538 1398 1002 1,21
1379 1685 1524 1073 1,22
1501 1831 1658 1171 1,22
1636 2002 1810 1270 1,22
1794 2185 1980 1403 1,22
1953 2380 2156 1526 1,22
2124 2600 2350 1648 1,22
2319 2832 2563 1806 1,22
2527 3088 2793 1966 1,22
2759 3369 3049 2149 1,22
3003 3662 3316 2344 1,22
3284 4004 3626 2564 1,22
3577 4358 3948 2796 1,22
3894 4761 4306 3027 1,22
4248 5188 4695 3308 1,22
Table 3.2: Frequency value [Hz] of the 16 pairs of primaries f1 and f2 used in the secondexperiment (PAPER II). Their distortion product 2f1 − f2, geometric mean Fgmean, andfrequency ratio f2/f1 are also shown. For some primaries the frequency ratio is 1.21instead of the programmed value of 1.22. This is due to limitations of the measuringsystem ILO96 – i.e., the ILO96 presents primaries at discrete frequencies with a minimumresolution of 12 Hz. Thus, when the system presents f1 it selects the value of f2 that willyield the closest value to 1.22.

3.4. SELECTION OF NOISE STIMULI 45
3.4 Selection of noise stimuli
Some of the characteristics of the stimuli TONE, CONT and IMP+CONT were keptidentical in order to facilitate the comparison between them. These characteristicsare (1) the duration of the exposure; and (2) the exposure level LEX,8ℎ. Their choiceis explained next.
3.4.1 Choice of exposure level
The choice of the exposure level (LEX,8ℎ = 80 dBA) for the stimuli TONE andCONT was based on the fact that it is ethically unacceptable to induce a permanentdamage in the hearing of the subjects during the noise exposures. According to ISO1999:1990 a daily eight-hour exposure during 10 years to 80 dBA will not resultin a significant hearing loss in any percentage of the population. However, thisconclusion is based on longitudinal studies in which workers were exposed mainlyto continuous broad-band noise, and it is not certain that it will also be safe for alltypes of impulsive exposures. For this reason, instead of normalizing the stimulusIMP+CONT to 80 dBA (this is, the same LEX,8ℎ as the stimuli CONT and TONE)and study whether the effects of the three equal-energy stimuli could be compared,it was preferred to use a more conservative approach and normalize the stimulusIMP+CONT to 75 dBA. In this way, the stimulus IMP+CONT can still be penalized+5 dB for impulsiveness and thereby, its corrected exposure level becomes LEX,8ℎ =75 + 5dBpenalty = 80 dBA.
For the stimulus TONE, an exposure level of LEX,8ℎ = 80dBA corresponds to anequivalent continuous A-weighted sound-pressure level (SPL) of LAeq,10min = 96.8 dBaccording to ISO 1999:1990. This level corresponds to a Lear of 102.2 dB measuredat the blocked-entrance ear canal according to ISO 11904-1:2002.
For the stimuli CONT and IMP+CONT further information is given in sec-tion 3.5.
3.4.2 Choice of stimuli duration
Noise stimuli had a duration of 10 minutes. This duration is a compromise betweenavoiding too short or too long exposures and still being able to induce a temporarychange on the hearing of the subjects.
Noise exposures shorter than 10 minutes may introduce the following disadvan-tages:
1. According to literature, intense tonal and narrow-band exposures of approxi-mately less than four minutes will produce a peak in the TTS recovery patternat approximately two minutes after the end of the noise exposure (Hirsh, 1958;Quaranta et al., 1998; Botsford, 1971). This peak is known as the two-minutebounce and it seems to disappear for longer exposures (Patuzzi, 1998; Botsford,1971). A similar phenomenon has also been reported in the DPOAE recoverydata from animal studies (Kirk et al., 1997; Kirk and Patuzzi, 1997). Someauthors have suggested that the two-minute bounce might be the product ofthe interaction between different short-lived recovery mechanisms that mayreflect different metabolic or mechanical changes in the cochlea. The two-minute bounce may complicate the comparison of the results between tonaland broad-bad noise exposures.
46 CHAPTER 3. METHODS
2. Noise exposures would require higher SPL if an exposure level (LEX,8ℎ) of80 dBA is to be maintained. This could be particularly critical in the case ofthe stimulus IMP+CONT, as peak levels would be higher than 120 dBC andthe risk of inducing a permanent hearing loss would increase.
Noise exposures longer than 10 minutes are avoided for the following reasons:
∙ To reduce the total number of impulses within the exposure: Impulses fromthe stimulus IMP+CONT had a repetition rate of 0.5 impacts per second.Such a repetition rate may pose a high fatigue on the auditory system (seesection 2.1.4). For this reason, it was decided to avoid long-duration stimuliin order to lower the total number of stimuli within an exposure.
∙ To avoid long experimental sessions that might be exhausting for subjects.Tiredness and fatigue may result in DPOAE measurements of poor quality, assubjects may cause involuntary body movements and/or deep inhalation.
3.4.3 Noise stimuli CONT and IMP+CONT
The noise stimuli CONT and IMP+CONT consisted of binaural recordings of in-dustrial noises with the following properties:
Continuous noise (CONT)
The stimulus CONT was an industrial noise of continuous character. The stimulusconsisted of the mix of a bench-driller and a table-saw. Both machines radiatenoise of continuous character but in different frequency range; i.e., low frequencyfor the driller and mid-high frequency for the saw. It was decided to mix the twonoise sources in order to cover a broader frequency range during the noise exposure.Noise recordings were done separately and mixed afterwards via software. The10 minute-duration stimulus was obtained by concatenating a segment of 30 secondsfrom the original recordings. A crossfading technique was applied in order to havea smooth and unnoticeable transition between segments. The exposure level wasnormalized to an eight-hour working day LEX,8ℎ of 80 dBA (ISO 1999:1990). Thislevel corresponds to Lear,10min = 102.7 dB measured at the blocked-entrance earcanal (ISO 11904-1:2002).
Impulsive + continuous noise (IMP+CONT)
The stimulus IMP+CONT consisted of the combination of impulsive and continuousindustrial noise. The continuous noise was a scaled version in level of the aforemen-tioned stimulus CONT. The impulsive noise was a hammer beating a metal platewith a repetition rate of 0.5 impacts per second. Thus, there are a total of 300impulses within the exposure. The 10-minute-duration sequence of impulses con-sisted of duplicates of one single hammer impact selected from the original record-ings. In this manner, it is assured that the impulsive parameters remained constantthroughout the exposure. The impact chosen had a peak level of 117 dBC; risetime of 1.64 msec; and a B-duration of 70 msec. After the addition of the contin-uous noise CONT, peak levels had a standard deviation of 0.3 dBC. The exposurelevel (LEX,8ℎ) was normalized to 75 dBA (ISO 1999:1990). This level corresponds toLear,10min = 98.2 dB measured at the blocked-entrance ear canal (ISO 11904-1:2002).

3.4. SELECTION OF NOISE STIMULI 47
0 1 2 3 4 5−20
−10
0
10
20
Time [seconds]
Am
plit
ud
e [
Pa
]
CONT
IMP+CONT
Figure 3.2: Five-second excerpt of the diffuse-field waveforms of stimuli CONT andIMP+CONT.
According to ISO 1999:1990 and the guidelines provided by the Danish Working En-vironment Authority, the stimulus IMP+CONT can be penalized for impulsiveness.Therefore, the corrected exposure level is LEX,8ℎ = 75 + 5dBpenalty = 80 dBA.
The combination of impulsive and continuous noise was preferred over a purelyimpulsive stimulus (IMP) in order to have similar spectral energy in both stimuliCONT and IMP+CONT. The individual stimuli IMP and CONT have differentnoise spectra. Most of the energy content of the stimulus IMP is concentratedaround 4 kHz, whereas the stimulus CONT covers a broad-band frequency range.By adding the two stimuli together, both stimuli CONT and IMP+CONT have asimilar spectral content.
Figure 3.2 shows the diffuse-field related waveforms of the stimuli CONT andIMP+CONT. Figure 3.3 shows on top the diffuse-field-related value of both stimuliin 1/3-octave-bands; and at the bottom the relative difference between them nor-malized at 1 kHz. It can be seen that both stimuli have similar noise spectra exceptaround 4 kHz due to the higher energy contribution of the hammer impact in thatrange.
3.4.4 Binaural recordings, sound processing and reproduc-tion
Binaural technology is chosen for the recording and reproduction of real-life noisestimuli in order to reproduce realistic noise exposures in laboratory conditions. Thatis, to expose subjects to the original exposure by preserving the spatial informationduring the recordings and reproduce the effect of proximity to the sound source.This is particularly important when considering the role of the acoustic middle-earreflex during the noise exposures, and the fact that the incoming sound directionmight have an effect on the bilateral interaction of the stapedius muscle; i.e., thecontraction of the muscle in one ear is influenced by the state of the muscle in theother ear (Møller, 2006).
Binaural recordings were done in a mechanical workshop at Aalborg Univer-sity with the artificial head Valdemar (Christensen and Møller, 2000; Minnaaret al., 2001) connected to the multi-channel measuring system Harmonie by 01dB-
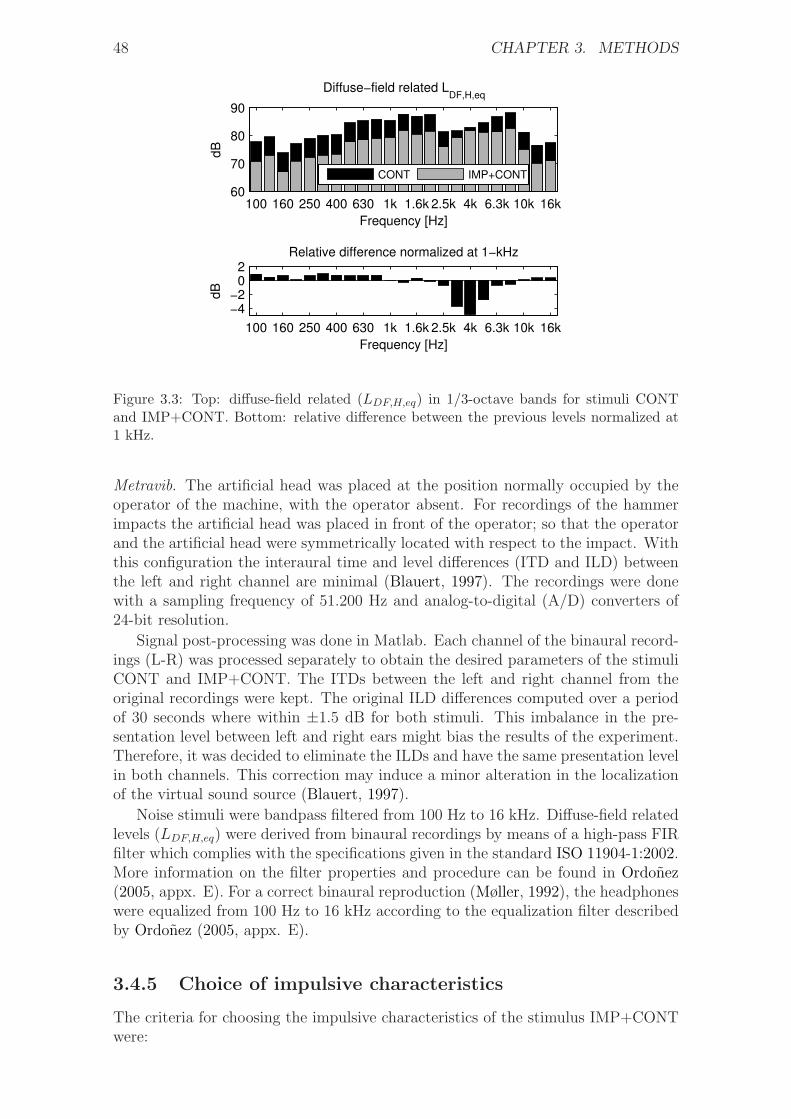
48 CHAPTER 3. METHODS
100 160 250 400 630 1k 1.6k 2.5k 4k 6.3k 10k 16k60
70
80
90
Frequency [Hz]d
B
Diffuse−field related LDF,H,eq
CONT IMP+CONT
100 160 250 400 630 1k 1.6k 2.5k 4k 6.3k 10k 16k
−4−2
02
dB
Frequency [Hz]
Relative difference normalized at 1−kHz
Figure 3.3: Top: diffuse-field related (LDF,H,eq) in 1/3-octave bands for stimuli CONTand IMP+CONT. Bottom: relative difference between the previous levels normalized at1 kHz.
Metravib. The artificial head was placed at the position normally occupied by theoperator of the machine, with the operator absent. For recordings of the hammerimpacts the artificial head was placed in front of the operator; so that the operatorand the artificial head were symmetrically located with respect to the impact. Withthis configuration the interaural time and level differences (ITD and ILD) betweenthe left and right channel are minimal (Blauert, 1997). The recordings were donewith a sampling frequency of 51.200 Hz and analog-to-digital (A/D) converters of24-bit resolution.
Signal post-processing was done in Matlab. Each channel of the binaural record-ings (L-R) was processed separately to obtain the desired parameters of the stimuliCONT and IMP+CONT. The ITDs between the left and right channel from theoriginal recordings were kept. The original ILD differences computed over a periodof 30 seconds where within ±1.5 dB for both stimuli. This imbalance in the pre-sentation level between left and right ears might bias the results of the experiment.Therefore, it was decided to eliminate the ILDs and have the same presentation levelin both channels. This correction may induce a minor alteration in the localizationof the virtual sound source (Blauert, 1997).
Noise stimuli were bandpass filtered from 100 Hz to 16 kHz. Diffuse-field relatedlevels (LDF,H,eq) were derived from binaural recordings by means of a high-pass FIRfilter which complies with the specifications given in the standard ISO 11904-1:2002.More information on the filter properties and procedure can be found in Ordonez(2005, appx. E). For a correct binaural reproduction (Møller, 1992), the headphoneswere equalized from 100 Hz to 16 kHz according to the equalization filter describedby Ordonez (2005, appx. E).
3.4.5 Choice of impulsive characteristics
The criteria for choosing the impulsive characteristics of the stimulus IMP+CONTwere:

3.4. SELECTION OF NOISE STIMULI 49
∙ It is an imperative requirement that the stimulus is innocuous for the hearingof the subjects; yet it induces temporary changes in the characteristics of theDPOAEs.
∙ The stimulus must allow penalization of +5 dB for impulsiveness accordingto the guidelines provided by the Danish Working Environment Authority(Arbejdstilsynet, 2003) –i.e., peak levels may be higher than 115 dBC (ordBA) more than once per minute (Arbejdstilsynet, 2003).
∙ The crest factor and kurtosis values must be distinct from those of contin-uous signals, so that the stimulus IMP+CONT can be clearly considered ofimpulsive character.
Eight different noise stimuli were created. They ranged from continuous broad-band to purely impulsive, through different combinations of impulsive+continuousnoise. The stimuli consisted of 30 second segments5 taken from the stimuli CONTand IMP described in section 3.4.3. In the following, the stimuli are labeled fromS1 to S8. S1 was the the stimulus CONT. S8 was the stimulus IMP. The rest of thestimuli consisted of combinations of IMP+CONT.
The purpose was (1) to investigate how the parameters crest factor and kurtosisvary depending on the impulsiveness of the signal; and (2) to use the AHAAH modelin order to obtain additional information regarding the risk of hearing loss of theimpulsive stimuli on the hearing of the subjects.
According to the cumulative-crest-factor method proposed by Stark and Pekkari-nen (1987), the crest factor is calculated as LApeak−LAeq. Nevertheless, the authorsreported that the A-weighting has only a slight effect in peak levels of differentfrequency content for most industrial environments. In our study, we used LCpeak
instead for the calculation of the crest factor. This option was preferred as ISO1999:1990 establishes C-weighted peak levels as the main descriptor of the impul-sive characteristics of acoustic signals.
The peak level, crest factor and kurtosis of the eight noise stimuli are shown intable 3.3. Peak levels for the impulsive stimuli ranged from from 114 to 119 dBCin steps of 1 dB. The stimuli S2–S8 were normalized to LEX,8ℎ = 75 dBA. It canbe seen that the crest factor increases in a linear manner from S1 to S8, whereasthe kurtosis increases exponentially. It can also be seen that the kurtosis of thecontinuous noise (S1) is 3 -the same as a Gaussian noise– whereas the kurtosis ofthe purely impulsive signal (S8) is 213. Further, when the continuous noise is addedwith a crest factor of 27 (S7), the kurtosis is markedly lower at 97.6.
AHAAH analysis
The risk of hearing loss of the stimuli S2-S8 was studied by using the AHAAH model.The purpose of the analysis was to select a peak level and number of impulses to beused in the formal test that will not result in a permanent damage in the hearingof the subjects. Despite the limitations of the AHAAH to predict risk of hearingloss from occupational exposures (see section 2.2.4), the model was used becauseit provides an insight into the mechanical impact that the noise stimuli may have
5The 10 minute-duration stimulus CONT was obtained by concatenating a segment of 30 sec-onds from the original recordings. Therefore, 30-second segments were chosen for the analysis inorder to include all the possible variations of the original waveform.
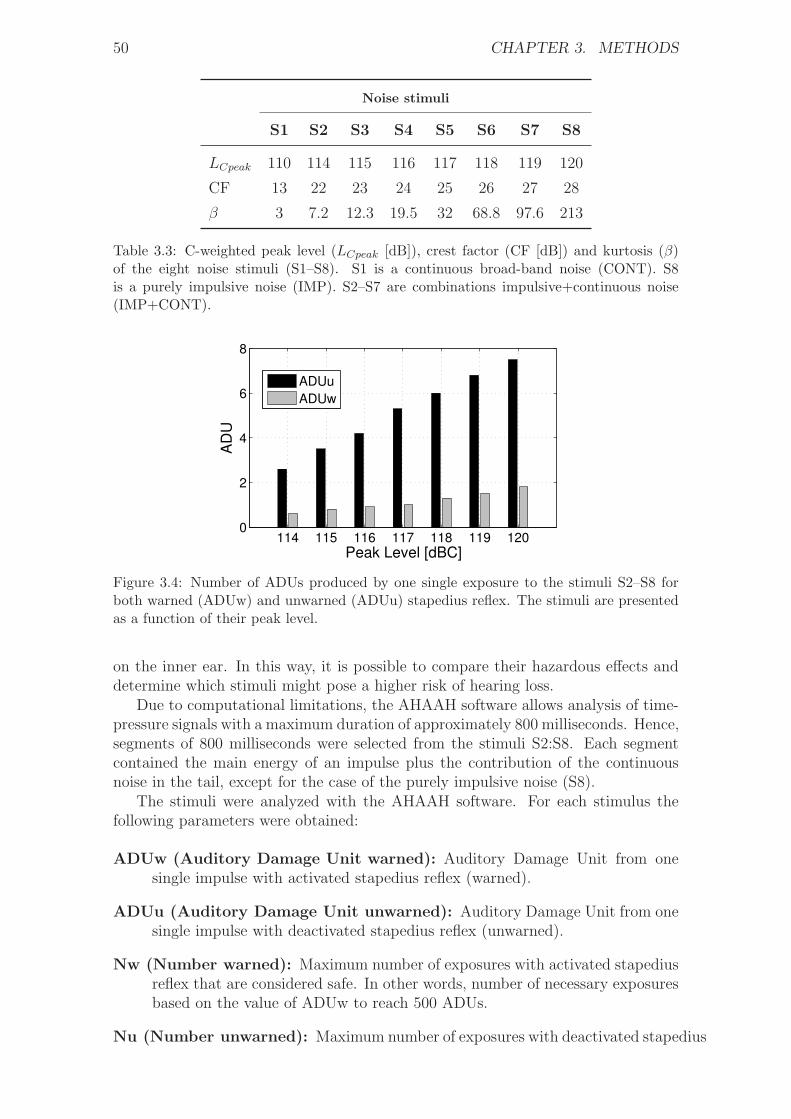
50 CHAPTER 3. METHODS
Noise stimuli
S1 S2 S3 S4 S5 S6 S7 S8
LCpeak 110 114 115 116 117 118 119 120
CF 13 22 23 24 25 26 27 28
� 3 7.2 12.3 19.5 32 68.8 97.6 213
Table 3.3: C-weighted peak level (LCpeak [dB]), crest factor (CF [dB]) and kurtosis (�)of the eight noise stimuli (S1–S8). S1 is a continuous broad-band noise (CONT). S8is a purely impulsive noise (IMP). S2–S7 are combinations impulsive+continuous noise(IMP+CONT).
114 115 116 117 118 119 1200
2
4
6
8
Peak Level [dBC]
AD
U
ADUu
ADUw
Figure 3.4: Number of ADUs produced by one single exposure to the stimuli S2–S8 forboth warned (ADUw) and unwarned (ADUu) stapedius reflex. The stimuli are presentedas a function of their peak level.
on the inner ear. In this way, it is possible to compare their hazardous effects anddetermine which stimuli might pose a higher risk of hearing loss.
Due to computational limitations, the AHAAH software allows analysis of time-pressure signals with a maximum duration of approximately 800 milliseconds. Hence,segments of 800 milliseconds were selected from the stimuli S2:S8. Each segmentcontained the main energy of an impulse plus the contribution of the continuousnoise in the tail, except for the case of the purely impulsive noise (S8).
The stimuli were analyzed with the AHAAH software. For each stimulus thefollowing parameters were obtained:
ADUw (Auditory Damage Unit warned): Auditory Damage Unit from onesingle impulse with activated stapedius reflex (warned).
ADUu (Auditory Damage Unit unwarned): Auditory Damage Unit from onesingle impulse with deactivated stapedius reflex (unwarned).
Nw (Number warned): Maximum number of exposures with activated stapediusreflex that are considered safe. In other words, number of necessary exposuresbased on the value of ADUw to reach 500 ADUs.
Nu (Number unwarned): Maximum number of exposures with deactivated stapedius
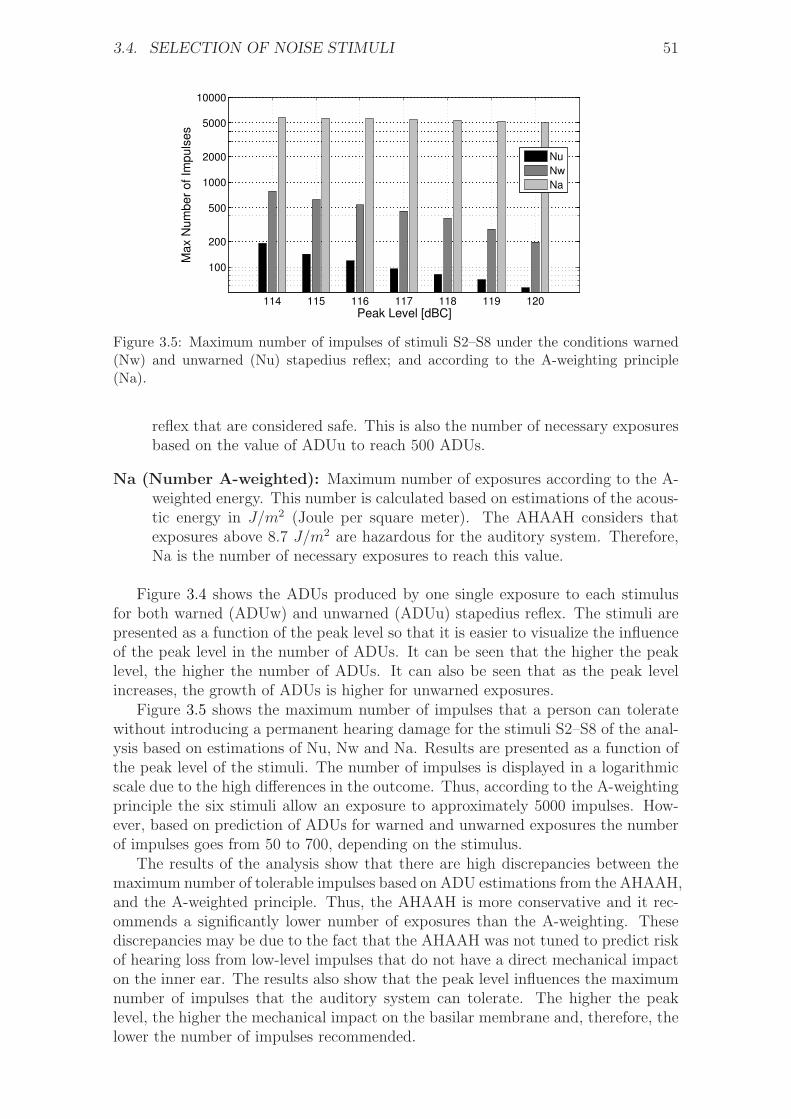
3.4. SELECTION OF NOISE STIMULI 51
114 115 116 117 118 119 120
100
200
500
1000
2000
5000
10000
Peak Level [dBC]
Max N
um
ber
of Im
puls
es
Nu
Nw
Na
Figure 3.5: Maximum number of impulses of stimuli S2–S8 under the conditions warned(Nw) and unwarned (Nu) stapedius reflex; and according to the A-weighting principle(Na).
reflex that are considered safe. This is also the number of necessary exposuresbased on the value of ADUu to reach 500 ADUs.
Na (Number A-weighted): Maximum number of exposures according to the A-weighted energy. This number is calculated based on estimations of the acous-tic energy in J/m2 (Joule per square meter). The AHAAH considers thatexposures above 8.7 J/m2 are hazardous for the auditory system. Therefore,Na is the number of necessary exposures to reach this value.
Figure 3.4 shows the ADUs produced by one single exposure to each stimulusfor both warned (ADUw) and unwarned (ADUu) stapedius reflex. The stimuli arepresented as a function of the peak level so that it is easier to visualize the influenceof the peak level in the number of ADUs. It can be seen that the higher the peaklevel, the higher the number of ADUs. It can also be seen that as the peak levelincreases, the growth of ADUs is higher for unwarned exposures.
Figure 3.5 shows the maximum number of impulses that a person can toleratewithout introducing a permanent hearing damage for the stimuli S2–S8 of the anal-ysis based on estimations of Nu, Nw and Na. Results are presented as a function ofthe peak level of the stimuli. The number of impulses is displayed in a logarithmicscale due to the high differences in the outcome. Thus, according to the A-weightingprinciple the six stimuli allow an exposure to approximately 5000 impulses. How-ever, based on prediction of ADUs for warned and unwarned exposures the numberof impulses goes from 50 to 700, depending on the stimulus.
The results of the analysis show that there are high discrepancies between themaximum number of tolerable impulses based on ADU estimations from the AHAAH,and the A-weighted principle. Thus, the AHAAH is more conservative and it rec-ommends a significantly lower number of exposures than the A-weighting. Thesediscrepancies may be due to the fact that the AHAAH was not tuned to predict riskof hearing loss from low-level impulses that do not have a direct mechanical impacton the inner ear. The results also show that the peak level influences the maximumnumber of impulses that the auditory system can tolerate. The higher the peaklevel, the higher the mechanical impact on the basilar membrane and, therefore, thelower the number of impulses recommended.

52 CHAPTER 3. METHODS
Conclusions from the AHAAH analysis
The final stimulus IMP+CONT chosen for the experiment in PAPER II was thestimulus S5. This stimulus has a C-weighted peak level of 117 dB, a crest factor of25 dB and a kurtosis � of 32. As the peak level is above 115 dBC, the stimulus canbe penalized +5 dB for impulsiveness according to the guidelines provided by theDanish Working Environment Authority (Arbejdstilsynet, 2003).
A peak level of 117 dBC was chosen because it is a compromise between (1)avoiding a higher risk of hearing loss for higher peak levels; and (2) still beingable to induce temporary changes in the properties of the inner ear. In addition,according to the results depicted in figure 3.5, a peak level of 117 dBC will allowa total of 5423 impulses based on A-weighted measurements, 457 impulses with awarned middle-ear (Nw), and 95 impulses with unwarned middle ear (Nu). For thisreason, it was decided to limit the number of impulses in the stimulus IMP+CONTto a total of 300 impulses. This number is a compromise between the 457 and 95impulses recommended from warned (Nw) and unwarned (Nu) middle-ear. As thestimuli used in the formal test were set to have a duration of 10 minutes, the 300impulses were presented with a repetition rate of one impulse every two seconds.
A crest factor of 25 dB is higher than the fence value of 15 dB establishedby the cumulative crest factor method. As the 10-minute stimulus IMP+CONThas a constant crest factor of 25 dB, it can be considered impulsive throughout theexposure. In a similar manner, it is considered that a kurtosis of 32 is clearly distinctfrom that of the continuous-broad-band stimulus CONT (� = 3).
3.4.6 Binaural vs monaural noise exposures
Both stimuli CONT and IMP+CONT were presented binaurally, whereas the stim-ulus TONE was presented monaurally. The difference in the presentation method(binaural/monaural) may have an effect on the hearing of the subjects (Ward, 1965;Hirsh, 1958; Rajan, 1995). According to literature, monaural exposures might in-duce a higher impact on hearing levels than binaural exposures (Ward, 1965; Hirsh,1958; Rajan, 1995). The reason is not clear but it is attributed to either (1) amore vigorously contraction of the middle-ear reflex for binaural exposures; or (2)influences exerted by the crossed efferent pathways.
The magnitude of the differences on the auditory system from monaural vs. bin-aural exposures is not completely understood. Several researchers have suggestedthat it might depend on the frequency of the stimulus. Ward (1965) reported fromTTS experiments with human subjects exposed to different pure tones, that monau-ral exposures resulted in a higher TTS particularly at low frequencies; whereas nobig differences were observed at other frequencies. Results from Hirsh (1958) alsofrom TTS experiments with humans showed that a exposure to white noise didnot result in clear differences between monaural and binaural exposures. However,monaural exposures to a pure tone resulted in a longer recovery period, even thoughthe TTS immediately after the exposure was the same as for the binaural exposure.
3.5 Calibration of noise exposures
In both experiments presented in PAPER I and II, the calibration of the noiseexposure was verified in five subjects, who were staff at Aalborg University withinthe age range of the subjects who participated in the formal test. Measurements
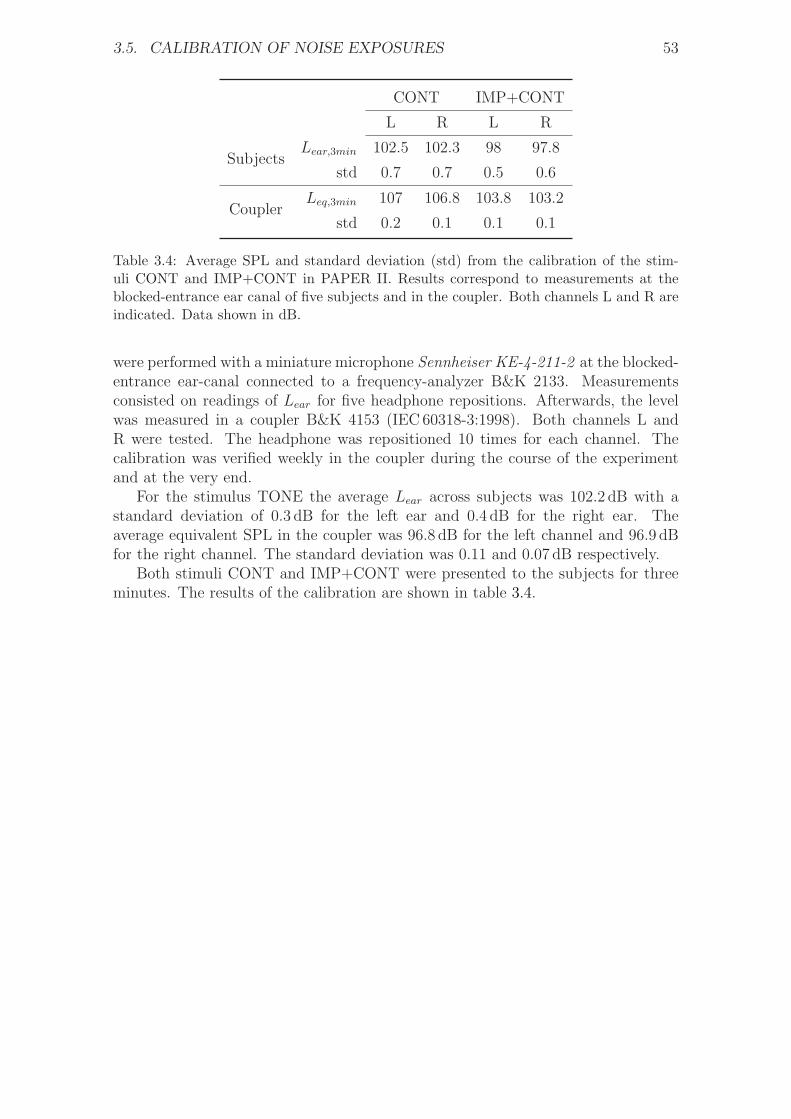
3.5. CALIBRATION OF NOISE EXPOSURES 53
CONT IMP+CONT
L R L R
SubjectsLear,3min 102.5 102.3 98 97.8
std 0.7 0.7 0.5 0.6
CouplerLeq,3min 107 106.8 103.8 103.2
std 0.2 0.1 0.1 0.1
Table 3.4: Average SPL and standard deviation (std) from the calibration of the stim-uli CONT and IMP+CONT in PAPER II. Results correspond to measurements at theblocked-entrance ear canal of five subjects and in the coupler. Both channels L and R areindicated. Data shown in dB.
were performed with a miniature microphone Sennheiser KE-4-211-2 at the blocked-entrance ear-canal connected to a frequency-analyzer B&K 2133. Measurementsconsisted on readings of Lear for five headphone repositions. Afterwards, the levelwas measured in a coupler B&K 4153 (IEC60318-3:1998). Both channels L andR were tested. The headphone was repositioned 10 times for each channel. Thecalibration was verified weekly in the coupler during the course of the experimentand at the very end.
For the stimulus TONE the average Lear across subjects was 102.2 dB with astandard deviation of 0.3 dB for the left ear and 0.4 dB for the right ear. Theaverage equivalent SPL in the coupler was 96.8 dB for the left channel and 96.9 dBfor the right channel. The standard deviation was 0.11 and 0.07 dB respectively.
Both stimuli CONT and IMP+CONT were presented to the subjects for threeminutes. The results of the calibration are shown in table 3.4.

54 CHAPTER 3. METHODS

Chapter 4
Main results and analysis
4.1 Results from PAPER 1
Figure 4.1 shows the effect of the tonal exposure on the characteristics of thefine structures from eight subjects. The analysis of the DPOAE fine-structuresis done according to the classification algorithm proposed by Reuter and Ham-mershøi (2006). The algorithm monitors the ripples of the fine structures, whichare characterized by a maximum DPOAE level (peak) located in between two min-ima (valleys). Changes in the DPOAE fine-structures are studied by plotting themaxima and minima of the ripples during the course of the experiment. A ripple isconsidered valid (and therefore plotted) if it satisfies two conditions: (1) the rippleheight (RH), which is the level difference between the maximum and the mean ofthe two minima, must be higher than 3 dB; and (2) the maximum of the ripple(SNRmax) must be at least 3 dB above the noise floor. These values are chosenin order to evaluate ripple characteristics with the lowest spread across subjects,and to distinguish true ripples of the fine structures from merely small variations inDPOAE levels.
Figure 4.1 shows that the characteristics of the fine structures are highly indi-vidual across subjects. Only subject 9 shows big level differences between peaksand valleys, with the greatest RH of 15 dB, and therefore the maxima and minimaare easier to localize. Other subjects (e.g. 1 and 7) do not show pronounced finestructures and the peaks and valleys of the ripples cover a broader frequency range,which makes the detection of the maxima and minima not so evident. Finally, thereare subjects with no measurable fine structures (e.g. subject 4).
4.1.1 Group-average DPOAE shift
Figure 4.2 shows the average DPOAE shift across subjects as a function of timeand frequency. Data from left and right ears are grouped together. Averages arecalculated in intervals of 30 seconds. Intervals are accepted if they include datafrom at least 10 subjects. The DPOAE shift immediately after the exposure isapproximately 5 dB for all frequencies. Most of the recovery occurs within the first20 minutes after the end of the tonal exposure –as the DPOAE shift drops to about2 dB for all measured frequencies.
55
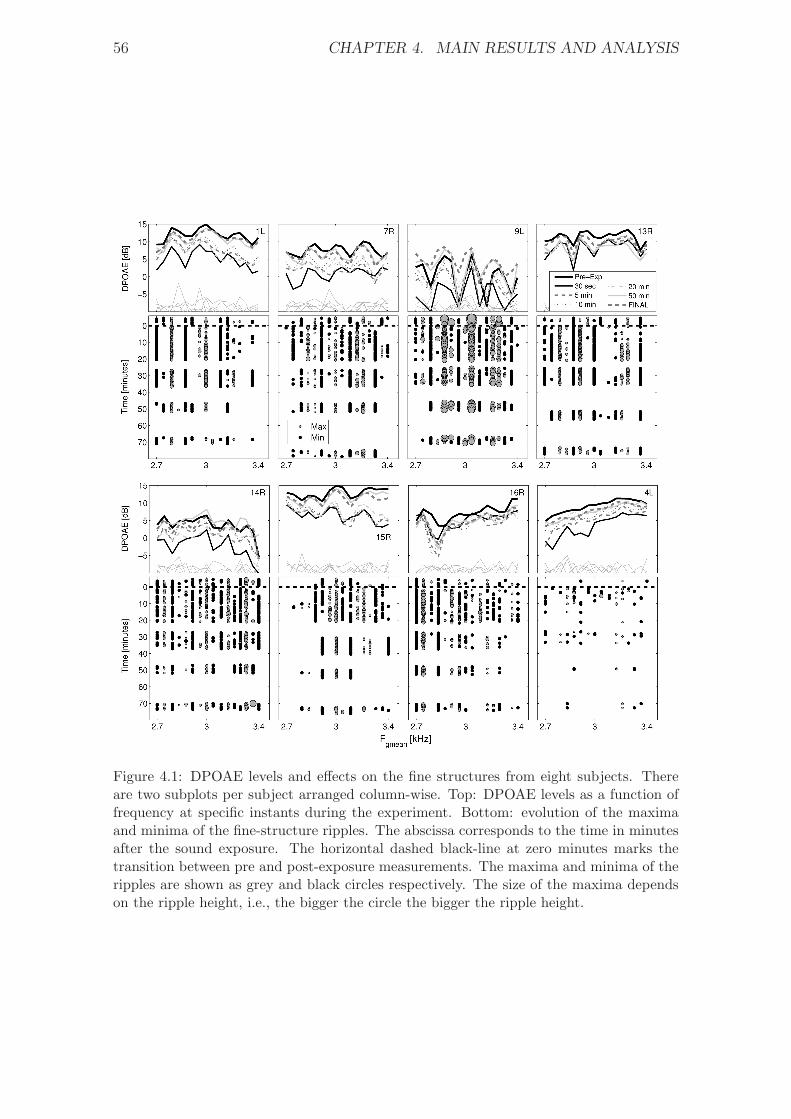
56 CHAPTER 4. MAIN RESULTS AND ANALYSIS
Figure 4.1: DPOAE levels and effects on the fine structures from eight subjects. Thereare two subplots per subject arranged column-wise. Top: DPOAE levels as a function offrequency at specific instants during the experiment. Bottom: evolution of the maximaand minima of the fine-structure ripples. The abscissa corresponds to the time in minutesafter the sound exposure. The horizontal dashed black-line at zero minutes marks thetransition between pre and post-exposure measurements. The maxima and minima of theripples are shown as grey and black circles respectively. The size of the maxima dependson the ripple height, i.e., the bigger the circle the bigger the ripple height.

4.1. RESULTS FROM PAPER 1 57
0 10 20 30 40 50 60 70 2.7
3
3.40
1
2
3
4
5
6
Fgmean
[kHz]Time after exposure [min]
DPOAE shift [dB]
0
1
2
3
4
5
6
Figure 4.2: Group average DPOAE-shift.
4.1.2 Comparison of pre-exposure and final DPOAE levels
Figure 4.3 shows the group-average DPOAE levels for pre-exposure and final mea-surements 70 minutes after the sound exposure. It also shows the average noise-floor level in both cases. The difference between the DPOAE level and noise level(the S/N) is between 13 and 15 dB. Such a S/N is considered adequate to obtainreliable DPOAE measurements, in which the stability of DPOAE levels is not influ-enced by the background noise (Lonsbury-Martin et al., 1993).
A balanced two-way ANOVA analysis is performed to determine whether thereare significant statistical differences between pre-exposure and final DPOAE levels.The significance level of the analysis (and all analysis in this thesis) is � = .05.The factors are: (1) determination time –i.e., pre-exposure/final; and (2) frequency–16 levels. There are no significant differences in the DPOAE levels across frequen-cies. However, there is a weak statistical difference between pre-exposure and finalDPOAE levels (F(1,975) = 7.9, p = .047). As the p-value is almost the same asthe significance level (.047 ≈ .05), it can be argued that the differences betweenpre-exposure and final DPOAE levels are negligible.
Next, it is studied whether reinserting the sound probe in the ear canal of thesubjects influenced the determination of pre-exposure and final DPOAE levels. Fig-ure 4.4 shows the average standard deviation of DPOAE levels across subjects duringthe determination of pre-exposure and final levels. The average standard deviationis similar in both cases and it falls within 0.5−1.5 dB. Similar results were obtainedby Reuter et al. (2007), who reported a standard deviation within 1 − 2 dB forthe measurements with and without reinsertion of the sound probe. It can also beseen in Figure 4.4 that the average standard deviation is slightly higher for refittedmeasurements.
Statistical differences in Figure 4.4 are studied by means of a a three-way ANOVAanalysis. The factors are: (1) probe fitting –i.e., refitted/non-refitted; (2) determi-nation time –i.e., pre-exposure/final; and (3) frequency – 16 levels. There are nosignificant differences between pre-exposure and final measurements –nor across fre-quencies. However, the standard deviation of refitted measurements is significantlyhigher than non-refitted measurements (F(1,975) = 75.7, p = .001). Finally, there areno significant interactions between the factors.
Figure 4.5 compares the DPOAE levels obtained from repeated measurements

58 CHAPTER 4. MAIN RESULTS AND ANALYSIS
2.7 2.8 2.9 3 3.1 3.2 3.3 3.4−10
−5
0
5
10
15
DP
OA
E [
dB
]
Fgmean
[kHz]
Pre−Exposure DPOAE
FINAL DPOAE
Figure 4.3: Group average DPOAE levels from pre-exposure and final measurements.Final measurements were measured 70 minutes after the sound exposure. Errorbars showthe standard deviation across subjects. The thin gray lines at the bottom correspond tothe average background noise during the measurements.
0
1
2
3
4
dB
Pre−exposure
Not refitted
Refitted
2.7 2.8 2.9 3 3.1 3.2 3.3 3.40
1
2
3
4
dB
Fgmean
[kHz]
Final
Figure 4.4: Average standard deviation (in decibels) across subjects for refitted and non-refitted DPOAE measurements. The horizontal axis corresponds to the geometric meanof the measured frequency range. Top: pre-exposure; Bottom: final.
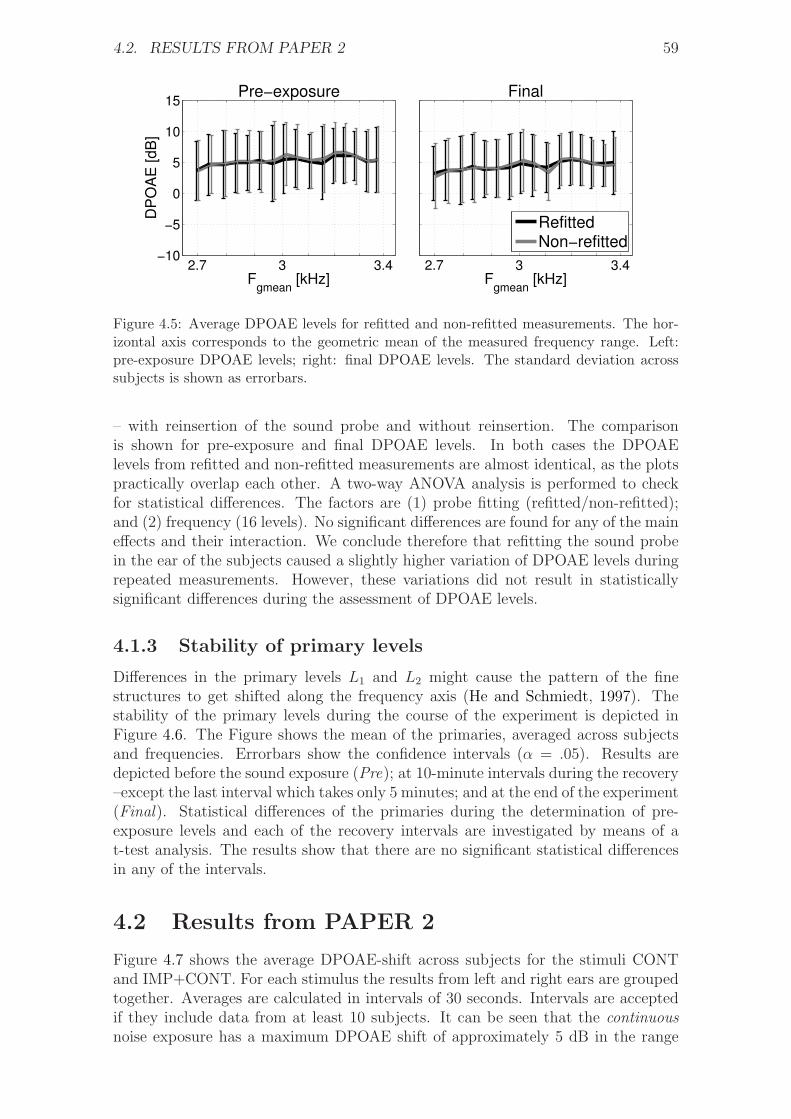
4.2. RESULTS FROM PAPER 2 59
2.7 3 3.4−10
−5
0
5
10
15
DP
OA
E [dB
]
Fgmean
[kHz]
Pre−exposure
2.7 3 3.4F
gmean [kHz]
Final
RefittedNon−refitted
Figure 4.5: Average DPOAE levels for refitted and non-refitted measurements. The hor-izontal axis corresponds to the geometric mean of the measured frequency range. Left:pre-exposure DPOAE levels; right: final DPOAE levels. The standard deviation acrosssubjects is shown as errorbars.
– with reinsertion of the sound probe and without reinsertion. The comparisonis shown for pre-exposure and final DPOAE levels. In both cases the DPOAElevels from refitted and non-refitted measurements are almost identical, as the plotspractically overlap each other. A two-way ANOVA analysis is performed to checkfor statistical differences. The factors are (1) probe fitting (refitted/non-refitted);and (2) frequency (16 levels). No significant differences are found for any of the maineffects and their interaction. We conclude therefore that refitting the sound probein the ear of the subjects caused a slightly higher variation of DPOAE levels duringrepeated measurements. However, these variations did not result in statisticallysignificant differences during the assessment of DPOAE levels.
4.1.3 Stability of primary levels
Differences in the primary levels L1 and L2 might cause the pattern of the finestructures to get shifted along the frequency axis (He and Schmiedt, 1997). Thestability of the primary levels during the course of the experiment is depicted inFigure 4.6. The Figure shows the mean of the primaries, averaged across subjectsand frequencies. Errorbars show the confidence intervals (� = .05). Results aredepicted before the sound exposure (Pre); at 10-minute intervals during the recovery–except the last interval which takes only 5 minutes; and at the end of the experiment(Final). Statistical differences of the primaries during the determination of pre-exposure levels and each of the recovery intervals are investigated by means of at-test analysis. The results show that there are no significant statistical differencesin any of the intervals.
4.2 Results from PAPER 2
Figure 4.7 shows the average DPOAE-shift across subjects for the stimuli CONTand IMP+CONT. For each stimulus the results from left and right ears are groupedtogether. Averages are calculated in intervals of 30 seconds. Intervals are acceptedif they include data from at least 10 subjects. It can be seen that the continuousnoise exposure has a maximum DPOAE shift of approximately 5 dB in the range

60 CHAPTER 4. MAIN RESULTS AND ANALYSIS
Pre 0−10 10−20 25−35 45−50 FINAL64.8
64.9
65
65.1
dB
L1
Pre 0−10 10−20 25−35 45−50 FINAL44.7
44.8
44.9
45
45.1
dB
L2
Figure 4.6: Stability of the overall primary levels L1 and L2 at different intervals. Theerrorbars show the confidence interval (� = .05). The dashed horizontal lines show targetlevels of 65 and 45 dB.
Tim
e a
fte
r exposure
[m
inute
s]
Fgmean
[kHz]
Continuous
1.25 1.6 2 2.5 3.15 4 5
0
10
20
30
40
50
60
70
80
90
100
Impulsive + continuous
DP
OA
E s
hift [d
B]
1.25 1.6 2 2.5 3.15 4 5
0
10
20
30
40
50
60
70
80
90
100 −1
0
1
2
3
4
5
LEX,8h
= 80 dBA LEX,8h
= 75 + 5penalty
= 80 dBA
Figure 4.7: Group-average DPOAE-shift from continuous and impulsive+continuous noiseexposures shown as a function of the geometric mean of the primaries and the determina-tion time after exposure.
4.2. RESULTS FROM PAPER 2 61
2 < Fgmean [kHz]< 3.15 during the first 10 minutes of the recovery, whereas theimpulsive+continuous noise exposure shows no evident DPOAE-shift.
A two-way ANOVA analysis is performed to study whether there are signifi-cant differences between the DPOAE levels from stimuli CONT and IMP+CONTthroughout the experiment. The factors are: (1) noise stimulus – CONT/IMP+CONT;and (2) frequency (16 levels). The analysis is done in time intervals of 5 and 10 min-utes during the recovery. Differences in pre-exposure and final DPOAE levels are alsoevaluated. The analysis is done by comparing the DPOAE levels from both stim-uli measured at the same time interval. Significant differences between the noisestimuli are observed during the first 10 minutes of the recovery (F1,10528 = 70.9,p < .001), which supports the idea that the stimulus CONT had a bigger impact onDPOAE levels than the stimulus IMP+CONT. These differences disappear through-out the rest of the recovery, except at the time interval 45–50 minutes (F1,5568 = 8.8,p < .01). There is a main effect in frequency for all the intervals (d.f. = 15,F > 29.32, p < .001), meaning that the DPOAE shift is significantly higher at somefrequencies than others.
4.2.1 Comparison of pre-exposure and final DPOAE levels
The group-average pre-exposure and final DPOAE levels from stimuli CONT andIMP+CONT are shown in Figure 4.8. The Figure also shows the average noise levelduring the measurements. The S/N across frequencies is between 8 and 14 dB. Abalanced four-way ANOVA analysis was performed with the following factors: (1)determination time – pre-exposure/final; (2) fitting effect1 – refitted/non-refitted;(3) noise stimulus – CONT/IMP+CONT; and (4) frequency (16 levels). Thereare no significant differences for the following main effects: (1) determination time,meaning that DPOAE levels recovered completely by the end of each exposure;(2) fitting, indicating that reinsertions of the sound probe in the ear canal did notinfluence the assessment of DPOAE levels; and (3) stimulus. There are however sig-nificant differences across frequency (F15,1981 = 17.12, p < .001), which means thatsubjects have significantly higher DPOAE levels at some frequencies than others.There are no significant interactions between the factors.
Figure 4.9 shows the average standard deviation of DPOAE levels during thedetermination of pre-exposure and final levels. Results are presented for both stimuliCONT and IMP+CONT. As in the first experiment (section 4.1.2), the averagestandard deviation is similar in both cases and it falls within 0.5− 1.5 dB. Also inthis case, the average standard deviation is slightly higher for refitted measurements.
Statistical differences in Figure 4.4 are studied by means of a a four-way ANOVAanalysis. The factors are: (1) probe fitting –i.e., refitted/non-refitted; (2) determi-nation time –i.e., pre-exposure/final; (3) Type of noise -i.e., CONT/IMP+CONTand (4) frequency – 16 levels. There is a significant effect for the probe fitting(F(1,975) = 75.7, p = .001), indicating that refitted measurements led to a higherdeviation of DPOAE levels. No significant differences are found for the rest of theeffects and their interactions.
1DPOAE levels from refitted/non-refitted measurements are not shown in Figure 4.8 for clarityreasons
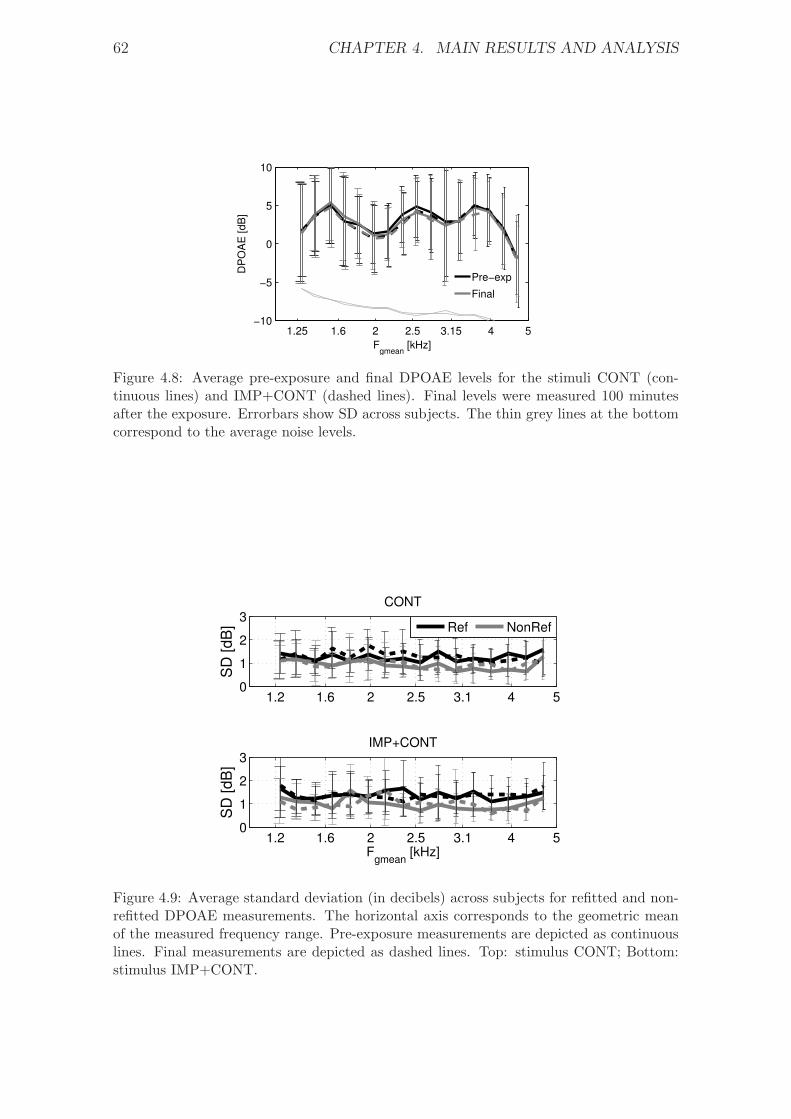
62 CHAPTER 4. MAIN RESULTS AND ANALYSIS
1.25 1.6 2 2.5 3.15 4 5−10
−5
0
5
10
DP
OA
E [dB
]
Fgmean
[kHz]
Pre−exp
Final
Figure 4.8: Average pre-exposure and final DPOAE levels for the stimuli CONT (con-tinuous lines) and IMP+CONT (dashed lines). Final levels were measured 100 minutesafter the exposure. Errorbars show SD across subjects. The thin grey lines at the bottomcorrespond to the average noise levels.
1.2 1.6 2 2.5 3.1 4 50
1
2
3
SD
[d
B]
CONT
Ref NonRef
1.2 1.6 2 2.5 3.1 4 50
1
2
3
SD
[d
B]
Fgmean
[kHz]
IMP+CONT
Figure 4.9: Average standard deviation (in decibels) across subjects for refitted and non-refitted DPOAE measurements. The horizontal axis corresponds to the geometric meanof the measured frequency range. Pre-exposure measurements are depicted as continuouslines. Final measurements are depicted as dashed lines. Top: stimulus CONT; Bottom:stimulus IMP+CONT.
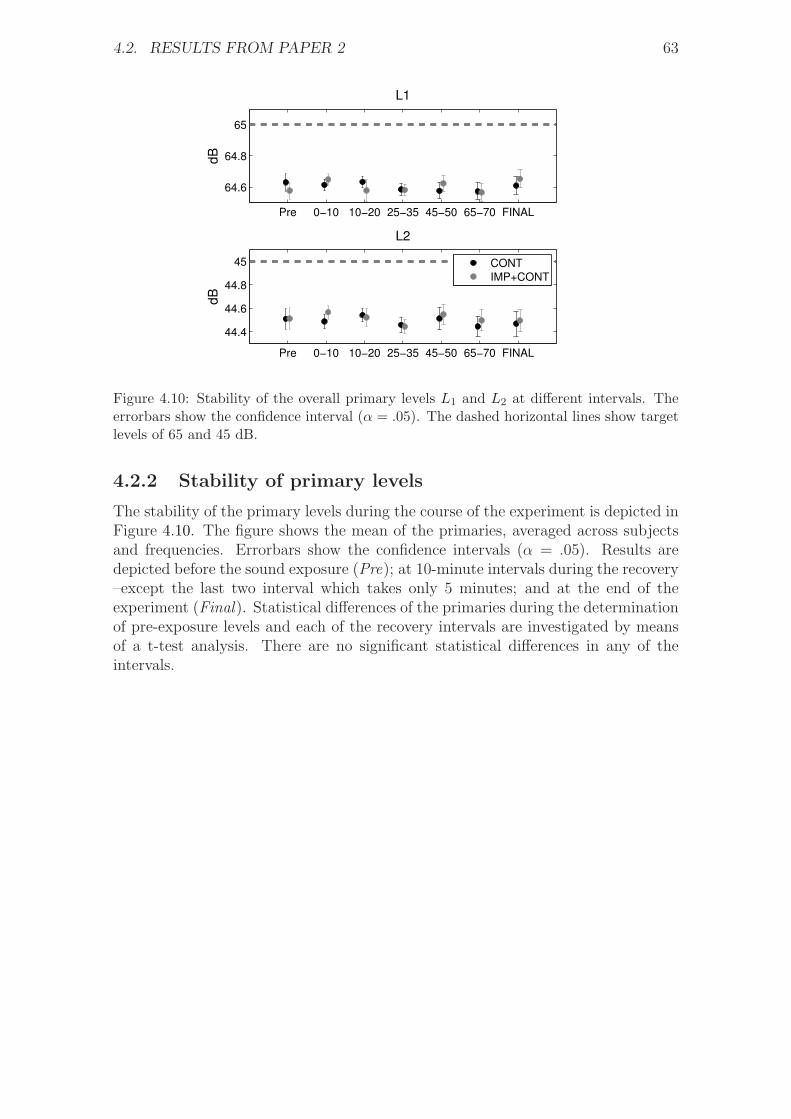
4.2. RESULTS FROM PAPER 2 63
Pre 0−10 10−20 25−35 45−50 65−70 FINAL
64.6
64.8
65
dB
L1
Pre 0−10 10−20 25−35 45−50 65−70 FINAL
44.4
44.6
44.8
45
dB
L2
CONT
IMP+CONT
Figure 4.10: Stability of the overall primary levels L1 and L2 at different intervals. Theerrorbars show the confidence interval (� = .05). The dashed horizontal lines show targetlevels of 65 and 45 dB.
4.2.2 Stability of primary levels
The stability of the primary levels during the course of the experiment is depicted inFigure 4.10. The figure shows the mean of the primaries, averaged across subjectsand frequencies. Errorbars show the confidence intervals (� = .05). Results aredepicted before the sound exposure (Pre); at 10-minute intervals during the recovery–except the last two interval which takes only 5 minutes; and at the end of theexperiment (Final). Statistical differences of the primaries during the determinationof pre-exposure levels and each of the recovery intervals are investigated by meansof a t-test analysis. There are no significant statistical differences in any of theintervals.

64 CHAPTER 4. MAIN RESULTS AND ANALYSIS

Chapter 5
Overall discussion and conclusion
5.1 Influence of sound overexposure on DPOAE
fine structures
The results presented in Figure 4.1 show that the characterisctics of the DPOAEfine structures are highly individual across subjects. In general, the location of themaxima and minima of the fine structures remained stable throughout the recoveryperiod. For few subjects, the depth (peak-to-valley amplitude) of the fine structurevaried considerably after sound overexposure -i.e., some subjects showed an increasein the depth of the fine structures (e.g., subject 13) while others showed a decreaseafter the exposure (e.g., subject 9)– but in general there were no significant differ-ences in the depth of the fine structures. This variability is in agreement with theresults by Reuter et al. (2007) and it can be explained according to the two-sourcemodel of DPOAE generation. The model considers that the fine structure is causedby constructive and destructive interference of the distortion component f2 and thereflection component 2f1 − f2. Variations of the depth of the fine structures aftersound overexposure can be indicative of shifts in the relative amplitude of the twocomponents. Our results indicate that the variation may be more acute for somesubjects than others but –on average– there are no significant differences acrosssubjects, which suggests that the two components might be equally affected. Thistheory could explain why no systematic changes of fine structure could be observedin this study.
The results suggest that the fine structures of the DPOAE might not be a betterindicator of early hearing loss than the DPOAE level alone. On the contrary, thevariability seen across subjects might complicate the interpretation and comparisonof results.
5.2 Comparison of temporary changes on DPOAEs
Figure 5.1 shows the average DPOAE-shift across subjects after exposure to thestimulus TONE in PAPER I; and the stimuli CONT and IMP+CONT in PAPER II.The horizontal axis corresponds to the frequency range of the primaries f1 and f2.The frequency range in each subplot is 1.25–5 kHz. This is done in order to facilitatethe comparison between the stimuli and to emphasize that the DPOAE recoveryfrom the stimulus TONE was measured in a narrower frequency range. The verticalaxis shows the time after the end of the noise exposure in minutes. Results are
65
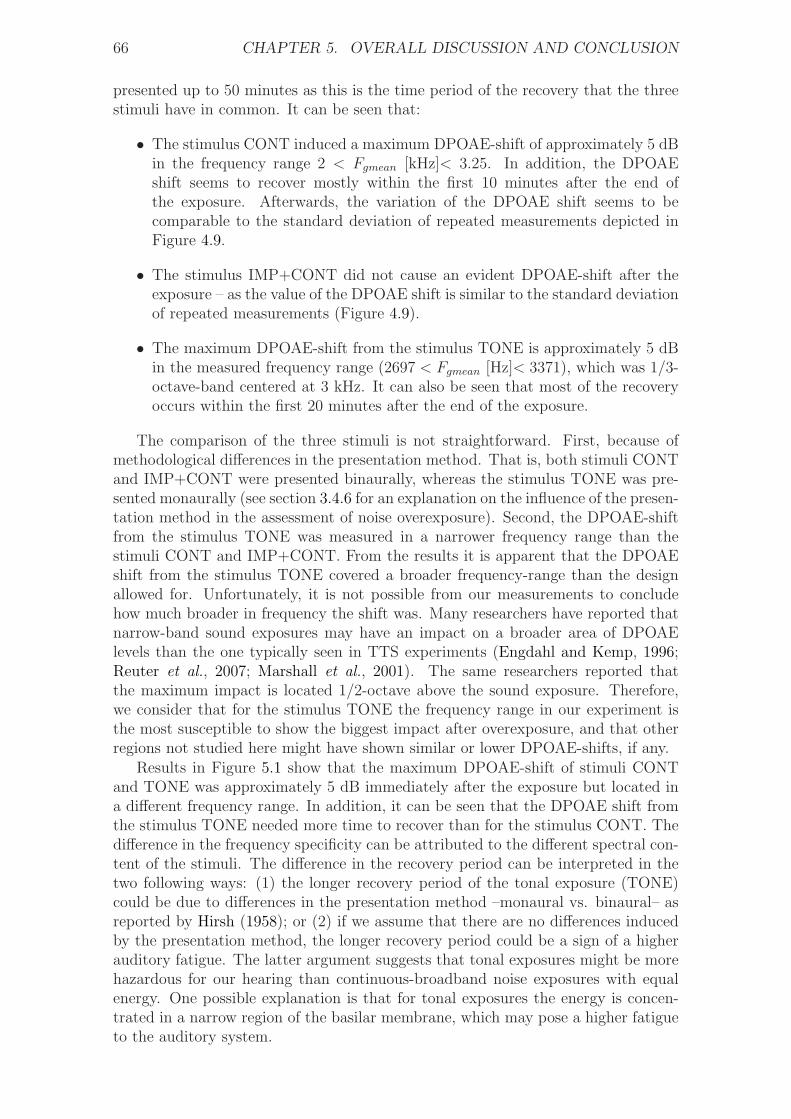
66 CHAPTER 5. OVERALL DISCUSSION AND CONCLUSION
presented up to 50 minutes as this is the time period of the recovery that the threestimuli have in common. It can be seen that:
∙ The stimulus CONT induced a maximum DPOAE-shift of approximately 5 dBin the frequency range 2 < Fgmean [kHz]< 3.25. In addition, the DPOAEshift seems to recover mostly within the first 10 minutes after the end ofthe exposure. Afterwards, the variation of the DPOAE shift seems to becomparable to the standard deviation of repeated measurements depicted inFigure 4.9.
∙ The stimulus IMP+CONT did not cause an evident DPOAE-shift after theexposure – as the value of the DPOAE shift is similar to the standard deviationof repeated measurements (Figure 4.9).
∙ The maximum DPOAE-shift from the stimulus TONE is approximately 5 dBin the measured frequency range (2697 < Fgmean [Hz]< 3371), which was 1/3-octave-band centered at 3 kHz. It can also be seen that most of the recoveryoccurs within the first 20 minutes after the end of the exposure.
The comparison of the three stimuli is not straightforward. First, because ofmethodological differences in the presentation method. That is, both stimuli CONTand IMP+CONT were presented binaurally, whereas the stimulus TONE was pre-sented monaurally (see section 3.4.6 for an explanation on the influence of the presen-tation method in the assessment of noise overexposure). Second, the DPOAE-shiftfrom the stimulus TONE was measured in a narrower frequency range than thestimuli CONT and IMP+CONT. From the results it is apparent that the DPOAEshift from the stimulus TONE covered a broader frequency-range than the designallowed for. Unfortunately, it is not possible from our measurements to concludehow much broader in frequency the shift was. Many researchers have reported thatnarrow-band sound exposures may have an impact on a broader area of DPOAElevels than the one typically seen in TTS experiments (Engdahl and Kemp, 1996;Reuter et al., 2007; Marshall et al., 2001). The same researchers reported thatthe maximum impact is located 1/2-octave above the sound exposure. Therefore,we consider that for the stimulus TONE the frequency range in our experiment isthe most susceptible to show the biggest impact after overexposure, and that otherregions not studied here might have shown similar or lower DPOAE-shifts, if any.
Results in Figure 5.1 show that the maximum DPOAE-shift of stimuli CONTand TONE was approximately 5 dB immediately after the exposure but located ina different frequency range. In addition, it can be seen that the DPOAE shift fromthe stimulus TONE needed more time to recover than for the stimulus CONT. Thedifference in the frequency specificity can be attributed to the different spectral con-tent of the stimuli. The difference in the recovery period can be interpreted in thetwo following ways: (1) the longer recovery period of the tonal exposure (TONE)could be due to differences in the presentation method –monaural vs. binaural– asreported by Hirsh (1958); or (2) if we assume that there are no differences inducedby the presentation method, the longer recovery period could be a sign of a higherauditory fatigue. The latter argument suggests that tonal exposures might be morehazardous for our hearing than continuous-broadband noise exposures with equalenergy. One possible explanation is that for tonal exposures the energy is concen-trated in a narrow region of the basilar membrane, which may pose a higher fatigueto the auditory system.

5.2. COMPARISON OF TEMPORARY CHANGES ON DPOAES 67
Tim
e a
fter
exposure
[m
inute
s]
Continuous
1.25 1.6 2 2.5 3.15 4 5
0
10
20
30
40
50
60
Fgmean
[kHz]
Impulsive + continuous
1.25 1.6 2 2.5 3.15 4 5
2−kHz tone
DP
OA
E s
hift [d
B]
1.25 1.6 2 2.5 3.15 4
0
10
20
30
40
50
60 −1
0
1
2
3
4
5
LEX,8h
= 80 dBA LEX,8h
= 80 dBALEX,8h
= 75 + 5penalty
= 80 dBA
Figure 5.1: Group DPOAE-shift comparison from exposure to stimuli CONT,IMP+CONT and TONE. The horizontal axis corresponds to the measured frequencyrange (geometric mean). The vertical axis shows the time in minutes after the end ofthe noise exposure. The blank periods during the recovery correspond to pauses to allowsubjects to relax.
The recovery from the stimulus IMP+CONT in Figure 5.1 does not show anevident DPOAE shift. A possible explanation might be that the combination ofcontinuous noise with a series of impulses, presented at a repetition rate of 0.5 im-pacts per second, had a protective effect on the auditory system. Several researchershave shown that a repetition rate between 0.5–1 impacts per second may pose thehighest hazard to hearing, both in humans (Tremolires and Hetu, 1980) and animals(Danielson et al., 1991; Henderson et al., 1991). However, this conclusion is basedon data from purely impulsive signals and therefore it cannot be ruled out that theaddition of a continuous sound in our experiment instigated some protective effect.
An interesting aspect is that the difference in the maximum DPOAE-shift be-tween the stimuli is approximately +5 dB –the same as the penalty. Whether this isa coincidence still needs to be evaluated. The evaluation could be done by compar-ing input-output (I/O) functions, in which the magnitude of the DPOAE shift canbe plotted as a function of the exposure level. In this way, it would be possible todetermine whether there is a linear relation between the magnitude of the DPOAE-shift and the exposure level. In the present study, the fact that the difference in themaximum DPOAE shift is approximately +5 dB suggests that the results can bebetter explained on an energy basis, in which the magnitude of the DPOAE-shiftmay increase at a rate of approximately 1 dB per dB in the exposure level. This isin agreement with the results by Eddins et al. (1999), in which a group of chinchillaswas continuously exposed to an octave-band noise centered at 4 kHz for a total of 42days, 6 days at each of seven exposure levels. The exposure level increased in 8-dBsteps from 48 to 96 dB SPL. DPOAE input-output (I/O) functions were measured atoctave intervals over a range of primary tone f2 frequencies between 1.2 and 9.6 kHz.The primaries were presented at equal level (L1 = L2) and with a f2/f1 ratio of 1.2.DPOAE I/O functions were measured in 5-dB increments from 0 to 80 dB SPL.Measurements were obtained (1) pre-exposure, (2) during days 3-6 of each 6-day ex-posure, and (3) 4 weeks after the final exposure. The maximum DPOAE shift was
68 CHAPTER 5. OVERALL DISCUSSION AND CONCLUSION
observed within the octave-band of the noise exposure (3.4− 6.8 kHz). The combi-nation of primaries that revealed that biggest DPOAE-shift was L1 = L2 = 75 dBSPL. For this set of primaries the DPOAE shift increased at a ratio of 1.3 dB forevery dB increase in noise level up to approximately 75 dB SPL. Thus, the ratioobserved in our experiment is comparable to the ratio observed by Eddins et al.(1999).
DPOAE measurements in PAPER II were performed with low frequency reso-lution, insufficient to monitor the fine structures of the DPOAE. For this reason,it is not possible to confirm whether more complex noise exposures –e.g., CONTand IMP+CONT– induced a similar effect on the DPOAE fine structures as theexposure TONE in PAPER I. The main reason for not monitoring the DPOAE finestructures in PAPER II is that the experimental protocol for DPOAE assessmentonly allows a maximum of 16 pairs of primaries. As results from PAPER I showedno systematic changes in the characteristics of the DPOAE fine structures after atonal overexposure, it was decided to disregard the assessment of the fine structuresin PAPER II in benefit of DPOAE measurements on a broader frequency range.
In the present study, changes in the properties of DPOAEs were evaluated bymonitoring the cubic distortion product 2f1− f2. However, several researchers havereported that the cuadratic distortion product f2 − f1 may be more sensitive than2f1 − f2 to evaluate changes in the inner ear after noise overexposure. Animalstudies have shown a bigger amplitude reduction in the component f2 − f1 than2f1 − f2 after ipsilateral and contralateral acoustic stimulation (Chang and Norton,1997; Kirk and Johnstone, 1993). These findings suggest an adaptive process withinthe cochlea that may be modulated by efferent stimulation. Similar findings havebeen reported for human subjects after contralateral stimulation (Wittekindt et al.,2009). The authors attributed the higher sensitivity of f2 − f1 to a shift of theoperating state and/or a change in the gain of the cochlear amplification due tocontralateral induced efferent modulation of the OHCs properties. Unfortunately,human data are rare due to the low amplitude of the f2 − f1 tone – which makes italmost immeasurable in human subjects (Meinke and Stagner, 2005).
5.2.1 Comparison of recovery functions
Next, a recovery function is obtained for the three noise exposures. The recoveryfunction models the DPOAE shift averaged across subjects and frequencies.
The recovery of the DPOAE shift after exposure to the stimulus TONE in themeasured frequency range can be modeled with two exponential functions of coeffi-cients:
TONE: y = 1.63 ⋅ e−t/3.33 + 3.45 ⋅ e−t/47.6 (5.1)
This fitting yields a coefficient of determination1 R2 of 0.77.
As the recovery function from the stimulus TONE is obtained in a frequencyrange of approximately 1/3-octave band, we select a similar frequency range forexposures to CONT and IMP+CONT. The frequency range corresponds to 2563 <Fgmean [Hz] < 3049 and it is the range that shows the maximum DPOAE-shift fromthe stimulus CONT. In this way, the recovery functions are:
1The coefficient of determination R2 provides a measure of how well future outcomes are likelyto be predicted by the model. The values can vary from 0 to 1 –i.e., from poor to perfect.
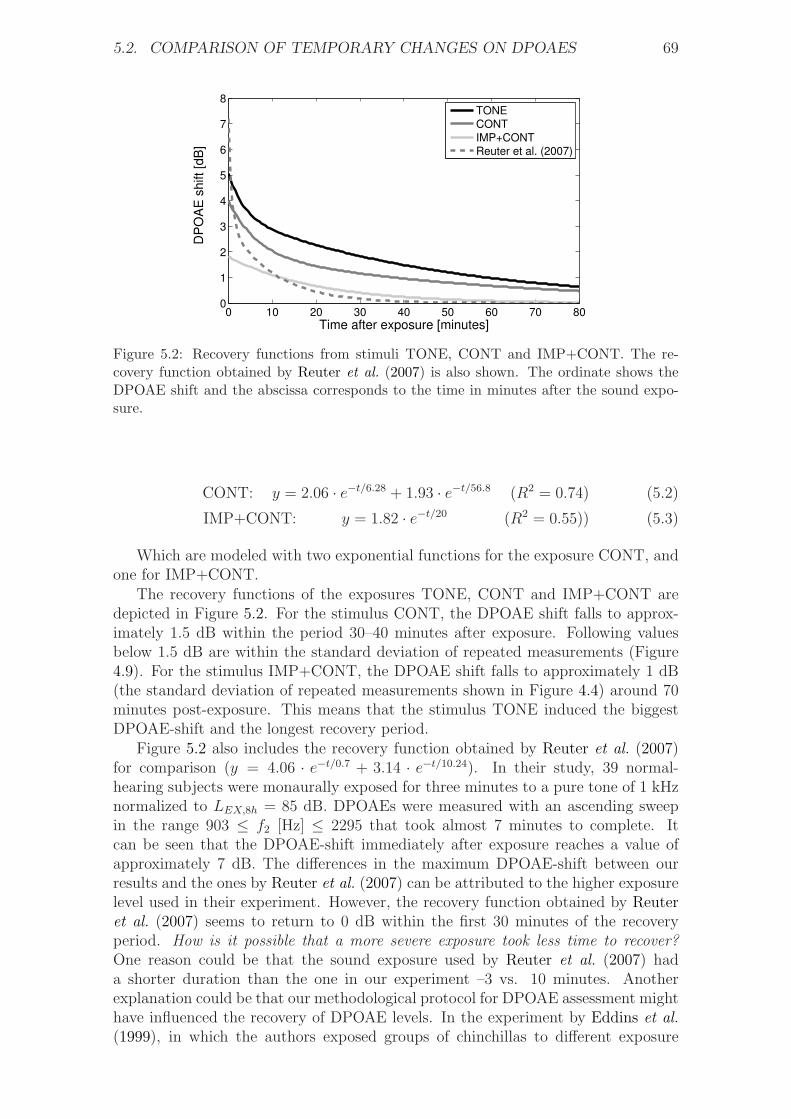
5.2. COMPARISON OF TEMPORARY CHANGES ON DPOAES 69
0 10 20 30 40 50 60 70 800
1
2
3
4
5
6
7
8
Time after exposure [minutes]
DP
OA
E s
hift
[dB
]
TONE
CONT
IMP+CONT
Reuter et al. (2007)
Figure 5.2: Recovery functions from stimuli TONE, CONT and IMP+CONT. The re-covery function obtained by Reuter et al. (2007) is also shown. The ordinate shows theDPOAE shift and the abscissa corresponds to the time in minutes after the sound expo-sure.
CONT: y = 2.06 ⋅ e−t/6.28 + 1.93 ⋅ e−t/56.8 (R2 = 0.74) (5.2)
IMP+CONT: y = 1.82 ⋅ e−t/20 (R2 = 0.55)) (5.3)
Which are modeled with two exponential functions for the exposure CONT, andone for IMP+CONT.
The recovery functions of the exposures TONE, CONT and IMP+CONT aredepicted in Figure 5.2. For the stimulus CONT, the DPOAE shift falls to approx-imately 1.5 dB within the period 30–40 minutes after exposure. Following valuesbelow 1.5 dB are within the standard deviation of repeated measurements (Figure4.9). For the stimulus IMP+CONT, the DPOAE shift falls to approximately 1 dB(the standard deviation of repeated measurements shown in Figure 4.4) around 70minutes post-exposure. This means that the stimulus TONE induced the biggestDPOAE-shift and the longest recovery period.
Figure 5.2 also includes the recovery function obtained by Reuter et al. (2007)for comparison (y = 4.06 ⋅ e−t/0.7 + 3.14 ⋅ e−t/10.24). In their study, 39 normal-hearing subjects were monaurally exposed for three minutes to a pure tone of 1 kHznormalized to LEX,8ℎ = 85 dB. DPOAEs were measured with an ascending sweepin the range 903 ≤ f2 [Hz] ≤ 2295 that took almost 7 minutes to complete. Itcan be seen that the DPOAE-shift immediately after exposure reaches a value ofapproximately 7 dB. The differences in the maximum DPOAE-shift between ourresults and the ones by Reuter et al. (2007) can be attributed to the higher exposurelevel used in their experiment. However, the recovery function obtained by Reuteret al. (2007) seems to return to 0 dB within the first 30 minutes of the recoveryperiod. How is it possible that a more severe exposure took less time to recover?One reason could be that the sound exposure used by Reuter et al. (2007) hada shorter duration than the one in our experiment –3 vs. 10 minutes. Anotherexplanation could be that our methodological protocol for DPOAE assessment mighthave influenced the recovery of DPOAE levels. In the experiment by Eddins et al.(1999), in which the authors exposed groups of chinchillas to different exposure
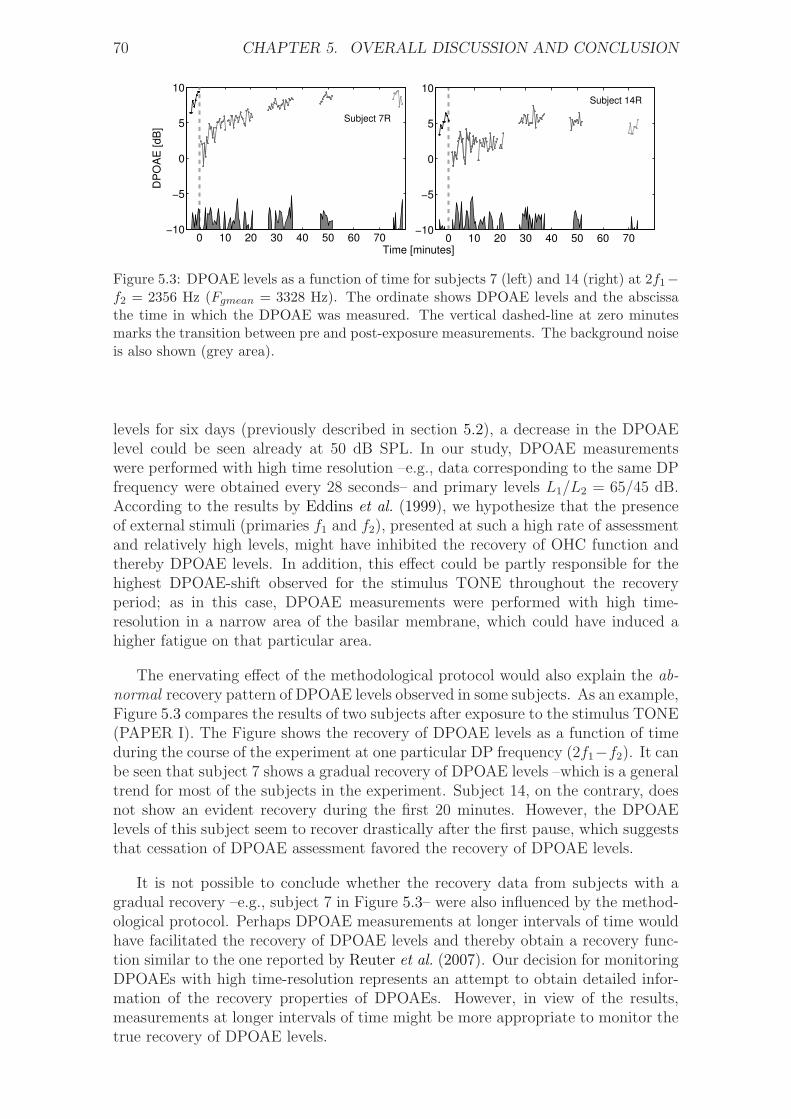
70 CHAPTER 5. OVERALL DISCUSSION AND CONCLUSION
0 10 20 30 40 50 60 70−10
−5
0
5
10
DP
OA
E [dB
]
Subject 7R
0 10 20 30 40 50 60 70−10
−5
0
5
10Subject 14R
Time [minutes]
Figure 5.3: DPOAE levels as a function of time for subjects 7 (left) and 14 (right) at 2f1−f2 = 2356 Hz (Fgmean = 3328 Hz). The ordinate shows DPOAE levels and the abscissathe time in which the DPOAE was measured. The vertical dashed-line at zero minutesmarks the transition between pre and post-exposure measurements. The background noiseis also shown (grey area).
levels for six days (previously described in section 5.2), a decrease in the DPOAElevel could be seen already at 50 dB SPL. In our study, DPOAE measurementswere performed with high time resolution –e.g., data corresponding to the same DPfrequency were obtained every 28 seconds– and primary levels L1/L2 = 65/45 dB.According to the results by Eddins et al. (1999), we hypothesize that the presenceof external stimuli (primaries f1 and f2), presented at such a high rate of assessmentand relatively high levels, might have inhibited the recovery of OHC function andthereby DPOAE levels. In addition, this effect could be partly responsible for thehighest DPOAE-shift observed for the stimulus TONE throughout the recoveryperiod; as in this case, DPOAE measurements were performed with high time-resolution in a narrow area of the basilar membrane, which could have induced ahigher fatigue on that particular area.
The enervating effect of the methodological protocol would also explain the ab-normal recovery pattern of DPOAE levels observed in some subjects. As an example,Figure 5.3 compares the results of two subjects after exposure to the stimulus TONE(PAPER I). The Figure shows the recovery of DPOAE levels as a function of timeduring the course of the experiment at one particular DP frequency (2f1−f2). It canbe seen that subject 7 shows a gradual recovery of DPOAE levels –which is a generaltrend for most of the subjects in the experiment. Subject 14, on the contrary, doesnot show an evident recovery during the first 20 minutes. However, the DPOAElevels of this subject seem to recover drastically after the first pause, which suggeststhat cessation of DPOAE assessment favored the recovery of DPOAE levels.
It is not possible to conclude whether the recovery data from subjects with agradual recovery –e.g., subject 7 in Figure 5.3– were also influenced by the method-ological protocol. Perhaps DPOAE measurements at longer intervals of time wouldhave facilitated the recovery of DPOAE levels and thereby obtain a recovery func-tion similar to the one reported by Reuter et al. (2007). Our decision for monitoringDPOAEs with high time-resolution represents an attempt to obtain detailed infor-mation of the recovery properties of DPOAEs. However, in view of the results,measurements at longer intervals of time might be more appropriate to monitor thetrue recovery of DPOAE levels.
5.3. IMPLICATIONS FOR NOISE STANDARDS 71
5.2.2 Estimation of maximum TTS
Pure-tone audiometries were performed before the noise exposures and by the endof the experimental sessions. The results averaged across subjects for left and rightears (shown in the corresponding papers) indicate that there are no significant dif-ferences in the auditory thresholds of the participants, which means that hearinglevels were able to recover within the experimental session. Unfortunately, it isnot possible to know the characteristics of the TTS induced by the stimuli TONE,CONT and IMP+CONT –i.e., the maximum TTS, the most affected frequencyrange and the temporal characteristics of the recovery. We decided to only monitorDPOAEs during the recovery period in an attempt to obtain detailed informationof the temporal characteristics of their recovery; especially in the early part. Thiswas particularly desired in order to continuously follow the evolution of the finestructures in PAPER I.
Several researchers have compared the characteristics of TTS and DPOAE-shift(e.g., Sutton et al., 1994; Marshall et al., 2001). These studies have shown thatthe magnitude of the TTS is generally higher than the DPOAE-shift although thetemporal characteristics of their recovery are similar. Of especial attention are theresults by Marshall et al. (2001), who in a similar experiment to the one presentedin PAPER I, studied the relationship between TTS and DPOAE amplitude shiftsfollowing a 10-minute monaural noise-exposure in 14 subjects (105 dB SPL half-octave narrow-band noise at 1.414 kHz center frequency). Hearing thresholds andDPOAEs were measured at 2 kHz (1/2-octave above the sound exposure) withmeasurements interleaved across the same recovery function. The average DPOAEshift for the group at approximately two minutes post-exposure was 5.0 dB (L1/L2 =65/45 dB SPL) and the mean TTS was 11.6 dB. As in our experiment the stimulusTONE also resulted in a DPOAE shift of approximately 5 dB, we expect thatthe TTS of our subjects may have reached a similar value to the one obtained byMarshall et al. (2001).
5.3 Implications for noise standards
Figure 5.1 on page 67 shows that both stimuli CONT and TONE induced a maxi-mum DPOAE shift of approximately 5 dB; whereas there is no evident shift due tothe stimulus IMP+CONT. Therefore, the +5 dB penalty failed in predicting thatthe DPOAE shift from the stimulus IMP+CONT normalized to an exposure levelof 75 + 5dBpenalty = 80 dBA, would be similar to that from the stimuli CONT andTONE normalized to 80 dBA. Furthermore, the combination of impulsive and con-tinuous noise did not pose a bigger impact on DPOAE levels. At least not higherthan what would be expected according to the EEH.
We conclude, according to Figure 5.1 and the discussion in section 5.2, that the+5 dB penalty for tonality and impulsiveness recommended by ISO 1999:1990 mightbe more appropriate for tonal exposures –as tonal exposures may induce a longerrecovery period. The penalty, however, might overestimate the auditory hazardfor the case of low-level impulse noise, at least for impulses with peak levels below117 dBC –as the one used in our experiment. It is not possible to generalize thisconclusion to impulses with higher peak levels. More empirical data from laboratoryand field studies are necessary on this issue.
Whether this conclusion can be extrapolated to other types of impulsive noisestill needs to be evaluated. Nevertheless, similar results may be expected for im-
72 CHAPTER 5. OVERALL DISCUSSION AND CONCLUSION
pulses not exceeding 117 dBC peak SPL with either (1) different spectral content;or (2) presented at lower repetition rates. In the first case, impulses with a dom-inant spectral content in the mid frequency range (2–5 kHz), like the ones usedin our experiment, are considered to be more hazardous to hearing than impulseswith spectral energy concentrated at lower or higher frequencies. This statement isbased on the results by Patterson et al. (1993), who exposed groups of chinchillasto narrow-band impulses of different spectral content. They concluded, based onaudiometric measurements and estimations of OHC loss, that impulses with spec-tral energy in the mid frequency range produced the highest damage. In the secondcase, human and animal data from both TTS and PTS studies have shown thata repetition rate of one impact per second may pose the highest auditory hazard(Tremolires and Hetu, 1980; Danielson et al., 1991; Henderson et al., 1991). Thisis because impacts within this range are not attenuated by the middle-ear reflexand pose the highest rate of acoustic stress to the inner ear. The repetition rateof 0.5 impulses per second used in this study is approximately the same as the oneconsidered the most harmful, and therefore, lower repetition rates might not pose ahigher hazard.
Results from the present study suggest that the risk of NIHL from impulsiveexposures with peak levels below 117 dBC may be reasonably predicted accordingto the EEH. This is in agreement with the recent study by Surovov et al. (2001), inwhich they suggested that the EEH might be a good predictor of hearing loss forimpulsive environments with low peak-levels. In their study, the authors comparedthe hearing levels of forge hammering workers in two different industrial plants,and studied whether the degree of hearing loss could be predicted according to ISO1999:1990. The equivalent A-weighted levels in both plants were approximately thesame, but the degree of impulsiveness varied significantly. The degree of hearing lossof workers exposed to low-level impulses (113-120 dBC) could be predicted accordingto the standard; whereas the group exposed to higher peak levels (115-143 dBC)showed a significantly higher hearing loss. These results indicate that the peak levelof the impulse may be a critical factor in the development of hearing loss. Theauthors concluded that the +5 dB penalty may be more suitable for noises withpeak levels above 120 dBC. Our results agree with their conclusion and extend theirfindings also to DPOAEs.
Finally, the Danish noise standard Arbejdstilsynet establishes that a +5 dBpenalty must be added when measuring noises of impulsive character with peaklevels higher than 115 dBC or dBA more than once per minute. Our results suggestthat an action level of 115 dBC (or dBA) may be overprotective in many situations.
5.4 Future Work
The next step for the experiment in PAPER II would be to include a third stim-ulus IMP+CONT normalized to an exposure level LEX,8ℎ of 80 dBA – with nopenalization for impulsiveness. Our results suggest that such an stimulus would beinnocuous for the hearing of the subjects participating in the experiment. If thisthird stimulus showed the same effects on DPOAE levels as the stimulus CONT,then the conclusion that the +5 dB penalty was excessive would be strengthened.With our current results, it is not possible to know what differences might arise fromcontinuous and impulsive+continuous noise of equivalent energy levels.
Further work may also include a purely impulsive signal IMP normalized to

5.4. FUTURE WORK 73
LEX,8ℎ = 80 dBA. In this way, it would be possible to study whether there aredifferences in the fatigure process between purely impulsive sounds and the combi-nation of impulsive and continuous noise in our experiment had a protective effecton the recovery of DPOAEs.
Finally, future work may also study whether the characteristics of the DPOAEfine structures are affected after exposure to more complex types of noise. If expo-sures to stimuli CONT, IMP and IMP+CONT –presented all at LEX,8ℎ of 80 dBA–do not result in statistical changes in the characteristics of the fine structures, thenthe conclusion that the risk of NIHL from low-level impulses may be predicted onan equal energy basis would be reinforced.

74 CHAPTER 5. OVERALL DISCUSSION AND CONCLUSION
Bibliography
Ahroon, W. A., Hamernik, R. P., and Davis, R. I. (1993). “Complex noise exposures:An energy analysis”, J. Acoust. Soc. Am. 93(2), 997–1006.
Altschuler, R. A. (1992). Acoustic stimulation and overstimulation in the cochlea;a comparison between basal and apical turns of the cochlea (A. L. Dancer, R.J. Salvi, D. Henderson and R. P. Hamernik, St. Louis: Mosby-Year Book), inNoise-induced hearing loss.
American National Standard ANSI S3.44-1996 (1996). “Determination of occupa-tional noise exposure and estimation of noise-induced hearing impairment”, Amer-ican National Standard (ANSI), Acoustical Society of America, Melville, NewYork, url:http://www.ansi.org/.
Arbejdstilsynet (2003). “At-vejledning D.7.4. maling af støj pa arbejdspladsen”,Arbejdstilsynet, url:http://www.at.dk/.
Arlinger, S. (1993).Manual of practical audiometry, second edition (Whurr Publish-ers Ltd, 19b Compton Terrace, London N1 2UN, England), chapter 8: Acousticimpedance audiometry: Anatomical, physiological and physical background of thestapedius reflex.
Atherley, G. R. C. and Martin, A. M. (1971). “Equivalent-continuous noise level asa measure of injury from impact and impulse noise”, Ann Occup Hyg 14, 11–28.
Attias, J. (2000). “Detection and diagnosis of NIHL by OAE”, Noise PollutionHealth Reduction (NOPHER); International Symposium on Noise-Induced Hear-ing Loss, Cambridge, England .
Attias, J., Furst, M., Furman, V., Reshef, I., Horowitz, G., and Bresloff, I. (1995).“Noise-induced hearing loss with or without hearing loss”, Ear Hear 16, 612–8.
Attias, J., Horovitz, G., El-Habit, N., and Nageris, B. (2001). “Detection andclinical diagnosis of noise-induced hearing loss by otoacoustic emissions”, Noiseand Health 3-12, 19–31.
Blauert, J. (1997). Spatial Hearing: the psychophysics of human sound localization(The MIT Press, Cambridge, MA).
Botsford, J. H. (1971). “Theory of temporal threshold shift”, J Acoust Soc Am 49(2), 440–446.
Bruel, P. V. (1977). “Do we measure damaging noise correctly?”, Noise ControlEngineering 8, 52–60.
75
76 BIBLIOGRAPHY
Burns, W. and Robinson, D. W. (1970). An investigation of the effects of occu-pational noise on hearing (G.E. W. Wolstenholme and J. Knight (Williams andWilkins, Baltimore, MD), sensorineural Hearing Loss.
Ceypek, T., Kuzniarz, J., and Lipowczan, A. (1973). “Hearing loss due to impulsenoise: a field study”, Proceedings of the International Congress on Noise as a Pub-lic Health Problem, Dubrovnik, Yugoslavia. Washington, DC: U.S. EnvironmentalProtection Agency, EPA Report No.550/9-73-008 219–228.
CHABA (1968). “Proposed damage-risk criterion for impulsive noise (gunfire)”,Report of Working Group 57, NAS-NRC committee on Hearing, Bioacoustics,and Biomechanics, Washington, D. C. .
CHABA (1992). “Committee on hearing, bioacoustics, and biomechanics (chaba).hazardous exposure to impulse noise”, National Academy Press, Washington,D.C.
Chan, P. C., Kan, K. C., Stuhmiller, J. H., and Mayorga, M. M. (2001). “Evaluationof impulse noise criteria using human volunteer data”, J. Acoust. Soc. Am. 110,1967–1975.
Chang, K. W. and Norton, S. J. (1997). “Efferently mediated changes in thequadratic distortion product (f2-f1)”, J Acoust Soc Am 102(3), 1719–1733.
Cheng, M., Liang, Z., Meng, Z., and Li, X. (1987). “Investigation of military stan-dard for impulse noise”, Proc. Inter-Noise 87 (2), 913–916.
Christensen, F. and Møller, H. (2000). “The design of valdemar: an artificial headfor binaural recordings purposes”, Proceedings of 109th Audio Engineering SocietyConvention, September 22-25, 2000, Los Angeles, California, USA .
Cody, A. R. and Russell, I. J. (1986). The response of mammalian cochlear hair cellsto acoustic overstimulation (R. J. Salvi and D. Henderson and R. P. Hamernikand V. Coletti, Plenum, New York), Basic and Applied Aspects of Noise-InducedHearing Loss.
Cohen, A., Amticalia, J. R., and Carpenter, P. (1972). “Temporary threshold shiftin hearing from exposure to different noise spectra at equal dba level”, J. Acoust.Soc. Am. 51, 503.
Collet, C., Mouling, A., Gartner, M., and Morgon, A. (1990). “Age-related changesin evoked otoacoustic emissions”, Ann. Otol. Rhinol. Laryngol. 99(112), 993–997.
Concha-Barrientos, M., Campbell-Lendrum, D., and Steenland, K. (2004). “Oc-cupational noise: Assessing the burden of disease from work-related hearing im-pairment at national and local levels”, Environmental burden of disease series 9,World Health Organization (WHO), url:http://www.who.int/en/, Geneva.
Danielson, R., Henderson, D., Gratton, M. A., Bianchi, L., and Salvi, R. (1991).“The importance of temporal pattern in traumatic impulse noise exposures”, J.Acoust. Soc. Am. 90(1), 209–218.
Davis, H., Morgan, C. T., Hawkins, J. E. J., and Galambos, R. (1950). “Temporarydeafness following exposure to loud tones and noise”, Acta Otolaryngol. Suppl.88, 1–56.
BIBLIOGRAPHY 77
Desai, A., Reed, D., Cheyne, A., Richards, S., and Prasher, D. (1999). “Absenceof otoacoustic emissions in subjects with normal audiometric thresholds impliesexposure to noise”, Noise and Health 2, 58–65.
Dunn, D. E., Davis, R. R., Merry, C. J., and Franks, J. R. (1991). “Hearing loss inthe chinchilla from impact and continuous noise exposure”, J Acoust Soc Am 90(4), 1979–1985.
Eddins, A. C., Zuskov, M., and Salvi, R. J. (1999). “Changes in distortion productotoacoustic emissions during prolonged noise exposures”, Hearing Research 127,119–28.
Emmerich, E., Richter, F., and an H. G. Dieroff, W. M. (2000a). “The effect ofimpulse noise exposure on distortion product otoacoustic emissions in the awakeguinea pig”, Eur Arch Otorhinolaryngol 257, 128–132.
Emmerich, E., Richter, F., Reinhold, U., Linss, V., and Linss, W. (2000b). “Ef-fects of industrial noise exposure on distortion product otoacoustic emissions(DPOAEs) and hair cell loss of the cochlea - long term experiments in awakeguinea pigs”, Hearing Research 148, 9–17.
Engdahl, B. and Kemp, D. T. (1996). “The effect of noise exposure on the detailsof distortion product otoacoustic emissions in humans”, J. Acoust. Soc. Am. 99,327–336.
Engdahl, B., Woxen, O., Arnesen, A. R., and Mair, I. W. (1996). “Transient evokedotoacoustic emissions as screening for hearing losses at the school for militarytraining”, Scandinavian Audiology 25, 71–78.
Erdreich, J. (1986). “A distribution based definition of impulse noise”, J. Acoust.Soc. Am. 79(4), 990–998.
Gaskill, S. A. and Brown, A. M. (1990). “The behaviour of the acoustic distortionproduct, 2f1− f2, from the human ear and its relation to auditory sensitivity”, J.Acoust. Soc. Am 88(2), 821–839.
Gaskill, S. A. and Brown, A. M. (1993). “Comparing the level of the acousticdistortion product, 2f1−f2, with behavioural threshold audiograms from normal-hearing and hearing-impaired ears”, Br. J. Audiol. 27, 397–407.
Guberan, E., J.Fernandez, Cardinet, J., and Terrier, G. (1971). “Hazardous expo-sure to industrial impact noise”, Ann Occup Hyg 14, 345–350.
Hamernik, R. P., Ahroon, W. A., Hsueh, K. D., Lei, S.-F., and Davis, R. I. (1993).“Audiometric and histological differences between the effects of continuous andimpulsive noise exposures”, J Acoust Soc Am 93 (4), 2088–2095.
Hamernik, R. P., D, D. H., and Salvi, R. (1981). “Potential for interaction of low-level impulse and continuous noise”, Wright Patterson Air Force Base, OH: U.S.Air Force Aerospace Medical Research Laboratory AFAMRL-TR-80-68.
Hamernik, R. P. and Henderson, D. (1976). The potentiation of noise by otherototraumatic agents (D. Henderson, R. P. Hamernik, D. S. Dosanjh and J. Mills,Raven, New York), the Effects of Noise on Hearing.

78 BIBLIOGRAPHY
Hamernik, R. P., Henderson, D., J.Crossley, J., and Salvi, R. J. (1974). “Interactionof continuous and impulse noise: audiometric and histological effects”, J. Acoust.Soc. Am. 55 (1), 117–121.
Hamernik, R. P., Patterson, J. J., Turrentine, G. A., and Ahroon, W. A. (1989).“The quantitative relation between sensory cell loss and hearing thresholds”, Hear-ing Research 38, 199–212.
Hamernik, R. P. and Qiu, W. (2000). “Correlations among evoked potential thresh-olds, distortion product otoacoustic emissions and hair-cell loss following variousnoise exposures in the chinchilla”, Hearing Research 150, 245–247.
Hamernik, R. P., Qiu, W., and Davis, B. (2003). “The effects of the amplitudedistribution of equal energy exposures on noise-induced hearing loss: The kurtosismetric”, J. Acoust. Soc. Am. 114(1), 386–395.
Hauser, R. and Probst, R. (1991). “The influence of systematic primary-tone levelvariation l2 − l1 on the acoustic distortion product emission 2f1 − f2 in normalhuman ears”, J. Acoust. Soc. Am. 89, 280–286.
He, N. and Schmiedt, R. A. (1993). “Fine structure of the 2f1−f2 acoustic distortionproduct: Changes with primary level”, J. Acoust. Soc. Am. 94, 2659–2669.
He, N. and Schmiedt, R. A. (1996). “Effects of aging on the fine structure of the2f1 − f2 acoustic distortion product”, J. Acoust. Soc. Am. 99(2), 1002–15.
He, N. and Schmiedt, R. A. (1997). “Fine structure of the 2f1−f2 acoustic distortionproduct: Effects on primary level and frequency ratios”, J. Acoust. Soc. Am.101(6), 3554–65.
Heitmann, J., Waldmann, B., and Plinkert, P. K. (1996). “Limitations in the useof distortion product otoacoustic emissions in objective audiometry as the resultof fine structure”, Eur. Arch. Otorhinolaryngol 253, 167–171.
Henderson, D. and Hamernik, R. P. (1986). “Impulse noise: critical review”, J.Acoust. Soc. Am. 80(2), 569–584.
Henderson, D., Subramaniam, M., Gratton, M. A., and Saunders, S. S. (1991).“Impact noise: The importance of level, duration and repetition rate”, J. Acoust.Soc. Am. 89 (3), 1350–1357.
Hirsh, I. J. (1958). “Monaural temporary threshold shift following monaural andbinaural exposures”, J. Acoust. Soc. Am. 30 (10), 912–914.
ISO 11904-1:2002 (2002). “Acoustics–determination of sound inmision from soundsources placed close to the ear - Part 1: Technique using a microphone in a realear (MIRE technique)”, International Organization for Standardization (ISO),Geneva, Switzerland, url:http://www.iso.org.
ISO 1999:1990 (1990). “Acoustics–determination of occupational noise exposureand estimation of noise-induced hearing impairment”, International Organizationfor Standardization (ISO), Geneva, Switzerland, url:http://www.iso.org.

BIBLIOGRAPHY 79
ISO 8253-1:1989 (1989). “Acoustics–audiometric test methods – Part 1: Basic puretone air and bone conduction threshold audiometry”, International Organizationfor Standardization, Geneva, Switzerland.
Johnson, D. L. (1973). “Prediction of NIPTS due to continuous noise exposure”,Washington DC, USA or AMRL-TR-73-91 (AD 767205), Wright-Patterson AirForce Base, Ohio, USA EPA-550/9-73-001-B.
Joint Committee on Infant Hearing (2007). “Year 2007 position statement: Princi-ples and guidelines for early hearing detection and intervention programs”, Pedi-atrics 120, 4, 898–921.
Kalluri, R. and Shera, C. A. (2001). “Distortion-product source unmixing: a test ofthe two-mechanism model for dpoae generation”, J. Acoust. Soc. Am. 109 (2),622–637.
Kardous, C. A., Franks, J. R., and Davis, R. R. (2005). “NIOSH/NHCA best-practices workshop on impulsive noise”, Noise Control Eng. J. 53 (2), 53–60.
Kemp, D. T. (1986). “Otoacoustic emissions, travelling waves and cochlear mecha-nisms”, Hearing Research 22, 95–104.
Kemp, D. T. (2002). “Otoacoustic emissions, their origin in cochlear function, anduse”, British Medical Bulletin 63, 223–241.
Kirk, D. L. and Johnstone, B. M. (1993). “Modulation of f2-f1: evidende for aGABA-ergic efferent system in apical cochlea of the guinea pig”, Hear. Res. 67,20–34.
Kirk, D. L., Moleirinho, A., and Patuzzi, R. B. (1997). “Microphonic and DPOAEmeasurements suggest a micromechanical mechanism for the bounce phenomenonfollowing low-frequency tones”, Hearing Research 112, 69–86.
Kirk, D. L. and Patuzzi, R. B. (1997). “Transient changes in cochlear potentialsand DPOAEs after low-frequency tones: the two-minute bounce revised”, HearingResearch 112, 49–68.
Knight, R. D. and Kemp, D. (2000). “Indications of different distortion productotoacoustic emission mechanisms from a detailed f1, f2 area study”, J Acoust SocAm 107, 457–473.
Konopka, W., Pawlaczyk-Luszczynska, M., Sliwinska-Kowalska, M., Grazanka, A.,and Zalewski, P. (2005). “Effects of impulse noise on trasiently evoked otoacousticemission in soldiers”, International Journal of Audiology 44, 3–7.
Lahti, T. and Starck, J. (1980). “Industrial impulse noise measurements”, Scand.Audiol. Suppl. 12, 61–69.
Lapsley Miller, J. A. and Marshall, L. (2006). Otoacoustic emissions as a preclinicalmeasure of noise-induced hearing loss and susceptibility to noise-induced hearingloss (Thieme Medical Publishers, Inc, New York), in Otoacoustic Emissions: Clin-ical Applications, by M. S. Robinette and T. J. Glattke.

80 BIBLIOGRAPHY
LePage, E. L. and Murray, N. M. (1993). “Click-evoked otoacoustic emissions: com-paring emissions strength with pure tone audiometric thresholds”, Aust. J. Audiol.15, 9–22.
LePage, E. L., Murray, N. M., Tran, K., and Harrap, M. J. (1993). “The ear asan acoustical generator: otoacoustic emissions and their diagnostic potential”,Acoustics Australia 21, 86–90.
Lonsbury-Martin, B., McCoy, M., Whitehead, M., and Martin, G. (1993). “Clinicaltesting of distortion-product otoacoustic emissions”, Ear Hear 14, 11–22.
Lonsbury-Martin, B. L., w. M. Cutler, and Martin, G. K. (1991). “Evidence forthe influence of aging on distortion-product otoacoustic emissions in human”, J.Acoust. Soc. Am. 89, 1749–1759.
Marshall, L. and Heller, L. M. (1998). “Transient-evoked otoacoustic emissions as ameasure of noise-induced threshold shift”, J. Speech Lang Hear Res 41, 1319–34.
Marshall, L., Heller, L. M., and Lentz, B. (1998). “Distortion-product emissionsaccompanying TTS”, Assoc. Res. Otolaryngol. Abs, 150.
Marshall, L., Lapsely-Miller, J. A., Heller, L. M., Wolgemuth, K. S., Hughes, L. M.,Smith, S. D., and Kopke, R. D. (2009). “Detecting incipient inner-ear damagefrom impulsive noise with otoacoustic emissions”, J. Acoust. Soc. Am 125 (2),995–1013.
Marshall, L., Miller, J. A. L., and Heller, L. M. (2001). “Distortion-product otoa-coustic emissions as a screening tool for noise-induced hearing loss”, Noise &Health 3(12), 43–60.
Martin, A. (1976). The equal energy concept applied to impulse noise (D. Henderson,R. P. Hamernik, D. S. Dosanjh and J. Mills, Raven, New York), the Effects ofNoise on Hearing.
Mauermann, M., Uppenkamp, S., Hengel, P. W. J., and Kollmeier, B. (1999).“Evidence for the distortion product frequency place as a source of distortionproduct otoacoustic emission (DPOAE) fine structure in humans. I fine structureand higher-order dpoae as a function of the frequency ratio f2/f1”, J. Acoust.Soc. Am. 106, 3473–83.
Mauermann, M., Uppenkamp, S., Hengel, P. W. J., and Kollmeier, B. (1999b). “Ev-idence for the distortion product frequency place as a source of distortion productotoacoustic emission (DPOAE) fine structure in humans. II. Fine structure fordifferent shapes of cochlear hearing loss”, J. Acoust. Soc. Am. 106, 3484–3491.
Meinke, D. K. and Stagner, B. B. (2005). “Human efferent adaptation of dpoaes inthe L1, L2 space”, Hear. Res. 208, 89–100.
MIL-STD 1474(B) (1979). “Noise limits for army material”, U.S. Army MissileCommand, Redstone Arsenal, AL .
Miller, J. A. L., Marshall, L., and Heller, L. M. (2004). “A longitudinal study ofchanges in evoked otoacoustic emissions and pure-tone thresholds as measured ina hearing conservation program”, International Journal of Audiology 43, 307–322.
BIBLIOGRAPHY 81
Miller, J. A. L., Marshall, L., Heller, L. M., and Hughes, L. M. (2006). “Low-levelotoacoustic emissions may predict susceptibility to noise-induced hearing loss”, J.Acoust. Soc. Am 120, 280–296.
Mills, J. H., Gilbert, R. M., and Adkins, W. Y. (1979). “Temporary threshold shiftsin humans exposed to octave bands of noise for 16 to 24 hours”, J. Acoust. Soc.Am. 65, 1238–48.
Minnaar, P., Olesen, S., Christensen, F., and Møller, H. (2001). “Localization withbinaural recordings from artificial and human heads”, AES: Journal of the AudioEngineering Society 49(5), 323–336.
Møller, A. R. (2006). Hearing: anatomy, physiology, and disorders of the auditorysystem, second edition (Academic Press).
Møller, H. (1992). “Fundamentals of binaural technology”, Applied acoustics 36(3-4), 171–218.
Murray, N. and LePage, E. L. (1993). “Age dependence of otoacoustic emissions andapparent rates of ageing of the inner ear in an australian population”, AustralianJournal of Audiology 15, 59–70.
NATO (1987). “Effects of impulse noise”, Research study group on the effects ofimpulse noise; AC/243, D9, NATO, Brussels.
NIOSH Publication No. 98-126 (1998). “Criteria for a recommended standard: Oc-cupational noise exposure”, National Institute for Occupational Safety and Health(NIOSH), url:http://www.cdc.gov/niosh/.
Nordmann, A., Bohne, B., and Harding, G. (2000). “Histophatological differencesbetween temporary and permanent threshold shift”, Hearing Res 139, 13–30.
Ordonez, R. (2005). “Temporary changes in human hearing caused by intensesounds”, Aalborg University Ph.D. Dissertation,.
OSHA 29 CFR 1910.95 (????). “Occupational safety and health standards -g- occu-pational health and environment control: Occupational noise exposure”, UnitedStates Department of Labor, Occupational Safety and Health Administration(OSHA), url:http://www.osha.gov/.
Passchier-Vermeer, W. (1968). “Hearing loss due to exposure to steady-state broad-band noise”, Institute for Public Health Eng, The Netherlands Report No. 36.
Passchier-Vermeer, W. (1971). Steady-state and fluctuating noise: its effect on thehearing of people (Robinson DW, Occupational hearing loss., New York: AcademicPress.).
Passchier-Vermeer, W. (1977). “Hearing levels of non-exposed subjects and sub-jects exposed to constant noise during working hours”, Research Institute forEnvironmental Hygiene, The Netherlands Report B367.
Patterson, J. H., Hamernik, R. P., Hargett, C. E., and Ahroon, W. A. (1993). “Anisohazard function for impulse noise”, J Acoust Soc Am 93(5), 2860–69.
82 BIBLIOGRAPHY
Patuzzi, R. (1998). “Exponential onset and recovery of temporal threshold shiftafter loud sound: evidence for long-term inactivation on mechano-electrical trans-duction channels”, Hearing Research 125, 17–38.
Prasher, D. and Sulkowski, W. (1999). “The role of otoacoustic emissions in screen-ing and evaluation of noise damage”, Int J. Occup. Med. Envir. Health 12, 183–92.
Price, G. R. (2007). “Validation of the auditory hazard assessment algorithm forthe human with impulse noise data”, J. Acoust. Soc. Am. 122 (5), 117–121.
Price, G. R. and Kalb, J. T. (1991). “Insights into hazard from intense impulsesfrom a mathematical model of the ear”, J. Acoust. Soc. Am. 90 (1), 219–227.
Probst, R., Lonsbury-Martin, B. L., and Martin, G. K. (1991). “A review of otoa-coustic emissions”, J. Acoust. Soc. Am. 89, 2027–2067.
Qiu, W., Davis, B., and Hamernik, R. P. (1986). “Hearing loss from interrupted,intermittent, and time varying Gaussian noise exposures: The applicability of theequal energy hypothesis”, J. Acoust. Soc. Am. 121(3), 1613–1620.
Quaranta, A., Portalatini, P., and Henderson, D. (1998). “Temporary and perma-nent threshold shift: An overview”, Scand. Audiol. 27, 75–86.
Rajan, R. (1995). “Involvement of cochlear efferent pathways in protective effectselicited with binaural loud sound exposure in cats”, J. Neurophysiol. 74, 582–597.
Rao, A., Long, G. R., Narayan, S., and Dhar, S. (1996). “Changes in the tem-poral characteristics of TEOAE and the fine structures of DPOAEs with aspirinconsumption”, 19th ARO Midwinter Research Meeting Abstract, p. 27.
Reshef, I., Attias, J., and Furst, M. (1993). “Characteristics of click-evoked otoa-coustic emissions in ears with normal hearing and with noise-induced hearingloss”, Br J Audiol 27, 387–395.
Reuter, K. and Hammershøi, D. (2006). “Distortion product otoacoustic emissionfine structure analysis of 50 normal-hearing humans”, J. Acoust. Soc. Am. 120,270–279.
Reuter, K. and Hammershøi, D. (2007). “Distortion product otoacoustic emissionsof symphony orchestra musicians before and after reharsal”, J. Acoust. Soc. Am.121(1), 327–336.
Reuter, K., Ordonez, R., and Hammershøi, D. (2007). “Overexposure effects of a1 khz tone on the distortion product otoacoustic emission in humans”, J. Acoust.Soc. Am. 94, 378–386.
Roberto, M., Hamernik, R. P., Salvi, R. J., Henderson, D., and Milone, R. (1985).“Impact noise and the equal energy hypothesis”, J. Acoust. Soc. Am. 77(4),1514–1520.
Robinette, M. S. and Glattke, T. J. (2000). Otoacoustic emissions; clinical applica-tions (Thieme Medical Publishers, Inc, 333 Seventh Ave, New York).
Rouhana, S. W., banglmaier, R. F., and Ochs, J. (2005). “Development of a newstandard for measurement of impulse noise associated with automotive inflatabledevices”, SAE transactions 114 (6), 2754–62.

BIBLIOGRAPHY 83
Samson, J., Wiktorek-Smagur, A., Politanski, P., Rajkowska, E., Pawlaczyk-Luszczynska, M., Dudarewicz, M., Sha, H., Schacht, J., and Sliwinska-Kowalski,M. (2008). “Noise-induced time-dependent changes in oxidative stress in themouse cochlea and attenuation by d-methionine”, Neuroscience 152, 146–50.
Saunders, J. C., Cohen, Y. E., and Szymko, Y. M. (1991). “The structural andfunctional consequences of acoustic injury in the cochlea and peripheral auditorysystem: A five year update”, J Acoust Soc Am 90(1), 136–46.
Saunders, J. C., Dear, S. D., and Schneider, M. E. (1985). “The anatomical conse-quences of acoustic injury: A review and tutorial”, J Acoust Soc Am 78, 833–60.
Schmiedt, R. A. (1984). “The effects of noise on the physiology of hearing: a reviewand tutorial”, J Acoust Soc Am 76, 1293–1317.
Schneider, E., Paoli, P., and Brun, E. (2005). “Noise in figures”, Environmental bur-den of disease series 92-9191-150-X, European Agency for Safety and Health atWork (EASHW), url:http://europa.eu.int, Luxembourg: Office for Official Publi-cations of the European Communities.
Seixas, N., Goldman, B., Sheppard, L., Neitzel, R., Norton, S., and Kujawa, S.(2005a). “Prospective noise induced changes to hearing among construction in-dustry apprentices”, Occupational and Environmental Medicine 62, 309–317.
Seixas, N., Neitzel, R., Sheppard, L., and Goldman, B. (2005b). “Alternative met-rics for noise exposure among construction workers”, Ann. Occup. Hyg 49 (6),493–502.
Shaffer, L., Withnell, R., Dhar, S., Lilly, D., Goodman, S., and Harmon, K. (2003).“Sources and mechanisms of DPOAE generation: Implications for the predictionof auditory sensitivity”, Ear Hear. 24, 367–379.
Shaffer, L. A. (2008). “DPOAE fine structure, supression, and influence on clinicaldecision-making”, Perspectives on Hearing and Hearing Disorders: Research andDiagnosis 12, 22–27.
Shera, C. A. and Guinan, J. J. (1999). “Evoked otoacoustic emissions arise bytwo fundamentally different mechanisms: a taxonomy for mammalian OAEs”, JAcoust Soc Am 105, 782–98.
Stark, J. and Pekkarinen, J. (1987). “Industrial impulse noise: Crest factor as anadditional parameter in exposure measurements”, Applied Acoustics 20, 263–274.
Stark, J., Toppila, E., and Pyykko, I. (2003). “Impulse noise and risk criteria”,Noise and Health 5 (20), 63–73.
Stover, L. J., Neely, S. T., and Gorga, M. P. (1996). “Latency and multiple sourcesof distortion product otoacoustic emissions”, J. Acoust. Soc. Am. 99, 1016–1024.
Sulkowski, W. J. and Lipowczan, A. (1982). “Impulse noise-induced hearing loss indrop forge operators and the energy concept”, Noise Control Eng 18, 24–29.
Surovov, G., Denisov, E., Antipin, V., Kharitonov, V., Stark, J., Pyykko, I., andToppila, E. (2001). “Effects of peak levels and number of impulses to hearingamong forge hammering workers”, Applied Occupational and Environmental Hy-giene 51, 816–822.
84 BIBLIOGRAPHY
Sutton, A. L., Lonsbury-Martin, B. L., Martin, G. K., and Whitehead, M. L. (1994).“Sensitivity of distortion-product otoacoustic emisions in humans to tonal over-exposure: Time course of recovery and effects of lowering L2”, Hear. Res. 75,161–174.
Talmadge, C. L., Tubis, A., Long, G., and Piskorski, P. (1998). “Modeling otoa-coustic emissions and hearing threshold fine structures in humans”, J. Acoust.Soc. Am. 104 (3), 1517–1543.
Tambs, K., Hoffman, H. J., Borchgrevink, H. M., Holmen, J., and Engdahl, B.(2006). “Hearing loss induced by occupational and impulse noise: results onthreshold shifts by frequencies, age and gender from the nord-trøndelag hearingloss study”, International Journal of Audiology 45 (5), 309–17.
Taylor, S. M., Lempert, B., Pelmear, P., Hemstock, I., and Kershaw, J. (1984).“Noise levels and hearing thresholds in the drop forging industry”, J. Acoust.Soc. Am. 76(3), 807–819.
Taylor, W. and Pelmear, P. L. (1976). “Noise levels and hearing thresholds in thedrop forging industry”, Med. Res. Council Project Rep. June, Grant G972/784/C(London, England).
Thiery, L. and Meyer-Bisch, C. (1988). “Hearing loss due to partly impulsive in-dustrial noise exposure at levels between 87 and 90 dB(A)”, J. Acoust. Soc. Am.84(2), 651–659.
Tremolires, C. and Hetu, R. (1980). “A multi-parametric study of impact noise-induced TTS”, J. Acoust. Soc. Am. 68(6), 1652–1659.
Voigt, P., Godenhielm, B., and Ostland, E. (1980). “Impulse noise-measurementand assessment of the risk of noise induced hearing loss”, Scand. Audiol. Suppl.12 (1), 319–325.
Von Gierke, H. E., Robinson, D. W., and Karmy, S. J. (1982). “Results of a work-shop on impulse noise and auditory hazard”, Journal of Sound and Vibration83(4), 579–584.
Ward, W. D. (1965). “Temporary threshold shifts following monaural and binauralexpsosure”, J. Acoust. Soc. Am. 38 (1), 121–125.
Whitehead, M. L., McCoy, M. J., Lonsbury-Martin, B. L., and Martin, G. K. (1995).“Dependence of distortion-product otoacoustic emissions on primary levels in nor-mal and impaired ears. i. effects of decreasing L2 below L1”, J. Acoust. Soc. Am.97, 2346–2358.
Wittekindt, A., Gaese, B. H., and Kossl, M. (2009). “Influence of contralateralacoustic stimulation on the quadratic distortion product f2-f1 in humans”, Hear.Res. 247, 27–33.
Yakamura, K., Aoshima, K., Hiramatsu, S., Hikichi, T., and Hiramatsu, S. (1980).“An investigation of the effects of impulse noise exposure on man (impulse noisewith a relatively low peak level)”, Eu. J. Appl. Physiol. Occup. Physiol 43, 135–142.
BIBLIOGRAPHY 85
Zweig, G. and Shera, C. A. (1995). “The origins and periodicity in the spectrum ofevoked otoacoustic emissions”, J. Acoust. Soc. Am. 98, 2018–47.

86 BIBLIOGRAPHY

Part I
PAPERS
87


Recovery of distortion product otoacoustic emissions after a 2-kHzmonaural sound-exposure in humans: effects on fine structures
Miguel Angel Aranda de Toro,a) Rodrigo Ordonez, Karen Reuter, and Dorte HammershøiAcoustics, Department of Electronic Systems, Aalborg University,
Fredrik Bajers Vej 7-B5, DK-9220 Denmark
(Dated: accepted for publication at the J. Acoust. Soc. Am. on the 30th of September, 2010)
A better understanding of the vulnerability of the fine structures of distortion product otoacous-tic emissions (DPOAEs) after acoustic overexposure may improve the knowledge about DPOAEgeneration, cochlear damage, and lead to more efficient diagnostic tools. It is studied whether theDPOAE fine structures of 16 normal-hearing human subjects are systematically affected after amoderate monaural sound-exposure of 10 minutes to a 2 kHz tone normalized to an exposure levelLEX,8ℎ of 80 dBA. DPOAEs were measured before and in the following 70 minutes after the expo-sure. The experimental protocol allowed measurements with high time and frequency resolution ina 1/3 octave-band centered at 3 kHz. On average, DPOAE levels were reduced approximately 5 dBin the entire measured frequency-range. Statistically significant differences in pre and post-exposureDPOAE levels were observed up to 70 minutes after the end of the sound exposure. The resultsshow that the effects on fine structures are highly individual and no systematic change was observed.
PACS numbers: 43.64.Jb, 43.64.Wn
I. INTRODUCTION
Distortion-product otoacoustic emissions (DPOAEs)are widely used to evaluate risk of hearing loss fromnoise overexposure. However, one of the limitations isthat the generation mechanisms of DPOAEs are not yetfully understood and therefore researchers are still in-vestigating how changes observed in DPOAE levels mayrelate to changes in absolute hearing levels, as well asthe principles behind DPOAE measurements that mightlead to a future standardized method for the assessmentof cochlear health. Hence, more research is necessary be-fore DPOAEs can be fully applied for clinical purposesor hearing conservation programs (Marshall et al., 2001).
One particular question for which there is not yet clearevidence refers to the origins of the fine structures of theDPOAE and whether their evaluation might provide fur-ther information about the vulnerability of the cochlea af-ter acoustic overexposure. When DPOAE measurementsare performed with small steps in frequency, the 2f1−f2acoustic distortion-product can show a particular patterncharacterized by a series of amplitude peaks and valleysacross frequency with peak-to-valley amplitude ratios asgreat as 20 dB (Gaskill and Brown, 1990b; Heitmannet al., 1996; Reuter and Hammershøi, 2006) and a peri-odicity of 3/32 octaves (He and Schmiedt, 1993). Thisdistinct characteristic in DPOAE levels with small fre-quency intervals is known as fine structures. The reasonfor the fine structures is not completely understood butit is widely accepted that they are the result of the in-teraction of two components (Shaffer et al., 2003): (1)the distortion component generated in the overlap regionof the two-stimulus tones – which approximates to the
a)Electronic address: [email protected]
region of f2; and (2) the reflection component generatedat the 2f1 − f2 place. The DPOAE measured in theear canal is the vector sum of contributions arising fromthese two regions. The two components interfere witheach other either constructively or destructively, produc-ing as much as +6 dB higher levels at some frequencies,and almost canceling at other frequencies, in a distinctperiodic pattern.
DPOAE fine structure might be observable wheneverthe acoustic distortion-product is measurable, and itssharpness, defined as the peak-to-peak frequency dis-tance, is independent of age and hearing loss (He andSchmiedt, 1996). Some authors suggest that the pres-ence of fine structures is a property of the healthy earand therefore their evaluation may reveal more informa-tion about the state of hearing than the DPOAE levelalone – e.g., the fine structures reappear after a suddenhearing loss (Mauermann et al., 1999b); and are reducedafter aspirin consumption (Rao et al., 1996). Other au-thors claim that the high variability usually seen in thepattern of the fine structures complicates the interpreta-tion and comparison of results across subjects (Shaffer,2008; Heitmann et al., 1996). Particularly critical is thatthe pattern of the fine structures get shifted along the fre-quency axis when the primary levels L1 and L2 are var-ied (He and Schmiedt, 1997) or the frequency ratio f2/f1is changed (Mauermann et al., 1999; He and Schmiedt,1997). This stimulus-dependent frequency shift compli-cates the comparison of DPOAE growth functions withaudiometric thresholds, and it might be responsible forthe lack of correlation between DPOAEs and hearingthresholds reported by many researchers (Shaffer et al.,2003; Heitmann et al., 1996). Several methods exist toavoid the detection of the fine structures by removing thecontribution from the reflection component (Kalluri andShera, 2001; Long et al., 2008; Dhar and Shaffer, 2004).However, it is not clear yet whether these methods may
Overexposure effects on otoacoustic emissions 1

improve the ability of DPOAEs to evaluate hearing lossand therefore further research is necessary before theycan be applied to assess the status of hearing. One reasonis that the methods require that the generation (f2) andthe reflection component (2f1 − f2) are linearly related,and currently there is a lack of data showing whether thisis true, both under normal conditions and under adverse(overexposured) conditions.Two studies have investigated whether there are sys-
tematic changes in the DPOAE fine structures of humansafter acoustic overexposure (Engdahl and Kemp, 1996;Reuter et al., 2007). Both used a monaural narrow-bandsound-exposure and monitored the fine structures at spe-cific times during the recovery. Their results show thatthe most affected frequency range was located 1/2-octaveabove the exposure –similar to the 1/2-octave shift seenin the temporary threshold shift (TTS). However, theyreported different effects in the fine structures. Engdahland Kemp (1996) found for their two subjects that themaximum to minimum ratio of the fine structure de-creased, and the whole pattern shifted toward lower fre-quencies after the exposure. Reuter et al. (2007) foundfor their 16 subjects that the effects were highly individ-ual and no systematic change was observed –i.e., somesubjects showed an increase in the depth of the fine struc-tures while others showed a decrease, with no systematicshift in frequency. Results by Reuter et al. (2007) mayhave been influenced by the methodological protocol forDPOAE assessment. That is, DPOAEs were measuredwith an ascending sweep in the range 903 ≤ f2 [Hz]≤ 2295 that took almost 7 minutes to complete. Thus,comparisons of DPOAE levels across frequency might bebiased by the time-shift during assessment –as they mightcorrespond to a different state of the recovery process inthe inner ear.The scope of the present experiment is to study
whether the fine structures of the DPOAE are systemati-cally affected after a moderate monaural sound-exposurein human subjects. A systematic change might indicatethat one of the components of DPOAE generation is moresensitive to noise overexposure –which means that thecomponents are not linearly related. Measurements wereperformed in a narrow frequency range with high timeand frequency resolution, in an attempt to provide a de-tailed description of the fine structures during the re-covery. The experiment was approved by the Danish Na-tional Ethical Committee on Biomedical Research Ethics.
II. MATERIALS AND METHODS
A. Subjects
In total, 16 subjects (eight males and eight females)participated in the experiment. The average age was24.1 ± 2.3 years. Subjects had hearing thresholds be-low 20 dBHL from 250Hz to 8 kHz measured in octaveintervals; a middle-ear pressure within ± 50 daPa; andan active stapedius reflex. None of the subjects reportedknown incidents of excessive noise exposures or abnormalreactions to noise, e.g. annoyance or headaches. All sub-
jects were students at Aalborg University and they wereremunerated for their participation.
B. Sound exposure
A pure tone of 2 kHz was presented monaurally for10 minutes via a pair of headphones model SennheiserHDA 200. The exposure level was normalized to an 8-hour working-day of LEX,8ℎ = 80dBA (ISO 1999:1990).This level corresponds to an Lear,10min = 102.2 dB mea-sured at the blocked-entrance ear canal (ISO 11904-1:2002). The standard deviation across subjects was±0.4 dB in the worst ear. The exposure frequency of2 kHz was chosen in order to avoid DPOAE measure-ments with poor S/N ratio in the low frequency-rangedue to (1) a higher background noise mainly attributed tophysiological noise from the subject; and (2) low DPOAElevels across subjects (Reuter and Hammershøi, 2006).The exposure duration of 10 minutes was a compromisebetween avoiding (1) the two-minute bounce after intensetonal/narrow-band exposures of less than four minutesobserved in measurements of TTS (Quaranta et al., 1998)and DPOAEs (Kirk and Patuzzi, 1997); and (2) longexperimental sessions that might be exhausting for sub-jects. Subjects were instructed to remove the headphonesat any time if they felt any discomfort during the soundexposure. None of them did.
C. Instrumentation
1. Pure-tone audiometry and middle-ear test
Pure-tone audiometries were measured using the com-mercial audiometer Madsen Orbiter 922 and the au-diometric headphones Telephonic TDH39. The left earwas tested first. Hearing thresholds were determinedin a frequency range from 250Hz to 8 kHz with a fre-quency resolution of one octave by using the ascend-ing method, which complies with the norms for auto-matic audiometries (ISO-8253:1989). Tympanometricand stapedius-reflex tests were performed with the In-
teracoustics impedance audiometer AT235.
2. Assessment of DPOAE
DPOAEs were measured with the ILO96 Research-system from Otodynamics, using the DPOAE macro op-erating mode. This mode is able to perform measure-ments in loop periods with a maximum of 16 user-definedpairs of primaries f1 and f2. Individual macros wereprogrammed for each subject. The only difference be-tween macros was the presentation order of the primaries,which was counter-balanced across subjects by means ofa Latin-square design.According to the 1/2-octave shift, it was expected
that a tonal exposure of 2 kHz would affect mostly thecochlear region around 3 kHz (Engdahl and Kemp, 1996;Reuter et al., 2007; Marshall et al., 2001). Therefore,
Overexposure effects on otoacoustic emissions 2

DPOAEs were measured across a frequency range ofapproximately 1/3-octave centered at 3 kHz (geometricmean of the primaries). This frequency range was cov-ered by 16 equally-spaced pairs of primaries with a fre-quency resolution of 48 Hz. The averaging time per eachpair of primaries presented was set to 1.3 seconds. Withthis configuration the ILO96 takes 28 seconds to measurethe 16 pairs of primaries in the frequency range.DPOAE measurements were performed using a ratio
of f2/f1 = 1.22 and fixed primary levels of L1/L2 =65/45 dB. This choice is a compromise between: (1)high sensitivity to detect small changes after noise over-exposure –i.e., maximum shifts in DPOAE levels canbe obtained when lowering L2 compared to L1 (Gaskilland Brown, 1990a; Hauser and Probst, 1991; White-head et al., 1995; Marshall et al., 2001); (2) measurableDPOAEs: Whitehead et al. (1995) measured DPOAEsfor various primary-level combinations at different fre-quencies and reported that 65/45 dB showed relativelyhigh level DPOAEs for all tested frequencies; and (3) de-tect the presence of fine structures: measurements withvarying equal primary levels (L1 = L2 = 40 to 70 dB)have shown a flattening of the fine structure for somesubjects at high levels (He and Schmiedt, 1993; Heitmannet al., 1996).The presence of spontaneous otoacoustic emisions
(SOAEs)in the ear of the subjects was not measured.
D. Sessions and experimental protocol
The experiment took place at the Section of Acous-tics of Aalborg University and it was divided in two ses-sions – session 1 and 2. Both sessions were conductedin a double-walled, sound-isolated audiometry-chamber,which complies with the background noise requirementsstated in ISO 8253-1:1989.Session 1 was a screening session with the following
purposes: (1) to inform subjects about the experiment;(2) to check whether subjects were otologically normal;and to verify that (3) subjects felt comfortable duringDPOAE measurements; (4) the sound probe fitted easilyin their ear canal; and (5) the primary levels for the testwere correctly presented. Subjects listened shortly to thesound exposure. They were allowed to decline participa-tion after this (and at any other point in time). Theduration of session 1 was approximately one hour.The sound exposure and the assessment of DPOAE
recovery took place in session 2, which lasted approxi-mately two hours. There was approximately one week inbetween sessions 1 and 2. Subjects reported that theywere not exposed to high-level noises at least one daybefore session 2. The order and duration of the measure-ments is depicted in figure 1 and it consisted of:
1. Audiometry (≈ 20 minutes). Both ears weretested.
2. DPOAE (≈ 10 minutes). Only the ear undermeasurement was tested to determine pre-exposureDPOAE levels.
3. Monaural sound-exposure (10 minutes)
4. DPOAE (50 minutes). The recovery of DPOAE ismeasured in three time intervals (called A, B andC in figure 1) with durations of 20, 10 and 5 min-utes respectively. There were two pauses of 5 and10 minutes respectively to allow subjects to relax.Pauses took place 20 and 35 minutes after the ex-posure. Subjects stayed in the room unless theyasked to go to the bathroom. Only few did.
5. Audiometry (≈ 20 minutes). Both ears weretested.
6. DPOAE (≈ 10 minutes). The final DPOAE levelwas determined in the test ear.
E. Measurement procedure
Subjects were comfortably seated on a chair with ahead rest and remained calm and still. The ear undermeasurement was randomly chosen and balanced acrosssubjects. Prior to each measurement, the ILO96 verifiesthe correct fitting of the sound probe in the ear canal bya checkfit procedure. During the checkfit two broadband-click stimuli are alternately delivered by the two outputtransducers of the sound probe. The checkfit result isstored in an array and used during data collection tobalance and normalize the two stimuli levels. All spec-trum analyses are done by the ILO96, which performs afast Fourier transform FFT with a frequency resolutionof 12.2Hz. The noise is estimated from the ten Fouriercomponents nearest to but not including the 2f1 − f2frequency. The noise is represented as all levels withintwo standard deviations of the background noise, i.e., thelimits of the 95% confidence region.
a. Determination of the pre-exposure DPOAE level
The pre-exposure DPOAE level is obtained as the av-erage of eight repeated measurements. DPOAE levelsbelow the noise floor are not included in the analysis.For four consecutive measurements the sound probe wasreinserted in the ear canal of the subject before eachmeasurement (so-called refitted). For the remaining fourmeasurements the sound probe was not reinserted (non-refitted). The presentation order of refitted and non-refitted measurements was balanced across subjects. Acheckfit was performed every time the sound probe isreinserted.
b. Assessment of the DPOAE recovery
The headphones were removed immediately after thesound exposure, the sound probe was placed in the earcanal of the subject, and a checkfit was performed. Onaverage, DPOAE collection started 30± 13 seconds afterthe end of the sound exposure, except for one subject,
Overexposure effects on otoacoustic emissions 3

FIG. 1. Order of measurements during session 2. The duration of each measurement is shown in minutes.
for whom it started 1 minute and 30 seconds after theexposure due to difficulties to get a correct probe fitting.The ILO96 was programmed to measure DPOAEs in
loop periods of either five or ten minutes. A checkfitwas performed before each loop. According to the sched-ule depicted in figure 1, there were two loop periods often minutes in interval A, a loop of ten minutes in inter-val B and a loop of five minutes in interval C. Moreover,after the first loop of interval A, the system stopped datacollection, saved the data and started a new loop. Thisinterruption took ten seconds approximately.
c. Determination of the final DPOAE level
The final DPOAE level is obtained in the same way asthe pre-exposure level, except that the order of refittedand non-refitted measurements was balanced across sub-jects depending on the order during the determinationof the pre-exposure level. On average, the final DPOAElevel was measured 70± 2.6 minutes after the end of thesound exposure.
d. Calculation of DPOAE shift
The DPOAE shift for a particular time during the re-covery is calculated as the difference between the pre-exposure DPOAE level and the corresponding post-exposure DPOAE level. Thus, a positive shift denotesa decrease in amplitude of the DPOAE. For the calcula-tion of the DPOAE shift, data are not included if pre-and post-exposure levels are both below the noise floor.If a DPOAE level is above the noise floor before the ex-posure, but below the noise floor after the exposure, bothvalues are accepted as valid.
III. RESULTS
A. Hearing levels
Figure 2 shows the average hearing levels of left andright ears exposed to the 2 kHz tone. Hearing levelswere measured before and 50 minutes after the end of thesound exposure. A balanced three-way-ANOVA analysiswas done in order to find whether there are significantdifferences. The factors are: (1) determination time ofthe hearing level –before or 50 minutes after the soundexposure; (2) ear under measurement – left or right; and(3) frequency (6 levels). The significance level of all the
250 500 1k 2k 4k 8k
−10
0
10
20
dB
HL
Left Ear
250 500 1k 2k 4k 8k
−10
0
10
20
dB
HL
Frequency [Hz]
Right Ear
Before50 min after
FIG. 2. Average hearing levels in the exposed ears beforeand 50 minutes after the sound exposure. Errorbars show theconfidence interval (� = .05). Top: left ear; bottom: rightear.
statistical analysis in this paper is � = .05. There are nosignificant differences in any of the main factors or theirinteractions.
B. DPOAE individual results
Figure 3 presents the results from six subjects and itshows DPOAE levels for one specific distortion-productfrequency as a function of time during the course ofthe experiment. Subjects 9 and 4 show a pronouncedDPOAE-shift immediately after the sound exposure. Inaddition, DPOAE levels from subject 9 seem to recovercompletely, as they become similar to pre-exposure val-ues; whereas DPOAE levels from subject 4 seem to reachan asymptote starting at 20 minutes, approximately 2 dBbelow pre-exposure levels.For the remaining subjects the following observations
are derived: subjects 8 and 11 show small DPOAE shifts.Additionally, subject 8 does not show a gradual recov-ery. Instead, the recovery resembles a staircase. Sub-ject 2 shows a low-level emission and there is no evidentalteration in DPOAE levels after the sound exposure.Finally, subject 5 presents an unusual recovery pattern,as DPOAE levels seem to increase immediately after thesound exposure and decrease later on along the recov-ery – until 70 minutes after exposure, in which the fi-
Overexposure effects on otoacoustic emissions 4
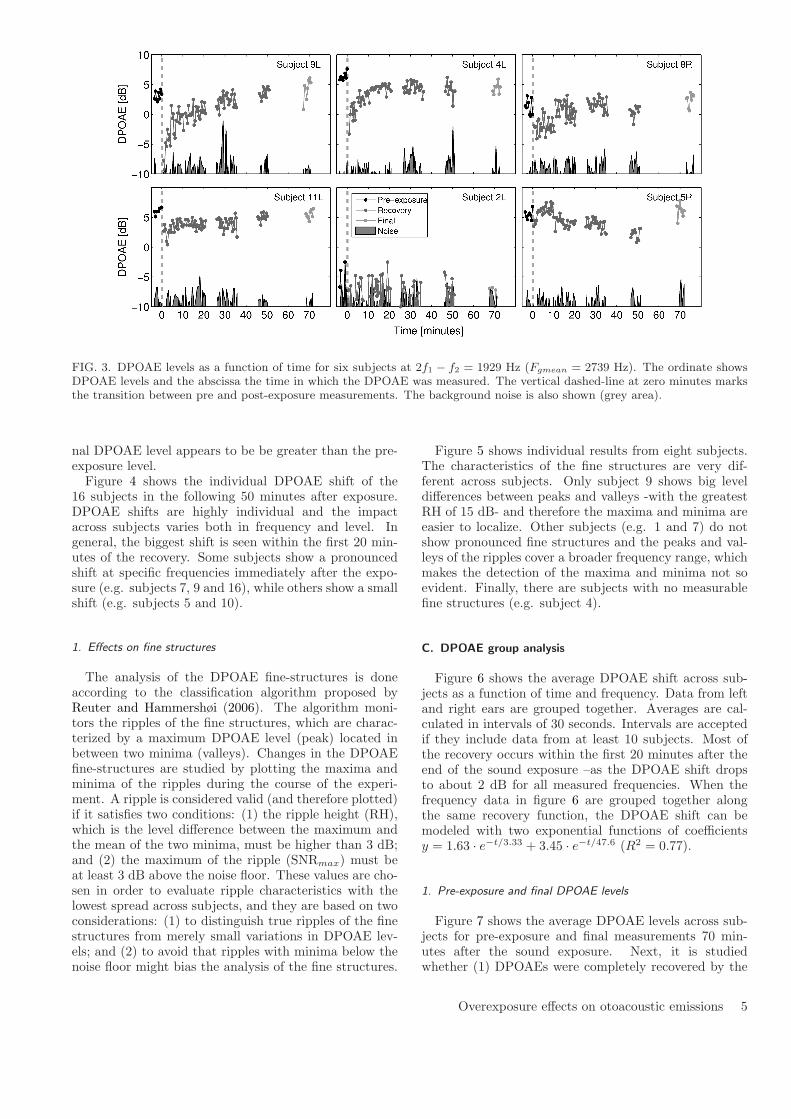
FIG. 3. DPOAE levels as a function of time for six subjects at 2f1 − f2 = 1929 Hz (Fgmean = 2739 Hz). The ordinate showsDPOAE levels and the abscissa the time in which the DPOAE was measured. The vertical dashed-line at zero minutes marksthe transition between pre and post-exposure measurements. The background noise is also shown (grey area).
nal DPOAE level appears to be be greater than the pre-exposure level.Figure 4 shows the individual DPOAE shift of the
16 subjects in the following 50 minutes after exposure.DPOAE shifts are highly individual and the impactacross subjects varies both in frequency and level. Ingeneral, the biggest shift is seen within the first 20 min-utes of the recovery. Some subjects show a pronouncedshift at specific frequencies immediately after the expo-sure (e.g. subjects 7, 9 and 16), while others show a smallshift (e.g. subjects 5 and 10).
1. Effects on fine structures
The analysis of the DPOAE fine-structures is doneaccording to the classification algorithm proposed byReuter and Hammershøi (2006). The algorithm moni-tors the ripples of the fine structures, which are charac-terized by a maximum DPOAE level (peak) located inbetween two minima (valleys). Changes in the DPOAEfine-structures are studied by plotting the maxima andminima of the ripples during the course of the experi-ment. A ripple is considered valid (and therefore plotted)if it satisfies two conditions: (1) the ripple height (RH),which is the level difference between the maximum andthe mean of the two minima, must be higher than 3 dB;and (2) the maximum of the ripple (SNRmax) must beat least 3 dB above the noise floor. These values are cho-sen in order to evaluate ripple characteristics with thelowest spread across subjects, and they are based on twoconsiderations: (1) to distinguish true ripples of the finestructures from merely small variations in DPOAE lev-els; and (2) to avoid that ripples with minima below thenoise floor might bias the analysis of the fine structures.
Figure 5 shows individual results from eight subjects.The characteristics of the fine structures are very dif-ferent across subjects. Only subject 9 shows big leveldifferences between peaks and valleys -with the greatestRH of 15 dB- and therefore the maxima and minima areeasier to localize. Other subjects (e.g. 1 and 7) do notshow pronounced fine structures and the peaks and val-leys of the ripples cover a broader frequency range, whichmakes the detection of the maxima and minima not soevident. Finally, there are subjects with no measurablefine structures (e.g. subject 4).
C. DPOAE group analysis
Figure 6 shows the average DPOAE shift across sub-jects as a function of time and frequency. Data from leftand right ears are grouped together. Averages are cal-culated in intervals of 30 seconds. Intervals are acceptedif they include data from at least 10 subjects. Most ofthe recovery occurs within the first 20 minutes after theend of the sound exposure –as the DPOAE shift dropsto about 2 dB for all measured frequencies. When thefrequency data in figure 6 are grouped together alongthe same recovery function, the DPOAE shift can bemodeled with two exponential functions of coefficientsy = 1.63 ⋅ e−t/3.33 + 3.45 ⋅ e−t/47.6 (R2 = 0.77).
1. Pre-exposure and final DPOAE levels
Figure 7 shows the average DPOAE levels across sub-jects for pre-exposure and final measurements 70 min-utes after the sound exposure. Next, it is studiedwhether (1) DPOAEs were completely recovered by the
Overexposure effects on otoacoustic emissions 5
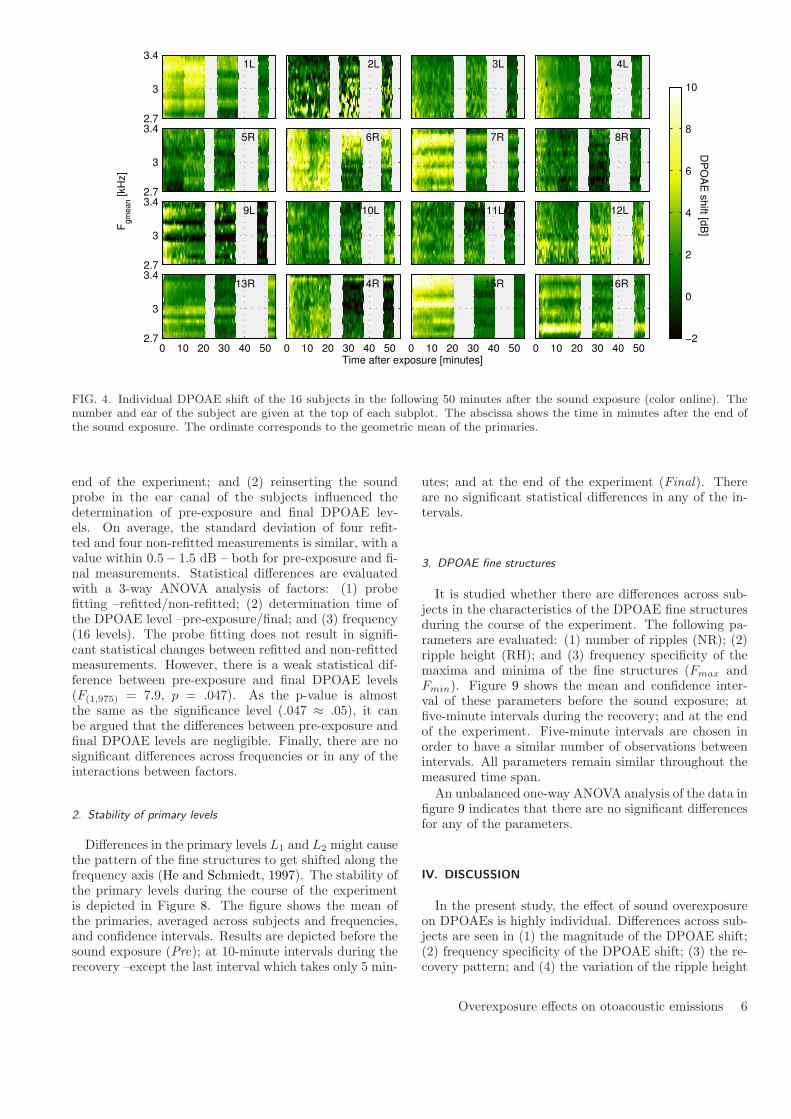
1L
2.7
3
3.42L 3L 4L
5R
2.7
3
3.46R 7R 8R
9L
2.7
3
3.410L 11L 12L
13R
0 10 20 30 40 502.7
3
3.414R
0 10 20 30 40 50
15R
0 10 20 30 40 50
16R
DP
OA
E s
hift [d
B]
Time after exposure [minutes]
Fgm
ean [kH
z]
0 10 20 30 40 50−2
0
2
4
6
8
10
FIG. 4. Individual DPOAE shift of the 16 subjects in the following 50 minutes after the sound exposure (color online). Thenumber and ear of the subject are given at the top of each subplot. The abscissa shows the time in minutes after the end ofthe sound exposure. The ordinate corresponds to the geometric mean of the primaries.
end of the experiment; and (2) reinserting the soundprobe in the ear canal of the subjects influenced thedetermination of pre-exposure and final DPOAE lev-els. On average, the standard deviation of four refit-ted and four non-refitted measurements is similar, with avalue within 0.5− 1.5 dB – both for pre-exposure and fi-nal measurements. Statistical differences are evaluatedwith a 3-way ANOVA analysis of factors: (1) probefitting –refitted/non-refitted; (2) determination time ofthe DPOAE level –pre-exposure/final; and (3) frequency(16 levels). The probe fitting does not result in signifi-cant statistical changes between refitted and non-refittedmeasurements. However, there is a weak statistical dif-ference between pre-exposure and final DPOAE levels(F(1,975) = 7.9, p = .047). As the p-value is almostthe same as the significance level (.047 ≈ .05), it canbe argued that the differences between pre-exposure andfinal DPOAE levels are negligible. Finally, there are nosignificant differences across frequencies or in any of theinteractions between factors.
2. Stability of primary levels
Differences in the primary levels L1 and L2 might causethe pattern of the fine structures to get shifted along thefrequency axis (He and Schmiedt, 1997). The stability ofthe primary levels during the course of the experimentis depicted in Figure 8. The figure shows the mean ofthe primaries, averaged across subjects and frequencies,and confidence intervals. Results are depicted before thesound exposure (Pre); at 10-minute intervals during therecovery –except the last interval which takes only 5 min-
utes; and at the end of the experiment (Final). Thereare no significant statistical differences in any of the in-tervals.
3. DPOAE fine structures
It is studied whether there are differences across sub-jects in the characteristics of the DPOAE fine structuresduring the course of the experiment. The following pa-rameters are evaluated: (1) number of ripples (NR); (2)ripple height (RH); and (3) frequency specificity of themaxima and minima of the fine structures (Fmax andFmin). Figure 9 shows the mean and confidence inter-val of these parameters before the sound exposure; atfive-minute intervals during the recovery; and at the endof the experiment. Five-minute intervals are chosen inorder to have a similar number of observations betweenintervals. All parameters remain similar throughout themeasured time span.An unbalanced one-way ANOVA analysis of the data in
figure 9 indicates that there are no significant differencesfor any of the parameters.
IV. DISCUSSION
In the present study, the effect of sound overexposureon DPOAEs is highly individual. Differences across sub-jects are seen in (1) the magnitude of the DPOAE shift;(2) frequency specificity of the DPOAE shift; (3) the re-covery pattern; and (4) the variation of the ripple height
Overexposure effects on otoacoustic emissions 6

FIG. 5. DPOAE levels and effects on fine structures from eight subjects. There are two subplots per subject arranged column-wise. Top: DPOAE levels as a function of frequency at specific instants during the experiment. Bottom: evolution of themaxima and minima of the fine-structure ripples. The abscissa corresponds to the time in minutes after the sound exposure.The horizontal dashed black-line at zero minutes marks the transition between pre and post-exposure measurements. Themaxima and minima of the ripples are shown as grey and black circles respectively. The size of the maxima depends on theripple height, i.e., the bigger the circle the bigger the ripple height.
of the fine structures. This high inter-subject variabil-ity is usually seen in the overexposure effects of bothDPOAE (Engdahl and Kemp, 1996; Reuter et al., 2007;Marshall et al., 2001) and TTS studies (Quaranta et al.,1998). In our study, the individual variability can notbe attributed to differences in the sound exposure be-tween subjects because (1) calibration results show thatthe Lear at the blocked-entrance ear canal had a standarddeviation below 0.4 dB; and (2) the sound transmission
within the ear canal at 2 kHz will lead to differences be-low 2 dB in the SPL at the eardrum (Hammershøi andMøller, 1996). Thus, we attribute the variability to indi-vidual susceptibility to noise overexposure.
Most subjects in figure 4 show a gradual recovery ofthe DPOAE-shift. However, few subjects show an abruptshift at the transition between the measurement intervalsprogrammed in the ILO96 (e.g., subject 1 at 10 min-utes). A further analysis of these subjects show that
Overexposure effects on otoacoustic emissions 7
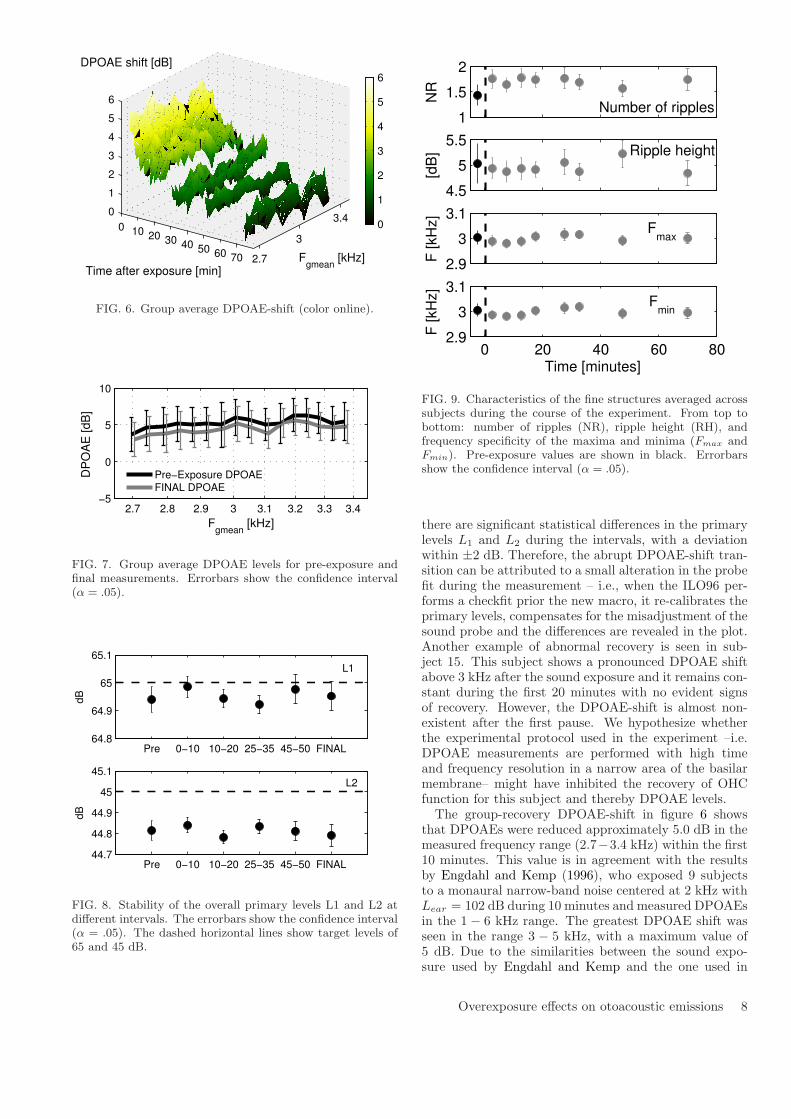
0 10 20 30 40 50 60 70 2.7
3
3.40
1
2
3
4
5
6
Fgmean
[kHz]Time after exposure [min]
DPOAE shift [dB]
0
1
2
3
4
5
6
FIG. 6. Group average DPOAE-shift (color online).
2.7 2.8 2.9 3 3.1 3.2 3.3 3.4−5
0
5
10
DP
OA
E [
dB
]
Fgmean
[kHz]
Pre−Exposure DPOAEFINAL DPOAE
FIG. 7. Group average DPOAE levels for pre-exposure andfinal measurements. Errorbars show the confidence interval(� = .05).
Pre 0−10 10−20 25−35 45−50 FINAL64.8
64.9
65
65.1
dB
L1
Pre 0−10 10−20 25−35 45−50 FINAL44.7
44.8
44.9
45
45.1
dB
L2
FIG. 8. Stability of the overall primary levels L1 and L2 atdifferent intervals. The errorbars show the confidence interval(� = .05). The dashed horizontal lines show target levels of65 and 45 dB.
1
1.5
2
NR
Number of ripples
4.5
5
5.5
[dB
] Ripple height
2.9
3
3.1
F [kH
z]
Fmax
0 20 40 60 802.9
3
3.1
Time [minutes]
F [kH
z]
Fmin
FIG. 9. Characteristics of the fine structures averaged acrosssubjects during the course of the experiment. From top tobottom: number of ripples (NR), ripple height (RH), andfrequency specificity of the maxima and minima (Fmax andFmin). Pre-exposure values are shown in black. Errorbarsshow the confidence interval (� = .05).
there are significant statistical differences in the primarylevels L1 and L2 during the intervals, with a deviationwithin ±2 dB. Therefore, the abrupt DPOAE-shift tran-sition can be attributed to a small alteration in the probefit during the measurement – i.e., when the ILO96 per-forms a checkfit prior the new macro, it re-calibrates theprimary levels, compensates for the misadjustment of thesound probe and the differences are revealed in the plot.Another example of abnormal recovery is seen in sub-ject 15. This subject shows a pronounced DPOAE shiftabove 3 kHz after the sound exposure and it remains con-stant during the first 20 minutes with no evident signsof recovery. However, the DPOAE-shift is almost non-existent after the first pause. We hypothesize whetherthe experimental protocol used in the experiment –i.e.DPOAE measurements are performed with high timeand frequency resolution in a narrow area of the basilarmembrane– might have inhibited the recovery of OHCfunction for this subject and thereby DPOAE levels.The group-recovery DPOAE-shift in figure 6 shows
that DPOAEs were reduced approximately 5.0 dB in themeasured frequency range (2.7−3.4 kHz) within the first10 minutes. This value is in agreement with the resultsby Engdahl and Kemp (1996), who exposed 9 subjectsto a monaural narrow-band noise centered at 2 kHz withLear = 102 dB during 10 minutes and measured DPOAEsin the 1 − 6 kHz range. The greatest DPOAE shift wasseen in the range 3 − 5 kHz, with a maximum value of5 dB. Due to the similarities between the sound expo-sure used by Engdahl and Kemp and the one used in
Overexposure effects on otoacoustic emissions 8

the present study, we consider that the frequency rangestudied in our experiment is the most susceptible to showthe biggest impact after overexposure, and that other re-gions in the basilar membrane might have shown similaror lower DPOAE-shifts, if any.
This experiment shows that the fine structures arehighly individual and they are not affected in a system-atic manner after sound overexposure. In general, the lo-cation of the maxima and minima of the ripples remainedstable during the recovery, except for few subjects whoshowed a downward shift in frequency at specific instantsof the recovery. For subjects with smooth fine structures–for which the location of the maxima and minima is notwell defined in frequency– the shift can be attributed toa quantization error of the classification algorithm (e.g.,subjects 7 and 15 in figure 5). In this way, adjacent DP-points may have similar levels, and therefore, small fluc-tuations of the DPOAE levels may influence the either-ordecision of the algorithm. This also explains why somesubjects do not show well-defined maxima and/or min-ima for pre-exposure DPOAE levels. An exception issubject 9. This subject shows pronounced fine struc-tures which appear randomly downward-shifted between3.2–3.4 kHz during the recovery. Engdahl and Kemp(1996) also reported a downward shift in their two sub-jects. According to our results, it might be possible thattheir data were influenced by the determination instantin which DPOAEs were measured during the recovery.Another explanation for the downward shift in frequencyis based on the influence of potential SOAEs. Furst et al.(1992) compared changes in SOAEs and the fine struc-ture of hearing thresholds after intense noise stimulation.They reported (1) a temporary reduction in the SOAEfrequency and amplitude; and (2) a decrease between theminimum and maximum of the threshold fine structuretogether with a downward shift in frequency. The au-thors attributed the shift to a change in the stiffness ofthe cochlear partition due a to reduction in the ampli-fier gain. That is the characteristic frequency (CF), de-fined as the point of maximum vibration in the basilarmembrane, might depend on the action of the OHCs. Alower contribution of the OHCs due to exhaustion af-ter noise overexposure may result in a decrease of theCF frequency. According to the results by Furst et al.
(1992) it is possible that the frequency shift observed inthe DPOAE fine structures of subject 9 might be due tothe influence of a potential SOAE –in a similar manneras they reported for the hearing threshold fine structuresof their subjects.
Figure 5 shows that –for some subjects– the rippleheight (RH) of the fine structure can vary considerablyafter sound overexposure. Subjects 13, 7 and 16 showa bigger shift in the minima and an increase in the RHduring the early recovery period. On the contrary, sub-ject 9 shows a bigger shift in the maxima, resulting in alower RH. For the rest of the subjects with measurablefine structures there are no clear differences. This vari-ability is in agreement with the results by Reuter et al.
(2007) and it can be explained according to the two-source model of DPOAE generation. The model consid-ers that the fine structure is caused by constructive and
destructive interference of the distortion component f2and the reflection component 2f1 − f2. Variations of theRH after sound overexposure can be indicative of shiftsin the relative amplitude of the two components. Our re-sults indicate that the shift may be more acute for somesubjects than others but –on average– there are no sig-nificant differences in the characteristics of the RH dueto overexposure (figure 9), which suggests that the twocomponents might be affected equally. This theory couldexplain why no systematic changes of fine structure couldbe observed in this study.In the literature it is suggested that the individual dif-
ferences in the behaviour of the fine structures can bepredicted by analysing the phase of the DPOAE (Tal-madge et al., 1999; Long et al., 2008). In this way, boththe generation and reflection component can be separatedand the analysis of the phase change with frequency canprovide a clue as to which component is dominant, andthereby what will be the effect on the fine structures.Several methods for separation of the two componentshave been proposed (Shera and Zweig, 1993; Stover et al.,1996; Long et al., 2008). However, the methods rely onprinciples that still need to be validated before they canbe reliably applied. One of the main constraints is thatthe methods assume that the cochlea is a linear and non-dispersive system. This assumption could lead to wrongestimations of the delay of the two components (Tubiset al., 2000). An alternative method to separate the twocomponents consists on adding a suppressor tone closeto the distortion component 2f1 − f2 (Heitmann et al.,1996; Mauermann and Kollmeier, 2004). The suppres-sor tone aims at avoiding the influence of the distortioncomponent while leaving the generator component f2 un-changed. Currently, a universal suppressor level for allsubjects does not exist, and this may sometimes increasethe fine structure instead of reducing it (Talmadge et al.,1999).
The results suggest that the fine structures of theDPOAE might not be a better indicator of early hear-ing loss than the DPOAE level alone. On the contrary,the variability seen across subjects might complicate theinterpretation and comparison of results.
Acknowledgments
This work has been supported by the Danish ResearchCouncil for Technology and Production. The authorswould like to thank all the subjects who participated inthe test for their constant and positive attitude. Specialthanks also to the reviewers of this manuscript for theirhelpful comments and suggestions.
Dhar, S. and Shaffer, L. A. (2004). “Effects of a suppres-sor tone on distortion product otoacoustic emissions finestructure: Why a universal suppressor level is not a practi-cal solution to obtaining single-generator DP-grams”, EarHear. 25, 573–85.
Engdahl, B. and Kemp, D. T. (1996). “The effect of noiseexposure on the details of distortion product otoacousticemissions in humans”, J. Acoust. Soc. Am. 99, 1573–87.
Overexposure effects on otoacoustic emissions 9

Furst, M., Reshef, I., and Attias, J. (1992). “Manifesta-tions of intense noise stimulation on spontaneous otoacous-tic emission and threshold microstructure: Experiment andmodel”, J. Acoust. Soc. Am. 91(2), 1003–14.
Gaskill, S. A. and Brown, A. M. (1990a). “The behavior ofthe acoustic distortion product, 2f1 − f2, from the humanear and its relation to auditory sensitivity”, J. Acoust. Soc.Am. 88, 821–39.
Gaskill, S. A. and Brown, A. M. (1990b). “The behaviour ofthe acoustic distortion product, 2f1 − f2”, J. Acoust. Soc.Am 88(2).
Hammershøi, D. and Møller, H. (1996). “Sound transmissionto and within the human ear canal”, J. Acoust. Soc. Am.100(1), 408–27.
Hauser, R. and Probst, R. (1991). “The influence of system-atic primary-tone level variation L2 − L1 on the acousticdistortion product emission 2f1−f2 in normal human ears”,J. Acoust. Soc. Am. 89, 280–86.
He, N. and Schmiedt, R. A. (1993). “Fine structure of the2f1−f2 acoustic distortion product: Changes with primarylevel”, J. Acoust. Soc. Am. 94, 2659–69.
He, N. and Schmiedt, R. A. (1996). “Effects of aging on thefine structure of the 2f1 − f2 acoustic distortion product”,J. Acoust. Soc. Am. 99(2), 1002–15.
He, N. and Schmiedt, R. A. (1997). “Fine structure of the2f1 − f2 acoustic distortion product: Effects on primarylevel and frequency ratios”, J. Acoust. Soc. Am. 101(6),3554–65.
Heitmann, J., Waldmann, B., and Plinkert, P. K. (1996).“Limitations in the use of distortion product otoacousticemissions in objective audiometry as the result of fine struc-ture”, Eur. Arch. Otorhinolaryngol 253, 167–71.
Kalluri, R. and Shera, C. A. (2001). “Distortion-productsource unmixing: A test of the two-mechanism model forDPOAE generation”, J. Acoust. Soc. Am. 109, 622–37.
Kirk, D. L. and Patuzzi, R. B. (1997). “Transient changes incochlear potentials and DPOAEs after low-frequency tones:the two-minute bounce revised”, Hearing Research 112, 49–68.
Long, G. R., Talmadge, C. L., and Lee, J. (2008). “Measuringdistortion product otoacoustic emissions using continuouslysweeping primaries”, J. Acoust. Soc. Am 124(3), 1613–26.
Marshall, L., Miller, J. A. L., and Heller, L. M. (2001).“Distortion-product otoacoustic emissions as a screeningtool for noise-induced hearing loss”, Noise & Health 3(12),43–60.
Mauermann, M. and Kollmeier, B. (2004). “Distortion prod-uct otoacoustic emisions (DPOAE) input/output functionsand the influence of the second DPOAE source”, J. Acoust.Soc. Am. 116, 2199–2212.
Mauermann, M., Uppenkamp, S., Hengel, P. W. J., andKollmeier, B. (1999). “Evidence for the distortion prod-uct frequency place as a source of distortion product otoa-coustic emission (DPOAE) fine structure in humans. I finestructure and higher-order DPOAE as a function of the fre-quency ratio f2/f1”, J. Acoust. Soc. Am. 106, 3473–83.
Mauermann, M., Uppenkamp, S., Hengel, P. W. J., andKollmeier, B. (1999b). “Evidence for the distortion prod-uct frequency place as a source of distortion product otoa-coustic emission (DPOAE) fine structure in humans. II. finestructure for different shapes of cochlear hearing loss”, J.Acoust. Soc. Am. 106, 3484–91.
Quaranta, A., Portalatini, P., and Henderson, D. (1998).“Temporary and permanent threshold shift: An overview”,Scand. Audiol. 27, 75–86.
Rao, A., Long, G. R., Narayan, S., and Dhar, S. (1996).
“Changes in the temporal characteristics of TEOAE andthe fine structures of DPOAEs with aspirin consumption”,19th ARO Midwinter Research Meeting Abstract, p. 27.
Reuter, K. and Hammershøi, D. (2006). “Distortion productotoacoustic emission fine structure analysis of 50 normal-hearing humans”, J. Acoust. Soc. Am. 120, 270–79.
Reuter, K., Ordonez, R., and Hammershøi, D. (2007). “Over-exposure effects of a 1 khz tone on the distortion productotoacoustic emission in humans”, J. Acoust. Soc. Am. 94,378–86.
Shaffer, L., Withnell, R., Dhar, S., Lilly, D., Goodman,S., and Harmon, K. (2003). “Sources and mechanisms ofDPOAE generation: Implications for the prediction of au-ditory sensitivity”, Ear Hear. 24, 367–79.
Shaffer, L. A. (2008). “DPOAE fine structure, supression,and influence on clinical decision-making”, Perspectives onHearing and Hearing Disorders: Research and Diagnosis12, 22–27.
Shera, C. A. and Zweig, G. (1993). “Noninvasive measure-ment of the cochlear traveling-wave ratio”, J. Acoust. Soc.Am. 93, 3333–52.
Stover, L. J., Neely, S. T., and Gorga, M. P. (1996). “Latencyand multiple sources of distortion product otoacoustic emis-sions”, J. Acoust. Soc. Am. 99, 1016–24.
Talmadge, C. L., Long, G. R., Tubis, A., and Dhar, S. (1999).“Experimental confirmation of the two-source interferencemodel for the fine structure of distortion product otoacous-tic emissions”, J. Acoust. Soc. Am 105, 275–92.
Tubis, A., Talmadge, C. L., Tong, C., and Dhar, S. (2000).“On the relationsips between the fixed-f1, fixed-f2 andfixed-ratio phase derivatives of the 2f1−f2 distortion prod-uct otoacoustic emission”, J. Acoust. Soc. Am. 108, 1772–85.
Whitehead, M. L., McCoy, M. J., Lonsbury-Martin, B. L.,and Martin, G. K. (1995). “Dependence of distortion-product otoacoustic emissions on primary levels in normaland impaired ears. i. effects of decreasing L2 below L1”, J.Acoust. Soc. Am. 97, 2346–58.
Overexposure effects on otoacoustic emissions 10
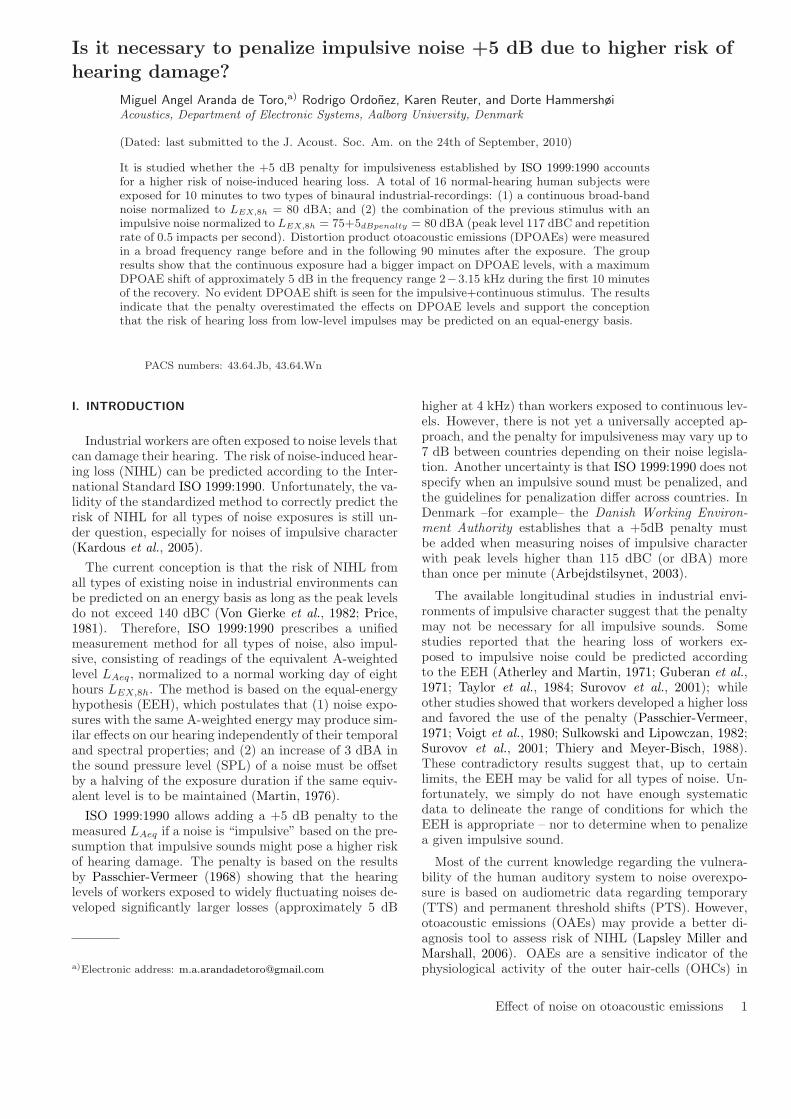
Is it necessary to penalize impulsive noise +5 dB due to higher risk ofhearing damage?
Miguel Angel Aranda de Toro,a) Rodrigo Ordonez, Karen Reuter, and Dorte HammershøiAcoustics, Department of Electronic Systems, Aalborg University, Denmark
(Dated: last submitted to the J. Acoust. Soc. Am. on the 24th of September, 2010)
It is studied whether the +5 dB penalty for impulsiveness established by ISO 1999:1990 accountsfor a higher risk of noise-induced hearing loss. A total of 16 normal-hearing human subjects wereexposed for 10 minutes to two types of binaural industrial-recordings: (1) a continuous broad-bandnoise normalized to LEX,8ℎ = 80 dBA; and (2) the combination of the previous stimulus with animpulsive noise normalized to LEX,8ℎ = 75+5dBpenalty = 80 dBA (peak level 117 dBC and repetitionrate of 0.5 impacts per second). Distortion product otoacoustic emissions (DPOAEs) were measuredin a broad frequency range before and in the following 90 minutes after the exposure. The groupresults show that the continuous exposure had a bigger impact on DPOAE levels, with a maximumDPOAE shift of approximately 5 dB in the frequency range 2−3.15 kHz during the first 10 minutesof the recovery. No evident DPOAE shift is seen for the impulsive+continuous stimulus. The resultsindicate that the penalty overestimated the effects on DPOAE levels and support the conceptionthat the risk of hearing loss from low-level impulses may be predicted on an equal-energy basis.
PACS numbers: 43.64.Jb, 43.64.Wn
I. INTRODUCTION
Industrial workers are often exposed to noise levels thatcan damage their hearing. The risk of noise-induced hear-ing loss (NIHL) can be predicted according to the Inter-national Standard ISO 1999:1990. Unfortunately, the va-lidity of the standardized method to correctly predict therisk of NIHL for all types of noise exposures is still un-der question, especially for noises of impulsive character(Kardous et al., 2005).
The current conception is that the risk of NIHL fromall types of existing noise in industrial environments canbe predicted on an energy basis as long as the peak levelsdo not exceed 140 dBC (Von Gierke et al., 1982; Price,1981). Therefore, ISO 1999:1990 prescribes a unifiedmeasurement method for all types of noise, also impul-sive, consisting of readings of the equivalent A-weightedlevel LAeq, normalized to a normal working day of eighthours LEX,8ℎ. The method is based on the equal-energyhypothesis (EEH), which postulates that (1) noise expo-sures with the same A-weighted energy may produce sim-ilar effects on our hearing independently of their temporaland spectral properties; and (2) an increase of 3 dBA inthe sound pressure level (SPL) of a noise must be offsetby a halving of the exposure duration if the same equiv-alent level is to be maintained (Martin, 1976).
ISO 1999:1990 allows adding a +5 dB penalty to themeasured LAeq if a noise is “impulsive” based on the pre-sumption that impulsive sounds might pose a higher riskof hearing damage. The penalty is based on the resultsby Passchier-Vermeer (1968) showing that the hearinglevels of workers exposed to widely fluctuating noises de-veloped significantly larger losses (approximately 5 dB
a)Electronic address: [email protected]
higher at 4 kHz) than workers exposed to continuous lev-els. However, there is not yet a universally accepted ap-proach, and the penalty for impulsiveness may vary up to7 dB between countries depending on their noise legisla-tion. Another uncertainty is that ISO 1999:1990 does notspecify when an impulsive sound must be penalized, andthe guidelines for penalization differ across countries. InDenmark –for example– the Danish Working Environ-
ment Authority establishes that a +5dB penalty mustbe added when measuring noises of impulsive characterwith peak levels higher than 115 dBC (or dBA) morethan once per minute (Arbejdstilsynet, 2003).
The available longitudinal studies in industrial envi-ronments of impulsive character suggest that the penaltymay not be necessary for all impulsive sounds. Somestudies reported that the hearing loss of workers ex-posed to impulsive noise could be predicted accordingto the EEH (Atherley and Martin, 1971; Guberan et al.,1971; Taylor et al., 1984; Surovov et al., 2001); whileother studies showed that workers developed a higher lossand favored the use of the penalty (Passchier-Vermeer,1971; Voigt et al., 1980; Sulkowski and Lipowczan, 1982;Surovov et al., 2001; Thiery and Meyer-Bisch, 1988).These contradictory results suggest that, up to certainlimits, the EEH may be valid for all types of noise. Un-fortunately, we simply do not have enough systematicdata to delineate the range of conditions for which theEEH is appropriate – nor to determine when to penalizea given impulsive sound.
Most of the current knowledge regarding the vulnera-bility of the human auditory system to noise overexpo-sure is based on audiometric data regarding temporary(TTS) and permanent threshold shifts (PTS). However,otoacoustic emissions (OAEs) may provide a better di-agnosis tool to assess risk of NIHL (Lapsley Miller andMarshall, 2006). OAEs are a sensitive indicator of thephysiological activity of the outer hair-cells (OHCs) in
Effect of noise on otoacoustic emissions 1

the inner ear. The function of the OHCs is essentialfor healthy hearing and it is believed that the onset andgradual development of NIHL is mainly a consequenceof OHC loss (Saunders et al., 1991). Thus, OAEs reflectvulnerability of the inner ear after acoustic overexposuredue to metabolic changes in the OHCs (Kemp, 1986;Probst et al., 1991). Longitudinal and cross-sectionalstudies have shown that OAEs can diminish before hear-ing levels in populations exposed to high levels of noise(an overview of the studies is given by Lapsley Millerand Marshall, 2006). For this reason OAEs may be moresensitive than pure-tone audiometry to detect incipienthearing loss. In addition, changes in OAE levels and au-diometric tests have shown similarities in the frequencyspecificity of TTS and PTS; and in the time course ofthe recovery of TTS (Marshall et al., 2001; Engdahl andKemp, 1996; Emmerich et al., 2000; Reuter et al., 2007).
In the present study human subjects were exposed un-der laboratory conditions to two different noise stimuli.One of the stimuli was penalized +5 dB for impulsive-ness as specified by the Danish legislation (Arbejdstil-synet, 2003). The purpose was to investigate whetherthere is a difference in the temporary changes from thetwo stimuli, which may be indicative of a higher risk ofNIHL. Temporary changes in the hearing of the subjectswere monitored with measurements of distortion prod-uct otoacoustic emissions (DPOAEs). The assumptionis that, if the penalty is correct, both stimuli may pro-duce similar effects on the DPOAEs. The experimentwas approved by the Danish National Ethical Committee
on Biomedical Research Ethics.
II. MATERIALS AND METHODS
A. Subjects
In total 16 subjects (eight males and eight females)participated in the experiment. The average age was 24.3years with a standard deviation (SD) of 3.7 years. Sub-jects had hearing thresholds below 20 dBHL from 250Hzto 8 kHz measured with octave intervals, a middle-earpressure within± 50 daPa, and an active stapedius reflex.None of the subjects reported known incidents of exces-sive noise exposures or abnormal reactions to noise, e.g.annoyance or headaches. All subjects were students atAalborg University and they were remunerated for theirparticipation.
B. Noise exposures
Subjects were exposed to two different noise stimuli.Both stimuli had a duration of 10 minutes and they con-sisted of binaural recordings of industrial noises with thefollowing properties:
0 1 2 3 4 5−20
−10
0
10
20
Time [seconds]
Am
plit
ude [P
a]
CONT
IMP+CONT
FIG. 1. Five-second excerpt of the diffuse-field waveforms ofstimuli CONT and IMP+CONT.
1. Continuous noise (CONT)
The stimulus CONT was industrial noise of continuouscharacter. The stimulus consisted of the mix of a benchdriller and a table saw. Both machines radiate noise ofcontinuous broad-band noise but in different frequencyranges; i.e., low frequency for the driller and mid-highfrequency for the saw. It was decided to mix the twonoise sources in order to cover a broader frequency rangeduring the exposure. Noise recordings were done sepa-rately and mixed afterwards via software. The 10 minute-duration stimulus was obtained by concatenating a seg-ment of 30 seconds from the original recordings. A cross-fading technique was applied in order to have a smoothand unnoticeable transition between segments. The ex-posure level was normalized to an eight-hour working dayLEX,8ℎ of 80 dBA, which corresponds to a LAeq,10min of97 dBA (ISO 1999:1990). This level leads to a Lear,10min
of 102.7 dB at the blocked-entrance ear canal (ISO 11904-1:2002). The SD across subjects was ±0.7 dB in bothears.
2. Impulsive + continuous noise (IMP+CONT)
The stimulus IMP+CONT consisted of the combina-tion of impulsive and continuous industrial noise. Thecontinuous noise was a scaled version in level of the afore-mentioned stimulus CONT. The impulsive noise was ahammer beating a metal plate with a repetition rate of0.5 impacts per second (300 impacts in total). The 10-minute-duration sequence of impulses consisted of du-plicates of one single hammer-impact selected from theoriginal recordings. In this manner, it is assured thatthe impulsive parameters remained constant throughoutthe exposure. The impact had a peak level of 117 dBCmeasured in diffuse field; rise time of 1.64 msec; and aB-duration of 70 msec. The exposure level was normal-ized to 75 dBA, which corresponds to a LAeq,10min of
Effect of noise on otoacoustic emissions 2

100 160 250 400 630 1k 1.6k 2.5k 4k 6.3k 10k 16k60
70
80
90
Frequency [Hz]
dB
Diffuse−field related LDF,H,eq
CONT IMP+CONT
100 160 250 400 630 1k 1.6k 2.5k 4k 6.3k 10k 16k
−4−2
02
dB
Frequency [Hz]
Relative difference normalized at 1−kHz
FIG. 2. Top: diffuse-field related (LDF,H,eq) in 1/3-octavebands for stimuli CONT and IMP+CONT. Bottom: relativedifference between the previous levels normalized at 1 kHz.
TABLE I. Acoustic parameters of the noise stimuli CONTand IMP+CONT in a 30-second interval. All the parame-ters are diffuse-field related values except Lear,10min, which ismeasured at the blocked-entrance ear canal. The crest factoris calculated as LCpeak − LAeq,10min. LAXX% are percentilelevels.
param [unit] CONT IMP+CONTLEX,8ℎ dBA 80 75 + 5dBpenalty
LAeq,10min dBA 97 92LCpeak dBC 110 117Lear,10min dBA 102.7 98.2crest factor dB 13 25LA10% dBA 101.5 93.5LA50% dBA 93.7 83.5LA90% dBA 79.1 60.5kurtosis 3 32
92 dBA (ISO 1999:1990). This level leads to a Lear,10min
of 98.2 dB at the blocked-entrance ear canal (ISO 11904-1:2002). The SD across subjects was±0.6 dB in the worseear. After penalization for impulsiveness the correctedexposure level is LEX,8ℎ = 75 + 5dBpenalty = 80 dBA.
3. Binaural recordings, sound processing and reproduction
Binaural technology is used for the recording and re-production of real-life noise stimuli in order to reproducerealistic noise exposures in laboratory conditions. In thisway, it is possible to expose subjects to the original ex-posure by preserving the spatial information during therecordings and reproduce the effect of proximity to thesound source. This is particularly important when con-sidering the role of the acoustic middle-ear reflex duringthe noise exposures, and the fact that the incoming sounddirection might have an effect on the bilateral interactionof the stapedius muscle; i.e., the contraction of the mus-
cle in one ear is influenced by the state of the muscle inthe other ear (Møller, 2006).
Binaural recordings were done in a mechanical work-shop at Aalborg University with the artificial head Valde-
mar (Christensen and Møller, 2000) connected to themulti-channel measuring system Harmonie by 01dB-
Metravib. The artificial head was placed at the posi-tion normally occupied by the operator of the machine,with the operator absent. For recordings of the ham-mer impacts the artificial head was placed in front ofthe operator so that the operator and the artificial headwere symmetrically located with respect to the impact.The recordings were done with a sampling frequency of51.2 kHz and analog-to-digital converters of 24-bit resolu-tion. Signal post-processing was done in Matlab. Noisestimuli were bandpass filtered from 100 Hz to 16 kHz.Diffuse-field related levels (LDF,H,eq) were derived frombinaural recordings according to the specifications givenin the standard ISO 11904-1:2002. The original binauralrecordings were down-sampled to 48 kHz for compatibil-ity with the soundcard in the computer used for playback.Noise stimuli had a fade in of 4 seconds and a fade outof 2 seconds.Figure 1 shows the diffuse-field related waveforms of
the stimuli CONT and IMP+CONT. Figure 2 shows ontop the diffuse-field-related value of both stimuli in 1/3-octave-bands; and at the bottom the relative differencebetween them normalized at 1 kHz. It can be seen thatboth stimuli have similar noise spectra except around4 kHz due to the higher energy contribution of the ham-mer impact in that range. A list of acoustic parametersfor both stimuli can be seen in table I. The kurtosis valuesuggested by Erdreich (1986) as descriptor of impulsive-ness is also shown.Noise stimuli were presented via the audiometric head-
phones Sennheiser HDA-200. For a correct binaural re-production (Møller, 1992), the headphones were equal-ized from 100 Hz to 16 kHz according to the equalizationfilter described by Ordonez (2005, appx. E).
C. Instrumentation
1. Pure-tone audiometry and middle-ear test
Pure-tone audiometries were measured using the com-mercial audiometer Madsen Orbiter 922 and the au-diometric headphones Telephonic TDH39. The left earwas tested first. Hearing thresholds were determined ina frequency range from 250Hz to 8 kHz in octave in-tervals by using the ascending method, which complieswith the norms for automatic audiometries ISO8253-1:1989. Tympanometries and stapedius-reflex tests wereperformed with the Interacoustics impedance audiometer
AT235.
2. DPOAE measurements
DPOAEs were measured with the ILO96 Research-system from Otodynamics, using the operating mode
Effect of noise on otoacoustic emissions 3

FIG. 3. Order of measurements during sessions 2 and 3. The duration of each measurement is shown in minutes.
called DPOAE macro. This mode is able to performmeasurements in loop periods with a maximum of 16user-defined pairs of primaries f1 and f2. Individualmacros were programmed for each subject. The only dif-ference between macros is the presentation order of theprimaries, which was counter-balanced across subjects bymeans of a Latin-square design.
DPOAEs were measured with a frequency ratio off2/f1 = 1.22 and fixed primary levels of L1/L2 =65/45 dB. This ratio was chosen as it may provide thelargest DPOAE levels across subjects (Probst et al.,1991). The choice of the primary levels is a compromisebetween: (1) high sensitivity to detect small changes af-ter noise overexposure – i.e., maximum shifts in DPOAElevels can be obtained when lowering L2 compared to L1
(Whitehead et al., 1995; Marshall et al., 2001); and (2)measurable DPOAEs: Whitehead et al. (1995) measuredDPOAEs for various primary-level combinations at dif-ferent frequencies and reported that 65/45 dB showedrelatively high level DPOAEs for all tested frequencies.
Measurements of the 2f1 − f2 acoustic distortion-product (DP) were performed with a frequency resolu-tion of eight points per octave in the frequency range1282 < Fgmean[Hz] < 4695 (geometric mean of the pri-maries). This frequency range is a compromise betweenavoiding low signal to noise ratio at lower frequencies,and a poor probe fitting at high frequencies. The aver-aging time per each pair of primaries presented was setto 1.3 seconds. This value was a compromise betweenminimizing random noise influence and still being ableto monitor the dynamic behaviour of the inner ear afternoise overexposure. With this configuration the ILO96takes 28 seconds to measure the 16 pairs of primaries inthe frequency range.
Further, a DPOAE measurement with a frequency res-olution of 40 primaries per octave was performed at thebeginning of the experiment. The primaries were pre-sented ascendantly from 905 Hz < Fgmean < 5.2 kHz.The purpose of this measurement was to have a detaileddescription of the DPOAE levels of each subject and re-veal any existing fine structure of the DPOAE (Gaskilland Brown, 1990; Reuter and Hammershøi, 2006). Inthe following, this measurement is called high-resolution
DPOAE.
D. Sessions and experimental protocol
The experiment took place at the Section of Acousticsof Aalborg University and it was divided in three sessions
–called session 1, 2 and 3. All sessions were conductedin a double-walled, sound-isolated audiometry-chamberwhich complies with the background noise requirementsstated in ISO8253-1:1989.Session 1 was a screening session with the following
main purposes: (1) to inform subjects about the ex-periment; (2) to check whether their hearing levels andmiddle-ear properties were normal; and to verify that (3)subjects felt comfortable during DPOAE measurements;(4) the sound probe fitted easily in their ear canal; and(5) the primary levels for the test were correctly pre-sented. Subjects listened shortly to the sound exposure.They were allowed to decline participation after this (andat any other point in time). The high-resolution DPOAEwas measured at the end of this session. The duration ofsession 1 was approximately one hour.Subjects were exposed to the sound stimuli in sessions
2 and 3. Each session lasted two and a half hours. Therewas approximately one week in between sessions. Sub-jects reported that they did not to go to noisy places orlisten to loud music at least one day before the sessions.DPOAEs were measured only in one ear which was ran-domly chosen and balanced across subjects. The sameear was used in both sessions. The presentation order ofthe stimuli was balanced across subjects. The order andduration of the measurements is depicted in Figure 3 andit consisted of:
1. Audiometry (≈ 20 minutes). Both ears weretested.
2. DPOAE (≈ 10 minutes). The pre-exposure levelwas determined in the ear under measurement.
3. Binaural noise-exposure (10 minutes). Subjectswere instructed to remove the headphones at anytime if they felt any discomfort during the expo-sure. None of them did.
4. DPOAE (80 minutes). The recovery of DPOAEwas measured in four intervals (called A, B, C andD in Figure 3) with durations of 20, 10, 5 and 5minutes respectively. There were three pauses of5, 10 and 15 minutes to allow subjects to relax.Pauses took place 20, 35 and 50 minutes after theexposure. Subjects stayed in the room unless theyasked to go to the bathroom. Few of them did.
5. Audiometry (≈ 20 minutes). Both ears weretested.
6. DPOAE (≈ 10 minutes). The final DPOAE levelwas determined in the tested ear
Effect of noise on otoacoustic emissions 4
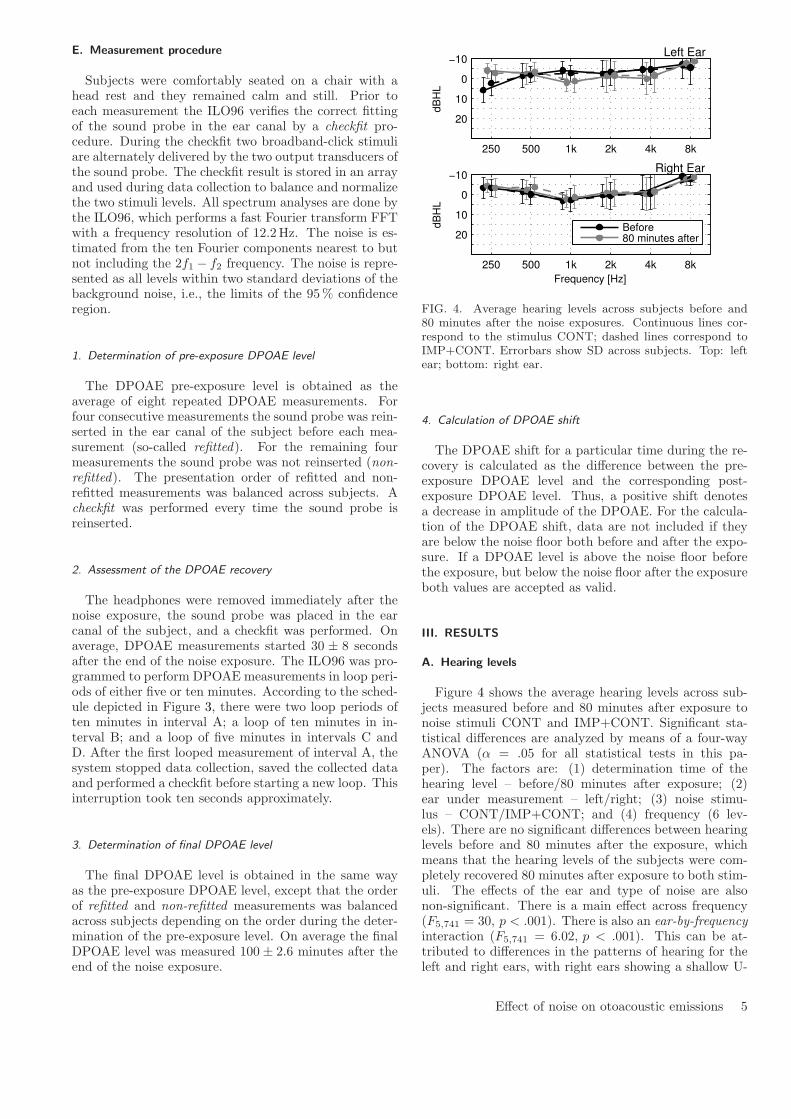
E. Measurement procedure
Subjects were comfortably seated on a chair with ahead rest and they remained calm and still. Prior toeach measurement the ILO96 verifies the correct fittingof the sound probe in the ear canal by a checkfit pro-cedure. During the checkfit two broadband-click stimuliare alternately delivered by the two output transducers ofthe sound probe. The checkfit result is stored in an arrayand used during data collection to balance and normalizethe two stimuli levels. All spectrum analyses are done bythe ILO96, which performs a fast Fourier transform FFTwith a frequency resolution of 12.2Hz. The noise is es-timated from the ten Fourier components nearest to butnot including the 2f1 − f2 frequency. The noise is repre-sented as all levels within two standard deviations of thebackground noise, i.e., the limits of the 95% confidenceregion.
1. Determination of pre-exposure DPOAE level
The DPOAE pre-exposure level is obtained as theaverage of eight repeated DPOAE measurements. Forfour consecutive measurements the sound probe was rein-serted in the ear canal of the subject before each mea-surement (so-called refitted). For the remaining fourmeasurements the sound probe was not reinserted (non-refitted). The presentation order of refitted and non-refitted measurements was balanced across subjects. Acheckfit was performed every time the sound probe isreinserted.
2. Assessment of the DPOAE recovery
The headphones were removed immediately after thenoise exposure, the sound probe was placed in the earcanal of the subject, and a checkfit was performed. Onaverage, DPOAE measurements started 30 ± 8 secondsafter the end of the noise exposure. The ILO96 was pro-grammed to perform DPOAE measurements in loop peri-ods of either five or ten minutes. According to the sched-ule depicted in Figure 3, there were two loop periods often minutes in interval A; a loop of ten minutes in in-terval B; and a loop of five minutes in intervals C andD. After the first looped measurement of interval A, thesystem stopped data collection, saved the collected dataand performed a checkfit before starting a new loop. Thisinterruption took ten seconds approximately.
3. Determination of final DPOAE level
The final DPOAE level is obtained in the same wayas the pre-exposure DPOAE level, except that the orderof refitted and non-refitted measurements was balancedacross subjects depending on the order during the deter-mination of the pre-exposure level. On average the finalDPOAE level was measured 100 ± 2.6 minutes after theend of the noise exposure.
250 500 1k 2k 4k 8k
−10
0
10
20
dB
HL
Left Ear
250 500 1k 2k 4k 8k
−10
0
10
20
dB
HL
Frequency [Hz]
Right Ear
Before80 minutes after
FIG. 4. Average hearing levels across subjects before and80 minutes after the noise exposures. Continuous lines cor-respond to the stimulus CONT; dashed lines correspond toIMP+CONT. Errorbars show SD across subjects. Top: leftear; bottom: right ear.
4. Calculation of DPOAE shift
The DPOAE shift for a particular time during the re-covery is calculated as the difference between the pre-exposure DPOAE level and the corresponding post-exposure DPOAE level. Thus, a positive shift denotesa decrease in amplitude of the DPOAE. For the calcula-tion of the DPOAE shift, data are not included if theyare below the noise floor both before and after the expo-sure. If a DPOAE level is above the noise floor beforethe exposure, but below the noise floor after the exposureboth values are accepted as valid.
III. RESULTS
A. Hearing levels
Figure 4 shows the average hearing levels across sub-jects measured before and 80 minutes after exposure tonoise stimuli CONT and IMP+CONT. Significant sta-tistical differences are analyzed by means of a four-wayANOVA (� = .05 for all statistical tests in this pa-per). The factors are: (1) determination time of thehearing level – before/80 minutes after exposure; (2)ear under measurement – left/right; (3) noise stimu-lus – CONT/IMP+CONT; and (4) frequency (6 lev-els). There are no significant differences between hearinglevels before and 80 minutes after the exposure, whichmeans that the hearing levels of the subjects were com-pletely recovered 80 minutes after exposure to both stim-uli. The effects of the ear and type of noise are alsonon-significant. There is a main effect across frequency(F5,741 = 30, p < .001). There is also an ear-by-frequency
interaction (F5,741 = 6.02, p < .001). This can be at-tributed to differences in the patterns of hearing for theleft and right ears, with right ears showing a shallow U-
Effect of noise on otoacoustic emissions 5
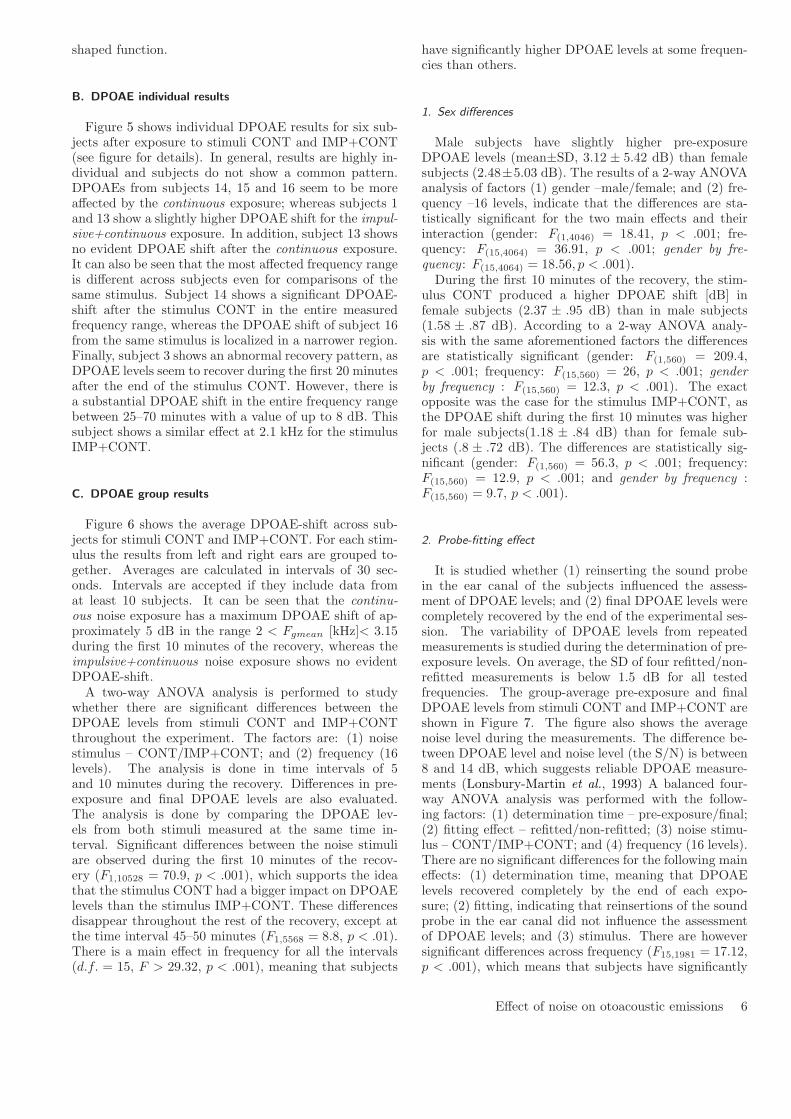
shaped function.
B. DPOAE individual results
Figure 5 shows individual DPOAE results for six sub-jects after exposure to stimuli CONT and IMP+CONT(see figure for details). In general, results are highly in-dividual and subjects do not show a common pattern.DPOAEs from subjects 14, 15 and 16 seem to be moreaffected by the continuous exposure; whereas subjects 1and 13 show a slightly higher DPOAE shift for the impul-
sive+continuous exposure. In addition, subject 13 showsno evident DPOAE shift after the continuous exposure.It can also be seen that the most affected frequency rangeis different across subjects even for comparisons of thesame stimulus. Subject 14 shows a significant DPOAE-shift after the stimulus CONT in the entire measuredfrequency range, whereas the DPOAE shift of subject 16from the same stimulus is localized in a narrower region.Finally, subject 3 shows an abnormal recovery pattern, asDPOAE levels seem to recover during the first 20 minutesafter the end of the stimulus CONT. However, there isa substantial DPOAE shift in the entire frequency rangebetween 25–70 minutes with a value of up to 8 dB. Thissubject shows a similar effect at 2.1 kHz for the stimulusIMP+CONT.
C. DPOAE group results
Figure 6 shows the average DPOAE-shift across sub-jects for stimuli CONT and IMP+CONT. For each stim-ulus the results from left and right ears are grouped to-gether. Averages are calculated in intervals of 30 sec-onds. Intervals are accepted if they include data fromat least 10 subjects. It can be seen that the continu-
ous noise exposure has a maximum DPOAE shift of ap-proximately 5 dB in the range 2 < Fgmean [kHz]< 3.15during the first 10 minutes of the recovery, whereas theimpulsive+continuous noise exposure shows no evidentDPOAE-shift.A two-way ANOVA analysis is performed to study
whether there are significant differences between theDPOAE levels from stimuli CONT and IMP+CONTthroughout the experiment. The factors are: (1) noisestimulus – CONT/IMP+CONT; and (2) frequency (16levels). The analysis is done in time intervals of 5and 10 minutes during the recovery. Differences in pre-exposure and final DPOAE levels are also evaluated.The analysis is done by comparing the DPOAE lev-els from both stimuli measured at the same time in-terval. Significant differences between the noise stimuliare observed during the first 10 minutes of the recov-ery (F1,10528 = 70.9, p < .001), which supports the ideathat the stimulus CONT had a bigger impact on DPOAElevels than the stimulus IMP+CONT. These differencesdisappear throughout the rest of the recovery, except atthe time interval 45–50 minutes (F1,5568 = 8.8, p < .01).There is a main effect in frequency for all the intervals(d.f. = 15, F > 29.32, p < .001), meaning that subjects
have significantly higher DPOAE levels at some frequen-cies than others.
1. Sex differences
Male subjects have slightly higher pre-exposureDPOAE levels (mean±SD, 3.12 ± 5.42 dB) than femalesubjects (2.48±5.03 dB). The results of a 2-way ANOVAanalysis of factors (1) gender –male/female; and (2) fre-quency –16 levels, indicate that the differences are sta-tistically significant for the two main effects and theirinteraction (gender: F(1,4046) = 18.41, p < .001; fre-quency: F(15,4064) = 36.91, p < .001; gender by fre-
quency : F(15,4064) = 18.56, p < .001).During the first 10 minutes of the recovery, the stim-
ulus CONT produced a higher DPOAE shift [dB] infemale subjects (2.37 ± .95 dB) than in male subjects(1.58 ± .87 dB). According to a 2-way ANOVA analy-sis with the same aforementioned factors the differencesare statistically significant (gender: F(1,560) = 209.4,p < .001; frequency: F(15,560) = 26, p < .001; gender
by frequency : F(15,560) = 12.3, p < .001). The exactopposite was the case for the stimulus IMP+CONT, asthe DPOAE shift during the first 10 minutes was higherfor male subjects(1.18 ± .84 dB) than for female sub-jects (.8 ± .72 dB). The differences are statistically sig-nificant (gender: F(1,560) = 56.3, p < .001; frequency:F(15,560) = 12.9, p < .001; and gender by frequency :F(15,560) = 9.7, p < .001).
2. Probe-fitting effect
It is studied whether (1) reinserting the sound probein the ear canal of the subjects influenced the assess-ment of DPOAE levels; and (2) final DPOAE levels werecompletely recovered by the end of the experimental ses-sion. The variability of DPOAE levels from repeatedmeasurements is studied during the determination of pre-exposure levels. On average, the SD of four refitted/non-refitted measurements is below 1.5 dB for all testedfrequencies. The group-average pre-exposure and finalDPOAE levels from stimuli CONT and IMP+CONT areshown in Figure 7. The figure also shows the averagenoise level during the measurements. The difference be-tween DPOAE level and noise level (the S/N) is between8 and 14 dB, which suggests reliable DPOAE measure-ments (Lonsbury-Martin et al., 1993) A balanced four-way ANOVA analysis was performed with the follow-ing factors: (1) determination time – pre-exposure/final;(2) fitting effect – refitted/non-refitted; (3) noise stimu-lus – CONT/IMP+CONT; and (4) frequency (16 levels).There are no significant differences for the following maineffects: (1) determination time, meaning that DPOAElevels recovered completely by the end of each expo-sure; (2) fitting, indicating that reinsertions of the soundprobe in the ear canal did not influence the assessmentof DPOAE levels; and (3) stimulus. There are howeversignificant differences across frequency (F15,1981 = 17.12,p < .001), which means that subjects have significantly
Effect of noise on otoacoustic emissions 6

FIG. 5. DPOAE levels of six subjects after exposure to stimuli CONT and IMP+CONT (color online). The number and earof the subject are shown at the top-right corner. Results from the stimulus CONT are presented first followed by results fromIMP+CONT. The abscissa corresponds to the geometric mean of the primaries. Top: DPOAE levels at specific instants duringthe course of the experiment. Bottom: DPOAE shift as a function of time after the end of the exposure.
Effect of noise on otoacoustic emissions 7

Tim
e a
fte
r e
xp
osu
re [
min
ute
s]
Fgmean
[kHz]
Continuous
1.25 1.6 2 2.5 3.15 4 5
0
10
20
30
40
50
60
70
80
90
100
Impulsive + continuous
DP
OA
E s
hift [d
B]
1.25 1.6 2 2.5 3.15 4 5
0
10
20
30
40
50
60
70
80
90
100 −1
0
1
2
3
4
5
LEX,8h
= 80 dBA LEX,8h
= 75 + 5penalty
= 80 dBA
FIG. 6. Group-average DPOAE-shift from continuous and impulsive+continuous noise exposures shown as a function of thegeometric mean of the primaries and the determination time after exposure (color online).
1.25 1.6 2 2.5 3.15 4 5−10
−5
0
5
10
DP
OA
E [dB
]
Fgmean
[kHz]
Pre−exp
Final
FIG. 7. Average pre-exposure and final DPOAE levels for thestimuli CONT (continuous lines) and IMP+CONT (dashedlines). Final levels were measured 100 minutes after the ex-posure. Errorbars show SD across subjects. The thin greylines at the bottom correspond to the average noise levels.
higher DPOAE levels at some frequencies than others.There are no significant interactions between the factors.
3. DPOAE-shift comparison between maxima and minima of
the fine structures
It is studied whether the maxima and minima ofthe DPOAE fine-structures are systematically affectedin a different manner after exposure to stimuli CONTand IMP+CONT. First, it is identified for each subjectwhether the 2f1−f2 DP points from measurements with
low frequency-resolution correspond to either a maxi-mum or minimum in the fine structures of measurementswith high-resolution. Next, the DPOAE-shift along therecovery of those DP points identified as maxima areselected and grouped together. The same is done forthe minima. Finally, the DPOAE-shift of the maximaand minima of all subjects are combined in their respec-tive group. In total, 61 DP-points were identified asmaxima and 73 as minima. Figure 8 shows the meanDPOAE-shift of the maxima and minima from stimuliCONT and IMP+CONT. The analysis is done in five-minute intervals along the recovery in order to have sim-ilar number of observations between intervals. It can beseen that: (1) the maxima and minima from stimulusCONT show a bigger DPOAE-shift than IMP+CONT;(2) for stimulus CONT, the maxima show a slightly big-ger DPOAE-shift along the recovery than the minima;and (3) for IMP+CONT there are no evident differ-ences between the maxima and minima. Table II showsthe results of a three-way ANOVA analysis from thedata in Figure 8. The factors are: (1) noise stimulus –CONT/IMP+CONT; (2) DP location –maxima/minima;and (3) recovery interval –eight levels. There are inter-actions between the factors noise stimulus-by-DP loca-
tion and noise stimulus-by-recovery interval. Accordingto Figure 8, these interactions mean that the differencesbetween the maxima and minima of the fine structures,as well as across intervals, are statistically significant onlyin the case of the continuous exposure. This result sup-ports the idea that the continuous exposure had a biggerimpact on DPOAE levels.
Effect of noise on otoacoustic emissions 8

0 10 20 30 40 50 60 70
−2
0
2
4
Continuous
DP
OA
E s
hift [d
B]
MaxMin
0 10 20 30 40 50 60 70
−2
0
2
4
Impulsive + continuous
DP
OA
E s
hift [d
B]
Time after exposure [minutes]
FIG. 8. DPOAE-shift comparison between the maxima andminima of the DPOAE fine structures from stimuli CONT(top) and IMP+CONT (bottom). The abscissa correspondsto the time after the end of the exposure. Errorbars show theSD across subjects.
TABLE II. Three-way-ANOVA analysis for the data inFigure 8. The factors are: (1) noise stimulus –CONT/IMP+CONT; (2) location –maxima/minima; and (3)recovery interval –eight levels. � = 0.05.
factor d.f. F p-valuenoise stimuli 1 165.8 < .001location 1 105.2 < .001interval 7 55.2 < .001stimuli * location 1 143.5 < .001stimuli * interval 7 20.6 < .001location * interval 7 1.8 .08
IV. DISCUSSION
The present study is restricted to evaluate temporarychanges on the hearing of the subjects – and therefore re-versible. The underlying mechanisms between temporaryand permanent shifts are likely to be physiologically dif-ferent, as indicated by Nordmann et al. (2000) for hear-ing thresholds and Lapsley Miller and Marshall (2006) forOAEs. In this sense, our results cannot be directly ex-trapolated to prolonged exposures in real industrial set-tings. However, the presence of a higher temporary shiftin one of the stimuli may be understood as a higher riskof a permanent shift.Individual results show that there is a high inter-
subject variability on DPOAEs after exposure to stim-uli CONT and IMP+CONT. These differences are seenin: (1) which stimulus produced the biggest DPOAE-shift; (2) the magnitude of the shift; and (3) the fre-quency specificity of the shift. As the SD in the Lear
between subjects is ±0.7 dB in the worst ear, we at-tribute the variability in our results to individual suscep-tibility and not to differences in the presentation levelacross subjects. This inter-subject variability has also
been reported by other researchers who in similar exper-iments measured overexposure effects in either DPOAE(Engdahl and Kemp, 1996; Reuter et al., 2007; Marshallet al., 2001) or TTS (Quaranta et al., 1998). It also illus-trates how difficult it can be to estimate with precisionthe risk posed by exposure to noise on individuals, andevidences the need for statistical methods to predict therisk of NIHL in the population (Henderson et al., 1993).Moreover, the statistically-significant sex differences de-scribed in section III.C.1 must be understood as a furthercharacterization of our group of subjects. However, withour small number of subjects there is hardly sufficientstatistical strenght to generalize these differences to abroader population.Four subjects show an abnormal DPOAE recovery pat-
tern after exposure to either one of the noise stimuli orboth (e.g., subject 3 in Figure 5). For these subjects themaximum shift on DPOAE levels does not occur immedi-ately after the noise exposure. Instead, it occurs abruptlyduring the late part of the recovery. These abrupt in-crements are revealed at the beginning of each measur-ing macro, and they remain present during the wholemeasurement period of the macro. A further analysis ofthese subjects showed that there were statistically signif-icant differences in the presentation level of the primariesL1 and L2 across measurement intervals, which in somecases were in the order of ±3 dB at some frequencies.These differences indicate a misadjustment of the probefitting during the measurements which may influence theassessment of DPOAE levels. Therefore, we attributethese abnormalities to a measurement error relating todifferences in the probe fitting, and not to a physiologi-cal change in the inner ear. Further, this measurementerror could be responsible for the significant differenceobserved between the DPOAE levels from both stimuli45–50 minutes after the exposure in section III.C.
Group results in Figure 6 show that the continuous
exposure (CONT), normalized to an exposure level of80 dBA, lead to a maximum DPOAE shift of approxi-mately 5 dB in the frequency range 2–3.15 kHz duringthe first 10 minutes of the recovery. Whereas the impul-
sive+continuous exposure (IMP+CONT), normalized to75 + 5dBpenalty dBA, lead to no evident DPOAE shift.Therefore, the +5 dB penalty failed in predicting that theDPOAE shift from the stimuli CONT and IMP+CONTcould be compared. For this reason, we conclude thatfor our stimuli (1) the +5 dB penalty overestimated theeffects on DPOAE levels; and (2) the EEH might be abetter predictor of the DPOAE shift.Whether this conclusion can be extrapolated to other
types of impulsive noise still needs to be evaluated. Nev-ertheless, similar results may be expected for impulsesnot exceeding 117 dBC peak SPL with either (1) dif-ferent spectral content; or (2) presented at lower repeti-tion rates. In the first case, impulses with a dominantspectral content in the mid frequency range (2–5 kHz),like the ones used in our experiment, are considered tobe more hazardous to hearing than impulses with spec-tral energy concentrated at lower or higher frequencies.This statement is based on the results by Patterson et al.
(1993), who exposed groups of chinchillas to narrow-band
Effect of noise on otoacoustic emissions 9
impulses of different spectral content. They concluded,based on audiometric measurements and estimations ofOHC loss, that impulses with spectral energy in the midfrequency range produced the highest damage. In thesecond case, human and animal data from both TTS andPTS studies have shown that a repetition rate of one im-pact per second may pose the highest auditory hazard(Tremolires and Hetu, 1980; Danielson et al., 1991; Hen-derson et al., 1991). This is because impacts within thisrange are not attenuated by the middle-ear reflex andpose the highest rate of acoustic stress to the inner ear.The repetition rate of 0.5 impulses per second used inthis study is approximately the same as the one consid-ered the most harmful, and therefore, lower repetitionrates might not pose a higher hazard.
Results from the present study suggest that the risk ofNIHL from impulsive exposures with peak levels below117 dBC may be reasonably predicted according to theEEH. This is in agreement with the results by Surovovet al. (2001), who compared the hearing levels of forgehammering workers in two different industrial plants, andstudied whether the degree of hearing loss could be pre-dicted according to ISO 1999:1990. The equivalent A-weighted levels in both plants were approximately thesame, but the degree of impulsiveness varied significantly.The degree of hearing loss of workers exposed to low-levelimpulses (113-120 dBC) could be predicted according tothe standard; whereas the group exposed to higher peaklevels (115-143 dBC) showed a significantly higher hear-ing loss. These results indicate that the peak level ofthe impulse may be a critical factor in the developmentof hearing loss. The authors concluded that the +5 dBpenalty may be more suitable for noises with peak levelsabove 120 dBC. Our results agree with their conclusionand extend their findings to DPOAEs.
Acknowledgments
This work has been supported by the Danish ResearchCouncil for Technology and Production. The authorswould like to thank all the subjects who participated inthe test for their constant and positive attitude. Specialthanks also to the reviewers of this manuscript for theirhelpful comments.
Arbejdstilsynet (2003). “At-vejledning D.7.4. maling af støjpa arbejdspladsen (D.7.4. assessment of noise at the work-place)”, Arbejdstilsynet, url:http://www.at.dk/ (date lastviewed 9/1/10).
Atherley, G. R. C. and Martin, A. M. (1971). “Equivalent-continuous noise level as a measure of injury from impactand impulse noise”, Ann Occup Hyg 14, 11–28.
Christensen, F. and Møller, H. (2000). “The design of valde-mar: an artificial head for binaural recordings purposes”,Proceedings of 109th Audio Engineering Society Conven-tion, September 22-25, 2000, L.A., California, USA .
Danielson, R., Henderson, D., Gratton, M. A., Bianchi, L.,and Salvi, R. (1991). “The importance of temporal patternin traumatic impulse noise exposures”, J. Acoust. Soc. Am.90(1), 209–18.
Emmerich, E., Richter, F., Reinhold, U., Linss, V., and Linss,W. (2000). “Effects of industrial noise exposure on distor-tion product otoacoustic emissions (DPOAEs) and hair cellloss of the cochlea - long term experiments in awake guineapigs”, Hearing Research 148, 9–17.
Engdahl, B. and Kemp, D. T. (1996). “The effect of noiseexposure on the details of distortion product otoacousticemissions in humans”, J. Acoust. Soc. Am. 99, 1573–87.
Erdreich, J. (1986). “A distribution based definition of im-pulse noise”, J. Acoust. Soc. Am. 79(4), 990–98.
Gaskill, S. A. and Brown, A. M. (1990). “The behaviour ofthe acoustic distortion product, 2f1 − f2, from the humanear and its relation to auditory sensitivity”, J. Acoust. Soc.Am 88(2), 821–39.
Guberan, E., J.Fernandez, Cardinet, J., and Terrier, G.(1971). “Hazardous exposure to industrial impact noise”,Ann Occup Hyg 14, 345–50.
Henderson, D., Subramaniam, M., and Boettcher, A. F.(1993). “Individual susceptibility to noise-induced hearingloss: An old topic revisited”, Ear and Hearing 14(3), 152–68.
Henderson, D., Subramaniam, M., Gratton, M. A., and Saun-ders, S. S. (1991). “Impact noise: The importance of level,duration and repetition rate”, J. Acoust. Soc. Am. 89 (3),1350–57.
ISO 1999:1990 (1990). “Acoustics–determination of occupa-tional noise exposure and estimation of noise-induced hear-ing impairment”, International Organization for Standard-ization (ISO), Geneva, Switzerland.
Kardous, C. A., Franks, J. R., and Davis, R. R. (2005).“NIOSH/NHCA best-practices workshop on impulsivenoise”, Noise Control Eng. J. 53 (2), 53–60.
Kemp, D. T. (1986). “Otoacoustic emissions, travelling wavesand cochlear mechanisms”, Hearing Research 22, 95–104.
Lapsley Miller, J. A. and Marshall, L. (2006). Otoacoustic
emissions as a preclinical measure of noise-induced hearing
loss and susceptibility to noise-induced hearing loss (ThiemeMedical Publishers, Inc, New York), in Otoacoustic Emis-sions: Clinical Applications; by M. S. Robinette and T. J.Glattke, 321–43.
Lonsbury-Martin, B., McCoy, M., Whitehead, M., and Mar-tin, G. (1993). “Clinical testing of distortion-product otoa-coustic emissions”, Ear Hear 14, 11–22.
Marshall, L., Miller, J. A. L., and Heller, L. M. (2001).“Distortion-product otoacoustic emissions as a screeningtool for noise-induced hearing loss”, Noise & Health 3(12),43–60.
Martin, A. (1976). The equal energy concept applied to im-
pulse noise, in: The Effects of Noise on Hearing; edited byD. Henderson, R. P. Hamernik, D. S. Dosanjh and J. Mills,(Raven Press, New York), 421–53.
Møller, A. R. (2006). Hearing: anatomy, physiology, and dis-
orders of the auditory system, 2nd edition (Academic Press,San Diego, CA), 181–92.
Møller, H. (1992). “Fundamentals of binaural technology”,Applied acoustics, 36(3-4), 171–218.
Nordmann, A., Bohne, B., and Harding, G. (2000).“Histophatological differences between temporary and per-manent threshold shift”, Hearing Res 139, 13–30.
Ordonez, R. (2005). “Temporary changes in human hear-ing caused by intense sounds”, Ph.D. Dissertation, AalborgUniversity (Denmark), 196–202.
Passchier-Vermeer, W. (1968). “Hearing loss due to expo-sure to steady-state broadband noise”, Institute for PublicHealth Eng, The Netherlands Report No. 36.
Passchier-Vermeer, W. (1971). Steady-state and fluctuating
Effect of noise on otoacoustic emissions 10
noise: its effect on the hearing of people, in OccupationalHearing Loss, edited by D. W. Robinson (New York, Aca-demic Press).
Patterson, J. H., Hamernik, R. P., Hargett, C. E., andAhroon, W. A. (1993). “An isohazard function for impulsenoise”, J Acoust Soc Am 93(5), 2860–69.
Price, G. R. (1981). “Implications of a critical level in the earfor assessment of noise hazard at high intensities”, J AcoustSoc Am 69, 171–7.
Probst, R., Lonsbury-Martin, B. L., and Martin, G. K.(1991). “A review of otoacoustic emissions”, J. Acoust.Soc. Am. 89, 2027–67.
Quaranta, A., Portalatini, P., and Henderson, D. (1998).“Temporary and permanent threshold shift: An overview”,Scand. Audiol. 27, 75–86.
Reuter, K. and Hammershøi, D. (2006). “Distortion productotoacoustic emission fine structure analysis of 50 normal-hearing humans”, J. Acoust. Soc. Am. 120, 270–79.
Reuter, K., Ordonez, R., and Hammershøi, D. (2007). “Over-exposure effects of a 1 khz tone on the distortion productotoacoustic emission in humans”, J. Acoust. Soc. Am. 94,378–86.
Saunders, J. C., Cohen, Y. E., and Szymko, Y. M. (1991).“The structural and functional consequences of acoustic in-jury in the cochlea and peripheral auditory system: A fiveyear update”, J Acoust Soc Am 90(1), 136–46.
Sulkowski, W. J. and Lipowczan, A. (1982). “Impulse noise-induced hearing loss in drop forge operators and the energy
concept”, Noise Control Eng 18, 24–29.Surovov, G., Denisov, E., Antipin, V., Kharitonov, V., Stark,J., Pyykko, I., and Toppila, E. (2001). “Effects of peaklevels and number of impulses to hearing among forge ham-mering workers”, Applied Occupational and EnvironmentalHygiene 51, 816–22.
Taylor, S. M., Lempert, B., Pelmear, P., Hemstock, I., andKershaw, J. (1984). “Noise levels and hearing thresholdsin the drop forging industry”, J. Acoust. Soc. Am. 76(3),807–19.
Thiery, L. and Meyer-Bisch, C. (1988). “Hearing loss due topartly impulsive industrial noise exposure at levels between87 and 90 dB(A)”, J. Acoust. Soc. Am. 84(2), 651–59.
Tremolires, C. and Hetu, R. (1980). “A multi-parametricstudy of impact noise-induced TTS”, J. Acoust. Soc. Am.68(6), 1652–59.
Voigt, P., Godenhielm, B., and Ostland, E. (1980). “Impulsenoise-measurement and assessment of the risk of noise in-duced hearing loss”, Scand. Audiol. Suppl. 12 (1), 319–25.
Von Gierke, H. E., Robinson, D. W., and Karmy, S. J. (1982).“Results of a workshop on impulse noise and auditory haz-ard”, Journal of Sound and Vibration 83(4), 579–84.
Whitehead, M. L., McCoy, M. J., Lonsbury-Martin, B. L.,and Martin, G. K. (1995). “Dependence of distortion-product otoacoustic emissions on primary levels in normaland impaired ears. I. effects of decreasing L2 below L1”, J.Acoust. Soc. Am. 97, 2346–58.
Effect of noise on otoacoustic emissions 11

98
19th INTERNATIONAL CONGRESS ON ACOUSTICS
MADRID, 2-7 SEPTEMBER 2007
OPTIMIZATION OF DISTORTION PRODUCT OTOACOUSTIC EMISSION (DPOAE) MEASUREMENTS WITH THE COMMERCIAL SYSTEM ILO96
PACS: 43.64.Jb Aranda de Toro, Miguel Angel; Ordoñez, Rodrigo; Hammershøi, Dorte
Acoustics, Dept. of Electronic Systems, Aalborg University; Fredrik Bajers Vej 7 B5, DK-9220 Aalborg Ø, Denmark: [email protected]; [email protected]; [email protected] ABSTRACT Measurements of distortion product otoacoustic emissions (DPOAEs) at Aalborg University are performed with the commercial system ILO96 from Otodynamics. The default measuring setup is not adequate for monitoring the recovery of DPOAEs after noise exposure because (1) data collection is interrupted repeatedly due to the operating mode of the system and (2) it is desired to have control over the presentation order of the primaries f1 and f2, which in the default setup are always presented in an ascending sweep. An optimized setup has been programmed with the ILO96. The setup is able to continuously measure up to 16 user-defined pairs of primaries in a loop mode. Furthermore, a systematic error was found in a particular setup of the system consisting of a mismatch between the primaries programmed to be measured and the ones actually measured. The error was reported to Otodynamics, who verified that the error occurs for this particular model. The ILO96 is no longer under production but it is still widely used for both clinical and research purposes. Therefore, this presentation will explain the new optimized setup as well as the error in the system. INTRODUCTION Measurements of distortion product otoacoustic emissions (DPOAEs) at the section of Acoustics of Aalborg University are performed with the commercial system ILO96 from Otodynamics1 [1, 2, 3]. It is intended to use the system in future experiments to study how DPOAEs in human subjects are affected after over-exposure to a noise of moderate level. It is known from literature that the level of the DPOAEs is reduced after noise over-exposure and it will recover gradually depending on the severity and characteristics of the exposure [4]. Therefore, if these changes are to be monitored a fast measurement method able to continuously track the DPOAE levels in the frequency range under measurement is necessary. The default setup of the ILO96 is adequate for measurements in which the properties of the DPOAE remain constant over the measuring period; however, it introduces some limitations when the properties of the DPOAE change with time (like as a result of noise over-exposure). Thus, the motivation behind this work has been to program a new setup with the ILO96 suitable for measurements of the recovery of DPOAE after noise over-exposure. The requirements for the new setup imply the control over the following parameters:
• Frequency value of the primaries f1 and f2 to be presented • Presentation order of the primaries f1 and f2 • Level of the primaries L1 and L2, and frequency ratio f2/ f1 • Possibility to collect data continuously over a specified measurement period • The system must be able to detect fine structures of the DPOAE
Furthermore, during the optimization process a systematic error was found in a particular setup of the ILO96.
1 http://www.oae-ilo.co.uk/enter.asp
This manuscript starts with a description of the default setup as well as the limitations that it introduces in the assessment of the recovery of DPOAE after noise exposure. Next, the optimized setup and its features are introduced. Finally, the systematic error is explained in detail. DEFAULT DPOAE MEASUREMENT SETUP OF THE ILO96 The default setup of the ILO96 for measurements of DPOAE presents a pair of primaries f1 and f2 and displays the level of the distortion product located at 2f1- f2 as it is the most prominent for most of the subjects [5]. The primaries are always swept in an ascending manner (from low to high frequencies) in a frequency range within 1-6 kHz. In the default setup the user has control over the following main parameters:
• Level of the primaries L1 and L2 • Ratio of the primaries f2/ f1 • Averaging time per each pair of primaries presented: 0.7-10 seconds • Frequency resolution: from one point per octave to 82 points per octave (so-called
“microstructure mode”) • Distortion product to be displayed: 2f1- f2, 3f1-2f2, 4f1- 3f2, 2f2- f1, 3f2- 2f1 and 4f2-3f1
Limitations of the default setup The default setup introduces the following limitations when measuring recovery of DPOAE after noise exposure:
• Operating the system requires manual navigation through different menus, which it is time consuming and interrupts data collection. When the frequency resolution of the measurement is above 17 points per octave, the ILO96 splits the frequency range from 1 kHz to 6 kHz in smaller windows (e.g., when measuring fine structures in the microstructure mode the system needs to split the measurement in 19 windows). For each one of these windows the system will first ask the user to select the starting frequency point. Next, the system calibrates the level of the primaries to be presented and tests for the correct fitting of the sound probe in the ear canal of the subject. Then, the system starts the measurement over the corresponding window; and finally, the user needs to save the data manually. The navigation through the different windows and menus to perform the measurement results in an interruption of the data collection which is undesirable when measuring the recovery of DPOAE after noise exposure.
• The user has no control over the presentation order of the primaries. The level of the DPOAE data from the recovery depends on the time in which they are measured. In the default setup the primaries are always presented in an ascending sweep which means that all the DPOAE values are measured at different instants of time with the biggest time difference between the first and the last pair of primaries presented. These time differences between primaries can be eliminated across subjects if the presentation order of the primaries is counter-balanced.
OPTIMIZED ILO96 DPOAE MEASUREMENT SETUP The ILO96 incorporates an option called “macro mode” which allows the user to program to some extent the operations to be performed by the system. In this mode the user writes a program called “macro” by using commands defined by the ILO96. Macros are written in ASCII code with either a macro editor incorporated in the ILO96 (macedit.exe) or conventional text editors. Macros need to be saved under the file name “AUTO.MAC” which will be run automatically by the ILO96 in the macro mode. The main features of the macro mode for the assessment of DPOAE recovery are:
• Possibility of programming up to 16 user-defined pairs of primaries • Measurements can be done in a loop mode during a user-defined time period • Possibility of programming L1 and L2, f2/ f1, averaging time per primaries presentation
(1.3-10 seconds) and the primary tones used for calibration The main advantage of the macro mode is that the measurement process becomes almost fully-automated, and the task of the operator is more based on supervision rather than active manipulation of the system like in the default setup. However, there are two cases during the macro execution where the system awaits for the response of the operator to continue the measurement: (1) to validate the results of the calibration and probe fitting; and (2) to confirm
19th INTERNATIONAL CONGRESS ON ACOUSTICS – ICA2007MADRID
2

saving the data. In normal circumstances these two cases together will take no longer than 10 seconds and during this time data collection is interrupted. Another advantage of the macro mode is that it introduces more flexibility in the design of a measurement protocol as it is possible to program both the values and the order of the primaries to be measured. Fine structures of the DPOAE can be measured by choosing the primaries to be presented with the appropriate frequency resolution. The main restriction of the macro mode is that the maximum number of pairs of primaries which can be programmed is sixteen. If more primaries are desired it is necessary to save the data from the previous primaries and program a new group of (up to) 16 pairs of primaries. Furthermore, the system always calibrates the levels and checks the fitting of the sound probe before a new group of primaries is presented. A description of the commands for programming macros can be found in the help file of the macro editor available in the ILO96. It is not the scope of this manuscript to explain all the possibilities of the macro mode; instead, we will show a simple macro example relating to the assessment of DPOAE recovery after noise over-exposure. In this example the system presents n user-defined pairs of primaries in a loop mode during a specific time “loop_time”. Then, the system saves the data in a file called “FileExample” and presents j new pairs of primaries. Both the ratio f2/f1 and levels L1 and L2 of the primaries are also programmed in the macro. ; ******************************************** MACRO EXAMPLE ************************************************************** ; Everything after “;” is considered a comment by the system. ;*************************************************************************************************************************************** ; SetDataFileName(FileExample) ; Data will be saved under the file name "FileExample" SetFRatio(ratio) ; Sets the f2/f1 ratio of the measurement. The permissible range of ; the ratio is 1.05:1.8 SetExpParameters(f1,f2,L1,L2) ; Parameters for the experiment (f1,f2,L1,L2)
; f1 and f2 determine the frequencies used during calibration SetCustomFreqCount(n) ; First group of n primaries to be presented (16 max) SetCustomFreq(1,f2(1)) SetCustomFreq(2,f2(2)) : ; Desired input value of f2 in Hz. The system will obtain the value of 1 according : ; to the ratio f2/f1 specified above SetCustomFreq(n-1,f2(n-1))
SetCustomFreq(n,f2(n)) SetHistoryTimeOut(loop_time) ; Total measurement time in seconds. The system will measure in a loop mode while ; measurement time < loop_time SpectralHistory(0,0,0,0,16,2) ; The meaning of the 6 parameters is: F1 freq shift (Hz) between each point (-120:120) ; F2 freq shift (Hz) between each point (-120:120) ; Level of F1 shift in dB for each point (-5:5) ; Level of F2 shift in dB for each point (-5:5) ; Number of subaverages (16 = 1.3 seconds,128 = 10 seconds) ; If “2” the system will use the custom frequencies defined above DataFileSave ; Saves data as “FileExample01” ; SetExpParameters(f1’,f2’,L1’,L2’) ; New set of parameters for the following group of primaries SetCustomFreqCount(j) ; Second group of j primaries to be presented (16 max) SetCustomFreq(1,f2’(1)) SetCustomFreq(2,f2’(2)) : : SetCustomFreq(j-1,f2’(j-1)) SetCustomFreq(j,f2’(j))) SetHistoryTimeOut(loop_time2) ; Total measurement time in seconds. The system will measure in a loop mode while ; measurement time < loop_time2 SpectralHistory(0,0,0,0,16,2) ; DataFileSave ; Saves data as “FileExample02” ; EndMacro The minimum averaging time per primaries presentation is 1.3 seconds. With this averaging time the ILO96 takes approximately 28 seconds to measure 16 pairs of primaries.
19th INTERNATIONAL CONGRESS ON ACOUSTICS – ICA2007MADRID
3

SYSTEMATIC ERROR IN THE “SPECTRAL HISTORY MODE” OF THE ILO96 A systematic error was found in a particular setup of the ILO96. The error consists of a mismatch between the primaries programmed to be measured and the ones actually measured when using the so-called “Spectral History Mode”. This mode offers the operator more control and flexibility than the default setup and it is more suitable for DPOAE experiments in which is desired to perform cyclical measurements changing specific parameters in each cycle. It was decided to study the possibilities of this mode for the optimization of the assessment of DPOAE recovery, especially because it introduces the advantage that the system does not need to split the measurement in smaller windows; which saves considerable time. Under this mode, the operator introduces the values of L1, L2 and ratio f2/f1. Moreover, the operator needs to specify two starting primaries f1 and f2 and the increment in Hz for consecutive primaries (in a range from ±12 to ±120Hz). The error occurs when the operator enables the option “constant ratio f2/f1”; which means that during the presentation of the primaries the system will increase the value of f1 depending on the increment value selected before and will obtain the new value of f2 according to the ratio f2/f1. The error occurs because the ILO96 does not update the value of f2 during the presentation of the primaries; however, in the saved data it appears that it did. The error is illustrated in figure 1 by showing different steps in the measuring process ordered from one to four. First, the system presents the first pair of primaries f1’ and f2’, measures the distortion product corresponding to 2f1’-f2’ and saves the data. Next (subfigure 1.2), the system is expected to increment the primaries to a new pair of primaries f1’’ and f2’’. However, f2’’ is not incremented even though the system saves that the values of the primaries were incremented correctly (subfigure 1.3). Instead, the system uses the previous value of f2’ to perform the measurement at 2f1’’-f2’. Note that the error results in a measurement with a smaller frequency ratio even though the saved data indicates that the primaries used were the correct ones (subfigure 1.4). The error is carried all along the measurement. This error can be critical especially for experiments studying the fine structures of the DPOAE because changes in either level or ratio of the primaries can make the fine structures appear shifted [6].
ff1’ f2’2f1’-f2’
L1’
L2’Saved data
2f1’-f2’f2’f1’
DPf2f1
2f1’-f2’f2’f1’
DPf2f1
DP
ff1’ f2’
L1’
L2’
f1’’ f2’’
L1’’
L2’’Saved data
f2’’f1’’
2f1’-f2’f2’f1’
DPf2f1
f2’’f1’’
2f1’-f2’f2’f1’
DPf2f1
ff1’ f2’
L1’
L2’
f1’’ f2’’
L1’’
L2’’Saved data
f2’’f1’’
2f1’-f2’f2’f1’
DPf2f1
f2’’f1’’
2f1’-f2’f2’f1’
DPf2f1
ff1’ f2’
L1’
L2’
f1’’ f2’’
L1’’
L2’’Saved data
2f1’’-f2’f2’’f1’’
2f1’-f2’f2’f1’
DPf2f1
2f1’’-f2’f2’’f1’’
2f1’-f2’f2’f1’
DPf2f1
2f1’’-f2’
DP
1) 2)
3) 4)
Figure 1.-Primaries presentation error in the “Spectral History Mode” when the option “constant
ratio f2/f1” is enabled
19th INTERNATIONAL CONGRESS ON ACOUSTICS – ICA2007MADRID
4

19th INTERNATIONAL CONGRESS ON ACOUSTICS – ICA2007MADRID
5
CONCLUSIONS The macro mode of the ILO96 is more appropriate for the assessment of DPOAE recovery after noise over-exposure rather than the default setup. The reason is because the macro mode allows almost full automation; it offers more flexibility in the design of a measuring protocol and it is able to measure DPOAE data continuously. The main features of the macro are:
• Possibility of programming up to 16 user-defined pairs of primaries • Measurements can be done in a loop mode • Possibility of programming L1 and L2, f2/ f1, and averaging time per primaries
presentation • With the minimum averaging time of 1.3 sec the system takes approximately 28
seconds to measure 16 pairs of primaries • Possibility to measure fine structures of DPOAE by choosing the primaries with the
appropriate frequency resolution On the other hand, there is a systematic error in the “Spectral History Mode” of the ILO96 when the option “constant ratio f2/f1” is enabled. The error consists of a mismatch between the primaries programmed to be measured and the ones actually measured. More precisely, the value of the primary f2 for a measurement n should be the value of the measurement n-1. The error has been confirmed by Otodynamics. References: [1] K. Reuter and D. Hammershøi: Distortion product otoacoustic emission fine structure analysis of 50 normal-hearing humans. Journal of the Acoustical Society of America; 120, No. 1 (2006), 270–279 [2] K. Reuter and D. Hammershøi: Distortion product otoacoustic emission of symphony orchestra musicians before and after rehearsal. Journal of the Acoustical Society of America; 121, No. 1 (2007), 327-336 [3] K. Reuter, R. Ordoñez, D. Hammershøi: Over-exposure effects of a 1 kHz tone on the distortion product otoacoustic emission in humans. Journal of the Acoustical Society of America (in print) [4] B. Engdahl and D. T. Kemp: The effect of noise exposure on the details of DPOAE in humans. Journal of the Acoustical Society of America; 99, No. 3 (1996) 1573-1587 [5] B. L. Lonsbury-Martin, F. P. Harris, M. D. Hawkins, B. B. Stagner and G. K. Martin: The clinical utility of distortion-product otoacoustic emissions. Ear Hear. 11, 144-154 [6] N. He and R. A. Schmiedt: Fine structures of the 2f1-f2 acoustic distortion product: Effects on primary level and frequency ratios. Journal of the Acoustical Society of America; 101, No 6 (1997), 3554-3565

110