Embed Size (px)
Citation preview

Aalborg Universitet
An Indicator for Separation of Structural and Harmonic Modes in Output-Only ModalTestingBrincker, Rune; Andersen, P.; Møller, N.
Published in:Proceedings of the European COST F3 Conference on System Identification & Structural HealthMonitoring, 6-9 June, 2000, Universidad Politécnica de Madrid, Spain
Publication date:2000
Document VersionPublisher's PDF, also known as Version of record
Link to publication from Aalborg University
Citation for published version (APA):Brincker, R., Andersen, P., & Møller, N. (2000). An Indicator for Separation of Structural and Harmonic Modes inOutput-Only Modal Testing. In J. A. Güemes (Ed.), Proceedings of the European COST F3 Conference onSystem Identification & Structural Health Monitoring, 6-9 June, 2000, Universidad Politécnica de Madrid, Spain(pp. 265-272). Universidad Politécnica de Madrid.
General rightsCopyright and moral rights for the publications made accessible in the public portal are retained by the authors and/or other copyright ownersand it is a condition of accessing publications that users recognise and abide by the legal requirements associated with these rights.
? Users may download and print one copy of any publication from the public portal for the purpose of private study or research. ? You may not further distribute the material or use it for any profit-making activity or commercial gain ? You may freely distribute the URL identifying the publication in the public portal ?
Take down policyIf you believe that this document breaches copyright please contact us at [email protected] providing details, and we will remove access tothe work immediately and investigate your claim.
Downloaded from vbn.aau.dk on: juni 22, 2018
An Indicator for Separation of Structural and Harmonic Modes in Output-Only Modal Testing
Rune Brincker1), Palle Andersen2
), and Nis M0ller3)
I) Department of Building Technology and Structural Engineering Aalborg University, Sohngaardsholmsvej 57, DK 9000, Aalborg, Denmark
2)Structural Vibration Solutions ApS,NOVI Science Park, Niels Jernes Vej 10, DK 9220 Aalborg East, Denmark
3) Sound and Vibration Measurement AIS, Bruel and Kjcer
Skodsborgvej 307, DK-2850, Ncerum, Denmark
SUMMARY: In this paper a technique for separation of harmonic and structural modes in output-only modal testing and identification is presented. The indicator is based on the basic differences of the statistical properties of a harmonic response and narrow-band stochastic response of a structural mode. The indicator is demonstrated on an example where a plate is loaded by an engine rotating with quasi-stationary speed. An output-only modal identification is performed using a technique based on Frequency Domain Decomposition (FDD), and what appeared to be three harmonic components and five structural modes were identified.
KEYWORDS: Rotating machinery, output-only modal testing, harmonic . components, harmonic indicator, separation of harmonics, operating conditions.
INTRODUCTION
When modal properties are to be identified from large structures or from structures in operation, usually the possibilities to control and measure the loading on the structure is rather limited. In these cases, the modal testing and identification is usually performed using response data only, and the procedure is often refened to as output-only modal testing and analysis.
Typical examples of these cases are large civil engineering structures such as buildings, bridges and offshore structures. In civil engineering this technique is also denoted ambient response testing and ambient response analysis. Several real cases of ambient response analysis can be found in Ventura and Horyna [1], and a comparison between different techniques for modal identification from ambient responses can by found in Andersen et al. [2] .
In mechanical applications the traditional methods have concentrated on techniques where the input is controlled and measured, Ewins (3], Maia et al. [4] . Usually, in this case, the tests are performed under conditions where the responses from the non-controllable loads are
265
minimised. However, in many applications in mechanical engineering, modal identification would be easier if the modal testing could take place with the structure and eventually rotating machinery in operation. In mechanical engineering this kind of identification is also denoted in-operation modal identification.
The general case considered in this paper, is a case where a structure is loaded by rotating machinery and a modal testing and identification is to be carried out based on the responses only. Thus, no artificial loading is used, the structure is loaded only by the rotating machinery and other natural sources of excitation. In many cases of output only modal testing, this problem is present. This is especially true for mechanical structures, but also in many cases civil engineering structures will have responses influenced by harmonic components.
When any rotating machinery is loading a structure, the structure is loaded by a combination of harmonic components and a stochastic background noise that looks more like a coloured white noise loading. This background noise might come from bearings in the rotating machinery, from explosions (if the rotating machinery is for instance a diesel engine) or from other sources such as vibrations from other types of equipment, traffic etc.
The response due to the stochastic loading can be treaded using the classical techniques in ambient response analysis or out-put modal identification. However, the harmonics will create some problems in the identification process. If parametric models are used, like for instance a kind of Stochastic Subspace Identification (SSI) technique, se for instance Overschee [6], then the harmonics will be identified as structural modes. For usual frequency domain techniques there is nothing in the identification process itself that clearly separates a harmonic from a narrow-band stochastic structural response. The reason is that in the frequency domain, the spectral density functions of a harmonic and a narrow banded process is not easily distinguished, This is especially true in the case where the harmonic has a slowly varying rotation frequency.
The Frequency Domain Decomposition (FDD) technique used in this paper has a natural indication of harmonics. However, even though this indicator is valuable for identification of typical harmonics, it is of great value to supplement this indication by a separate indicator for a more clear indication of harmonics. Also it is important to have a way to indicate harmonics independently of the identification technique.
In this paper a simple indication technique is presented that is based on the basic differences of the stochastic properties of a harmonic and a stochastic structural response. The indicator is demonstrated on an example where a plate is loaded by an engine rotating with quasistationary speed. An output-only modal identification is performed using a technique based on Frequency Domain Decomposition (FDD), and what appears to be three harmonic components and five structural modes are identified. The inherent indication of harmonics using the FDD technique is briefly introduced in the section about the FDD technique.
THEORETICAL BACKGROUND OF HARMONIC INDICATOR
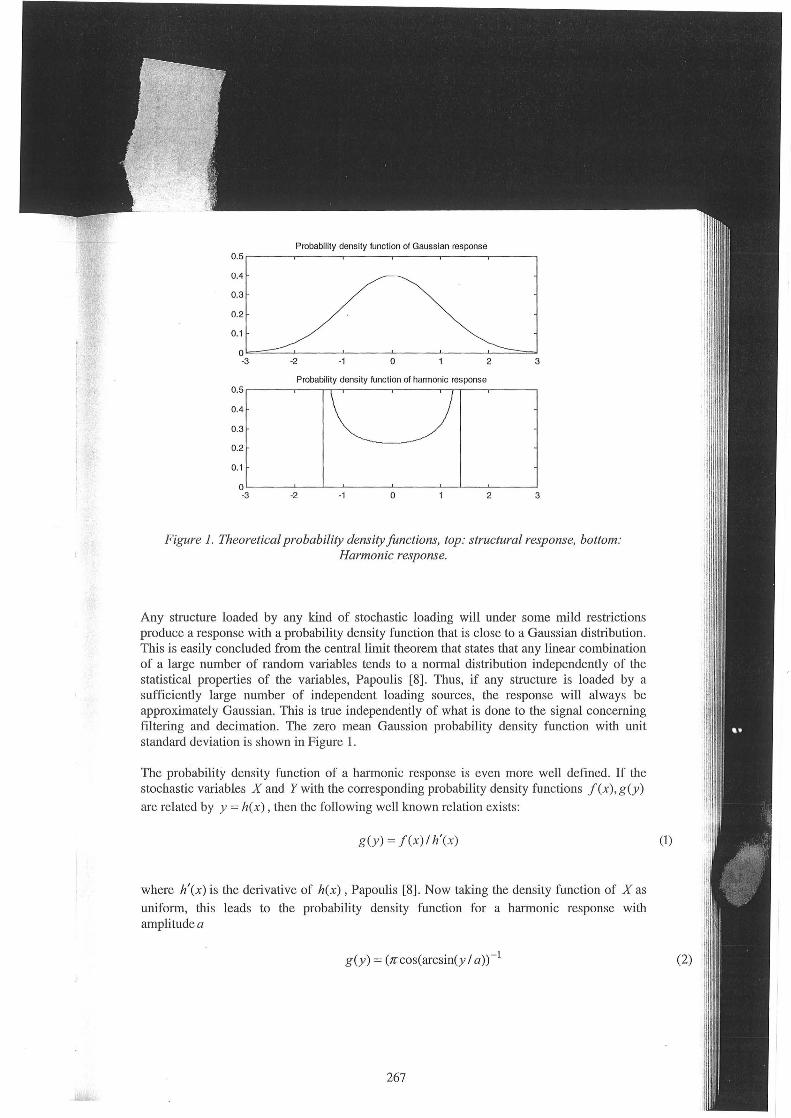
The statistical properties of a harmonic response and a stochastic structural response is quite different. The probability density function of a harmonic response is a distribution with two peaks whereas the probability density function of a stochastic structural response is a distribution with only one peak. Thus, the empirical probability density function for a mode under consideration constitutes a natvral indicator for harmonic/structural response. This basic difference was originally pointed out by Lago [7].
266
Probabili ty density function of Gaussian response 0.5 ,...---..----.----.-----.-------.------,
0.4
0.3
0.2
0. 1
0k=~-J----L---~--J----L-~~
-3 -2 -1 0 2 3
Probability density function of hannonic response
0.5~~-,---~~ 0.4
0.3
0.2
0.1
OL---J--~-L---~--J--L--L--~
-3 -2 -1 0 2 3
Figure 1. Theoretical probability density functions, top: structural response, bottom: Harmonic response.
Any structure loaded by any kind of stochastic loading will under some mild restrictions produce a response with a probability density function that is close to a Gaussian distribution. This is easily concluded from the central limit theorem that states that any linear combination of a large number of random variables tends to a normal distribution independently of the statistical properties of the variables, Papoulis (8]. Thus, if any structure is loaded by a sufficiently large number of independent loading sources, the response will always be approximately Gaussian. This is true independently of what is done to the signal concerning filtering and decimation. The zero mean Gaussion probability density function with unit standard deviation is shown in Figure 1.
The probability density function of a harmonic response is even more well defined. If the stochastic variables X and Ywith the corresponding probability density functions f(x) ,g(y)
are related by y = h(x) , then the following well known relation exists:
g(y) = f(x)/ h'(x )
where h'(x) is the derivative of h(x), Papoulis [8] . Now taking the density function of X as uniform, this leads to the probability density function for a harmonic response with amplitude a
g (y) = (Jl'cos(arcsin(y I a)) - I
267
(1)
(2)
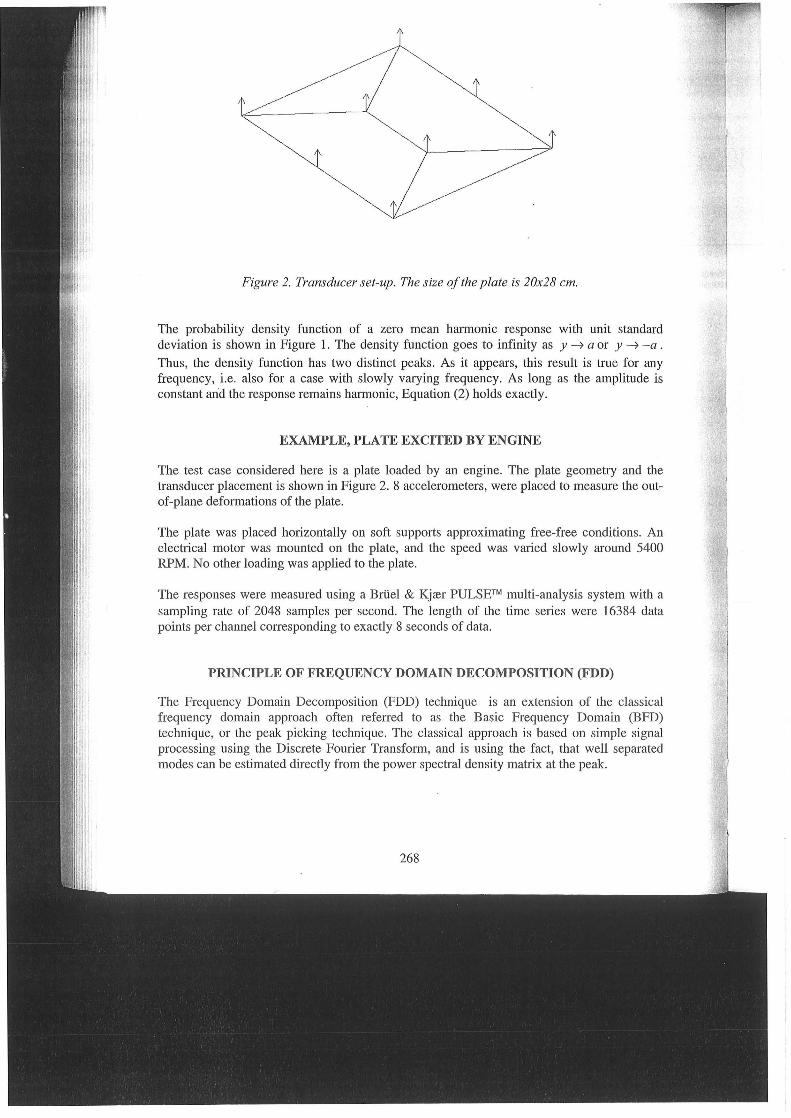
Figure 2. Transducer set-up. The size of the plate is 20x28 cm.
The probability density function of a zero mean harmonic response with unit standard deviation is shown in Figure 1. The density function goes to infinity as y -7 a or y -7 -a . Thus, the density function has two distinct peaks. As it appears, this result is true for any frequency, i.e. also for a case with slowly varying frequency. As long as the amplitude is constant and the response remains harmonic, Equation (2) holds exactly.
EXAMPLE, PLATE EXCITED BY ENGINE
The test case considered here is a plate loaded by an engine. The plate geometry and the transducer placement is shown in Figure 2. 8 accelerometers, were placed to measure the outof-plane deformations of the plate.
The plate was placed horizontally on soft supports approximating free-free conditions. An electrical motor was mounted on the plate, and the speed was varied slowly around 5400 RPM. No other loading was applied to the plate.
The responses were measured using a Briiel & Kjrer PULSE™ multi-analysis system with a sampling rate of 2048 samples per second. The length of the time series were 16384 data points per channel corresponding to exactly 8 seconds of data.
PRINCIPLE OF FREQUENCY DOMAIN DECOMPOSITION (FDD)
The Frequency Domain Decomposition (FDD) technique is an extension of the classical frequency domain approach often refetTed to as the Basic Frequency Domain (BFD) technique, or the peak picking technique. The classical approach is based on simple signal processing using the Discrete Fourier Transform, and is using the fact, that well separated modes can be estimated directly from the power spectral density matrix at the peak.
268
Averaged Normalized SVD of PSD
Frequency Dorrain Decorrpos ition Peak Acking
1 .2,_------------.-------------,-------------,---~--------,
1200 Frequency [Hz]
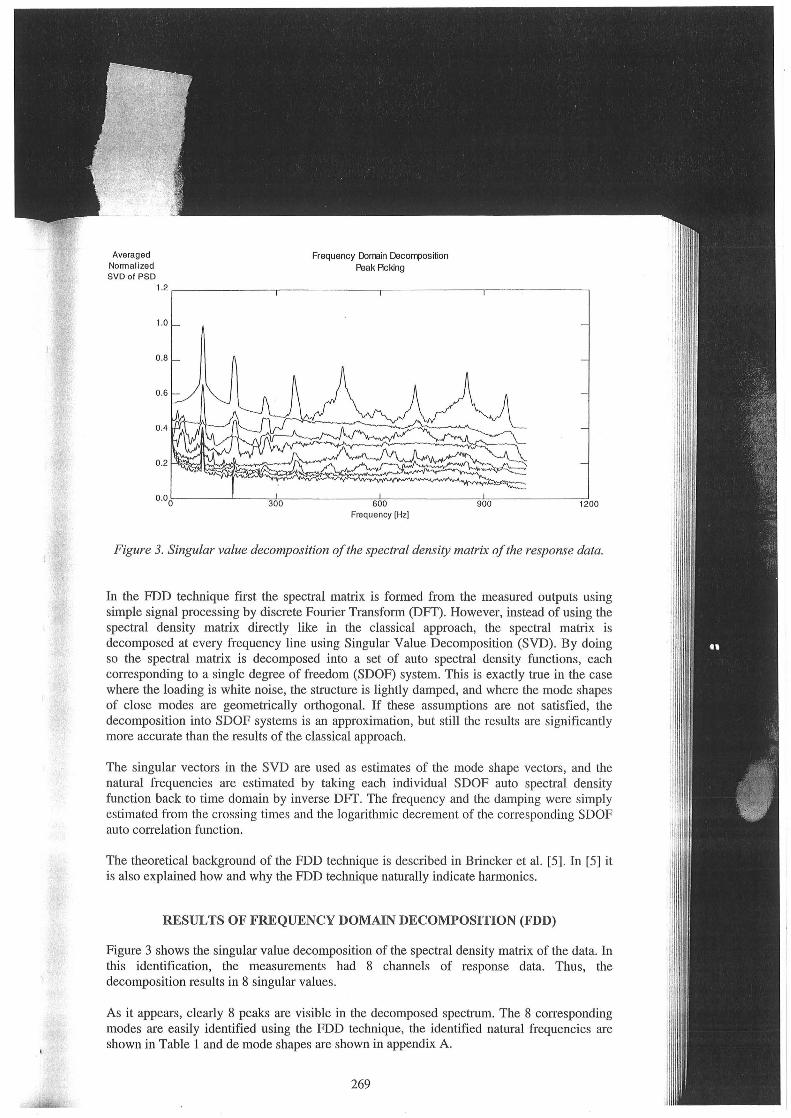
Figure 3. Singular value decomposition of the spectral density matrix of the response data.
In the FDD technique first the spectral matrix is formed from the measured outputs using simple signal processing by discrete Fourier Transform (DFT). However, instead of using the spectral density matrix directly like in the classical approach, the spectral matrix is decomposed at every frequency line using Singular Value Decomposition (SVD). By doing so the spectral matrix is decomposed into a set of auto spectral density functions, each corresponding to a single degree of freedom (SDOF) system. This is exactly true in the case where the loading is white noise, the structure is lightly damped, and where the mode shapes of close modes are geometrically orthogonal. If these assumptions are not satisfied, the decomposition into SDOF systems is an approximation, but still the results are significantly more accurate than the results of the classical approach.
The singular vectors in the SVD are used as estimates of the mode shape vectors, and the natural frequencies are estimated by taking each individual SDOF auto spectral density function back to time domain by inverse DFT. The frequency and the damping were simply estimated from the crossing times and the logarithmic decrement of the corresponding SDOF auto correlation function.
The theoretical background of the FDD technique is described in Brincker et al. [5]. In [5] it is also explained how and why the FDD technique naturally indicate harmonics.
RESULTS OF FREQUENCY DOMAIN DECOMPOSITION (FDD)
Figure 3 shows the singular value decomposition of the spectral density matrix of the data. In this identification, the measurements had 8 channels of response data. Thus, the decomposition results in 8 singular values.
As it appears, clearly 8 peaks are visible in the decomposed spectrum. The 8 corresponding modes are easily identified using the FDD technique, the identified natural frequencies are shown in Table 1 and de mode shapes are shown in appendix A.
269
: :&: : :J:: l ~] -80 -60 -40 -20 0 20 40 60 80 100 -80 -60 -40 -20 0 20 40 60 80 100
:~:: J :~ ] - ~ ~ ~ 0 ~ ~ 60 80 ~ -80 -60 -40 -20 0 20 40 60 80 100
:~:1 :~ ] -80 -60 -40 -20 0 20 40 60 80 100 -80 -60 -40 -20 0 20 ~ 60 80 100
: =z=s;;:: l ~: ] - ~ ~ ~ 0 ~ ~ 60 80 100 -80 -60 -40 -20 0 20 40 60 80 100
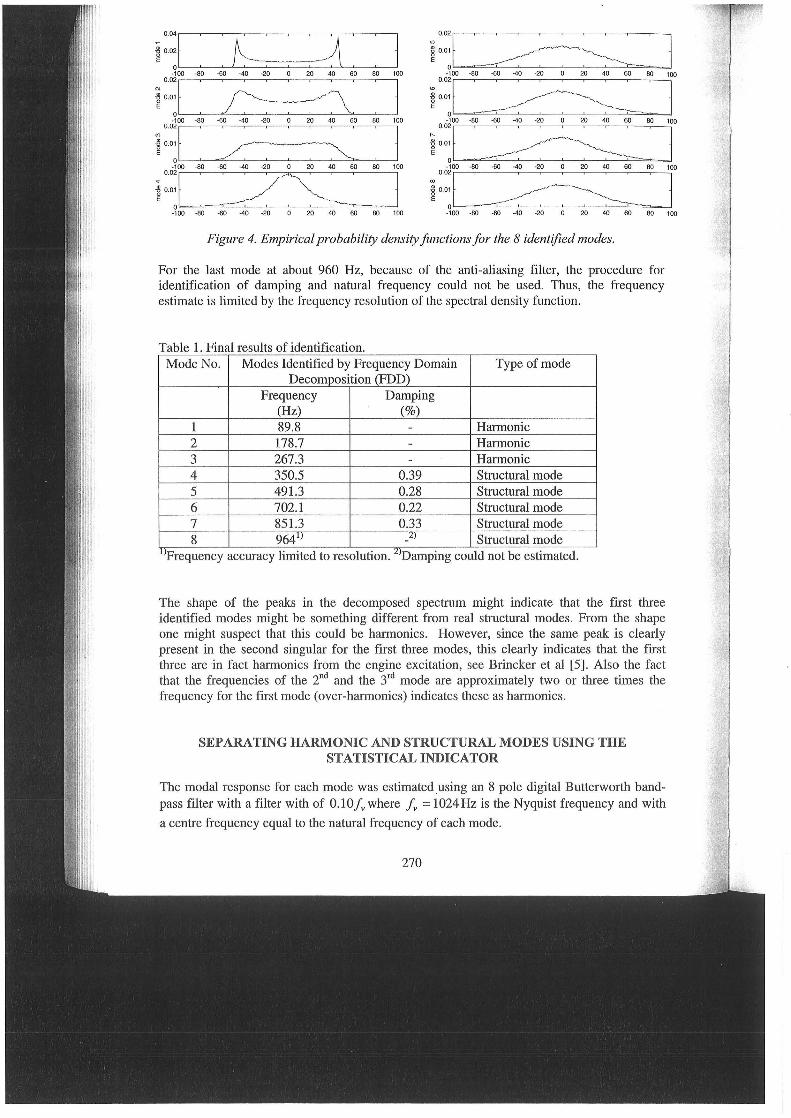
Figure 4. Empirical probability density functions for the 8 identified modes.
For the last mode at about 960 Hz, because of the anti-aliasing filter, the procedure for identification of damping and natural frequency could not be used. Thus, the frequency estimate is limited by the frequency resolution of the spectral density function.
Table 1 Final results of identification Mode No. Modes Identified by Frequency Domain Type of mode
Decomposition (FDD) Frequency Damping
(Hz) (%) 1 89.8 - Harmonic 2 178.7 - Harmonic 3 267.3 - Harmonic 4 350.5 0.39 Structural mode 5 491.3 0.28 Structural mode 6 702.1 0.22 Structural mode 7 851.3 0.33 Structural mode 8 9641) _2) Structural mode
1): L)· Frequency accuracy lumted to resolutton. Dampmg could not be estimated.
The shape of the peaks in the decomposed spectrum might indicate that the first three identified modes might be something different from real structural modes. From the shape one might suspect that this could be harmonics. However, since the same peak is clearly present in the second singular for the first three modes, this clearly indicates that the first three are in fact harmonics from the engine excitation, see Brincker et al [5]. Also the fact that the frequencies of the 2nd and the 3'd mode are approximately two or three times the frequency for the first mode (over-harmonics) indicates these as harmonics.
SEPARATING HARMONIC AND STRUCTURAL MODES USING THE STATISTICAL INDICATOR
The modal response for each mode was estimated using an 8 pole digital Butterworth bandpass filter with a filter with of O.lOfv where fv = 1024Hz is the Nyquist frequency and with
a centre frequency equal to the natural frequency of each mode.
270
J 100
J 100
J 100
J r '{
100
The empirical probability density functions for the band-pass filtered signals were then estimated. The empirical density functions are shown in Figure 4.
As it appears from the results, the three first modes are clearly identified as harmonics. For the first three modes the density functions is a double-peak distribution. For the rest of the modes the distribution is a single-peak distribution looking like a Gaussian distribution indicating the rest of the modes as structural modes.
CONCLUSIONS
The results of the identification are given in Table 1.
An indicator for separation of harmonics and structural modes in output-only identification has been defined and tested on a real case where a plate was loaded by engine rotations.
Only the mounted engine loaded the test specimen, and from the in-operational responses, 8 modes were identified using a frequency domain decomposition technique.
Using the defined indicator, the three first modes were identified as harmonics and the 5 remaining modes were identified as structural modes.
Based on 8 seconds of response data only, five structural modes and three harmonics were identified.
ACKNOWLEDGEMENTS
This investigation was carried out with assistance from Gloria Martins, Technical University of Lisbon. The good company the intellectual and the emotional support is gratefully acknowledged.
REFERENCES
[1] Ventura, Carlos E. and Tomas Horyna: "Structural Assessment by Modal Analysis in Western Canada" , Proc. of the 151
h International Modal Analysis Conference, Orlando, Florida, Orlando, 1997.
[2] Andersen, P, R. Brincker, B. Peeters, G. De Roeck, L. Hermans and C. Kramer: "Comparison of system Identification Methods Using Ambient Bridge Test Data", Proc. of the 17th International Modal Analysis Conference, Kissimee, Florida, 1999.
[3] Ewins, D.J.: "Modal Testing: Theory and Practice", Research Studies Press Ltd., John Wiley and Sons Inc., 1995
[4] Maia, N.M.M. and J.M.M. e Silva: "Theoretical and Experimental Modal Analysis", Research Studies Press Ltd., John Wiley and Sons Inc., 1997.
[5] Brincker, R., L. Zhang and P. Andersen: "Modal Identification of Output-Only Systems using Frequency Domain Decomposition", Proc. of the European COST F3 Conference on System Identification & Structural Health Monitoring, Universidad Politecnica de Madrid, Spain, 6-9 June, 2000.
[6] Overschee, Van P., and B. De Moor: " Subspace Identification for Linear Systems", Kluver Academic Publishers, 1996.
[7] Lago, T.: "The difference between harmonics and stochastic narrow band responses", oral presentation at the SVIBS symposium, Stockholm, 1997.
[8] Papoulis, A.: "Probability and Statistics", Prentice Hall International Inc., 1990.
271
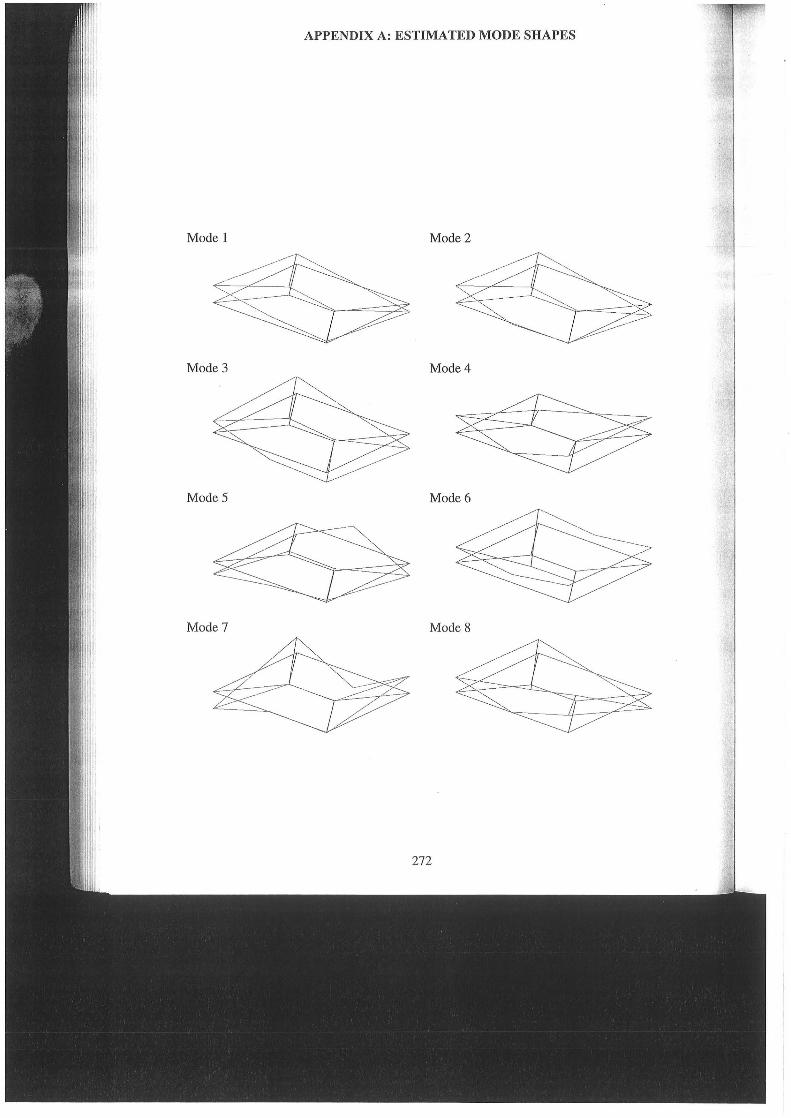
APPENDIX A: ESTIMATED MODE SHAPES
Mode 1 Mode2
Mode3 Mode4
ModeS Mode6
Mode? ModeS