Embed Size (px)
Citation preview
AAI LIMITED | CONSOLIDATED FINANCIAL REPORT 2014/15 1
AAI Limited and subsidiaries ABN 48 005 297 807
Consolidated financial report for the financial year ended 30 June 2015
Contents
Directors’ report .................................................................................................................................................. 2 Lead auditor’s independence declaration ........................................................................................................... 5 Statements of comprehensive income ............................................................................................................... 6 Statements of financial position .......................................................................................................................... 7 Statements of changes in equity ........................................................................................................................ 8 Statements of cash flows .................................................................................................................................... 9 Notes to the consolidated financial statements ................................................................................................ 10 1. Reporting entity ......................................................................................................................................... 10 2. Basis of preparation .................................................................................................................................. 10 3. Dividends .................................................................................................................................................. 11 4. Segment reporting .................................................................................................................................... 12 5. Revenue .................................................................................................................................................... 13 6. Incurred claims .......................................................................................................................................... 14 7. Other underwriting expenses .................................................................................................................... 16 8. Other expenses ......................................................................................................................................... 16 9. Income tax ................................................................................................................................................. 17 10. Receivables............................................................................................................................................... 18 11. Financial assets designated at fair value through profit or loss ................................................................ 18 12. Derivative financial instruments ................................................................................................................ 19 13. Reinsurance and other recoveries receivable .......................................................................................... 20 14. Deferred insurance assets ........................................................................................................................ 20 15. Goodwill and other intangible assets ........................................................................................................ 21 16. Other assets .............................................................................................................................................. 22 17. Payables and other liabilities .................................................................................................................... 23 18. Employee benefits liabilities ...................................................................................................................... 23 19. Unearned premium liabilities ..................................................................................................................... 25 20. Outstanding claims liabilities ..................................................................................................................... 25 21. Subordinated notes ................................................................................................................................... 30 22. Share capital ............................................................................................................................................. 30 23. Capital notes ............................................................................................................................................. 30 24. Capital management ................................................................................................................................. 31 25. Reconciliation of cash flows from operating activities .............................................................................. 33 26. Financial instruments ................................................................................................................................ 34 27. Risk management ..................................................................................................................................... 37 28. Operating lease expenditure commitments .............................................................................................. 45 29. Parent entity and subsidiaries ................................................................................................................... 46 30. Key management personnel disclosures .................................................................................................. 46 31. Other related party disclosures ................................................................................................................. 47 32. Auditor’s remuneration .............................................................................................................................. 48 33. Contingent assets and liabilities................................................................................................................ 49 34. Significant accounting policies .................................................................................................................. 49 35. Subsequent events ................................................................................................................................... 55 Directors’ declaration ........................................................................................................................................ 56 Independent auditor’s report to the members of AAI Limited ........................................................................... 57

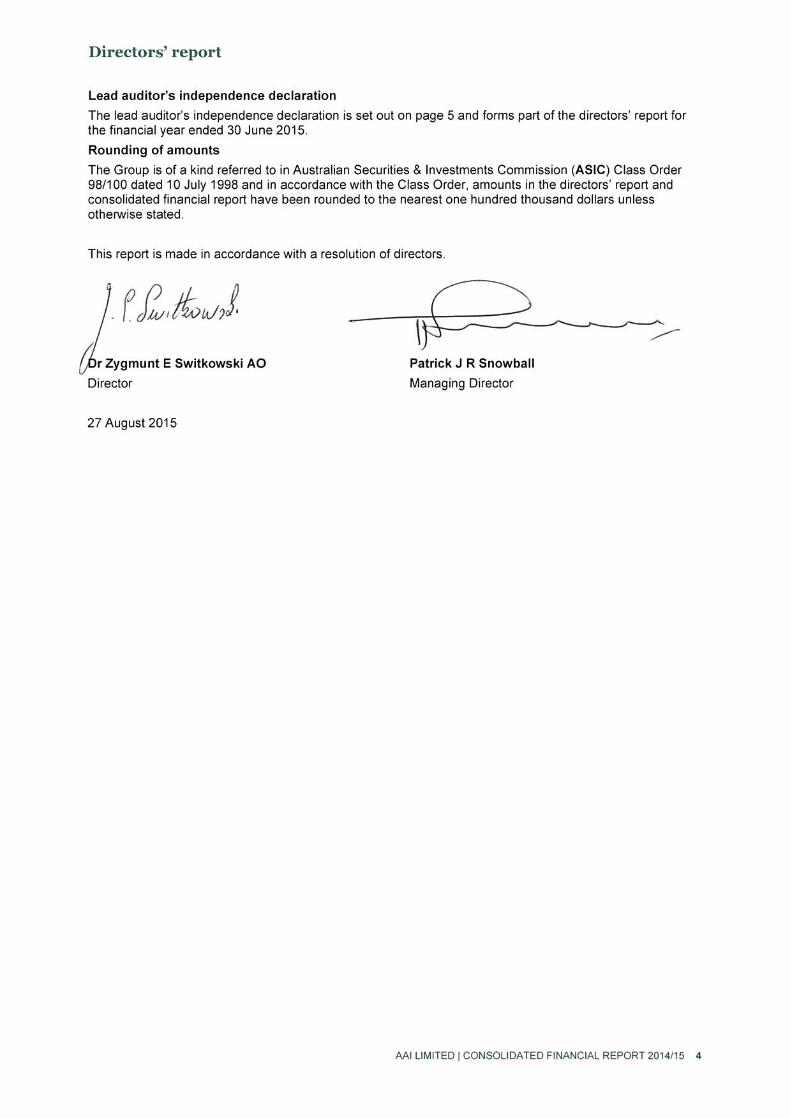
Directors’ report
AAI LIMITED | CONSOLIDATED FINANCIAL REPORT 2014/15 2
Directors’ report
The directors present their report together with the financial report of AAI Limited (the Company) and of the Group, being the Company and its subsidiaries, for the financial year ended 30 June 2015 and the auditor’s report thereon.
Directors
The directors of the Company at any time during or since the end of the financial year are:
Non-executive Dr Zygmunt E Switkowski (Chairman) Director since 2007, appointed Chairman 27 October 2011 William J Bartlett Director since 2007 Michael A Cameron Director since 2012 Audette E Exel Director since 2012 Ewoud J Kulk Director since 2003 Christine F McLoughlin Appointed 11 February 2015 Dr Douglas F McTaggart Director since 2012 Geoffrey T Ricketts Director since 2003 Ilana R Atlas Director since 2011, resigned 20 August 2014 Executive Patrick J R Snowball Director since 2009
Principal activities
The principal activities of the Group during the course of the financial year were the underwriting of general insurance and managing statutory insurance funds for external clients. The Group distributes products directly and through intermediated channels, including market leading brands AAMI, GIO, Suncorp and Vero, as well as niche brands Apia, Bingle, CIL, Insure My Ride, Just Car Insurance, Shannons, Terri Scheer, Resilium and MTA Insurance.
There were no significant changes in the nature of the activities of the Group during the financial year.
Dividends
During the financial year, the Company paid dividends on ordinary shares totalling $950.2 million (2014: $654.2 million) and on capital notes totalling $21.9 million (2014: $1.9 million).
Since the end of the financial year, the directors have declared a dividend on ordinary shares in respect of the 2015 financial year of an amount up to $327.4 million to be paid on or before 21 September 2015 and a dividend on capital notes for the quarter ending 16 September 2015 of $5.2 million to be paid on 17 September 2015.
Further details of dividends paid and capital notes are set out on note 3 to the financial statements.
Operating and financial review
Consolidated profit after tax for the year ended 30 June 2015 was $604.2 million compared to $918.6 million for the year ended 30 June 2014.
The consolidated insurance trading result was $714.7 million for the year to 30 June 2015 compared to $1,094.9 million for the year to 30 June 2014. This provided an insurance trading ratio for the current year of 10.4% (2014: 16.0%).
Net premium revenue increased by $54.9 million or 0.8%, with continued growth in the CTP portfolio offsetting slight reductions in the Motor and Home portfolios. Outwards reinsurance expense decreased 6% due to a reduction in insurance rates.
Claims expense increased by 14.0%, driven by a high level of natural hazards including the Brisbane Hailstorm, Cyclone Marcia and NSW Low Storms in late April. This was in part offset by 46.5% higher reinsurance and other recoveries, primarily as a result of the abovementioned weather events.
Total operating underwriting expenses were $1,556.1 million, decreasing 1.3%, predominantly due to a reduction in legacy simplification program costs and fire service levy costs.
Investment income on insurance funds was $373.4 million, with gains from reductions in risk-free rates partially offset by the relative underperformance of inflation-linked bonds. Investment income on shareholders’ funds was $151.1 million, with benefits from reductions in risk-free rates offset by a widening of credits spreads and low running yields, both risk-free and credit.

Directors’ report
AAI LIMITED | CONSOLIDATED FINANCIAL REPORT 2014/15 3
Significant changes in state of affairs
On 29 August 2014, the Company acquired a wholly-owned subsidiary MTA Insurance Limited (MTAIL).
During the financial year, the Suncorp Group received approval to consolidate the business of MTA Insurance Limited (MTAIL) with the Company. The Company entered into a Scheme of Arrangement (under Division 3A of Part III of the Insurance Act) to transfer the insurance assets and liabilities of MTAIL to the Company at carrying value as at 1 July 2015.
In the opinion of the directors, there were no other significant changes in the state of affairs of the Group that occurred during the financial year.
Events subsequent to reporting date
Effective 1 July 2015, the Company executed the abovementioned court approved Scheme of Arrangement to consolidate the business of the Company and MTAIL. As a result of these transactions, the Australian general insurance assets and liabilities of MTAIL were transferred to the Company.
There has not arisen in the interval between the end of the financial year and the date of this report any other item, transaction or event of a material and unusual nature likely, in the opinion of the directors of the Group, to affect significantly the operations of the Group, the results of those operations, or the state of affairs of the Group in future financial years.
Likely developments
Other than as disclosed elsewhere in this report, at the date of signing, the directors can make no further comment on any likely developments in the Group’s operations in future financial years or the expected results of these operations.
Environmental regulation
The Group’s operations are not subject to any particular or significant environmental regulations under any law of the Commonwealth of Australia or any of its states or territories. The Group has not incurred any liability (including rectification costs) under any environmental legislation.
Indemnification and insurance of officers
Indemnification
Under the Constitution of the ultimate parent entity, Suncorp Group Limited, each person who is or has been a director or officer of the Company is indemnified. The indemnity relates to all liabilities to another party (other than the Company or a related body corporate) that may arise in connection with the performance of their duties to the Company, except where the liability arises out of conduct involving a lack of good faith.
The Constitution stipulates that Suncorp Group Limited will meet the full amount of such liabilities, including costs and expenses incurred in successfully defending civil or criminal proceedings or in connection with an application, in relation to such proceedings, in which relief is granted under the Corporations Act 2001.
Insurance Premiums
During the financial year ended 30 June 2015, Suncorp Group Limited paid insurance premiums in respect of a directors' and officers' liability insurance contract. The contract insures each person who is or has been a director or executive officer (as defined in the Corporations Act 2001) of the Company against certain liabilities arising in the course of their duties to the Company. The directors have not included details of the nature of the liabilities covered or the amount of premium paid in respect of the insurance contract as such disclosure is prohibited under the terms of the contract.


Statements of comprehensive income for the financial year ended 30 June 2015
AAI LIMITED | CONSOLIDATED FINANCIAL REPORT 2014/15 6
Statements of comprehensive income
The statements of comprehensive income are to be read in conjunction with the accompanying notes.
Note2015 2014 2015 2014
$m $m $m $mPremium revenue 7,691.1 7,683.2 7,659.6 7,683.2 Outwards reinsurance premium expense 14 (795.3) (842.3) (795.3) (842.3)Net premium revenue 6,895.8 6,840.9 6,864.3 6,840.9 Claims expense (6,505.6) (5,705.0) (6,503.0) (5,705.0)Reinsurance and other recoveries revenue 13 1,410.2 962.4 1,410.1 962.4 Net incurred claims 6.1 (5,095.4) (4,742.6) (5,092.9) (4,742.6)Acquisition costs 14 (986.0) (953.1) (963.8) (953.1)Other underwriting expenses 7 (570.1) (624.0) (569.4) (624.0)Underwriting expenses (1,556.1) (1,577.1) (1,533.2) (1,577.1)Other insurance income 97.0 98.3 97.0 98.3 Underwriting result 341.3 619.5 335.2 619.5 Investment income on insurance funds 5.1 373.4 475.4 373.4 475.4 Insurance trading result 714.7 1,094.9 708.6 1,094.9 Investment income on shareholders funds 5.1 151.1 247.1 156.0 969.8 Investment expense on shareholders funds (16.0) (21.1) (15.7) (20.4)Other income 5.2 100.6 99.9 92.0 93.9 Other expenses 8 (97.6) (111.6) (97.5) (106.7)Profit before tax 852.8 1,309.2 843.4 2,031.5 Income tax expense 9.1 (248.6) (390.6) (245.7) (389.9)Profit for the financial year attributable to owners of the Company 604.2 918.6 597.7 1,641.6
Other comprehensive income (loss)Items that may be reclassified subsequently to profit or lossNet change in fair value of cash flow hedge (0.5) 1.3 (0.5) 1.3 Exchange difference on translation of foreign operation 0.3 - - - Income tax benefit (expense) 0.4 (0.4) 0.4 (0.4)
0.2 0.9 (0.1) 0.9 Items that will not be reclassified to profit or lossActuarial gains on defined benefit plans 1.8 8.5 1.3 8.0 Income tax expense (0.5) (2.5) (0.5) (2.4)
1.3 6.0 0.8 5.6 Total other comprehensive income 1.5 6.9 0.7 6.5
Total comprehensive income for the financial year attributable to owners of the Company 605.7 925.5 598.4 1,648.1
CompanyConsolidated

Statements of financial position as at 30 June 2015
AAI LIMITED | CONSOLIDATED FINANCIAL REPORT 2014/15 7
Statements of financial position
The statements of financial position are to be read in conjunction with the accompanying notes.
Note2015 2014 2015 2014
$m $m $m $mAssetsCash and cash equivalents 140.4 221.8 105.7 167.6 Receivables 10 2,598.4 2,516.4 2,569.7 2,516.7 Financial assets designated at fair value through profit or loss 11 11,467.9 12,084.6 11,400.5 12,084.6 Derivative financial instruments 12 23.7 22.9 23.7 22.9 Reinsurance and other recoveries receivable 13 1,710.9 1,376.1 1,710.8 1,376.1 Deferred insurance assets 14 1,243.4 1,185.9 1,218.3 1,185.9 Deferred tax assets 9.2 - 1.5 - - Goodwill and other intangible assets 15 84.6 54.8 22.0 22.0 Investment in subsidiaries - - 120.7 83.2 Other assets 16 137.1 122.3 115.6 107.7 Total assets 17,406.4 17,586.3 17,287.0 17,566.7
LiabilitiesPayables and other liabilities 17 1,224.3 1,514.5 1,503.4 1,788.8 Derivative financial instruments 12 153.6 149.3 153.6 149.3 Employee benefits liabilities 18 67.6 77.8 34.0 39.0 Unearned premium liabilities 19.1 4,124.2 4,083.4 4,056.3 4,083.4 Outstanding claims liabilities 20 8,750.7 8,161.7 8,748.7 8,161.7 Deferred tax liabilities 9.2 5.6 - 14.0 11.0 Subordinated notes 21 571.7 727.0 299.5 483.3 Total liabilities 14,897.7 14,713.7 14,809.5 14,716.5 Net assets 2,508.7 2,872.6 2,477.5 2,850.2
EquityShare capital 952.7 950.2 951.0 950.0 Capital notes 23 510.0 510.0 510.0 510.0 Reserves (2.2) (2.4) (2.5) (2.4)Retained profits 1,048.2 1,414.8 1,019.0 1,392.6 Total equity attributable to owners of the Company 2,508.7 2,872.6 2,477.5 2,850.2 Total equity 2,508.7 2,872.6 2,477.5 2,850.2
Consolidated Company

Statements of changes in equity for the financial year ended 30 June 2015
AAI LIMITED | CONSOLIDATED FINANCIAL REPORT 2014/15 8
Statements of changes in equity
The statements of changes in equity are to be read in conjunction with the accompanying notes.
Note2015 2014 2015 2014
$m $m $m $mShare capitalIssued capitalBalance at the beginning of the financial year 949.4 2,408.1 949.4 2,408.1 Share buyback - (1,458.7) - (1,458.7)Balance at the end of the financial year 949.4 949.4 949.4 949.4
Share based paymentsBalance at the beginning of the financial year 0.8 1.0 0.6 0.5 Share-based payments 2.5 (0.2) 1.0 0.1 Balance at the end of the financial year 3.3 0.8 1.6 0.6 Total share capital at the end of the financial year 952.7 950.2 951.0 950.0
Capital notesBalance at the beginning of the financial year 510.0 - 510.0 - Capital notes issued - 510.0 - 510.0 Balance at the end of the financial year 510.0 510.0 510.0 510.0
ReservesHedging reserveBalance at the beginning of the financial year (2.4) (3.3) (2.4) (3.3)Net change in fair value of cash flow hedge (0.1) 0.9 (0.1) 0.9 Balance at the end of the financial year (2.5) (2.4) (2.5) (2.4)
Foreign currency translation reserveBalance at the beginning of the financial year - - - - Exchange difference on translation of foreign operation 0.3 - - - Balance at the end of the financial year 0.3 - - - Total reserves at the end of the financial year (2.2) (2.4) (2.5) (2.4)
Retained profitsBalance at the beginning of the financial year 1,414.8 1,146.3 1,392.6 401.5 Profit for the financial year 604.2 918.6 597.7 1,641.6 Actuarial gains on defined benefit plans 1.3 6.0 0.8 5.6 Dividends paid 3 (972.1) (656.1) (972.1) (656.1)Balance at the end of the financial year 1,048.2 1,414.8 1,019.0 1,392.6
Total equity at the end of the financial year 2,508.7 2,872.6 2,477.5 2,850.2
Profit for the financial year 604.2 918.6 597.7 1,641.6 Movements in reserves 0.2 0.9 (0.1) 0.9 Actuarial gains on defined benefit plans 1.3 6.0 0.8 5.6 Total other comprehensive income 1.5 6.9 0.7 6.5 Total comprehensive income for the financial year 605.7 925.5 598.4 1,648.1
Consolidated Company

Statements of cash flows for the financial year ended 30 June 2015
AAI LIMITED | CONSOLIDATED FINANCIAL REPORT 2014/15 9
Statements of cash flows
The statements of cash flows are to be read in conjunction with the accompanying notes.
Note2015 2014 2015 2014
$m $m $m $mCash flows from operating activitiesPremiums received 9,158.8 8,947.4 9,134.9 8,947.4 Reinsurance and other recoveries received 1,072.0 1,178.9 1,072.0 1,178.9 Interest received 441.2 496.1 440.4 495.7 Dividends received - - 9.5 2.9 Other revenue received 279.9 327.7 278.3 328.1 Claims paid (6,510.6) (6,245.0) (6,507.6) (6,245.0) Outwards reinsurance premiums paid (879.0) (929.3) (878.0) (929.3) Acquisition costs paid (1,212.3) (1,081.7) (1,187.4) (1,081.7) Income tax paid (245.6) (331.7) (243.2) (331.7) Finance costs paid (26.1) (35.0) (26.1) (32.8) Underwriting and other operating expenses paid (1,616.9) (1,405.6) (1,578.0) (1,373.8) Net cash from operating activities 25 461.4 921.8 514.8 958.7
Cash flows used in investing activitiesNet proceeds from the sale and purchase of financial assets 689.8 (327.1) 660.8 (327.1) Acquisition of subsidiary, net of cash acquired (49.3) - (54.2) - Net cash from (used in) investing activities 640.5 (327.1) 606.6 (327.1)
Cash flows used in financing activitiesShares buyback - (402.0) - (402.0) Cash received from transfer of net assets - - - 10.1 Capital notes issued - 510.0 - 510.0 Payment on call of subordinated debts (183.0) - (183.0) - (Payments) proceeds on intercompany loans with related parties (55.4) 55.4 (55.4) 55.4 Dividends paid 3 (972.1) (656.1) (972.1) (656.1)Proceeds from other financing activities 27.2 - 27.2 - Net cash used in financing activities (1,183.3) (492.7) (1,183.3) (482.6)
Net increase in cash and cash equivalents (81.4) 102.0 (61.9) 149.0 Cash and cash equivalents at the beginning of the financial year 221.8 119.8 167.6 18.6 Cash and cash equivalents at the end of the financial year 140.4 221.8 105.7 167.6
Consolidated Company

Notes to the consolidated financial statements
AAI LIMITED | CONSOLIDATED FINANCIAL REPORT 2014/15 10
Notes to the consolidated financial statements
1. Reporting entity
AAI Limited (the Company) is a company limited by shares, incorporated and domiciled in Australia. Its registered office is Level 28, 266 George Street, Brisbane, QLD 4000.
The Company’s principal activities during the course of the financial year were the underwriting of general insurance and managing statutory insurance funds for external clients.
The consolidated financial statements of the Company for the financial year ended 30 June 2015 comprise the Company and its subsidiaries (the Group) and were authorised for issue by the Board of Directors on 27 August 2015.
The Company’s parent entity is Suncorp Insurance Holdings Limited, with Suncorp Group Limited being the ultimate parent entity. Suncorp Group Limited and its subsidiaries are referred to as the Suncorp Group.
1.1 Licence consolidation
During the financial year, the Suncorp Group received approval to consolidate the business of MTA Insurance Limited (MTAIL) with the Company. The Company entered into a Scheme of Arrangement (under Division 3A of Part III of the Insurance Act) to transfer the insurance assets and liabilities of MTAIL to the Company at carrying value as at 1 July 2015.
2. Basis of preparation
The Company and the Group are for-profit entities and the consolidated financial statements have been prepared on the historical cost basis unless the application of fair value measurements are required by the relevant accounting standards.
Significant accounting policies applied in the preparation of these financial statements are set out in note 34. There have been no significant changes to accounting policies during the financial year. None of the new accounting standards and amendments to standards that are mandatory for the first time for the financial year beginning 1 July 2014 affected any of the amounts recognised in the current period or any prior period and are not likely to affect future periods.
These financial statements are presented in Australian dollars, which is the Company’s and Group’s functional and presentation currency.
The Company is of a kind referred to in ASIC Class Order 98/100 dated 10 July 1998 and all financial information presented in Australian dollars has been rounded to the nearest one hundred thousand dollars, unless otherwise stated.
The consolidated statements of financial position are prepared in a liquidity format. Amounts expected to be recovered or settled no more than twelve months after the reporting period, are classified as ‘current’, otherwise they are classified as ‘non-current’.
Where necessary, comparatives have been restated to conform to changes in presentation in the current year.
2.1 Statement of compliance
The consolidated financial statements are general purpose financial statements which have been prepared in accordance with Australian Accounting Standards (AASB) (including Australian Interpretations) adopted by the Australian Accounting Standards Board and the Corporations Act 2001. The consolidated financial statements comply with International Financial Reporting Standards and Interpretations issued by the International Accounting Standards Board.

Notes to the consolidated financial statements
AAI LIMITED | CONSOLIDATED FINANCIAL REPORT 2014/15 11
2.2 Use of estimates and judgments
The preparation of consolidated financial statements requires management to make judgments, estimates and assumptions that affect the application of accounting policies and amounts reported in the financial statements. The estimates and associated assumptions are based on historical experience and various other factors that are believed to be reasonable under the circumstances. Estimates and underlying assumptions are reviewed on an ongoing basis. Where revisions are made to accounting estimates, any financial impact is recognised in the period in which the estimate is revised.
Significant estimates, judgments and assumptions are discussed in the following notes:
Outstanding claims liabilities and assets arising from reinsurance contracts (refer note 20.3)
Employee benefits liabilities (refer note 18)
Liability adequacy test (refer note 19.2)
Financial instruments (refer note 26)
Derivative financial instruments (refer note 12)
Insurance managed funds income (refer note 34.4 (e))
3. Dividends
The capital notes are unsecured and pay periodic, non-cumulative dividends to the holder, based on a set formula. Such dividends are at the discretion of the directors.
Consolidated and Company¢ per
share / note $m
¢ per share /
note $mOrdinary sharesDividend paid September 2014(2014: September 2013) 293.2 501.9 170.0 342.8 Dividend paid October 2014 116.8 200.0 - - Dividend paid March 2015 (2014: March 2014) 145.0 248.3 163.0 311.4 Total dividends paid on ordinary shares 555.0 950.2 333.0 654.2
Capital notes - issued on 11 February 2014September quarter 129.6 1.4 - - December quarter 127.2 1.4 - - March quarter 127.7 1.4 47.5 0.5 June quarter 122.9 1.4 128.7 1.4
507.4 5.6 176.2 1.9 Capital notes - issued on 27 June 2014September quarter 96.1 3.8 - - December quarter 105.4 4.2 - - March quarter 106.2 4.3 - - June quarter 100.8 4.0 - -
408.5 16.3 - - Total dividends paid on capital notes 915.9 21.9 176.2 1.9
Total dividends paid 972.1 656.1
Dividends declared since balance date and not recognised in the statement of financial positionOrdinary dividend of an amount up to 191.2 327.4 293.2 501.9Capital notes - issued on 11 February 2014 120.1 1.3 129.6 1.4Capital notes - issued on 27 June 2014 98.0 3.9 96.1 3.8
2015 2014

Notes to the consolidated financial statements
AAI LIMITED | CONSOLIDATED FINANCIAL REPORT 2014/15 12
4. Segment reporting
Operating segments are identified based on separate financial information which is regularly reviewed by the Group Chief Executive Officer and his immediate executive team, representing the Group’s Chief Operating Decision Maker (CODM), in assessing performance and determining the allocation of resources. The Group’s operating segments are determined based on their business activities as described in note 4.1 below.
4.1 Operating segments
The Group comprises the following operating segments:
Segment Products and services
Personal insurance Provision of personal insurance products to customers in Australia including home and contents insurance, motor insurance, boat insurance and travel insurance.
Commercial insurance Provision of commercial insurance products to customers in Australia including commercial motor insurance, commercial property insurance, marine insurance, industrial special risks insurance, public liability and professional indemnity insurance, workers’ compensation insurance, compulsory third party insurance, loan protection insurance and equity and cash benefit insurance.
Revenues and expenses occurring between segments are subject to arm’s length transfer pricing arrangements. Inter-segment transactions which are eliminated on consolidation are reported on a gross basis.
Segment results presented below are measured on a consistent basis to how they are reported to the CODM:
Revenues and expenses occurring between segments are subject to contractual agreements between the legal entities comprising each segment.
Inter-segment transactions, which are eliminated on consolidation, are reported on a gross basis. An exception exists for operating expenses incurred by one segment on behalf of another, which are recharged on a cost-recovery basis, and are presented on a net basis (post allocation basis).
4.2 Reconciliation of segment profit before tax
Consolidated2015 2014 2015 2014 2015 2014
$m $m $m $m $m $mRevenue from external customers 5,913.3 5,653.7 3,802.4 3,761.4 9,715.7 9,415.1 Total segment revenue 5,913.3 5,653.7 3,802.4 3,761.4 9,715.7 9,415.1 Segment profit before tax 337.5 765.3 576.0 578.1 913.5 1,343.4 Segment tax expense (97.4) (231.5) (168.9) (171.9) (266.3) (403.4)Segment profit after tax 240.1 533.8 407.1 406.2 647.2 940.0
Other segment disclosuresInterest income 207.1 232.1 224.3 251.5 431.4 483.6 Interest expense (14.6) (22.5) (10.9) (12.5) (25.5) (35.0)Depreciation and amortisation expense (5.5) (8.5) (5.9) (7.5) (11.4) (16.0)Goodwill 35.3 35.3 41.6 19.5 76.9 54.8
Personal Commercial Total
Consolidated 2015 2014$m $m
Segment profit before tax 913.5 1,343.4 Share of profit of equity accounted investees 8.3 4.8 Other corporate expenses (69.0) (39.0)Profit before tax 852.8 1,309.2
Notes to the consolidated financial statements
AAI LIMITED | CONSOLIDATED FINANCIAL REPORT 2014/15 13
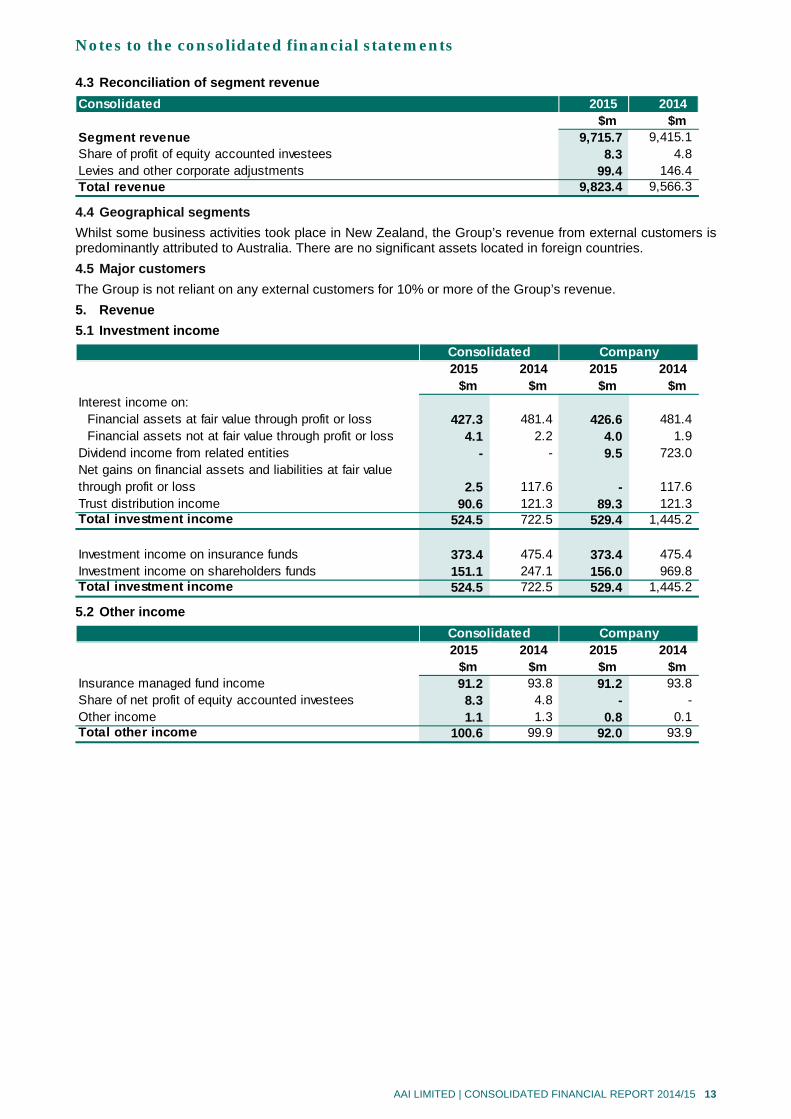
4.3 Reconciliation of segment revenue
4.4 Geographical segments
Whilst some business activities took place in New Zealand, the Group’s revenue from external customers is predominantly attributed to Australia. There are no significant assets located in foreign countries.
4.5 Major customers
The Group is not reliant on any external customers for 10% or more of the Group’s revenue.
5. Revenue
5.1 Investment income
5.2 Other income
Consolidated 2015 2014$m $m
Segment revenue 9,715.7 9,415.1 Share of profit of equity accounted investees 8.3 4.8 Levies and other corporate adjustments 99.4 146.4 Total revenue 9,823.4 9,566.3
2015 2014 2015 2014$m $m $m $m
Interest income on:Financial assets at fair value through profit or loss 427.3 481.4 426.6 481.4 Financial assets not at fair value through profit or loss 4.1 2.2 4.0 1.9
Dividend income from related entities - - 9.5 723.0 Net gains on financial assets and liabilities at fair value through profit or loss 2.5 117.6 - 117.6 Trust distribution income 90.6 121.3 89.3 121.3 Total investment income 524.5 722.5 529.4 1,445.2
Investment income on insurance funds 373.4 475.4 373.4 475.4 Investment income on shareholders funds 151.1 247.1 156.0 969.8 Total investment income 524.5 722.5 529.4 1,445.2
Consolidated Company
2015 2014 2015 2014$m $m $m $m
Insurance managed fund income 91.2 93.8 91.2 93.8 Share of net profit of equity accounted investees 8.3 4.8 - - Other income 1.1 1.3 0.8 0.1 Total other income 100.6 99.9 92.0 93.9
Consolidated Company

Notes to the consolidated financial statements
AAI LIMITED | CONSOLIDATED FINANCIAL REPORT 2014/15 14
6. Incurred claims
6.1. Net incurred claims
Current year claims relate to risks borne in the current financial year. Prior year claims relate to a reassessment of the risks borne in all previous financial years.
Consolidated
Current
YearPrior
Years TotalCurrent
YearPrior
Years Total$m $m $m $m $m $m
Direct businessGross claims incurred and related expenses
Undiscounted 7,427.6 (1,090.2) 6,337.4 6,284.7 (621.9) 5,662.8 Discount and discount movement (167.7) 324.9 157.2 (191.3) 236.3 45.0
Gross claims incurred discounted 7,259.9 (765.3) 6,494.6 6,093.4 (385.6) 5,707.8
Reinsurance and other recoveriesUndiscounted (1,707.1) 303.3 (1,403.8) (1,158.0) 199.6 (958.4)Discount and discount movement 32.4 (38.7) (6.3) 29.7 (33.9) (4.2)
Reinsurance and other recoveries discounted (1,674.7) 264.6 (1,410.1) (1,128.3) 165.7 (962.6)Net incurred claims - direct business 5,585.2 (500.7) 5,084.5 4,965.1 (219.9) 4,745.2
Inwards reinsuranceGross claims incurred and related expenses
Undiscounted 10.3 0.7 11.0 0.7 (5.3) (4.6)Discount and discount movement (0.3) 0.3 - - 1.8 1.8
Gross claims incurred discounted 10.0 1.0 11.0 0.7 (3.5) (2.8)
Reinsurance and other recoveriesUndiscounted - (0.1) (0.1) - 0.2 0.2
Reinsurance and other recoveries discounted - (0.1) (0.1) - 0.2 0.2 Net incurred claims - inwards reinsurance 10.0 0.9 10.9 0.7 (3.3) (2.6)
Total net incurred claims 5,595.2 (499.8) 5,095.4 4,965.8 (223.2) 4,742.6
2015 2014

Notes to the consolidated financial statements
AAI LIMITED | CONSOLIDATED FINANCIAL REPORT 2014/15 15
6.1 Net incurred claims (continued)
The $499.8 million Group decrease and $500.2 million Company decrease in prior year net provisions is primarily due to valuation releases arising from favourable claims experience. The sensitivity of net profit to changes in claims assumptions, experience and risk margins is set out in note 20.5.
Company
Current
YearPrior
Years TotalCurrent
YearPrior
Years Total$m $m $m $m $m $m
Direct businessGross claims incurred and related expenses
Undiscounted 7,425.5 (1,090.7) 6,334.8 6,284.7 (621.9) 5,662.8 Discount and discount movement (167.7) 324.9 157.2 (191.3) 236.3 45.0
Gross claims incurred discounted 7,257.8 (765.8) 6,492.0 6,093.4 (385.6) 5,707.8
Reinsurance and other recoveriesUndiscounted (1,707.1) 303.4 (1,403.7) (1,158.0) 199.6 (958.4)Discount and discount movement 32.4 (38.7) (6.3) 29.7 (33.9) (4.2)
Reinsurance and other recoveries discounted (1,674.7) 264.7 (1,410.0) (1,128.3) 165.7 (962.6)Net incurred claims - direct business 5,583.1 (501.1) 5,082.0 4,965.1 (219.9) 4,745.2
Inwards reinsuranceGross claims incurred and related expenses
Undiscounted 10.3 0.7 11.0 0.7 (5.3) (4.6)Discount and discount movement (0.3) 0.3 - - 1.8 1.8
Gross claims incurred discounted 10.0 1.0 11.0 0.7 (3.5) (2.8)
Reinsurance and other recoveriesUndiscounted - (0.1) (0.1) - 0.2 0.2
Reinsurance and other recoveries discounted - (0.1) (0.1) - 0.2 0.2 Net incurred claims - inwards reinsurance 10.0 0.9 10.9 0.7 (3.3) (2.6)Total net incurred claims 5,593.1 (500.2) 5,092.9 4,965.8 (223.2) 4,742.6
2015 2014
Notes to the consolidated financial statements
AAI LIMITED | CONSOLIDATED FINANCIAL REPORT 2014/15 16
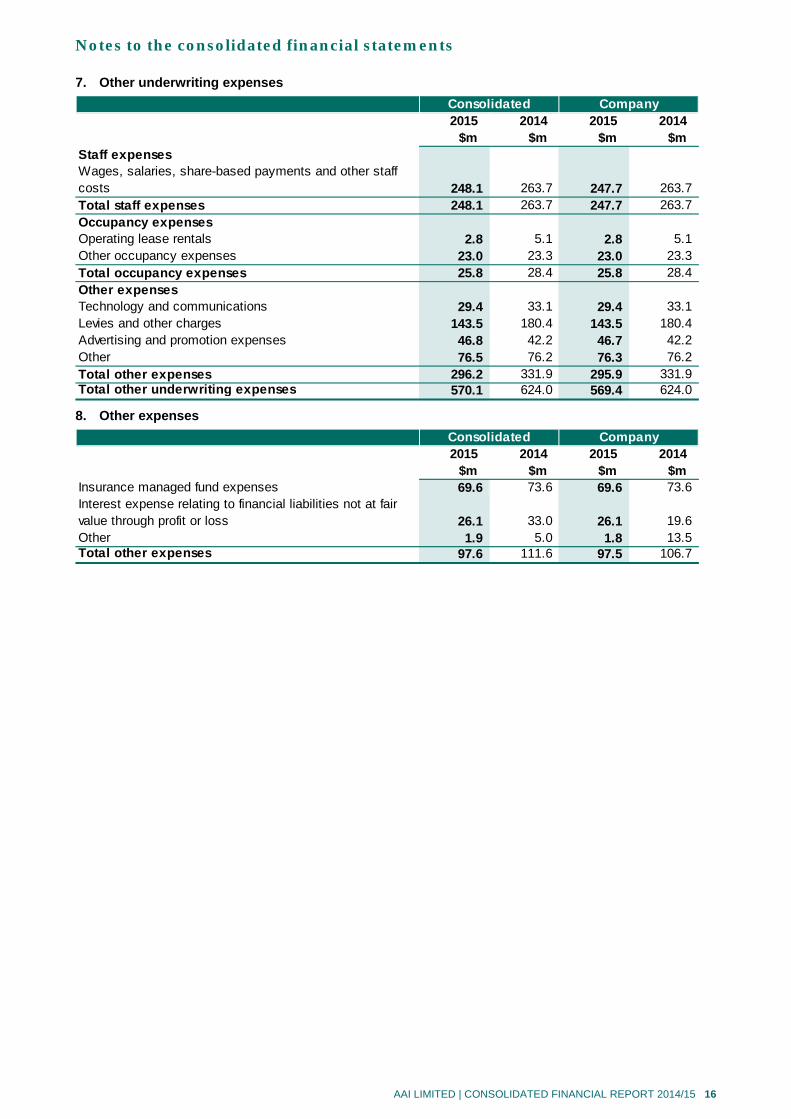
7. Other underwriting expenses
8. Other expenses
2015 2014 2015 2014$m $m $m $m
Staff expensesWages, salaries, share-based payments and other staff costs 248.1 263.7 247.7 263.7 Total staff expenses 248.1 263.7 247.7 263.7 Occupancy expensesOperating lease rentals 2.8 5.1 2.8 5.1 Other occupancy expenses 23.0 23.3 23.0 23.3 Total occupancy expenses 25.8 28.4 25.8 28.4 Other expensesTechnology and communications 29.4 33.1 29.4 33.1 Levies and other charges 143.5 180.4 143.5 180.4 Advertising and promotion expenses 46.8 42.2 46.7 42.2 Other 76.5 76.2 76.3 76.2 Total other expenses 296.2 331.9 295.9 331.9 Total other underwriting expenses 570.1 624.0 569.4 624.0
Consolidated Company
2015 2014 2015 2014$m $m $m $m
Insurance managed fund expenses 69.6 73.6 69.6 73.6 Interest expense relating to financial liabilities not at fair value through profit or loss 26.1 33.0 26.1 19.6 Other 1.9 5.0 1.8 13.5 Total other expenses 97.6 111.6 97.5 106.7
Consolidated Company

Notes to the consolidated financial statements
AAI LIMITED | CONSOLIDATED FINANCIAL REPORT 2014/15 17
9. Income tax
9.1 Income tax expense
9.2 Deferred tax assets and liabilities
2015 2014 2015 2014$m $m $m $m
Profit before tax 852.8 1,309.2 843.4 2,031.5
Income tax using the domestic corporation tax rate of 30%(2014: 30%) 255.8 392.8 253.0 609.5 Movement in income tax expense due to:
Non-deductible expenses 1.3 3.6 1.1 1.3 Non-deductible write-downs - (0.6) - - Imputation gross-up on dividends received 1.5 1.6 0.9 1.2 Intercompany dividend elimination - - (2.8) (216.9)Income tax offsets and credits (5.5) (6.1) (3.7) (4.8)Other (4.5) (0.7) (2.8) (0.4)
248.6 390.6 245.7 389.9 Income tax expense 248.6 390.6 245.7 389.9
Income tax expense recognised in profit consists of:Current tax expense
Current period 253.9 417.4 252.5 418.0 Adjustments for prior financial years (9.6) 0.2 (9.7) 0.2
244.3 417.6 242.8 418.2 Deferred tax expense
Origination and reversal of temporary differences 4.3 (27.0) 2.9 (28.3)Total income tax expense 248.6 390.6 245.7 389.9
Consolidated Company
Consolidated2015 2014 2015 2014 2015 2014
$m $m $m $m $m $m
Investments - - 75.8 86.5 (75.8) (86.5)Employee benefits 20.4 23.5 - - 20.4 23.5 Outstanding claims 77.8 77.3 - - 77.8 77.3 Other items 8.6 17.3 36.6 30.1 (28.0) (12.8)Tax assets / liabilities 106.8 118.1 112.4 116.6 (5.6) 1.5 Set-off of tax (106.8) (116.6) (106.8) (116.6) - - Net tax assets - 1.5 5.6 - (5.6) 1.5
2015 2014 2015 2014 $m $m $m $mBalance at the beginning of the financial year 118.1 109.6 116.6 132.2 Movement recognised in profit or loss (11.4) 11.0 (7.1) (16.0)Movement recognised in other comprehensive income (0.1) (2.5) - 0.4 Acquisition of business 0.2 - 2.9 - Balance at the end of the financial year 106.8 118.1 112.4 116.6
Deferred tax assets Deferred tax liabilitiesConsolidated
Deferred tax assets Deferred tax liabilities Net

Notes to the consolidated financial statements
AAI LIMITED | CONSOLIDATED FINANCIAL REPORT 2014/15 18
9.2 Deferred tax assets and liabilities (continued)
There are no unrecognised deferred tax assets and liabilities for the Group or the Company.
10. Receivables
11. Financial assets designated at fair value through profit or loss
Company2015 2014 2015 2014 2015 2014
$m $m $m $m $m $mInvestments - - 75.6 86.4 (75.6) (86.4)Employee benefits 10.2 11.7 - - 10.2 11.7 Outstanding claims 77.5 77.3 - - 77.5 77.3 Other items 8.3 16.0 34.4 29.6 (26.1) (13.6)Tax assets / liabilities 96.0 105.0 110.0 116.0 (14.0) (11.0)Set-off of tax (96.0) (105.0) (96.0) (105.0) - - Net tax liabilities - - 14.0 11.0 (14.0) (11.0)
2015 2014 2015 2014 $m $m $m $mBalance at the beginning of the financial year 105.0 29.9 116.0 34.9 Movement recognised in profit or loss (8.9) 11.5 (6.0) (16.8)Movement recognised in other comprehensive income (0.1) (2.4) - 0.4 Transfer of assets / liabilities of Group entities - 66.0 - 97.5 Balance at the end of the financial year 96.0 105.0 110.0 116.0
Deferred tax assets Deferred tax liabilities Net
Company Deferred tax assets Deferred tax liabilities
2015 2014 2015 2014$m $m $m $m
Premiums outstanding 2,060.8 2,152.7 2,059.9 2,152.3 Amounts due from reinsurers 149.3 48.4 149.3 48.4 Insurance managed funds receivable 33.3 11.6 33.2 11.5 Amounts due from related parties 232.2 196.8 205.8 203.7 Other receivables 128.0 113.0 126.7 106.9 Provision for impairment (5.2) (6.1) (5.2) (6.1)Total receivables 2,598.4 2,516.4 2,569.7 2,516.7
Current 2,372.5 2,334.8 2,379.8 2,335.1 Non-current 225.9 181.6 189.9 181.6 Total receivables 2,598.4 2,516.4 2,569.7 2,516.7
Consolidated Company
2015 2014 2015 2014$m $m $m $m
Interest-bearing securitiesDebentures and corporate bonds 6,532.0 5,555.7 6,532.0 5,555.7 Government and semi-government securities 3,674.7 4,527.3 3,674.7 4,527.3 Other interest-bearing securities 53.7 - 53.7 - Total interest-bearing securities 10,260.4 10,083.0 10,260.4 10,083.0 Unit trusts 1,207.5 2,001.6 1,140.1 2,001.6 Total financial assets designated at fair value through profit or loss - current 11,467.9 12,084.6 11,400.5 12,084.6
Consolidated Company

Notes to the consolidated financial statements
AAI LIMITED | CONSOLIDATED FINANCIAL REPORT 2014/15 19
12. Derivative financial instruments
Derivatives used include exchange rate-related contracts, interest rate-related contracts and equity contracts.
To prevent derivatives being used as a source of gearing, all derivatives have to be wholly or partly cash covered depending on the type of risk undertaken. The investment mandates specifically prohibit the use of derivatives for leveraged trading. ‘Leverage’ here is defined as creating a portfolio which would have sensitivity to an underlying economic or financial variable which is greater than could be achieved using only physical securities.
Hedging of fluctuations in interest and foreign exchange rates
Interest rate swaps designated as hedges are classified as either cash flow hedges or fair value hedges and are measured at fair value in the statements of financial position.
At balance date the Group has interest rate swaps designated as hedges and classified as fair value hedges of fixed rate subordinated note issues. All other interest rate derivatives are accounted for as fair value through profit or loss.
Hedge accounting has been adopted by the Group for the interest rate swaps hedging the fair value translation risk arising on fixed rate subordinated note issues. All cross currency interest rate swaps entered into by the Group are designated as hedges using the split approach. Under this approach the benchmark rate component of the swap is accounted for as a fair value hedge and the margin component as a cash flow hedge.
The following table details the derivatives used in the hedging of fluctuations in interest rates and foreign exchange rates.
Consolidated and CompanyNotional Notional
Value Asset Liability Value Asset Liability$m $m $m $m $m $m
Exchange rate related contractsForward foreign exchange contracts 261.1 0.8 0.8 269.2 1.3 1.1 Cross currency swaps 354.2 - 43.0 291.0 - 48.7
615.3 0.8 43.8 560.2 1.3 49.8
Interest rate related contractsInterest rate swaps 1,993.0 21.6 107.2 1,552.3 20.6 72.2 Interest rate futures 978.7 - 1.9 2,997.1 - 26.8
2,971.7 21.6 109.1 4,549.4 20.6 99.0
Equity contractsEquity futures 192.5 1.3 0.7 99.0 1.0 0.5
192.5 1.3 0.7 99.0 1.0 0.5
Total derivative exposures - current 3,779.5 23.7 153.6 5,208.6 22.9 149.3
20142015Fair Value Fair Value
Consolidated and Company2015 2014
$m $mHedging of fluctuations in interest and foreign exchange ratesNotional value of cross currency swaps designated as hedges 291.0 291.0 Notional value of interest rate swaps designated as hedges 98.0 228.7
Fair value:net pay cross currency swaps (22.0) (48.7) net receive interest rate swaps 5.4 10.5
(16.6) (38.2)
Split approach

Notes to the consolidated financial statements
AAI LIMITED | CONSOLIDATED FINANCIAL REPORT 2014/15 20
13. Reinsurance and other recoveries receivable
14. Deferred insurance assets
2015 2014 2015 2014$m $m $m $m
Expected future reinsurance and other recoveries receivables undiscounted 1,819.9 1,491.4 1,819.8 1,491.4 Discount to present value (109.0) (115.3) (109.0) (115.3)Total reinsurance and other recoveries receivable 1,710.9 1,376.1 1,710.8 1,376.1
Current 866.1 625.0 866.0 625.0 Non-current 844.8 751.1 844.8 751.1 Total reinsurance and other recoveries receivable 1,710.9 1,376.1 1,710.8 1,376.1
Reconciliation of movements in reinsurance and other recoveries receivableBalance at the beginning of the financial year 1,376.1 1,496.3 1,376.1 495.5 Reinsurance and other recoveries revenue 1,410.2 962.4 1,410.1 962.4 Reinsurance and other recoveries received (1,075.4) (1,082.6) (1,075.4) (1,082.6)Transfer in of reinsurance and other recoveries receivable - - - 1,000.8 Balance at the end of the financial year 1,710.9 1,376.1 1,710.8 1,376.1
Consolidated Company
2015 2014 2015 2014$m $m $m $m
Deferred insurance assets 1,243.4 1,185.9 1,218.3 1,185.9
Reconciliation of movements in deferred acquisition costsBalance at the beginning of the financial year 505.9 487.9 505.9 182.4 Acquisition costs deferred 1,009.1 971.1 984.8 971.1 Amortisation charged to profit or loss (986.0) (953.1) (963.8) (953.1)Transfer in of deferred acquisition costs 23.0 - - 305.5 Balance at the end of the financial year 552.0 505.9 526.9 505.9 Current 538.3 505.9 526.9 505.9 Non-current 13.7 - - - Balance at the end of the financial year 552.0 505.9 526.9 505.9
Reconciliation of movements in deferred reinsurance assetsBalance at the beginning of the financial year 610.0 629.6 610.0 257.2 Reinsurance premiums paid during the year 805.6 822.7 805.6 822.7 Reinsurance premiums charged to profit or loss (795.3) (842.3) (795.3) (842.3)Transfer in of deferred reinsurance assets - - - 372.4 Balance at the end of the financial year - current 620.3 610.0 620.3 610.0
Reconciliation of movements other deferred expensesBalance at the beginning of the financial year 70.0 118.5 70.0 26.3 Other expenses deferred 144.6 131.9 144.6 131.9 Amortisation charged to profit or loss (143.5) (180.4) (143.5) (180.4)Transfer in of other deferred expenses - - - 92.2 Balance at the end of the financial year - current 71.1 70.0 71.1 70.0
Consolidated Company

Notes to the consolidated financial statements
AAI LIMITED | CONSOLIDATED FINANCIAL REPORT 2014/15 21
15. Goodwill and other intangible assets
All intangibles except goodwill have finite useful lives.
Consolidated
GoodwillDealer
relationships Software Total$m $m $m $m
2015Gross carrying amount 82.6 8.6 - 91.2 Accumulated amortisation and impairment losses (5.7) (0.9) - (6.6)Balance at the end of the financial year - non-current 76.9 7.7 - 84.6
Movements in intangible assetsBalance at the beginning of the financial year 54.8 - - 54.8 Acquisitions 22.1 8.6 2.1 32.8 Disposal - - (1.7) (1.7)Amortisation - (0.9) (0.4) (1.3)Balance at the end of the financial year 76.9 7.7 - 84.6 2014Gross carrying amount 60.5 - - 60.5 Accumulated amortisation and impairment losses (5.7) - - (5.7) Balance at the end of the financial year - non-current 54.8 - - 54.8
Movements in intangible assetsBalance at the beginning of the financial year 1,111.4 - - 1,111.4 Transfer (1,056.6) - - (1,056.6) Balance at the end of the financial year 54.8 - - 54.8
Company
GoodwillDealer
relationships Software Total$m $m $m $m
2015Gross carrying amount 27.5 - - 27.5 Accumulated impairment losses (5.5) - - (5.5)Balance at the end of the financial year - non-current 22.0 - - 22.0
Movements in intangible assetsBalance at the beginning of the financial year 22.0 - - 22.0 Amortisation - - - - Balance at the end of the financial year 22.0 - - 22.0 2014Gross carrying amount 27.5 - - 27.5 Accumulated impairment losses (5.5) - - (5.5) Balance at the end of the financial year - non-current 22.0 - - 22.0
Movements in intangible assetsBalance at the beginning of the financial year 11.3 - - 11.3 Transfer 10.7 - - 10.7 Balance at the end of the financial year 22.0 - - 22.0

Notes to the consolidated financial statements
AAI LIMITED | CONSOLIDATED FINANCIAL REPORT 2014/15 22
15.1 Impairment tests for cash-generating units containing goodwill
For the purpose of the annual impairment test, goodwill is allocated to significant cash-generating units (CGUs) which represent the Group’s operating segments (refer note 4.1). The carrying amount of each CGU is then compared to its recoverable amount. The accounting policy relating to impairment testing for CGUs containing goodwill is included in note 34.12. The value of goodwill allocated to each CGU is found in note 4.1.
(a) Value in use for each CGU
The recoverable amount of each CGU is based on its value in use. Value in use was determined by discounting the future cash flows generated from the continuing use of the units and was based on cash flows projected from the financial forecasts prepared by management covering a five-year period. A terminal growth rate of 2.75% (2014: 2.75%) is used to extrapolate cash flows beyond the five-year projections which does not exceed the long-term average growth rate for the industry.
For each CGU, the weighted average cost of capital is used as the post-tax discount rate of 8.7% (2014: 10.2%). This is equivalent to 12.4% (2014: 14.6%) on a pre-tax basis. The discount rates reflect a beta and a market risk premium sourced from observable market inputs.
16. Other assets
16.1 Interests in joint arrangements
Information relating to joints arrangements is set out below.
1. Registered office of NTI Ltd is Level 29, 400 George Street, Brisbane, QLD, 4000. 2. Investment held by GIO Insurance Investment Holdings (A) Pty Limited. 3. Registered office of RACT Insurance Pty Ltd is ‘RACT’ House Level 1, 179-191 Murray Street, Hobart, 7E3781744,
TAS, 7000.
Note 2015 2014 2015 2014$m $m $m $m
Accrued interest 83.5 93.3 83.5 93.3 Prepayments 29.4 9.1 26.6 9.0 Investment in equity accounted investments 16.1 24.2 19.9 5.5 5.4 Total other assets 137.1 122.3 115.6 107.7
Current 112.9 102.4 110.1 102.3 Non-current 24.2 19.9 5.5 5.4 Total other assets 137.1 122.3 115.6 107.7
Consolidated Company
Name of entity2015 2014 2015 2014 2015 2014
% % $m $m $m $mJoint ventures
NTI Limited 1 Management Services 50 50 5.5 5.4 5.5 5.4
RACT Insurance Pty Ltd 2,3 Insurance 50 50 18.7 14.5 - -
24.2 19.9 5.5 5.4
Joint operationsNational Transport Insurance
Facilitation of insurance arrangements 50 50
Total investment in equity accounted investments
Principal Activity
Consolidated CompanyOwnership
interestCarryingamount
Carryingamount

Notes to the consolidated financial statements
AAI LIMITED | CONSOLIDATED FINANCIAL REPORT 2014/15 23
17. Payables and other liabilities
18. Employee benefits liabilities
As explained in note 34.14, the amounts for long service leave included in employee entitlements above are measured at their present values. The following assumptions were adopted in measuring present values:
18.1 Share-based payments
The Company is a wholly owned subsidiary of Suncorp Group Limited (SGL). Eligible employees of the Company have the right to participate in the Suncorp Group Limited share plans. Shares offered in these share plans are granted by SGL over its own shares to employees of SGL subsidiaries.
Long-term incentives (performance rights)
Long-term incentives (LTI) are performance rights granted to eligible executives. These are equity-settled and in limited circumstances cash-settled at the SGL Board’s discretion. The SGL Board determines the value of shares granted (offered) based on the executive’s remuneration and individual performance. Vested shares carry full entitlement to dividend from the grant date (less any taxes paid by the plan trustee in respect of such dividends).
Vesting of LTI is subject to performance hurdles and service conditions being met during the performance period. The performance hurdle is based on the SGL’s total shareholder returns (TSR) against the TSR of a peer comparator group, which is the top 50 industrial companies by market capitalisation in the S&P/ASX 100 (excluding mining companies and listed property trusts). Generally, the performance period commences on the grant date for a three year period. The percentage of performance rights that will vest is based on the LTI vesting schedule. No LTI will vest unless SGL achieves a relative TSR of 50th percentile (median) or above. Any performance rights not vested at the end of the performance period are forfeited.
2015 2014 2015 2014$m $m $m $m
Trade and other creditors 179.3 325.3 195.9 334.0 Amounts due to reinsurers 494.5 488.0 494.5 488.0 Unearned income 73.9 75.7 73.9 75.7 Amounts due to related parties 383.9 625.5 646.4 891.1 Other financial liabilities 92.7 - 92.7 - Total payables and financial liabilities 1,224.3 1,514.5 1,503.4 1,788.8
Current 1,214.4 1,497.2 1,246.0 1,552.9 Non-current 9.9 17.3 257.4 235.9 Total payables and financial liabilities 1,224.3 1,514.5 1,503.4 1,788.8
Consolidated Company
2015 2014 2015 2014$m $m $m $m
Employee entitlements 66.2 77.1 32.6 38.3 Net defined benefit liability 1.4 0.7 1.4 0.7 Total employee benefits liabilities 67.6 77.8 34.0 39.0
Current 46.1 55.7 22.2 26.7 Non-current 21.5 22.1 11.8 12.3 Total employee benefits liabilities 67.6 77.8 34.0 39.0
Consolidated Company
2015 2014 2015 2014Weighted average rate of increases in annual employee benefits to settlement of the liabilities 2.5% 3.8% 2.5% 3.8%Weighted average discount rate 3.2% 3.0% 3.2% 3.0%Weighted average term to settlement of liabilities (years) 3.6 2.5 3.6 2.5
Consolidated Company

Notes to the consolidated financial statements
AAI LIMITED | CONSOLIDATED FINANCIAL REPORT 2014/15 24
18.1 Share-based payments (continued)
The fair value of services received in return for LTI granted is measured by reference to the fair value of the shares granted. The estimate of the fair value of the shares is measured based on a Monte Carlo simulation pricing model and reflects the fact that vesting of the shares is dependent on meeting performance criteria based on TSR. The vesting of the shares is also subject to non-market conditions but these are not taken into account in the grant date fair value measurement of the services received. The dividend yield is not considered in the measurement of fair value at grant date due to the dividend entitlements on vested shares as described above.
The expense included in the profit or loss in relation to LTI for the financial year ended 30 June 2015 for the Company was $2,000 (2014: $29,200) and for the Group was $2,000 (2014: $29,200).
Other equity-settled share plans
SGL operates other equity-settled share plans that are not subject to performance conditions. Key features are set out below:
The expense included in the profit or loss in relation to restricted shares for the financial year ended 30 June 2015 for the Company was $50,400 (2014: $19,500) and for the Group was $50,400 (2014: $19,500).
Shares issued during the financial year under the Suncorp Equity Participation Plan that were funded by employee salary sacrifice have a nil impact on the Company Statement of comprehensive income.
The SGL Board approved a grant to each eligible employee ordinary shares of SGL to the value of $1,000 (2014: $1,000) under the Suncorp Employee Share Plan (tax exempt) for the financial year. These shares will be acquired on-market for allocation to employees by the share plan in October 2015 (2014: October 2014).
Equity plans Restricted shares Suncorp Employee Share plan (tax exempt)
Suncorp Equity Participation plan
Eligible plan participant
Employees in senior roles below executive level that satisfy the eligibility criteria.
Employees not eligible for LTI awards.
Employees and non-executive directors can elect to participate.
Basis of share grant / issue
Value of restricted shares granted (offered) is determined by the Board based on the employee’s remuneration and individual performance.
Market value of shares up to $1,000 per employee per year may be granted by the Board based on the Suncorp Group’s overall performance.
Employees to fund the acquisition of shares to be held under this Plan from their pre-tax remuneration up to a maximum value of $5,000.
Vesting Subject to remaining in employment with the Suncorp Group until the vesting date and not having given notice of intention to resign.
Fully vested, not subject to forfeiture.
As the acquisition of shares is funded through the employee’s or non-executive director’s remuneration, the shares are fully vested at the date of acquisition.
Dividend entitlements
Full entitlement from when the shares are allocated to the participating employee and held in the Plan.
Full entitlement to dividend from when the shares are acquired and held in the Plan.
Full entitlement to dividend from when the shares are acquired and held in the Plan.
Fair value Discounted cash flow model incorporating the expected share price at vesting date and expected dividends entitlements, discounted from the vesting date to the grant date.
Market value of the shares on the date they were acquired.
Market value of the shares on the date they were acquired.

Notes to the consolidated financial statements
AAI LIMITED | CONSOLIDATED FINANCIAL REPORT 2014/15 25
19. Unearned premium liabilities
19.1 Reconciliation of movement
19.2. Liability adequacy test
The probability of adequacy adopted for the general insurance liability adequacy test (LAT) differs from the 90% (2014: 90%) probability of adequacy adopted in determining the outstanding claims liabilities (refer note 20.4). The reason for this difference is that the former is in effect an impairment test used only to test the sufficiency of net premium liabilities whereas the latter is a measurement accounting policy used in determining the carrying value of the outstanding claims liabilities.
As at 30 June 2015 and 30 June 2014, the LAT resulted in a surplus.
20. Outstanding claims liabilities
2015 2014 2015 2014$m $m $m $m
Reconciliation of movements in unearned premium liabilitiesUnearned premium liability at the beginning of the financial year 4,083.4 4,034.9 4,083.4 873.6 Premiums written during the financial year 7,669.4 7,731.7 7,632.5 7,731.7 Premiums earned during the financial year (7,691.1) (7,683.2) (7,659.6) (7,683.2)Transfer in of unearned premium liabilities 62.5 - - 3,161.3 Unearned premium liability at the end of the financial year 4,124.2 4,083.4 4,056.3 4,083.4
Current 4,086.0 4,083.4 4,056.3 4,083.4 Non-current 38.2 - - - Total unearned premium liabilities 4,124.2 4,083.4 4,056.3 4,083.4
Consolidated Company
2015 2014 2015 2014$m $m $m $m
Central estimate of present value of expected future cash flows arising from future claims 3,055.6 2,943.0 3,038.8 2,943.0 Risk margin 61.8 60.0 61.4 60.0 Present value of expected future cash inflows arising from reinsurance recoveries on future claims (184.7) (166.0) (184.7) (166.0) Expected present value of future cash flows for future claims including risk margin 2,932.7 2,837.0 2,915.5 2,837.0
% % % %Risk margin 2.3% 2.3% 2.3% 2.3%Probability of adequacy 57 – 64% 57 – 64% 57 – 64% 57 – 64%
Consolidated Company
2015 2014 2015 2014$m $m $m $m
Gross central estimate - undiscounted 8,134.6 7,685.4 8,133.4 7,685.4 Risk margin 1,173.6 1,180.1 1,173.0 1,180.1 Claims handling expenses 282.0 292.8 281.8 292.8
9,590.2 9,158.3 9,588.2 9,158.3 Discount to present value (839.5) (996.6) (839.5) (996.6)Gross outstanding claims liabilities - discounted 8,750.7 8,161.7 8,748.7 8,161.7
Current 3,370.5 2,913.6 3,368.9 2,913.6 Non-current 5,380.2 5,248.1 5,379.8 5,248.1 Gross outstanding claims liabilities - discounted 8,750.7 8,161.7 8,748.7 8,161.7
Consolidated Company

Notes to the consolidated financial statements
AAI LIMITED | CONSOLIDATED FINANCIAL REPORT 2014/15 26
20.1 Reconciliation of movement in discounted gross outstanding claims liabilities
The following table summarises the maturity profile of net outstanding claims liabilities based on the estimated timing of net discounted cash flows.
2015 2014 2015 2014$m $m $m $m
Net outstanding claims liabilities at the beginning of the financial year 6,785.6 6,637.7 6,785.6 1,354.9 Transfer in of outstanding claims liability balance 2.1 - - 5,282.8 Prior periods
Claims payments (1,850.8) (1,897.8) (1,848.7) (1,897.8)Discount unwind 116.5 112.5 116.5 112.5 Margin release on prior periods (243.0) (237.6) (242.4) (237.6)Incurred claims due to changes in assumptions and experience (502.2) (172.8) (503.2) (172.8)Change in discount rate 128.9 74.7 128.9 74.7
Current periodIncurred claims 5,595.2 4,965.8 5,593.1 4,965.8 Claims payments (2,992.5) (2,696.9) (2,991.9) (2,696.9)
Net outstanding claims liabilities at the end of the financial year 7,039.8 6,785.6 7,037.9 6,785.6 Reinsurance and other recoveries on outstanding claims liabilities 1,710.9 1,376.1 1,710.8 1,376.1 Gross outstanding claims liabilities - discounted 8,750.7 8,161.7 8,748.7 8,161.7
Consolidated Company
Carrying amount
1 year or less
1 to 5 years
Over 5 years
Total cash flows
Consolidated $m $m $m $m $m2015 7,039.8 2,504.4 3,262.2 1,273.2 7,039.8 2014 6,785.6 2,288.7 3,279.5 1,217.4 6,785.6
Company 2015 7,037.9 2,502.9 3,261.8 1,273.2 7,037.9 2014 6,785.6 2,288.7 3,279.5 1,217.4 6,785.6

Notes to the consolidated financial statements
AAI LIMITED | CONSOLIDATED FINANCIAL REPORT 2014/15 27
20.2 Claims development tables
The following tables show the development of undiscounted outstanding claims relative to the ultimate expected claims for the ten most recent accident years.
Consolidated 2015Accident year Prior 2006 2007 2008 2009 2010 2011 2012 2013 2014 2015 Total
$m $m $m $m $m $m $m $m $m $m $m $m
1,186.1 1,223.8 1,267.9 1,272.0 1,312.8 1,306.6 1,286.9 1,374.4 1,389.5 1,405.4 13,025.4 One year later 1,099.6 1,162.0 1,128.3 1,259.9 1,216.2 1,201.8 1,276.0 1,344.1 1,383.3 11,071.2 Two years later 1,022.1 1,056.4 1,092.4 1,153.0 1,131.3 1,141.9 1,208.2 1,227.1 9,032.4 Three years later 948.1 1,026.4 1,048.9 1,133.0 1,103.0 1,123.0 1,127.2 7,509.6 Four years later 895.8 974.2 989.1 1,121.6 1,095.9 1,053.4 6,130.0 Five years later 862.2 947.5 975.7 1,085.6 1,017.2 4,888.2 Six years later 870.3 927.0 971.8 1,052.2 3,821.3 Seven years later 858.6 929.0 917.2 2,704.8 Eight years later 847.0 899.9 1,746.9 Nine years later 851.3 851.3
Current estimate of cumulative claims cost 851.3 899.9 917.2 1,052.2 1,017.2 1,053.4 1,127.2 1,227.1 1,383.3 1,405.4
(798.6) (847.1) (828.0) (938.5) (822.3) (756.0) (664.9) (495.6) (289.7) (83.0)Outstanding claims - undiscounted 736.1 52.7 52.8 89.2 113.7 194.9 297.4 462.3 731.5 1,093.6 1,322.4 5,146.6 Discount to present value (204.8) (4.5) (3.8) (7.7) (9.2) (15.5) (23.4) (32.4) (49.4) (77.1) (101.1) (528.9)Outstanding claims - 531.3 48.2 49.0 81.5 104.5 179.4 274.0 429.9 682.1 1,016.5 1,221.3 4,617.7 Outstanding claims - short tail 1,148.7 Claims handling expenses 253.2 Risk margin 1,020.2 Total net outstanding claims liabilities 7,039.8 Reinsurance and other recoveries on outstanding claims liabilities 1,710.9 Total gross outstanding claims liabilities 8,750.7
Cumulative payments
Accident year
At end of accident yearEstimate of ultimate claims cost:
Company 2015Accident year Prior 2006 2007 2008 2009 2010 2011 2012 2013 2014 2015 Total
$m $m $m $m $m $m $m $m $m $m $m $m
1,186.1 1,223.8 1,267.9 1,272.0 1,312.8 1,306.6 1,286.9 1,374.4 1,389.5 1,405.4 13,025.4 One year later 1,099.6 1,162.0 1,128.3 1,259.9 1,216.2 1,201.8 1,276.0 1,344.1 1,383.3 11,071.2 Two years later 1,022.1 1,056.4 1,092.4 1,153.0 1,131.3 1,141.9 1,208.2 1,227.1 9,032.4 Three years later 948.1 1,026.4 1,048.9 1,133.0 1,103.0 1,123.0 1,127.2 7,509.6 Four years later 895.8 974.2 989.1 1,121.6 1,095.9 1,053.4 6,130.0 Five years later 862.2 947.5 975.7 1,085.6 1,017.2 4,888.2 Six years later 870.3 927.0 971.8 1,052.2 3,821.3 Seven years later 858.6 929.0 917.2 2,704.8 Eight years later 847.0 899.9 1,746.9 Nine years later 851.3 851.3
851.3 899.9 917.2 1,052.2 1,017.2 1,053.4 1,127.2 1,227.1 1,383.3 1,405.4 (798.6) (847.1) (828.0) (938.5) (822.3) (756.0) (664.9) (495.6) (289.7) (83.0)
Outstanding claims - undiscounted 736.1 52.7 52.8 89.2 113.7 194.9 297.4 462.3 731.5 1,093.6 1,322.4 5,146.6 Discount to present value (204.8) (4.5) (3.8) (7.7) (9.2) (15.5) (23.4) (32.4) (49.4) (77.1) (101.1) (528.9)Outstanding claims - long tail 531.3 48.2 49.0 81.5 104.5 179.4 274.0 429.9 682.1 1,016.5 1,221.3 4,617.7 Outstanding claims - short tail 1,146.8 Claims handling expenses 253.2 Risk margin 1,020.2 Total net outstanding claims liabilities 7,037.9 Reinsurance and other recoveries on outstanding claims liabilities 1,710.8 Total gross outstanding claims liabilities 8,748.7
Accident year
Estimate of ultimate claims cost:At end of accident year
Current estimate of cumulative claims costCumulative payments

Notes to the consolidated financial statements
AAI LIMITED | CONSOLIDATED FINANCIAL REPORT 2014/15 28
20.2 Claims development tables (continued)
The claims development table discloses amounts net of reinsurance and third party recoveries to give the most meaningful insight into the impact on profit or loss. Short-tail claims are disclosed separately as they are generally subject to less uncertainty since they are normally reported soon after the incident and are generally settled within 12 months following the reported incident.
20.3 Outstanding claims liabilities and assets arising from reinsurance contracts
The Group’s estimation of its claims liabilities includes the expected future cost of claims notified to the Suncorp Group as at balance date as well as claims incurred but not reported (IBNR) and claims incurred but not enough reported (IBNER). Projected payments are discounted to present value and an estimate of direct expenses expected to be incurred in settling these claims is determined.
The Group takes all reasonable steps to ensure that it has appropriate information regarding its claims exposures with estimates and judgments continually being evaluated and updated based on historical experience and other factors. However, given the uncertainty in the estimation process, it is likely that the final outcome will prove to be different from the original liability established.
The estimation of claims IBNR and claims IBNER are generally subject to a greater degree of uncertainty with claims often not being adequately reported until many years after the events giving rise to the claims have happened. For this reason, long-tail classes of business will typically display greater variations between initial estimates and final outcomes.
Estimation of assets arising from reinsurance and other recoveries are also computed using the above methods. The recoverability of these assets is assessed on a periodic basis, taking into consideration factors such as counterparty and credit risk.
20.4 Actuarial assumptions and methods
The estimation of the outstanding claims liabilities is based on multiple actuarial techniques that analyse experience, trends and other relevant factors utilising the Group’s specific data, relevant industry data and general economic data. Methods undertaken to determine claims liabilities will vary according to the class of business. The Group stratifies its general insurance contracts into two classes of business: Personal and Commercial.
The use of multiple actuarial methods assists in providing a greater understanding of the trends inherent in the past data. The projections obtained from various methods also assist in setting the range of possible outcomes. The most appropriate method or a blend of methods is selected, taking into account the characteristics of the class of business and the extent of the development of each past accident period.
The following key assumptions have been made in determining the outstanding claims liabilities:
Consolidated
2015 2014 2015 2014Weighted average term to settlement (years) 0.5 0.5 4.4 4.5 Economic inflation rate 4.0% 4.0% 4.0% 4.0%Superimposed inflation rate 0.3% 0.3% 2.4% 2.5%Discount rate 2.1% 2.6% 2.8% 3.4%Claims handling expense ratio 5.8% 7.0% 4.2% 4.3%Risk margin 8.6% 9.5% 18.4% 18.3%
Company
2015 2014 2015 2014Weighted average term to settlement (years) 0.5 0.5 4.4 4.5 Economic inflation rate 4.0% 4.0% 4.0% 4.0%Superimposed inflation rate 0.3% 0.3% 2.4% 2.5%Discount rate 2.1% 2.6% 2.8% 3.4%Claims handling expense ratio 5.8% 7.0% 4.2% 4.3%Risk margin 8.6% 9.5% 18.4% 18.3%
CommercialPersonal
Personal Commercial

Notes to the consolidated financial statements
AAI LIMITED | CONSOLIDATED FINANCIAL REPORT 2014/15 29
20.4 Actuarial assumptions and methods (continued)
Weighted average term to settlement – The weighted average term to settlement is calculated separately by class of business and is based on historic settlement patterns.
Economic and superimposed inflation – Economic inflation is based on economic indicators such as the consumer price index and/or increases in average weekly earnings. Superimposed inflation reflects the tendency for some costs, such as court awards, to increase at levels in excess of economic inflation. Inflation assumptions are set at a class of business level and reflect past experience and future expectations.
Discount rate – Discount rates are derived from market yields on Commonwealth Government securities in Australia at the balance date.
Claims handling expense ratio – Claims handling expense ratio is calculated with reference to past experience of claims handling costs as a percentage of past payments.
Risk margin – The overall risk margin is determined after analysing the relative uncertainty of the outstanding claims estimate for each class of business and the diversification between classes and geographical locations.
The assumptions regarding uncertainty for each class are applied to the net central estimates and the results are aggregated allowing for diversification in order to arrive at an overall position which is intended to have approximately 90% probability of sufficiency (2014: 90%).
20.5 Sensitivity analysis
The Group conducts sensitivity analyses to quantify the exposure to the risk of changes in the key underlying actuarial assumptions. A sensitivity analysis is conducted on each variable, whilst holding all other variables constant. The tables below describe how a change in each assumption will affect the profit before tax. All variables are weighted averages. There is no impact on equity reserves.
2015 2014 2015 2014Movement
in variable
Profit (loss)
before tax
Profit (loss)
before tax
Profit (loss)
before tax
Profit (loss)
before tax
% $m $m $m $mWeighted average term to settlement (years) +0.5 (119.6) (99.4) (119.6) (99.4)
-0.5 117.6 98.0 117.5 98.0 Inflation rate +1 (228.7) (222.6) (228.7) (222.6)
-1 210.7 205.3 210.7 205.3 Discount rate +1 213.7 206.8 213.7 206.8
-1 (236.5) (228.5) (236.5) (228.5)Claims handling expense ratio +1 (57.7) (55.3) (57.7) (55.3)
-1 57.7 55.3 57.7 55.3 Risk margin +1 (60.2) (57.9) (60.1) (57.9)
-1 60.2 57.9 60.1 57.9
Consolidated Company

Notes to the consolidated financial statements
AAI LIMITED | CONSOLIDATED FINANCIAL REPORT 2014/15 30
21. Subordinated notes
The above subordinated notes were issued by the Company and Suncorp Insurance Funding 2007 Limited with maturities of 20 years, first callable at the option of the issuer after ten years. The notes are unsecured obligations of the issuing entity. Payments of principal and interest on the notes have priority over the issuing entity’s dividend payments only. In the event of the winding-up of the issuing entity, the rights of the note holders will rank in preference only to the rights of its ordinary shareholders.
22. Share capital
The following table show the movement in ordinary shares on issue:
The Company does not have authorised capital in respect of its issued shares. All issued shares are fully paid.
Holders of ordinary shares are entitled to receive dividends as declared from time to time and are entitled to one vote per share at shareholders’ meetings.
In the event of winding-up of the Company, ordinary shareholders rank after all other shareholders and creditors and are fully entitled to any proceeds on liquidation.
23. Capital notes
The Capital notes are perpetual, subordinated notes issued to Suncorp Insurance Holdings Limited. The notes are unsecured and pay periodic, non-cumulative dividends to the holder, based on a set formula (Bank Bill Swap Rate + Margin) x (1 - Corporate Tax Rate). Such dividends are at the discretion of the directors.
2015 2014 2015 2014$m $m $m $m
Financial liabilities at amortised costFixed rate notes 496.5 601.5 224.3 357.8 Floating rate notes 77.1 128.6 77.1 128.6
573.6 730.1 301.4 486.4 Less transaction costs (1.9) (3.1) (1.9) (3.1)Total subordinated notes 571.7 727.0 299.5 483.3
Current 197.6 183.0 197.6 183.0 Non-current 374.1 544.0 101.9 300.3 Total subordinated notes 571.7 727.0 299.5 483.3
Consolidated Company
2015 2014
Shares SharesIssue and fully paid ordinary sharesBalance at the beginning of the financial year 171,213,341 317,077,465 Shares buyback - (145,864,124) Balance at the end of the financial year 171,213,341 171,213,341
Company
Consolidated and CompanyNo of notes $m No of notes $m
Issued on 11 February 2014 1,100,000 110.0 1,100,000 110.0 Issued on 27 June 2014 4,000,000 400.0 4,000,000 400.0 Balance at end of financial year 510.0 510.0
2015 2014

Notes to the consolidated financial statements
AAI LIMITED | CONSOLIDATED FINANCIAL REPORT 2014/15 31
24. Capital management
The Group is part of the Suncorp Group. The capital management strategy of the Suncorp Group is to optimise shareholder value by managing the level, mix and use of capital resources. The primary objective is to ensure there are sufficient capital resources to maintain and grow the business, in accordance with risk appetite. The Suncorp Group’s Internal Capital Adequacy Assessment Process (ICAAP) provides the framework to ensure that the Suncorp Group as a whole, and each regulated entity, is capitalised to meet internal and external requirements.
The ICAAP is reviewed regularly and, where appropriate, adjustments are made to reflect changes in the capital needs and risk profile of the Suncorp Group. Capital targets are structured according to both the business line regulatory framework and to the Australian Prudential Regulation Authority’s (APRA) standards for the supervision of Conglomerates.
All APRA authorised general insurance entities that conduct insurance business in Australia are subject to a risk-based approach for measuring and holding the required regulatory level of capital, referred to as the Prudential Capital Requirement (PCR). The PCR is the minimum level of capital that APRA deems must be held to meet policyowner obligations and consists of the Prescribed Capital Amount (PCA) and any supervisory adjustment determined by APRA. The company uses APRA’s standardised method for calculating the PCA in accordance with the relevant Prudential Standards and holds regulatory capital in excess of the PCA.
The PCA is calculated by assessing the risks inherent in the business, charges for which comprise:
insurance risk charge to reflect the risks inherent in claims and premium liabilities
insurance concentration risk charge to ensure capital is set aside for the risk of loss resulting from a single large event or a series of smaller events
operational risk charge to ensure capital is set aside for the risk of loss resulting from inadequate processes or failed internal control, people and systems
asset risk charge to better reflect the risk of adverse movements in the value of on-balance sheet and off-balance sheet exposures by including a variety of asset stress scenarios as well as some default charges
an asset concentration risk charge to reflect an overconcentration to counterparties, if any;
offset by
an aggregation benefit, which makes an explicit allowance for diversification between asset risk charges and the sum of insurance risk and insurance concentration risk charges
These risks charges are quantified to determine the prescribed capital required under the prudential standards. This requirement is compared with the regulatory capital held in the Company.
For regulatory purposes, capital is classified as follows: Common Equity Tier 1 (CET1) Capital comprising accounting equity with adjustments for intangible
assets and regulatory reserves
Tier 1 Capital comprising CET1 Capital plus Additional Tier 1 Capital such as certain hybrid securities with ‘equity-like’ qualities
Tier 2 Capital comprising certain securities recognised as Tier 2 Capital, such as transitional subordinated notes; and
Total Capital, being the sum of Tier 1 Capital and Tier 2 Capital.
CET1 Capital has the greatest capacity to absorb potential losses, followed by Additional Tier 1 Capital and then Tier 2 Capital.
For capital adequacy purposes, a general insurer is required to hold CET 1 capital in excess of 60% of PCA, Tier 1 capital in excess of 80% of PCA and total capital in excess of PCR to ensure solvency. For this purpose, a general insurer’s capital base is expected to be adequate for its size, business mix, complexity and the risk profile of its business.
The Company and its licensed subsidiary (MTA Insurance Limited) satisfied all regulatory capital requirements during both the current and the prior financial year.

Notes to the consolidated financial statements
AAI LIMITED | CONSOLIDATED FINANCIAL REPORT 2014/15 32
24. Capital management (continued)
The following table summarises the capital position and PCA at the end of the financial year. The Company is not the parent entity for the consolidated general insurance group and as a result does not prepare consolidated capital information for the Group.
2015 2014$m $m
Common Equity Tier 1 CapitalIssued capital 949.4 949.4 Reserves (2.5) (2.8)Retained profits 1,019.0 1,392.4 Technical provision in excess of liability valuation (net of tax) 563.4 648.7 Goodwill and other intangible assets (84.2) (57.9)Other Tier 1 deductions (14.1) (5.0)
Common Equity Tier 1 Capital 2,431.0 2,924.8 Additional Tier 1 Capital 510.0 510.0 Tier 2 Capital 500.3 571.8
Total Capital 3,441.3 4,006.6
Prescribed Capital AmountInsurance risk charge 1,309.2 1,274.6 Insurance concentration risk charge 250.0 250.0 Asset risk charge 566.9 609.2 Operational risk charge 260.1 295.3 Aggregation benefit (363.7) (382.5)
Total Prescribed Capital Amount (PCA) 2,022.5 2,046.6
Capital Coverage Ratio 1.70 1.96
Company

Notes to the consolidated financial statements
AAI LIMITED | CONSOLIDATED FINANCIAL REPORT 2014/15 33
25. Reconciliation of cash flows from operating activities
2015 2014 2015 2014$m $m $m $m
Profit for the financial year 604.2 918.6 597.7 1,641.6 Non-cash itemsMovement in financial assets at fair value through profit or loss (2.5) (95.8) - (91.2)Share of net profit from joint venture entities (8.3) (4.8) - - Dividends received from subsidiaries - - - (720.0)Other non-cash items 2.5 - 1.1 - Change in assets and liabilitiesNet movement in defined benefit funds (0.7) (7.3) (0.7) (7.1)Increase in receivables (82.0) (215.4) (53.0) (191.1)(Increase) decrease in reinsurance and other recoveries (334.8) 120.2 (334.7) 120.2 (Increase) decrease in deferred reinsurance premiums (10.3) 19.6 (10.3) 19.6 Increase in deferred acquisition costs (46.1) (18.0) (21.0) (18.0)(Increase) decrease in deferred other expenses (1.1) 48.5 (1.1) 48.5 (Increase) decrease in other assets (10.5) 20.5 (7.8) 20.5 Decrease (increase) in deferred tax assets 1.5 (8.5) - (8.5)(Decrease) increase in payables (290.2) 147.4 (285.4) 147.4 Increase in outstanding claims liabilities 589.0 27.7 587.0 27.7 Increase (decrease) in unearned premium liabilities 40.8 48.5 (27.1) 48.5 Decrease in employee benefit obligations (10.2) (8.4) (5.0) (7.6)Increase (decrease) in deferred tax liabilities 5.6 (15.6) 3.0 (16.4)Movement in net assets due to investing and financing activities 14.5 (55.4) 72.1 (55.4)Net cash from operating activities 461.4 921.8 514.8 958.7
Consolidated Company

Notes to the consolidated financial statements
AAI LIMITED | CONSOLIDATED FINANCIAL REPORT 2014/15 34
26. Financial instruments
26.1 Comparison of fair value to carrying amounts
The following financial assets and liabilities are recognised and measured at fair value and therefore their carrying value equates to their fair value:
financial assets designated at fair value through profit or loss
derivatives
The basis for determining their fair value is described in note 26.2.
Financial assets
The carrying amount of cash and cash equivalents, receivables and other financial assets approximates their net fair value.
Financial liabilities
The fair value of subordinated notes are calculated based on either the quoted market prices at balance date or, where quoted market prices were not available, a discounted cash flow model using a yield curve appropriate to the remaining maturity of the instrument.
For all other financial liabilities, the carrying value is considered to be a reasonable estimate of fair value.
26.2 Fair value hierarchy
Financial assets and liabilities that are recognised and measured at fair value are categorised by a hierarchy which identifies the most significant input used in the valuation methodology:
Level 1 – derived from quoted prices (unadjusted) in active markets for identical financial instruments
Level 2 – derived from other than quoted prices included within Level 1 that are observable for the financial instruments, either directly or indirectly
Level 3 – fair value measurement is not based on observable market data.
Fair values of the significant financial instruments at balance date, classified by fair value hierarchy level are as follows:
There have been no significant transfers between Level 1 and Level 2 during the 2015 and 2014 financial years.
Carrying value
Fair value
Carrying value
Fair value
Consolidated $m $m $m $mFinancial liabilities Subordinated notes 573.6 557.6 730.1 708.3
Company Financial liabilities Subordinated notes 301.4 299.9 486.4 479.3
2015 2014
Level 1 Level 2 Level 3 Total Level 1 Level 2 Level 3 TotalConsolidated $m $m $m $m $m $m $m $mFinancial assetsInvestment securities 1,573.3 9,894.6 - 11,467.9 1,914.6 10,170.0 - 12,084.6 Derivative assets 1.3 22.4 - 23.7 1.0 21.9 - 22.9
1,574.6 9,917.0 - 11,491.6 1,915.6 10,191.9 - 12,107.5 Financial liabilitiesDerivative liabilities 2.6 151.0 - 153.6 27.3 122.0 - 149.3
2.6 151.0 - 153.6 27.3 122.0 - 149.3
CompanyFinancial assetsInvestment securities 1,573.3 9,827.2 - 11,400.5 1,914.6 10,170.0 - 12,084.6 Derivative assets 1.3 22.4 - 23.7 1.0 21.9 - 22.9
1,574.6 9,849.6 - 11,424.2 1,915.6 10,191.9 - 12,107.5 Financial liabilitiesDerivative liabilities 2.6 151.0 - 153.6 27.3 122.0 - 149.3
2.6 151.0 - 153.6 27.3 122.0 - 149.3
2015 2014

Notes to the consolidated financial statements
AAI LIMITED | CONSOLIDATED FINANCIAL REPORT 2014/15 35
26.3 Master netting or similar arrangements
The following table sets out the effect of netting arrangements of financial assets and financial liabilities that are offset in the statements of financial position, or are subject to enforceable master netting arrangements, irrespective of whether they are offset in the statements of financial position.
Derivative assets and liabilities
Offsetting has been applied to the derivatives (e.g. interest rate swaps and foreign currency swaps) in the statements of financial position where there is a legally enforceable right to set off and there is an intention to settle on a net basis.
Certain derivatives are subject to International Swaps and Derivatives Association (ISDA) Master Arrangement and other similar master netting arrangements. These arrangements contractually binds the Group or Company and other counterparties to apply close out netting across all financial transactions only if either party defaults or other pre-arranged termination events occur. As such, they do not meet the criteria for offsetting in the statements of financial position.
The cash collateral pledged or received is subject to ISDA Credit Support Annex and other standard industry terms.
Amounts due to reinsurers
Some reinsurance treaties require netting arrangements whereby the receivable from and the payable to reinsurers are settled on a net basis. As such, offsetting has been applied in the consolidated statement of financial position.
The collateral received are subject to terms and conditions of the respective reinsurance treaties and provide regulatory capital relief from credit exposures to reinsurers.
Repurchase agreements
The Group enters into repurchase agreements involving the sale of interest-bearing securities in exchange for cash and simultaneously agreeing to buy back the interest-bearing securities at a pre-agreed price on a future date. In the statements of financial position, the interest-bearing securities transferred are included in ‘Financial assets designated at fair value through profit or loss’ and the obligation to repurchase is included in ‘Payables and other liabilities’.

Notes to the consolidated financial statements
AAI LIMITED | CONSOLIDATED FINANCIAL REPORT 2014/15 36
26.3 Master netting or similar arrangements (continued)
The following financial assets and financial liabilities are subject to offsetting, enforceable master netting arrangement and similar agreements.
Gross amounts
Offsetting applied
Financial instruments
Cash collateral
Net exposure Total
Consolidated $m $m $m $m $m $m $m2015Financial assetsDerivatives 18.7 - (13.4) (3.2) 2.1 5.0 23.7 Amounts due from reinsurers 122.9 (87.3) - - 35.6 113.7 149.3 Total 141.6 (87.3) (13.4) (3.2) 37.7 118.7 173.0 Financial liabilitiesDerivatives 130.6 - (13.4) (110.7) 6.5 23.0 153.6 Amounts due to reinsurers 112.3 (87.3) - - 25.0 469.5 494.5 Repurchase agreements 92.7 - (92.7) - - - 92.7 Total 335.6 (87.3) (106.1) (110.7) 31.5 492.5 740.8
2014Financial assetsDerivatives 11.5 - (7.4) - 4.1 11.4 22.9 Amounts due from reinsurers 65.4 (41.1) - (1.4) 22.9 24.1 48.4 Total 76.9 (41.1) (7.4) (1.4) 27.0 35.5 71.3
Financial liabilitiesDerivatives 100.5 - (7.4) (87.2) 5.9 48.8 149.3 Amounts due to reinsurers 85.5 (41.1) - - 44.4 443.6 488.0 Total 186.0 (41.1) (7.4) (87.2) 50.3 492.4 637.3
Company2015Financial assetsDerivatives 18.7 - (13.4) (3.2) 2.1 5.0 23.7 Amounts due from reinsurers 122.9 (87.3) - - 35.6 113.7 149.3 Total 141.6 (87.3) (13.4) (3.2) 37.7 118.7 173.0 Financial liabilitiesDerivatives 130.6 - (13.4) (110.7) 6.5 23.0 153.6 Amounts due to reinsurers 112.3 (87.3) - - 25.0 469.5 494.5 Repurchase agreements 92.7 - (92.7) - - - 92.7 Total 335.6 (87.3) (106.1) (110.7) 31.5 492.5 740.8
2014Financial assetsDerivatives 11.5 - (7.4) - 4.1 11.4 22.9 Amounts due from reinsurers 65.4 (41.1) - (1.4) 22.9 24.1 48.4 Total 76.9 (41.1) (7.4) (1.4) 27.0 35.5 71.3
Financial liabilitiesDerivatives 100.5 - (7.4) (87.2) 5.9 48.8 149.3 Amounts due to reinsurers 85.5 (41.1) - - 44.4 443.6 488.0 Total 186.0 (41.1) (7.4) (87.2) 50.3 492.4 637.3
Amounts subject to master netting or similar arrangements
Related amounts not offset on the SOFP
Amounts not subject to
master netting or similar
arrangements

Notes to the consolidated financial statements
AAI LIMITED | CONSOLIDATED FINANCIAL REPORT 2014/15 37
27. Risk management
27.1 Risk management objectives and structure
As the Company and its subsidiaries are entities within the Suncorp Group, the Group follows the Suncorp Group risk management objectives and structure as described below.
The Suncorp Group Limited Board and management recognise that effective risk management is considered to be critical to the achievement of the Suncorp Group’s objectives. The Board Risk Committee (Risk Committee) has delegated authority from the Board to oversee the adequacy and effectiveness of the risk management frameworks and processes within the Suncorp Group.
An Enterprise Risk Management Framework (ERMF) is in place for the Suncorp Group. It is subject to an annual review, updated for material changes as they occur and is approved by the Board. The ERMF comprises:
the Suncorp Group’s risk appetite framework and its link to strategic business and capital plans
accountabilities and governance arrangements for the management of risk within the Three Lines of Defence model
risk management process
The Three Lines of Defence model of accountability involves:
Line of Defence Responsibility of Accountable for
First – Manage risk and comply with Suncorp Group frameworks, policies and risk appetite
All business areas (and staff)
Identify and manage the risks inherent in their operations
Ensure compliance with all legal and regulatory requirements and Suncorp Group policies
Promptly escalate any significant actual and emerging risks for management attention.
Second – Independent functions own and monitor the application of risk frameworks, and measure and report on risk performance and compliance
All risk functions (Suncorp Group and business units)
Design, implement and manage the ongoing maintenance of Suncorp Group risk frameworks and related policies
Advise and partner with the business in the design and execution of risk frameworks and practices
Develop, apply and execute business units’ risk frameworks that are consistent with the Suncorp Group for the respective business areas
Facilitate the reporting of the appropriateness and quality of risk management.
Third – Independent assurance over internal controls and risk management practices
Internal and external auditors
Decides the level and extent of independent testing required to verify the efficacy of internal controls
Validates the overall risk framework Provides assurance that the risk management
practices are functioning as intended.
The Board has delegated authorities and limits to the Group Chief Executive Officer (Group CEO) to manage the business. Management recommends to the Board, and the Board has approved, various frameworks, policies and limits relating to the key categories of risk faced by the Suncorp Group within the Group CEO’s authorities and limits.
The Senior Leadership Team, comprising the Group CEO, Line of Business CEOs and all Group Executives, provides executive oversight and direction-setting across the Suncorp Group, taking risk considerations into account. The Group Chief Risk Officer, a member of the Senior Leadership Team, is charged with the overall accountability for both the ERMF and risk management capability.
The Suncorp Group has in place a number of Management Committees, each with its own charter, to execute specific responsibilities in the risk framework. Management asset and liability committees are in place to provide effective governance over aspects of the risk framework designed to optimise the long-term returns achieved by asset portfolios within the risk appetite or parameters established by the Board.

Notes to the consolidated financial statements
AAI LIMITED | CONSOLIDATED FINANCIAL REPORT 2014/15 38
27.1 Risk management objectives and structure (continued)
There is also an Asset and Liability Committee (ALCO) and a Risk & Governance Committee (RGC). The ALCO provides effective governance over aspects of the risk framework designed to optimise the long-term returns achieved by asset portfolios within any risk appetite or parameters established by the Board.
The primary role of the RGC is to oversee the management of governance and other non-financial aspects of selected risks arising from the activities of the business within the Board approved risk parameters: Insurance Risk, Compliance Risk, Operational Risk and Strategic Risk.
APRA-regulated entities prepare Risk Management Strategies (RMS) approved by the Risk Committee and submit these to APRA annually. The RMS describes the strategy adopted by the Board for managing risk, including the risk appetite, policies, procedures, management responsibilities and controls.
The key risks addressed by the ERMF are defined below.
Key risks Definition
Credit risk (counterparty risk)
The risk to each party to a contract that a counterparty will not meet its financial obligations in accordance with agreed terms.
Liquidity risk The risk that the Group will be unable to service its cash flow obligations today or in the future.
Market risk The risk of unfavourable changes in foreign exchange rates, interest rates, equity prices, credit spreads, commodity prices, and market volatilities.
Asset and liability risk The risk to earnings and capital from mismatches between assets and liabilities with varying maturity and repricing profiles and from mismatches in term.
Insurance risk The risk of financial loss and the inability to meet liabilities due to inadequate or inappropriate insurance product design, pricing, underwriting, concentration risk, reserving, claims management and/or reinsurance management.
Operational risks The risk of financial loss resulting from inadequate or failed internal processes, people and systems or from external events. This includes legal risk but excludes strategic and reputational risks.
Compliance risks The risk of legal or regulatory sanctions, financial loss, or loss to reputation which the Group may suffer as a result of its failure to comply with all applicable regulations, codes of conduct and good practice standards.
Strategic risks The risk that our business model or strategy is not viable due to adverse changes in the business environment.
The Group is exposed to mainly the following categories of market risk:
Categories of market risk
Definition
Foreign exchange (FX) risk
The risk of an asset or liability’s value changing unfavourably due to changes in currency exchange rates.
Interest rate risk The risk of loss of current and future earnings and unfavourable movements in the value of interest bearing assets and liabilities from changes in interest rates.
Equity risk The risk of loss in current and future earnings and unfavourable movement in the value of investments in equity instruments from adverse movements in equity prices.
Credit spread risk Credit spread is the difference in yield due to difference in credit quality. This is the risk of loss in current and future earnings and unfavourable movement in the value of investments from changes in the credit spread as determined by capital market sentiment or factors affecting all issuers in the market and not necessarily due to factors specific to an individual issuer.
Further discussions on the application of the Group’s risk management practices are presented in the following sections:
note 27.2 Insurance risk management
note 27.3 to 27.5 Group risk management for financial instruments: credit, liquidity and market risks; and
note 12 Derivative financial instruments.

Notes to the consolidated financial statements
AAI LIMITED | CONSOLIDATED FINANCIAL REPORT 2014/15 39
27.2 Group insurance risk management
27.2.1 Policies and practices for mitigating insurance risk
Risk appetite statements are in place and controls are implemented to manage the following components of insurance risk:
pricing, including pricing strategies, technical pricing and pricing adequacy reviews
roles and responsibilities for pricing, the development and approval of new products and changes to existing products
processes that identify and respond to changes in the internal and external environment impacting insurance products
underwriting, including processes to consider aggregate exposures from a portfolio perspective to determine the actual exposure to particular risks or an event, monitoring of significant accumulation and concentration of risk, and guidelines around the utilisation of reinsurance in pricing and underwriting
delegated authorities for the acceptance, assessment and settlement of claims including operational and ex-gratia authority limits
procedures relating to the notification, assessment, evaluation, settlement and closure of claims, and processes to detect and reduce loss associated with claims risk; and
reserving practices and procedures at individual claim and portfolio level.
The Board receives Financial Condition Reports from the Appointed Actuaries who also provide advice in relation to premium, issuing of new policies and reinsurance arrangements in accordance with APRA Prudential Standards.
Concentration of insurance risk is mitigated through diversification over classes of insurance business, industry segments, the use of reinsurer coverage and ensuring there is an appropriate mixture of business. Catastrophe and facultative reinsurance contracts are purchased to ensure that any accumulation of losses from a single event is mitigated.
27.2.2 Terms and conditions of insurance business
The majority of direct insurance contracts written are entered into on a standard form basis. Insurance contracts are generally entered into on an annual basis and at the time of entering into a contract all terms and conditions are negotiable or, in the case of renewals, renegotiable. Non-standard and long-term policies may only be written if expressly approved by a relevant delegated authority. There are no special terms and conditions in any non-standard contracts that would have a material impact on the consolidated financial statements. There are no embedded derivatives that are separately recognised from a host insurance contract.
27.3 Credit risk
The Group is exposed to and manages the following key sources of credit risk.
Key sources of credit risk
How are these managed
Premiums receivable For direct business, outstanding premiums on policies arise on those which are generally paid on a monthly instalment basis. Payment default will result in the termination of the insurance contract with the policyowner, as provided by law, eliminating both the credit risk and insurance risk for the unpaid balance.
Where business is written through intermediaries, limited credit is provided under the terms and conditions of the agreement with the respective intermediary, with debtor control ensuring constant attention is paid to minimise overdue debts.
Investments in financial instruments
Investments in financial instruments in the investment portfolios are held in accordance with the investment mandates. Credit limits have been established within these guidelines to ensure counterparties have appropriate credit ratings. An investment framework is in place that sets and monitors investment strategies and arrangements.
Reinsurance recoveries Eligible recoveries under reinsurance arrangements are monitored and managed internally and by specialised reinsurance brokers operating in the international reinsurance market.
Where applicable reinsurers are not APRA-authorised reinsurers, collateralised security of outstanding liabilities is obtained in line with treaty stipulations.

Notes to the consolidated financial statements
AAI LIMITED | CONSOLIDATED FINANCIAL REPORT 2014/15 40
27.3 Credit risk (continued)
The carrying amount of the relevant asset classes in the statement of financial position represents the maximum amount of credit exposures as at the end of the financial year, except for derivatives. The fair value of derivatives recognised in the statement of financial position represents the current risk exposure, but not the maximum risk exposure. The notional value and fair value of derivatives are illustrated in note 12.
The following table provides information regarding credit risk exposure of financial assets, classified according to Standard & Poor’s counterparty credit ratings. AAA is the highest possible rating. Rated assets falling outside the range of AAA to BBB are classified as non-investment grade.
AAA AA A BBB Non-
investment Not
Rated Total Consolidated $m $m $m $m $m $m $m2015Cash and cash equivalents - 48.3 92.1 - - - 140.4 Premiums outstanding - - - - - 2,055.6 2,055.6 Accrued interest 33.8 13.5 28.9 7.3 - - 83.5 Trade and other receivables 34.7 213.5 282.5 - - 12.1 542.8 Derivative financial instruments 1.3 17.0 5.4 - - - 23.7 Interest-bearing investment securities 4,020.4 3,194.1 2,517.0 527.4 1.5 - 10,260.4 Reinsurance and other recoveries receivable 419.5 417.5 196.2 - - 677.7 1,710.9
4,509.7 3,903.9 3,122.1 534.7 1.5 2,745.4 14,817.3 2014Cash and cash equivalents - 24.9 196.9 - - - 221.8 Premiums outstanding - - - - - 2,146.6 2,146.6 Accrued interest 36.4 22.5 28.5 5.9 - - 93.3 Trade and other receivables 22.9 95.9 225.2 - - 25.8 369.8 Derivative financial instruments 1.0 11.5 10.4 - - - 22.9 Interest-bearing investment securities 4,341.1 3,337.4 2,048.2 356.3 - - 10,083.0 Reinsurance and other recoveries receivable 382.0 230.9 168.3 - - 594.9 1,376.1
4,783.4 3,723.1 2,677.5 362.2 - 2,767.3 14,313.5
Company2015Cash and cash equivalents - 33.5 72.2 - - - 105.7 Premiums outstanding - - - - - 2,054.7 2,054.7 Accrued interest 33.8 13.5 28.9 7.3 - - 83.5 Trade and other receivables 34.6 213.5 256.1 - - 10.8 515.0 Derivative financial instruments 1.3 17.0 5.4 - - - 23.7 Interest-bearing investment securities 4,020.4 3,194.1 2,517.0 527.4 1.5 - 10,260.4 Reinsurance and other recoveries receivable 419.4 417.5 196.2 - - 677.7 1,710.8
4,509.5 3,889.1 3,075.8 534.7 1.5 2,743.2 14,753.8 2014Cash and cash equivalents - 21.1 146.5 - - - 167.6 Premiums outstanding - - - - - 2,146.2 2,146.2 Accrued interest 36.4 22.5 28.5 5.9 - - 93.3 Trade and other receivables 22.9 95.9 224.0 - - 27.7 370.5 Derivative financial instruments 1.0 11.5 10.4 - - - 22.9 Interest-bearing investment securities 4,341.1 3,337.4 2,048.2 356.3 - - 10,083.0 Reinsurance and other recoveries receivable 382.0 230.9 168.5 - - 594.7 1,376.1
4,783.4 3,719.3 2,626.1 362.2 - 2,768.6 14,259.6
Credit Rating

Notes to the consolidated financial statements
AAI LIMITED | CONSOLIDATED FINANCIAL REPORT 2014/15 41
27.3 Credit risk (continued)
Notes
1 Receivables neither past due nor impaired in the below table are not rated according to the Standard & Poor’s counterparty credit ratings.
2 Collateral arrangements exist for non-regulated reinsurers and certain derivative positions. Refer to note 26.3 Master netting or similar arrangements for further information.
All financial assets are neither past due nor impaired at balance date except for those disclosed in the following table. An amount is considered past due when a contractual payment falls overdue by one or more days. When an amount is classified as past due, the entire balance is disclosed in the past due analysis presented.
27.4 Liquidity risk
To ensure payments are made when they fall due, the Group has the following key facilities and arrangements in place to mitigate liquidity risks:
investment portfolio mandates provide sufficient cash deposits to meet day-to-day obligations
investment funds set aside within the portfolio can be realised to meet significant claims payment obligations
in the event of a major catastrophe, cash access is available under the terms of reinsurance arrangements
mandated liquidity limits
regularity of premiums received provides substantial liquidity to meet claims payments and associated expenses as they arise; and
flexibility in investment strategies implemented for investment management to provide sufficient liquidity to meet claim payments as they fall due, based on actuarial assumptions.
Neither past due
nor impaired
0-3 mths
3-6 mths
6-12 mths
> 12 mths Impaired Total
Consolidated $m $m $m $m $m $m $m2015Premiums outstanding 1,993.9 32.5 3.8 10.2 10.0 5.2 2,055.6 Trade and other receivables 518.5 23.2 0.1 0.2 0.8 - 542.8
2,512.4 55.7 3.9 10.4 10.8 5.2 2,598.4 2014Premiums outstanding 2,053.5 59.4 8.7 9.6 9.3 6.1 2,146.6 Trade and other receivables 342.8 19.4 2.3 2.5 2.8 - 369.8
2,396.3 78.8 11.0 12.1 12.1 6.1 2,516.4
Company2015Premiums outstanding 1,993.0 32.5 3.8 10.2 10.0 5.2 2,054.7 Trade and other receivables 490.6 23.3 0.1 0.2 0.8 - 515.0
2,483.6 55.8 3.9 10.4 10.8 5.2 2,569.7 2014Premiums outstanding 2,053.0 59.5 8.7 9.6 9.3 6.1 2,146.2 Trade and other receivables 343.6 19.3 2.3 2.5 2.8 - 370.5
2,396.6 78.8 11.0 12.1 12.1 6.1 2,516.7
Past due but not impaired

Notes to the consolidated financial statements
AAI LIMITED | CONSOLIDATED FINANCIAL REPORT 2014/15 42
27.4 Liquidity risk (continued)
The following table summarises the maturity profile of the Group financial liabilities based on the remaining undiscounted contractual obligations.
Carrying amount
1 year or less
1 to 5 years
Over 5 years
Total Cash
Flows Consolidated $m $m $m $m $m2015Payables 1,224.3 1,214.4 9.9 - 1,224.3 Unearned premium liabilities 4,124.2 4,086.0 38.2 - 4,124.2 Subordinated notes 573.6 225.0 364.0 - 589.0
5,922.1 5,525.4 412.1 - 5,937.5 Derivative financial instrumentsDerivative liabilities (net settled) 131.6 24.9 82.2 48.4 155.5 Amounts receivable (gross settled) - (15.0) (263.0) - (278.0)Amounts payable (gross settled) 22.0 9.0 300.0 - 309.0
153.6 18.9 119.2 48.4 186.5 2014Payables 1,514.5 1,497.2 17.3 - 1,514.5 Unearned premium liabilities 4,083.4 4,083.4 - - 4,083.4 Subordinated notes 730.1 217.3 557.6 - 774.9
6,328.0 5,797.9 574.9 - 6,372.8 Derivative financial instrumentsDerivative liabilities (net settled) 100.6 46.4 50.8 23.5 120.7 Amounts receivable (gross settled) - (10.6) (246.4) - (257.0)Amounts payable (gross settled) 48.7 10.4 313.7 - 324.1
149.3 46.2 118.1 23.5 187.8
Company2015Payables 1,503.4 1,261.0 272.9 - 1,533.9 Unearned premium liabilities 4,056.3 4,056.3 - - 4,056.3 Subordinated notes 301.4 210.0 101.0 - 311.0
5,861.1 5,527.3 373.9 - 5,901.2 Derivative financial instrumentsDerivative liabilities (net settled) 131.6 24.9 82.2 48.4 155.5 Amounts receivable (gross settled) - (15.0) (263.0) - (278.0)Amounts payable (gross settled) 22.0 9.0 300.0 - 309.0
153.6 18.9 119.2 48.4 186.5 2014Payables 1,788.8 1,566.6 263.7 - 1,830.3 Unearned premium liabilities 4,083.4 4,083.4 - - 4,083.4 Subordinated notes 486.4 203.6 311.2 - 514.8
6,358.6 5,853.6 574.9 - 6,428.5 Derivative financial liabilitiesDerivative liabilities (net settled) 100.6 46.4 50.8 23.5 120.7 Amounts receivable (gross settled) - (10.6) (246.4) - (257.0)Amounts payable (gross settled) 48.7 10.4 313.7 - 324.1
149.3 46.2 118.1 23.5 187.8

Notes to the consolidated financial statements
AAI LIMITED | CONSOLIDATED FINANCIAL REPORT 2014/15 43
27.5 Market risk
27.5.1 Foreign exchange risk
The Group is exposed to foreign exchange risk through its outstanding claims liability from previously written offshore reinsurance business, predominantly denominated in United States dollars (USD). This exposure is managed using a USD forward exchange contract.
The practice is that all insurance policies are written in Australian dollars, unless separately authorised, with processes’ in place to comply with the Suncorp Group Foreign Exchange Policy.
The Group is also exposed to foreign exchange risk through investments in foreign securities, which is managed via the use of cross-currency swaps. The Group also carries subordinated notes with a foreign currency exposure in GBP, which is managed via the use of cross-currency swaps. The Group utilises a qualifying hedge to significantly reduce this exposure.
A sensitivity analysis showing the impact on profit or loss for changes in foreign exchange rates for exposure as at the balance date with all other variables including interest rates remaining constant is shown in the tables below. There is no impact on equity reserves.
The movements in the foreign exchange used in the sensitivity analysis for 2015 have been revised to reflect updated assessment of the reasonable possible changes in foreign exchange rates over the next twelve months given renewed observations and experience in the investment markets during the financial year.
Exposure at 30 June
Change in FX rate
Profit (loss)
after taxExposure
at 30 JuneChange in
FX rate
Profit (loss)
after taxConsolidated $m % $m $m % $m
129.3 +12 10.4 132.5 +10 8.7 -12 (11.2) -10 (9.7)
37.7 +10 2.5 25.3 +10 1.7 -10 (2.8) -10 (1.9)
13.6 +10 0.9 30.4 +10 2.0 -10 (1.0) -10 (2.2)
11.6 +10 0.8 24.0 +10 1.6 -10 (0.9) -10 (1.8)
34.4 +10 2.3 56.5 +10 3.8 -10 (2.5) -10 (4.1)
Company129.3 +12 10.4 132.5 +10 8.7
-12 (11.2) -10 (9.7)37.7 +10 2.5 25.3 +10 1.7
-10 (2.8) -10 (1.9)13.6 +10 0.9 30.4 +10 2.0
-10 (1.0) -10 (2.2)11.6 +10 0.8 24.0 +10 1.6
-10 (0.9) -10 (1.8)34.4 +10 2.3 56.5 +10 3.8
-10 (2.5) -10 (4.1)
2015 2014
USD
Euro
GBP
JPY
Other
JPY
Other
USD
Euro
GBP

Notes to the consolidated financial statements
AAI LIMITED | CONSOLIDATED FINANCIAL REPORT 2014/15 44
27.5.2 Interest rate risk
Interest rate risk exposure arises mainly from investment in interest-bearing securities and from ongoing valuation of insurance liabilities. The investment portfolios hold significant interest-bearing securities in support of corresponding outstanding claims liabilities and are invested in a manner consistent with the expected duration of claims payments. Interest rate risk is also managed by the controlled use of interest rate derivative instruments.
The sensitivity of profit or loss after tax to movements in interest rates in relation to interest-bearing financial assets held at the balance date is shown in the table below. There is no impact on equity reserves. It is assumed that all residual exposures for the shareholder after tax are included in the sensitivity analysis, that the percentage point change occurs at the balance date and there are concurrent movements in interest rates and parallel shifts in the yield curves. The movements in interest rate used in the sensitivity analysis for 2015 have been revised to reflect an updated assessment of the reasonable possible changes in interest rates over the next twelve months, given renewed observations and experience in the investment markets during the financial year.
The effect of interest rate movements on the Group’s provision for outstanding claims is included in note 20.5.
27.5.3 Equity risk
The Group is exposed to equity risk through investments in international and domestic equity trusts. The tables below present a sensitivity analysis showing the impact on profit or loss after tax for price movements for exposures as at the reporting date, with all other variables remaining constant. There is no impact on equity reserves.
Exposure at 30 June
Change in Interest rate
Profit (loss) after tax
Exposure at 30 June
Change in Interest rate
Profit (loss) after tax
Consolidated $m bp $m $m bp $m
10,130.5 +100 (178.4) 9,956.6 +125 (178.0)
-50 93.6 -25 37.4
452.0 +100 3.2 608.6 +125 5.3
-50 (1.6) -25 (1.1)
Company
10,130.5 +100 (178.4) 9,956.6 +125 (178.0)
-50 93.6 -25 37.4
179.8 +100 1.3 364.9 +125 3.1
-50 (0.6) -25 (0.6)
Interest-bearing investment securities (including derivative financial instruments)Subordinated notes (including derivative financial instruments)
2015 2014
Interest-bearing investment securities (including derivative financial instruments)Subordinated notes (including derivative financial instruments)
Exposure at 30 June
Change in equity prices
Profit (loss)
after taxExposure
at 30 June
Change in equity prices
Profit (loss)
after taxConsolidated $m % $m $m % $mAustralian equities 340.4 +15 35.7 245.5 +15 25.8
-20 (47.7) -15 (25.8)International equities 212.9 +15 22.4 250.7 +15 26.3
-20 (29.8) -15 (26.3)
CompanyAustralian equities 340.4 +15 35.7 245.5 +15 25.8
-20 (47.7) -15 (25.8)International equities 212.9 +15 22.4 250.7 +15 26.3
-20 (29.8) -15 (26.3)
2015 2014
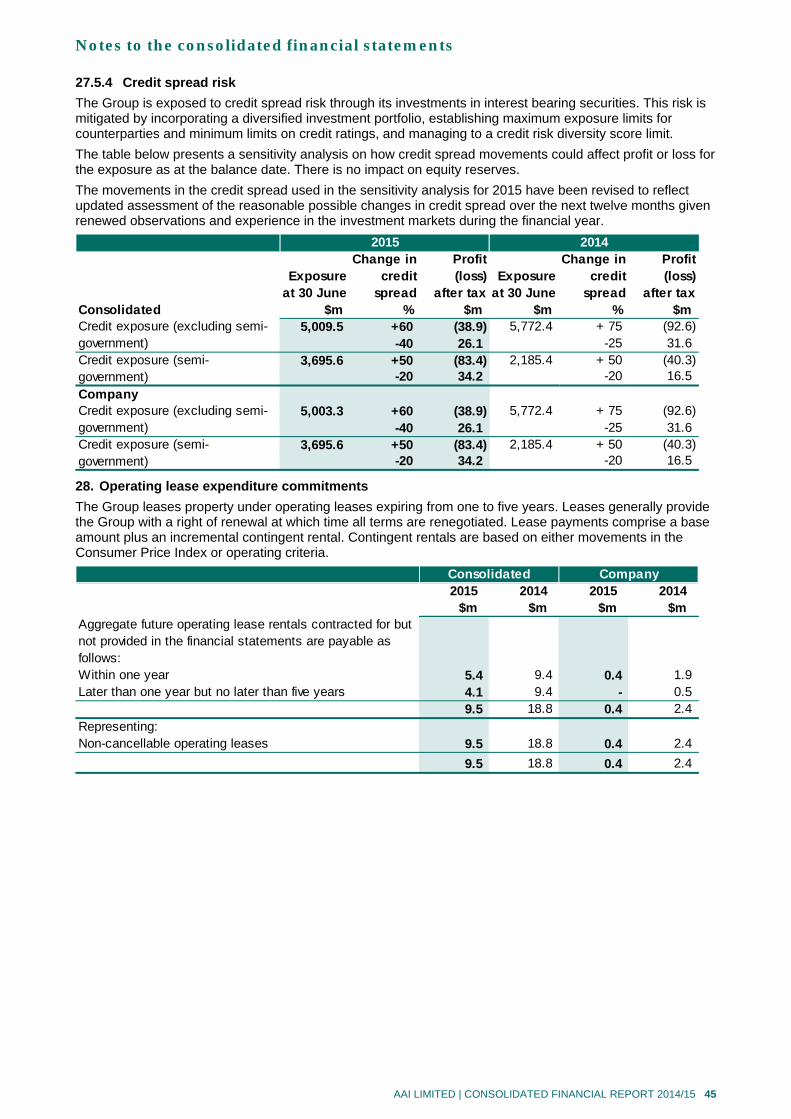
Notes to the consolidated financial statements
AAI LIMITED | CONSOLIDATED FINANCIAL REPORT 2014/15 45
27.5.4 Credit spread risk
The Group is exposed to credit spread risk through its investments in interest bearing securities. This risk is mitigated by incorporating a diversified investment portfolio, establishing maximum exposure limits for counterparties and minimum limits on credit ratings, and managing to a credit risk diversity score limit.
The table below presents a sensitivity analysis on how credit spread movements could affect profit or loss for the exposure as at the balance date. There is no impact on equity reserves.
The movements in the credit spread used in the sensitivity analysis for 2015 have been revised to reflect updated assessment of the reasonable possible changes in credit spread over the next twelve months given renewed observations and experience in the investment markets during the financial year.
28. Operating lease expenditure commitments
The Group leases property under operating leases expiring from one to five years. Leases generally provide the Group with a right of renewal at which time all terms are renegotiated. Lease payments comprise a base amount plus an incremental contingent rental. Contingent rentals are based on either movements in the Consumer Price Index or operating criteria.
Exposure at 30 June
Change in credit
spread
Profit (loss)
after taxExposure
at 30 June
Change in credit
spread
Profit (loss)
after taxConsolidated $m % $m $m % $m
5,009.5 +60 (38.9) 5,772.4 + 75 (92.6)-40 26.1 -25 31.6
3,695.6 +50 (83.4) 2,185.4 + 50 (40.3)-20 34.2 -20 16.5
Company5,003.3 +60 (38.9) 5,772.4 + 75 (92.6)
-40 26.1 -25 31.6 3,695.6 +50 (83.4) 2,185.4 + 50 (40.3)
-20 34.2 -20 16.5
Credit exposure (excluding semi-government)Credit exposure (semi-government)
2015 2014
Credit exposure (excluding semi-government)Credit exposure (semi-government)
2015 2014 2015 2014$m $m $m $m
Aggregate future operating lease rentals contracted for but not provided in the financial statements are payable as follows:Within one year 5.4 9.4 0.4 1.9 Later than one year but no later than five years 4.1 9.4 - 0.5
9.5 18.8 0.4 2.4 Representing:Non-cancellable operating leases 9.5 18.8 0.4 2.4
9.5 18.8 0.4 2.4
Consolidated Company

Notes to the consolidated financial statements
AAI LIMITED | CONSOLIDATED FINANCIAL REPORT 2014/15 46
29. Parent entity and subsidiaries
29.1 Material subsidiaries of the Company
Notes a) The company was acquired on 29 August 2014.
29.2 Change in composition of the Group
The Group acquired MTA Insurance Limited on 29 August 2014.
The fair value of assets and liabilities acquired was $92.7 million and $68.6 million respectively. Consideration paid was $54.2 million. Goodwill and other intangible assets recognised from the business combination was $32.8 million (refer note 15), with a corresponding deferred tax liability of $2.7 million.
The Group did not acquire or dispose of any other material subsidiaries, associations or joint ventures during the current or prior financial year.
29.3 Licence consolidation
On 1 July 2013, as part of the General Insurance One Licence Consolidation (GIOL), the insurance assets and liabilities constituting the business of Australian Alliance Insurance Company Pty Limited, GIO General Pty Limited, Suncorp Metway Insurance Pty Limited and Australian Associated Motor Insurers Pty Limited were transferred to the Company.
In the books of the Company, all insurance assets and liabilities transferred continued to reflect their carrying values in the Company’s consolidated accounting records immediately prior to the transfer, using the Company’s accounting policies prior to the business combinations occurring.
30. Key management personnel disclosures
As a wholly-owned subsidiary of Suncorp Group Limited, key management personnel disclosures (KMP) are consistent with those disclosed by Suncorp Group Limited. Total compensation for KMP of the Company are as follows:
The ultimate parent entity has determined the compensation of KMPs in accordance with their roles within the Suncorp Group. Employee service contracts do not include any compensation, including bonuses, specifically related to the role of KMP of the Company and to allocate a figure may be misleading. There is no link between KMP compensation and the performance of the Company. Therefore, as there is no reasonable basis for allocating a KMP compensation amount to the Company, the entire compensation of the KMPs has been disclosed above.
Subsidiaries Note 2015 2014
% %
Australian Associated Motor Insurers Pty Limited
Ordinary Australia 100 100
MTA Insurance Limited a Ordinary Australia 100 -Suncorp Insurance Funding 2007 Limited Ordinary Australia 100 100 Shannons Auctions Limited Ordinary Australia 100 100
Equity holdingClass of shares
Country of incorporation
2015 2014 2015 2014$'000 $'000 $'000 $'000
Short-term employee benefits 20,499 20,389 20,499 20,389 Long-term employee benefits 5,025 5,248 5,025 5,248 Post-employment benefits 435 416 435 416 Share-based payments 5,628 4,719 5,628 4,719 Termination benefits - 767 - 767
31,587 31,539 31,587 31,539
Consolidated Company

Notes to the consolidated financial statements
AAI LIMITED | CONSOLIDATED FINANCIAL REPORT 2014/15 47
30.1 Other key management personnel transactions with the Company or its subsidiaries or jointly controlled entities
Transactions with directors, executives and their related parties are conducted on arm's length terms and conditions, and are deemed trivial or domestic in nature. These transactions are in the nature of general insurance policies.
No director, executive or their related parties has entered into a material contract with the Group during the reporting period, and there were no material contracts involving directors, executives or their related parties existing at the end of the reporting period.
31. Other related party disclosures
31.1 Identity of related parties
The ultimate parent entity in the wholly owned group is Suncorp Group Limited. The immediate parent entity is Suncorp Insurance Holdings Limited. The Company has a related party relationship with its subsidiaries (refer note 29) and joint ventures (refer note 16.1), its key management personnel and other entities within the Suncorp group.
31.2 Related party transactions with related parties
Transactions between the Company and its subsidiaries, parent entity and ultimate parent entity consisted of dividends received and paid, and interest received and paid.
Transactions between the Group and other related entities consist of interest received on deposits and investment securities held, finance costs, fees received and paid for information technology services, investment management and custodian services, overseas management services, finance facilities and reinsurance arrangements. The Group’s primary banking facilities are held with Suncorp-Metway Limited, a subsidiary of the ultimate parent entity.
All the transactions described above were on commercial terms, except that some advances may be interest free.

Notes to the consolidated financial statements
AAI LIMITED | CONSOLIDATED FINANCIAL REPORT 2014/15 48
31.2 Related party transactions with related parties (continued)
32. Auditor’s remuneration
Fees for services rendered by the Company’s auditor are borne by a related entity within the Suncorp Group.
2015 2014 2015 2014$'000 $'000 $'000 $'000
The aggregate amounts included in the determination of profit or loss and other comprehensive income before tax that resulted from transactions with related parties:Investment revenue including dividend income
Subsidiaries - - 9,464 722,900 Other related parties 4,000 3,500 - 250
Other incomeOther related parties 1,341 628 681 -
Claims expenseOther related parties 419 400 419 400
Interest expenseSubsidiaries - - 14,336 13,456
Investment expensesOther related parties - 5,840 - 5,840
Operating expenses attributionsOther related parties 1,159,569 1,215,211 1,156,985 1,214,848
Cash flow hedges - amounts recognised in equityOther related parties (2,200) (2,400) (2,500) (2,400)
Aggregate balances, amounts receivable from, and payable to, each class of related parties as at the end of the financial year:Derivatives liability
Other related parties 16,600 38,200 16,600 38,200 Financial assets designated at fair value through profit or loss
Other related parties 1,069,147 2,001,571 1,001,690 2,001,571 Receivables
Subsidiaries - - 12,486 8,591 Other related parties 232,047 196,839 193,102 195,154 Parent entity 173 - 173 -
Payables and other liabilitiesParent entity - 55,388 - 55,388 Subsidiaries - - 266,285 265,236 Other related parties 383,798 570,110 380,003 570,386
Consolidated Company
2015 2014 2015 2014$'000 $'000 $'000 $'000
KPMG AustraliaAudit and review services
Audit and review of financial reports 1,720 1,618 1,580 1,505 Other regulatory audits 341 327 296 298
2,061 1,945 1,876 1,803 Other services
In relation to other assurance, actuarial, taxation and non-audit services 350 442 345 442
Total auditor's remuneration 2,411 2,387 2,221 2,245
Consolidated Company

Notes to the consolidated financial statements
AAI LIMITED | CONSOLIDATED FINANCIAL REPORT 2014/15 49
33. Contingent assets and liabilities
33.1 Contingent assets
There are claims and possible claims made by the Group against external parties, the aggregate amount of which cannot be readily quantified. Where considered appropriate, legal advice has been obtained. The Group does not consider that the outcome of any such claims known to exist at the date of this report, either individually or in aggregate, is likely to have a material effect on its operations or financial position. The directors are of the opinion that receivables are not required in respect of these matters, as it is not virtually certain that future economic benefits will eventuate or the amount is not capable of reliable measurement.
33.2 Contingent liabilities
There are outstanding court proceedings, potential fines, claims and possible claims against the Group, the aggregate amount of which cannot be readily quantified. Where considered appropriate, legal advice has been obtained. The Group does not consider that the outcome of any such claims known to exist at the date of this report, either individually or in aggregate, are likely to have a material effect on its operations or financial position. The directors are of the opinion that provisions are not required in respect of these matters, as it is not probable that a future sacrifice of economic benefits will be required or the amount is not capable of reliable measurement.
The parent entity has provided written undertakings to a wholly-owned subsidiary and to related party entities to provide financial support, where necessary, to enable the entities to meet their financial obligations as and when they fall due, until such time as the financial statements for the year ended 30 June 2015 are approved by the Board of directors.
34. Significant accounting policies
The Group’s significant accounting policies set out below have been consistently applied by all Group entities to all periods presented in these consolidated financial statements.
34.1 Basis of consolidation
The Group’s consolidated financial statements are financial statements of the Company and all its subsidiaries presented as those of a single economic entity. Intra-group transactions and balances are eliminated on consolidation.
(a) Subsidiaries
Subsidiaries are entities controlled by the Group which includes companies, managed funds and trusts. The Group controls an entity when it is exposed to, or has rights to, variable returns from its involvement with the entity and has the ability to affect those returns through its power over the entity. Subsidiaries are consolidated from the date when control commences until the date when control ceases.
Business combinations
The acquisition method of accounting is used to account for business combinations by the Group.
The cost of an acquisition is measured as the fair value of the assets transferred, liabilities incurred, and equity instruments issued by the Group at the acquisition date. Acquisition-related costs are expensed in the period in which they are incurred. Where equity instruments are issued in an acquisition, their fair value is the published market price at the acquisition date. Transaction costs arising on the issue of equity instruments are recognised directly in equity.
The acquiree’s identifiable assets acquired, liabilities assumed, contingent liabilities, and any non-controlling interests are measured at their fair values at the acquisition date. If the consideration transferred and any non-controlling interest in the acquiree is greater than the fair value of the net amounts of the identifiable assets acquired and liabilities assumed, the excess is recorded as goodwill; otherwise, the difference is recognised immediately in profit or loss after a reassessment of the identification and measurement of the net assets acquired.
Business combination of entities under common control
In a business combination arising from transfers of interests in entities that are under the control of the ultimate parent entity, the assets and liabilities are acquired at the carrying amounts recognised previously in the Group’s consolidated financial statements.

Notes to the consolidated financial statements
AAI LIMITED | CONSOLIDATED FINANCIAL REPORT 2014/15 50
34.2 Insurance managed funds
The Company is licensed to maintain statutory insurance funds for external clients. The application of the statutory funds by the Company is restricted to the collection of premiums and the payment of claims, related expenses and other payments authorised under the relevant Acts. The Company is not liable for any deficiency in the funds, or entitled to any surplus. For these reasons, the directors are of the opinion that the Company does not have control over, nor have the capacity to control, the statutory funds. The statutory funds are of a separate and distinct nature. Therefore the statutory funds are not consolidated into the Group’s consolidated financial statements.
34.3 Foreign currency transactions
(a) Foreign currency transactions
Transactions denominated in foreign currencies are translated into the functional currency of the operation using the spot exchange rates ruling at the date of the transaction. Foreign currency monetary assets and liabilities at reporting date are translated into the functional currency using the spot exchange rates current on that date. The resulting differences on monetary items are recognised in the profit or loss as exchange gains/losses in the financial year in which the exchange rates difference arises. Foreign currency non-monetary assets and liabilities that are measured in terms of historical cost are translated using the exchange rate at the date of the transaction. Foreign currency non-monetary assets and liabilities that are stated at fair value are translated using exchange rates at the dates the fair value was determined.
Where a foreign currency transaction is part of a hedge relationship, it is accounted for as above, subject to the hedge accounting rules set out in note 34.11.
(b) Financial reports of foreign operations
The assets and liabilities of foreign operations are translated to Australian dollars at exchange rates at the reporting date. The income and expenses of foreign operations are translated at rates approximating the foreign exchange rates ruling at the dates of the transactions. Foreign exchange differences arising on translation are recognised in other comprehensive income and presented in the foreign currency translation reserve.
34.4 Revenue and expense recognition
(a) Premium revenue
Premium revenue comprises amounts charged to policyowners and includes applicable levies and charges such as fire service levies but excludes stamp duty collected on behalf of third parties such as GST. Premiums are recognised as revenue in accordance with the pattern of the underlying risk exposure from the date of attachment over the period of the insurance policy, which is usually one year.
Premiums on unclosed business are brought to account by reference to the prior year’s experience and information that has become available between the reporting date and the date of completing the consolidated financial statements.
(b) Claims expenses
Claims expense represents payments for claims and the movement in outstanding claims liabilities. Claims represent the benefits paid or payable to the policyowner on the occurrence of an event giving rise to a loss or accident according to the terms of the policy. Claims expenses are recognised in profit or loss as losses are incurred, which is usually the point in time when the event giving rise to the claim occurs.
(c) Reinsurance
Outwards reinsurance expense
Premiums ceded to reinsurers are recognised as an expense from the attachment date over the period of indemnity of the reinsurance contract in accordance with the expected pattern of the incidence of risk.
Reinsurance premiums are deferred and recognised as an asset where there are future economic benefits to be received from reinsurance premiums.
Reinsurance and other recoveries revenue
Reinsurance and other recoveries receivables are measured as the present value of the expected future receipts, calculated on the same basis as outstanding claims liabilities.
(d) Investment revenue
Interest income is recognised in profit or loss using the effective interest method.
Dividends and distribution income are recognised when the right to receive income is established.

Notes to the consolidated financial statements
AAI LIMITED | CONSOLIDATED FINANCIAL REPORT 2014/15 51
34.4 Revenue and expense recognition (continued)
(e) Insurance managed funds income
The Group manages statutory insurance funds for external clients and earns income from the provision of services such as premium collection and claims processing (base fee) as well as an incentive fee based on performance results. Income for the base fee is recognised as the service is provided and for the incentive fee, as the income is earned.
Fees receivables are based on management’s best estimate of the likely fee at balance date. There is a significant amount of judgment involved in the estimation process of the fees receivable which may not be finalised for a number of years.
The statutory authorities allocate the base fee to each authorised agent based on factors such as market share and service capability. The performance fee is allocated to each authorised agent based on performance components set by each statutory authority.
(f) Fees and other income
Fees and other income are recognised in profit or loss on an accruals basis as the services are rendered.
(g) Levies and charges
Levies and charges imposed on the Group by various authorities are expensed to profit or loss on a basis consistent with the recognition of premium revenue. These include fire service levies, Medical Care and Injury Services Levy, NSW Insurance Protection Tax and Workers’ Compensation levies. The portion of levies and charges payable at reporting date relating to unearned premium is recorded as other deferred insurance assets. A liability is recognised for levies and charges payable at the reporting date.
(h) Finance costs
Finance costs include interest expense on financial liabilities (borrowing costs) and transactions costs relating to borrowings. Finance costs are expensed as incurred and are recognised net of any associated hedge transactions.
Finance costs on subordinated notes includes interest expense, fair value movements on derivative instruments relating to subordinated notes, amortisation of discounts relating to subordinated notes and amortisation of ancillary costs incurred in connection with arrangement of subordinated notes.
34.5 Income tax
Income tax expense comprises current and deferred tax and is recognised in the profit or loss except to the extent it relates to items recognised in equity or in other comprehensive income.
Current tax consists of the expected tax payable on the taxable income for the year, after any adjustments in respect of previous years.
Deferred tax is recognised in respect of temporary differences between the carrying amounts of assets and liabilities for financial reporting purposes and the amounts used for taxation purposes.
Deferred tax assets are recognised where it is probable that future taxable profits will be available against which the temporary differences can be utilised. Provisions for taxation require the Group to take into account the impact of uncertain tax positions. For such uncertainties, the Group relies on estimates and assumptions about future events.
Tax consolidation
The Group is a wholly-owned entity in a tax-consolidated group, with Suncorp Group Limited as the head entity.
The Company and each of its wholly-owned subsidiaries recognise the current and deferred tax amounts applicable to the transactions undertaken by it, reasonably adjusted for certain intra-group transactions, as if it continued to be a separate tax payer. The head entity recognises the entire tax-consolidated group’s current tax liability. Any differences, per subsidiary, between the current tax liability and any tax funding arrangement amounts (see below) are recognised by the head entity as an equity contribution to or distribution from the subsidiary.
The members of the tax-consolidated group have entered into a tax-sharing agreement and a tax funding agreement. The tax funding agreement sets out the funding obligations of the members. The assets and liabilities arising under the tax funding agreement are recognised as intercompany assets and liabilities, at call.
Taxation of financial arrangements (TOFA)
The Group has accepted the default method of accruals or realisation and has not made any elections regarding transitional financial arrangements or other elective timing methods.

Notes to the consolidated financial statements
AAI LIMITED | CONSOLIDATED FINANCIAL REPORT 2014/15 52
34.6 Goods and services tax (GST)
Revenues, expenses and assets are recognised net of GST, except where the amount of GST incurred is not recoverable. In these circumstances the GST is recognised as part of the cost of acquisition of the asset or the amount of expense.
Receivables, payables and the provision for outstanding claims are stated with the amount of GST included.
34.7 Cash and cash equivalents
Cash and cash equivalents include cash on hand, cash on deposit and money at short call. They are measured at face value or the gross value of the outstanding balance.
34.8 Non-derivative financial assets
(a) Financial assets at fair value through profit or loss
Financial assets at fair value through profit or loss are classified as either held for trading or are designated as such upon initial recognition as a result of the following:
if the Group manages such investments, evaluates the performance and makes purchase and sale decisions based on their fair value in accordance with the Suncorp Group's documented risk management or investment strategy; or
it eliminates or significantly reduces ‘an accounting mismatch’.
They are initially recognised on trade date at fair value. Transaction costs are recognised in the profit or loss as incurred. Subsequently, the assets are measured at fair value each reporting date and any gains or losses are taken immediately to the profit or loss.
(b) Receivables
Receivables are financial assets with fixed or determinable payments that are not quoted in an active market. They are initially recognised on the date that they originated at fair value plus any directly attributable transaction costs and subsequently measured at amortised cost using the effective interest method, less any impairment losses.
(c) Derecognition of financial assets
Financial assets are derecognised when the rights to receive future cash flows from the assets have expired, or have been transferred, and the Suncorp Group has transferred substantially all risk and rewards of ownership.
34.9 Assets backing general insurance liabilities
The assets of the Group are assessed under AASB 1023 General Insurance Contracts to be assets that are held to back general insurance liabilities (referred to as insurance funds) and assets that represent shareholder funds.
The Group has designated financial assets held in portfolios intended to match the average duration of a corresponding insurance liability as assets backing general insurance liabilities. These financial assets include investment securities and are designated at fair value through profit or loss as they are managed and their performance evaluated on a fair value basis for internal and external reporting in accordance with the investment strategy.
All investment securities held to back general insurance liabilities are highly liquid securities. Despite some of these securities having maturity dates beyond the next twelve months, as they are highly liquid in nature and are actively traded, they have been classified as current.
34.10 Derivative financial instruments
The Group holds derivative financial instruments to hedge the Group's assets and liabilities or as part of the Group's trading and investment activities. Derivatives include exchange rate related contracts, interest rate related contracts and equity contracts.
All derivatives are initially recognised at fair value on trade date and transaction costs are recognised in profit or loss as incurred. Derivatives are classified and accounted for as held for trading financial assets at fair value through profit or loss (note 34.8(a)) unless they qualify as a hedging instrument in an effective hedge relationship under hedge accounting (note 34.11).

Notes to the consolidated financial statements
AAI LIMITED | CONSOLIDATED FINANCIAL REPORT 2014/15 53
34.11 Hedge accounting
The Group applies hedge accounting to offset the effects on profit or loss of changes in the fair values of the hedging instrument and the hedged item.
(a) Cash flow hedges
Changes in the fair value associated with the effective portion of a hedging instrument designated as a cash flow hedge are recognised in other comprehensive income and accumulated in the hedging reserve within equity as the lesser of the cumulative fair value gain or loss on the hedging instrument and the cumulative change in fair value on the hedged item from the inception of the hedge. Ineffective portions are immediately recognised in the profit or loss.
If the hedging instrument no longer meets the criteria for hedge accounting, expires or is sold, terminated or exercised or, the hedge relationship is revoked, then hedge accounting is discontinued prospectively. The cumulative gain or loss previously recognised in equity remains there until the forecast transaction affects profit or loss. When a forecast transaction is no longer expected to occur, the amounts accumulated in equity are released to profit or loss immediately. In other cases the cumulative gain or loss previously recognised in equity is transferred to profit or loss in the same period that the hedged item affects profit or loss.
(b) Fair value hedges
Where an effective hedge relationship is established, fair value gains or losses on the hedging instrument are recognised in profit or loss. The hedged item attributable to the hedged risk is carried at fair value with the gain or loss recognised in profit or loss.
When a hedge relationship no longer meets the criteria for hedge accounting, the hedged item is accounted for under the effective interest method from that point and any accumulated adjustment to the carrying value of the hedged item from when it was effective is released to profit or loss over the period to when the hedged item will mature.
34.12 Impairment
(a) Financial assets
Financial assets, other than those measured at fair value through profit or loss, are assessed at each reporting date to determine whether there is any objective evidence of impairment. If impairment has occurred, the carrying amount of the asset is written down to its estimated recoverable amount.
(b) Non-financial assets
Non-financial assets are assessed for indicators of impairment at each reporting date. If any such indication exists, the asset’s recoverable amount is estimated in order to determine the extent of the impairment loss (if any).
For the purposes of assessing impairment, assets are grouped at the lowest levels for which there are separately identifiable cash flows (cash generating unit (‘CGUs’)) – this may be an individual asset or a group of assets. The recoverable amount of non-financial assets is the greater of fair value less costs to sell and value in use. In assessing value in use, the estimated future cash flows are discounted to their present value using a pre-tax discount rate that reflects current market assessments of the time value of money and the risks specific to the asset or CGU.
Impairment losses are recognised in profit or loss if the carrying amount of an asset or CGU exceeds its recoverable amount. Impairment losses, if any, recognised in respect of CGUs are allocated first to reduce the carrying amount of any goodwill allocated to CGUs and then to reduce the carrying amount of the other assets in the unit on a pro-rata basis.
An impairment loss recognised for goodwill is not reversed.
34.13 Non-derivative financial liabilities
Financial liabilities carried at amortised cost are initially measured at fair value plus any directly attributable transaction costs. They are subsequently measured at amortised cost using the effective interest method. This includes payables and subordinated notes.
Non-derivative liabilities are derecognised when the contractual obligations are discharged, cancelled or expired.

Notes to the consolidated financial statements
AAI LIMITED | CONSOLIDATED FINANCIAL REPORT 2014/15 54
34.14 Employee benefits liabilities
(a) Short-term employee benefits
Liabilities for short-term employee benefits are those expected to be settled wholly before twelve months after the end of the annual reporting period in which the employees render the related services. They are measured at the amounts expected to be paid when the liabilities are settled. Related on-costs such as superannuation, workers’ compensation and payroll tax are also included in the liability.
(b) Long service leave and annual leave
The liability for long service leave and annual leave is not expected to be settled wholly before twelve months after the end of the annual reporting period. It is recognised as the present value of expected future payments to be made in respect of services provided by employees up to the reporting date. Consideration is given to expected future wage and salary levels, experience of employee departures and periods of service. Expected future payments are discounted using Commonwealth Government bond rates with terms to maturity that match, as closely as possible, the estimated future cash outflows. Related on-costs such as superannuation, workers’ compensation and payroll tax are also included in the liability.
34.15 Contingent liabilities and contingent assets
Contingent liabilities are not recognised but are disclosed in the financial report, unless the possibility of settlement is remote, in which case no disclosure is made. If settlement becomes probable and the amount can be reliably estimated, a provision is recognised.
Contingent assets are not recognised but are disclosed in the financial report when inflows are probable. If inflows become virtually certain, an asset is recognised.
The amount disclosed as a contingent liability or contingent asset is the best estimate of the settlement or inflow.
34.16 Deferred acquisition costs (DAC)
Acquisition costs are deferred and recognised as an asset where they can be reliably measured and where it is probable that they will give rise to premium revenue that will be recognised in profit or loss in subsequent reporting periods.
DAC are amortised systematically in accordance with the expected pattern of the incidence of risk under the general insurance contracts to which they relate.
DAC are recognised as assets to the extent that the related unearned premiums exceed the sum of the DAC and the present value of both future expected claims and settlement costs, including an appropriate risk margin. Where there is a shortfall, the DAC asset is written down and if insufficient, an unexpired risk liability is recognised.
34.17 Unearned premium liabilities
Premium revenue received and receivable but not earned is recognised as unearned premium liabilities.
The carrying value of unearned premium liabilities is assessed at each reporting date by carrying out a liability adequacy test (LAT). This test assesses whether the net unearned premium liabilities less any DAC is sufficient to cover future claims costs for in-force insurance contracts. Future claims costs are calculated as the present value of the expected cash flows relating to future claims, and include a risk margin to reflect the inherent uncertainty in the central estimate. The assessment is carried out on a portfolio of contracts basis. If a LAT deficiency occurs, it is recognised in the profit or loss with a corresponding write-down of the related DAC asset. Any remaining balance is recognised as an unexpired risk liability on the consolidated statement of financial position.
34.18 Outstanding claims liabilities
The outstanding claims liability is measured as the central estimate of the present value of expected future payments against claims incurred at the reporting date and includes an additional risk margin to allow for the inherent uncertainty in the central estimate.
Standard actuarial methods are applied to all classes of business to assess the net central estimate of outstanding claims liabilities. The outstanding claims liability is heavily dependent on assumptions and judgments. The details of actuarial assumptions and the process for deferring the risk margins are set out in note 20.4.

Notes to the consolidated financial statements
AAI LIMITED | CONSOLIDATED FINANCIAL REPORT 2014/15 55
34.19 New accounting standards and interpretations not yet adopted
AASB 9 Financial Instruments was issued and introduces changes in the classification and measurement of financial assets and financial liabilities, impairment of financial assets and new rules for hedge accounting. This standard becomes mandatory for the Group’s 30 June 2019 financial statements. The potential effects on adoption of the standard are currently being assessed. It is available for early adoption but has not been applied by the Group in this financial report.
35. Subsequent events
Effective 1 July 2015, the Company executed the abovementioned court approved Scheme of Arrangement to consolidate the business of the Company and MTAIL. As a result of these transactions, the Australian general insurance assets and liabilities of MTAIL were transferred to the Company.
There has not arisen in the interval between the end of the financial period and the date of this report any item, transaction or event of a material and unusual nature likely, in the opinion of the directors of the Company, to affect significantly the operations of the Group, the results of those operations, or the state of affairs of the Group in future financial years.


AAI LIMITED | CONSOLIDATED FINANCIAL REPORT 2014/15 57
Liability limited by a scheme approved under Professional Standards Legislation.
KPMG, an Australian partnership and a member firm of the KPMG network of independent member firms affiliated with KPMG International Cooperative (“KPMG International”), a Swiss entity.
Independent auditor’s report to the members of AAI Limited
Independent auditor’s report to the members of AAI Limited
Report on the financial report
We have audited the accompanying financial report of AAI Limited (the Company), which comprises the statements of financial position as at 30 June 2015, and statements of comprehensive income, statements of changes in equity and statements of cash flows for the year ended on that date, notes 1 to 35 comprising a summary of significant accounting policies and other explanatory information and the directors’ declaration of the Company and the Group comprising the Company and the entities it controlled at the year’s end or from time to time during the financial year.
Directors’ responsibility for the financial report
The directors of the Company are responsible for the preparation of the financial report that gives a true and fair view in accordance with Australian Accounting Standards and the Corporations Act 2001 and for such internal control as the directors determine is necessary to enable the preparation of the financial report that is free from material misstatement whether due to fraud or error. In note 2.1, the directors also state, in accordance with Australian Accounting Standard AASB 101 Presentation of Financial Statements, that the financial statements comply with International Financial Reporting Standards.
Auditor’s responsibility
Our responsibility is to express an opinion on the financial report based on our audit. We conducted our audit in accordance with Australian Auditing Standards. These Auditing Standards require that we comply with relevant ethical requirements relating to audit engagements and plan and perform the audit to obtain reasonable assurance whether the financial report is free from material misstatement.
An audit involves performing procedures to obtain audit evidence about the amounts and disclosures in the financial report. The procedures selected depend on the auditor’s judgment, including the assessment of the risks of material misstatement of the financial report, whether due to fraud or error. In making those risk assessments, the auditor considers internal control relevant to the entity’s preparation of the financial report that gives a true and fair view in order to design audit procedures that are appropriate in the circumstances, but not for the purpose of expressing an opinion on the effectiveness of the entity’s internal control. An audit also includes evaluating the appropriateness of accounting policies used and the reasonableness of accounting estimates made by the directors, as well as evaluating the overall presentation of the financial report.
We performed the procedures to assess whether in all material respects the financial report presents fairly, in accordance with the Corporations Act 2001 and Australian Accounting Standards, a true and fair view which is consistent with our understanding of the Company’s and the Group’s financial position and of their performance.
We believe that the audit evidence we have obtained is sufficient and appropriate to provide a basis for our audit opinion.
Independence
In conducting our audit, we have complied with the independence requirements of the Corporations Act 2001.