Embed Size (px)
DESCRIPTION
salary compression
Citation preview
Using Stochastic Dominance to Investigate Salary Inversion in Business Schools
Tom Arnold
Raymond P. H. Fishe Robins School of Business University of Richmond Richmond, VA 23173
Adam Schwartz
Williams School of Commerce, Economics and Politics
Washington & Lee University Lexington, VA 24450
ABSTRACT The paper analyzes AACSB salary survey information from 1979 to 2005. The question addressed in this analysis is whether salary inversion is wide-spread across the business disciplines. We find limited evidence of mean level inversions, which is concentrated in recent years. Stochastic dominance methods confirm these results. We also develop a measure of salary dominance based on comparing the distribution of reported salaries. This statistic shows a significant trend towards salary inversion in most AACSB disciplines.
Contact author: [email protected]
804-287-1269
Draft: September 2008 Comments Welcome
Please do not cite or quote without permission of the authors
Pat Fishe thanks the Robins School of Business for generous research support and assistance with purchases of AACSB data. The authors also wish to thank Eli Bauman and Neil Biller for very capable research assistance and data collection. Also, special thanks to Joseph Mondello (AACSB) for assembling copies of the early salary survey reports. All errors are our own responsibility.
Using Stochastic Dominance to Investigate Salary Inversion in Business Schools
I. Introduction Every year academic department chairs and deans deliberate over salary
adjustments from limited raise pools. Generally, business schools base a substantial
portion of these raise adjustments on merit, as opposed to rank or length of service. Even
so, considerations of equity are not lost in the process. In particular, the phenomenon of
salary inversion may arise in some disciplines, which may task administrators to explain
their decisions. Salary inversion occurs when a faculty member of higher rank receives a
salary less than that of a faculty member of lower rank.1 Salary inversion may also arise
after the hiring of new junior faculty members and provides insight into the basic supply
and demand conditions in the market. As merit considerations may be difficult to
quantify and comparisons of records and experience equally difficult to develop
objectively, those faculty affected by salary inversion may feel wronged or disadvantaged
by the raise or hiring processes.
In an effort to provide better information to all faculty and administrators, we
investigate the extent of salary inversion in business schools accredited by the
Association to Advance Collegiate Schools of Business (AACSB). We study eight
disciplines: Accounting, Computer Information Systems (CIS), Economics, Finance,
Management, Marketing, Organizational Behavior, and Operations Management. We
use data collected by the AACSB in its annual salary survey. Our dataset covers the
1 Toutkoushian, (1998) uses “level of experience” instead of rank to define salary inversion. We will use the rank measure, as the level of experience is not available from the AACSB salary surveys.
2
years, 1979 to 2005. These are aggregate data, which reveal means, medians and other
selected distributional information on academic salaries. We document mean levels of
salary inversion between assistant and associate professor ranks for Finance and
Accounting disciplines at both private and public business schools, and for Economics
and Operations Management at private schools. Typically, these average level inversions
arise first at private schools and then at public schools. All of these inversions begin in
the late 1990s or early 2000s. We find little evidence of sustained inversions between
assistant and associate professors or any years with average level inversions between
associate and full professors in these business disciplines.
We also analyze the distribution of salaries across disciplines and ranks over the
AACSB data. We examine whether junior ranks dominate the more senior ranks in terms
of first- and second-degree stochastic dominance. We use stochastic dominance methods
because they offer information on all salaries within a rank, not just a summary
comparison such as provided by mean or median statistics. First-degree stochastic
dominance implies that salaries are uniformly higher across the entire distribution of all
junior faculty members. Thus, first-degree dominance is a stronger statement about
salary conditions between ranks than a comparison of means, and implies a greater
burden on administrators to explain relative salary levels and adjustments. Note that if a
junior rank is first-degree dominate over a more senior rank then the average salary of the
junior rank will be greater than the average salary of the more senior rank.2 Therefore,
first-degree stochastic dominance implies average-level salary inversion, but not vice
versa.
2 There is an extensive literature on the use of stochastic dominance in portfolio selection and decision-making under uncertainty. See Levy (2006) for comprehensive discussion of this literature and stochastic dominance theorems.
3
Evidence of first-degree stochastic dominance in any period is also likely to imply
substantial salary changes in future periods when some junior faculty are promoted and
move up through the ranks. LeClair (2004) makes a similar point while discussing the
2003-2004 AACSB salary survey: “…most recent trends still hold. For instance, the
inversion of salary rates—where new hires earn as much or more than experienced
faculty—is still in place and will inevitably contribute to the escalation of salaries across
all categories.”
We test for second-degree stochastic dominance when the salary distributions
cross, which negates evidence of first-degree dominance. Second-degree stochastic
dominance also implies that salaries show inversion at the mean.3 However, when there
is no first-degree dominance, second-degree dominance allows some salaries for faculty
at senior ranks to exceed those of junior ranks when matched along the probability
distribution of salaries. In effect, business schools exhibit a spectrum of faculty quality,
which leads to both higher and lower relative salaries from rank comparisons. With
second-degree dominance, we develop a summary statistic to define the incidence of
dominance between two salary distributions. This statistic reveals the fraction of the
junior rank distribution that dominates a more senior rank distribution.
Our results show only a limited number of years with stochastic dominance in
which a junior rank dominates a senior rank. We find no examples of either first- or
second-degree dominance for associate and full professors, and only four years with
second-degree dominance between assistant and associate professors. These are all
recent years and arise in the disciplines of Finance and Operations Management.
3 Strictly speaking, if X is second-degree stochastically dominant over Y then E[X] ≥ E[Y].
4
To address the issue of faculty quality with the AACSB data, we perform separate
analyses for private and public business schools. We also re-calculate salary distributions
after adjusting for non-overlapping observations. Specifically, many business schools
may have senior faculty members who have substituted away from the school’s mission
or otherwise become less productive, and the salary of such faculty will be relatively low
as a result. Alternatively, some schools may have recently hired outstanding senior
scholars at salaries far above those at the same rank. These outliers may significantly
affect our mean level and distributional comparisons. To eliminate this problem, we
adjust the salary distributions such that only salaries that overlap between rank
comparisons are included in the analysis.
For example, assistant professors of finance had a salary range of $48,700 to
$171,800 in the 2004-2005 AACSB salary survey of private accredited schools, while
associate professors of finance had a range of $43,400 to $195,400. At the mean, assistant
professors earn $116,600 and associate professors earn $112,500, which indicates salary
inversion. However, these data only overlap for the assistant professor range, so we re-
calculate the associate professor distribution to make mean and stochastic dominance
comparisons only over this range. This has the effect of shifting the associate professor
(conditional) mean to $117,006, which no longer shows salary inversion. In effect, by
comparing faculty with overlapping salaries—who arguably may have similar levels of
productivity—we introduce a control for quality differences that left uncontrolled may
skew our results.
Our research relates to recent work on salary compression in higher education
(Toutkoushian (1998) and Barbezat (2004)). Salary inversion is closely associated with
5
salary compression, which occurs when salaries for different ranks approach each other
over time. Toutkoushian (1998) suggests that salary compression (or inversion) arises in
institutions that have hired several new junior faculty members, but failed to adjust
compensation levels to existing faculty members. He develops a regression procedure to
estimate what junior faculty would earn if they were compensated according to the
mechanism used for more senior faculty. Barbezat (2004) applies this method to two
national surveys of faculty salary and finds evidence of salary compression across a range
of disciplines. By using the AACSB survey data, we also provide evidence for a national
sample, although our methods are different because we do not observe individual faculty
data.
The outline of this paper is as follows. In section II, we discuss the development
of the AACSB salary surveys and the extent of information provided about salary
distributions. Section III investigates mean level salary inversion and documents
inversion differences between private and public business schools. This section also
provides a detailed discussion of the Finance discipline. Section IV introduces stochastic
dominance methods and applies them to the AACSB data. We modify these methods to
help control for quality differences among faculty and develop a statistic to measure the
degree of dominance between faculty ranks. Section V offers our conclusions.
II. Data
The AACSB has conducted salary surveys from member business schools since
1968. The early salary surveys (1968-71) were more general data collection and
reporting efforts. Beginning in 1972, member institutions reported detailed information
6
that included means and standard deviations. These detailed surveys reports
distinguished salary information by discipline, degree-granting level, enrollment and
regional categories. Beginning with the 1977-78 survey, the AACSB changed the
method by which it reported salary distributions, providing data on salaries at specific
percentiles. The percentile breakdown reported maximum and minimum salaries as well
as salary cutoffs for the 10%, 25%, 50%, 75%, and 90% levels. The mean salaries
continued to be reported, but the standard deviations were dropped after 1978.
Throughout the years since 1978, the AACSB continued to modify what information they
collected. In 1983, it introduced additional discipline distinctions—particularly the
Management discipline was further distinguished with Organizational Behavior and
Operations Management distinctions. However, the basic format of the salary
information—means and percentiles—remained the same, so these reports continued to
provide a consistent series on annual academic compensation in business schools.
As an accrediting body, the response rates to these surveys have always been
high, typically above 90 percent for accredited schools and around 50 percent for non-
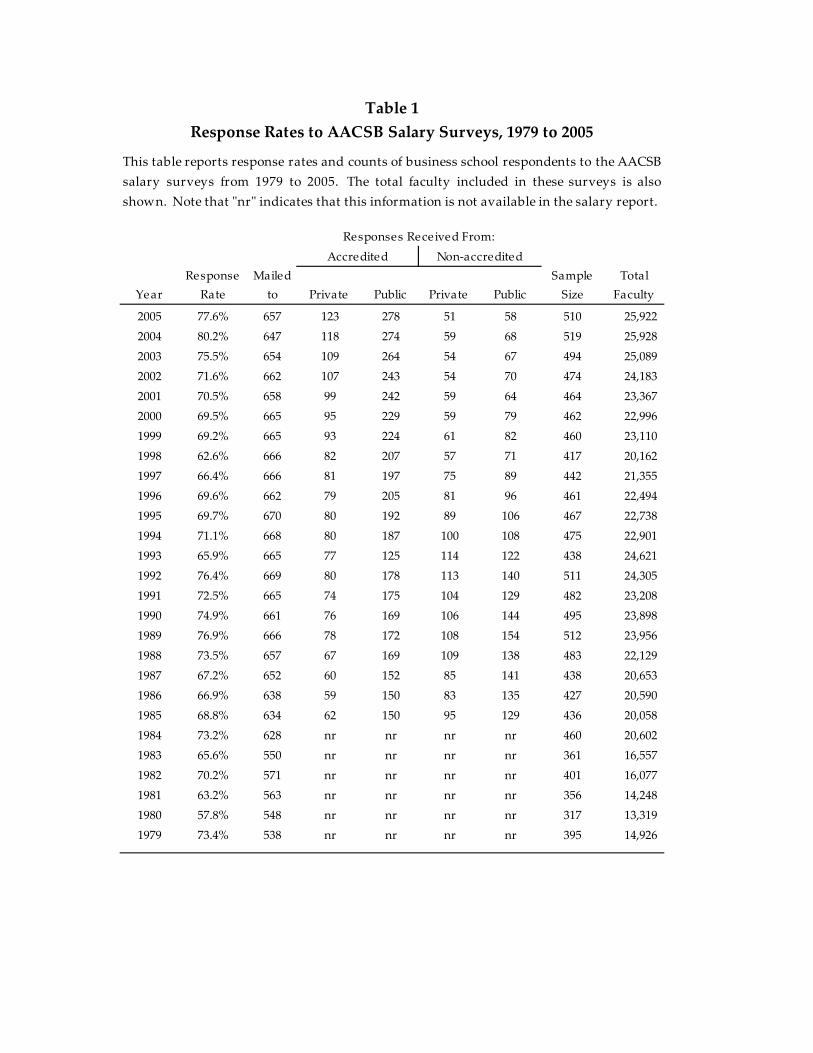
accredited schools. Table 1 shows that the majority of the overall response rates are
between 70 to 80 percent and that the sample sizes are all large for the four institutional
groupings: private versus public and accredited versus non-accredited. However, the
lower response rates for non-accredited schools may introduce selectivity biases into our
analysis. As such, we will only focus on salary structure in accredited business schools.
These response rates exceed the sample size requirements necessary to make reliable
statistical statements and leave little concern for selectivity bias, as the number of non-
respondents is unlikely to skew any results.
7
The data that we analyze consists of 16,698 entries from the AACSB annual
surveys conducted between 1979 and 2005. The smallest unit of measurement in these
surveys is the rank and hiring status of faculty. Specifically, the survey reports provide
average and percentile information for existing instructors, assistant, associate and full
professors, as well as new hires. These salary data are reported separately by discipline,
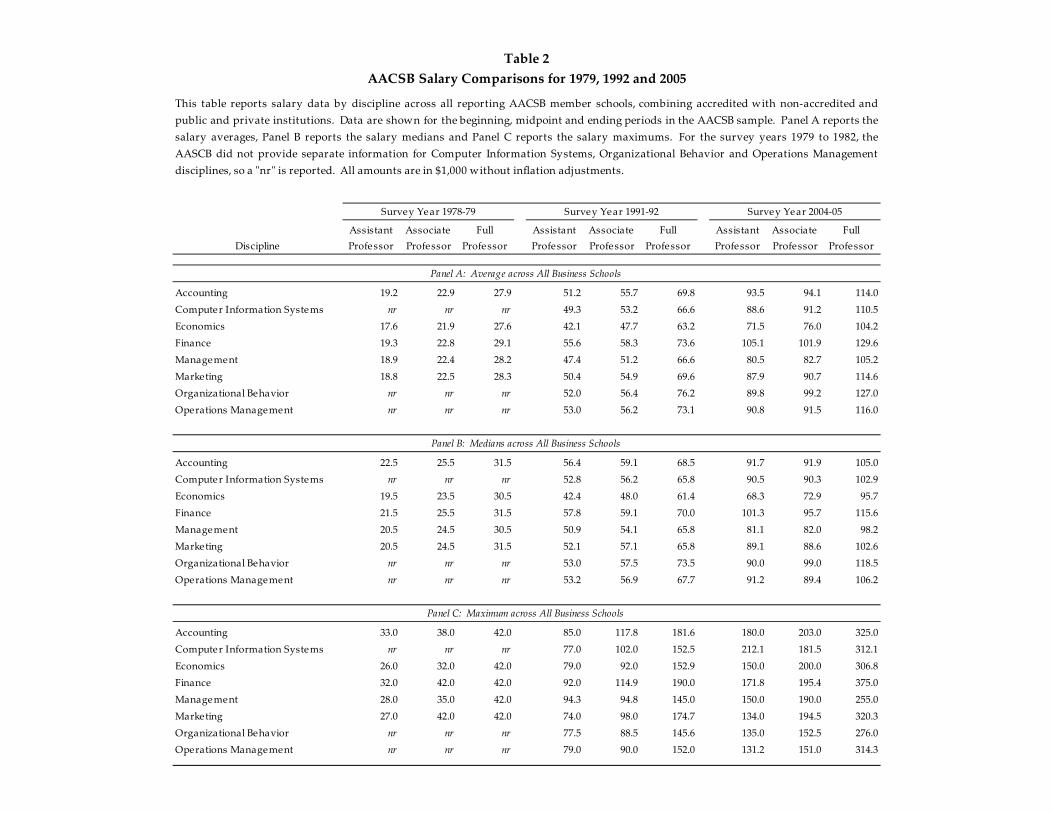
institutional type (public or private) and accreditation status. Table 2 offers a picture of
these data by summarizing of the mean, maximum and minimum salary averages across
accredited schools for assistant, associate and full professors by discipline for the first,
middle and last year of the AACSB sample data.
Table 2 reports salary data in $1,000s, which are not inflation adjusted. These
data show substantial nominal salary grow rates in most business disciplines. For the
entire 26-year period, salaries over all disciplines grew at a compound average of 5.7%
per year. As CPI inflation over this period averaged 3.8% per year, real wage growth
was about 2.0% per year. Slightly less favorable conditions prevailed in the second half
of our sample, between 1992 and 2005. Nominal salary growth averaged 3.9% per year
and inflation averaged about 2.4% per year. Thus, real wage growth dipped to 1.5% per
year. The minimum salary levels grew at 1.8% per year less than the average growth rate
and the maximum levels grew at 1.5% more than the average, which suggests that the
variance of accredited business school salaries has increased over time.
III. Analysis of Averages
Our focus is on relative salary comparisons between ranks within a given
discipline. We begin the analysis by investigating sample averages across the AACSB
8
disciplines. The data in Table 2 provide our first look at salary inversion cases in
AACSB business schools. This table shows that Assistant Professors on average earn
more than Associate Professors in Finance during the 2004-2005 academic year. This
result also arises with a comparison of the median salaries in Finance. No other
discipline shows an average level inversion during 2004-2005 or in the two previous
surveys. However, the disciplines of CIS, Marketing and Operations Management all
show median level inversions and CIS shows an inversion at the maximum level. These
data suggest that mean salary inversions are likely a limited phenomenon in business
schools. To explore these results further, we examine the Finance discipline in more
detail, and then use similar methods for the other disciplines.
A. A Closer Look at Finance Salaries
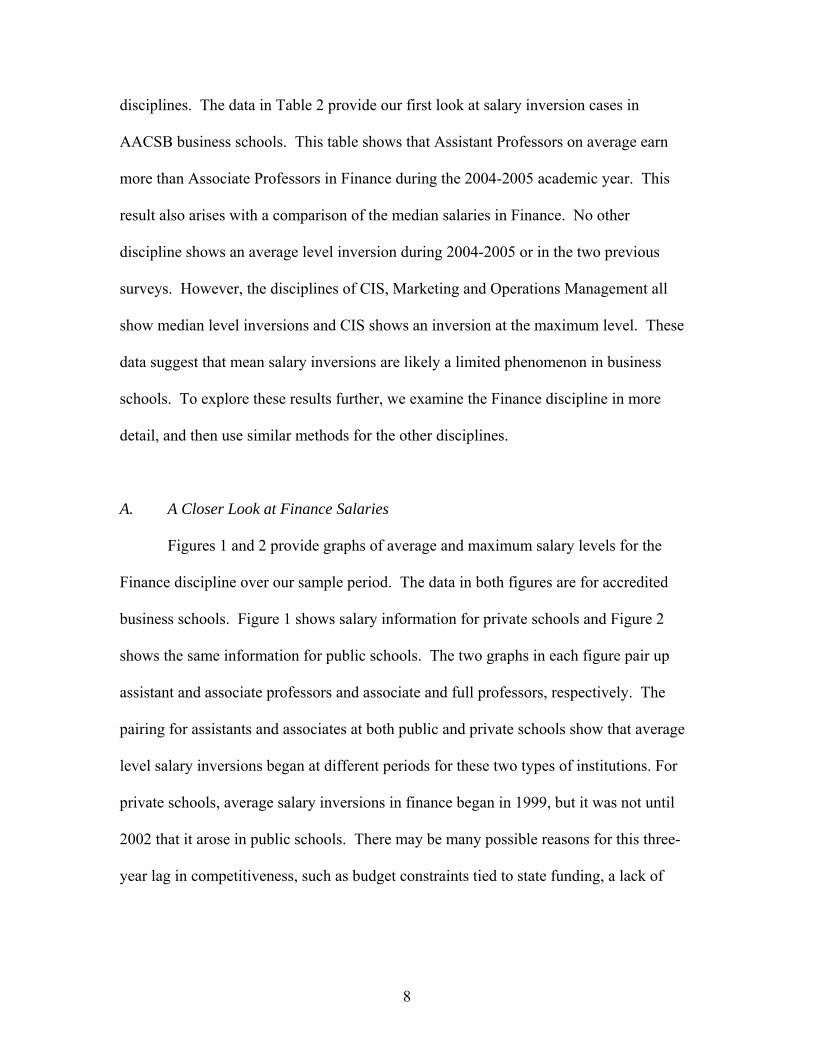
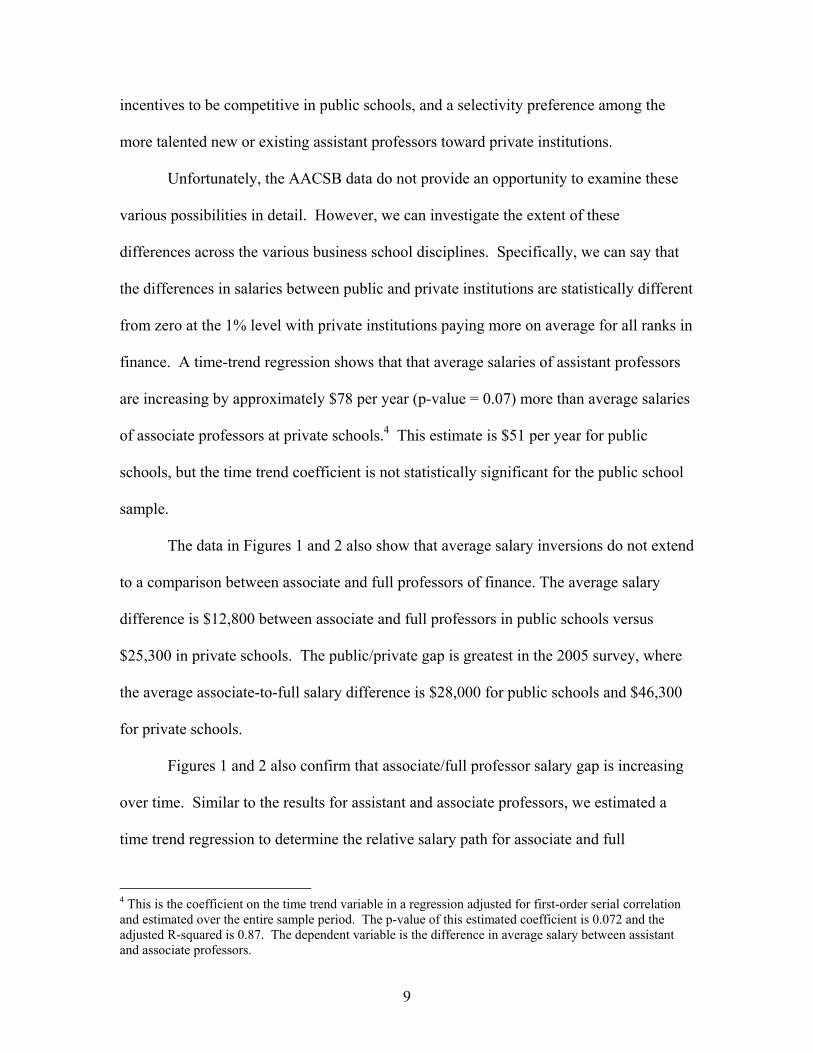
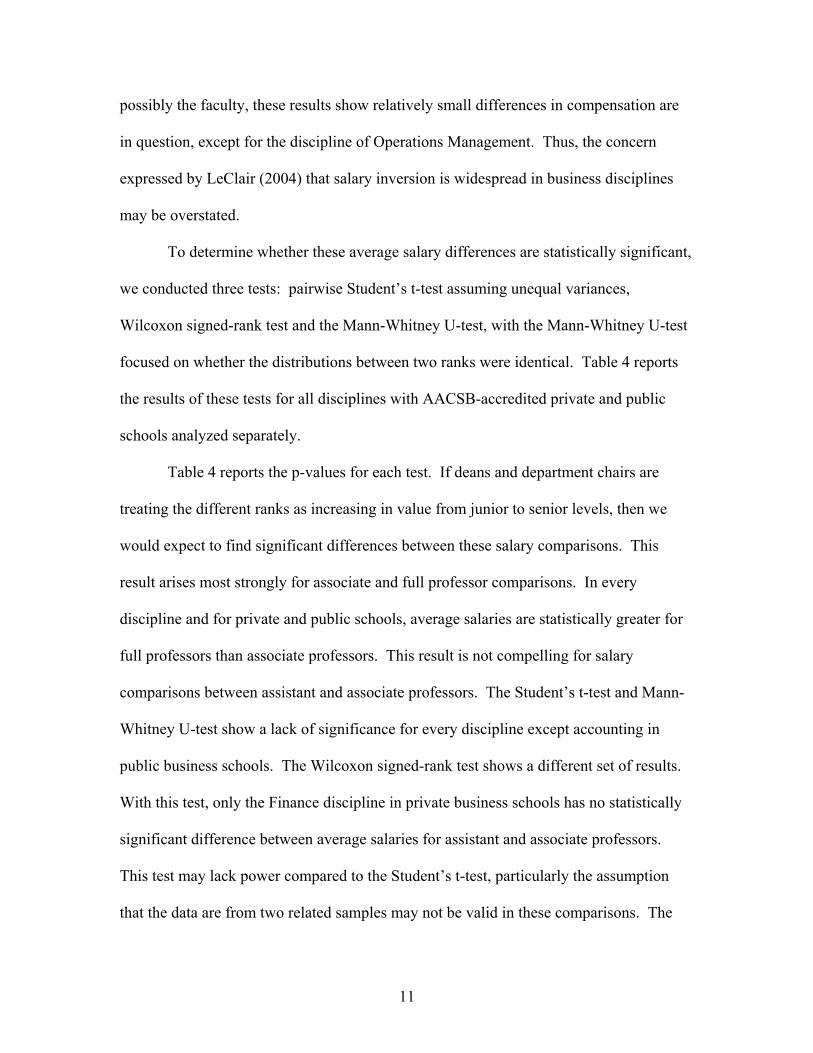
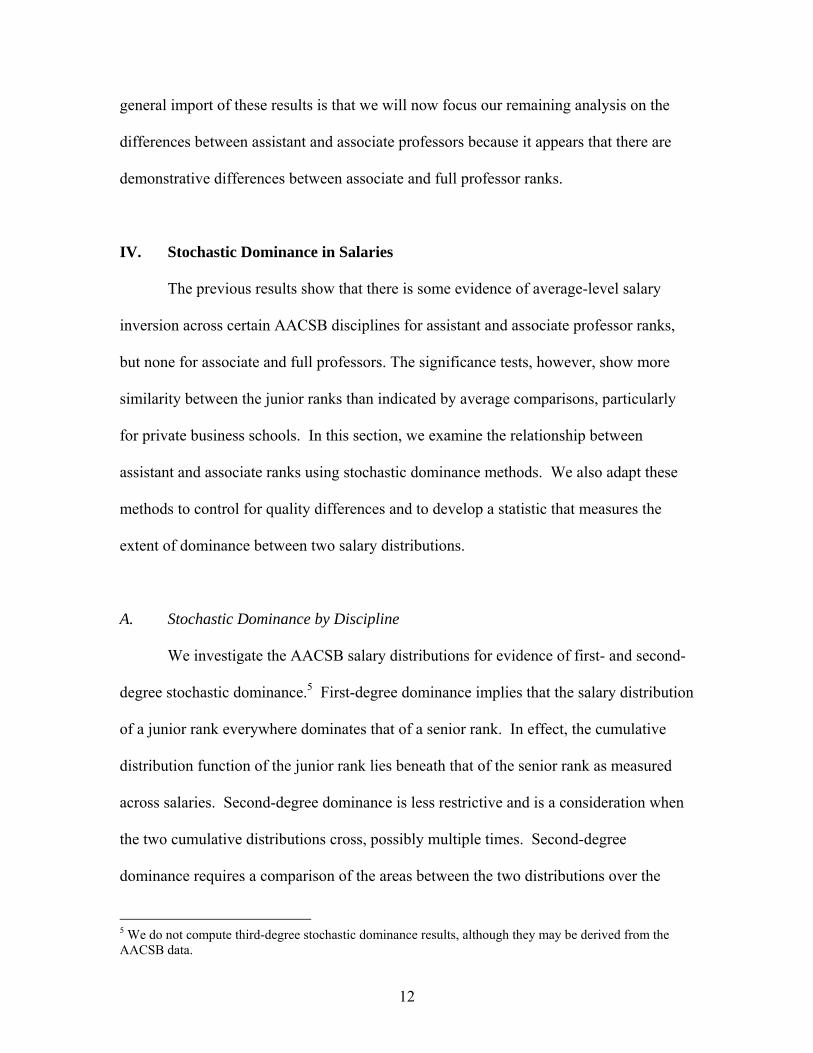
Figures 1 and 2 provide graphs of average and maximum salary levels for the
Finance discipline over our sample period. The data in both figures are for accredited
business schools. Figure 1 shows salary information for private schools and Figure 2
shows the same information for public schools. The two graphs in each figure pair up
assistant and associate professors and associate and full professors, respectively. The
pairing for assistants and associates at both public and private schools show that average
level salary inversions began at different periods for these two types of institutions. For
private schools, average salary inversions in finance began in 1999, but it was not until
2002 that it arose in public schools. There may be many possible reasons for this three-
year lag in competitiveness, such as budget constraints tied to state funding, a lack of
9
incentives to be competitive in public schools, and a selectivity preference among the
more talented new or existing assistant professors toward private institutions.
Unfortunately, the AACSB data do not provide an opportunity to examine these
various possibilities in detail. However, we can investigate the extent of these
differences across the various business school disciplines. Specifically, we can say that
the differences in salaries between public and private institutions are statistically different
from zero at the 1% level with private institutions paying more on average for all ranks in
finance. A time-trend regression shows that that average salaries of assistant professors
are increasing by approximately $78 per year (p-value = 0.07) more than average salaries
of associate professors at private schools.4 This estimate is $51 per year for public
schools, but the time trend coefficient is not statistically significant for the public school
sample.
The data in Figures 1 and 2 also show that average salary inversions do not extend
to a comparison between associate and full professors of finance. The average salary
difference is $12,800 between associate and full professors in public schools versus
$25,300 in private schools. The public/private gap is greatest in the 2005 survey, where
the average associate-to-full salary difference is $28,000 for public schools and $46,300
for private schools.
Figures 1 and 2 also confirm that associate/full professor salary gap is increasing
over time. Similar to the results for assistant and associate professors, we estimated a
time trend regression to determine the relative salary path for associate and full
4 This is the coefficient on the time trend variable in a regression adjusted for first-order serial correlation and estimated over the entire sample period. The p-value of this estimated coefficient is 0.072 and the adjusted R-squared is 0.87. The dependent variable is the difference in average salary between assistant and associate professors.
10
professors. This regression shows that the average salary of associate professors
decreases $855 per year (p-value = 0.003) relative to the average salary of full professors
in private business schools. This time trend coefficient shows a decrease of $311 per
year (p-value = 0.011) for public business schools. These results also show that salary
relationships differ between private and public business schools, with private schools
maintaining increasingly higher salaries for full professors.
The differences between average salaries for associate and full professors of
finance suggest that the variance of these salary distributions may be increasing over
time, which may also be true for assistant professors. The increasing levels of the
maximum salaries in Figures 1 and 2 also support this view.
B. Salary Inversion by Discipline
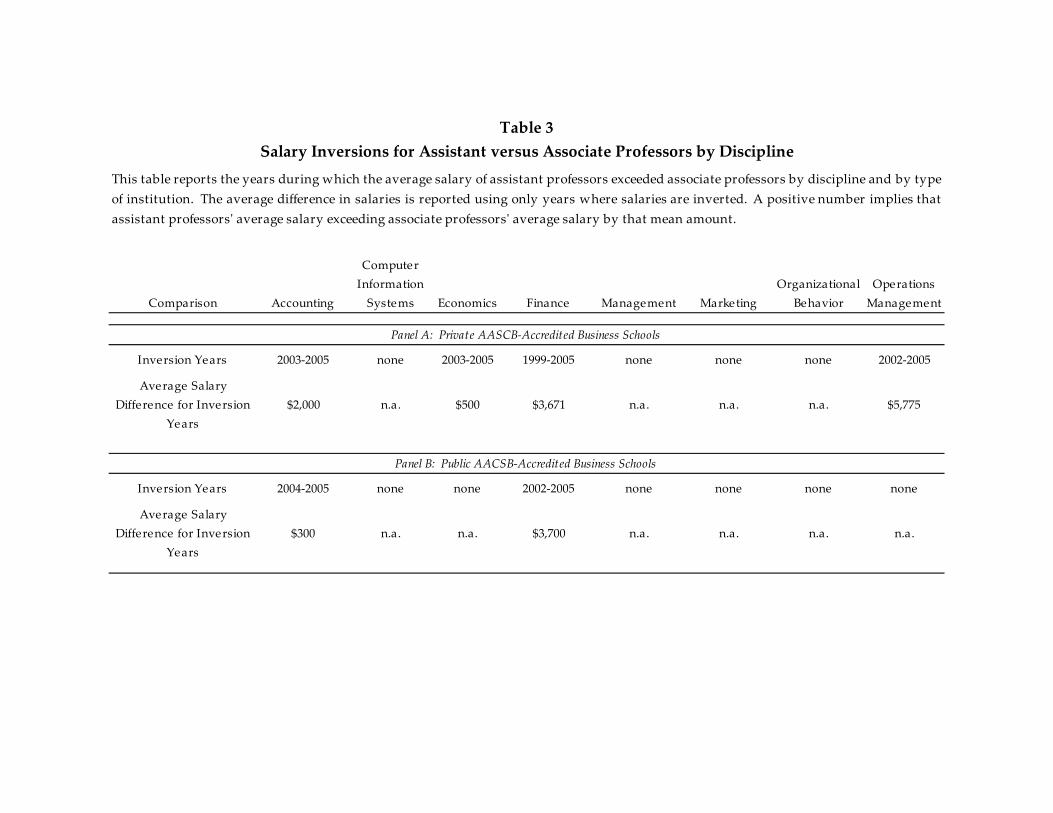
Table 3 provides a summary of mean level salary inversions for all years in our
sample. Four disciplines—Accounting, Economics, Finance and Operations
Management—show evidence of salary inversion in private business schools, whereas
only Accounting and Finance show this evidence in public business schools. Across
these groups, the average size of such inversions range from $500 in Economics to
$5,775 in Operations Management for private schools and from $300 in Accounting to
$3,700 in Finance for public schools.
Table 3 also shows that salary inversion is a recent phenomenon with the earliest
case in Finance in 1999. Most instances, however, began in 2002 or 2003, which means
that overall salary inversion has affected business schools for only a few years. Although
deans and department chairs must rationalize salary decisions to other administrators and
11
possibly the faculty, these results show relatively small differences in compensation are
in question, except for the discipline of Operations Management. Thus, the concern
expressed by LeClair (2004) that salary inversion is widespread in business disciplines
may be overstated.
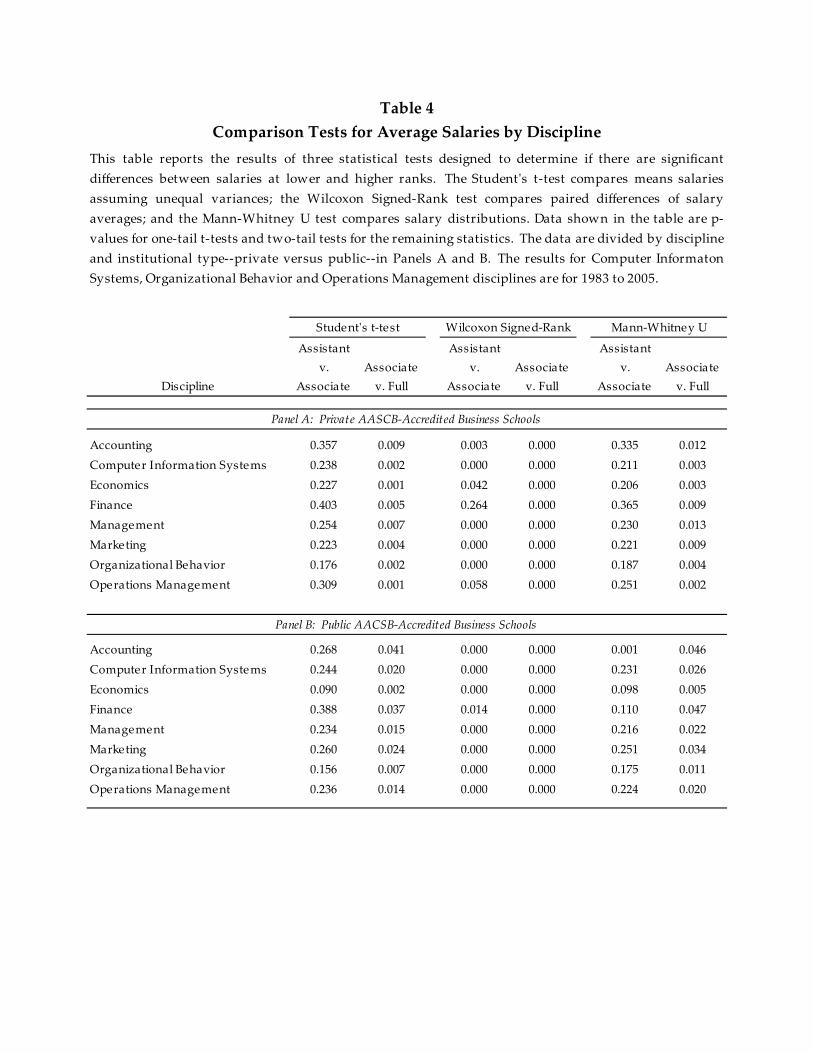
To determine whether these average salary differences are statistically significant,
we conducted three tests: pairwise Student’s t-test assuming unequal variances,
Wilcoxon signed-rank test and the Mann-Whitney U-test, with the Mann-Whitney U-test
focused on whether the distributions between two ranks were identical. Table 4 reports
the results of these tests for all disciplines with AACSB-accredited private and public
schools analyzed separately.
Table 4 reports the p-values for each test. If deans and department chairs are
treating the different ranks as increasing in value from junior to senior levels, then we
would expect to find significant differences between these salary comparisons. This
result arises most strongly for associate and full professor comparisons. In every
discipline and for private and public schools, average salaries are statistically greater for
full professors than associate professors. This result is not compelling for salary
comparisons between assistant and associate professors. The Student’s t-test and Mann-
Whitney U-test show a lack of significance for every discipline except accounting in
public business schools. The Wilcoxon signed-rank test shows a different set of results.
With this test, only the Finance discipline in private business schools has no statistically
significant difference between average salaries for assistant and associate professors.
This test may lack power compared to the Student’s t-test, particularly the assumption
that the data are from two related samples may not be valid in these comparisons. The
12
general import of these results is that we will now focus our remaining analysis on the
differences between assistant and associate professors because it appears that there are
demonstrative differences between associate and full professor ranks.
IV. Stochastic Dominance in Salaries
The previous results show that there is some evidence of average-level salary
inversion across certain AACSB disciplines for assistant and associate professor ranks,
but none for associate and full professors. The significance tests, however, show more
similarity between the junior ranks than indicated by average comparisons, particularly
for private business schools. In this section, we examine the relationship between
assistant and associate ranks using stochastic dominance methods. We also adapt these
methods to control for quality differences and to develop a statistic that measures the
extent of dominance between two salary distributions.
A. Stochastic Dominance by Discipline
We investigate the AACSB salary distributions for evidence of first- and second-
degree stochastic dominance.5 First-degree dominance implies that the salary distribution
of a junior rank everywhere dominates that of a senior rank. In effect, the cumulative
distribution function of the junior rank lies beneath that of the senior rank as measured
across salaries. Second-degree dominance is less restrictive and is a consideration when
the two cumulative distributions cross, possibly multiple times. Second-degree
dominance requires a comparison of the areas between the two distributions over the
5 We do not compute third-degree stochastic dominance results, although they may be derived from the AACSB data.
13
entire range of salaries. These areas are compared at each salary level, and the junior rank
distribution must prevail in area for every comparison for second degree dominance to
hold. We follow the methods in Levy (2006), who provides details on how such
comparisons are made using asset return distributions to construct optimal portfolios.
As both first- and second-degree stochastic dominance imply mean level salary
inversion, there are only a few years and disciplines that present the opportunity for either
type of dominance by junior ranks. However, we can reverse the analysis to ask whether
the associate rank shows evidence in its salary distribution of dominating the assistant
rank. One may expect to find such dominance given the lack of salary inversion in most
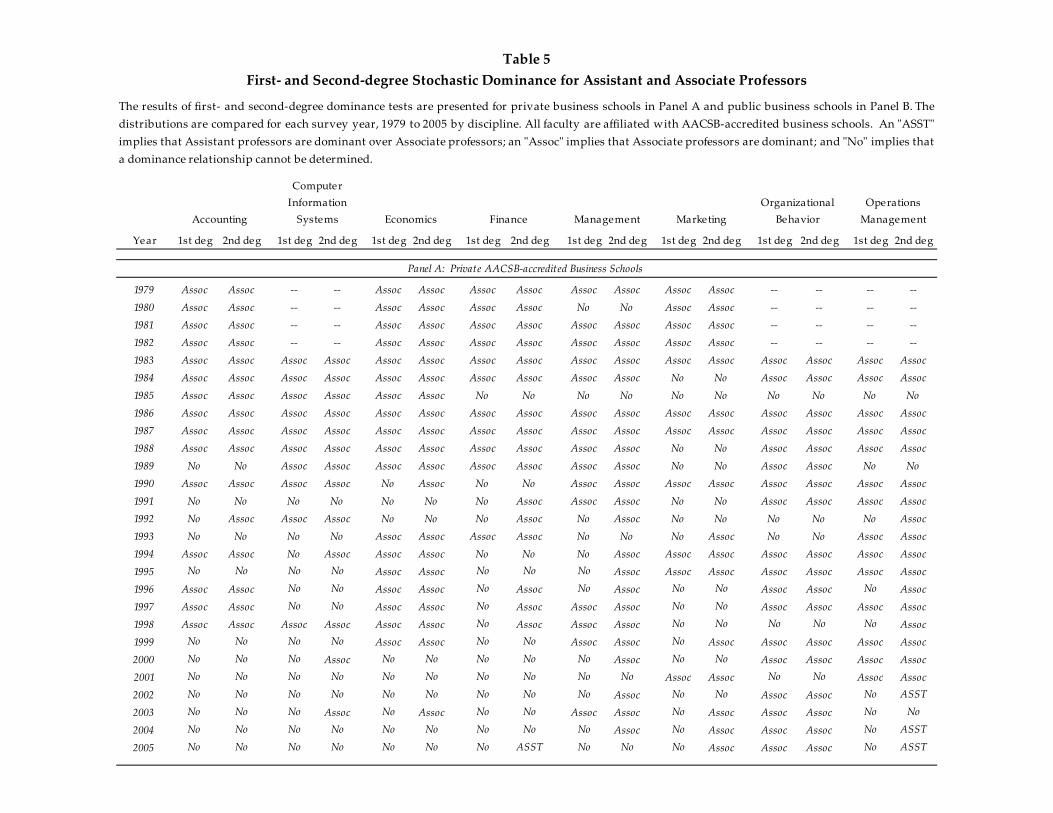
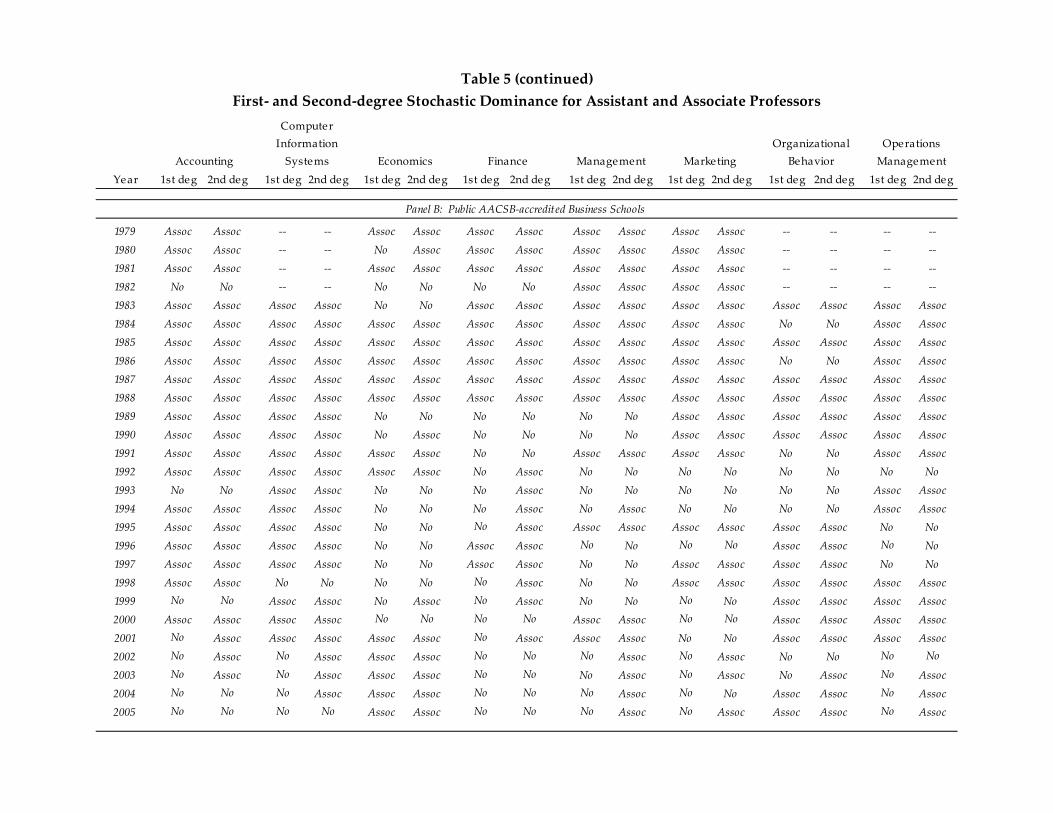
years and most disciplines. Table 5 presents the results of this analysis.
Table 5 reports all cases of dominance in either direction of rank. Panel A reports
results for private business schools and Panel B reports results for public business
schools. These panels show consistent dominance by associate professors over assistant
professors in the early years of the AACSB salary surveys. For the six years, 1983 to
1988, 85% of the entries show first- or second-degree dominance by associate professors
in private schools, and 95% of the entries show associate professor dominance in public
schools. The six-year period at the end of our sample, 2000 to 2005, tells a different
story. Now only 28% or the entries show dominance by associate professors for private
schools and only 52% show this dominance for public schools. The trend is that first- and
second-degree dominance is more difficult to identify because assistant and associate
salary distributions show more ranges in which salaries overlap, which rules out first-
degree dominance. This trend holds for all disciplines except Economics in public
schools and Organizational Behavior in both private and public schools.
14
B. Stochastic Dominance Adjusted for Overlapping Salaries
The basic results on stochastic dominance offer no controls for faculty quality
other than the distinction between private and public schools. However, the AACSB
survey data offer an opportunity for an additional control on quality. Specifically, we can
determine where salaries overlap on these distributions, and re-compute the stochastic
dominance comparisons using only overlapping salary ranges.6 To the extent that
academic salaries are competitively determined, these overlapping ranges are expected to
identify faculty who offer their institutions similar marginal revenue product. In which
case, we would expect to find fewer examples of one rank consistently dominating
another rank using these adjusted distributions.
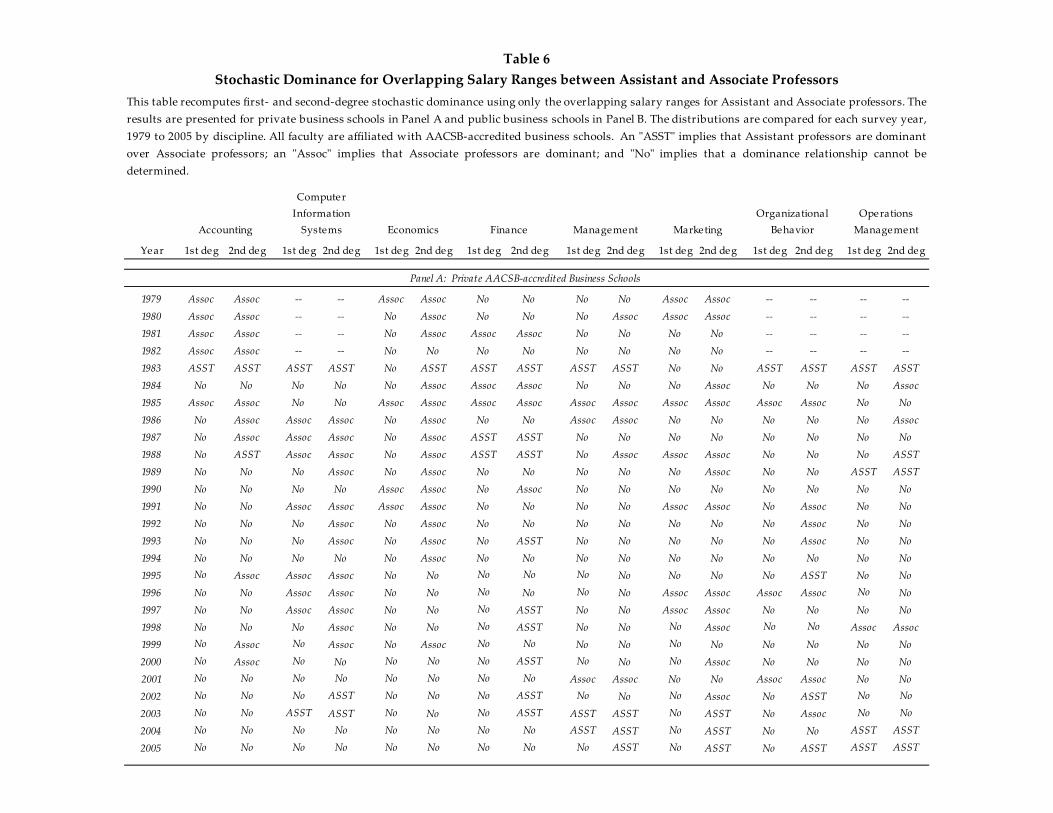
Table 6 presents our results on stochastic dominance for overlapping salary
ranges. Now either first- of second-degree stochastic dominance arises in many fewer
cases. In Table 5 using the entire salary distribution, 37% of the comparisons for private
schools and 33% for public schools resulted in “No” dominance for either rank. These
results change to 65.2% and 55%, respectively, in the overlapping salary results shown in
Table 6. These percentage increases give support to the view that institutions may regard
the assistant and associate ranks as having similar marginal revenue product.
The results in Table 6 also continue to support the view that salaries for the
assistant professor rank in selected disciplines are gaining on the associate professor rank.
The fraction of cases in which associates dominate assistants decreased significantly
between the early and late six-year intervals, 1983-88 and 2000-05. For private schools,
this fraction decreased from 35.4% to 8.3% and for public schools in decreased even
6 After determining the overlapping salaries ranges, the distributions are re-scaled to proper density before computing stochastic dominance tests.
15
more notably from 61.4% to 11.4%. A look at Table 6 will also show many more cases
in which assistant professors are first- or second-degree dominant over associate
professors. The clearest cases of this trend occur in Finance and CIS at public schools
and Management at private schools.
C. Measuring the Degree of Dominance
The stochastic dominance results suggest that there may be a trend towards
greater salary inversion over time. Unfortunately, the discrete nature of the stochastic
dominance method—either first degree or second degree or not dominant—provides little
flexibility to understand how close these salary distributions are to being dominant in one
form or another, and whether this “closeness” is changing over time. To address this
problem, we develop a measure of the degree of first-degree dominance between two
salary distributions.
First-degree dominance between assistant and associate professors implies that
the assistant professor distribution lies everywhere beneath the associate professor
distribution over the range of salaries. If these distributions overlap, then first-degree
dominance cannot hold. This means that these distributions may overlap for only a small
salary range and first-degree dominance is invalidated. As first-degree dominance offers
a clear picture of salary inversion, we extend the concept to measure the degree to which
one distribution lies beneath another over the salary range. Specifically, we define the
dominance fraction as the percent of the cumulative distribution function that lies beneath
the comparison cumulative distribution. If the dominance fraction equals 100% then one
distribution is first-degree dominant over the other distribution. If the dominance fraction
16
is 0%, then the second distribution actually dominates the first distribution. The
dominance fraction provides a continuum of values between zero and one to use in
judging how close two ranks are to first-degree stochastic dominance.
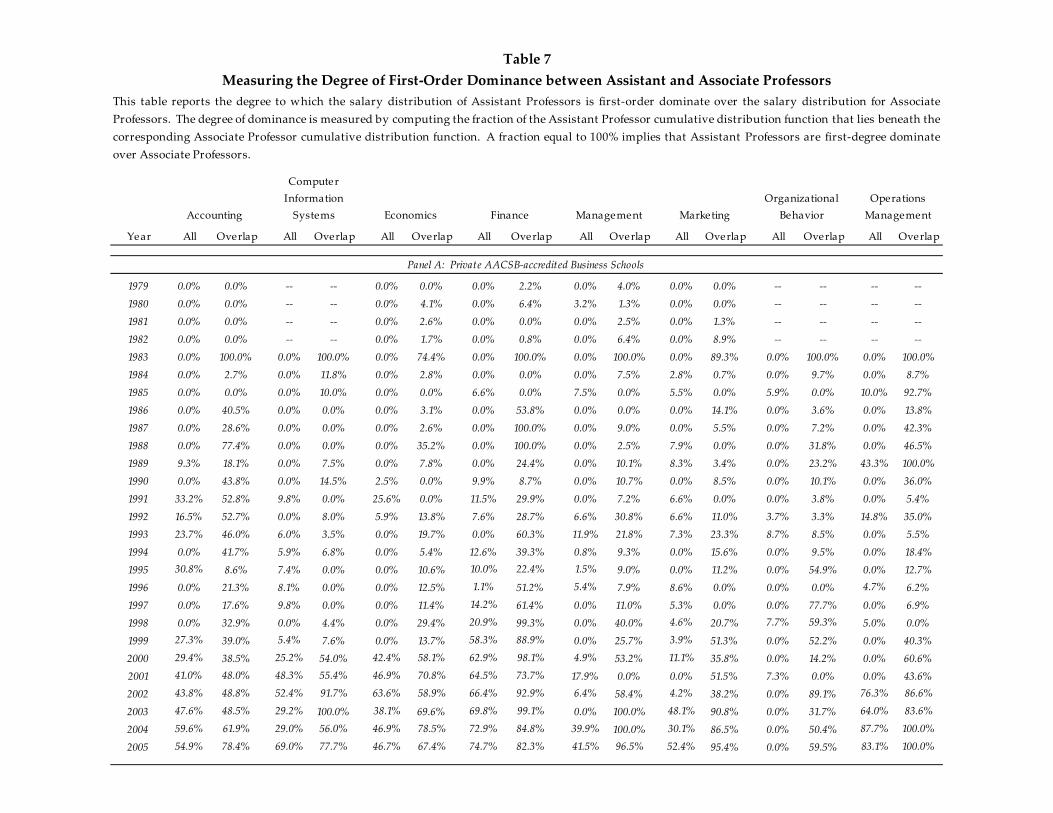
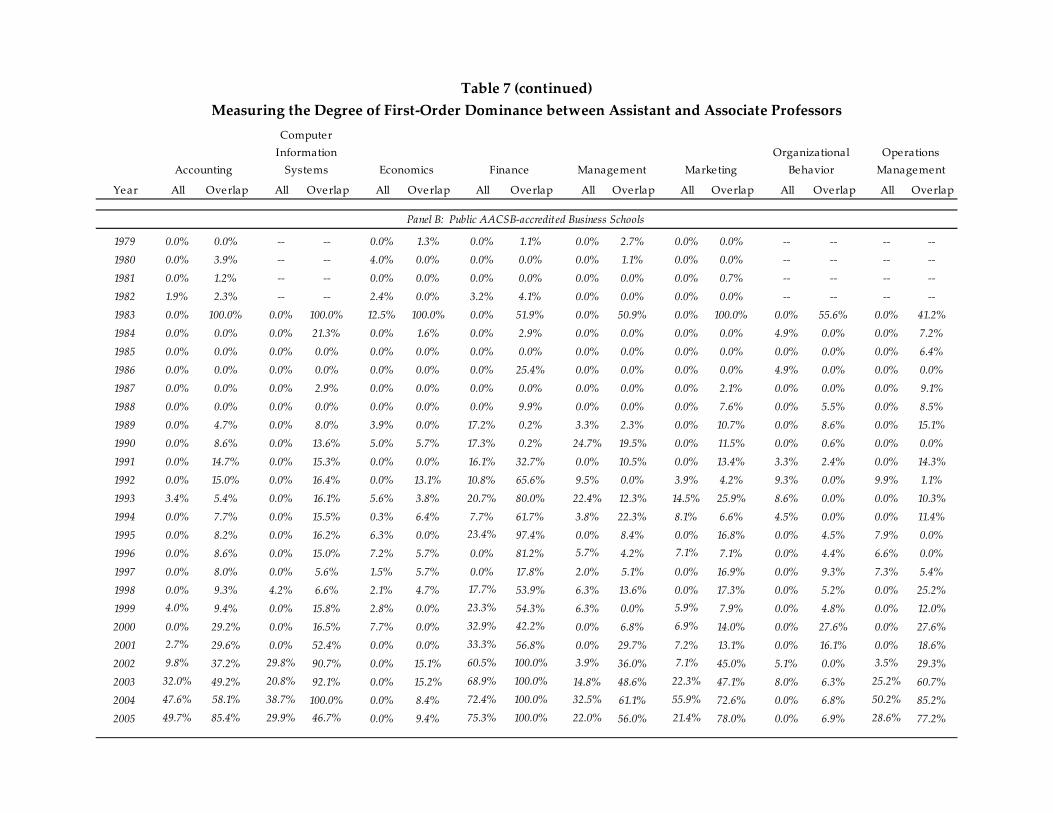
Table 7 reports the dominance fraction for both private and public schools across
the eight business disciplines. We compute the dominance fraction for two cases: the
entire salary distribution (All) for assistant and associate professors and the overlapping
distributions for these ranks (Overlap). The case in which the entire distribution is used
shows an increasing dominance fraction in recent years. In private schools, only the
discipline of Organizational Behavior is not participating in this trend, which appears to
be strongest in Finance and Operations Management. The trend is also present in public
schools but the dominance fraction is not as large as in private schools.
The overlapping distributional data show even stronger results for dominance of
assistant professor over associate professors. In Finance, the overlapping distribution of
assistant professors is first-degree dominant for the last four years of the AACSB salary
survey in public schools, and nearly as strong in private schools. The disciplines of
Operations Management and Management also show a strong degree of dominance in
recent years in private schools. Overall, these results indicate that salaries of assistant
professors are converging (or exceeding) to those of associate professors across business
school disciplines with only a few notable exceptions.
V. Conclusion
The issue of relative academic salaries is important to faculty and administrators
for budgeting and provision of incentives within business schools. Using AACSB salary
17
survey data, we show that mean level salary inversion between assistant and associate
professors is isolated to only a few disciplines, and found only in recent years. However,
applying the method of stochastic dominance, we observe that there is a trend towards
increasing salary inversions. We develop a dominance fraction to measure this trend and
find that notable increases in the degree of dominance by assistant professors in both
public and private business schools.
18
References
Barbezat, Debra A., 2004, A Loyalty Tax? National Measures of Academic Salary
Compression, Research in Higher Education 45 (7), 761-776.
Gomez-Mejia, Luis R. and David B. Balkin, 1987, Pay Compression in Business
Schools; Causes and Consequences, Compensation and Benefits Review 19 (5), 43-
55.
Glandon, Sid and Terry Ann Glandon, 2001, Faculty Turnover and Salary Compression
in Business Schools: Comparing Teaching and Research Missions, Journal of Applied
Business Research 17 (2), 33-40.
LeClair, Dan, 2004, The Professor’s Paycheck, BizEd (March/April), 58-60.
Levy, Haim, 2006, Stochastic Dominance: Investment Decision Making Under
Uncertainty, Studies in Risk and Uncertainty, Springer: New York.
Toutkoushian, Robert K., 1998, Using Regression Analysis to Determine if Faculty
Salaries are Overly Compressed,” Research in Higher Education 39 (1), 87-100.
YearResponse
RateMailed
to Private Public Private PublicSample Size
Total Faculty
2005 77.6% 657 123 278 51 58 510 25,922 2004 80.2% 647 118 274 59 68 519 25,928 2003 75.5% 654 109 264 54 67 494 25,089 2002 71.6% 662 107 243 54 70 474 24,183 2001 70.5% 658 99 242 59 64 464 23,367 2000 69.5% 665 95 229 59 79 462 22,996 1999 69.2% 665 93 224 61 82 460 23,110 1998 62.6% 666 82 207 57 71 417 20,162 1997 66.4% 666 81 197 75 89 442 21,355 1996 69.6% 662 79 205 81 96 461 22,494 1995 69.7% 670 80 192 89 106 467 22,738 1994 71.1% 668 80 187 100 108 475 22,901 1993 65.9% 665 77 125 114 122 438 24,621 1992 76.4% 669 80 178 113 140 511 24,305 1991 72.5% 665 74 175 104 129 482 23,208 1990 74.9% 661 76 169 106 144 495 23,898 1989 76.9% 666 78 172 108 154 512 23,956 1988 73.5% 657 67 169 109 138 483 22,129 1987 67.2% 652 60 152 85 141 438 20,653 1986 66.9% 638 59 150 83 135 427 20,590 1985 68.8% 634 62 150 95 129 436 20,058 1984 73.2% 628 nr nr nr nr 460 20,602 1983 65.6% 550 nr nr nr nr 361 16,557 1982 70.2% 571 nr nr nr nr 401 16,077 1981 63.2% 563 nr nr nr nr 356 14,248 1980 57.8% 548 nr nr nr nr 317 13,319 1979 73.4% 538 nr nr nr nr 395 14,926
Table 1
This table reports response rates and counts of business school respondents to the AACSBsalary surveys from 1979 to 2005. The total faculty included in these surveys is alsoshown. Note that ʺnrʺ indicates that this information is not available in the salary report.
Accredited Non‐accreditedResponses Received From:
Response Rates to AACSB Salary Surveys, 1979 to 2005
DisciplineAssistant Professor
Associate Professor
Full Professor
Assistant Professor
Associate Professor
Full Professor
Assistant Professor
Associate Professor
Full Professor
Accounting 19.2 22.9 27.9 51.2 55.7 69.8 93.5 94.1 114.0Computer Information Systems nr nr nr 49.3 53.2 66.6 88.6 91.2 110.5Economics 17.6 21.9 27.6 42.1 47.7 63.2 71.5 76.0 104.2Finance 19.3 22.8 29.1 55.6 58.3 73.6 105.1 101.9 129.6Management 18.9 22.4 28.2 47.4 51.2 66.6 80.5 82.7 105.2Marketing 18.8 22.5 28.3 50.4 54.9 69.6 87.9 90.7 114.6Organizational Behavior nr nr nr 52.0 56.4 76.2 89.8 99.2 127.0Operations Management nr nr nr 53.0 56.2 73.1 90.8 91.5 116.0
Accounting 22.5 25.5 31.5 56.4 59.1 68.5 91.7 91.9 105.0Computer Information Systems nr nr nr 52.8 56.2 65.8 90.5 90.3 102.9Economics 19.5 23.5 30.5 42.4 48.0 61.4 68.3 72.9 95.7Finance 21.5 25.5 31.5 57.8 59.1 70.0 101.3 95.7 115.6Management 20.5 24.5 30.5 50.9 54.1 65.8 81.1 82.0 98.2Marketing 20.5 24.5 31.5 52.1 57.1 65.8 89.1 88.6 102.6Organizational Behavior nr nr nr 53.0 57.5 73.5 90.0 99.0 118.5Operations Management nr nr nr 53.2 56.9 67.7 91.2 89.4 106.2
Accounting 33.0 38.0 42.0 85.0 117.8 181.6 180.0 203.0 325.0Computer Information Systems nr nr nr 77.0 102.0 152.5 212.1 181.5 312.1Economics 26.0 32.0 42.0 79.0 92.0 152.9 150.0 200.0 306.8Finance 32.0 42.0 42.0 92.0 114.9 190.0 171.8 195.4 375.0Management 28.0 35.0 42.0 94.3 94.8 145.0 150.0 190.0 255.0Marketing 27.0 42.0 42.0 74.0 98.0 174.7 134.0 194.5 320.3Organizational Behavior nr nr nr 77.5 88.5 145.6 135.0 152.5 276.0Operations Management nr nr nr 79.0 90.0 152.0 131.2 151.0 314.3
Panel C: Maximum across All Business Schools
This table reports salary data by discipline across all reporting AACSB member schools, combining accredited with non‐accredited andpublic and private institutions. Data are shown for the beginning, midpoint and ending periods in the AACSB sample. Panel A reports thesalary averages, Panel B reports the salary medians and Panel C reports the salary maximums. For the survey years 1979 to 1982, theAASCB did not provide separate information for Computer Information Systems, Organizational Behavior and Operations Managementdisciplines, so a ʺnrʺ is reported. All amounts are in $1,000 without inflation adjustments.
AACSB Salary Comparisons for 1979, 1992 and 2005Table 2
Survey Year 1991‐92 Survey Year 2004‐05Survey Year 1978‐79
Panel A: Average across All Business Schools
Panel B: Medians across All Business Schools
Comparison Accounting
Computer Information Systems Economics Finance Management Marketing
Organizational Behavior
Operations Management
Inversion Years 2003‐2005 none 2003‐2005 1999‐2005 none none none 2002‐2005
Average Salary Difference for Inversion
Years$2,000 n.a. $500 $3,671 n.a. n.a. n.a. $5,775
Inversion Years 2004‐2005 none none 2002‐2005 none none none none
Average Salary Difference for Inversion
Years$300 n.a. n.a. $3,700 n.a. n.a. n.a. n.a.
Panel B: Public AACSB‐Accredited Business Schools
Table 3Salary Inversions for Assistant versus Associate Professors by Discipline
This table reports the years during which the average salary of assistant professors exceeded associate professors by discipline and by typeof institution. The average difference in salaries is reported using only years where salaries are inverted. A positive number implies thatassistant professorsʹ average salary exceeding associate professorsʹ average salary by that mean amount.
Panel A: Private AASCB‐Accredited Business Schools
Discipline
Assistant v.
AssociateAssociate v. Full
Assistant v.
AssociateAssociate v. Full
Assistant v.
AssociateAssociate v. Full
Accounting 0.357 0.009 0.003 0.000 0.335 0.012Computer Information Systems 0.238 0.002 0.000 0.000 0.211 0.003Economics 0.227 0.001 0.042 0.000 0.206 0.003Finance 0.403 0.005 0.264 0.000 0.365 0.009Management 0.254 0.007 0.000 0.000 0.230 0.013Marketing 0.223 0.004 0.000 0.000 0.221 0.009Organizational Behavior 0.176 0.002 0.000 0.000 0.187 0.004Operations Management 0.309 0.001 0.058 0.000 0.251 0.002
Accounting 0.268 0.041 0.000 0.000 0.001 0.046Computer Information Systems 0.244 0.020 0.000 0.000 0.231 0.026Economics 0.090 0.002 0.000 0.000 0.098 0.005Finance 0.388 0.037 0.014 0.000 0.110 0.047Management 0.234 0.015 0.000 0.000 0.216 0.022Marketing 0.260 0.024 0.000 0.000 0.251 0.034Organizational Behavior 0.156 0.007 0.000 0.000 0.175 0.011Operations Management 0.236 0.014 0.000 0.000 0.224 0.020
Panel B: Public AACSB‐Accredited Business Schools
This table reports the results of three statistical tests designed to determine if there are significantdifferences between salaries at lower and higher ranks. The Studentʹs t‐test compares means salariesassuming unequal variances; the Wilcoxon Signed‐Rank test compares paired differences of salaryaverages; and the Mann‐Whitney U test compares salary distributions. Data shown in the table are p‐values for one‐tail t‐tests and two‐tail tests for the remaining statistics. The data are divided by disciplineand institutional type‐‐private versus public‐‐in Panels A and B. The results for Computer InformatonSystems, Organizational Behavior and Operations Management disciplines are for 1983 to 2005.
Comparison Tests for Average Salaries by DisciplineTable 4
Wilcoxon Signed‐Rank Mann‐Whitney UStudentʹs t‐test
Panel A: Private AASCB‐Accredited Business Schools
Year 1st deg 2nd deg 1st deg 2nd deg 1st deg 2nd deg 1st deg 2nd deg 1st deg 2nd deg 1st deg 2nd deg 1st deg 2nd deg 1st deg 2nd deg
1979 Assoc Assoc ‐‐ ‐‐ Assoc Assoc Assoc Assoc Assoc Assoc Assoc Assoc ‐‐ ‐‐ ‐‐ ‐‐1980 Assoc Assoc ‐‐ ‐‐ Assoc Assoc Assoc Assoc No No Assoc Assoc ‐‐ ‐‐ ‐‐ ‐‐1981 Assoc Assoc ‐‐ ‐‐ Assoc Assoc Assoc Assoc Assoc Assoc Assoc Assoc ‐‐ ‐‐ ‐‐ ‐‐1982 Assoc Assoc ‐‐ ‐‐ Assoc Assoc Assoc Assoc Assoc Assoc Assoc Assoc ‐‐ ‐‐ ‐‐ ‐‐1983 Assoc Assoc Assoc Assoc Assoc Assoc Assoc Assoc Assoc Assoc Assoc Assoc Assoc Assoc Assoc Assoc1984 Assoc Assoc Assoc Assoc Assoc Assoc Assoc Assoc Assoc Assoc No No Assoc Assoc Assoc Assoc1985 Assoc Assoc Assoc Assoc Assoc Assoc No No No No No No No No No No1986 Assoc Assoc Assoc Assoc Assoc Assoc Assoc Assoc Assoc Assoc Assoc Assoc Assoc Assoc Assoc Assoc1987 Assoc Assoc Assoc Assoc Assoc Assoc Assoc Assoc Assoc Assoc Assoc Assoc Assoc Assoc Assoc Assoc1988 Assoc Assoc Assoc Assoc Assoc Assoc Assoc Assoc Assoc Assoc No No Assoc Assoc Assoc Assoc1989 No No Assoc Assoc Assoc Assoc Assoc Assoc Assoc Assoc No No Assoc Assoc No No1990 Assoc Assoc Assoc Assoc No Assoc No No Assoc Assoc Assoc Assoc Assoc Assoc Assoc Assoc1991 No No No No No No No Assoc Assoc Assoc No No Assoc Assoc Assoc Assoc1992 No Assoc Assoc Assoc No No No Assoc No Assoc No No No No No Assoc1993 No No No No Assoc Assoc Assoc Assoc No No No Assoc No No Assoc Assoc1994 Assoc Assoc No Assoc Assoc Assoc No No No Assoc Assoc Assoc Assoc Assoc Assoc Assoc1995 No No No No Assoc Assoc No No No Assoc Assoc Assoc Assoc Assoc Assoc Assoc1996 Assoc Assoc No No Assoc Assoc No Assoc No Assoc No No Assoc Assoc No Assoc1997 Assoc Assoc No No Assoc Assoc No Assoc Assoc Assoc No No Assoc Assoc Assoc Assoc1998 Assoc Assoc Assoc Assoc Assoc Assoc No Assoc Assoc Assoc No No No No No Assoc1999 No No No No Assoc Assoc No No Assoc Assoc No Assoc Assoc Assoc Assoc Assoc2000 No No No Assoc No No No No No Assoc No No Assoc Assoc Assoc Assoc2001 No No No No No No No No No No Assoc Assoc No No Assoc Assoc2002 No No No No No No No No No Assoc No No Assoc Assoc No ASST
2003 No No No Assoc No Assoc No No Assoc Assoc No Assoc Assoc Assoc No No
2004 No No No No No No No No No Assoc No Assoc Assoc Assoc No ASST
2005 No No No No No No No ASST No No No Assoc Assoc Assoc No ASST
Table 5First‐ and Second‐degree Stochastic Dominance for Assistant and Associate Professors
The results of first‐ and second‐degree dominance tests are presented for private business schools in Panel A and public business schools in Panel B. Thedistributions are compared for each survey year, 1979 to 2005 by discipline. All faculty are affiliated with AACSB‐accredited business schools. An ʺASSTʺimplies that Assistant professors are dominant over Associate professors; an ʺAssocʺ implies that Associate professors are dominant; and ʺNoʺ implies thata dominance relationship cannot be determined.
Panel A: Private AACSB‐accredited Business Schools
Accounting
Computer Information Systems Economics Finance Management Marketing
Organizational Behavior
Operations Management
Year 1st deg 2nd deg 1st deg 2nd deg 1st deg 2nd deg 1st deg 2nd deg 1st deg 2nd deg 1st deg 2nd deg 1st deg 2nd deg 1st deg 2nd deg
1979 Assoc Assoc ‐‐ ‐‐ Assoc Assoc Assoc Assoc Assoc Assoc Assoc Assoc ‐‐ ‐‐ ‐‐ ‐‐1980 Assoc Assoc ‐‐ ‐‐ No Assoc Assoc Assoc Assoc Assoc Assoc Assoc ‐‐ ‐‐ ‐‐ ‐‐1981 Assoc Assoc ‐‐ ‐‐ Assoc Assoc Assoc Assoc Assoc Assoc Assoc Assoc ‐‐ ‐‐ ‐‐ ‐‐1982 No No ‐‐ ‐‐ No No No No Assoc Assoc Assoc Assoc ‐‐ ‐‐ ‐‐ ‐‐1983 Assoc Assoc Assoc Assoc No No Assoc Assoc Assoc Assoc Assoc Assoc Assoc Assoc Assoc Assoc1984 Assoc Assoc Assoc Assoc Assoc Assoc Assoc Assoc Assoc Assoc Assoc Assoc No No Assoc Assoc1985 Assoc Assoc Assoc Assoc Assoc Assoc Assoc Assoc Assoc Assoc Assoc Assoc Assoc Assoc Assoc Assoc1986 Assoc Assoc Assoc Assoc Assoc Assoc Assoc Assoc Assoc Assoc Assoc Assoc No No Assoc Assoc1987 Assoc Assoc Assoc Assoc Assoc Assoc Assoc Assoc Assoc Assoc Assoc Assoc Assoc Assoc Assoc Assoc1988 Assoc Assoc Assoc Assoc Assoc Assoc Assoc Assoc Assoc Assoc Assoc Assoc Assoc Assoc Assoc Assoc1989 Assoc Assoc Assoc Assoc No No No No No No Assoc Assoc Assoc Assoc Assoc Assoc1990 Assoc Assoc Assoc Assoc No Assoc No No No No Assoc Assoc Assoc Assoc Assoc Assoc1991 Assoc Assoc Assoc Assoc Assoc Assoc No No Assoc Assoc Assoc Assoc No No Assoc Assoc1992 Assoc Assoc Assoc Assoc Assoc Assoc No Assoc No No No No No No No No1993 No No Assoc Assoc No No No Assoc No No No No No No Assoc Assoc1994 Assoc Assoc Assoc Assoc No No No Assoc No Assoc No No No No Assoc Assoc1995 Assoc Assoc Assoc Assoc No No No Assoc Assoc Assoc Assoc Assoc Assoc Assoc No No1996 Assoc Assoc Assoc Assoc No No Assoc Assoc No No No No Assoc Assoc No No1997 Assoc Assoc Assoc Assoc No No Assoc Assoc No No Assoc Assoc Assoc Assoc No No1998 Assoc Assoc No No No No No Assoc No No Assoc Assoc Assoc Assoc Assoc Assoc1999 No No Assoc Assoc No Assoc No Assoc No No No No Assoc Assoc Assoc Assoc2000 Assoc Assoc Assoc Assoc No No No No Assoc Assoc No No Assoc Assoc Assoc Assoc2001 No Assoc Assoc Assoc Assoc Assoc No Assoc Assoc Assoc No No Assoc Assoc Assoc Assoc2002 No Assoc No Assoc Assoc Assoc No No No Assoc No Assoc No No No No
2003 No Assoc No Assoc Assoc Assoc No No No Assoc No Assoc No Assoc No Assoc2004 No No No Assoc Assoc Assoc No No No Assoc No No Assoc Assoc No Assoc2005 No No No No Assoc Assoc No No No Assoc No Assoc Assoc Assoc No Assoc
Management MarketingOrganizational
BehaviorOperations Management
Panel B: Public AACSB‐accredited Business Schools
Table 5 (continued)First‐ and Second‐degree Stochastic Dominance for Assistant and Associate Professors
Accounting
Computer Information Systems Economics Finance
Year 1st deg 2nd deg 1st deg 2nd deg 1st deg 2nd deg 1st deg 2nd deg 1st deg 2nd deg 1st deg 2nd deg 1st deg 2nd deg 1st deg 2nd deg
1979 Assoc Assoc ‐‐ ‐‐ Assoc Assoc No No No No Assoc Assoc ‐‐ ‐‐ ‐‐ ‐‐1980 Assoc Assoc ‐‐ ‐‐ No Assoc No No No Assoc Assoc Assoc ‐‐ ‐‐ ‐‐ ‐‐1981 Assoc Assoc ‐‐ ‐‐ No Assoc Assoc Assoc No No No No ‐‐ ‐‐ ‐‐ ‐‐1982 Assoc Assoc ‐‐ ‐‐ No No No No No No No No ‐‐ ‐‐ ‐‐ ‐‐1983 ASST ASST ASST ASST No ASST ASST ASST ASST ASST No No ASST ASST ASST ASST1984 No No No No No Assoc Assoc Assoc No No No Assoc No No No Assoc1985 Assoc Assoc No No Assoc Assoc Assoc Assoc Assoc Assoc Assoc Assoc Assoc Assoc No No1986 No Assoc Assoc Assoc No Assoc No No Assoc Assoc No No No No No Assoc1987 No Assoc Assoc Assoc No Assoc ASST ASST No No No No No No No No1988 No ASST Assoc Assoc No Assoc ASST ASST No Assoc Assoc Assoc No No No ASST1989 No No No Assoc No Assoc No No No No No Assoc No No ASST ASST1990 No No No No Assoc Assoc No Assoc No No No No No No No No1991 No No Assoc Assoc Assoc Assoc No No No No Assoc Assoc No Assoc No No1992 No No No Assoc No Assoc No No No No No No No Assoc No No1993 No No No Assoc No Assoc No ASST No No No No No Assoc No No1994 No No No No No Assoc No No No No No No No No No No1995 No Assoc Assoc Assoc No No No No No No No No No ASST No No1996 No No Assoc Assoc No No No No No No Assoc Assoc Assoc Assoc No No1997 No No Assoc Assoc No No No ASST No No Assoc Assoc No No No No1998 No No No Assoc No No No ASST No No No Assoc No No Assoc Assoc1999 No Assoc No Assoc No Assoc No No No No No No No No No No2000 No Assoc No No No No No ASST No No No Assoc No No No No2001 No No No No No No No No Assoc Assoc No No Assoc Assoc No No2002 No No No ASST No No No ASST No No No Assoc No ASST No No
2003 No No ASST ASST No No No ASST ASST ASST No ASST No Assoc No No
2004 No No No No No No No No ASST ASST No ASST No No ASST ASST
2005 No No No No No No No No No ASST No ASST No ASST ASST ASST
Organizational Behavior
Operations Management
Table 6Stochastic Dominance for Overlapping Salary Ranges between Assistant and Associate Professors
This table recomputes first‐ and second‐degree stochastic dominance using only the overlapping salary ranges for Assistant and Associate professors. Theresults are presented for private business schools in Panel A and public business schools in Panel B. The distributions are compared for each survey year,1979 to 2005 by discipline. All faculty are affiliated with AACSB‐accredited business schools. An ʺASSTʺ implies that Assistant professors are dominantover Associate professors; an ʺAssocʺ implies that Associate professors are dominant; and ʺNoʺ implies that a dominance relationship cannot bedetermined.
Panel A: Private AACSB‐accredited Business Schools
Accounting
Computer Information Systems Economics Finance Management Marketing
Year 1st deg 2nd deg 1st deg 2nd deg 1st deg 2nd deg 1st deg 2nd deg 1st deg 2nd deg 1st deg 2nd deg 1st deg 2nd deg 1st deg 2nd deg
1979 Assoc Assoc ‐‐ ‐‐ No No No Assoc No Assoc Assoc Assoc ‐‐ ‐‐ ‐‐ ‐‐1980 No No ‐‐ ‐‐ Assoc Assoc Assoc Assoc No Assoc Assoc Assoc ‐‐ ‐‐ ‐‐ ‐‐1981 No Assoc ‐‐ ‐‐ Assoc Assoc Assoc Assoc Assoc Assoc No No ‐‐ ‐‐ ‐‐ ‐‐1982 No Assoc ‐‐ ‐‐ Assoc Assoc No Assoc Assoc Assoc Assoc Assoc ‐‐ ‐‐ ‐‐ ‐‐1983 ASST ASST ASST ASST ASST ASST No No No No ASST ASST No ASST No No1984 Assoc Assoc No Assoc No Assoc No Assoc Assoc Assoc Assoc Assoc Assoc Assoc No No1985 Assoc Assoc Assoc Assoc Assoc Assoc Assoc Assoc Assoc Assoc Assoc Assoc Assoc Assoc No No1986 Assoc Assoc Assoc Assoc Assoc Assoc No No Assoc Assoc Assoc Assoc Assoc Assoc Assoc Assoc1987 Assoc Assoc No Assoc Assoc Assoc Assoc Assoc Assoc Assoc No Assoc Assoc Assoc No No1988 Assoc Assoc Assoc Assoc Assoc Assoc No No Assoc Assoc No No No No No No1989 No Assoc No No Assoc Assoc No Assoc No Assoc No No No No No No1990 No No No No No No No Assoc No No No No No Assoc Assoc Assoc1991 No No No No Assoc Assoc No ASST No No No No No Assoc No No1992 No No No No No No No ASST Assoc Assoc No Assoc Assoc Assoc No Assoc1993 No Assoc No No No Assoc No ASST No Assoc No No Assoc Assoc No No1994 No Assoc No No No Assoc No ASST No No No Assoc Assoc Assoc No No1995 No Assoc No No Assoc Assoc No ASST No No No No No Assoc Assoc Assoc1996 No Assoc No No No Assoc No ASST No Assoc No Assoc No No Assoc Assoc1997 No Assoc No Assoc No Assoc No No No Assoc No No No No No Assoc1998 No Assoc No Assoc No Assoc No No No Assoc No No No Assoc No No1999 No Assoc No No Assoc Assoc No No Assoc Assoc No Assoc No No No No2000 No No No No Assoc Assoc No No No No No Assoc No No No No2001 No No No No Assoc Assoc No No No No No Assoc No No No No2002 No No No ASST No No ASST ASST No No No No Assoc Assoc No Assoc2003 No No No ASST No No ASST ASST No No No No No No No No2004 No No ASST ASST No Assoc ASST ASST No ASST No No No No No ASST2005 No No No No No Assoc ASST ASST No No No No No No No ASST
Panel B: Public AACSB‐accredited Business Schools
Table 6 (continued)Stochastic Dominance for Overlapping Salary Ranges between Assistant and Associate Professors
Accounting
Computer Information Systems Economics Finance Management Marketing
Organizational Behavior
Operations Management
Year All Overlap All Overlap All Overlap All Overlap All Overlap All Overlap All Overlap All Overlap
1979 0.0% 0.0% ‐‐ ‐‐ 0.0% 0.0% 0.0% 2.2% 0.0% 4.0% 0.0% 0.0% ‐‐ ‐‐ ‐‐ ‐‐1980 0.0% 0.0% ‐‐ ‐‐ 0.0% 4.1% 0.0% 6.4% 3.2% 1.3% 0.0% 0.0% ‐‐ ‐‐ ‐‐ ‐‐1981 0.0% 0.0% ‐‐ ‐‐ 0.0% 2.6% 0.0% 0.0% 0.0% 2.5% 0.0% 1.3% ‐‐ ‐‐ ‐‐ ‐‐1982 0.0% 0.0% ‐‐ ‐‐ 0.0% 1.7% 0.0% 0.8% 0.0% 6.4% 0.0% 8.9% ‐‐ ‐‐ ‐‐ ‐‐1983 0.0% 100.0% 0.0% 100.0% 0.0% 74.4% 0.0% 100.0% 0.0% 100.0% 0.0% 89.3% 0.0% 100.0% 0.0% 100.0%1984 0.0% 2.7% 0.0% 11.8% 0.0% 2.8% 0.0% 0.0% 0.0% 7.5% 2.8% 0.7% 0.0% 9.7% 0.0% 8.7%1985 0.0% 0.0% 0.0% 10.0% 0.0% 0.0% 6.6% 0.0% 7.5% 0.0% 5.5% 0.0% 5.9% 0.0% 10.0% 92.7%1986 0.0% 40.5% 0.0% 0.0% 0.0% 3.1% 0.0% 53.8% 0.0% 0.0% 0.0% 14.1% 0.0% 3.6% 0.0% 13.8%1987 0.0% 28.6% 0.0% 0.0% 0.0% 2.6% 0.0% 100.0% 0.0% 9.0% 0.0% 5.5% 0.0% 7.2% 0.0% 42.3%1988 0.0% 77.4% 0.0% 0.0% 0.0% 35.2% 0.0% 100.0% 0.0% 2.5% 7.9% 0.0% 0.0% 31.8% 0.0% 46.5%1989 9.3% 18.1% 0.0% 7.5% 0.0% 7.8% 0.0% 24.4% 0.0% 10.1% 8.3% 3.4% 0.0% 23.2% 43.3% 100.0%1990 0.0% 43.8% 0.0% 14.5% 2.5% 0.0% 9.9% 8.7% 0.0% 10.7% 0.0% 8.5% 0.0% 10.1% 0.0% 36.0%1991 33.2% 52.8% 9.8% 0.0% 25.6% 0.0% 11.5% 29.9% 0.0% 7.2% 6.6% 0.0% 0.0% 3.8% 0.0% 5.4%1992 16.5% 52.7% 0.0% 8.0% 5.9% 13.8% 7.6% 28.7% 6.6% 30.8% 6.6% 11.0% 3.7% 3.3% 14.8% 35.0%1993 23.7% 46.0% 6.0% 3.5% 0.0% 19.7% 0.0% 60.3% 11.9% 21.8% 7.3% 23.3% 8.7% 8.5% 0.0% 5.5%1994 0.0% 41.7% 5.9% 6.8% 0.0% 5.4% 12.6% 39.3% 0.8% 9.3% 0.0% 15.6% 0.0% 9.5% 0.0% 18.4%1995 30.8% 8.6% 7.4% 0.0% 0.0% 10.6% 10.0% 22.4% 1.5% 9.0% 0.0% 11.2% 0.0% 54.9% 0.0% 12.7%1996 0.0% 21.3% 8.1% 0.0% 0.0% 12.5% 1.1% 51.2% 5.4% 7.9% 8.6% 0.0% 0.0% 0.0% 4.7% 6.2%1997 0.0% 17.6% 9.8% 0.0% 0.0% 11.4% 14.2% 61.4% 0.0% 11.0% 5.3% 0.0% 0.0% 77.7% 0.0% 6.9%1998 0.0% 32.9% 0.0% 4.4% 0.0% 29.4% 20.9% 99.3% 0.0% 40.0% 4.6% 20.7% 7.7% 59.3% 5.0% 0.0%1999 27.3% 39.0% 5.4% 7.6% 0.0% 13.7% 58.3% 88.9% 0.0% 25.7% 3.9% 51.3% 0.0% 52.2% 0.0% 40.3%2000 29.4% 38.5% 25.2% 54.0% 42.4% 58.1% 62.9% 98.1% 4.9% 53.2% 11.1% 35.8% 0.0% 14.2% 0.0% 60.6%2001 41.0% 48.0% 48.3% 55.4% 46.9% 70.8% 64.5% 73.7% 17.9% 0.0% 0.0% 51.5% 7.3% 0.0% 0.0% 43.6%2002 43.8% 48.8% 52.4% 91.7% 63.6% 58.9% 66.4% 92.9% 6.4% 58.4% 4.2% 38.2% 0.0% 89.1% 76.3% 86.6%
2003 47.6% 48.5% 29.2% 100.0% 38.1% 69.6% 69.8% 99.1% 0.0% 100.0% 48.1% 90.8% 0.0% 31.7% 64.0% 83.6%
2004 59.6% 61.9% 29.0% 56.0% 46.9% 78.5% 72.9% 84.8% 39.9% 100.0% 30.1% 86.5% 0.0% 50.4% 87.7% 100.0%
2005 54.9% 78.4% 69.0% 77.7% 46.7% 67.4% 74.7% 82.3% 41.5% 96.5% 52.4% 95.4% 0.0% 59.5% 83.1% 100.0%
Operations ManagementFinance Management Marketing
Organizational Behavior
Table 7Measuring the Degree of First‐Order Dominance between Assistant and Associate Professors
This table reports the degree to which the salary distribution of Assistant Professors is first‐order dominate over the salary distribution for AssociateProfessors. The degree of dominance is measured by computing the fraction of the Assistant Professor cumulative distribution function that lies beneath thecorresponding Associate Professor cumulative distribution function. A fraction equal to 100% implies that Assistant Professors are first‐degree dominateover Associate Professors.
Panel A: Private AACSB‐accredited Business Schools
Accounting
Computer Information Systems Economics
Year All Overlap All Overlap All Overlap All Overlap All Overlap All Overlap All Overlap All Overlap
1979 0.0% 0.0% ‐‐ ‐‐ 0.0% 1.3% 0.0% 1.1% 0.0% 2.7% 0.0% 0.0% ‐‐ ‐‐ ‐‐ ‐‐1980 0.0% 3.9% ‐‐ ‐‐ 4.0% 0.0% 0.0% 0.0% 0.0% 1.1% 0.0% 0.0% ‐‐ ‐‐ ‐‐ ‐‐1981 0.0% 1.2% ‐‐ ‐‐ 0.0% 0.0% 0.0% 0.0% 0.0% 0.0% 0.0% 0.7% ‐‐ ‐‐ ‐‐ ‐‐1982 1.9% 2.3% ‐‐ ‐‐ 2.4% 0.0% 3.2% 4.1% 0.0% 0.0% 0.0% 0.0% ‐‐ ‐‐ ‐‐ ‐‐1983 0.0% 100.0% 0.0% 100.0% 12.5% 100.0% 0.0% 51.9% 0.0% 50.9% 0.0% 100.0% 0.0% 55.6% 0.0% 41.2%1984 0.0% 0.0% 0.0% 21.3% 0.0% 1.6% 0.0% 2.9% 0.0% 0.0% 0.0% 0.0% 4.9% 0.0% 0.0% 7.2%1985 0.0% 0.0% 0.0% 0.0% 0.0% 0.0% 0.0% 0.0% 0.0% 0.0% 0.0% 0.0% 0.0% 0.0% 0.0% 6.4%1986 0.0% 0.0% 0.0% 0.0% 0.0% 0.0% 0.0% 25.4% 0.0% 0.0% 0.0% 0.0% 4.9% 0.0% 0.0% 0.0%1987 0.0% 0.0% 0.0% 2.9% 0.0% 0.0% 0.0% 0.0% 0.0% 0.0% 0.0% 2.1% 0.0% 0.0% 0.0% 9.1%1988 0.0% 0.0% 0.0% 0.0% 0.0% 0.0% 0.0% 9.9% 0.0% 0.0% 0.0% 7.6% 0.0% 5.5% 0.0% 8.5%1989 0.0% 4.7% 0.0% 8.0% 3.9% 0.0% 17.2% 0.2% 3.3% 2.3% 0.0% 10.7% 0.0% 8.6% 0.0% 15.1%1990 0.0% 8.6% 0.0% 13.6% 5.0% 5.7% 17.3% 0.2% 24.7% 19.5% 0.0% 11.5% 0.0% 0.6% 0.0% 0.0%1991 0.0% 14.7% 0.0% 15.3% 0.0% 0.0% 16.1% 32.7% 0.0% 10.5% 0.0% 13.4% 3.3% 2.4% 0.0% 14.3%1992 0.0% 15.0% 0.0% 16.4% 0.0% 13.1% 10.8% 65.6% 9.5% 0.0% 3.9% 4.2% 9.3% 0.0% 9.9% 1.1%1993 3.4% 5.4% 0.0% 16.1% 5.6% 3.8% 20.7% 80.0% 22.4% 12.3% 14.5% 25.9% 8.6% 0.0% 0.0% 10.3%1994 0.0% 7.7% 0.0% 15.5% 0.3% 6.4% 7.7% 61.7% 3.8% 22.3% 8.1% 6.6% 4.5% 0.0% 0.0% 11.4%1995 0.0% 8.2% 0.0% 16.2% 6.3% 0.0% 23.4% 97.4% 0.0% 8.4% 0.0% 16.8% 0.0% 4.5% 7.9% 0.0%1996 0.0% 8.6% 0.0% 15.0% 7.2% 5.7% 0.0% 81.2% 5.7% 4.2% 7.1% 7.1% 0.0% 4.4% 6.6% 0.0%1997 0.0% 8.0% 0.0% 5.6% 1.5% 5.7% 0.0% 17.8% 2.0% 5.1% 0.0% 16.9% 0.0% 9.3% 7.3% 5.4%1998 0.0% 9.3% 4.2% 6.6% 2.1% 4.7% 17.7% 53.9% 6.3% 13.6% 0.0% 17.3% 0.0% 5.2% 0.0% 25.2%1999 4.0% 9.4% 0.0% 15.8% 2.8% 0.0% 23.3% 54.3% 6.3% 0.0% 5.9% 7.9% 0.0% 4.8% 0.0% 12.0%2000 0.0% 29.2% 0.0% 16.5% 7.7% 0.0% 32.9% 42.2% 0.0% 6.8% 6.9% 14.0% 0.0% 27.6% 0.0% 27.6%2001 2.7% 29.6% 0.0% 52.4% 0.0% 0.0% 33.3% 56.8% 0.0% 29.7% 7.2% 13.1% 0.0% 16.1% 0.0% 18.6%2002 9.8% 37.2% 29.8% 90.7% 0.0% 15.1% 60.5% 100.0% 3.9% 36.0% 7.1% 45.0% 5.1% 0.0% 3.5% 29.3%2003 32.0% 49.2% 20.8% 92.1% 0.0% 15.2% 68.9% 100.0% 14.8% 48.6% 22.3% 47.1% 8.0% 6.3% 25.2% 60.7%2004 47.6% 58.1% 38.7% 100.0% 0.0% 8.4% 72.4% 100.0% 32.5% 61.1% 55.9% 72.6% 0.0% 6.8% 50.2% 85.2%2005 49.7% 85.4% 29.9% 46.7% 0.0% 9.4% 75.3% 100.0% 22.0% 56.0% 21.4% 78.0% 0.0% 6.9% 28.6% 77.2%
Panel B: Public AACSB‐accredited Business Schools
Table 7 (continued)Measuring the Degree of First‐Order Dominance between Assistant and Associate Professors
Accounting
Computer Information Systems Economics Finance Management Marketing
Organizational Behavior
Operations Management
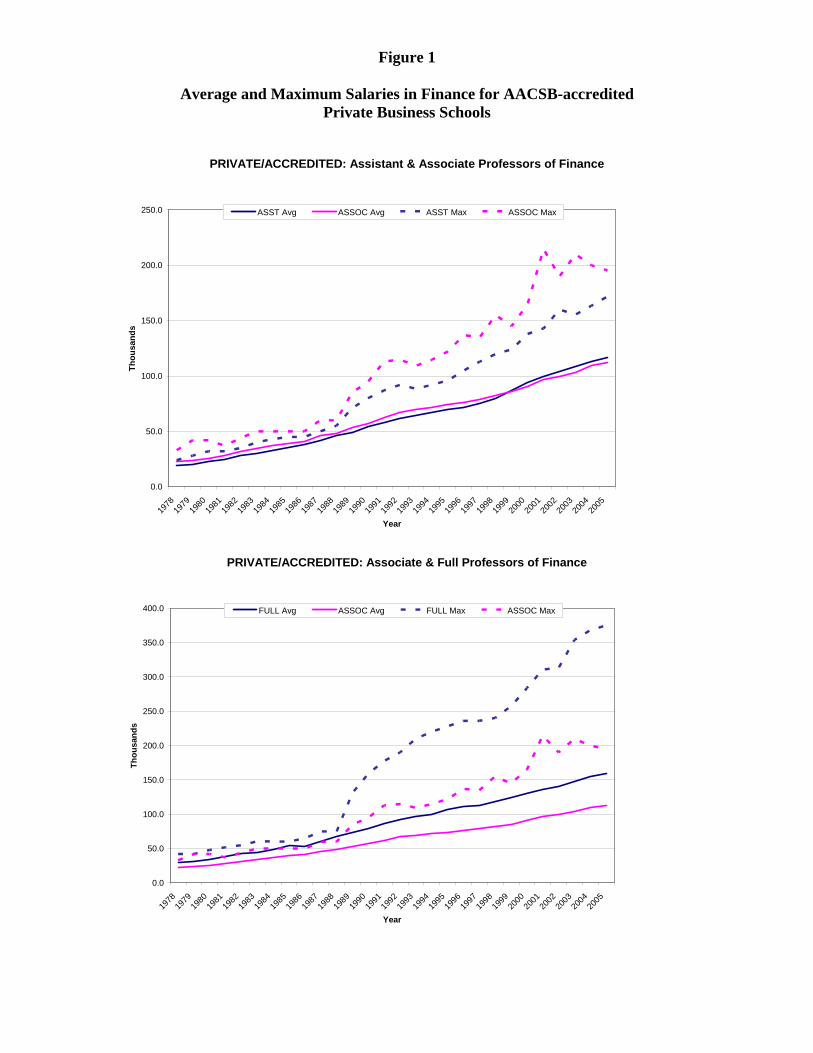
Figure 1
Average and Maximum Salaries in Finance for AACSB-accredited Private Business Schools
PRIVATE/ACCREDITED: Assistant & Associate Professors of Finance
0.0
50.0
100.0
150.0
200.0
250.0
1978
1979
1980
1981
1982
1983
1984
1985
1986
1987
1988
1989
1990
1991
1992
1993
1994
1995
1996
1997
1998
1999
2000
2001
2002
2003
2004
2005
Year
Thou
sand
s
ASST Avg ASSOC Avg ASST Max ASSOC Max
PRIVATE/ACCREDITED: Associate & Full Professors of Finance
0.0
50.0
100.0
150.0
200.0
250.0
300.0
350.0
400.0
1978
1979
1980
1981
1982
1983
1984
1985
1986
1987
1988
1989
1990
1991
1992
1993
1994
1995
1996
1997
1998
1999
2000
2001
2002
2003
2004
2005
Year
Thou
sand
s
FULL Avg ASSOC Avg FULL Max ASSOC Max
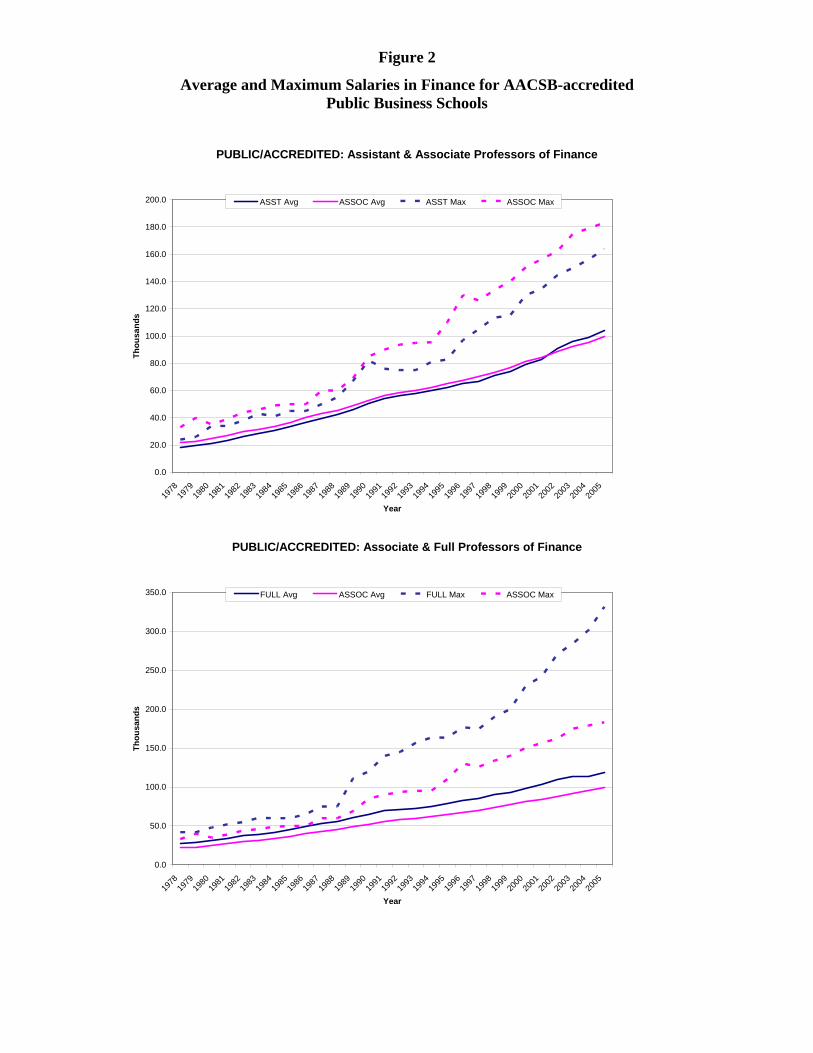
Figure 2
Average and Maximum Salaries in Finance for AACSB-accredited Public Business Schools
PUBLIC/ACCREDITED: Assistant & Associate Professors of Finance
0.0
20.0
40.0
60.0
80.0
100.0
120.0
140.0
160.0
180.0
200.0
1978
1979
1980
1981
1982
1983
1984
1985
1986
1987
1988
1989
1990
1991
1992
1993
1994
1995
1996
1997
1998
1999
2000
2001
2002
2003
2004
2005
Year
Thou
sand
s
ASST Avg ASSOC Avg ASST Max ASSOC Max
PUBLIC/ACCREDITED: Associate & Full Professors of Finance
0.0
50.0
100.0
150.0
200.0
250.0
300.0
350.0
1978
1979
1980
1981
1982
1983
1984
1985
1986
1987
1988
1989
1990
1991
1992
1993
1994
1995
1996
1997
1998
1999
2000
2001
2002
2003
2004
2005
Year
Thou
sand
s
FULL Avg ASSOC Avg FULL Max ASSOC Max


![AACSB INTERNATIONAL SELF EVALUATION REPORT GUIDELINESweb.mst.edu/~scm1/AACSB/AACSB_SER_Data_Reuqirement.pdf · AACSB INTERNATIONAL SELF EVALUATION REPORT GUIDELINES ... [MISSION STATEMENT]](https://img.pdfslide.us/doc/110x75/5afcd9637f8b9a864d8cb5fb/aacsb-international-self-evaluation-report-scm1aacsbaacsbserdatareuqirementpdfaacsb.jpg)