Embed Size (px)
Citation preview
6/1/2016
1
Robert H. Eckel, MD Professor of Medicine
University of Colorado Anschutz Medical Campus Aurora, CO
EMPA-REG Results:
Implications for CVD Prevention in Type 2 Diabetes
Therapy
AACE Orlando
May 27, 2016
Metabolic Basis of Increased Atherosclerosis: Diabetes & Beyond
• Metabolic substrates – Glucose
– Fatty acids
– Lipoproteins
• Inflammation
• Oxidation/Glycoxidation
• Endothelial dysfunction
• Pro-thrombotic state – thrombosis
– fibrinolysis

6/1/2016
2
Metabolic Basis of Increased Atherosclerosis: Diabetes & Beyond
• Metabolic substrates – Glucose
– Fatty acids
– Lipoproteins
• Inflammation
• Oxidation/Glycoxidation
• Endothelial dysfunction
• Pro-thrombotic state – thrombosis
– fibrinolysis
Learning Objectives
At the conclusion of this activity, the participant will be able to:
1. Describe the mechanism of action of the SGLT2 inhibitors.
2. Review the main findings of the EMPA-REG OUTCOME trial.
3. Discuss the implicatons that the EMPA-REG OUTCOME trial has for CVD risk reduction in diabetes treatment.

6/1/2016
3
SGLT2
SGLT1
Normal Physiology of Renal Glucose Homeostasis
Proximal tubule
S1
Glomerulus Distal tubule
Glucose filtration
Minimal glucose
excretion
S3
Collecting duct
90%
10% Glucose
reabsorption
Wright EM. Am J Physiol Renal Physiol. 2001;280:F10-F18; Lee YJ et al. Kidney Int Suppl. 2007;106:S27-S35; Han S. Diabetes. 2008;57:1723-1729.
Loop of Henle
SGLT2 inhibitor
SGLT2 Inhibition Reduces Renal Glucose Reabsorption
SGLT2
SGLT1
Proximal tubule
S1
Glomerulus Distal tubule
Glucose filtration
Increased glucose
excretion
S3
Collecting duct
90%
10%
Loop of Henle
Glucose reabsorption
Wright EM. Am J Physiol Renal Physiol. 2001;280:F10-F18; Lee YJ et al. Kidney Int Suppl. 2007;106:S27-S35; Han S. Diabetes. 2008;57:1723-1729.
- 70-80 g/day ( - 280-320 Kcal/day)
SGLT2 inhibitor
Canagliflozin 100, 300 mg
Dapagliflozin 5, 10 mg
Empagliflozin 10, 25 mg
SGLT2 Inhibition Reduces Renal Glucose Reabsorption
*not approved in U.S.
6/1/2016
4
-1.25
-1.00
-0.75
-0.50
-0.25
0.00
Ad
just
ed m
ean
(9
5%
CI)
dif
fere
nce
ver
sus
pla
ceb
o
in c
han
ge f
rom
bas
elin
e in
Hb
A1
c (%
) Dapagliflozin Canagliflozin Empagliflozin Ipragliflozin Luseogliflozin
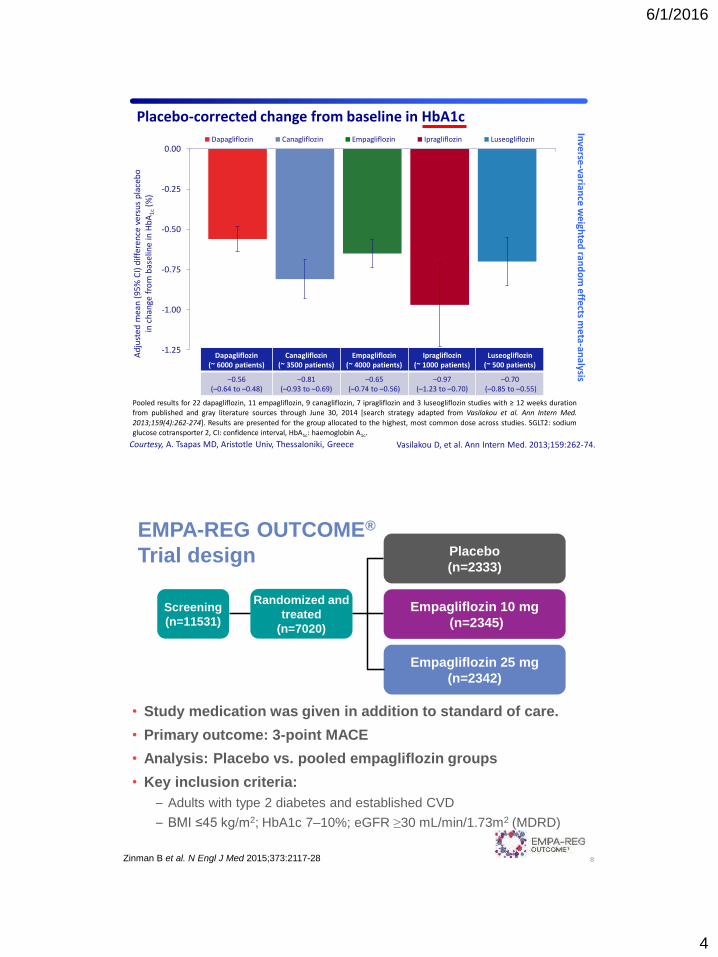
Pooled results for 22 dapagliflozin, 11 empagliflozin, 9 canagliflozin, 7 ipragliflozin and 3 luseogliflozin studies with ≥ 12 weeks duration from published and gray literature sources through June 30, 2014 [search strategy adapted from Vasilakou et al. Ann Intern Med.
2013;159(4):262-274]. Results are presented for the group allocated to the highest, most common dose across studies. SGLT2: sodium glucose cotransporter 2, CI: confidence interval, HbA1c: haemoglobin A1c.
Placebo-corrected change from baseline in HbA1c
Dapagliflozin (~ 6000 patients)
Canagliflozin (~ 3500 patients)
Empagliflozin (~ 4000 patients)
Ipragliflozin (~ 1000 patients)
Luseogliflozin (~ 500 patients)
–0.56 (–0.64 to –0.48)
–0.81 (–0.93 to –0.69)
–0.65 (–0.74 to –0.56)
–0.97 (–1.23 to –0.70)
–0.70 (–0.85 to –0.55)
Courtesy, A. Tsapas MD, Aristotle Univ, Thessaloniki, Greece Vasilakou D, et al. Ann Intern Med. 2013;159:262-74.
Inve
rse-varian
ce we
ighte
d ran
do
m e
ffects m
eta-an
alysis
EMPA-REG OUTCOME®
Trial design
• Study medication was given in addition to standard of care.
• Primary outcome: 3-point MACE
• Analysis: Placebo vs. pooled empagliflozin groups
• Key inclusion criteria:
– Adults with type 2 diabetes and established CVD
– BMI ≤45 kg/m2; HbA1c 7–10%; eGFR ≥30 mL/min/1.73m2 (MDRD)
8
Randomized and
treated
(n=7020)
Empagliflozin 10 mg
(n=2345)
Empagliflozin 25 mg
(n=2342)
Placebo
(n=2333)
Screening
(n=11531)
Zinman B et al. N Engl J Med 2015;373:2117-28
6/1/2016
5
Placebo
(n=2333)
Empagliflozin
10 mg
(n=2345)
Empagliflozin
25 mg
(n=2342)
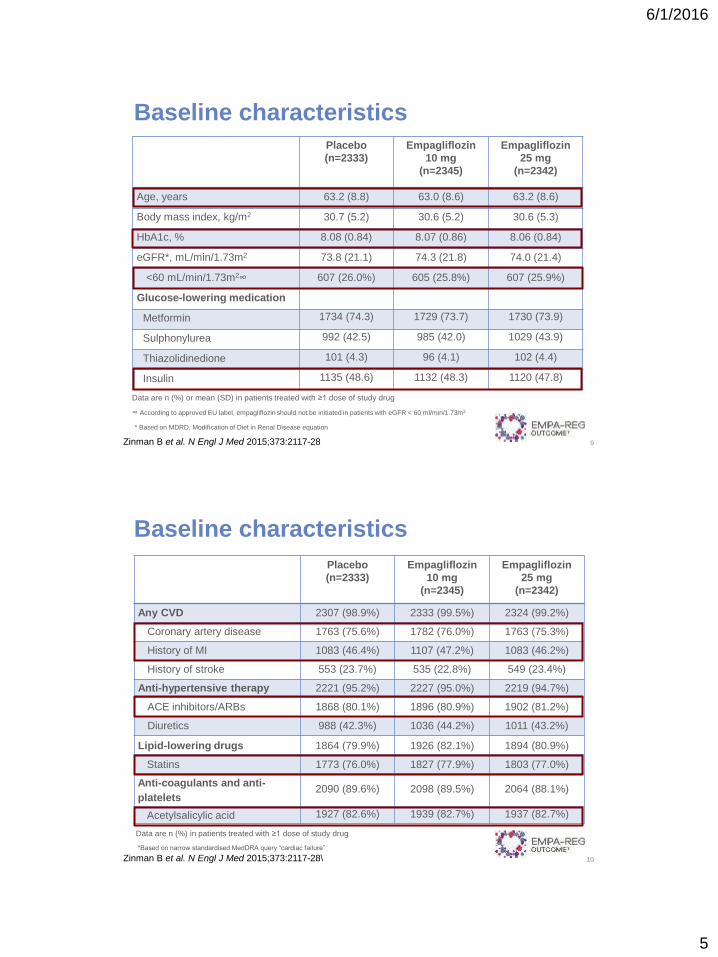
Age, years 63.2 (8.8) 63.0 (8.6) 63.2 (8.6)
Body mass index, kg/m2 30.7 (5.2) 30.6 (5.2) 30.6 (5.3)
HbA1c, % 8.08 (0.84) 8.07 (0.86) 8.06 (0.84)
eGFR*, mL/min/1.73m2 73.8 (21.1) 74.3 (21.8) 74.0 (21.4)
<60 mL/min/1.73m2∞ 607 (26.0%) 605 (25.8%) 607 (25.9%)
Glucose-lowering medication
Metformin 1734 (74.3) 1729 (73.7) 1730 (73.9)
Sulphonylurea 992 (42.5) 985 (42.0) 1029 (43.9)
Thiazolidinedione 101 (4.3) 96 (4.1) 102 (4.4)
Insulin 1135 (48.6) 1132 (48.3) 1120 (47.8)
Baseline characteristics
Data are n (%) or mean (SD) in patients treated with ≥1 dose of study drug
∞ According to approved EU label, empagliflozin should not be initiated in patients with eGFR < 60 ml/min/1.73m2
9
* Based on MDRD, Modification of Diet in Renal Disease equation
Zinman B et al. N Engl J Med 2015;373:2117-28
Placebo
(n=2333)
Empagliflozin
10 mg
(n=2345)
Empagliflozin
25 mg
(n=2342)
Any CVD 2307 (98.9%) 2333 (99.5%) 2324 (99.2%)
Coronary artery disease 1763 (75.6%) 1782 (76.0%) 1763 (75.3%)
History of MI 1083 (46.4%) 1107 (47.2%) 1083 (46.2%)
History of stroke 553 (23.7%) 535 (22.8%) 549 (23.4%)
Anti-hypertensive therapy 2221 (95.2%) 2227 (95.0%) 2219 (94.7%)
ACE inhibitors/ARBs 1868 (80.1%) 1896 (80.9%) 1902 (81.2%)
Diuretics 988 (42.3%) 1036 (44.2%) 1011 (43.2%)
Lipid-lowering drugs 1864 (79.9%) 1926 (82.1%) 1894 (80.9%)
Statins 1773 (76.0%) 1827 (77.9%) 1803 (77.0%)
Anti-coagulants and anti-
platelets 2090 (89.6%) 2098 (89.5%) 2064 (88.1%)
Acetylsalicylic acid 1927 (82.6%) 1939 (82.7%) 1937 (82.7%)
Data are n (%) in patients treated with ≥1 dose of study drug
10
*Based on narrow standardised MedDRA query “cardiac failure”
Baseline characteristics
Zinman B et al. N Engl J Med 2015;373:2117-28\
6/1/2016
6
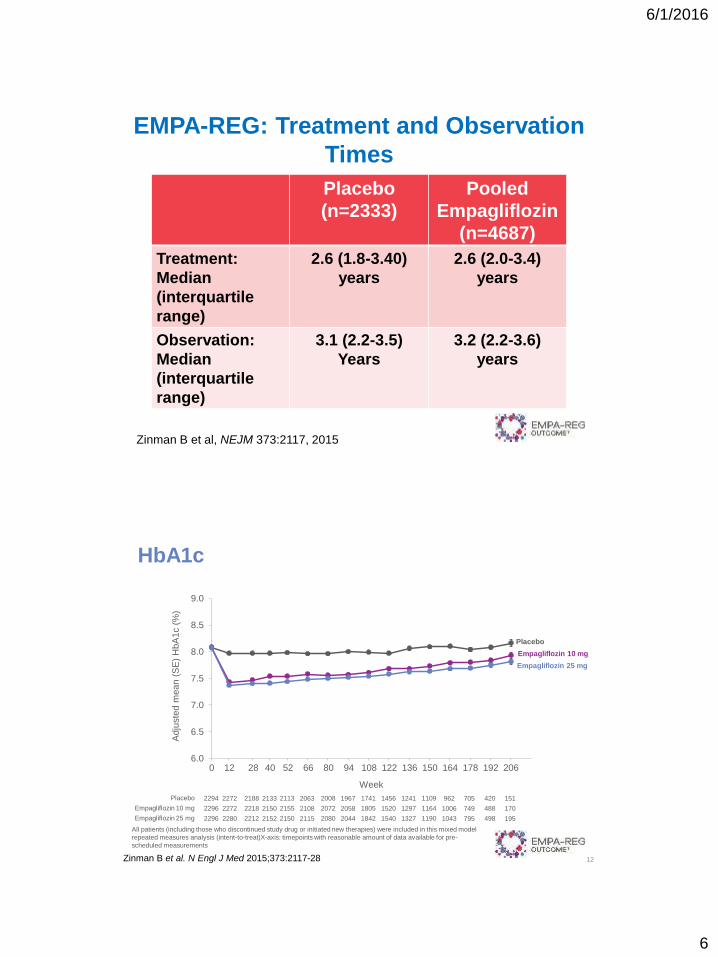
EMPA-REG: Treatment and Observation
Times
Zinman B et al, NEJM 373:2117, 2015
Placebo
(n=2333)
Pooled
Empagliflozin
(n=4687)
Treatment:
Median
(interquartile
range)
2.6 (1.8-3.40)
years
2.6 (2.0-3.4)
years
Observation:
Median
(interquartile
range)
3.1 (2.2-3.5)
Years
3.2 (2.2-3.6)
years
HbA1c
6.0
6.5
7.0
7.5
8.0
8.5
9.0
Adju
ste
d m
ean (
SE
) H
bA
1c (
%)
Week
Placebo
Empagliflozin 10 mg
Empagliflozin 25 mg
2294
2296
2296
Placebo
Empagliflozin 10 mg
Empagliflozin 25 mg
2272
2272
2280
2188
2218
2212
2133
2150
2152
2113
2155
2150
2063
2108
2115
2008
2072
2080
1967
2058
2044
1741
1805
1842
1456
1520
1540
1241
1297
1327
1109
1164
1190
962
1006
1043
705
749
795
420
488
498
151
170
195
12 28 52 94 108 80 122 66 136 0 150 164 178 192 206 40
12
All patients (including those who discontinued study drug or initiated new therapies) were included in this mixed model
repeated measures analysis (intent-to-treat)X-axis: timepoints with reasonable amount of data available for pre-
scheduled measurements
Zinman B et al. N Engl J Med 2015;373:2117-28
6/1/2016
7
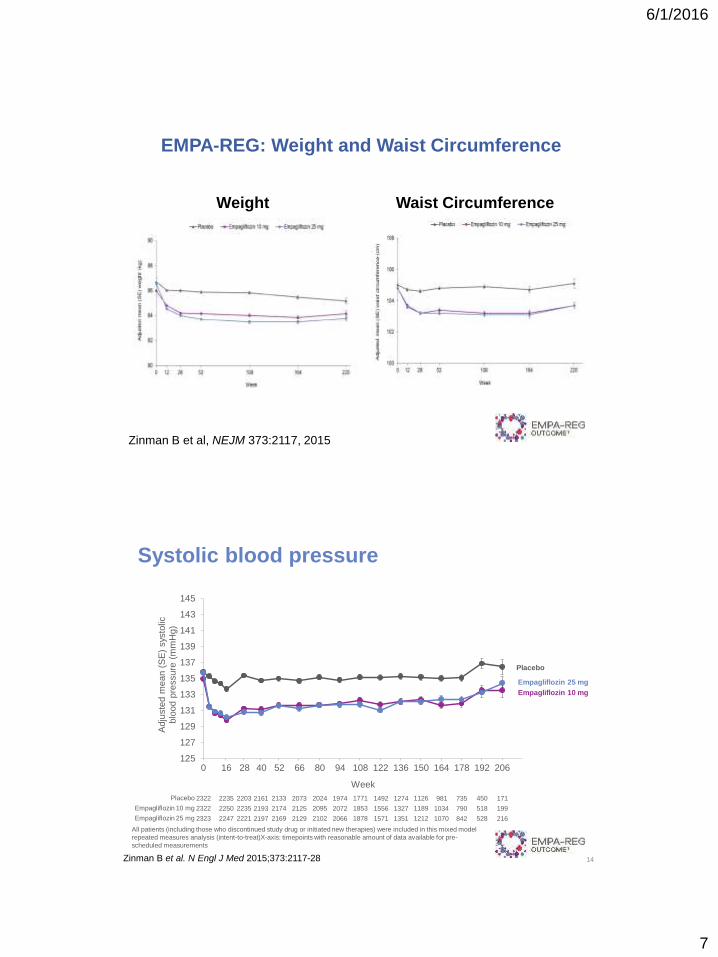
EMPA-REG: Weight and Waist Circumference
Zinman B et al, NEJM 373:2117, 2015
Weight Waist Circumference
Systolic blood pressure
14
125
127
129
131
133
135
137
139
141
143
145
Adju
ste
d m
ean (
SE
) sys
tolic
blo
od p
ressure
(m
mH
g)
Week
2322
2322
2323
Placebo
Empagliflozin 10 mg
Empagliflozin 25 mg
2235
2250
2247
2203
2235
2221
2161
2193
2197
2133
2174
2169
2073
2125
2129
2024
2095
2102
1974
2072
2066
1771
1853
1878
1492
1556
1571
1274
1327
1351
1126
1189
1212
981
1034
1070
735
790
842
450
518
528
171
199
216
Placebo
Empagliflozin 10 mg
Empagliflozin 25 mg
16 28 52 94 108 80 122 66 136 0 150 164 178 192 206 40
All patients (including those who discontinued study drug or initiated new therapies) were included in this mixed model
repeated measures analysis (intent-to-treat)X-axis: timepoints with reasonable amount of data available for pre-
scheduled measurements
Zinman B et al. N Engl J Med 2015;373:2117-28
6/1/2016
8
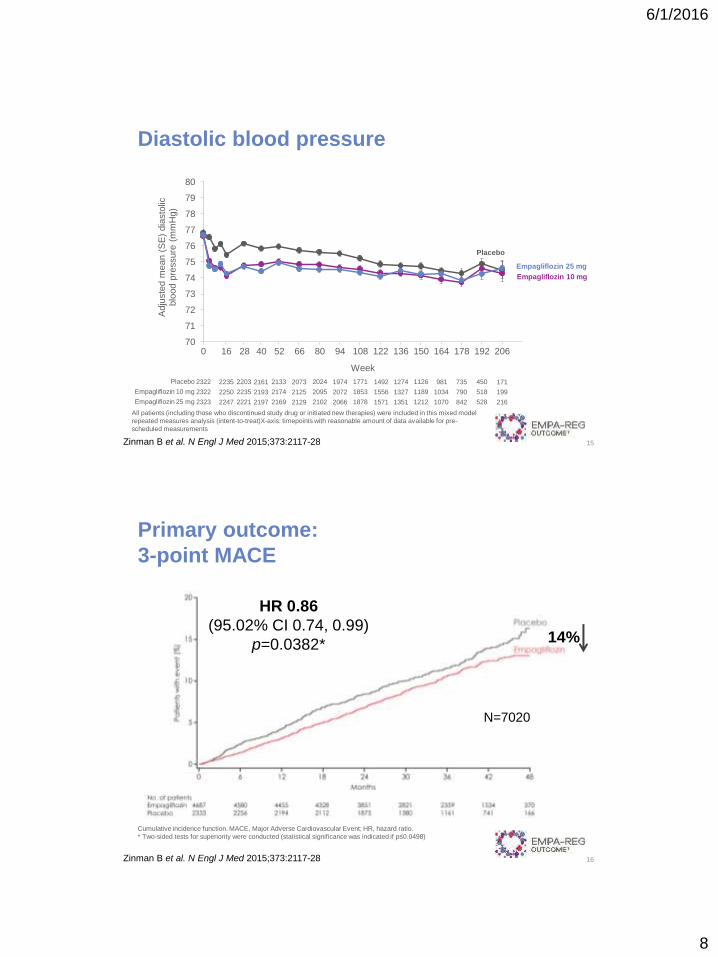
Diastolic blood pressure
15
70
71
72
73
74
75
76
77
78
79
80
Adju
ste
d m
ean (
SE
) dia
sto
lic
blo
od p
ressure
(m
mH
g)
Week
2322
2322
2323
Placebo
Empagliflozin 10 mg
Empagliflozin 25 mg
2235
2250
2247
2203
2235
2221
2161
2193
2197
2133
2174
2169
2073
2125
2129
2024
2095
2102
1974
2072
2066
1771
1853
1878
1492
1556
1571
1274
1327
1351
1126
1189
1212
981
1034
1070
735
790
842
450
518
528
171
199
216
Placebo
Empagliflozin 10 mg
Empagliflozin 25 mg
16 28 52 94 108 80 122 66 136 0 150 164 178 192 206 40
All patients (including those who discontinued study drug or initiated new therapies) were included in this mixed model
repeated measures analysis (intent-to-treat)X-axis: timepoints with reasonable amount of data available for pre-
scheduled measurements
Zinman B et al. N Engl J Med 2015;373:2117-28
Primary outcome:
3-point MACE
16
HR 0.86
(95.02% CI 0.74, 0.99)
p=0.0382*
Cumulative incidence function. MACE, Major Adverse Cardiovascular Event; HR, hazard ratio.
* Two-sided tests for superiority were conducted (statistical significance was indicated if p≤0.0498)
14%
N=7020
Zinman B et al. N Engl J Med 2015;373:2117-28
6/1/2016
9
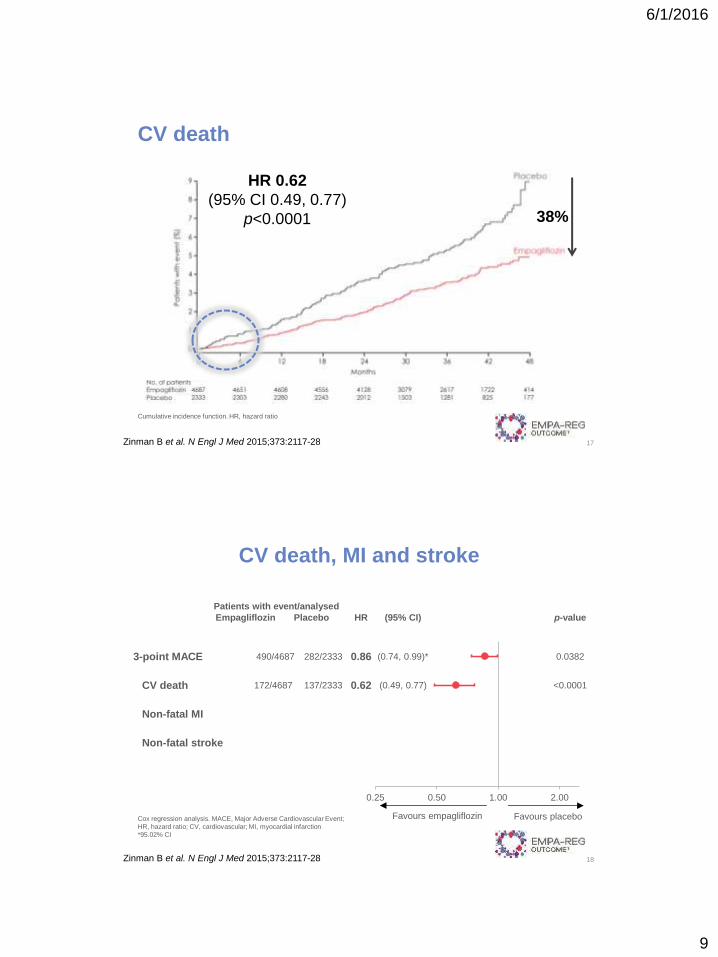
CV death
17
HR 0.62
(95% CI 0.49, 0.77)
p<0.0001
Cumulative incidence function. HR, hazard ratio
38%
Zinman B et al. N Engl J Med 2015;373:2117-28
Patients with event/analysed
Empagliflozin Placebo HR (95% CI) p-value
3-point MACE 490/4687 282/2333 0.86 (0.74, 0.99)* 0.0382
CV death 172/4687 137/2333 0.62 (0.49, 0.77) <0.0001
Non-fatal MI
Non-fatal stroke
0.25 0.50 1.00 2.00
CV death, MI and stroke
18
Favours empagliflozin Favours placebo Cox regression analysis. MACE, Major Adverse Cardiovascular Event;
HR, hazard ratio; CV, cardiovascular; MI, myocardial infarction
*95.02% CI
Zinman B et al. N Engl J Med 2015;373:2117-28
6/1/2016
10
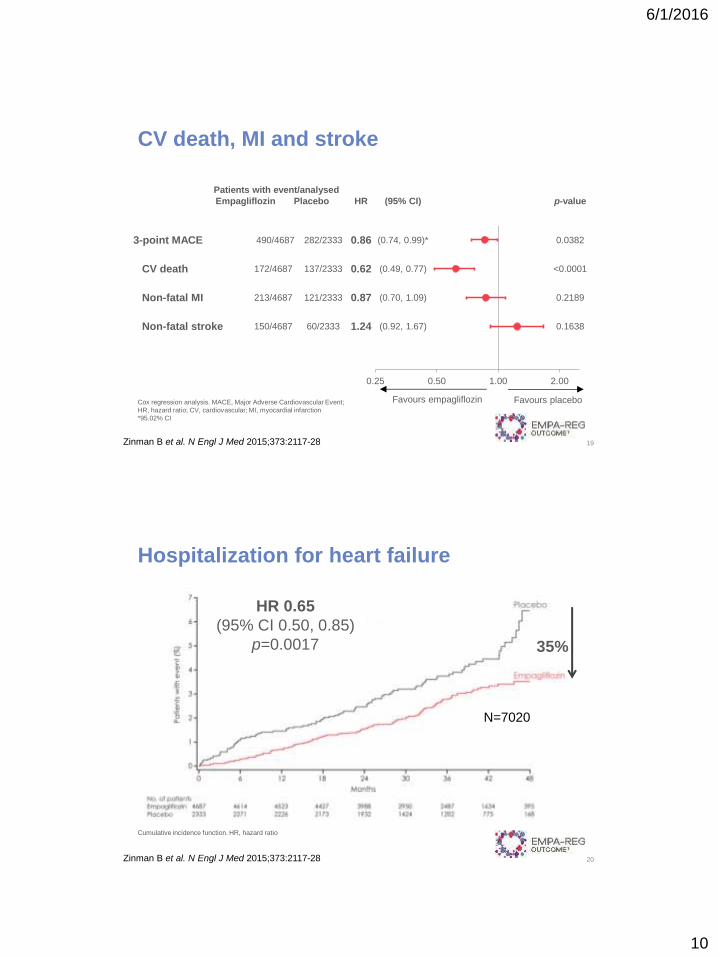
Patients with event/analysed
Empagliflozin Placebo HR (95% CI) p-value
3-point MACE 490/4687 282/2333 0.86 (0.74, 0.99)* 0.0382
CV death 172/4687 137/2333 0.62 (0.49, 0.77) <0.0001
Non-fatal MI 213/4687 121/2333 0.87 (0.70, 1.09) 0.2189
Non-fatal stroke 150/4687 60/2333 1.24 (0.92, 1.67) 0.1638
0.25 0.50 1.00 2.00
CV death, MI and stroke
19
Favours empagliflozin Favours placebo Cox regression analysis. MACE, Major Adverse Cardiovascular Event;
HR, hazard ratio; CV, cardiovascular; MI, myocardial infarction
*95.02% CI
Zinman B et al. N Engl J Med 2015;373:2117-28
Hospitalization for heart failure
20
Cumulative incidence function. HR, hazard ratio
35%
Zinman B et al. N Engl J Med 2015;373:2117-28
N=7020
HR 0.65
(95% CI 0.50, 0.85)
p=0.0017
6/1/2016
11
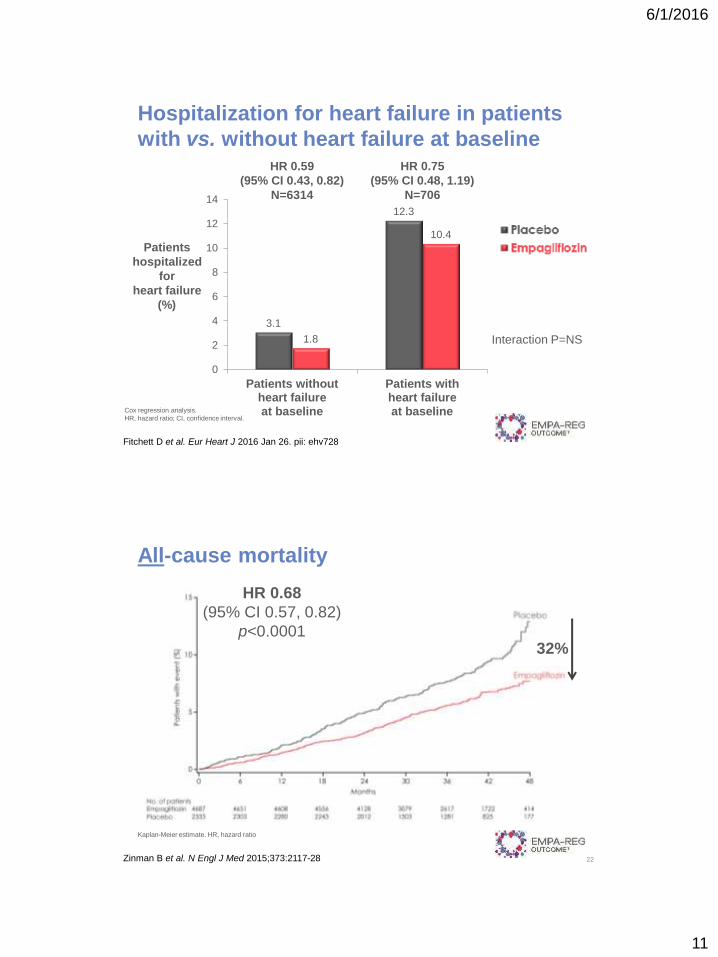
Patients
hospitalized
for
heart failure
(%)
Hospitalization for heart failure in patients
with vs. without heart failure at baseline
3.1
12.3
1.8
10.4
0
2
4
6
8
10
12
14
Patients withoutheart failureat baseline
Patients withheart failureat baselineCox regression analysis.
HR, hazard ratio; CI, confidence interval.
Interaction P=NS
Fitchett D et al. Eur Heart J 2016 Jan 26. pii: ehv728
HR 0.75
(95% CI 0.48, 1.19)
N=706
HR 0.59
(95% CI 0.43, 0.82)
N=6314
All-cause mortality
22
HR 0.68
(95% CI 0.57, 0.82)
p<0.0001
Kaplan-Meier estimate. HR, hazard ratio
32%
Zinman B et al. N Engl J Med 2015;373:2117-28
6/1/2016
12
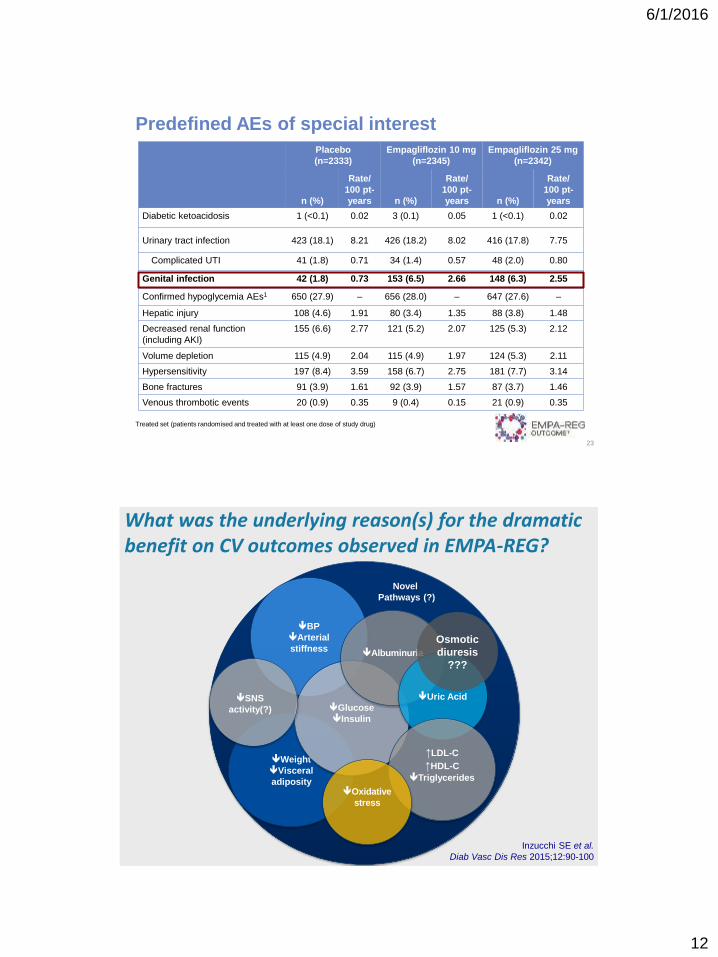
Predefined AEs of special interest
23
Treated set (patients randomised and treated with at least one dose of study drug)
Placebo
(n=2333)
Empagliflozin 10 mg
(n=2345)
Empagliflozin 25 mg
(n=2342)
n (%)
Rate/
100 pt-
years n (%)
Rate/
100 pt-
years n (%)
Rate/
100 pt-
years
Diabetic ketoacidosis 1 (<0.1) 0.02 3 (0.1) 0.05 1 (<0.1) 0.02
Urinary tract infection 423 (18.1) 8.21 426 (18.2) 8.02 416 (17.8) 7.75
Complicated UTI 41 (1.8) 0.71 34 (1.4) 0.57 48 (2.0) 0.80
Genital infection 42 (1.8) 0.73 153 (6.5) 2.66 148 (6.3) 2.55
Confirmed hypoglycemia AEs1 650 (27.9) – 656 (28.0) – 647 (27.6) –
Hepatic injury 108 (4.6) 1.91 80 (3.4) 1.35 88 (3.8) 1.48
Decreased renal function
(including AKI)
155 (6.6) 2.77 121 (5.2) 2.07 125 (5.3) 2.12
Volume depletion 115 (4.9) 2.04 115 (4.9) 1.97 124 (5.3) 2.11
Hypersensitivity 197 (8.4) 3.59 158 (6.7) 2.75 181 (7.7) 3.14
Bone fractures 91 (3.9) 1.61 92 (3.9) 1.57 87 (3.7) 1.46
Venous thrombotic events 20 (0.9) 0.35 9 (0.4) 0.15 21 (0.9) 0.35
Weight
Visceral
adiposity
BP
Arterial
stiffness
Glucose
Insulin
Albuminuria
Uric Acid
Novel
Pathways (?)
↑LDL-C
↑HDL-C
Triglycerides
Oxidative
stress
SNS
activity(?)
Inzucchi SE et al.
Diab Vasc Dis Res 2015;12:90-100
Osmotic
diuresis
???
Potential pathways to CV impact of SGLT2-inhibitors,
based on clinical and mechanistic studies
What was the underlying reason(s) for the dramatic benefit on CV outcomes observed in EMPA-REG?
6/1/2016
13
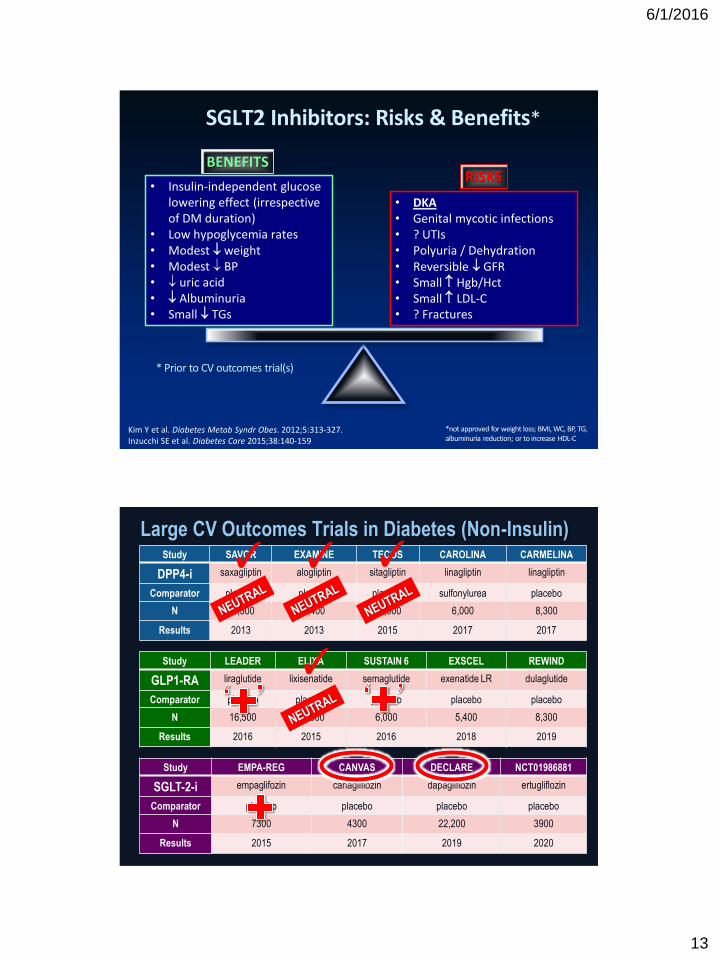
SGLT2 Inhibitors: Risks & Benefits*
Kim Y et al. Diabetes Metab Syndr Obes. 2012;5:313-327. Inzucchi SE et al. Diabetes Care 2015;38:140-159
• DKA • Genital mycotic infections • ? UTIs • Polyuria / Dehydration • Reversible GFR • Small Hgb/Hct • Small LDL-C • ? Fractures
• Insulin-independent glucose lowering effect (irrespective of DM duration)
• Low hypoglycemia rates • Modest weight • Modest BP • uric acid • Albuminuria • Small TGs
BENEFITS RISKS
*not approved for weight loss; BMI, WC, BP, TG, albuminuria reduction; or to increase HDL-C
* Prior to CV outcomes trial(s)
Study SAVOR EXAMINE TECOS CAROLINA CARMELINA
DPP4-i saxagliptin alogliptin sitagliptin linagliptin linagliptin
Comparator placebo placebo placebo sulfonylurea placebo
N 16,500 5,400 14,000 6,000 8,300
Results 2013 2013 2015 2017 2017
Study LEADER ELIXA SUSTAIN 6 EXSCEL REWIND
GLP1-RA liraglutide lixisenatide semaglutide exenatide LR dulaglutide
Comparator placebo placebo placebo placebo placebo
N 16,500 14,000 6,000 5,400 8,300
Results 2016 2015 2016 2018 2019
Study EMPA-REG CANVAS DECLARE NCT01986881
SGLT-2-i empaglifozin canagliflozin dapagliflozin ertugliflozin
Comparator placebo placebo placebo placebo
N 7300 4300 22,200 3900
Results 2015 2017 2019 2020
Large CV Outcomes Trials in Diabetes (Non-Insulin)
✓
✓ ✓ ✓
6/1/2016
14
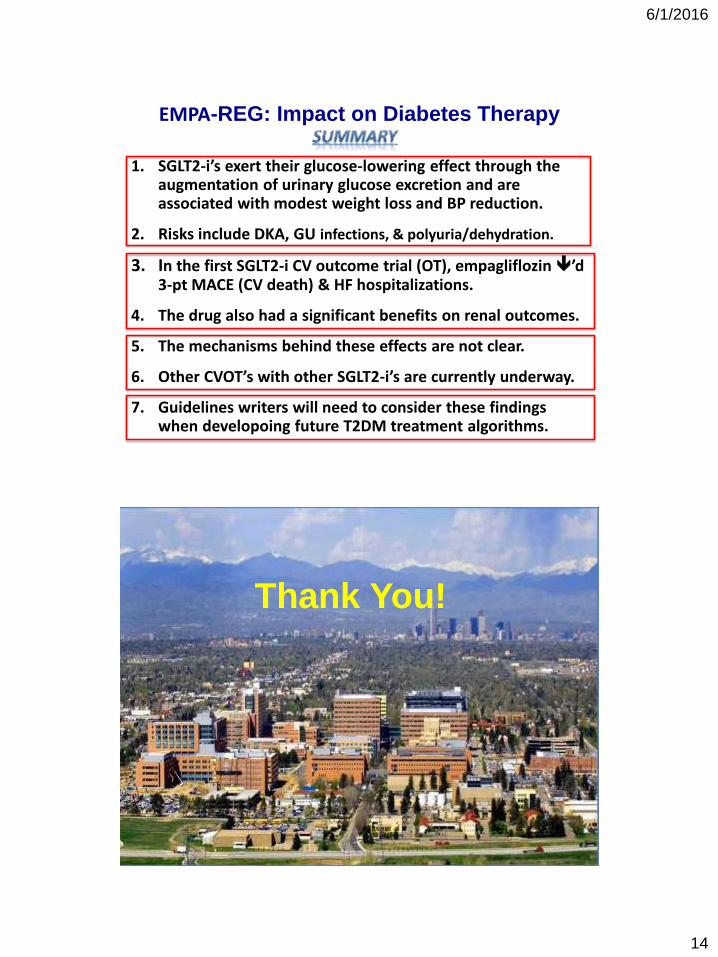
1. SGLT2-i’s exert their glucose-lowering effect through the augmentation of urinary glucose excretion and are associated with modest weight loss and BP reduction.
2. Risks include DKA, GU infections, & polyuria/dehydration.
3. In the first SGLT2-i CV outcome trial (OT), empagliflozin ’d 3-pt MACE (CV death) & HF hospitalizations.
4. The drug also had a significant benefits on renal outcomes.
5. The mechanisms behind these effects are not clear.
6. Other CVOT’s with other SGLT2-i’s are currently underway.
7. Guidelines writers will need to consider these findings when developoing future T2DM treatment algorithms.
EMPA-REG: Impact on Diabetes Therapy
Thank You!

6/1/2016
15