Embed Size (px)
Citation preview
l^^%^P^^A1^i IlMÄÄ
iäfflnw
BöE' i^^KI
«Hi
IN
Ü
a«aaiiiiBMi8KiBBi i'^mffi ^filisSi
ITU rm k~«
K?
r
H&1
EPiü
mm& lip p?*«
HUP w&l NP»;;

THIS DOCUMENT IS BEST
QUALITY AVAILABLE. THE
COPY FURNISHED TO DTIC
CONTAINED A SIGNIFICANT
NUMBER OF PAGES WHICH DO
NOT REPRODUCE LEGIBLY.
PSU LEPS 96/09
I. FINAL TECHNICAL REPORT
AFOSR GRANT F49620-94-1-0223 April 1, 1994-March 31, 1996
Gerald A. Smith Principal Investigator
May 31, 1996
-1-

REPORT DOCUMENTATION PAGE form Approved OMB No. 0704-0788
Public renortmq burden for this collection of information is estimated to average 1 hour per response, including the time for reviewing Instructions,.searching existing da?* scurces. gathering and maintaining the data needed, and completing and reviewing the collection of information. Send comments regarding this burden estimate or any other as: ?ct ■ i shis collection of Information, including suggestions for reducing this burden, to Washington Headquarters Services, Directorate lor Information Operations and Reports, 121 J ,«i .c-'son Davis Highway Suite 1204 Arlington. VA 22202-1302, and to the OMice of Management and Budget. Paperwork Reduction Pro|eci (0704-01 SB), Washington, DC 20SOJ.
1. AGENCY USE ONLY (Leave blank) 2. REPORT DATE 3. REPORT TYPE AND DATES COVERED
FINAL REPORT 01 Apr 94 - 31 Mar 96 4. TITLE AND SUBTITLE
Storage and Transport of Antiprotons
6. AUTHOR(S) Professor Gerald Smith
7. PERFORMING ORGANIZATION NAME(S) AND ADDRESS(ES)
Laboratory for Elementary Particles Science Department of Physics Pennsylvania State University 303 Osmond Laboratory University Park, PA 16802
5. FUNDING NUMBERS
61102F 2301/DS
AFOSR-TR-96
i 9. SPONSORING /MONITORING AGENCY NAME(S) AND AODRESS(ES)
AFOSR/NE 110 Duncan Avenue Suite B115 Boiling AFB DC 20332-0001
10. SPONSORING/MONITORING AGENCY REPORT NUMBER
F49620-94-1-0223
11. SUPPLEMENTARY NOTES
12a. DISTRIBUTION/AVAILABILITY STATEMENT
APPROVED FOR PUBLIC RELEASE; DISTRIBUTION UNLIMITED
12b. DISTRIBUTION CODE
13. ABSTRACT (Maximum 200words)
The objective oftiiis research is to trap large numbers of antiprotons at CERN and transport them in a portable Penning trap to research sites where they are needed. Accomplishments to date involve the trapping of a million antiprotons, a fact or of ten more that previously achieved, cooling of the antiprotons by interaction with electrons, and retaining them in the (non portable) trap for up to one-half hour. A portable Penning trap has been designed and built and is in the final stages of testing prior to use. This trap has been "buttoned up", and external pumping to the trap has resulted in a vacuum of approximately ten-to-the-negative-eighth torr. First cool-down with nitrogen and helium is planned for the very near future, followed by electron and hydrogen stora ge tests.
WTC QTJALITT TJJSPSetH <
14. SUBJECT TERMS NUMBER OF PACES
ICE CODE
17. SECURITY CLASSIFICATION OF REPORT
UNCLASSIFIED
18. SECURITY CLASSIFICATION OF THIS PAGE
UNCLASSIFIED
19. SECURITY CLASSIFICATION j OF ABSTRACT j
UNCLASSIFIED j
LIMITATION OF ABSTRACT
NSN 7540-01-280-5500 •■d Form 298 (Re, 2-39) •j by ANSI ltd. m■■■■

II.SCIENTIFIC OBJECTIVES AND APPROACH
The objectives of this work are to trap antiprotons in large numbers and transport them to the Phillips Laboratory, Kirtland AFB, NM and deliver them to a target compressed at the SHIVA Star facility. The primary goal is demonstration of antiproton-catalyzed microfission. The approach of this experiment is outlined in three previous publications from our group, found in Appendices I-III.
III. STATUS OF EFFORT
Trapping of large numbers of antiprotons at CERN during 1994, 1995 and 1996 to date has exceeded our greatest expectations. One million antiprotons have been routinely captured, electron cooled and held for periods of up to one-half hour.
An anomalously low annihilation rate of trapped and cooled antiprotons has been observed. This result has been recently published (Phys. Lett. A214, 279 (1996)), and is found in Appendix IV. The possible implications of this are very important, e.g. at no expense to storage lifetime, portable traps may not require cryogenic surroundings, considerably lessening the cost and size of the trap.
Development of the portable trap is on schedule. The trap has been "buttoned up", and external pumping to the trap has resulted in a vacuum of approximately 10"8 torr. First cool-down with nitrogen and helium is planned for the very near future, followed by electron and hydrogen storage tests. Subject to availabililty of SHIVA Star, injection tests at SHIVA Star with antiprotons would be possible in 1997.
Implosion tests with/without targets done in 1994/5 at SHIVA Star have been very successful. A final set of tests is planned this summer, where especially sensitive components of the injection line will be tested under actual firing conditions.
IV. ACCOMPLISHMENTS/NEW FINDINGS
(a) PORTABLE ANTIPROTON TRAP
We have designed a unique, low weight and low cost trap. It is unique because for the first time permanent SmCo magnets will be used in a cold Penning trap. This system is far more robust, i.e. not vulnerable to quenches arising from mechanical forces created during moving operations, than the customary superconducting solenoid used in Penning traps. Although the on-axis field has two zeros, each symmetrically positioned around the geometrical center of the trap, our beam optics computations show that for both injection and ejection antiprotons can be efficiently transported across those zeros. This understanding was made possible by our use of the sophisticated code EGUN, acquired from the Stanford Linear Accelerator Center.
-2-

Cryogenic fluids, i.e. liquid nitrogen and helium, are used to maintain high vacuum, i.e approaching 1(T15 torr. Because the magnet requires no fluids, the volume is considerably reduced over a conventional Penning trap. The system is designed to require no fluids for at least four days, sufficient for transport over large distances using a small truck or commercial aircraft.
Renderings of the trap are shown in Figures 1 and 2. It is cylindrical in shape, 100 cm tall and 30 cm in diameter. Its weight is 70 kg, so it is readily transported by conventional methods. The cost of the cryosystem and permanent magnets were $20,000 and $10,000 respectively. We estimate the final cost of the trap at less than $60,000. The trap, fully outfitted with all required systems, will be ready for antiproton injection in the Fall.
We are pleased to note that our work has captured national and international attention. An article in the July 15, 1994 issue of Technology Review (Appendix V) briefly mentions our work. The Mutual Broadcasting System radio program "America in the Morning" featured Prof. Smith in a spot in August, 1994. The spot was taped and prepared by the American Association for the Advancement of Science. A feature article appeared in the September 17, 1994 issue of the New Scientist (Appendix VI). We were featured in an article in October, 1995 issue of Discover Magazine. The American Institute of Physics taped an interview for radio airing on Feb. 6 of this year. Finally, we have recently been taped for airing on the BBC TV programs "Future Fantastic" and "Horizons".
(b) RECORD NUMBERS OF ANTIPROTONS TRAPPED AT CERN
In 1993, in collaboration with Los Alamos National Laboratory, we trapped 720,000 antiprotons from one CERN beam spill. This was a world-record, eclipsing the previous record set by the Harvard group by roughly a factor of seven. For this work, we developed a systematic method of detecting particles in the trap (Appendix VII) .
In 1994 we routinely trapped, electron cooled and stored for up to one half-hour 1,000,000 antiprotons. We observed an anomalously low annihilation rate of low energy antiprotons in the trap. With reference to theoretical atomic physics predictions, the data suggest a lower than expected (by at least one order of magnitude) annihilation cross section with residual helium gas in the trap. Also, the annihilation rate does not exhibit the expected dependence with antiproton energy. Thus, the experiment has demonstrated that it is capable of windowing previously unseen atomic physics.
In January, 1995 the CERN management gave PS200 the green light for more than enough beam shots through 1996. They were impressed with the progress we have made, along with the expansion of the collaboration through the addition of groups from Denmark (University of Aarhus), England (University College, London), and
-3-
Japan (University of Tokyo).
(c)IMPLOSION TESTS AT SHIVA STAR
The High Energy Plasma Division (J.Degnan et al) started serious solid liner implosion tests in 1994. The first results, without a target at the center of the electrodes, were very successful and published in Physical Review Letters (Appendix VIII). Penn State physicists R.A. Lewis and G.A. Smith are co-authors on this paper.
In 1995 tests were done with copper and aluminum cylindrical targets, prototypes for antiproton microfission injection experiments to be carried out next year. Again, radiographs of the implosion (see Figure 3) were in excellent agreement with predictions from the 2D MHD codes MACH2 (PL) and CALE (Penn State). Penn State graduate student Suman Chakrabarti is responsible for the CALE simulations, and has played a major role in this activity.
(d) PREPARATIONS AT PENN STATE FOR PARTICLE INJECTION TESTS AT SHIVA STAR
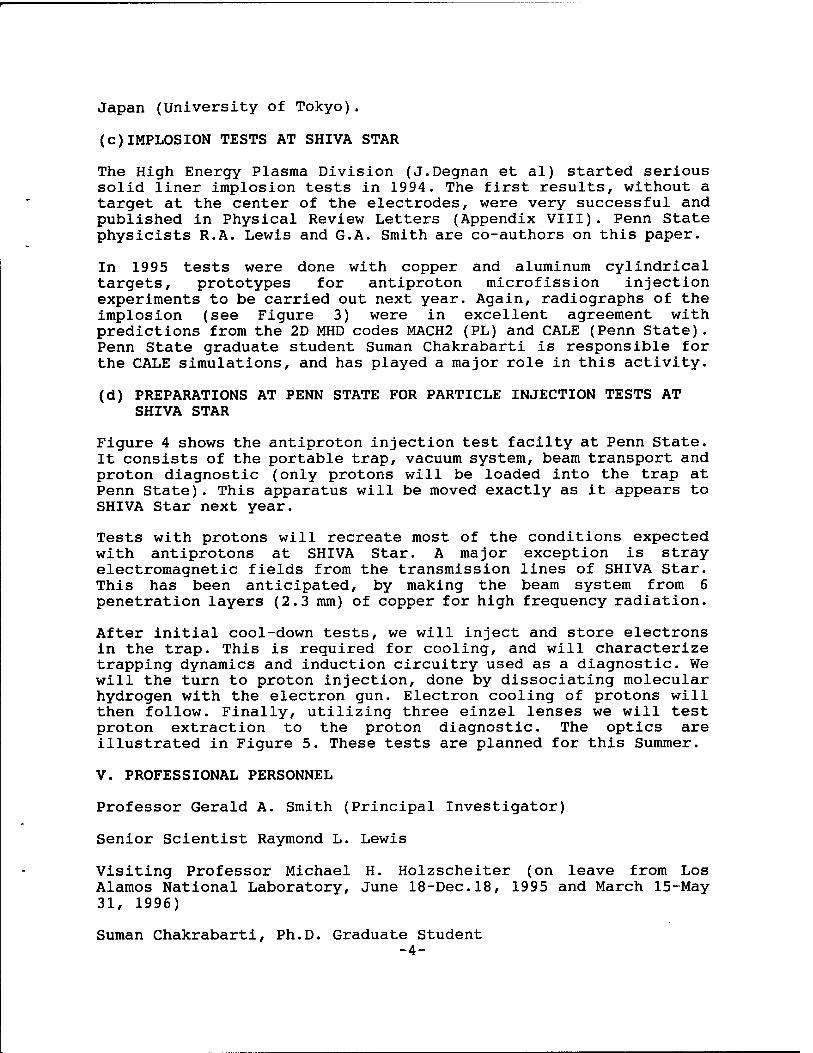
Figure 4 shows the antiproton injection test facilty at Penn State. It consists of the portable trap, vacuum system, beam transport and proton diagnostic (only protons will be loaded into the trap at Penn State). This apparatus will be moved exactly as it appears to SHIVA Star next year.
Tests with protons will recreate most of the conditions expected with antiprotons at SHIVA Star. A major exception is stray electromagnetic fields from the transmission lines of SHIVA Star. This has been anticipated, by making the beam system from 6 penetration layers (2.3 mm) of copper for high frequency radiation.
After initial cool-down tests, we will inject and store electrons in the trap. This is required for cooling, and will characterize trapping dynamics and induction circuitry used as a diagnostic. We will the turn to proton injection, done by dissociating molecular hydrogen with the electron gun. Electron cooling of protons will then follow. Finally, utilizing three einzel lenses we will test proton extraction to the proton diagnostic. The optics are illustrated in Figure 5. These tests are planned for this Summer.
V. PROFESSIONAL PERSONNEL
Professor Gerald A. Smith (Principal Investigator)
Senior Scientist Raymond L. Lewis
Visiting Professor Michael H. Holzscheiter (on leave from Los Alamos National Laboratory, June 18-Dec.l8, 1995 and March 15-May 31, 1996)
Suman Chakrabarti, Ph.D. Graduate Student -4-

VI. PUBLICATIONS
1.Target Compression by Working Fluids Driven with Solid Liner Implosions, P-R. Chiang et al, J. Appl. Phys. 76 (1994).
2.Neutron Yields for Antiproton Microfission Experiments, C. Gazze et al, Nuclear Science and Engineering, 118, 217 (1994).
3.Containment and Neutron Production by Charged Pions in Antiproton Microfission Experiments, K. Higman et al, Nuclear Science and Engineering 118, 227 (1994).
4.Are Antiprotons Forever?, M. Holzscheiter et al, Phys. Lett. A214, 279 (1996).
5.Tank Circuit Model Applied to Particles in a Penning Trap, X. Feng et al, J. Appl. Phys. 79, 8 (1996).
VII. INTERACTIONS/TRANSITIONS
(a) Participation/presentations at meetings, conferences, seminars, etc.
1. Colloquium, "Experiments with Trapped Antiprotons", Department of Physics, Brookhaven National Laboratory, February 21, 1995.
2. Seminar, "Experiments with Trapped Antiprotons", Dept. of Physics, Purdue University, April 26, 1995.
3. Seminar, "Experiments with Trapped Antiprotons", Dept. of Physics, University of Arizona, January 30, 1996.
(b) Consultative and advisory function to other laboratories and agencies, especially Air Force and other DoD laboratories.
1. IPA appointment (paid), Phillips Laboratory, Kirtland AFB, March 1- Aug.31, 1995 @ 20% of time; 24 days spent at KAFB working on antiproton microfission experiment.
2. Scientific Affiliate, Los Alamos National Laboratory, April 10, 1995-March 31, 1996; consultant on antiproton science.
(c) Transitions
Potential appliations of the portable Penning trap include (1) in situ production of rare radioisotopes for PET scanning at remote hospital sites (2) stimulation of lasing in portable weapons systems (3) portable ion source to medical accelerators for providing simultaneous, high resolution, low radiation scanning of treated areas.
-5-

VIII. NEW DISCOVERIES, INVENTIONS OR PATENT DISCLOSURES
See Appendix IX.
IX. HONORS/AWARDS
Fellow, American Physical Society
X. ADDITIONAL INFORMATION
The activities described above also benefit from support from the Jet Propulsion Laboratory (NASA). Additional graduate student support comes from the Penn State Propulsion Research Engineering Center (NASA), the National Science Foundation and the Rocketdyne Division, Rockwell International Corporation. AFOSR funding has been used to leverage significant funding from other sources.
-6-

Anti proton Trajectory \
Electrodes & Magnets
Vacuum Feedthroughs
Me Penning T i ^^
i
■if M r
Liquid Nitrogen | K
Jacket ^^Cji i wm i te
■-".'
■'•"-■:"'■'.'. ........ ; p3|3
.-■•' ' '-. ■-'-. :'• III '■'■■
Cryogen Feed Tubes
Liquid Helium Tank
Vacuum Jacket
Indium Portal
Snout
■"•— Electrical Feed I Tube
Vniis\l\;ini;i Sialc I ni\crsii\
Figure 1

ON)
o u 3 en
•H fa

CD s- U D P O
00 o U
J: a G G) O
D
-a jD B D E
ö "c a) J a x
LU
Riraili^£3^ BSplifs^^ *8|B ^^*■* *
^*%!k
~JsL M
K»i§il I -'.V
Ht^HH^ ■^IM Rl T'^ESVJ ■S&gg8f&&V;j '-■**34s5)S359i
IEK^ISP^^^^^^
to
O
CO
O
CO
CO
3 cn
•H
u
•H
LÜ 3 rr 13 13 n < n a Z n. a -> z a V) a h- u UJ _J

IT) 03 o>
M
2£
CO o •-Ö o a a
<D
>
oo o
o
I I I I I I I I I I I w c (D
0
LU
' ' I I ' ' '♦! CO m. > 6) to. rt-
--4 o' ~ >- © o
O
o o o °«OOo 0 o o oo0
(0 CD #o°000°
CD
o o o ooo »
°00(
P v\ ,oOO° N c
Lu I
00 o oo ooo '»
O Oo O Oo Ooo Ooo 8» •
i: CD
■ ■ i i i ■■■ ■ i ■ ■ i ■ l i i i i I i i i i I i i i r<
CO
o w CM
O O CM
O
O O
O in
CO in CM
CM in in d
E o
OT *X
CO
o %-• Q. O
D) C _o to CD Ü c CO
■«-• (0 b
T- O O CO CM O
■ +
O CM O CO CVJ JO
CO
o Q- O CM O
CO CD CO c CD
T- o CM Jo -1 CM I<
Ä^co
CD «^
IT)
0)
•H
oio 'snipBU
Appendix I
Target compression by working fluids driven with solid liner implosions P-R. Chiang, R. A. Lewis, and G. A. Smith Laboratory for Elementary Particle Science, Department of Physics, The Pennsylvania State University, University Park, Pennsylvania 16802
J. M. Dailey Department of Aerospace Engineering, The Pennsylvania State University, University Park, Pennsylvania 16802
S. Chakrabarti Department of Mechanical Engineering, The Pennsylvania State University, University Park, Pennsylvania 16802
K. I. Higman Department of Nuclear Engineering, The Pennsylvania State University, University Park, Pennsylvania 16802
D. Bell, J. H. Degnan, T. W. Hussey, and B. W. Mullins High Energy Plasma Division, Phillips Laboratory, Kirtland AFB, New Mexico 87117
(Received 4 October 1993; accepted for publication 25 March 1994)
Compression by a spherical solid liner of a gold target surrounded by a hydrogen plasma is simulated. Two-dimensional simulations that treat only a subset of the physics included in the one-dimensional code were performed in an attempt to assess multidimensional effects. A one-dimensional numerical code has been developed to study the effects of thermal radiation and conduction. Results of pressure, density, and energy deposited for different initial plasma conditions are presented and discussed. Results from both one- and two-dimensional codes show that the average target density at peak compression is 39-43 g/cm3, using the SHIVA Star facility at 90 kV discharge.
I. INTRODUCTION
Electromagnetically imploded solid liners have been em- ployed at some laboratories as a means of achieving high- energy densities and pressures.1"7 Solid liner implosions are essentially hollow shell z pinches8 or 0 pinches in which the mass of the liner is sufficient to prevent vaporization of the liner during the run-in phase of the implosion. At the Phillips Laboratory we are planning to use solid liner implosions to compress a hot hydrogen working fluid which will in turn compress an inner target. The advantages of a working fluid include decoupling of outer implosion nonuniformities from the central implosion and the possibility of transferring non- spherical liner energy onto a spherical target.
One application of this technology is antiproton- catalyzed microfission. Antiproton annihilations have been shown to be a strong source of neutrons9 and pions10 which, under conditions of high density, enable a significant reduc- tion in burn time and, hence, size of fissile targets. The con- cept of antiproton-catalyzed microfission1112 will be tested by compressing a small fissile target with an electromagneti- cally imploded solid liner. A subcritical test is possible at this time, with presently limited numbers of antiprotons avail- able. To simulate the compression of a solid target, a one- dimensional (ID) Lagrangian hydrodynamics with radiation code, HYDRAD,
13 has been developed. A two-dimensional
(2D) magnetohydrodynamics (MHD) code, C-language arbi- trary Lagrangian Eulerian (CALE),
14 is used in order to assess
multidimensional effects. Since thermal radiation and con- duction are not available in this version of CALE, ID calcu-
lations with radiation and thermal conduction are performed to study their effects.
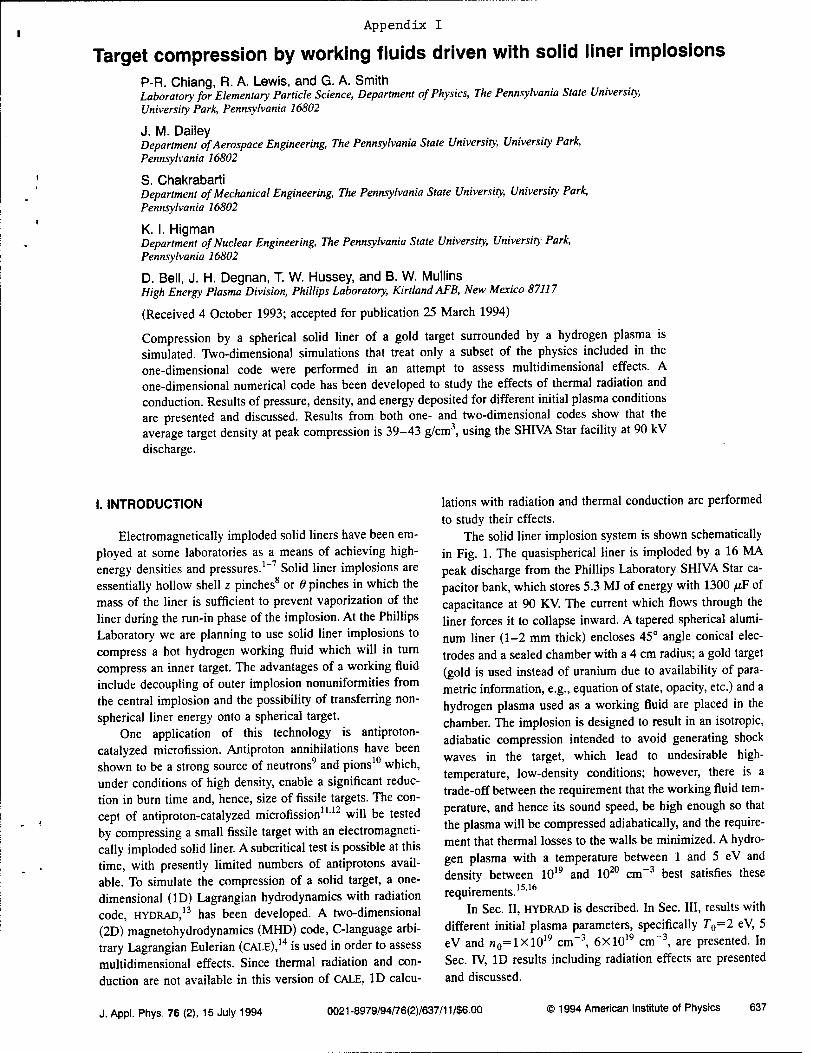
The solid liner implosion system is shown schematically in Fig. 1. The quasispherical liner is imploded by a 16 MA peak discharge from the Phillips Laboratory SHIVA Star ca- pacitor bank, which stores 5.3 MJ of energy with 1300 jiF of capacitance at 90 KV. The current which flows through the liner forces it to collapse inward. A tapered spherical alumi- num liner (1-2 mm thick) encloses 45° angle conical elec- trodes and a sealed chamber with a 4 cm radius; a gold target (gold is used instead of uranium due to availability of para- metric information, e.g., equation of state, opacity, etc.) and a hydrogen plasma used as a working fluid are placed in the chamber. The implosion is designed to result in an isotropic, adiabatic compression intended to avoid generating shock waves in the target, which lead to undesirable high- temperature, low-density conditions; however, there is a trade-off between the requirement that the working fluid tem- perature, and hence its sound speed, be high enough so that the plasma will be compressed adiabatically, and the require- ment that thermal losses to the walls be minimized. A hydro- gen plasma with a temperature between 1 and 5 eV and density between 1019 and 1020 cm-3 best satisfies these requirements.15,16
In Sec. II, HYDRAD is described. In Sec. Ill, results with different initial plasma parameters, specifically T0=2 eV, 5 eV and /i0=lxl019 cm-3, 6X1019 cm-3, are presented. In Sec. IV, ID results including radiation effects are presented and discussed.
J. Appl. Phys. 76 (2), 15 July 1994 0021 -8979/94/76(2)/637/11/$6.00 © 1994 American Institute of Physics 637

16.6p
L = 29nH Tapered Aluminum Liner
FIG. 1. Schematic of spherical solid liner at Shiva Star.
II. DESCRIPTION OF HYDRAD AND CALE
A.HYDRAD
1. One-dimensional hydrodynamics
The model of HYDRAD assumes spherical symmetry and fluidlike solids. The one-dimensional Euler equations in spherical geometry are
dv dr2 u . . (continuity), =0
dt dm (1)
du dp t-r —=g (momentum), dt dm
and
dE dr~ up + —. =ug-Kxh+qen
dt dm (energy).
(2)
(3)
Here, v = lip is the specific volume, u is the fluid velocity in the radial r direction, g is the external force, p is the pres- sure, £ is the internal energy, m is the mass coordinate, Kth
accounts for the rate of energy loss due to thermal radiation conduction, and qnx is the rate of change of external energy sources.
We use a radiation thermal-conduction model to calcu- late thermal radiation and conduction loss. Thermal conduc- tion due to electrons and ions is included in the calculation by using the following equations, for both plasma and me- tallic solids:
/:,„=--V.(KVD,
K=K,+ Ke+ Kr,
and
\6uLRr
(4)
(5)
(6)
where T is the temperature, cr is the Stefan-Boltzmann con- stant, LR is the Rosseland mean free length, and K, and Ke
are, respectively, the ion and electron thermal conductivities. Since a strong shock wave may be created in the solid
target due to its initial low temperature, it is necessary to use a sophisticated numerical scheme to account for large pres- sure and temperature gradients. Therefore, we adopt the piecewise parabolic method (PPM).18 The PPM scheme is an extension of Godunov's approach,19 which has: (1) a Rie- mann solver to handle wave interactions; (2) higher-order interpolation techniques; and (3) special monotonicity con- straints and discontinuity detectors. The scheme is one of the most accurate numerical methods for hydrodynamics simulations.19 The accuracy of the method is second order in time and third order in space. Instead of mixing a Lagrangian step and an Eulerian remap step, a pure Lagrangian scheme is used.
The Cranck-Nicholson scheme20 is used for solving the thermal conduction equation and the free-stream flux limiter20"22 is imposed on thermal conduction coefficients, xr
and Ke, to compensate for the diffusion approximation. The numerical model for radiation calculations in HYDRAD is similar to the model of MEDUSA,
22 except that HYDRAD uses
one temperature only.
2. Equation of state and Rosseland mean free path
To simulate solids, including the target and liner, under compression a three-term model17 is used to calculate the equation of state (EOS), namely,
(7)
and
E=Ec(v)+Ej(v,T)+ETe{v,T),
I
P=Pc(v) + Pj(v,T) + PTe(v,T), (8)
where Ec(v) and Pc(v) are, respectively, the energy and pressure of the cold isotherms, and subscripts i and e, re- spectively, indicate the thermal contributions from ions and
638 J. Appl. Phys., Vol. 76, No. 2, 15 July 1994 Chiang et al.
Inner radius jC\ £1 2 = 4 cm ^«^^ \\ u 3 i/> «3
^r ^ \\ outer radius o. ^r -,.. \ \ =4.15 cm o as
S3
es
number of Lagrangian cells
target region
12
plasma region
FIG. 2. Schematic of system geometry in one-dimensional simulation of compression.
electrons. Thermal contributions from ions and electrons are expressed in analytical forms.17 The cold isotherms are gen- erated from the SESAME EOS library,23 and have been fit by a polynomial function to improve computation speed. The ad- vantage of using this three-term model is that the tempera- ture can be analytically computed without interpolation. The EOS model is reasonably accurate up to 1=20 eV.
With relatively low initial temperature compared to the temperature required for full ionization, the hydrogen gas is not fully ionized throughout the compression cycle. We therefore use the Saha equation24 to calculate the EOS for the hydrogen plasma. Although the Saha equation may not be appropriate for hydrogen beyond solid density, the model is well justified since the Fermi energy is much smaller than the thermal energy.
We use power-law approximations based on the SESAME opacity library for calculating the Rosseland mean free path in the solids, i.e.,
LR=ApaTß, (9)
TABLE I. Initial plasma conditions for simulations. All cases have a 27 g gold target at the center, and the liner and target are initially at room tem- perature.
Case Density Temperature (eV) Pressure (bar)
A 1019cm-;,(1.67xl(r5gW) B 1019cm"3(l-67xl0-5g/cm3) C 6xl010cnr3(lxl(r4g/<:m3)
D 6X10,9cnr3(lxl(r4g/cm3)
2 71 5 161 2 256 5 952
B
1
> <
12
10 -
4 -
1 ' 1 , i .
A 1-D simulations o 2-D simulations
:
A
A A D
& B
$
200 400 600 800 1000
0 200 400 600 800 1000
i ■
2.5
A
-
2
D A '■
1.5
1
D
A
D
A "
0.5
D :
200 400 600 800
Initial plasma pressure (bar)
1000
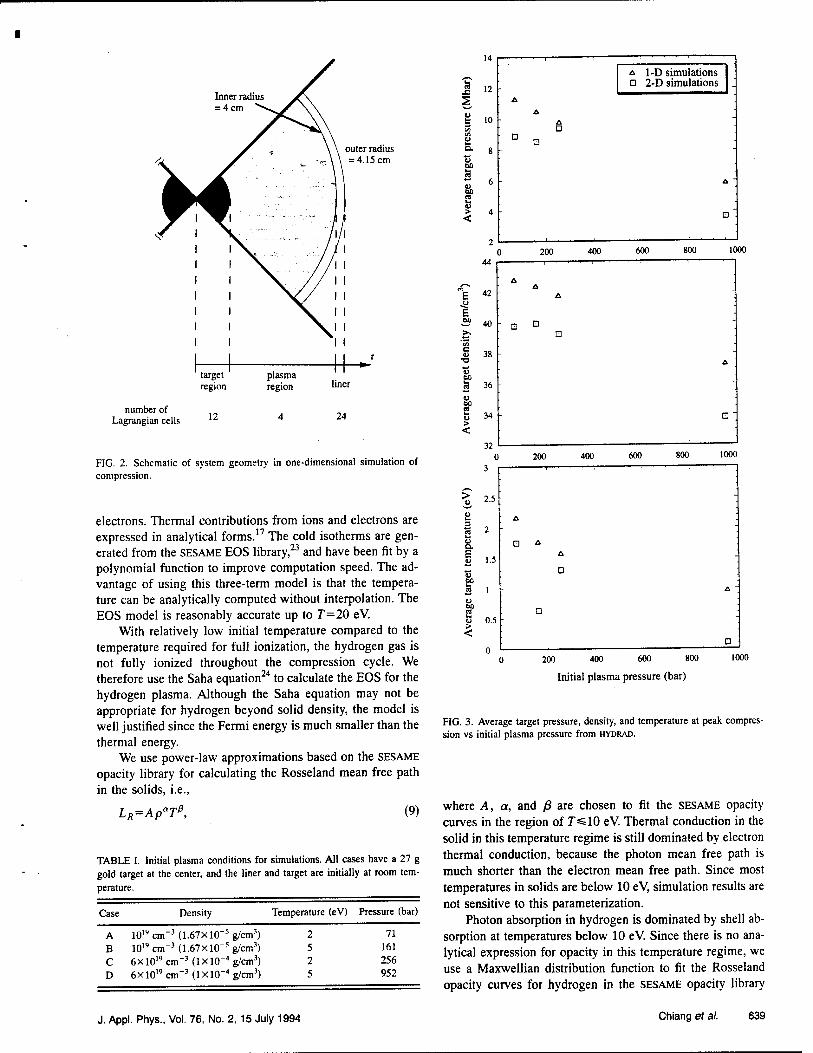
FIG. 3. Average target pressure, density, and temperature at peak compres- sion vs initial plasma pressure from HYDRAD.
where A, a, and ß are chosen to fit the SESAME opacity curves in the region of 7« 10 eV. Thermal conduction in the solid in this temperature regime is still dominated by electron thermal conduction, because the photon mean free path is much shorter than the electron mean free path. Since most temperatures in solids are below 10 eV, simulation results are not sensitive to this parameterization.
Photon absorption in hydrogen is dominated by shell ab- sorption at temperatures below 10 eV. Since there is no ana- lytical expression for opacity in this temperature regime, we use a Maxwellian distribution function to fit the Rosseland opacity curves for hydrogen in the SESAME opacity library
J. Appl. Phys., Vol. 76, No. 2, 15 July 1994 Chiang et al. 639

Case A CaseC
.& i ' U 1.4 1.6 1.8'"2
CaseB
r(cm)
~z (cm)
0 Ö 0.2(1.4 0^6 Ö.8 1 i.2 1.4 1.6 1.8 2
CaseD
Plasma d.s' i ' ili,L4''l,6,',,i'"8 "i
Contour Density (gm/cnV) 0 8.0 1 16.0 2 24.0 3 32.0 4 40.0 5 48.0 6 56.0 7 64.0 8 72.0 9 80.0
FIG. 4. System geometries and density contours in the target at peak compression for cases A-D (see Table I) from CALE.
for temperatures under 20 eV. Above 20 eV we use bremsstrahlung17 absorption cross sections to calculate the opacity.
3. Pressure due to magnetic field
The system circuit for a solid liner compression can be schematically expressed as a simple RLC circuit shown in Fig. 1. The resistance R is considered to be constant through- out the compression cycle. If the liner inductance is constant in time, the current can be analytically expressed as
A2+B2
I(t) = CV0 ■,-Al
B sin Bt, (10)
where V0 is the initial voltage of the capacitor bank,
R
~2L and B =
1 R* 2 \ 1/2
LC 4L' (11)
However, since L is a function of the liner position, the cir- cuit equation is coupled with the equation of motion. We have adjusted R,L,C from their initial values to compensate for the time-varying inductance in the system. The following parameters for a cylindrical implosion experiment6 have been used in this calculation: R<**1 mfi, C = 1300 /xF, I «30 nH (combined inductance of circuit and liner).
The diffusion time scale for the magnetic field in the liner is
640 J. Appl. Phys., Vol. 76, No. 2, 15 July 1994 Chiang et al.

10
a °
2 u 6
- Target Plasma ft -
JK -
7 v
0.8 1.2
Radius (cm)
9 10 11
Time (usec)
FIG. 5. Radial profiles of pressure, density, and temperature at different FIG. 6. Time history of average pressure, density, and temperature in the times close to the peak compression from HYDRAD for case A. target from HYDRAD without radiation for case A.
i-ß=0-i/iiAr2 (12)
From CALE, the average liner temperature at peak compres- sion is less than 1 eV. Using O£ = 107 Ü"1 m-1 for the con- ductivity at J=0.6 eV, /u.i=47rXlO-7 Hin-1 for the mag- netic permeability of the liner, and Ar = l mm for the liner thickness, from Eq. (12) the diffusion time scale is 50 /ts, which is relatively long compared to the compression time (13 /AS). This estimate agrees with the CALE result which shows that 10 /JS is required for the current to diffuse across 1/4 of the liner thickness. Therefore, it is reasonable to ap- proximate the spatial current distribution in the liner with a surface current.
J. Appl. Phys., Vol. 76, No. 2, 15 July 1994
The magnetic pressure due to a surface current through the liner is nonuniform along the polar angle direction for the spherical compression, and can be expressed as
where
BA=; /V
(13)
(14) 2vr, sin 6
is the azimuthal component of the magnetic field, / is the time-varying current running through the liner, r, is the ra- dial position of the liner outer surface, 6 is the polar angle
Chiang et al. 641

TABLE II. Plasma conditions at peak compression from HYDRAD without TABLE III. Plasma conditions at peak compression from CALE.
radiation.
Case Plasma pressure
(Mbar) Plasma temperature
(eV) Plasma density
Plasma pressure (Mbar)
Plasma temperature (eV)
Plasma density (gm/cnr1)
(gm/cm3)
Case A B C D
3.7 2.7 2.4 1.4
220 350
76 128
0.009
A B C
3.32 3.11 2.91 2.17
138 263
57 110
0.0125 0.006 13 0.0266 0.0102
0.0040 0.0332 0.0057
D
measured around the electrode symmetry axis z, and /XQ is the magnetic permeability in vacuum. Since HYDRAD is a one-dimensional code, it can only compute a single value for the magnetic pressure. To account for the tapered liner thick- ness, HYDRAD uses an average thickness for the liner. The average magnetic pressure is
P„=1.247 B <t>o 2^0
where
B*=
B. CALE
2Trr;
(15)
(16)
The version of CALE used for the simulation has the following features: 2D MHD calculation in Eulerian coordi- nates or Lagrangian coordinates; elastic properties of mate- rials; Saha equation for the equation of state and conductivity of hydrogen; polynomial function input for the EOS of sol- ids; frictionless contact between liner and electrode; and no thermal radiation or conduction in the system.
A fully Eulerian calculation is chosen for the simulations in order to correctly treat details at complicated boundaries.
The conductivities of the aluminum and gold are param- etrized by a four-phase model. The solid,, liquid, and vapor conductivities are parametrized as a power-law dependence on temperature and density. The plasma conductivity is cal- culated using the Thomas-Fermi ionization state, rather than the Saha ionization, since the plasma states of interest are nearly degenerate.
Parameters for the EOS for the solids were taken from Ref. 14, while the EOS from the SESAME library was used to obtain parameters appropriate for the higher pressures en- countered in the gold target. The strength properties of the metals is based on the Steinberg-Guinan model.
where r0 is the initial position of the outer liner surface, rp is the radius of the liner outer surface at peak compression, and em = Tr/4 is the electrode angle. Since most of the displace- ment Ar occurs at the time when /(f) is close to the maxi- mum, Eq. (17) can be written as
AL^ax(MJ)~1.8XlO-3(r0-'>)/rnax(MA). (18)
where 7max is the maximum value of I(t). Equation (18) shows the fundamental limitation on the efficiency for en- ergy conversion. For example, using r0=4.15 cm, rp«1.5 cm, and /max=16 MA (90 kV discharge), the maximum en- ergy available for compression is 1.2 MJ. From Eq. (18), the efficiency for energy conversion is 22% (1.2/5.3), which agrees with the prediction from CALE (19%).
III. RESULTS OF SIMULATIONS
The geometry used in HYDRAD simulations is schemati- cally shown in Fig. 2. The total number of Lagrangian cells is 40. The region containing the liner, working fluid, and target is divided into a continuous 15 (in z)Xl00 (in r) Eu- lerian grid in CALE. A fine grid (15 polar sectors, 13 radii) is used to describe the target to facilitate the subsequent simu- lation of nuclear reactions. Except for the center of the target, all cells are quadrilaterals. A typical run requires ««0.5 h for HYDRAD without radiation, and =15 h for CALE in central processor unit (CPU) time on a DECstation 3100.
Initial conditions for four cases simulated are listed in Table I. In this section, we show results of both ID (HYDRAD) and 2D (CALE) simulations.
A. Without radiation
Since the liner is tapered (see Fig. 1), we take the aver- age thickness of 1.5 mm as the initial thickness of the liner. This leads to a ID liner mass of 59 g, as compared to the actual mass of 51 g used by CALE. Figure 1 shows that the liner and the plasma occupy an angle of TT/2 rad in the 6
C. Limit of energy deposition
The fraction of the 5.3 MJ of stored energy which is available for compression is of crucial importance for the microfission experiment. Art upper limit to the amount of energy which can be converted to compression is obtained from the work-energy relation,
AU Jr0 J r0
■2 In tan 6m\ Hoi2«)
AIT dr,
TABLE IV. Energy distribution in the system at peak compression from HYDRAD without radiation.
Case A Case B Case C Case D
(17)
Internal energy in target Internal energy in plasma Internal energy in liner Kinetic energy in target Kinetic energy in plasma Kinetic energy in liner Total energy
290 kJ 124 kJ 780 kJ 3kJ =0.04 J 51 kJ
248 kJ 238 kJ 709 kJ 3kJ 0.2 J 56 kJ
222 kJ 306 kJ 657 kJ 2kJ 24 J 66 kJ
121 kJ 597 kJ 399 kJ lkJ 9J 100 kJ
1.25 MJ 1.25 MJ 1.25 MJ 1.22 MJ
642 J. Appl. Phys., Vol. 76, No. 2, 15 July 1994 Chiang et al.

TABLE V. Energy distribution in the system at peak compression from CALE.
Case A CaseB Case C Case D
Internal energy in target" 221 kJ 192 kJ 206 Id 89 kJ Internal energy in plasma 114 kJ 243 kJ 149 kJ 368 kJ
Internal energy in liner3 616 kJ 486 kJ 591 kJ 358 kJ
Kinetic energy in target 13 kJ 2kJ 11 kJ 1 kJ
Kinetic energy in plasma 2J 3 J 11 J 300 J
Kinetic energy in liner 38 kJ 35 kJ 50 kJ 79 Id
Total energy 1002 kJ 958 kJ 1017 kJ 895 kJ
aThe energy of degenerate electrons has been estimated by using the cold- temperature EOS from the TFC model and included in the internal energy.
direction, whereas the target subtends an angle of TT rad. The target, which subtends an angle from 7r/4 to 377/4 in Fig. 2, contains 71% of the full target volume. Therefore, the target radius is increased by a factor of 1.12 to simulate a target of the same mass. The target in all HYDRAD simulations has a mass of 27 g and a radius of 0.783 cm.
Figure 3 shows target pressure, density, and temperature, spatially averaged at peak compression, as a function of the initial plasma pressure from HYDRAD and CALE simulations. The average target densities from HYDRAD simulations range from 38 to 43 g/cm3, while from CALE simulations the den- sities range from 34 to 40 g/cm3, as the initial pressure ranges from 71 bar (case A) to 952 bar (case D). At initial plasma pressures below 256 bar (case C), the average target density at peak compression is almost constant («42 g/cm3) from ID, and =39 g/cm3 from 2D. With the initial pressure at 952 bar (case D), the target density is 8% less than in cases A-C. These results clearly show an inverse correlation be- tween density and initial plasma pressure; however, there is a trade-off for increasing the liner momentum, i.e., a greater liner momentum may create a stronger shock wave in the target, which may increase thermal energy at the expense of compression energy, leading to lower target density.
Average target densities from CALE at peak compression are consistently lower than from HYDRAD by 3-4 g/cm3.
8 -•■
a.
45
40
E 35
1 an 30 -
o 25 Q
20
..,....,. ■i , i i i | i i i i | i i i i i i i i . |
Target | Plasma
_ .. 1 :
. • ■ ■
. < ■
/ : / -
jj t i . . . i . ■ • • ' r-^-XT , , i , , , .
10 11 12 13 14
( 2
1.5
7 8 9 10 il 12 13 \t
'■' 1 ' ' , i | i i . . i . .
^ > 1 u o J
3
S. 0.5 ../ - E /
0
-O 5
/
. . i . . . . i . , ..!.... 9 10 11 12
Time ((isec)
13 14
TABLE VI. Comparison between HYDRAD and CALE for case A.
Parameters
Initial plasma conditions Target Initial target radius Maximum current Peak compression time
Plasma P at peak Plasma T at peak
Maximum target P at peak Maximum target p at peak Maximum target T at peak Average target P at peak Average target p at peak Average target T at peak
Average liner p at peak Average liner T at peak
HYDRAD CALE
2 eV, lX10l9cnT3 2eV, 1X10 27gAu 27gAu 0.783 cm 0.682 cm «=16 MA = 16 MA 12.81 fis 12.99 /xs
«=3.3 Mbar =3.6 Mbar = 135 eV =221 eV
«=34 Mbar = 147 Mbar =60 g/cm3 =94 g/cm3
=4.8 eV = 11.8 eV = 11.3 Mbar = 10 Mbar =43 g/cm3 =40 g/cm3
=2.2 eV = 1.7 eV
=6.0 g/cm3 =4.2 g/cm3
=0.3 eV <1 eV
FIG. 7. Time history of average pressure, density, and temperature in the target from CALE without radiation for case A.
This density difference may be attributed to nonuniform compression in the 2D simulation. Because of the cylindrical symmetry of the liner, the radial compression wave con- verges earlier at the equator (z=0) than the axial compres- sion wave at the axis (r=0). The compression of the target in CALE is more nearly cylindrical than spherical. This also ex- plains why the target at peak compression appears prolate (as will be seen in Fig. 4). Therefore, the compression wave in CALE is less focused than in HYDRAD, giving rise to smaller average target densities.
Two-dimensional density profiles at peak compression from CALE are shown in Fig. 4. As seen, the lower the initial plasma pressure, the closer the liner gets to the target. This is especially true in cases B, C, and D. The bubbles seen in B,
J. Appl. Phys., Vol. 76, No. 2, 15 July 1994 Chiang et al. 643

C, and D in the plasma near the equator are most likely caused by the local imbalance of plasma and magnetic pres- sure, less likely by an instability. The magnetic pressure is not uniform along the 6 direction and is lowest at the equator (z=0), as Eq. (14) shows. The plasma pressure, which is nearly uniform, exceeds the magnetic pressure earlier in time at the equator than for regions closer to the pole. A bubble is developed as the net force near the equator pushes outward. In case D, a large bubble has been formed in the liner due to early development of high pressure in the plasma. As seen by the contour lines, higher initial plasma pressure results in more nearly adiabatic and uniform target compression. The density gradients for case D are much smaller than those for cases A, B, and C and the contours are more spherical than cylindrical. Referring back to Fig. 3, the target temperature for case D is low, indicating that target compression is more nearly adiabatic.
The CALE simulation indicates that some interesting physics is occurring as the liner flows past the 45° electrode corner. The following information is provided by CALE: time, 9.5 /its; speed of liner near electrode, 0.8 cm//«, speed of sound in liner, 0.7 cm//is, temperature of liner, 1.1 eV for r<0.8 cm, 0.17 eV for r>0.8 cm; and pressure in the liner, 320 kbar for r<0.8 cm and 220 kbar for r>0.8 cm.
The liner gets very hot as it moves past the electrode corner. The speed indicated above suggests that a separation between the liner and electrode might occur; however, no indication of this separation is observed in CALE, possibly because the region of possible separation is small compared to the grid size of 0.6 cm (radial) by 0.3 cm (axial) in this area. Radiographs from the recent experiment at SHIVA Star confirm that the liner is in contact with the electrode at this point.
One-dimensional shock wave motion in the target can be seen in Fig. 5, which shows radial profiles of pressure, den- sity, and temperature at different times close to peak com- pression for case A. Initially, the magnitude of the shock pressure in the target is approximately 5 Mbar, about the same as the plasma pressure. The momentum of the target surface compresses the target interior, until the pressure gets up to 35 Mbar at the center and rebounds. Time histories of the average target pressure, density, and temperature from HYDRAD for case A are shown in Fig. 6. The compression process takes about 1 fis, and the dwell time for which the average target density is above 35 gm/cm3 is about 700 ns.
The plasma pressure at peak compression from HYDRAD ranges from 2.17 to 3.32 Mbar as shown in Table II. The temperature reaches above 100 eV for cases A and B; brems- strahlung radiation from these hot dense plasmas may have significant influence on compression. For instance, the pre- heating of the target surface may reduce shock wave com- pression in the target. On the other hand, loss of plasma pressure at early times may increase maximum liner momen- tum, thus causing a high plasma pressure at peak compres- sion. These two competing mechanisms can affect compres- sion in either way.
Table III shows plasma conditions at peak compression from CALE. Plasma pressures are 2-4 Mbar, which are close to HYDRAD values; However, the CALE temperatures are
13
s
S 6
> <
B
1 60
£
<
- X A
X
1
£ without radiation x with radiation
:
- A X
A -
- x '.
- A "
-
'
-
600 800 1000
0 200 400 « x) 800 m
i —,—,—,—.—.—i—i —-t ' ^^ ■
> 4>
X X . ?1 -
U 3
k-
8. E u
2
A x X
V A E" 1 -i IS ' u Ml a u 1 A > <
200 400 600 800
Initial plasma pressure (bar) 1000
FIG. 8. Average target pressure, density, and temperature at peak compres- sion vs initial plasma pressure from HYDRAD with and without radiation.
about 1.2-1.5 times higher than those of HYDRAD. Since thermal conduction is not included in either calculation, this behavior suggests that viscous heating in the CALE plasma is quite significant.
The distribution of energy at peak compression from HYDRAD for all cases is shown in Table IV. The internal energy in solids is defined as the sum of (1) degenerate elec- tron energy (compression energy), (2) ionization energy, and (3) ion thermal energy. The total energy deposited in the system is «1.2 MJ and is consistent with Eq. (18). The target energy is =20% of the total energy deposition. Most of the energy is deposited in the liner, and about 30%-50% of the total energy is in solids in the form of thermal energy. Energy of «100-200 kJ is deposited in the target as degenerate
644 J. Appl. Phys., Vol. 76, No. 2, 15 July 1994 Chiang et al.

s 3.5 -
3 -
!T 2.5 -
——
X x
& without radiation x with radiation ■
A
* X
A X
A
0 200 400 600 SO0 10(
0.12 '
,-. 0.1 - X X -
£ •a £ 0.08 00
- :
•S 0.06 c u
•a
- X X
| 0.04 - - en
SÜ 0.02
A A
A
> .
.
.
1
.
.
200 400 600 800 1000
300
250 >
a 2oo
g. 150
E loo «
50
X X
200 400 600 800
Initial plasma pressure (bar)
1000
FIG. 9. Average plasma pressure, density, and temperature at peak compres- sion vs initial plasma pressure from HYDRAD with and without radiation.
electron energy which is the energy accounted for by com- pression; therefore, about 4c"c of the capacitor energy is de- livered into the target in the form of compression work.
For comparison, the energy distribution in each compo- nent from CALE for case A is shown in Table V. The total energy input is around 1 MJ, and =20% of the total energy input is deposited in the target. Again, this result agrees with HYDRAD.
Table VI lists HYDRAD and CALE results for case A (2 eV, 1X1019 cm-3 initial plasma conditions.) The time at peak compression is about 13 /*s for both cases. CALE has a higher local pressure and density, although the average target pres- sure and density are higher in HYDRAD. The highest pressure in the CALE simulation usually occurs on the z axis, i.e., the
J. Appl. Phys., Vol. 76, No. 2, 15 July 1994
center of the compression. The CALE higher local quantities in Table VI may be due to the smaller radial grid size at the axis, which reveals more detailed structure of local quanti- ties. Therefore, the CALE local pressure appears higher than that of HYDRAD. Time histories of average pressure, density, and temperature from CALE for case A are shown in Fig. 7. The dwell time for the average target density above 35 gm/cm3 is about 500 nsec and comparable with HYDRAD.
B. With radiation
Spatially averaged target quantities with radiation at peak compression from HYDRAD are shown in Fig. 8. For comparison, results without radiation from HYDRAD are also shown. The average target density increases as the initial plasma pressure decreases, which is similar to the trend seen without radiation. Therefore, a lower initial plasma pressure is more desirable.
The temperature in the target is generally higher with radiation than without radiation, as is the pressure. Target densities are lower in cases A-C and higher in D with radia- tion than without radiation. This shows that the role of radia- tion is complex. As discussed earlier, there are two compet- ing mechanisms: (1) preheating of the target surface; and (2) loss of pressure in the hydrogen plasma, affecting target compression. These two mechanisms may lead to changes in target density, in either positive or negative directions. The effect of preheating depends more upon thermal conduction inside the target, while pressure loss depends more upon heat transfer at the boundary surface of the plasma. As the radia- tion loss in the plasma increases and thermal conduction in- side the target remains unchanged, effects from pressure loss in the plasma will dominate over effects from preheating. Since the pressure loss leads to increased momentum in the liner, the target density is increased at peak compression. This explains why the average target density in case D in- creases, while the others decrease due to thermal radiation.
Plasma quantities at peak target compression are shown in Fig. 9. As seen, plasma temperatures in all cases are sig- nificantly lower with than without radiation. Correspond- ingly, plasma densities are higher with radiation than without radiation as a result of resisting the inward motion of the liner. Plasma densities in some cases are higher than solid density; however, since the Fermi energy at densities of «=0.1 g/cm3 is around 5 eV, which is smaller than the plasma tem- perature (=20 eV), use of the Saha equation is well justified.
Figure 10 shows the time history of average target pres- sure, density and temperature for case A. The histories are similar to results without radiation, despite significant differ- ences in plasma properties when radiation is included. The dwell time for average target density above 35 g/cm" is around 700 ns. Because of radiation loss, the liner speed is faster with than without radiation. Peak compression times in all four cases are earlier by tens of nanoseconds due to ra- diation. Note that the target temperature is increased by about 0.5-1 eV due to the radiation.
The energy distribution with radiation from HYDRAD is shown in Table VII. Comparing Table VII with Table IV, all internal energies in the target are increased to =320 kJ. The increased energy raises the target temperature, instead of in-
Chiang ef al. 645

S3
E
1 60
U > <
10 -
4 -
2 -
45
40
35
30
3 25
20
A" Target Plasma 1 1
; -
d ; irvl ■
i. v* 10 14
7 8 9 10 11 12 13 14
FIG. 10. Time history of average pressure, density, and temperature in the target from HYDRAD with radiation for case A.
creasing the target density, in cases A-C. The total energy deposited in the system is around 1.25 MJ, which is close to that without radiation.
IV. SUMMARY
In this study, the ID hydrodynamics code HYDRAD and the 2D MHD code CALE are used to simulate compression of a hydrogen working fluid and target. It is found that the ID and 2D results without radiation are comparable. The ID calculation is much less time consuming than the 2D (=»1:30 in CPU time), and includes important physics, i.e., thermal radiation, which is not available in our version of CALE. Al- though the ID model simplifies several important physics
646 J. Appl. Phys., Vol. 76, No. 2, 15 July 1994
TABLE VII. Energy distribution in the system at peak compression from HYDRAD with radiation.
Case A Case B Case C Case D
Internal energy in target Internal energy in plasma Internal energy in liner Kinetic energy in target Kinetic energy in plasma Kinetic energy in liner Total energy
344 Id 342 kJ 322 kJ 320 kJ 18 kJ 18 kJ 144 kJ 147 kJ 834 kJ 841 kJ 730 kJ 726 kJ 4kJ 4kJ 3kJ 2kJ ~0.005 J 0.02 J 0.32 J 42 J 49 kJ 46 kJ 54 kJ 63 kJ 1.25 MJ 1.25 MJ 1.25 MJ 1.26 MJ
topics, for instance, circuit coupling and current diffusion, efforts have been made to minimize differences between the ID and 2D results caused by these approximations. In the absence of a complete 2D code, HYDRAD is a very efficient and useful tool for simulating liner and target compressions.
The results are as follows: (a) The time for peak com- pression of a 27 g gold target is 12.5-13.5 /AS; (b) the dwell time for an average target density above 35 g/cm3 ranges from 500 ns (2D) to 700 ns (ID); (c) an average target den- sity (pressure) of about 40 g/cm3 (12 Mbar) and a maximum local density (pressure) of 60-100 g/cm3 (30-140 Mbar) can be achieved in the target using 5.3 MJ of energy from SHIVA star; (d) an energy of 1.2 MJ is deposited in the liner, plasma and target, including 200-350 kJ in the target; (e) radiation brings down the plasma temperature consistently to around 20 eV and increases the target temperature by about 0.5-1 eV; however, it has little influence on the average target den- sity and pressure at peak compression; and (f) to obtain a higher target density, a lower initial plasma pressure is more desirable.
ACKNOWLEDGMENTS
This work was supported in part by the Air Force Office of Scientific Research, Jet Propulsion Laboratory (NASA), National Science Foundation, Penn State Propulsion Engi- neering Research Center Grant No. NAGW-1356, no. 8, and the Rocketdyne Corporation.
1 A. E. Sherwood, E. L. Cantvel, C. A. Ekdhal, I. Henins, H. W. Hoiday, T. R. Jarboe, P. L. Klinger, R. C. Malone, J. Marshall, and G. A. Sawyer, in Megagauss Physics and Technology, edited by R J. Turchi (Plenum, New York, 1980), p. 375.
2 P. J. Turchi, A. L. Cooper, R. D. Ford, D. J. Jenkins, and R. L. Burton, in Megagauss Physics and Technology, edited by P. J. Turchi (Plenum, New York, 1985), p. 375.
3S. G. Alikhanov, V. P. Bakhtin, and D. A. Toporkov, in Ultrahigh Magnetic Fields—Physics, Techniques, Applications, edited by V. M. Totov and G. A. Shvetsov (Nauka, Moscow, 1984), p. 213.
4 A. G. Eskov, M. I. Kitayev, and R. Kh. Kurtmullayev, in Ultrahigh Mag- netic Fields—Physics, Techniques, Applications, edited by V. M. Totov and G. A. Shvetsov (Nauka, Moscow, 1984), p. 204.
5 A. A. Petrukhin, N. P. Bidlyo, S. F. Garanin, V. M. Danov, V. V. Zmushko, A. I. Kuzyaev, V. N. Mokhov, E. S. Pavlovskii, V. A. Prokopov, V. K. Chernyshev, V. A. Shvetsov, and V. B. Yakubov, in Ultrahigh Magnetic Fields—Physics, Techniques, Applications, edited by V. M. Totov and G. A. Shvetsov (Nauka, Moscow, 1984), p. 406.
6J. H. Degnan, M. L. Alme, W. L. Baker, J. S. Buff, C. B. Boyer, C. J. Clouse, S. K. Coffey, D. W. Conley, D. Dietz, J. D. Graham, S. L. Gonza- lez, K. E. Hackett, D. J. Hall, J. L. Holmes, E. A. Lopez, W. F. Mc- Cullough, D. W. Price, R. E. Reinovsky, N. F. Roderick, P. J. Turchi, and J. M. Welby, in Megagauss Technology and Pulsed Power Applications,
Chiang et al.

edited by C. M. Fowler, R. S. Caird, and E. J. Erickson (Plenum, New York, 1987), pp. 699-706.
7J. H. Degnan, W. L. Baker, J. D. Beason, C. J. Clouse, D. Dietz, D. J. Hall, J. L. Holmes, D. W. Price, and C. R. Sovinec, in Megagauss Technology and Pulsed Power Applications, edited by V. M. Titov and C. A. Shvetsov (Plenum, New York, 1990), pp. 623-630.
8N. A. Krall and A. W. Trivelpiece, Principles of Plasma Physics (McGraw-Hill, New York, 1973).
9B. Chen, T. A. Armstrong, R. A. Lewis, R. Newton, G. A. Smith, J. P. Bocquet, F. Malek, H. Nifenecker, M. Maurel, E. Monnand, P. Perrin, C. Ristori, G. Ericsson, T. Johansson, G. Tibell, M. Rey-Campagnolle, S. Polikanov, T. Krogulski, and J. Mougey, Phys. Rev. C 45, 2332 (1992).
10E. D. Minor, T. A. Armstrong, R. Bishop, V. Harris, R. A. Lewis, and G. A. Smith, Z. Phys. A 336, 461 (1990).
11R. A. Lewis, G. A. Smith, R. J. Kanzleiter, K. 1. Higman, and R. Newton, Fusion Tech. 20, 1046 (1991).
12 R. A. Lewis, R. Newton, G. A. Smith, and R. J. Kanzleiter, Nucl. Sei. Eng. 109, 411 (1991).
,3P.-R. Chiang, HYDRAD—One-Dimensional Radiative Hydrodynamics Code, Laboratory for Elementary Particle Science, The Pennsylvania State University, 1993 (unpublished).
,4CALE users manual, July 1, 1991, R. Tipton, LLNL, Mail Stop L-35, P.O. Box 808, Livermore, Los Angeles, CA 94550; Megagauss Technology and
Pulsed Power Applications, edited by C. M. Fowler, R. S. Cavid, and D. J. Erickson (Plenum, New York, 1987), p. 299.
15 F. M. Lehr, A. Alaniz. J. D. Beason, L. C. Carswell, J. H. Degnan, J. F. Crawford, S. E. Englert, T. J. Englert, J. M. Gahl, J. H. Holmes, T. W. Hussey, G. F. Kiuttu, B. W. Mullins, R. E. Peterkin, Jr., N. F. Roderick, P. J. Turchi, and J. D. Graham (unpublished).
'"F. M. Lehr, J. H. Degnan, D. Dietz, S. E. Englert, T. J. Englert, T. W. Hussey, G. F. Kiuttu, J. M. Messerschmitt, B. W. Mullins. C. A. Outten, R. E. Peterkin, Jr., N. F. Roderick, P. J. Turchi, and J. D. Graham, in 9th IEEE Pulsed Power Conference, June 6-10, 1993.
17 Ya. B. Zel'dovich and Yu. P. Raizer, Physics of Shock Waves and Tem- perature Hydrodynamic Phenomenon (Academic, New York, 1966).
18P. Collela and P. R. Woodard, J. Comp. Phys. 54, 174 (1984). "P. R. Woodard and P. Collela, J. Comp. Phys. 54, 115 (1984). 20T. Tajima, Computational Plasma Physics: With Applications to Fusion
and Astrophysics (Addison-Wesley, New York, 1989). 21N. A. Tahir and K. A. Long, Laser Part. Beams 4, 287 (1986). 22J. P. Christiansen, D. E. T. F. Ashby, and K. V. Roberts, Comp. Phys.
Commun. 7, 271 (1974). 23 S. P. Lyon and J. D. Johnson, LA-UR-92-3407, 1992. 24J. A. Bittencourt, Fundamentals of Plasma Physics (Pergamon, New
York, 1988).
J. Appl. Phys., Vol. 76, No. 2, 15 July 1994 Chiang et al. 647

Appendix II
NUCLEAR SCIENCE AND ENGINEERING: 118, 217-226 (1994)
Neutron Yields for Antiproton Microfission Experiments
Christopher E. Gazze and Richard J. Newton
The Pennsylvania State University, Department of Nuclear Engineering University Park, Pennsylvania 16802
and
Raymond A. Lewis, Pi-Ren Chiang, and Gerald A. Smith
The Pennsylvania State University, Department of Physics Laboratory for Elementary Particle Science, University Park, Pennsylvania 16802
Received November 8, 1993 Accepted July 19, 1994
Abstract- Neutrons that are produced following antiproton annihilation on uranium nuclei are trans- ported through compressed targets by the SCATTER Monte Carlo code in support of antiproton microfission experiments. The SCATTER code and necessary input data are described. Results show that the high-energy (>20 MeV) component of the source is responsible for the majority of the neu- tron yield. Results for a wide range of uniformly compressed targets are presented for moderation levels of hydrogen-to-uranium ratios of 0:1, 3:1, and 9:1 in 235U targets and 238U. Moderation is found to increase neutron yields at a given pr. Uniformly compressed unmoderated 238U targets demonstrate 9 to 16% lower yields than 23SU. Four targets under different, nonuniform compression conditions are considered. The average yield in these cases is -21.8 ± 0.2 neutrons per source antiproton, an increase of 34% over the 16.3 primary neutrons per antiproton. The average yield of the nonuniform compression cases agrees within error with uniformly compressed targets.
I. INTRODUCTION
Practical, nondestructive uses of nuclear systems are limited by the inability to safely harness the result- ing large energy yields. In microfission, these energy yields are reduced by burning as little fissile material as possible while still maintaining a net energy gain. The concept, first introduced by Askar'Yan et al.1 and Winterberg,2 involves starting a chain reaction in a small, compressed fissile target.
The use of antiprotons annihilating on the surface of fissionable nuclei has been proposed3 as the initia- tor for the chain reaction. Recent experiments4 at the Low-Energy Antiproton Ring at CERN, in Geneva, Switzerland, have demonstrated that large numbers of highly energetic neutrons are released following such annihilations. These neutrons could be used to bypass the slow, early stages of the chain reaction, increasing
the number of fissions that can occur during the conT
finement time. A Monte Carlo study was performed to examine
moderated and unmoderated neutron reactions induced by the annihilation of antiprotons in fissionable nuclei. This study was done in support of a larger effort to demonstrate the feasibility and potential applications of antiproton catalyzed microfission at the SHIVA Star facility.5 Other studies address reactions induced by pi- ons released during the annihilation of antiprotons6
and the trapping and delivery of the antiproton beam.7
The goal of the SHIVA Star experiment is to dem- onstrate that significant subcritical neutron yields can be observed under moderate levels of compression fol- lowing antiproton annihilation on fissionable targets. The SHIVA Star is a solid liner imploder capable of providing 10 to 40 Mbars of pressure to compress a small (tens of grams) uranium target. The apparatus is
217

218
Fig. 1. Schematic diagram of the SHIVA Star apparatus.
shown schematically in Fig. 1. The system operates by discharging a 5.3-MJ capacitor bank through a thin liner connecting the anode and cathode. The resulting 10-MA average current induces large inwardly directed magnetic pressures. The liner then collapses, applying pressure on the working fluid inside, which is a hydro- gen plasma. This produces a uniform pressure field in the plasma that can uniformly and adiabatically com- press the spherical target that is located in the center of the system.
The HYDRAD one-dimensional radiative La- grangian hydrodynamics code5 and the CALE two- dimensional magnetohydrodynamics code8 have been used to model the compression process in the SHIVA apparatus. The CALE finite difference code provides the time-dependent density profile during the compres- sion. The information provided by the computer codes is then used directly in the neutronics calculation. The amount of energy released from nuclear interactions is -1 erg. This has a negligible effect on the hydro- dynamics, which is driven by 5.6 MJ of stored energy in SHIVA Star. Therefore, the use of sequential and de-
coupled hydrodynamics-neutronics calculations for this application is fully justified.
II. DESCRIPTION OF NEUTRONICS
To accurately model neutron reactions initiated by antiproton annihilation, one must characterize neu- tron cross sections within an energy regime that ex- tends up to 750 MeV. Although existing data libraries focus on the energy regime below 20 MeV, our work has shown that neutrons in the higher energy regime are important.
The kinetic energy spectrum of neutrons from the antiproton annihilation is shown in Fig. 2 (Ref. 4). The spectrum extends to 747 MeV, which is the high- est kinetic energy cited in the literature for fission- related reactions in uranium. The released neutrons are distributed isotropically in the laboratory frame and total 16.3 (Ref. 4).
The SCATTER Monte Carlo code was written to study the neutronics of the SHIVA Star experiment.9
NUCLEAR SCIENCE AND ENGINEERING VOL. 118 DEC. 1994

NEUTRON YIELDS IN ANTIPROTON MICROFISSION 219
1.6
1.4
1.2
1.0
0.8
0.6
0.4
0.2
0.0
;—i—i—i—i—|—i—i—i—i—|—i—i—i—i—|—1—i—i—i—|—r-
.
J 1 O035j, ■
II 1 0.025; - \ - ■
m 0.020; I- \
1 0.015; !■ \ . W 0.010;
\ 1 0-005! - ^frii ; v T i ri
■
^i 50 150 250 SSO 450 550 6*0 750
V. _ _J -
""""X ! _j F .... i .... i __i—i—i—i—|—i—i—|—|—I—| 1—|—|_J
10 40 50
Fig. 2.
20 30
Energy (MeV)
Neutron energy spectrum resulting from antiproton annihilation in uranium.
The code requires a variety of input data. The energy spectrum of annihilation neutrons has been used to model the source. Total and partial neutron cross sec- tions have been taken from the literature (from 0 to 1000 MeV). A time-dependent density profile has been taken from CALE and applied to the model. Aniso- tropie elastic-scattering probability distributions have been used to propagate neutrons through the target. Finally, energy-dependent multiplicity data and fis- sion and other inelastic energy spectra have been ap- plied to create secondary neutrons with the appropriate energies.4'10'11
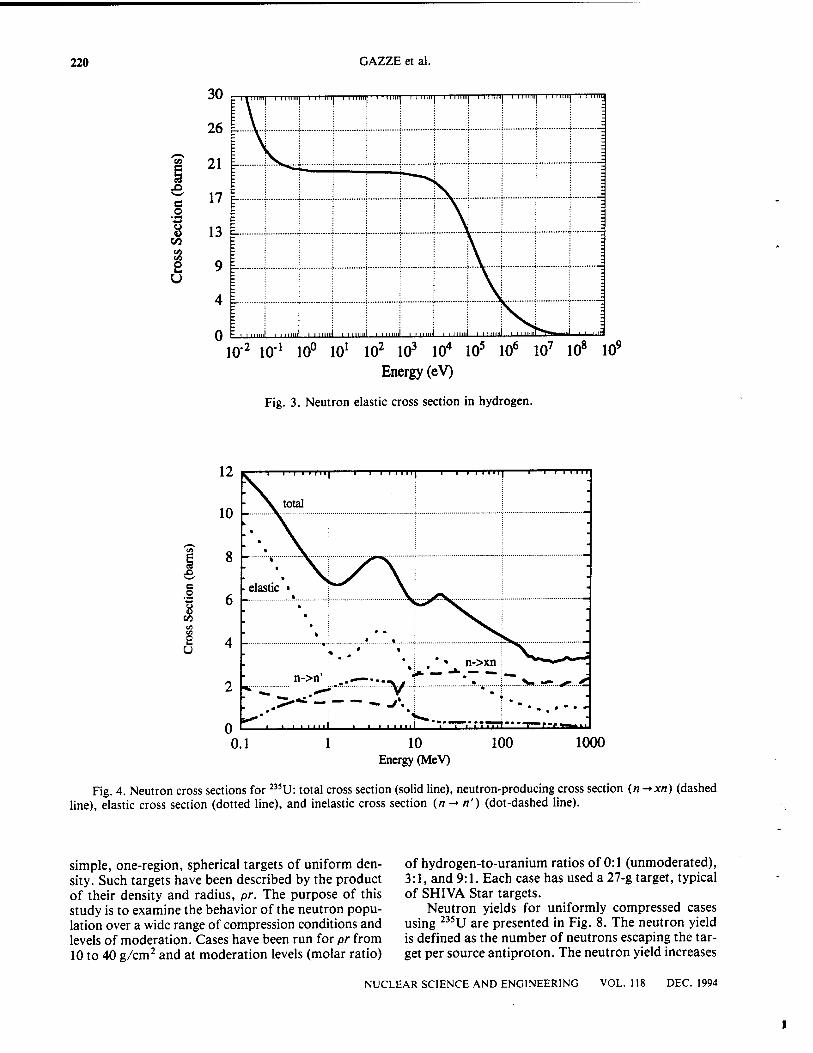
Cross sections and nuclear reaction data in the lower energy regions (below 100 MeV for hydrogen and below 20 MeV for uranium) have been taken from the ENDF/B-VI database, compiled by Brookhaven Na- tional Laboratory.12 Data for the higher energy re- gions were gathered from a variety of sources in the literature.9'13'14 High-energy cross-section data that are used by the SCATTER program are shown in Fig. 3 for hydrogen and in Figs. 4 and 5 for 235U and 238U, respectively. The neutron production cross section (n -*xn) is defined as the total cross section minus the elastic and inelastic («-►«') cross sections. Multiplic- ity data are presented in Fig. 6 for uranium. The dif- ference between 235U and 238U below 125 MeV results from the larger fission cross section in 235U.
Spectra for neutrons released from high-energy re- actions at 20 MeV (neutrons12), 155 MeV (protons11), 300 MeV (protons10), and 455 MeV (antiprotons15) are shown in Fig. 7. The 455-MeV curve is based on an en- ergy transfer measurement for antiprotons at rest. In terms of equivalent laboratory bombarding energy, the curve would likely be represented at a higher energy.
The SCATTER code has been extensively tested. Predictions for more conventional neutron experiments (i.e., those occurring below 20 MeV) have been com- pared with the results of the Monte Carlo Neutron Pho- ton (MCNP) code.16 The results produced by the two codes agree very well. To assess statistical accuracy, we calculated and studied figures of merit (FOMs) as a function of the number of case histories run. We found that the FOMs became stable after ~ 15 000 case histo- ries. Typically, 40000 case histories were compiled for each of the data points presented in this paper, giving a statistical confidence per data point in excess of 99.5%.
III. RESULTS FOR UNIFORMLY COMPRESSED TARGETS
While the most probable energy for primary neu- trons is 2 MeV (Ref. 4), the average energy of neutrons selected from the energy spectrum is just over 50 MeV. Neutron-multiplying interactions involving very high energy neutrons are important because of their high multiplicities and the high-energy secondary neutrons they can produce. The SCATTER code was run with the primary neutron spectrum (Fig. 2) terminated at 20 MeV. Results from these tests have shown that the primary neutron population above 20 MeV is respon- sible for more than half of the yield in a typical SHIVA Star target.
III.A. Uranium-235
Before analyzing targets specific to the SHIVA Star experiment, the SCATTER code was used to examine
NUCLEAR SCIENCE AND ENGINEERING VOL.118 DEC. 1994
220 GAZZE et al.
30
26
? 21
f 17 o
8 13 | I 00
p u
9 |~
4
0
TTTTtTl—I I 11 IHM—I Mllllll— Uli—I llllllll 1 I II Ulli—I Mlllll|—I Mlllllj 1 lllllllj—I I I |— U
i i il I »I 1 ' in mil i i ' I I I II Ulli I I lllllll—I I llllllP>HIIIIII I I INI»
lO"2 10"1 10° 101 102 103 104 105 106 107 108 109
Energy (eV)
Fig. 3. Neutron elastic cross section in hydrogen.
B O
C/5
t/3
S u
10 Energy (MeV)
1000
Fig. 4. Neutron cross sections for 235U: total cross section (solid line), neutron-producing cross section (n -► xn) (dashed line), elastic cross section (dotted line), and inelastic cross section (n -» «') (dot-dashed line).
simple, one-region, spherical targets of uniform den- of hydrogen-to-uranium ratios of 0:1 (unmoderated), sity. Such targets have been described by the product 3:1, and 9:1. Each case has used a 27-g target, typical of their density and radius, pr. The purpose of this of SHIVA Star targets. study is to examine the behavior of the neutron popu- Neutron yields for uniformly compressed cases lation over a wide range of compression conditions and using 235U are presented in Fig. 8. The neutron yield levels of moderation. Cases have been run for pr from is defined as the number of neutrons escaping the tar- 10 to 40 g/cm2 and at moderation levels (molar ratio) get per source antiproton. The neutron yield increases
NUCLEAR SCIENCE AND ENGINEERING VOL.118 DEC. 1994

NEUTRON YIELDS IN ANTIPROTON MICROFISSION 221
12
10
e o •ö
»3 «5
2 u n->xn
n ->n ^L
>•- , • N I. — —i —r ~ -— iJ— —i l—l l l l l ll 1 1—l *l I I l1"~1 ''lafci
0.1 10
Energy (MeV)
100 1000
Fig. 5. Neutron cross sections for 238U: total cross section (solid line), neutron-producing cross section (n->xn) (dashed line), elastic cross section (dotted line), and inelastic cross section (n-*n') (dot-dashed line).
monotonically with pr at all levels of moderation. This dependence can be expressed by a power series in pr of the form
Y = c0 + c, (pr) + c2(pr)2 + c3(pr)3 + (1)
where Y is the yield of escaping neutrons in neutrons per antiproton and c,, shown in Table I for these fits, are the coefficients of the expansion. It is evident that the effect of adding moderation is to increase yield.
Figure 9 shows how average energies of the primary neutron population depend on pr and the moderation ratio in 235U targets. The statistical accuracy of these measurements is typically 10%. For all levels of mod- eration, the average energy at which primary neutrons
escape is approximately equal to the average energy at which they are created for all values of pr. For the 0:1 and 3:1 moderated cases, the average energy of ab- sorbed neutrons is significantly higher than that of the rest of the population because of the larger neutron- production cross section (n -* xn) above 8 MeV (see Fig. 4).
In the 3:1 moderated case, the behavior of the av- erage absorption energy at low pr is the same as that observed for the unmoderated case. The effect of the hydrogen is not yet felt on the absorption average be- cause the average path length of a neutron is relatively large at small values of pr. As pr increases, however, it becomes more likely that a neutron will be absorbed
TABLE I
Coefficients for the Fitted Curves in Fig. 8
Hydrogen-to-Uranium Hydrogen-to-Uranium Hydrogen-to-Uranium Ratio of 0:1 Ratio of 3:1 Ratio of 9:1
c0 neutrons per antiproton 1.6300E+la 1.6300E+1 1.6300E+1 c, neutrons per antiproton (g/cm2) 2.1120E-1 1.7110E-1 2.1040E-1 c2 neutrons per antiproton (g2/cm4) 6.0850E-4 3.0000E-3 2.0O00E-3 c3 neutrons per antiproton (gVcm6) 0.0000E+0 0.0000E+0 O.OOOOE+0 c4 neutrons per antiproton (g4/cm8) O.00OOE+0 0.0000E+0 4.6660E-6
"Read as 1.6300 x 10"
NUCLEAR SCIENCE AND ENGINEERING VOL.118 DEC. 1994
222
c o ■a ä
c
3
250 375 500 625 750
Energy (MeV)
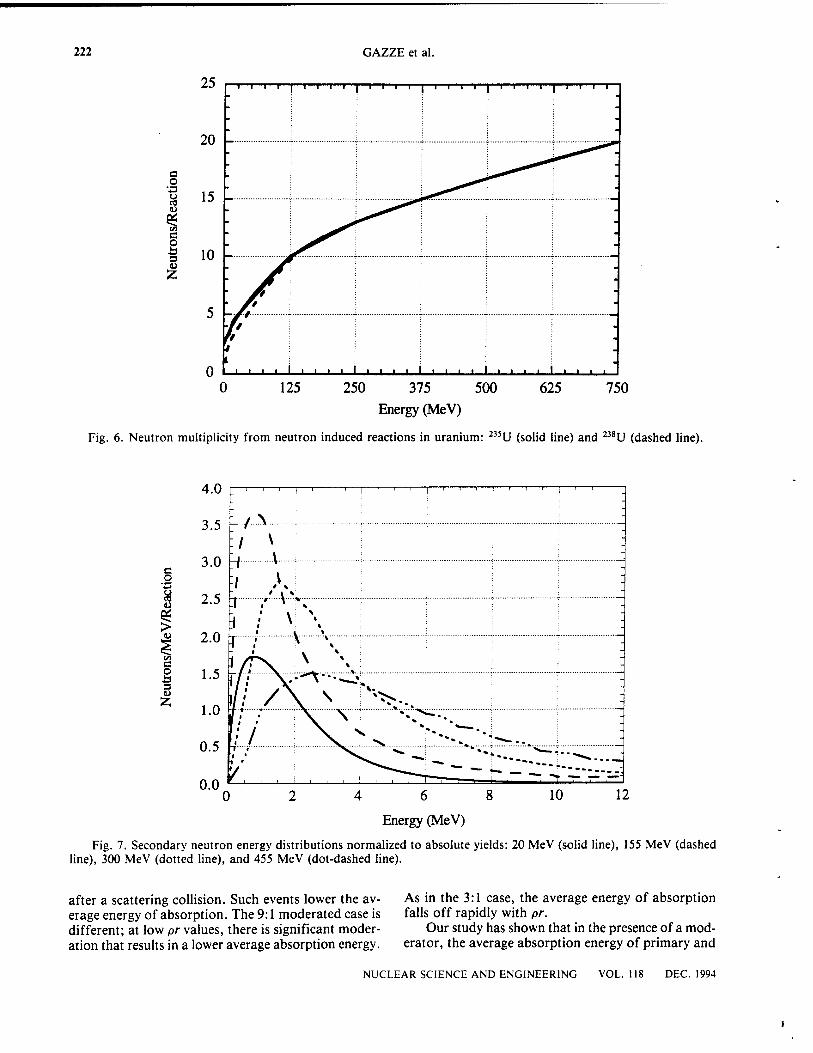
Fig. 6. Neutron multiplicity from neutron induced reactions in uranium: 235U (solid line) and 238U (dashed line).
c
1 eg >
2 3 U
2 4 6 8
Energy (MeV)
Fig. 7. Secondary neutron energy distributions normalized to absolute yields: 20 MeV (solid line), 155 MeV (dashed line), 300 MeV (dotted line), and 455 MeV (dot-dashed line).
after a scattering collision. Such events lower the av- As in the 3:1 case, the average energy of absorption erage energy of absorption. The 9:1 moderated case is falls off rapidly with pr. different; at low pr values, there is significant moder- ation that results in a lower average absorption energy.
Our study has shown that in the presence of a mod- erator, the average absorption energy of primary and
NUCLEAR SCIENCE AND ENGINEERING VOL.118 DEC. 1994
a
1
NEUTRON YIELDS IN ANTIPROTON MICROFISSION
40 i i i i i | i i i i | i i i i | i i i i | i i i i | i i '' | '■' '
223
■ I ■ ■ ■ ■ I ■ ■ ■ ■ I ■ ■ ■ ■ I ■ ■ ■ ■ I ■ ■
5 10 15 20 25 30 35 40
pr (gm/cm2)
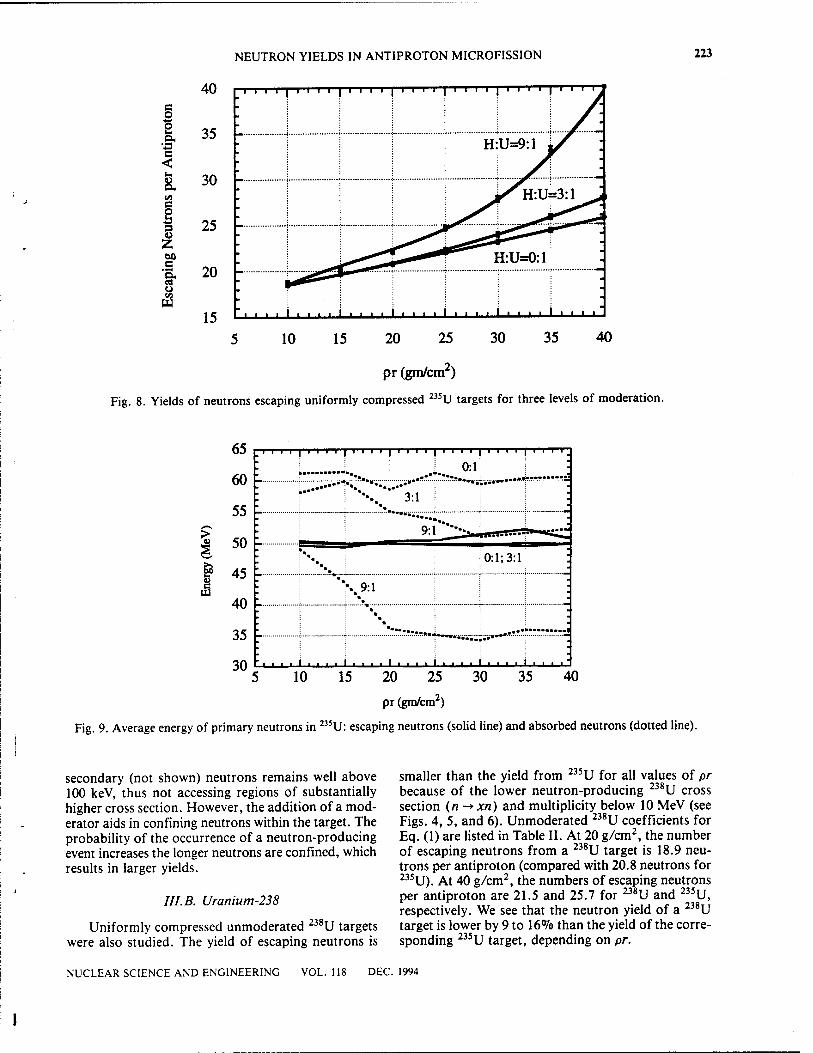
Fig. 8. Yields of neutrons escaping uniformly compressed 235U targets for three levels of moderation.
65
60
55
3 50
i i i i I i i i i I i i i i I i i i i I i i i i I i i i i I i i i i
L 1 i 0:1
3:1
9:1 **•■••.
j 0:1; 3:1
>. 9:1 45
40
35
30 ** * * * * ' * * * * ' * * * * ' * * *
»—......^
I ■ ■ ■ ■ I 5 10 15 20 25 30 35 40
pr (gm/cm2)
Fig. 9. Average energy of primary neutrons in 235U: escaping neutrons (solid line) and absorbed neutrons (dotted line).
secondary (not shown) neutrons remains well above 100 keV, thus not accessing regions of substantially higher cross section. However, the addition of a mod- erator aids in confining neutrons within the target. The probability of the occurrence of a neutron-producing event increases the longer neutrons are confined, which results in larger yields.
III.B. Uranium-238
Uniformly compressed unmoderated 238U targets were also studied. The yield of escaping neutrons is
smaller than the yield from 235U for all values of pr because of the lower neutron-producing 238U cross section (n ->xn) and multiplicity below 10 MeV (see Figs. 4, 5, and 6). Unmoderated 238U coefficients for Eq. (1) are listed in Table II. At 20 g/cm2, the number of escaping neutrons from a 238U target is 18.9 neu- trons per antiproton (compared with 20.8 neutrons for 235U). At 40 g/cm2, the numbers of escaping neutrons per antiproton are 21.5 and 25.7 for 238U and 235U, respectively. We see that the neutron yield of a 238U target is lower by 9 to 16% than the yield of the corre- sponding 235U target, depending on pr.
NUCLEAR SCIENCE AND ENGINEERING VOL.118 DEC. 1994
224 GAZZE et al.
TABLE II
Coefficients for the 238U Escaped-Neutron Yield
Hydrogen-to-Uranium Ratio of 0:1
c0 neutron per antiproton Cj neutron per antiproton (g/cm2) c2 neutrons per antiproton (g2/cm4) c3 neutrons per antiproton (gVcm6)
1.6300E+1" 1.3030E-1 O.OOOOE+0 0.0000E+0
"Read as 1.6300 x 10'.
As in the case of 235U, the addition of a modera- tor to the 238U targets could improve the yield of es- caping neutrons. The effect of moderation has been shown to improve confinement and not to significantly degrade the neutron energy distribution. Using the yields from the 235U targets as a representative case, at 40 g/cm2, one can expect an increase in the yields from 238U targets between 8% (hydrogen-to-uranium ratio of 3:1) and 50% (hydrogen-to-uranium ratio of 9:1).
IV. EXPECTED YIELDS FROM THE SHIVA STAR EXPERIMENT
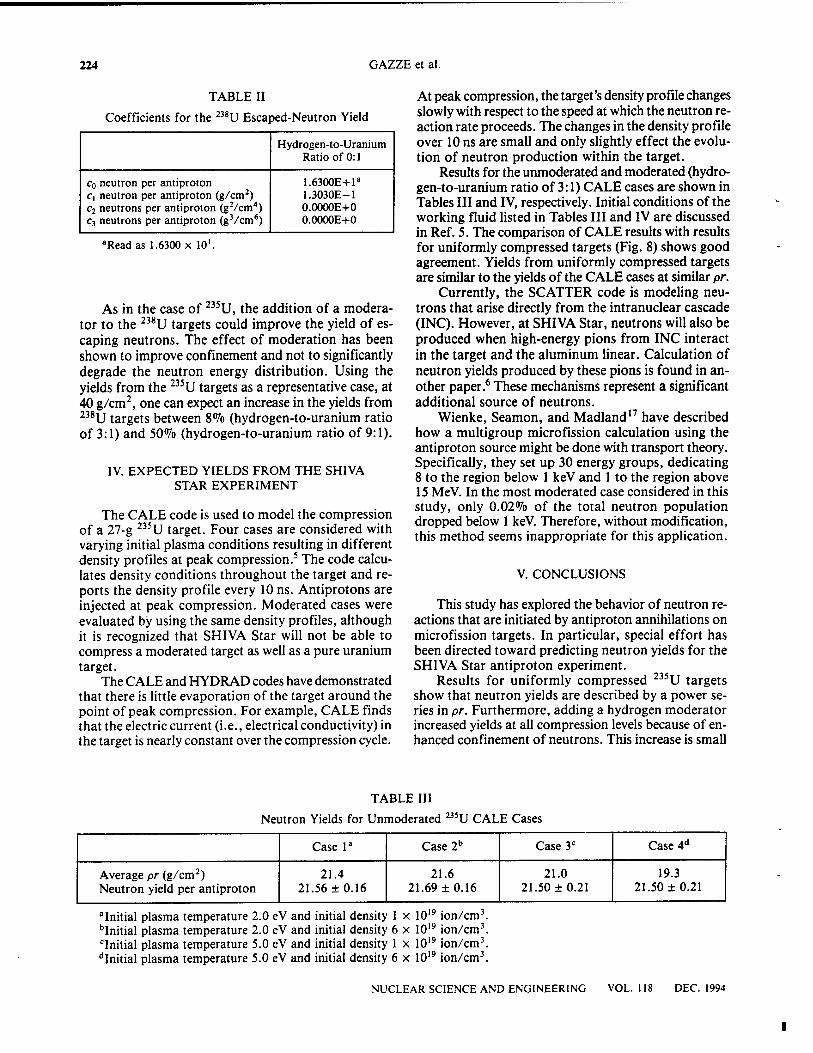
The CALE code is used to model the compression of a 27-g 235U target. Four cases are considered with varying initial plasma conditions resulting in different density profiles at peak compression.5 The code calcu- lates density conditions throughout the target and re- ports the density profile every 10 ns. Antiprotons are injected at peak compression. Moderated cases were evaluated by using the same density profiles, although it is recognized that SHIVA Star will not be able to compress a moderated target as well as a pure uranium target.
The CALE and HYDRAD codes have demonstrated that there is little evaporation of the target around the point of peak compression. For example, CALE finds that the electric current (i.e., electrical conductivity) in the target is nearly constant over the compression cycle.
At peak compression, the target's density profile changes slowly with respect to the speed at which the neutron re- action rate proceeds. The changes in the density profile over 10 ns are small and only slightly effect the evolu- tion of neutron production within the target.
Results for the unmoderated and moderated (hydro- gen-to-uranium ratio of 3:1) CALE cases are shown in Tables III and IV, respectively. Initial conditions of the working fluid listed in Tables III and IV are discussed in Ref. 5. The comparison of CALE results with results for uniformly compressed targets (Fig. 8) shows good agreement. Yields from uniformly compressed targets are similar to the yields of the CALE cases at similar pr.
Currently, the SCATTER code is modeling neu- trons that arise directly from the intranuclear cascade (INC). However, at SHIVA Star, neutrons will also be produced when high-energy pions from INC interact in the target and the aluminum linear. Calculation of neutron yields produced by these pions is found in an- other paper.6 These mechanisms represent a significant additional source of neutrons.
Wienke, Seamon, and Madland17 have described how a multigroup microfission calculation using the antiproton source might be done with transport theory. Specifically, they set up 30 energy groups, dedicating 8 to the region below 1 keV and 1 to the region above 15 MeV. In the most moderated case considered in this study, only 0.02% of the total neutron population dropped below 1 keV. Therefore, without modification, this method seems inappropriate for this application.
V. CONCLUSIONS
This study has explored the behavior of neutron re- actions that are initiated by antiproton annihilations on microfission targets. In particular, special effort has been directed toward predicting neutron yields for the SHIVA Star antiproton experiment.
Results for uniformly compressed 235U targets show that neutron yields are described by a power se- ries in pr. Furthermore, adding a hydrogen moderator increased yields at all compression levels because of en- hanced confinement of neutrons. This increase is small
TABLE III
Neutron Yields for Unmoderated 235U CALE Cases
Case la Case 2b Case 3C Case 4d
Average pr (g/cm2) Neutron yield per antiproton
21.4 21.56 + 0.16
21.6 21.69 ±0.16
21.0 21.50 ±0.21
19.3 21.50 ±0.21
"Initial plasma temperature 2.0 eV and initial density 1 x 10¹⁹ ion/cm3. bInitial plasma temperature 2.0 eV and initial density 6 x 10" ion/cm3, initial plasma temperature 5.0 eV and initial density 1 x 10¹⁹ ion/cm3. dInitial plasma temperature 5.0 eV and initial density 6 x 10¹⁹ ion/cm3.
NUCLEAR SCIENCE AND ENGINEERING VOL.118 DEC. 1994

NEUTRON YIELDS IN ANTIPROTON MICROFISSION 225
TABLE IV
Neutron Yields for Moderated (Hydrogen-to-Uranium Ratio of 3:1) 235U CALE Cases
Case la Case 2b Case 3C Case 4d
Average pr (g/cm2) Neutron yield per antiproton
21.4 21.71 ±0.21
21.6 21.87 ±0.16
21.0 21.72 ±0.21
19.3 21.92 ±0.21
"Initial plasma temperature 2.0 eV and initial density 1 x 10¹⁹ ion/cm3. bInitial plasma temperature 2.0 eV and initial density 6 x 10¹⁹ ion/cm3. 'Initial plasma temperature 5.0 eV and initial density 1 x 10¹⁹ ion/cm3. dInitial plasma temperature 5.0 eV and initial density 6 x 10¹⁹ ion/cm3.
at low pr but increases with higher pr. Studies of aver- age energy and interaction profiles for primary and sec- ondary neutron populations indicate that the effect of moderation is to confine the neutrons in the target, rather than degrading them into regions of higher cross section.
Modeling of unmoderated 238U targets has demon- strated 9 to 16% lower yields of escaping neutrons than yields from 235U targets. The yield of escaping neu- trons from moderated 238U targets are expected to in- crease analogously with the yields from the moderated 235U targets.
Four SHIVA Star moderated (hydrogen-to-uranium ratios of 3:1) and unmoderated 235U targets with dif- fering initial plasma density and temperature conditions were evaluated. Results for the cases, which had aver- age pr values of -21 g/cm2, differ only slightly. The SCATTER code predicts an average yield per antipro- ton for these targets of 21.8 ± 0.2, which is in good agreement with uniformly compressed cases of simi- lar pr.
ACKNOWLEDGMENT
This work was supported in part by the U.S. Air Force Office of Scientific Research and Jet Propulsion Laboratory (National Aeronautics and Space Administration).
also "Micro-Fission Explosions and Controlled Release of Thermonuclear Energy," Nature, 241, 449 (1973).
3. R. A. LEWIS, R. NEWTON, G. A. SMITH, and R. J. KANZLEITER, "Antiproton-Boosted Microfission," Nucl. Sei. Eng., 109, 411 (1991); see also R. A. LEWIS, G. A. SMITH, R. J. KANZLEITER, K. HIGMAN, and R. NEW- TON, "Antiproton Boosted Microfission,"Fusion Techno!., 20, 1046 (1991).
4. B. CHEN et al., "Neutron Yields and Angular Distri- butions Produced in Antiproton Annihilation at Rest in Ura- nium," Phys. Rev., C45, 2332 (1992).
5. P.-R. CHIANG et al., "Target Compression by Work- ing Fluids Driven with Solid Liner Implosions," J. Appl. Phys., 76, 2, 15 (July 1994).
6. K. I. HIGMAN, R. J. NEWTON, R. A. LEWIS, P.-R. CHIANG, and G. A. SMITH, "Containment and Neutron Production by Charged Pions in Antiproton Microfission Experiments," Nucl. Sei. Eng., 118, 227 (1994).
7. G. A. SMITH, "Applications of Trapped Antiprotons," Hyperfine Interact., 81, 189 (1993).
8. R. TIPTON, CALE Users' Manual, Lawrence Liver- more National Laboratory (July 1991); see also Megagauss Technology and Pulsed Power Applications, p. 299, C. M. FOWLER, R. S. CAVID, and D. J. ERICKSON, Eds., Ple- num Press, New York (1987).
REFERENCES
1. G. A. ASKAR'YAN et al., "Supercompression of Mat- ter by Reaction Pressure to Obtain Microcritical Masses of Fissioning Matter, to Obtain Ultrastrong Magnetic Fields, and to Accelerate Particles," JETPLett., 17, 424 (1973).
2. F. WINTERBERG, "The Possibility of Micro-Fission Chain-Reactions and Their Application to the Controlled Release of Thermonuclear Energy," Z. NATURFORSCH, 28a, 900 (1973); see also "The Possibility of Microfission Ex- plosions by Laser or Relativistic Electron-Beam High Den- sity Compression," Lett. Nuovo Cimento, 6, 407 (1973); see
9. C. E. GAZZE, "Neutron Yields for the SHIVA Star Antiproton Microfission Experiment," MS Thesis, The Pennsylvania State University (1993).
10. F. S. ALSMILLER, R. G. ALSMILLER, Jr., T. A. GABRIEL, R. A. LILLIE, and J. BARISH, "A Phenom- enological Model for Particle Production from the Collisions of Nucleons and Pions with Fissile Elements at Medium En- ergies," Nucl. Sei. Eng., 79, 147 (1981).
U.E. CHEIFITZ et al., "Measurement of the Prompt Neu- trons Emitted in the Fission of Bi209 and U238 Induced by 155-MeV Protons," Phys. Rev. C, 2, 256 (1970).
NUCLEAR SCIENCE AND ENGINEERING VOL.118 DEC. 1994
226 GAZZE et al.
12. "ENDF-102 Data Formats and Procedures for the Eval- uated Nuclear Data File ENDF-6," BNL-NCS-44945, Brook- haven National Laboratory (1990).
13. J. FRANZ et al., "Total Neutron-Nucleus Cross Sections at Intermediate Energies," Nucl. Phys., A490, 667 (1988).
14. W. SCHIMMERLING et al., "Neutron-Nucleus Total and Inelastic Cross Sections: 900 to 2600 MeV/c," Phys. Rev. C, 7, 248 (1973).
15. E. D. MINOR et al., "Charged Pion Spectra and Energy Transfer Following Antiproton Annihilation at Rest in Car- bon and Uranium," Z. Phys. A, 336, 461 (1990).
16. "CCC-200/MCNP, Version 3A Code," Oak Ridge Na- tional Laboratory (1986).
17. B. R. WIENKE, R. E. SEAMON, and D. G. MAD- LAND, "Multigroup Antiproton Transport and Fission," Nucl. Sei. Eng., 113, 86 (1993).
NUCLEAR SCIENCE AND ENGINEERING VOL.118 DEC. 1994
Appendix III
NUCLEAR SCIENCE AND ENGINEERING: 118, 227-234 (1994)
Containment and Neutron Production by Charged Pions
in Antiproton Microfission Experiments
Kumiko I. Higman and Richard J. Newton
The Pennsylvania State University, Department of Nuclear Engineering University Park, Pennsylvania 16802
and
Raymond A. Lewis, Pi-Ren Chiang, and Gerald A. Smith
The Pennsylvania State University, Department of Physics Laboratory for Elementary Particle Science, University Park, Pennsylvania 16802
Received November 8, 1993 Accepted August 5, 1994
Abstract—Containment and interaction of charged pions in a solid linear implosion system are simu- lated. Pions are generated from annihilation of antiprotons at the surface of a compressed target. A three-dimensional Monte Carlo code has been developed to simulate the interaction of charged pions with the system. Neutron yields are presented for several 27-g uranium targets compressed under dif- ferent initial plasma conditions. Effects on neutron yields from the diffused magnetic field and density profiles at peak compression are discussed. Results show that the magnetic field at peak compression significantly increases overall neutron yields.
I. INTRODUCTION
Antiproton annihilation has been shown to be a strong source of neutrons1 and charged pions.2 Under conditions of high density, the neutrons, and neutrons produced by charged pions, enable a significant reduc- tion in the burn time and, hence, size of fissile targets. The concept of antiproton microfission will be tested by compressing a small fissile target with an electro- magnetically imploded solid liner.3 A subcritical test is possible at this time by using the currently limited num- bers of antiprotons available. The experiment employs hydrogen plasma as a working fluid to compress the target and will be conducted at the SHIVA Star facil- ity, located at the Phillips Laboratory, Kirtland Air Force Base, New Mexico. The solid liner implosion sys- tem is suitable because of its relatively high efficiency of energy conversion and capability of compressing high-Z materials.
Pions from antiproton annihilation have a mass of about one-seventh of a nucleon mass and are produced in three charge states. On the average, 1.48 ir~, 1.36 7T°, and 0.99 ir+ are produced per annihilation in ura-
nium, with an average kinetic energy of 232 MeV/pion. The 7T° 's decay into two gamma rays with a lifetime of 8.4 x 10~17 s and contribute little to secondary inter- actions. The 26-ns lifetime of charged pions is long compared with the 1 to 2 ns required for a pion to es- cape or stop in the target. The -K~ can stop in nuclear targets and produce secondary interactions at rest, whereas ir+ can interact only in flight because of their repulsion from positively charged nuclei.
In the absence of pion interactions, the experiment will yield an =20% increase in neutrons relative to the primary source1 of neutrons 16.3. The actual neutron yield will consist of primary neutrons and secondary neutrons induced by antiprotons, plus neutrons created by charged pions. Since path lengths for charged pions are increased because of the magnetic field diffused around the target, neutron multiplicities from charged pions are expected to be enhanced.
The PICALE three-dimensional Monte Carlo code has been developed to simulate containment and inter- actions of charged pions in the apparatus at peak com- pression.4 The PICALE code is described in Sec. II. Results obtained from PICALE for different initial
227

228 HIGMAN et al.
plasma conditions in SHIVA Star are presented, and effects on neutron yields from magnetic field and den- sity profiles at peak compression are discussed in Sec. III. Results are summarized in Sec. IV.
II. PION-CONTAINMENT MODEL
H.A. Simulation ofPion Motion and Interactions
The PICALE code tracks the motion of charged pions in a magnetic field and simulates interactions of pions with the target (uranium) and aluminum liner (see Fig. 1) using the Monte Carlo method. Given the initial position and momentum of a pion born on the upper surface of the target, the code updates the pion's position at every time step by integrating the equa- tions of motion. Magnetic field and density profiles in the simulations are calculated by the CALE two- dimensional magnetohydrodynamics code.5 Because the time scale (= 1 to 2 ns) for pion interactions is much shorter than the dwell time3 («400 ns) of peak com- pression, the magnetic field and density are assumed to be constant throughout the simulations. The Lorentz force due to the magnetic field is 240 MeV/cm, three orders of magnitude larger than the force due to the electric field (=90 keV/cm). Therefore, effects on pion
Antiprotons
Working Fluid
motion from both the static electric field and that induced by the time-dependent magnetic field are neglected.
Because most of a pion's path length occurs at momenta above 100 MeV/c (Ref. 2), charged pions are assumed to lose energy at a constant rate of 1.09 MeV/g-cm2 because of collisions with atomic elec- trons.6 Interactions of pions with a nucleus include elastic scattering, inelastic scattering, and absorption. Elastic scattering at high energies shows strong forward diffraction scattering, and energy loss is assumed neg- ligible in collisions with nuclei.
In an inelastic scattering, a pion may undergo charge- exchange. However, experiments7,8 show that the frac- tion of charge-exchange in the total reaction cross section is small (< 1 %). The inelastic scattering angle and energy distributions of charged pions on nuclei are assumed to be uniform in the center-of-mass and laboratory frames, respectively.7,8
The energy range of measured neutron yields and cross sections from pions is limited to low momenta.7"9
Since the momentum cutoff of pion spectra from anti- proton annihilation is 1000 MeV/c (Ref. 2), it is neces- sary to further model neutron yields and cross sections due to pions up to this energy.
II.B. Energy-Dependent Neutron Yields
Figure 2 shows neutron yields versus energy depos- ited in uranium and aluminum nuclei for different pro- jectiles. The solid curve is a characterization of the yield in uranium, drawn through points at 455 MeV (antipro- tons at rest2), 140 MeV (TT~ at rest10), and 20 to 50 MeV (protons in flight11). Based on the smooth energy de- pendence, we conclude that neutron yields do not de- pend on the incident particle but rather on the amount of energy deposited into a nucleus. Production of neu- trons in uranium can be induced by absorption and in- elastic scattering of charged pions, and two mechanisms are treated separately in the simulation.
Because of lack of data, neutron yields for alumi- num are scaled from uranium. A correlation between the average number of ejectiles from annihilation of an antiproton and the atomic mass number of the target is 12
NeJeclccA0M
Fig. 1. Schematic of spherical solid liner implosion sys- tem with working fluid shown at peak compression.
(1)
We assume that the number of emitted neutrons is proportional to Nejec„ and energy-dependent neutron yields for aluminum are scaled from those for uranium. As seen in Fig. 2, data from Madey et al.13 are consis- tent with the scaled curve for aluminum (dotted curve).
II.C. Energy-Dependent Cross Sections
Cross sections from Ashery et al.8 for absorption and inelastic scattering of IT
+ and ir"" in aluminum are used. Although data for uranium are not available, those for bismuth can be used to infer cross sections for
NUCLEAR SCIENCE AND ENGINEERING VOL.118 DEC. 1994

CHARGED PIONS IN ANTIPROTON MICROFISSION 229
2
3 U Z
200 400 600 800 1000 Energy Deposited into the Nucleus (MeV)
Fig. 2. Neutron yields versus energy deposited into the nucleus for uranium (solid curve) and aluminum (dashed curve). Data are taken from Refs. 2 (solid circle), 10 (solid square), 12 (open circles), and 13 (solid triangle).
uranium. Absorption and inelastic scattering cross sec- tions for uranium can be scaled by using8
<xAQ» (2)
where qm(E) is an energy-dependent exponent, A is the target atomic mass, and the subscript m indicates the reaction, i.e., absorption, inelastic scattering, etc.
The exponents qm(E) of ir+ for various types of interactions and the effective number Ne/f of nucleons participating in the process are obtained from Ashery et al.8 For ir~, data for qm{E) are available14 only at 125 and 165 MeV and are not sufficient to establish scaling. Therefore, the same qm(E) for ir+ is used for TT~ as an approximation. Equation (2) is used, and cross sections for uranium are scaled as
°m,u(E) = om<Bi(E) 238 209
Qm(E)
(3)
Cross sections for interactions between charged pi- ons and uranium at energies above 315 MeV are not available in the literature; however, they can be reason- ably inferred from data from other projectiles. Reac- tion cross sections for uranium with proton incident energies15 up to 3 GeV, total and reaction cross sec- tions for uranium and aluminum with neutron incident energies16 of 0.9 to 2.6 GeV, and total cross sections for uranium and aluminum at intermediate incident neutron energies17 (160 to 575 MeV) are used to infer cross sections for charged pions.
For an opaque nucleus, the geometric limit, 2irR2, for the total cross section, is the sum of cross sections due to absorption and diffractive processes, and both cross sections approach the geometric limit asymptot- ically.17 Therefore, it is reasonable to assume that both
absorption and inelastic scattering cross sections are ap- proximately constant at high energies. Both the reac- tion and absorption cross sections of x+ and -K ~ for uranium and aluminum for energies above 400 MeV are interpolated between data at energies below 315 MeV and values at higher energies.
To model absorption cross sections at low energies, we used data obtained by Navon et al.18 at 50 MeV. The data do not include uranium and aluminum. How- ever, a correlation between absorption cross sections and atomic mass number at 50 MeV is given, and cross sections for uranium and aluminum are deduced by using this correlation.
For cross sections at energies below 50 MeV, the fol- lowing features19 are included:
1. The absorption cross section of 7r~ increases to infinity as the pion energy approaches zero.
2. The absorption cross section of ir+ drops to zero at ~20 MeV for uranium and 4 MeV for alu- minum, energies required to penetrate the Coulomb barrier.
3. The inelastic scattering cross sections of ir+ and 7T~ become very small at low energies and rapidly drop to zero at a threshold value.
Gathering together all of the measurements and features discussed earlier, energy-dependent cross sec- tions for TT~ and ir + interactions with uranium and aluminum nuclei are shown in Figs. 3 and 4 (for ura- nium) and Figs. 5 and 6 (for aluminum), respectively. Because these cross sections are model-dependent gen- eralizations of several experiments over a wide range of energies, both statistical and systematic errors must be considered.
1 ■■ "i—r-T—r—r r- | ' ' ■ ■ | ■
I
8 i : y»v \ ■
X) . s»^
\ c o 6 i •\ ,
o «J •\ in .
4 \\ - o u. •• \ ■
U * 2
"-■-,
— — — — s
0 100 200 300 400
Kinetic Energy (MeV) 500
Fig. 3. Energy-dependent neutron producing cross sec- tions for ir~ interactions with uranium: inelastic (dashed curve) and absorption (dot-dashed curve).
NUCLEAR SCIENCE AND ENGINEERING VOL.118 DEC. 1994

230 HIGMAN et al.
10 ,—
Kinetic Energy (MeV)
Fig. 4. Energy-dependent neutron producing cross sec- tions for 7r+ interactions with uranium: inelastic (dashed curve) and absorption (dot-dashed curve).
XI
c _o o u
W5 O u u
1
0.8
0.6
0.4
0.2
0
—i—r—T—T—T—r—r—r-
\
/ /
/ /.•■'
i; 1.1. i—i > i 111.11 * * * ■ ■ ■ ■ * ■ ■
0 100 200 300 400
Kinetic Energy (MeV) 500
Fig. 6. Energy-dependent neutron producing cross sec- tions for 7r+ interactions with aluminum: inelastic (dashed curve) and absorption (dot-dashed curve).
c o o 0)
C/5
o U
0.8
0.6
0.4 -
0.2
Y ■' r"-T r-'- '*-■—' i i i i i i i i i i i i i i i
'- \\ - '. \
. '•. \ - ' — ^
\ \
1—i—,—,—i—I—,—,—,—,—L_J—, i , i i , , , i , , , ,_J
100 200 300 400
Kinetic Energy (MeV)
500
Fig. 5. Energy-dependent neutron producing cross sec- tions for ir~ interactions with aluminum: inelastic (dashed curve) and absorption (dot-dashed curve).
For the inelastic cross sections given, only one set of experimental data with small statistical errors (a few percent) was available. The errors are dominated by systematics related to the validity of the energy-scaling model employed, which we estimate to be -10% at any energy.
For the absorption cross sections given, up to four different sets of experimental data were used, which exhibited individual statistical and systematic errors among themselves of typically a few percent and 20%, respectively. When combined with estimated model- dependent errors (10%), we estimate overall errors at any energy to be -25%.
III. RESULTS AND DISCUSSION
III. A. Effects of Magnetic Field and Density Profile
The preferred direction of antiproton injection is opposite to the direction of current (see Fig. 1). This preference results from the charge asymmetry and rel- ative cross sections of pions. With such an arrange- ment, a 7T~ turns toward the target and a TT
+ turns
away from the target. Since ar produces more neu- trons than a 7T+, neutron yields will be enhanced by choosing this direction for antiproton injection. In ad- dition, as discussed later, the magnetic field direction also helps focus the antiproton beam.
The CALE code results for the compression of a 27-g target with initial plasma conditions of 2 eV and 1 x 1019 cm-3 are used for the simulations.3 At peak compression, the target has density fluctuations up to 90 g/cm3, and magnetic fields of several hundred tesla. Results of simulations with/without target com- pression and/or magnetic field are summarized in Ta- ble I. Case A is the baseline simulation, wherein the antiprotons are injected before compression. At peak compression with the magnetic field (case B), the neu- tron yield increases by a factor of 3.6 because of the combination of compression and magnetic field. For case C, with the magnetic field ignored in the simula- tion, the neutron yield increases by only a factor of 2.0, which implies that the magnetic field accounts for a factor of 1.8 increase in yield. Simulations with the CALE code predict no significant target asymmetries or instabilities, e.g., formation of jets of liner or tar- get material. This has been recently partially confirmed in SHIVA Star liner firings in vacuum.20
NUCLEAR SCIENCE AND ENGINEERING VOL.118 DEC. 1994

CHARGED PIONS IN ANTIPROTON MICROFISSION 231
TABLE I
Average Pathlengths of Pions in Target and Liner, Fraction of Stopped *~ in Target, and Resultant Neutron Yields for 27-g Target, and 2-eV and 1 x 10" cm-3 Initial Working Fluid Conditions
Items Case Aa Case Bb Case Cc
Average /,*,,/, of ic~ in target (mm) 3.179 ±0.027 3.435 ± 0.025 2.604 ± 0.020 Average lp„th of T+
in target (mm) 3.233 ± 0.019 2.825 ± 0.017 2.709 ± 0.015 Average lp„th of w~ in liner (mm) 0.439 ± 0.003 15.181 ±0.123 7.828 ± 0.048 Average lpalh of w+ in liner (mm) 0.445 ± 0.002 9.725 ± 0.062 8.133 ±0.036 Percent of stopped ir~ in target (%) 0.46 4.73 1.19 Neutron yield from target per p 1.335 ± 0.022 3.810 ± 0.038 2.151 ± 0.028 Neutron yield from liner per p 0.016 ± 0.001 1.001 ±0.012 0.557 ± 0.009 Total neutron yield per p 1.351 ± 0.022 4.811 ±0.040 2.708 ± 0.029
"Case A: uncompressed target. bCase B: CALE density profiles and magnetic field. cCase C: CALE density profiles without magnetic field.
Orbits of three typical charged pions in the mag- netic field are shown in Fig. 7 (elevation view as shown in Fig. 1) and Fig. 8 (top view). Path lengths of charged pions, especially in the liner, increase because of the magnetic field as seen in Table I. Comparing cases B and C in Table I, we see that the magnetic field in- creases the path lengths of charged pions, especially ir~, by factors ranging from 1.04 to 1.94. The percen- tage of stopped 7T of 4.
is also increased by nearly a factor
I I LB. Neutron Yields
In this section, neutron yields for four CALE cases are presented. These results, and their corresponding initial plasma conditions, are summarized in Table II. For comparison, case A discussed in Sec. III.A is also listed.
Case 2 gives the largest yield of 4.574 ± 0.042 neu- trons from the target. The average target density for case 2 is the largest among all cases, thus increasing the interactions between the pions and the target. The mag- netic field also increases path lengths of ir~ and ir + ; therefore, the neutron yield is further enhanced. Effects from the magnetic field can be seen in the difference in 7T_ and 7r+ path lengths. Since the magnetic field direction increases the path length of -K ~ more than that of 7T + , a stronger magnetic field results in a greater difference in the path lengths. As seen in Ta- ble II, the differences in path lengths of ir~ and ir+ in case 2 are the largest among the four cases. Therefore, the magnetic field enhances the neutron yield the most in case 2.
Azimuthal magnetic field contours for case 2 are shown in Fig. 9. A large magnetic field of «1 MG is predicted within 0.1 cm of the beam axis (r — 0). By Ampere's law, the magnetic field must decrease to zero on the axis. An antiproton moving off the beamline will be deflected radially inward by the Lorentz force. Tak-
ing into account energy loss per unit length, dE/ds, due to antiproton interactions with electrons, we numeri- cally ray-trace antiproton trajectories in this field. Typ- ical trajectories inside the compression chamber are shown in Fig. 10. As seen, a beam with a maximum spread of 0.9 mm from r = 0 and initial energy of 4 MeV hits the target surface within a 0.2-mm radius from r = 0. In other words, the chosen magnetic field direction focuses the antiproton beam onto the target.
Neutron yields from the liner are greatly enhanced (factor of 40 to 60), compared with those for case A, for all four cases. As seen in Fig. 9, this is because the magnetic field is much stronger in the liner than in the
0.025 ■.! , , , i , i i I I I | I I I I I 1 '
0.015
0.005 -
-0.005 -
-0.015
-0.025 y -0.025 -0.015 -0.005 0.005 0.015 0.025
x (m)
Fig. 7. Three typical pion orbits seen in the elevation view.
NUCLEAR SCIENCE AND ENGINEERING VOL.118 DEC. 1994

232 HIGMAN et al.
0.025 I i i . i i i i i i i i i i ' i i ' i' i
0.015 -
E
0.005
-0.005
-0.015
-0.025 I | ' ■ ■ * ■ ■ ■
-0.025 -0.015 -0.005 0.005 0.015 0.025
x (m)
Fig. 8. Three typical pion orbits from Fig. 7 seen in the top view.
target, and the liner thickness is greatly increased under compression; hence, the average path length of pions is dramatically larger in the liner under compression.
The magnetic field profile at peak compression dif- fers somewhat for different initial plasma conditions. As a consequence, neutron yields induced by charged pions are more sensitive to initial plasma conditions than those induced by primary neutrons generated by annihilation of antiprotons. We illustrate as follows: The gain in neutron yields1 from the compressed tar- get induced by parent neutrons is enhanced by a fac- tor of =1.8 compared with the uncompressed target case A, whereas the factor varies between 1.95 and 3.43 for neutron yields induced by charged pions.
The version of CALE used in these simulations does not include radiation and thermal conduction. In- cluding thermal radiation, we find that the target den- sity at peak compression is relatively unchanged for cases 1, 2, and 3 and increases3 by 10% for case 4. Therefore, neutron yields at peak compression includ- ing radiation and thermal conduction should be simi- lar to the results in Table II.
IV. SUMMARY
Containment of charged pions generated at anni- hilation of an antiproton have been simulated. Neutron yields resulting from interactions between charged pi- ons and the target and liner are obtained. The results are summarized as follows:
1. The magnetic field at peak compression increases neutron yields induced by charged pions by a factor
r-
2 "S3 > c o u
■*-»
3 u z -h-J c CO
UJ
<
c o
3 "3 CJ
Of T3 C O
es TJ
~-l u FT
(2.S
■S 5
•u CO
- s =
> <
m
E ■* ON Wl VO (V) — OO VO o o o o
— © o m — f> © © ©
1/1 ©
o © o o © © © <=><* +1 +1 +1 +1 - +1 +1 +1 +1^
c4
C3 y u v©
— oo v~> t— — — C\ <N
O VO w> O vo r- VO VO «S
> ro r<> © © CM © f>
f>
E Tf OO Tt l~- m — t— m — fi O © © ©
">■?■> o o o © +i +i +i +i s ^ o VO o\ W n vONN d Ov m OO
© © © o© o>2 cs v
+1 +1 +1
VO «N 00 n» —■
_ fi
<N
> CJ
nNm» fl © Tt
>/->
r*i
E Ov 00 Tf vo (S — <N v> © © — © 35 3 ©
CCj y
o
© © © © © © © <=>oo +i +i +i +i 22 — Tf </i CN «"> rt m r- © © oo vo —
+i +i +i r- oo vo in o\ v*i
>" u
•*N m» •* © u-i
Ci
f*i
E w-j r~ m CN <N — <N VO © © — ©
OO (S ©
© © © ©
Zs © © © ©
+1 +1 +1 +1 P © © ©
+1 +1 +1 +1°. CO y i/l i^ — if) ^t
m <N oo M ■* oo — r» 53 © oo
> <u
m (N u-i ov m — ^
fN
r- ov fi <N
© © © © <S © <S © © ©
fi ©
< © © © © VO © © © © oo
cj +1 +1 +1 +1 "*. +1 +1 +1 co U 1— ro fi t
<n vo —' m — f, m © r*>
ri —« vo
mm©© _, o —
^ b.
CÄ
frill W QJ t, u 5
5Si£.£ .E .E .5 .E V
o B
i_ 'Q.T3 CJ i_ c D. u rt - o-- D . ej DO S oo ■- e u
T3 4> U 3
T3 C
•— £.
£?_ & CO t/1 D.
E CJ
1 + 1 + 13 fc= t= N fc «
i_ u- u. v- S; o o o o §■ 5 -S 5 -5 <S
-J-J.-J-J-'-
E E E o o o k- b. t-
(•- t^ u.
2 2 2 u Si .Si
its <= s >> .Si S "- '>. U 3
S « C ■Bi >. CO
3-° o Z H
CJ CJ CJ cj —
00 00 00 60 c co co cd co CJ U. U- b- 1- ?j U U U U £ > > > > CJ < < < < D.
C C C ,- o o o ,C1- W. k. U L.
3 3 3 Si. cj ej o> "• z z z
oo o ^r O "* C -= O 00
n o co f:
>- w U .E S
CO 5
00" So-a f- g c _ • — cj »5 00
•2H
00 c CJ
CO
a. CJ 00 CO
c o CO
k. CO |Q LI •v E c 0 rr\ CJ
VO O
1
t*- u-
T3 O CJ ■n ro m CJ a >, CJ c
o 3
CJ C
CO >>
H CO
E E o a
(4- t/i
< CJ T3
U^
NUCLEAR SCIENCE AND ENGINEERING VOL.118 DEC. 1994

CHARGED PIONS IN ANTIPROTON MICROFISSION 233
r(cm)
2 LJI ll|llll|llll|llll|MII|llll|llll|ll I I | I L 1 I | I T-n | I I I | I I , I j I I H j I I I 1 [ I ll|llll|MII|MM |iiii|ii
Ö 0.2 0.4 0.6 0.8 1 1.2 1.4 1.6 1.8 2
z(cm)
Fig. 9. Magnetic field profiles at peak compression for case 2 (Table II).
4
3.5
3
2.5
2
1.5
I
0.5
0
""•»^s^ Liner
: |Cathode|
Target
Working Fluid r p beam
window
<^-rT^^rTTTTr,
4 4.5 5.5 6 6.5
z (mm)
7.5 8
of =2.4 to 4.1 over yields with an uncompressed get without magnetic field. get without magnetic field.
tar-
Fig. 10. Enlarged view of target, working fluid region showing focusing of antiproton beam rays (solid lines).
2. Neutron yields induced by charged pions are sen- sitive to initial plasma conditions used for compression, since different initial plasma conditions significantly change the magnetic field profile at peak compression.
3. The highest neutron yields induced by charged pions per antiproton are 4.6 from the target and 1.0 from the liner. Including 16.3 primary neutrons, 3.0 neutrons induced by parent neutrons,1 and 5.6 neu- trons induced by pions, approximately 25 neutrons are produced from the target and liner at annihilation. This represents a gain of a factor of 1.3 over an uncom- pressed target.
ACKNOWLEDGMENT
This work was supported in part by the U.S. Air Force Office of Scientific Research and the Jet Propulsion Labora- tory (National Aeronautics and Space Administration).
NUCLEAR SCIENCE AND ENGINEERING VOL.118 DEC. 1994

234 HIGMAN et al.
REFERENCES
1. C. E. GAZZE, R. J. NEWTON, R. A. LEWIS, P. R. CHIANG, and G. A. SMITH, "Neutron Yields for Antipro- ton Microfission Experiments," Nucl. Sei. Eng., 118, 217 (1994).
2. E. D. MINOR et al., Z. Phys. A, 336, 461 (1990).
3. P.-R. CHIANG et al., "Target Compression by Work- ing Fluids Driven with Solid Liner Implosions," J. Appl. Phys., 76, 2, 15 (July 1994).
4. K. I. HIGMAN, "Compression and Pion Recirculation in Antiproton-Induced Microfission," PhD Thesis, The Pennsylvania State University (1993).
5. R. TIPTON, "CALE Users' Manual," Lawrence Liver- more National Laboratory (July 1991); see also Megagauss Technology and Pulsed Power Applications, p. 299, C. M. FOWLER, R. S. CAVID, and D. J. ERICKSON, Eds., Ple- num Press, New York (1987).
6. "Review of Particle Properties," Phys. Rev. D, 45, 2 (June 1992).
7. J. P. SCHIFFER, "Pion Reaction Modes on Nuclei," Nucl. Phys. A, 335, 339 (1980).
8. D. ASHERY et al., "True Absorption and Scattering of Pions on Nuclei," Phys. Rev. C, 23, 2173 (1981).
9. K. NAKAI et al., "Measurements of Cross Sections for Pion Absorption by Nuclei," Phys. Rev. Lett., 44, 1446 (1980).
10. H. P. 1SAAK et al., "Inclusive Neutron Spectra from trie Absorption of Stopped Negative Pions in Heavy Nuclei," Nucl. Phys. A, 392, 368 (1983).
H.H. BABA et al., "A Shell Model Nuclear Level Den- sity," Nucl. Phys. A, 159, 625 (1970).
12. J. CUGNON et al., "Nucleus Excitation and Deexcitation Following Antiproton Annihilation at Rest,"Nucl. Phys. A, 470, 558 (1987).
13. R. MADEY et al., "Neutrons from Nuclear Capture of Negative Pions," Phys. Rev. C, 25, 3050 (1982).
14. D. ASHERY and J. P. SCHIFFER, "Pion Absorption in Nuclei," Ann. Rev. Nucl. Part. Sei., 36, 207 (1986).
15. F. S. ALSMILLER, R. G. ALSMILLER, Jr., T. A. GABRIEL, R. A. LILLIE, and J. BARISH, "A Phenom- enological Model for Particle Production from the Collisions of Nucleons and Pions with Fissile Elements at Medium En- ergies," Nucl. Sei. Eng., 79, 147 (1981).
16. W. SCHIMMERLING et al., "Neutron-Nucleus Total and Inelastic Cross Sections: 900 to 2600 MeV/c," Phys. Rev. C, 7, 248 (1973).
17. J. FRANZ et al., "Total Neutron-Nucleus Cross Sec- tions at Intermediate Energies," Nucl. Phys. A, 490, 667 (1988).
18. I. NAVON et al., "True Absorption and Scattering of 50 MeV Pions," Phys. Rev. C, 28, 2548 (1983).
19. E. SEGRE, Nuclei and Particles—An Introduction to Nuclear and Subnuclear Physics, 2nd ed., Benjamin Publish- ing, Reading, Massachusetts (1977).
20. J. H. DEGNAN et al., "Electromagnetic Implosion of Spherical Liner," submitted to Phys. Rev. Lett. (1994).
NUCLEAR SCIENCE AND ENGINEERING VOL.118 DEC. 1994

Accepted for Publication in 'VH^/S, A BTT^ R2i^i. 57"?// f 7 Q Physics Letters A, 1996 /
hep-ex/9506015 LA-ÜR-95-1604
ARE ANTIPROTONS FOREVER?
M. H. Holzscheiter.fl X. Feng.6 T. Goldman/ N. S. P. King.0
R. A. Lewis.0* M. M. Nieto" and G. A. Smith,0"
aPhysics Division. Los Alamos National Laboratory. Los Alamos, NM 87545. U.S.A. bUniversity of Aarhus, Institute for Physics and Astronomy, 8000 Aarhus-C, DENMARK cTheoretical Division, Los Alamos National Laboratory. Los Alamos, NM 87545, U.S.A. dPennsylvania State University. University Park. PA 16S02. U.S.A. ^Abteilung für Quantenphysik. Universität Ulm. D-89069 Ulm, GERMANY
ABSTRACT
Up to more than one million antiprotons from a single LEAR spill have
been captured in a large Penning trap. Surprisingly, when the antiprotons
are cooled to energies significantly below 1 eV. the annihilation rate falls
below background. Thus, very long storage times for antiprotons have
been demonstrated in the trap, even at the compromised vacuum con-
ditions imposed by the experimental set up. The significance for future
ultra-low energy experiments is discussed.
PACS: 39.10.4-j. 25.43.-H, 35.80.-fs. 07.30.-t
Email: mhhulanl.gov: fengddfi.aau.dk: goldmanuhotelcal.lanl.gov; kingdplomvl.lanl.gov: rxl ulepsa.phys.psu.edu: mnindpion.lanl.gov: smithdlepsa.phys.psu.edu

An experiment to measure the gravitational acceleration of antiprotons is under
preparation at the Low Energy Antiproton Ring (LEAR) ar CERX [1]. The exper-
iment proposes to use a time-of-fliglit technique [2], as pioneered in an experiment,
wiiich measured the gravitational acceleration of electrons [3]. A critical requirement
for such an experiment is a sufficiently large number of antiprotons at sub-eY energies
in order to assemble a time-of-flight spectrum with sufficient statistics.
The lowest-energy antiprotons currently available are produced at LEAR. Here
antiprotons are delivered at energies as low as 5.9 MeV. A gap of at least 10 orders
of magnitude in energy has to be bridged before a meaningful measurement of the
gravitational acceleration of antiprotons can be attempted.
To achieve this energy reduction we have developed a large Penning trap system
which is matched to the output phase space of the LEAR facility. An antiproton bunch
of 200 ns duration, containing up to 109 antiprotons. is transmitted through a thin
foil in wliich the energy of the individual particles is reduced by multiple collisions.
With a properly chosen foil thickness up to 0.6 % of the incident antiprotons emerge
from the foil with less than 12.5 keV kinetic energy.
These particles are dynamically captured in the Penning trap by rapidly switching
the entrance electrode potential while the bunch is inside the trap volume. Once
captured, the antiprotons are cooled by an electron cloud which has been stored in
the trap in preparation for the capture. During recent tests of this system we have
succeeded in the capture of up to one million antiprotons from a single bunch from
LEAR. Up to 65 % of the captured particles were cooled to sub-eV energies and
collected in a 1 cm3 region at the center of the trap. Presumably, the remaining
35% could not be cooled due to a lack of overlap between antiproton and electron
clouds in the radial direction. This can also be seen by the fact that the collection
efficiency varies strongly with the beam time from LEAR, wiiich may change from run
to run. causing strong variations in the number of collected antiprotons for otherwise

unchanged conditions (see data points in figure 2 around 130 seconds).
Using a set of scintillators mounted externally to the vacuum system we are able
to monitor the annihilation of the antiprotons on the residual gas molecules during
the cool-down period. When all particles have been collected in the central well and
have been cooled below 1 eY. no annihilation can be oljserved above the ambient
background of approximately 1-2 counts per second.
This result is, at first glance, in contradiction to what one would expect to happen
since the annihilation cross section at low energy is generally assumed to have a 1/r
dependence. As a result of this effect, antiprotons were stored for significantly long
periods of time, even though the residual gas pressure in the system was estimated to
be equal to or greater than 10" n Torr. Note that our result is of different origin than
the long storage times obtained by the PS196 collaboration [4]. In this experiment,
which demonstrated the first capture and subsequent electron cooling of antiprotons
from LEAR, a fully cryogenic vacuum system was used. Their long storage time w^s
simply attributed to an extremely-low residual gas density. Effects discussed here
were not considered.
We now describe our results in detail and comment on their significance. Charged
particles may be confined in vacuum by a superposition of an electric quadrupole field
and a strong, axial, magnetic field, a combination typically referred to as a Penning
trap [5]. One needs to ensure that all the antiprotons emerging from the degrading
foil during a single LEAR pulse and having a kinetic energy of less than 12.5 keV are
still within the trap volume when the potential at the entrance electrode is ramped
up. This requires an axial dimension of the trap of about 50 an.
To meet this requirement we have constructed an 'open-end-cap' Penning trap
[6]. It contains 5 cylindrical electrodes of inside diameters 2.8 an and with other
dimensions carefully chosen to allow generation of a harmonic potential at the center.
Additionally there are two liigh-voltage electrodes, located at the entrance and the
3
exit of the trap. The entrance electrode consists of a 5 mil, gold-coated, aluminum
foil of diameter 0.6 cm. which also serves as the degrading foil. The exit electrode
was chosen to be an open cylinder (of inside diameter 2.8 an) to allow ejection of
the antiprotons from the trap subsequent to their capture and cooling. The electric
potential to the innermost electrodes was -26 Volts for the end-caps. +4 Volts for
the central ring, and ground potential for the compensation electrodes. This formed
a harmonic well with a depth of 30 Volts. The entrance and exit electrodes denning
the 50 an long catching trap were initially set to -12.5 kV. and lowered to 10 kV 8
seconds after capture.
This trap is located in the bore of a superconducting magnet capable of producing
an axial magnetic field of up to 6 Tesla. Figure 1 displays a schematic lay-out of
the entire set-up, including the location of the external scintillators used to monitor
antiproton annihilations.
The following is a brief description of a normal measurement cycle. The central,
harmonic well of the trap is preloaded with typically 109 electrons from an electron
gun located in the fringe field of the magnet. These electrons quickly cool by syn-
chrotron radiation to equilibrium with the ambient temperature of the system (« 10
K). Initially the entrance foil potential is held at ground while the exit electrode is at
full potential. Antiprotons from LEAR traverse the beam profile monitor, generating
a trigger for the high-voltage switch to the entrance foil. The antiprotons are slowed
down in the foil. Those emerging from it at kinetic energies below the exit electrode
potential are reflected back towards the entrance. The potential at the entrance
electrode is ramped up to the desired potential in less than 100 ns by a commercial
switch [7]. This captures the antiprotons in the 50 an long (non-harmonic) well of
this "catching trap." Due to scattering on the cold electrons, the stored antiprotons
lose energy and eventually collect in the inner, harmonic region of the trap.
Antiprotons stored in either the the long, non-harmonic well or the inner, hat-
moiiic well of the trap can be detected by lowering the respective electrical potentials.
Escaping antiprotons will follow the magnetic field lines, strike the surface of the
down-stream radiation baffle, and anniliilate. External scintillators S5-S8 (see figure
1) detect the anniliilations and the information is stored in a multichannel analyzer.
If the time constant for reducing the potential is chosen to be much longer tlian the
oscillation period in the trap, particles will constantly probe the height of the bar-
rier and escape when tliis barrier has become lower than their energy. The resulting
•tmie-of-amvar spectrum directly reflects the energy distribution of the particles in
the trap before the release.
During a typical cycle we collect three such spectra. At Tl = 8 seconds, the
potential on the exit electrode is lowered to 10 kV. This ejects a fixed fraction of the
captured antiprotons and provides a calibrated measure for the number of particles
captured. At a variable time T2. the potential on the high voltage electrodes is
lowered to zero, allowing all antiprotons which have not been cooled to the inner,
harmonic well to escape. This is typically between 35 and 50 9c of the remaining
population. Finally, at T3, the harmonic well is lowered and the number and energy
distribution of cold antiprotons in the central well is recorded.
In Figure 2 we show the total number of antiprotons detected in the inner, har-
monic well (normalized to the number of antiprotons initially captured) vs. the
cooling time. We find that after approximately 600 seconds as much as 65 % of the
initially captured antiprotons were cooled into the inner well. The solid line shows
the prediction for a cooling time constant of 175 sec. This time constant is in good
agreement with calculations based on Spitzer's equation [S]. allowing for the only
partial overlap between electron and antiproton clouds.
Overall we have collected data for about 30 LEAR shots during the 2 hour beam
time for which the parameters given here apply. All these runs show the same features.
Suljscquently we have increased the electron densitv. therein" lowered the cooling

time constant to about 50 seconds, and reproduced the overall results. Since both
the parameters for the LEAR beam and the settings for the trap parameters have
changed drastically these data can not be easily compared, but we now use the change
of annihilation rate in time as an indication for successful electron cooling, which is
then used as a start signal for the continuation of the measurement cycle.
Hie following describes the finding for one specific shot during this 2 hour LEAR
rim. Figure 3 shows the energy spectrum of those antiprotons released from the inner,
harmonic trap after 1500 sec of storage time. We find the width of the peak to be
less than 800 meV. with the centroid located around 1 eV. Due to unknown contact
potentials on the trap structure it is impossible to determine the absolute value of
the energy to better than 200 meV. The width of the distribution must be attributed
mostly to the space charge effects from the charged particles in the trap. When
the antiprotons are cooled to 10 K the Debye length is smaller than the cloud size
and the cloud can be considered a uniformly charged ellipsoid. When the potential
at the edge of the cloud balances the external potential the antiprotons will start
escaping the trap. Since the shape of the potential and the cloud is changing when
the external potential is reduced, this is a dynamic process. Lsing the parameters
for our trap, and assuming the cloud to be an ellipsoid despite the unsymmetrical
lowering of the potential, we find this balance to occur at V » 0.95 Volts. This
argument does not include the space charge potential from the electrons. We find
little effect on the overall width of the spectrum when the electrons are removed prior
to opening the trap and attribute this to the small overlap in radial direction between
electrons (wiiich are produced as a filament with a sub-millimeter diameter) and the
antiprotons (wiiich occupy a region of several mm diameter). Therefore we find our
results to be fully compatible with 65 % of the antiprotons having been cooled to the
ambient temperature of the trap (< 15 K) after 600 seconds.
During the entire time between the initial capture of the antiproton pulse and the
6

filial release from the inner trap, the counts in the external scintillators are recorded.
Scintillators Si - S3 are located closest to the center of the trap and are therefore
mostly sensitive to annihilations occurring on the residual gas in the trap (see Fig-
ure 1). For background suppression these scintillators are connected in a two-fold
coincidence set-up and the detection efficiency is determined to be 4 %. Since the
number of stored antiprotoiis may vary in time, the observed annihilation rate needs
to be normalized to the number of particles present in the trap at any given time t.
To obtain this number, we use four data points between which we interpolate asum-
ing an exponential decay of the antiproton population (which has been confirmed in
independent measurements studying the development of the antiproton population
both with and without electron cooling present). The number of antiprotons ait = 0
is obtained from the signal at Tl. The number of cold antiprotons remaining at. the
end of the cycle {t = loOOsec) is obtained by integrating the spectrum at T3. The
number of antiprotons in the trap just, after the opening of the catching trap (T2)
is obtained by adding the integrated count rate (after background subtraction) from
SI - S4 and S5 - S8 during the storage time in the inner well to the number at T3.
Adding to this the count rate observed at T2 gives the number of particles prior to
the release from the catching trap. These results can be cross checked using typical
decay times of particles in the trap as well as the known ratio between cold and hot
particles at. the specific time T2. Such a normalized annihilation rate, for this specific
run, is shown in Figure 4.
At the beginning of the cool-down we see an increase in the probability for annihi-
lation on the residual gas. The annihilation rate reaches a maximum at approximately
150 seconds, but. afterwards decreases strikingly. At t = 600 seconds the long, non-
liamionic section of the trap is opened and a small, but sharp, drop in the annihilation
rate is seen. Tliis indicates the ejection of the few liigher-energy antiprotons remain-
ing in this section of the trap. Subsequently, the oljserved rate is not distinguisliable

above the cosmic-ray background. This is so even though, in tliis specific example,
approximately 12 % of the initially captured antiprotons were determined to be still
present in the inner trap at t = 1500 sec.
This olDservation is in contradiction to the generally held belief that the annihila-
tion cross section at low energy should exhibit a 1/r dependence [9]. (Tliis adiabatic
calculation was done, it should be noted, for hydrogen targets.) Such a 1/v behavior
would result in a normalized annihilation rate which would be independent of the
antiproton energy, which in turn implies that we should observe a constant rate vs.
time. Thus, with a 1/r behaviour, neither the initial rise of the observed rate nor the
decay at times larger than 200 seconds could be explained. (The initial increase may
be consistent with a 1/v". n > 1, dependence as given, for instance, by Morgan and
Hughes [10]. who had n = 2.) The upper bound of the observed annihilation rate is
8x 10"3 sec-1. However, the final annihilation rate at t > 600 sec is significantly lower
than this. To our knowledge no theoretical model exists that predicts such a striking
(or indeed, any) decrease of the rate with temperature. An approach [11] different
than that of Ref. [9] uses a coupled-channel, non-adiabatic procedure. Although this
produces a low rate at low energies, that model underpredicts our measured results
at times less than 200 sec.
The chemical composition of the residual gas in the trap is of critical importance.
Since the outer wall of the vacuum vessel is in direct contact with the liquid helium in
the cryostat. all gases except hydrogen and helium should be frozen out. Furthurmore.
because of the liquid helium environment and the fact that helium is poorly pumped
by the external ion-getter pumps, the remaining gas should be predominantly helium.
Now we can consider the actual gas pressure in the trap. In fact, the observed
maximum annihilation rate. 8 x 10⁻³ sec-1, can be used to verify a rough estimate
for the residual gas pressure. Assume that (1) the cross-section estimates given by
Bracci et al. [9] (wiiich has a 1/r dependence) are valid as an upper lxmnd for our

observed annihilation rate even through the calculation was for a hydrogen target,
and (2) the measured temperatme of the trap structure. 10 K. is the temperature of
the residual gas. Using these parameters one obtains 4 x 10"12 Torr for the residual
gas pressure. Ulis is in good agreement with our expectation that the gas pressure
in the trap is bounded from above by the lower limit of the residual gas pressure
immediately outside the cryogenic section. 10"n Ton-.
In those runs where no electrons were preloaded, so no cooling of the antiprotons
was taking place, the observed normalized annihilation rate remained constant at
about 2 x 10"3 over comparable time intervals. This shows the importance of the
temperature of the antiprotons and proves the stability of the antiproton cloud against
dynamical effects.
Experimental data for the annihilation of antiprotons on neutral particles at low
energy does not exist. We are investigating the possibility that there exists a small
repulsive potential at short range [12]. Strong binding/antibinding effects on antipro-
tons penetrating the electron cloud of helium atoms have been observed by the PS194
collaboration [13] in a study of the double-ionization cross section for antiprotons and
protons impacting on a helium gas target at energies of 13 keV and above. Recently,
the formation of metastable systems in antiproton-helium collisions have been ob-
served [14] and theoretical predictions of repulsive potentials in excited-state systems
have been discussed [15]. Possibly related effects have been seen in positronium for-
mation from positron impact on large molecules [16]. (Elsewhere we will comment in
more detail on these points [17].)
The observed reduction of the annihilation rate at ultra-low energies would have
a significant impact on a number of experiments planned with cold antiprotons. For
these experiments antiprotons. once captured and cooled in the PS200 catching trap,
need to be extracted as a beam and transported to either a scattering chain)}«- or a
second trap system for recapture. Such a transport line would !.*? made teclinicallv

much easier if a room temperature vacuum system can be used instead of enclosing
the entire apparatus in a cryogenic environment.
Downstream traps will have to include a vacuum section which can be coupled
to the PS 200 catching trap (or a similar system) for filling. Again, this is easier
to do if ultra-low pressures are not needed, and. even though the actual traps need
to be at cryogenic temperatures to achieve the ultra-low energy for the antiprotons.
the transfer sections (which must include mechanical valves) could be operated under
room temperature UHY conditions. To summarize, because of the reduced antiproton
annihilation rate at low energies that we have observed, the long storage times needed
for experimentation with antiprotons can realistically be achieved hi small systems
[18]. (Earlier it was assumed that antiprotons need to be stored at higher energies,
requiring larger, possibly ring-like structures, to counteract the expected increase of
the annihilation rate at low energies.)
Future work will include the controlled reheating of the cooled antiprotons. This
will be done by using resonance excitation of the axial motion with radio-frequency
fields. The energy dependence of the annihilation cross section will be studied. We
also will use different target, gases to investigate the possible effect of the polarization
potential of the target atom.
The work described here has been performed within the framework of the PS200
experimental development and we wish to thank the entire PS200 collaboration for
their support. We especially wish to thank P. L. Dyer for the development of the
data acquisition system used for these measurements. J. Rochet for his assistance
in constructing and operating the experimental apparatus, and M. Charlton and Y.
Yamazaki for their support during data taking. We appreciate the helpful comments
by S. Barlow on the positron annihilation data. None of the results presented here
wotild have been obtainable without the support and help from the entire LEAR
operating team. A very special •thank you" goes to J.-Y. Hemery. M. Michel, and M.
10

Giovannozzi for delivering the very best beam spot possible to the entrance of our
apparatus. Tliis work was in part supported by the US Department of Energy under
contract no. W7405 ENG-36 (Los .Alamos), the U.S. Air Force Office of Scientific
Research under grant no. F49620-&4-1-0223 (Pennsylvania State University) and the
.Alexander von Humboldt Stiftung (M.M.X. at Ulm).
11
References
[1] M. H. Holzscheiter. Hyperfine Int. 81 (1993) 71; M. M. Nieto and M. H.
Holzscheiter. Appl. Phys. B 60 (1995) 103: M. H. Holzscheiter. et al.. Phys.
Atom. Xucl. 57 (1994) 1799: M. H. Holzscheit er. Physica Scripta (to be pub-
lished).
[2] T. Goldman and M. M. Nieto, Phys. Lett. B 112 (1982) 437.
[3] F. S. Wittebom and W. M. Fairbank. Phys. Rev. Lett. 19 (1967) 1049.
[4] G. Gabrielse. X. Fei. K. Helmerson. S. L. Rolston, R, Tjoelker. T. A. trainor.
H. Kcdino™>ky. J. Haas. W. Kells: Phys. Rev. Lett. 57 (1986) 2504, and G.
Gabrielse, X. Fei. L. A. Orozco. R. L. Tjoelker, J. Haas. H. Kalino\vsky. T. A.
Trainor. and W. Kells, Phys. Rev. Lett. 65 (1990) 1317.
[5] J. R- Pierce. Theory and Design of Electron Beams (D. van Xostrand, NY. 1949).
chapter 3; H. G. Dehmelt, Adv. At. Mol. Phys. 3 (1967) 53: ibid. 5 (1969) 109.
[6] G. Gabrielse, L. Haarsma, and S. L. Rolston, Int. J. Mass Spec. Ion Processes
88 (1989) 319.
[7] Solid state switch Model HTS301 from Behlke Electronics GmbH, Frankfurt.
Germany, with maximum operating voltage of 30 keV and a rated rise time of
20 ns under optimum load conditions.
[8] L. Spitzer: Physics of Fully Ionized Gases. Interscience Publishers. New York
(1962) chapter 5.
[9] L. Bracci. G. Fiorentini. and 0. Pitzurras. Phys. Lett. B 8-5 (1979) 280.
[10] D. L. Morgan. Jr. and V. W. Hughes. Phys. Rev. A 7 (1973) 1811.
12

[11] A. Yu. Voronin, Zh. Eksp. Teor. Fiz. 102 (1992) 760. [Sov. Phys. JETP 75 (1992)
416.]
[12] We Tvish to especially thank T. Kinoshita and T. Ziegler. private communications,
for insightful comments on this matter.
[13] P. Hvelplund. H. Knudsen, U. Mikkelsen. E. Morenzoni, S. P. Moller. E. Ugger-
hoj. and T. Worm, J. Phys. B 27 (1994) 925.
[14] T. Yamazaki. R. S. Hayano, T. Ishikawa. H. Oata, E. Takada. H. Tamura. and
A. Sakaguchi. Phys. Rev. Lett. 63 (1989) 1590.
[15] K. Richter. J.-M. Rost, R. Thurwächter, J. S. Briggs, D. Wintgen. and E. A.
SoloVev, Phys. Rev. Lett. 66 (1991) 149.
[16] C. M. Surko. R. G. Greaves, and M. Leventhal, Hyperfine Int. 81 (1993) 239.
[17] M. H. Holzsclieiter et al., (in preparation).
[18] H. G. Dehmelt, R. Van Dyck, P. Schwinberg and G. Gabrielse, Bull. Am. Phys.
Soc. 24 (1979) 757, abstract D 3; S. D. Howe, M. V. Hynes, and A. Picklesimer;
in Antiproton Science and Technology, eds. B. W. Augenstein, B. E. Bonner,
F. E. Mills, and M. X. Nieto (World Scientific Singapore, 1988), p. 481; G. A.
Smith, Hyperfine Int. 81 (1993) 189.
13

Figure Captions:
Fig.l Schematic layout of the experimental set-up. Shown is the superconducting
magnet system (length 2 meter), the PS200 catching trap, all beam monitors,
and the scintillators used to trigger the voltage switch and to monitor the an-
tiproton annihilations during storage and upon release.
Fig.2 Accumulation of ultra-low energy antiprotons in the harmonic well in the center
of the PS200 catching trap. The solid line is calculated for a cooling time
constant of 175 seconds and a maximum transfer efficiency of 65 7c
Fig.3 Energy spectrum of cold antiprotons released from the inner trap. The centroid
of the distribution is at < 1 eV. the FWHM is < 800 meY.
Fig.4 Rate of annihilation during storage and cooling of antiprotons in the PS200
catching trap. The observed rate has been normalized to the number of an-
tiprotons in the trap at any given time t. Tlie sharp drop between 600 and
700 seconds is due to the loss of antiprotons when the outer trap is opened
completely (see text. also).
14
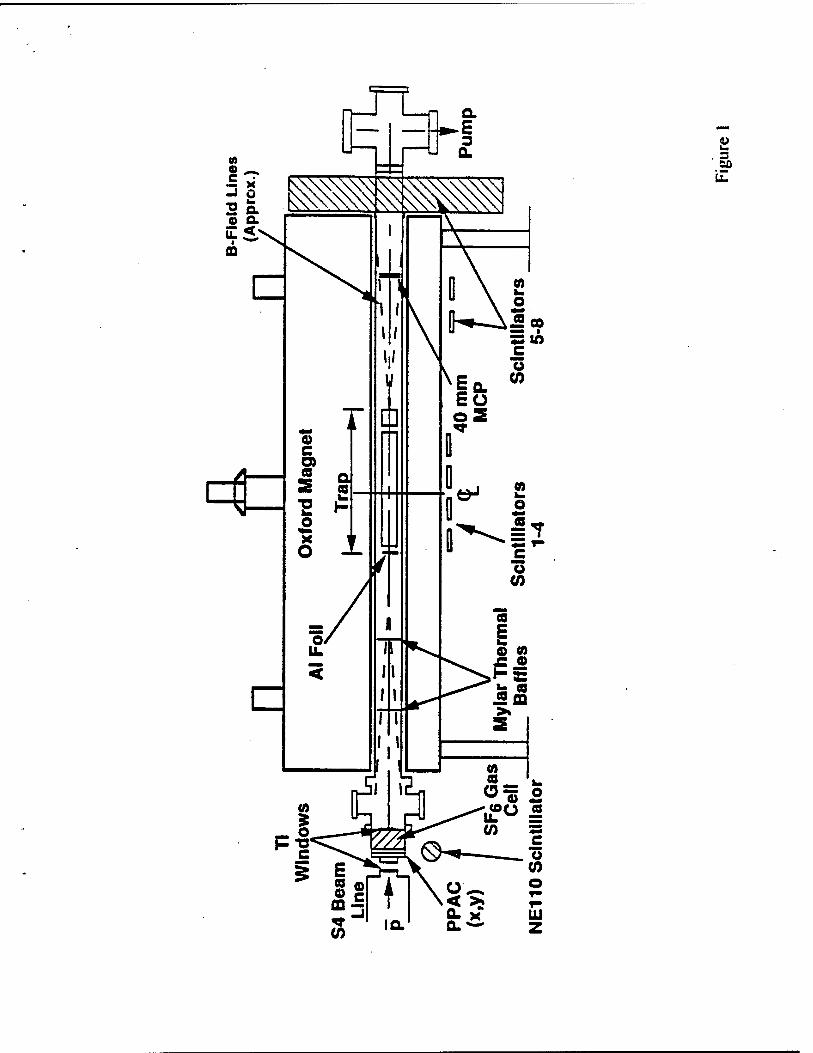
u to
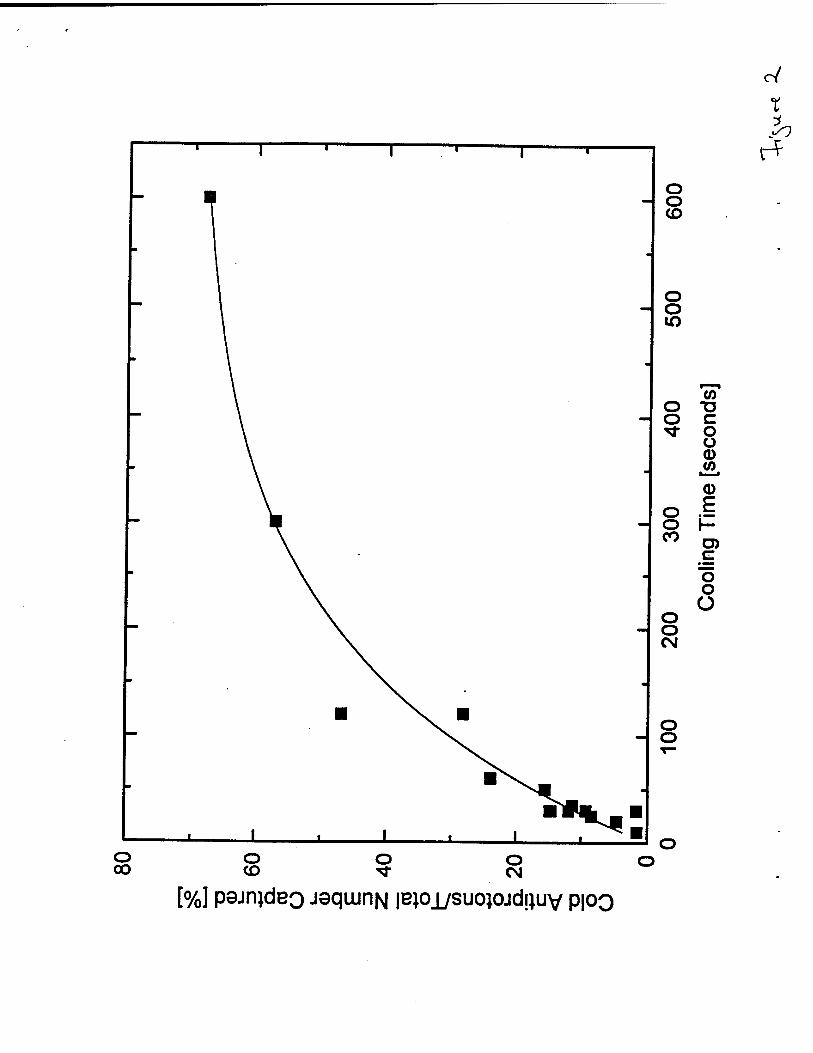
t h
[%] p9jn|dBQ joqiunN leioi/suojojctyuv P|OQ

cO
io I- 4
</) T3
£ C o o u
<D -o </> <D o (/> o (0 IO <D T—
0) II i_
w H c +-> o CD
o Q. c (0 Q. c i_
< (D C C
CO
s> c HI c o o
c <
suojojdijuv jo jaqoinN
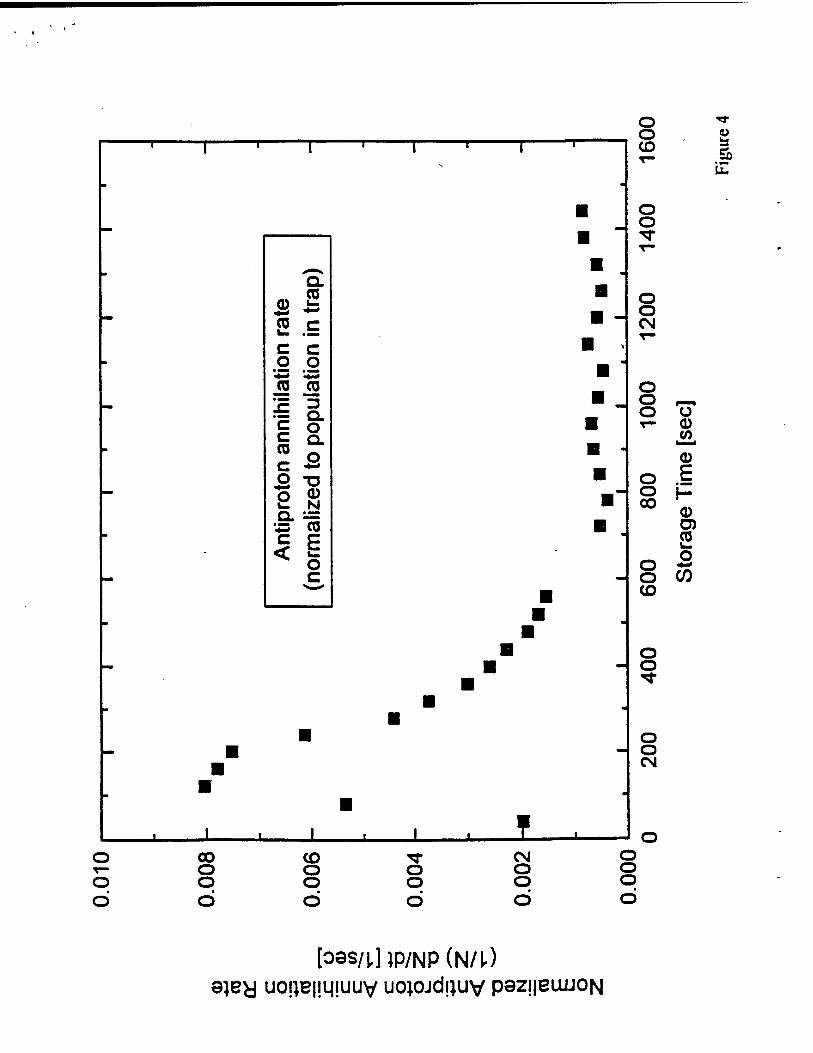
1 1 ' 1 1 1 T- 1
■ ■ ■ ■ ■ > ■ ■ ' ■ _ ■
■
■
■
1 . 1 . 1 . 1
Ant
ipro
ton
anni
hila
tion
rate
(n
orm
aliz
ed t
o po
pula
tion
in t
rap)
■ ■ ■
1
■
1
■ ■
■ ■ ■ ■ ■
■ ' « I 1
o o CD
O O
o o CM
O O „ O O T- <D
,<0,
CD E j- <D O) C3
o S o CO CO
o o CO
b So
o o
o o CM
O T- o d
oo o o
CO o o CD
o o CM o o
o o o d
[oas/i,] ip/NP (N/0 9jey uoijentjiuuv uojojdijuv pazneuxiON

Appendix J# \/ _
TRENDS
southern Arabian Peninsula, Elachi saw a series of lines leading to a single point. "Archeologists went to this area in Oman and found that these lines are really ancient roads, says El-Baz. "The point where they meet is the site of an ancient city," which may be the lost city of Ubar, famous in the Koran and other literature as a major stop on the frank- incense trade route. Further investiga- tions using SIR images and satellite pho- tos led to the discovery of another, even larger ancient entrepot, Saffara Metro- polis, in Oman's Qara Mountains.
Elachi's latest brainchild, a technolog- ically advanced SIR, flew in April on the shuttle Endeavor and is scheduled to fly again in August. Part of the $366 mil- lion, 23,000-pound Space Radar Labo- ratory, the new SIR is regarded as the most sophisticated radar system ever used in space. Unlike its single-wave- length predecessors, which sent C-band (6-centimeter) signals, the new model also uses X-band (3-centimeter) and L- band (23-centimeter) wavelengths. Each wavelength penetrates surface materials differently. L-band radar penetrates solid ground better than shorter wave- length signals do, and X-band signals reflect better off of low-density materi- als. Combining data from the three fre- quencies produces sharper images than were previously possible.
The radar images from the April shut- tle flight will be used to study the geol- ogy and hydrology of nearly 20 sites in
■ South America, Australia, Egypt, the Sahara Desert, and Death Valley, Calif. El-Baz has requested radar strips of two
\ areas—the Arabian Peninsula, where he ] has been working since 1991 to evalu- '• ate the Gulf War's environmental ef- I fects; and Egypt's Western Desert, where ; he hopes to further trace the rivers ! uncovered by the first SIR flight. He has ! also found evidence that other portions ' of the Sahara may conceal huge under- i ground aquifers. He believes they may 1 be on the scale of the one Libya is now
tapping, which hydrologists claim will supply that riverless country with six million cubic meters of water daily for the next half-century.—PETER TYSON
Have Antimatter, Will Travel
Antimatter may be most familiar as the strange fuel that powers Star
Trek's starship Enterprise across the galaxy in the twenty-fourth century. But the material is quite real. In fact, twenti- eth-century physicists are heralding it as a potential tool for accomplishing feats ranging from understanding the funda- mental nature of matter to creating a powerful new form of energy.
Unfortunately, antimatter is also quite rare and volatile, which has severely lim- ited scientists' ability to use the exotic material. For the past 40 years, physi- cists have been able to study particles of it as it zips around the massive linear accelerators where it is created by high- energy particle collisions. And because antimatter possesses an electrical charge opposite that of normal matter, a proton with a positive charge and an antiproton with a negative charge will annihilate each other on contact, converting all of
£555
their combined mass into a flash of energy.
In recent months, however, research- ers have developed a technique that col- lects more than a million antimatter particles at a time—an order-of-mag- nitude increase over earlier efforts. Encouraged by the ability to amass such quantities, they are designing cases for transporting the particles from the giant accelerators to their own labs for experimentation.
The technique represents a major step beyond the original technique for col- lecting antimatter particles developed by Gerald Gabrielse, a physicist at Harvard University. While working at the Euro- pean Organization for Nuclear Research (CERN) in France a few years ago, he devised a way to siphon off as many as 100,000 antiprotons into a foot-long cylindrical trap. The billions of antipro- tons created in the particle accelerator were first slowed from near light-speed by radio waves, which absorbed some of the antimatter's kinetic energy. This material was then guided by a magnetic
14 .JULY 1994 ILLUSTRATION: STEVE BtiRDI
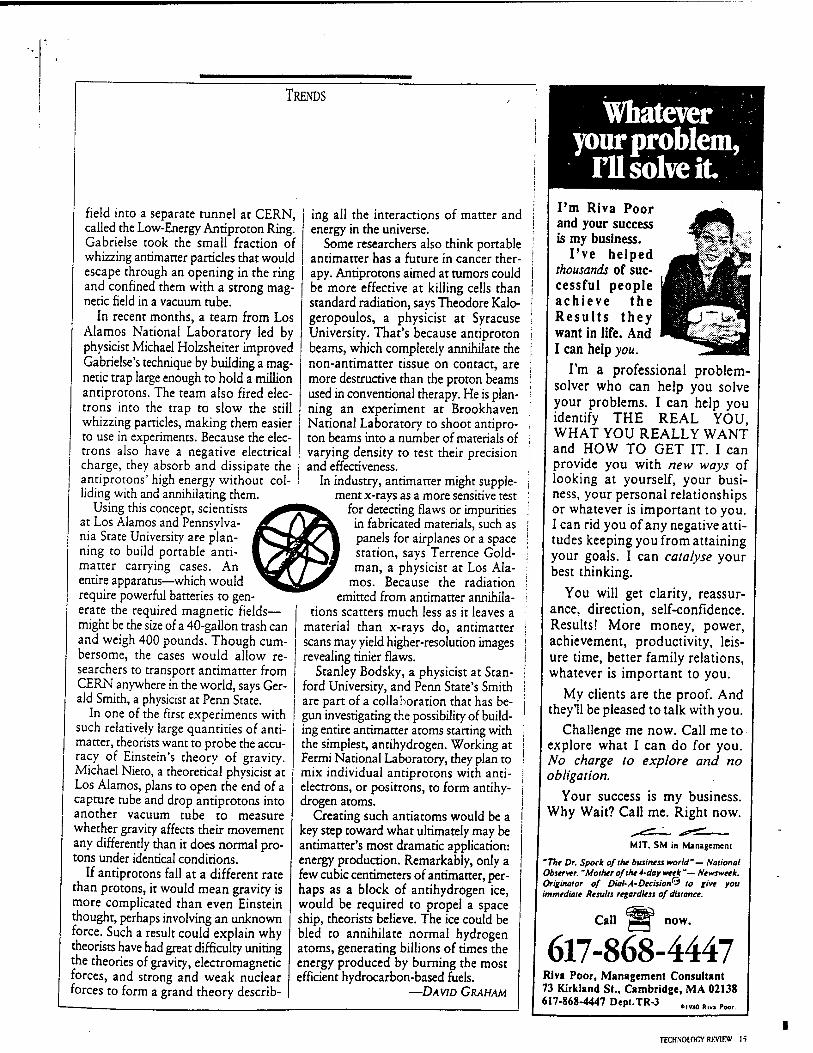
TRENDS
field into a separate tunnel at CERN, called the Low-Energy Anriproton Ring. Gabrielse took the small fraction of whizzing antimatter particles that would escape through an opening in the ring and confined them with a strong mag- netic field in a vacuum tube.
In recent months, a team from Los Alamos National Laboratory led by physicist Michael Holzsheiter improved Gabrielse's technique by building a mag- netic trap large enough to hold a million antiprotons. The team also fired elec- trons into the trap to slow the still whizzing particles, making them easier to use in experiments. Because the elec- trons also have a negative electrical charge, they absorb and dissipate the antiprotons' high energy without col- liding with and annihilating them.
Using this concept, scientists at Los Alamos and Pennsylva- nia State University are plan- ning to build portable anti- matter carrying cases. An entire apparatus—which would require powerful batteries to gen- erate the required magnetic fields— might be the size of a 40-gallon trash can and weigh 400 pounds. Though cum- bersome, the cases would allow re- searchers to transport antimatter from CERN anywhere in the world, says Ger- ald Smith, a physicist at Perm State.
In one of the first experiments with such relatively large quantities of anti- matter, theorists want to probe the accu- racy of Einstein's theory of gravity. Michael Nieto, a theoretical physicist at Los Alamos, plans to open the end of a capture tube and drop antiprotons into another vacuum tube to measure whether gravity affects their movement any differently than it does normal pro- tons under identical conditions.
If antiprotons fall at a different rate than protons, it would mean gravity is more complicated than even Einstein thought, perhaps involving an unknown force. Such a result could explain why theorists have had great difficulty uniting the theories of gravity, electromagnetic forces, and strong and weak nuclear forces to form a grand theory describ-
ing all the interactions of matter and energy in the universe.
Some researchers also think portable antimatter has a future in cancer ther- apy. Antiprotons aimed at tumors could be more effective at killing cells than standard radiation, says Theodore Kalo- geropoulos, a physicist at Syracuse University. That's because anriproton beams, which completely annihilate the non-antimatter tissue on contact, are more destructive than the proton beams used in conventional therapy. He is plan- ning an experiment at Brookhaven National Laboratory to shoot anripro- ton beams into a number of materials of varying density to test their precision and effectiveness.
In industry, antimatter might supple- ment x-rays as a more sensitive test
for detecting flaws or impurities in fabricated materials, such as panels for airplanes or a space station, says Terrence Gold- man, a physicist at Los Ala-
mos. Because the radiation emitted from antimatter annihila-
tions scatters much less as it leaves a material than x-rays do, antimatter scans may yield higher-resolution images revealing tinier flaws.
Stanley Bodsky, a physicist at Stan- ford University, and Perm State's Smith are part of a collaboration that has be- gun investigating the possibility of build- ing entire antimatter atoms starting with the simplest, antihydrogen. Working at Fermi National Laboratory, they plan to mix individual antiprotons with anti- electrons, or positrons, to form antihy- drogen atoms.
Creating such antiatoms would be a key step toward what ultimately may be antimatter's most dramatic application: energy production. Remarkably, only a few cubic centimeters of antimatter, per- haps as a block of antihydrogen ice, would be required to propel a space ship, theorists believe. The ice could be bled to annihilate normal hydrogen atoms, generating billions of times the energy produced by burning the most efficient hydrocarbon-based fuels.
—DA wo GRAHAM
Whatever your problem,
111 solve it. I'm Riva Poor and your success is my business.
I've helped thousands of suc- cessful people achieve the Results they want in life. And I can help you.
I'm a professional problem- solver who can help you solve your problems. I can help you identify THE REAL YOU, WHAT YOU REALLY WANT and HOW TO GET IT. I can provide you with new ways of looking at yourself, your busi- ness, your personal relationships or whatever is important to you. I can rid you of any negative atti- tudes keeping you from attaining your goals. I can catalyse your best thinking.
You will get clarity, reassur- ance, direction, self-confidence. Results! More money, power, achievement, productivity, leis- ure time, better family relations, whatever is important to you.
My clients are the proof. And they'll be pleased to talk with you.
Challenge me now. Call me to explore what I can do for you. No charge to explore and no obligation.
Your success is my business. Why Wait? Call me. Right now.
MIT. SM in Management
"The Dr. Spock of the business world"— National Observer. "Mother of the 4-day week "— Newsweek. Originator of Dial-A-Decision^ to give you immediate Results regardless of distance.
Call now.
617-868-4447 Riva Poor, Management Consultant 73 Kirkland St., Cambridge, MA 02138 617-868-4447 Dept.TR-3 »I9K0 RIVJ Poor.
TECHNOLOGY RKVIEW 16
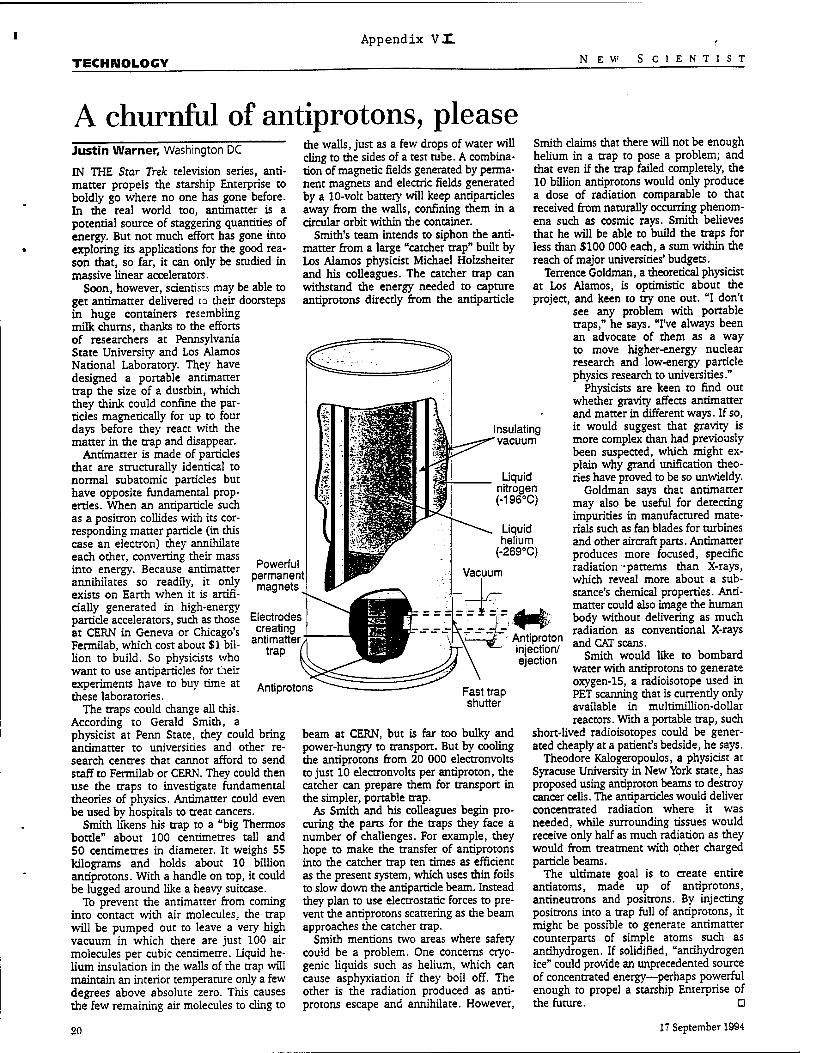
Appendix VI
TECHNOLOGY NEW SCIENTIST
A churnful of antiprotons, please Justin Warner, Washington DC
IN THE Star Trek television series, anti- matter propels the starship Enterprise to boldly go where no one has gone before. In the real world too, antimatter is a potential source of staggering quantities of energy. But not much effort has gone into exploring its applications for the good rea- son that, so far, it can only be studied in massive linear accelerators.
Soon, however, scientisis may be able to get antimatter delivered to their doorsteps in huge containers resembling milk chums, thanks to the efforts of researchers at Pennsylvania State University and Los Alamos National Laboratory. They have designed a portable antimatter trap the size of a dustbin, which they think could confine the par- ticles magnetically for up to four days before they react with the matter in the trap and disappear.
Antimatter is made of particles that are structurally identical to normal subatomic particles but have opposite fundamental prop- erties. When an antiparticle such as a positron collides with its cor- responding matter particle (in this case an electron) they annihilate each other, converting their mass into energy. Because antimatter annihilates so readily, it only exists on Earth when it is artifi- cially generated in high-energy particle accelerators, such as those at CERN in Geneva or Chicago's Fermilab, which cost about $1 bil- lion to build. So physicists who want to use antiparticles for their experiments have to buy time at these laboratories.
The traps could change all this. According to Gerald Smith, a physicist at Perm State, they could bring antimatter to universities and other re- search centres that cannot afford to send staff to Fermilab or CERN. They could then use the traps to investigate fundamental theories of physics. Antimatter could even be used by hospitals to treat cancers.
Smith likens his trap to a "big Thermos bottle" about 100 centimetres tall and 50 centimetres in diameter. It weighs 55 kilograms and holds about 10 billion antiprotons. With a handle on top, it could be lugged around like a heavy suitcase.
To prevent the antimatter from coming into contact with air molecules, the trap will be pumped out to leave a very high vacuum in which there are just 100 air molecules per cubic centimetre. Liquid he- lium insulation in the walls of the trap will maintain an interior temperature only a few degrees above absolute zero. This causes the few remaining air molecules to cling to
20
the walls, just as a few drops of water will cling to the sides of a test tube. A combina- tion of magnetic fields generated by perma- nent magnets and electric fields generated by a 10-volt battery will keep antiparticles away from the walls, confining them in a circular orbit within the container.
Smith's team intends to siphon the anti- matter from a large "catcher trap" built by Los Alamos physicist Michael Holzsheiter and his colleagues. The catcher trap can withstand the energy needed to capture antiprotons directly from the antiparticle
Powerful permanent magnets
Electrodes creating
antimatter trap
Antiprotons
Insulating vacuum
Liquid nitrogen (-196°C)
Liquid helium
(-269°C)
Vacuum
__J_!
Z&~; Antiproton injection/ ejection
Fast trap shutter
beam at CERN, but is far too bulky and power-hungry to transport. But by cooling the antiprotons from 20 000 electronvolts to just 10 electronvolts per antiproton, the catcher can prepare them for transport in the simpler, portable trap.
As Smith and his colleagues begin pro- curing the parts for the traps they face a number of challenges. For example, they hope to make the transfer of antiprotons into the catcher trap ten times as efficient as the present system, which uses thin foils to slow down the antiparticle beam. Instead they plan to use electrostatic forces to pre- vent the antiprotons scattering as the beam approaches the catcher trap.
Smith mentions two areas where safety could be a problem. One concerns cryo- genic liquids such as helium, which can cause asphyxiation if they boil off. The other is the radiation produced as anti- protons escape and annihilate. However,
Smith claims that there will not be enough helium in a trap to pose a problem; and that even if the trap failed completely, the 10 billion antiprotons would only produce a dose of radiation comparable to that received from naturally occurring phenom- ena such as cosmic rays. Smith believes that he will be able to build the traps for less than $100 000 each, a sum within the reach of major universities' budgets.
Terrence Goldman, a theoretical physicist at Los Alamos, is optimistic about the project, and keen to try one out. "I don't
see any problem with portable traps," he says. "Fve always been an advocate of them as a way to move higher-energy nuclear research and low-energy particle physics research to universities."
Physicists are keen to find out whether gravity affects antimatter and matter in different ways. If so, it would suggest that gravity is more complex than had previously been suspected, which might ex- plain why grand unification theo- ries have proved to be so unwieldy.
Goldman says that antimatter may also be useful for detecting impurities in manufactured mate- rials such as fan blades for turbines and other aircraft parts. Antimatter produces more focused, specific radiation •patterns than X-rays, which reveal more about a sub- stance's chemical properties. Anti- matter could also image the human body without delivering as much radiation as conventional X-rays and CAT scans.
Smith would like to bombard water with antiprotons to generate oxygen-15, a radioisotope used in PET scanning that is currently only available in multimillion-dollar reactors. With a portable trap, such
short-lived radioisotopes could be gener- ated cheaply at a patient's bedside, he says.
Theodore Kalogeropoulos, a physicist at Syracuse University in New York state, has proposed using antiproton beams to destroy cancer cells. The antiparticles would deliver concentrated radiation where it was needed, while surrounding tissues would receive only half as much radiation as they would from treatment with other charged particle beams.
The ultimate goal is to create entire antiatoms, made up of antiprotons, antineutrons and positrons. By injecting positrons into a trap full of antiprotons, it might be possible to generate antimatter counterparts of simple atoms such as antihydrogen. If solidified, "antihydrogen ice" could provide an unprecedented source of concentrated energy—perhaps powerful enough to propel a starship Enterprise of the future. D
17 September 1994

Tank circuit model applied to particles in a Penning trap X Feng Institute of Phvstis (iiul Astronomy Aurhus University, DK-8000 Aarhus. Denmark
M. Charlton Department o] Physics and Astronomy. University College London. London WC1E 6BT. United Kingdom
M. Holzscheiter his Alamos National Laboratory, Los Alamos, New Mexico 87545
Ft. A. Lewis Pennsylvania Stale University, Slate College, Pennsylvania 16802
Y. Yamazaki University of Tokyo, Tokyo 153, Japan
(Received 18 July 1995; accepted for publication 12 September-.1995)
The equivalent circuit model is used to describe analytically the coupling process of the center of mass motion of a cloud of particles in a Penning trap. From the response of this coupled circuit to white noise a way of nondestructively diagnosing the number of trapped particles is given which is valid for all values of this quantity. Experimental results are presented and compared with this analysis. © 1996 American Institute of Physics. [S0021-8979(96)01701-0]
I. INTRODUCTION
Ion traps provide a very clean, virtually background free environment, long sampling times and ultra-low particle en- ergy. Benefiting from these advantages many unprecedented experiments with very high precision have been performed in the fields of laser and microwave spectroscopy, mass mea- surements and atomic and molecular collisions. In recent years this technique has also been applied to the trapping and manipulation of antimatter. A few antiprotons have been stored in a Penning trap for longer than three months' and the proton and antiproton mass ratio has recently been mea- sured with ppb precision.2 Another experiment, aimed at storing many antiprotons in a Penning trap, has successfully caught about one million antiprotons from a single fast- extracted pulse from the low energy antiproton ring at CERN.3 The use of trapped antiprotons as an ultra-low en- ergy antiproton reservoir is of interest to various groups for research in atomic, nuclear and fundamental physics, such as comparing gravitation between matter and antimatter and producing antihydrogen. For these purposes a primary ques- tion is to diagnose the number of trapped particles continu- ously and nondestructively.
Wineland and Dehmelt4 have studied a practical way to determine the number of trapped charged particles by mea- suring the separation of two resonant peaks when an external "tank" circuit is coupled to their center-of-mass (CM) mo- tion. Thereafter this method has been used widely mostly to determine "small"' numbers of trapped particles. In this pa- per we report on the use of this method to estimate the num- ber of electrons which are present in our cylindrical Penning trap to cool the antiprotons, and its comparison to the num- ber measured by ejecting them onto a foil using appropriate bias voltages li was thus found that the measured values differed from those derived from Ref. 4 when the number of panicles becomes large We studied this problem by deduc- ing ;i ;in;tl\ni'iil solution lor the equivalent circuit model de-
scribing the coupling of the trap and the electron cloud and found that the equivalent resistance, which expresses the damping of the CM motion of a cloud of particles, plays an important role in this relationship.
In Sec. II we construct the equivalent circuit model in a fully analytical way, and in Sec. Ill we analyze its impedance which is used to deduce the spectral response to white noise and to find the dependence of this spectrum on the number of trapped electrons. In Sec. IV, we present our experimental results and discuss them within the framework of our analysis.
II. EQUIVALENT CIRCUIT
Particles are stored in a cylindrical Penning trap with a laboratory inductor connected to the two correction elec- trodes as shown in Fig. 1. The potentials on the different electrodes were chosen according to the condition'given in Ref. 5 to tune out the higher order anharmonic terms in the trapping field. Near the center of the trap the potential can be expressed, for a particle of charge q and mass m, as
2
*( fflW,
4«? "(2z2-r2), (2.1)
where r and z are cylindrical coordinates, and w z is the fre- quency at which a single trapped particle (or the CM of a cloud of panicles) oscillates along the : axis. When the ef- fects of induced charges in the electrodes can be neglected this frequency is given by
V/C2 md'
(2.2)
where V0 is the trapping potential, d is the characteristic distance defined as d2= 5 (r(
2,+ ip,2) (see Figure I) and C2 is a dimensionless parameter dependent on the trap geometry and in our case is equal to 0.544')
J Appl Phvs 79 Ml I January 1996 0021 -8979/96/7911J/8/6/S6 00 © 1996 American Inslilute of Physics

FIG. 1. Open geometry cylindrical trap and typical detection circuit. Here p0 is the inner radius of the trap and Zj, is the dimension from the center of trap to the end of the compensation electrodes. The trapping potential is
denoted by V0 and the inductor Lt forms part of the tank circuit.
Shockley6 demonstrated that a charged particle at posi- tion r which moves with a velocity v=drldt in an interelec- trode region induces currents in these electrodes. The current flowing from the electrode k through an external circuit to ground can be expressed as ik=q\-k(r), where Ek(r) is the electric field at position r when the electrode k is at unit potential and the other electrodes are grounded. The current flowing between the two correction electrodes via the exter- nal inductor induced by the oscillation of a single trapped particle can then be written as
ic=qvPar,icu-Ec{r), (2.3)
where ypar,icie is the velocity of the trapped particle and Ec(r) is the electric field near the center of trap when one of the correction electrodes is at unit potential and all others are grounded. This can be given in terms of the potentials ap- plied to the trap electrodes with symmetric and antisymmet- ric configuration under reflection across the z=0 plane as shown in Fig. 2. Solutions of the Laplace equation near the
Endcap
Contction
Ring
Contction
Endcap
fc=?° t= 5? °
FIG. 2. The sum of the symmetric and antisymmetric configurations of a trap which forms the unit potential at one correction electrode and zero potential at the others. The solutions for the potential near the trap center are given by Eqs. (2.4) and (2.5).
J. Appl. Phys., Vol. 79, No. 1. 1 January 1996
center of the trap can be expanded in Legendre polynomials as5
*""(r)=i,|„ D*( d)Pticos e) {2A)
and
*.«i/(r)=r2 di- P4(cosfl), (2.5)
and Ec( r) can be expressed as
E*(r) = V[*,,Jr)+ *„,,.(!-)]
which to first order can be approximated by
(2.6)
(2.7)
According to Eq. (2.3) the oscillation of a single particle in a Penning trap induces a current
qd\i
2z0 (2.8)
in the correction electrode. If there is a potential difference V across these two correction electrodes the motion of the par- ticle is modified by the electric force induced by this voltage and the induced current is changed. In this case we write the equation of motion of a single particle in the z-direction in a Penning trap as4
z=- qdxV _ F„ 2 1" 1 ' , * ind ■wzz-yz-- + , 2mz0 m
(2.9)
where a>z denotes the harmonic restoring strength given by the trapping field, y is the cooling rate of the motion of the particle, - qdx V72z0 is the electric force due to the potential difference between the two correction electrodes, and in the last term Find is the Coulomb attraction force due to the image charge in the electrodes induced by the trapped par- ticle. This term is negligibly small in the single particle case. From Eqs. (2.8) and (2.9), and by neglecting the last term in Eq. (2.9), we find the dependence of the voltage V on the induced current i, can be written as
dic 1 f dt+rsic, (2.10)
where we define
/.
and
Amzl c, = -
q2d\
q2dV ' 4kzl
4ymz0 rs~ 7,1 ■ q dx
For the many particle case the motion of the CM of a cloud of particles induces a current
/,= nqd{L
2z0
(2.11)
Feng et al.

where Z denotes the coordinates of the CM and n is the number of particles. We can write the equation of motion of the CM in z direction in a Penning trap as
2= — w' Z— y'Z- qdxv
2mzo' (2.12)
where w[ expresses the harmonic restoring strength given by the trapping field modified by the Coulomb attraction force due to the total image charge, y' is the damping rate of the CM motion which includes cooling of the CM motion by transferring the energy of the CM to an external reservoir, and the diffusion of the CM motion which transfers the en- ergy of the CM motion into the internal mode. Within the first order approximation the effect of image charges on the axial CM motion of a cloud of trapped particles can be ex- pressed as a shift of the axial oscillation frequency of that motion. From Eqs. (2.11) and (2.12) the analogous relation to Eq. (2.10) in the case of many particles in the cloud is
dlc 1 f (2.13)
with
/„ = 4mZo _q2d\
'4nkzl
and
Jy'mzl r"~ T7T •
The voltage-current relations given by Eqs. (2.10) and (2.13) mean that the circuit response of a single particle or a cloud of particles in a Penning trap is equivalent to a lscsrs or lnCnrn circuit with a resonant frequency of the oscillation of a single particle or the CM of a cloud of particles, respec- tively.
From this relation we can draw the equivalent electrical representation of the external "tank" circuit formed by a laboratory inductor Lc and the trap parasitic capacitance Ce
coupled to the motion of the CM of a cloud of trapped par- ticles as. in Fig. 3(a), where R presents the resistance of the external "tank" circuit and uR denotes the Johnson noise of this resistor. In Fig. 3(b) we present this circuit in an equiva- lent way to represent the Johnson noise voltage source as a
ui
L. ±C.
<SK>
(a)
<sH>i Uotil
FIG. 3. The equivalent circuit represents an external tank circuit coupled to the motipn of the center of mass of a cloud of ions. The Johnson noise is expressed in (a) and (b) as voltage and current sources respectively.
current source. In this equivalent representation we do not include the Johnson noise of the resistor rn because it is normally much smaller than R and the input noise of the preamplifier is ignored since it only increases the amplitude of the white noise background in this case.
III. CIRCUIT ANALYSIS
The frequency response of the equivalent circuit shown in Fig. 3(b) is described by its impedance
Z(o>) = 1
1 1 1
#■„ +j<oln + (l/jtoc) + R + j^Le + } Ü)C' (3.1)
Using an amplitude-tracking detector, such as a spectrum analyzer, the measured output spectrum of this circuit for a white noise input source is proportional to the amplitude of its impedance. When <az = \I^LeCe, the amplitude of the impedance in Eq. (3.1) can be written as
|Z(< i-V? ?2;2,.,2 R%al( al-<ai)2 + R2rlnw 7TJ-.
^Ä + rJ2 + 4[/n2 + (^V^)-(2/„/?X^)]^2(^-^)2 + (/^2/a,^)(W
2-^)4- (3.2)
Eq. (3.2) indicates that the spectrum consists of one dip at w= wz, since the CM motion of the trapped particles os- cillates in resonance and shunts the external circuit by its equivalent resistance rn, and two peaks. The latter are caused by the resonant peak of the external tank circuit, being shifted by the additional inductance ± 2il„\w - w.|(l + ]/Q2pan,,-i^ due t0 the CM motion of trapped particles.
10 J. Appl. Phys.. Vol. 79, No. 1. 1 January 1996
Here ßpanicic expresses the ratio of the energy deposited in the CM motion to that dissipated due to relaxation into the internal mode and coupling to the external reservoir. We re- call the definition of /„= IJn = (.Amz\lnqld\). From this relationship it is clear that the size of the shift of the RCL parallel resonance peak induced by the trapped particles is related to their number.
Feng et al
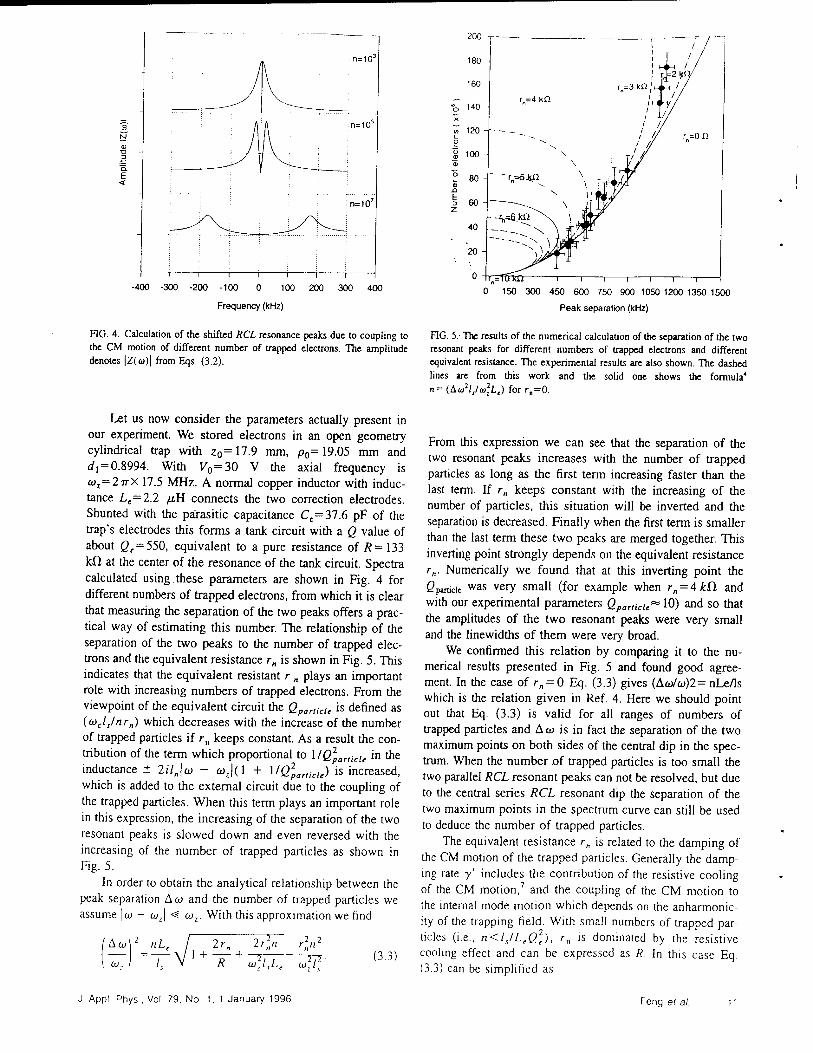
n=10J
n=ia
jn=10'
-400 -300 -200 -100
Frequency (kHz)
-1 1 1
100 200 300 400
FIG. 4. Calculation of the shifted RCL resonance peaks due to coupling to the CM motion of different number of trapped electrons. The amplitude denotes |Z(w)| from Eqs. (3.2).
Let us now consider the parameters actually present in our experiment. We stored electrons in an open geometry cylindrical trap with z0= 17.9 mm, p0= 19.05 mm and dx = 0.8994. With V0=30 V the axial frequency is wz=27rX 17.5 MHz. A normal copper inductor with induc- tance Lc-2.2 fiH connects the two correction electrodes. Shunted with the parasitic capacitance Ce=37.6 pF of the trap's electrodes this forms a tank circuit with a Q value of about ßf = 550, equivalent to a pure resistance of R= 133 kfi at the center of the resonance of the tank circuit. Spectra calculated using these parameters are shown in Fig. 4 for different numbers of trapped electrons, from which it is clear that measuring the separation of the two peaks offers a prac- tical way of estimating this number. The relationship of the separation of the two peaks to the number of trapped elec- trons and the equivalent resistance r„ is shown in Fig. 5. This indicates that the equivalent resistant r „ plays an important role with increasing numbers of trapped electrons. From the viewpoint of the equivalent circuit the Qpar!icU is defined as {(Dcljnrn) which decreases with the increase of the number of trapped particles if rn keeps constant. As a result the con- tribution of the term which proportional to \IQ2
v„rlirl. in the inductance ± 2//J" - --• l'1 -1- ' "">2
^panicle jo) - wj(l + \IQ2
parucU) is increased, which is added to the external circuit due to the coupling of the trapped particles. When this term plays an important role in this expression, the increasing of the separation of the two resonant peaks is slowed down and even reversed with the increasing of the number of trapped particles as shown in Fig. 5.
In order to obtain the analytical relationship between the peak separation Aw and the number of trapped particles we assume | w - wz\ <S coz. With this approximation we find
cu-
rt L,
'17 rW + }LL + 2r"n - ■■ (3.3)
0 150 300 450 600 750 900 1050 1200 1350 1500
Peak separation (kHz)
FIG. 5. The results of the numerical calculation of the separation of the two resonant peaks for different numbers of trapped electrons and different equivalent resistance. The experimental results are also shown. The dashed lines are from this work and the solid one shows the formula'' n= (4a!V«!l.,) forr„=0.
From this expression we can see that the separation of the two resonant peaks increases with the number of trapped particles as long as the first term increasing faster than the last term. If r„ keeps constant with the increasing of the number of particles, this situation will be inverted and the separation is decreased. Finally when the first term is smaller than the last term these two peaks are merged together. This inverting point strongly depends on the equivalent resistance r„. Numerically we found that at this inverting point the ßpaiticie was very small (for example when rn = AkCl and with our experimental parameters Qparticu"" 10) and so that
the amplitudes of the two resonant peaks were very small and the linewidths of them were very broad.
We confirmed this relation by comparing it to the nu- merical results presented in Fig. 5 and found good agree- ment. In the case of r„ = 0 Eq. (3.3) gives (Aw/w)2= nLe/ls which is the relation given in Ref. 4. Here we should point out that Eq. (3.3) is valid for all ranges of numbers of trapped particles and A w is in fact the separation of the two maximum points on both sides of the central dip in the spec- trum. When the number of trapped particles is too small the two parallel RCL resonant peaks can not be resolved, but due to the central series RCL resonant dip the separation of the two maximum points in the spectrum curve can still be used to deduce the number of trapped particles.
The equivalent resistance rn is related to the damping of the CM motion of the trapped particles. Generally the damp- ing rate y' includes the contribution of the resistive cooling of the CM motion,7 and the coupling of the CM motion to the internal mode motion which depends on the anharmonic- ity of the trapping field. With small numbers of trapped par- ticles (i.e., n<lJLeQ
2e), rn is dominated by the resistive
cooling effect and can be expressed as R. In this case Eq. (3.3) can be simplified as
J Appl. Phys . Vol 79, No 1. 1 January 1996 Feng ef a/
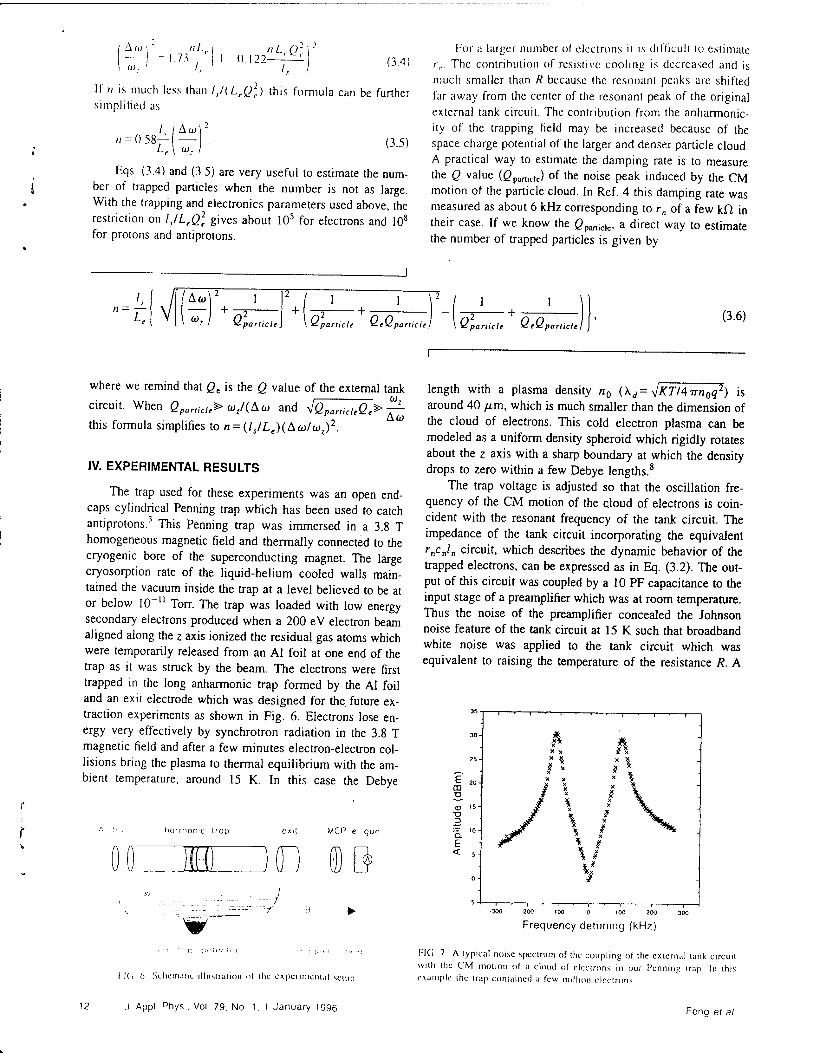
— I (O. '
.73- "!■,■
7~ - 0.122 "L,Q;.
(3.4)
If// is much less than IJ(LeQ2
r) this formula can be further simplified as
/J = 0 58 / |M L, \ üJ
(3.5)
Eqs. (3.4) and (3.5) are very useful to estimate the num- ber of trapped particles when the number is not as large. With the trapping and electronics parameters used above, the restriction on l,/LfQ
2r gives about 105 for electrons and IO8
for protons and antiprotons.
For ;i larger number of electrons it is difficult to estimate /„. The contribution of resistive cooling is decreased and is much smaller than R because the resonant peaks are shifted far away from the center of the resonant peak of the original external tank circuit. The contribution from the anharmonic- ity of the trapping field may be increased because of the space charge potential of the larger and denser particle cloud. A practical way to estimate the damping rate is to measure the Q value (ßpartide) of the noise peak induced by the CM motion of the particle cloud. In Ref. 4 this damping rate was measured as about 6 kHz corresponding to rn of a few kü in their case. If we know the ßpanicle, a direct way to estimate the number of trapped particles is given by
L.
I Hi
Q particle. Q 5 particle QeQ particle Q particle QeQ particle
(3.6)
where we remind that Qc is the Q value of the external tank
circuit. When QparlicU*> wz/(Aw and yjQparlieltQt*> ^-
this formula simplifies to n = (ls/Le)(^(o/toz)2.
IV. EXPERIMENTAL RESULTS
The trap used for these experiments was an open end- caps cylindrical Penning trap which has been used to catch antiprotons.3 This Penning trap was immersed in a 3.8 T homogeneous magnetic field and thermally connected to the cryogenic bore of the superconducting magnet. The large cryosorption rate of the liquid-helium cooled walls main- tained the vacuum inside the trap at a level believed to be at or below ](T" Torr. The trap was loaded with low energy secondary electrons produced when a 200 eV electron beam aligned along the z axis ionized the residual gas atoms which were temporarily released from an Al foil at one end of the trap as it was struck by the beam. The electrons were first trapped in the long anharmonic trap formed by the Al foil and an exit electrode which was designed for the future ex- traction experiments as shown in Fig. 6. Electrons lose en- ergy very effectively by synchrotron radiation in the 3.8 T magnetic field and after a few minutes electron-electron col- lisions bring the plasma to thermal equilibrium with the am- bient temperature, around 15 K. In this case the Debye
h<jf r-iomc t:ap exit MCP e -gu
D 0)B ■:J „
w
length with a plasma density n0 (Xd= JKT/4irn0q2) is around 40 /im, which is much smaller than the dimension of the cloud of electrons. This cold electron plasma can be modeled as a uniform density spheroid which rigidly rotates about the z axis with a sharp boundary at which the density drops to zero within a few Debye lengths.8
The trap voltage is adjusted so that the oscillation fre- quency of the CM motion of the cloud of electrons is coin- cident with the resonant frequency of the tank circuit. The impedance of the tank circuit incorporating the equivalent rncj„ circuit, which describes the dynamic behavior of the trapped electrons, can be expressed as in Eq. (3.2). The out- put of this circuit was coupled by a 10 PF capacitance to the input stage of a preamplifier which was at room temperature. Thus the noise of the preamplifier concealed the Johnson noise feature of the tank circuit at 15 K such that broadband white noise was applied to the tank circuit which was equivalent to raising the temperature of the resistance R. A
35-
30-
i ■ i ■ r—i 1 . 1 . 1 . ,
x* * x x & X
25- * x x X
!: x* \
/ ** i \ a i5- n / X ? \^_ 3 J \ i \ - — 10-
F r \ t < 5- \ $
0 - *» $
7
I l(> (i Schematic illuslrulion ol ihc cxpcrinicnial setup
Frequency detuning (kHz)
f-IG 7 A typical noise .spectrum of the coupling of the external lank circuit with the CM motion of a cloud of electrons in our Penning trap In this example the trap contained a lew million eleclrons
12 J Appl Pfiys . Vol 79. No I. I January 1996 Feng et al

o E
Ü o
<5 01 c o. E
2 4 6 8 10 12 U 16 18 20
Number of electrons (x106)
FIG. 8. The behaviour of the damping rate / for different numbers of trapped electrons. The solid line is fitted by the square root of the number of electrons.
HP8590B spectrum analyzer was used to collect the spectra of this noise.
The number of the stored electrons was controlled by changing the loading time and electron gun current. In the first 10 minutes after loading the separation of the two reso- nant peaks increased and the center of these two peaks shifted from lower frequency to the frequency of the oscilla- tion of the CM motion of the trapped electrons when the density distribution of the electron plasma was concentrating in the central harmonic trap and they coupled to each other due to synchrotron radiation cooling and binary collisions. When the electrons reached thermal equilibrium with the ambient temperature this process stopped and a typical spec- trum is shown in Fig. 7. The separation of the two peaks was measured and soon afterwards the electrons were dumped onto the Al foil and the number derived by measuring the charge accumulated on this foil with a Keithley electrometer. The results are shown, along with the calculation, in Fig. 5. It can be clearly seen that the divergence of the measured num- ber of electrons from the value predicted from the formula
(Aco/oo)2= nLells increases when the number of trapped electrons is large. From the definition of r„ and Eq. (3.3) we get the damping rate y' for different numbers of trapped electrons as shown in Fig. 8. From these data and the analy- sis in the last section we find that the damping rate increases approximately with the square root of the number of elec- trons. The damping rate was also increased when we. pro-
duced ;i much larger electron cloud h> shilling ihe electron gun off" the trap axis. In this case (he unharmomc terms of the trapping field made important contribution to the damping rate y\ With the increase of the size of the electron cloud, the two resonant peaks became smaller and broader and fi- nally could not be resolved by the spectrum analyzer. This phenomenon qualitatively agreed with our analysis in Sec- tion III where we discussed the spectra around the inverting point. The damping rate y' is a direct measurement of the energy transfer rate from the CM motion to the external res- ervoir and the internal motion of trapped particles. More work is needed to study this in detail.
V. CONCLUSIONS
In this paper the coupling of the CM motion of a cloud of particles trapped in a Penning trap to an externally con- nected tank circuit has been studied. Both the number of trapped particles and the damping of their CM motion play an important role in this process. These results give us a way to continuously, non-destructively and passively diagnose the number of trapped particles, which is valid for clouds of any number, and observe some of the dynamic characteristics of the CM motion.
ACKNOWLEDGMENTS
We would like to thank J. Rochet for providing technical support during the construction and operation of the experi- ment and Dr. T. Otto for preparing the experiment in the early stages. X. F. is grateful for financial support from the Danish National Science Foundation. This work was par- tially supported by the US Department of Energy under con- tract W7405 ENG-36 and also by the U.S. Air Force Office of Scientific Research under Grant No. F49620-94-1-0223 (Pennsylvania State University) and Jet Propulsion Labora- tory (U.S. National Aeronautics and Space Administration).
'G. Gabrielse, X. Fei, L. A. Orozco, R. L. Tjoelker. J. Haas, H. Kali- nowsky, T. A. Trainor, and W. Kells, Phys. Rev. Lett. 65, 1317 (1990).
2G. Gabrielse, D. Phillips, W. Quint, H. Kalinowsky, G Rouleau, and W. Jhe, Phys. Rev. Lett. 74, 3544 (1995).
3M. M. Nieto and M. H. Holzscheiter, Appl. Phys. B 60, 103 (1995). 4D. J. Wineland and H. G. Dehmelt, J. Appl. Phys. 46, 919 (1975). 5G. Gabrielse, L. Haarsma, and S. L. Rolston, Int. J. Mass Spectrom. Ion Processes 88. 319 (1989).
6W. J. Shockley, J. Appl. Phys. 9. 635 (1938). 'if we consider the effect of resistive cooling of the CM motion in the z direction of a cloud of particles in a Penning trap as a dissipative force from a voltage between the two correction electrodes due to the induced current of a charged particle of mass nm and charge nq, the resistive cooling rate can be expressed as nd]q2R/4zBm where R is the resistance
in the external circuit. 'See, for example, S. A. Prasad and T. M. O'Neil, Phys. Fluids 22. 278 (1979); T. M. O'Neil and C. F. Driscoll, ibid.. 266 (1979)
J Appl Phys , Vol 79. No I. 1 January 1996 Feng el al 13

VOLUME 74, NUMBER I Appendix VIlI
PHYSICAL REVIEW LETTERS 2 JANUARY 1995
Electromagnetic Implosion of Spherical Liner
J. H. Degnan, F. M. Lehr, J. D. Beason,* G. P. Baca, D. E. Bell, A. L. Chesley, S. K. Coffey,* D. Dietz, D. B. Dunlap,* S. E. Englert, T. J. Englert, D. G. Gale,* J. D. Graham,* J. J. Havranek, C. D. Holmberg, T. W. Hussey, R. A. Lewis,8
C.A. Outten, R.E. Peterkin, Jr., D.W. Price, N.F. Roderick, E.L. Ruden, U. Shumlak, G.A. Smith,8 and P.J. Turchi High Energy Plasma Division, Phillips Laboratory, Kirtland Air Force Base, New Mexico 87117-5776
(Received 12 April 1994)
We have magnetically driven a tapered-thickness spherical aluminum shell implosion with a 12.5 MA axial discharge. The initially 4 cm radius, 0.1 to 0.2 cm thick, ±45* latitude shell was imploded along conical electrodes. The implosion time was approximately 15 jtsec. Radiography indicated substantial agreement with 2D-MHD calculations. Such calculations for this experiment predict final inner-surface implosion velocity of 2.5 to 3 cm/fistc, peak pressure of 56 Mbar, and peak density of 16.8 g/cm' (>6 times solid density). The principal experimental result is a demonstration of the feasibility of electromagnetic-driven spherical liner implosions in the cm//*sec regime.
PACS numbers: 52.55.Ez, 52.50.Lp
A crucial problem in the creation of high energy density matter is spherically symmetric implosions. Laser techniques become quite expensive at high total energy in the compressed matter. Electromagnetic implosions, on the other hand, require close control of solid state mechanics at high magnetic field values.
Fast solid density shell implosions, particularly in spherical geometry, may be used to obtain physical regimes of 10 to 100 Mbar pressures with 1 to 10 g masses in the laboratory. Such regimes can be useful for studies of equation of state of materials and for applications including magnetized target fusion [1]. We have previously worked on electromagnetically driven solid density shell implosions in cylindri- cal and conical geometry [2,3]. These experiments agreed well with two-dimensional magnetohydrodynamic (2D-MHD) calculations—which predicted aluminum liner compressions to 10 Mbar, 3x solid density. We now report on such an experiment in spherical geometry. The experimental results may be useful for comparison with three-dimensional instability theory.
Previous related work by others in cylindrical geome-' try included that by Alikhanov et al. [4], Eskov et al. [5], Petrukhin et al. [6], Chemyshev et al. [7], Turchi et al. [8], and Sherwood et al. [9]. The deformation of elec- tromagnetically driven cylindrical shells into spheroidal shells has been discussed by Goloviznin et al. [10] and by Chemyshev et al. [11]. Mokhov discussed 2D-MHD cal- culations of a spheroidal shell liner driven by an explosive magnetic flux compression generator discharge. Its shape deformed to spherical during the implosion [12]. His pub- lication also showed corroborating radiography from a re- duced energy scaled experiment [12]. This achieved a 2 km/sec velocity inferred from comparison of radiogra- phy and calculations.
In the work reported here, we used a 12.5 MA, 4.8 MJ capacitor discharge, with current flowing in the polar di- rection through a spherical aluminum shell between con- ical electrodes, as illustrated in Fig. I. This is the first
direct electromagnetically driven spherical liner implo- sion in the velocity range » 2 km/sec. Radiography in- dicates s7 km/sec of the inner surface at 1 /isec prior to peak compression. 2D-MHD calculations indicate that the liner's peak velocity exceeded 6 km/sec (depth aver- age). The peak inner surface velocity predicted by those calculations is 25 km/sec. The result reported here is also the first example of an electromagnetically imploded liner with an initially spherical shape. The outer surface of the ±45° shell is spherical, with 4.0 cm radius. The thickness is proportional to the cosecant squared of the polar angle as measured from* the symmetry axis of the electrodes (colatitude). The thickness at the "equator" is 0.10 cm. Deviation of the actual shell thickness from the intended thickness vs polar angle was s5%. The mass was 49 g. The outer surface was polished to a mirror finish. This polar angle variation of thickness causes the ratio of magnetic pressure to shell areal mass density to be independent of polar angle, assuming no polar mass flow. Ideally, this enables the spherical shape to be main- tained during the implosion.
To compensate for shell-electrode contact effects, the conical electrodes are overconverged by 3* each. That is, while the zero order design has 45° conical electrodes (whose projected vertices coincide at the origin of the electrode cylindrical coordinate system), the actual design has 42* (with respect to axis) conical electrodes. Their vertices project beyond the midplane from the respective
V-proba
CIRCUIT LOAD
FIG. I. Circuit diagram and load schematic.
98 ()03l-9()()7/95/74(!)/98(4)$06.00 © 1994 The American Physical Society

VOLUME 74, NUMBER I PHYSICAL REVIEW LETTERS 2 JANUARY 1995
electrodes. These electrodes are truncated at an axial distance of I cm from each other (0.5 cm from the origin).
The 1300/zF, 120 W, 9.4 MJ Shiva Star capacitor bank was used to drive the implosion discharge. The charge voltage and energy were 86 kV and 4.8 MJ. The initial inductance up to the outer surface of the spheri- cal shell was 39 nH. Of this, 33 nH is in a very con- servative design vacuum transmission line. This vacuum transmission line inductance can, in principle, be sub- stantially reduced, enabling higher current, faster implo- sions. The series resistance was approximately 1 mil plus the resistance of a safety fuse [2,3]. This 94 cm long, 2.125 cm2 cross section aluminum thermister/fuse limits peak discharge current and reversal in the event of an insulator or current feed failure. It has a small but non-negligible effect on a normal discharge. Its resistance during the time of interest ranges from 0.12 to -0.5 mft. The peak discharge current, measured by integrated in- ductive Rogowski and azimuthal magnetic probes, is 12.5 ± 0.5 MA. The current rise time is 9 /zsec. The az- imuthal magnetic probes indicated full current delivery in the vacuum section of the transmission line for 16 /zsec into the discharge. The vacuum chamber pressure was ~10~6 Torr prior to the discharge.
The principal experimental diagnostic was pulsed ra- diography, taken with. 300 kV, 5 kA, and 30 nsec pulse driven xrray tubes. The tubes have tungsten anodes (9.13° or 14.25° conical tips), carbon felt cathodes, and 3 mm anode-cathode coaxial gaps. They are normally damaged in such experiments, but readily refurbished. Only cylin- drical radial views were used. The source to axis distance is 31.3 cm. The axis to film distance is 37.5 cm. The diagnostic x rays pass through a 0.64 cm thick, 10 cm ra- dius cylindrical outer current conductor and through film pack shielding as well as through the spherical shell. The film pack shielding consists of 0.64 cm aluminum, 3.8 cm polyethylene, and 3.8 cm of low density foam. The film is DuPont NDT 57, with NDT 9 front and back screens. There were three x-ray tubes and film packs used on this experiment. Two were fired at 12.7 /zsec and one at 14 /zsec into the discharge. Collimation shielding and setup shots eliminated possible crosstalk complications. The earlier radiographs, taken with views 60* apart in az- imuth, showed essentially identical images. X-ray pulser timing was confirmed using silicon p-i-n x-ray detectors.
Radiographs of the implosion taken at / = 0, 12.7, and 14 /zsec into the discharge are shown in Figs. 2 and 3. Also shown are 2D-MHD calculated contours of the inner and outer liner surface. This same calculation was used to generate synthetic radiographs for qualitative comparison with experimental ones. There is good agreement on the experimental and calculated shapes, locations, and timing.
The radiographs show some evidence of short (~mm) and long (~cm) wavelength nonuniformities. These do not appear to threaten the integrity of the imploding shell. These nonuniformities may be Rayleigh-Taylor instabilities of liquid and plastic portions of the liner.
Radiographs Experimental Synthetic
Surface Contours
FIG. 2. Radiographs (at /I, /2, /3 = 0, 12.7, 14 /zsec), 2D- MHD (at 12, /3 «= 12.7, 14 /zsec) comparison.
They will be discussed at greater length in a separate paper, for both cylindrical and spherical geometry. The 12.7 /*sec radiographs (one shown here) were taken with the sharper 9.13° anode x-ray tubes, which are higher resolution. This may be why the shorter wavelength nonuniformities are more evident than on the 14 /zsec radiograph.
The 2D-MHD calculations were done using the CALE code [13,14]. We used version 930313 of this code, with the Steinberg-Guynan elastic-plastic strength model and a 4-phase equation of state for aluminum. We ran this arbitrary Lagrangian-Eulerian (ALE) code in Eulerian mode for —1300 cycles, with 25 axial x 75 radial zones.
The 2D-MHD calculated synthetic radiographs assume 300 keV monoenergetic x rays and linear film response. The displayed intensities are proportional to chordal path integrals of density times opacity. They may be a more useful comparison to the experimental radiographs than the surface or density contour plots, at least until more complete analysis of the experimental radiographs is accomplished. It should be noted that the experimental radiographs are obtained with a distributed rather than a monoenergetic x-ray spectrum and with nonlinear rather than linear film response. Thus, one expects the synthetic
FIG. 3. Blowup of t = 14 /zsec experimental (left) and syn- thetic (right) radiographs.
99

VOLUME 74, NUMBER I PHYSICAL REVIEW LETTERS - JANUARY 1 y95
radiographs to be an inexact but useful simulation of the experimental radiographs. Good quantitative agreement on shape and symmetry and qualitative agreement on density distribution between synthetic and experimental radiographs are evident.
There is no substantial deviation of the shape of the outer liner surface from spherical either observed or calculated until late in the implosion (/ > 12.7 /tsec, r < 2.3 cm). The deviation from spherical shape of the outer surface that then occurs is initially consistent with an approximately incompressible liner material. The liner parameters were chosen so that resistive heating would not cause bulk vaporization prior to the liner reaching the axis. Thus, the bulk of the liner material should be solid (albeit plastically deformed) or liquid prior to self-stagnation. If the liner were incompressible and there were no polar mass flow, the outer surface would not implode to a radius less than 1.67 cm at the "equator," nor to a radius less than 2.1 cm at the electrode polar angle. That is, in this approximation, r\ - r\ = K0 csc2c£, where K0 = rh\ - rf0, and r2o,r\0
are the initial outer and inner radii at the equator. The radius of the liner can be estimated from the
circuit inductance. In a low impedance discharge such as this, Lp vs / is obtained from the experimental current / and voltage Vp vs t. Vp is the voltage measured at the (capacitive) voltage probe location, 33.9 nH from the initial liner outer surface position (cf. Fig. 1). We assume that the initial voltage at this position is the inductance ratio (33.9/39) times the charge voltage (86 kV), that is, 75 kV. (Lp is initially 33.9 nH.) The resistance past the voltage probe, R2, is approximately 0.6 mCl and assumed constant. This assumption may be incorrect by ~0.1 mH over the time of interest, standard way:
h-T f (Vp- IR2)dt. (1) ' Jo
For self-similar implosion geometry (i.e., electrodes not overconverged), the current radius rc vs t is related to Lp
vs / by
Lp vs t is then obtained in the
ALP = LP -p0
IdA
\2ir)Jrr J+m rsin<f>
— (ro rc), (2)
where <f>m is the (colatitude) polar angle of the electrode, 0) is the initial outer (spherical) current radius (presum- ably equal to initial outer liner radius), and fi0 is the magnetic permeability = 4w x 10"7 H/m. The geom- etry factor g = 0.881 when 4>m = 45°. The relation is slightly more complicated for overconverged electrodes.
100
In principle, this analysis gives the current radius vs time. In practice, the errors can be large, with uncertainty in R2 the major source of error. A reasonable value of R2
(0.6 mfl) gives reasonable rc vs t. Equation (2) is also used to calculate the increasing load inductance (and its derivative dL/dt) in the modeling of the capacitor dis- charge driving the implosion. In this use, the total series resistance matters, but the calculation is not sensitive to the relative portion of the total resistance past the volt- age probe. A comparison of the experimental (spherical) current radius vs time with the 2D-MHD calculated inner and outer liner (spherical) radius r vs time / is shown in Fig. 4. Since the shape deviates from spherical once the incompressible limiting radius at the electrode polar angle is reached, the calculated r vs t is shown for a given po- lar angle (<f> = 90* equator). This current radius should correspond more to the outer liner radius than to the in- ner radius, and this is evident in Fig. 4. In the limit of full diffusion of the current throughout the liner thickness, the current radius would correspond to the mean liner ra- dius. 2D-MHD calculations indicate that this current is predominantly limited to the outer 20% of the liner thick- ness. The more reliable radiography data points are also shown on this plot.
The degree of agreement between experimental and 2D-MHD calculated results encourages us to extend the 2D-MHD predictions through peak compression. Some principal results for a calculation for this experiment are shown in Fig. 5. These indicate that a large portion of the liner mass is compressed to greater than twice solid density, and on the order of 10~2 g is compressed to ~6x solid density, 56 Mbar. The predicted inner surface implosion velocity reaches 2.5 to 3 cm//xsec at a radius of 0.2 cm. The predicted peak implosion kinetic energy is~l MJ.
Similar calculations with less conservative electrodes (not overconverged) indicate more distortion of the liner near the electrode, but not enough to cause liner-electrode
4.5
4
3.5
■o oc
^ 3 E Ä 2.5
2
1.5
1
0.5
0
.. — Calculated r-inner — Calculated r-outer
• Inductance r-data .. A Radiograph r-inner
v Radiograph r-outer
—i 1 i. I i 1 i 1 i—i—i—i—i—)—i— 0 2 4 6 6 10 12 14 16
Time (usec)
FIG. 4. Calculated, experimental r vs /. Error bars are for ±0.1 mfl tolerance on series resistance Rj past voltage probe.
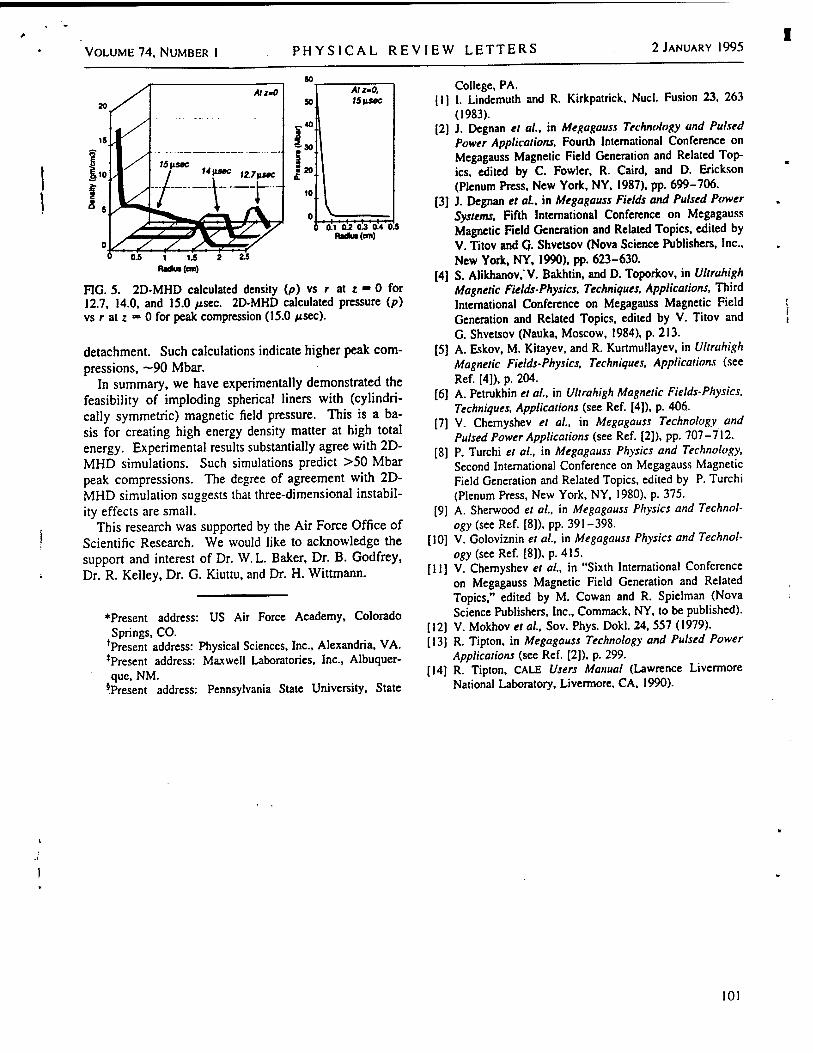
VOLUME 74, NUMBER I PHYSICAL REVIEW LETTERS 2 JANUARY 1995
11 0.1 0.2 0J 0.4 0.5 Radka(cm)
FIG. 5. 2D-MHD calculated density (p) vs r at z - 0 for 12.7, 14.0, and 15.0 /isec. 2D-MHD calculated pressure (p) vs r at z = 0 for peak compression (15.0 jtsec).
detachment. Such calculations indicate higher peak com- pressions, ~90 Mbar.
In summary, we have experimentally demonstrated the feasibility of imploding spherical liners with (cylindri- cally symmetric) magnetic field pressure. This is a ba- sis for creating high energy density matter at high total energy. Experimental results substantially agree with 2D- MHD simulations. Such simulations predict >50 Mbar peak compressions. The degree of agreement with 2D- MHD simulation suggests that three-dimensional instabil- ity effects are small.
This research was supported by the Air Force Office of Scientific Research. We would like to acknowledge the support and interest of Dr. W. L. Baker, Dr. B. Godfrey, Dr. R. Kelley, Dr. G. Kiuttu, and Dr. H. Wittmann.
»Present address: US Air Force Academy, Colorado Springs, CO.
+Present address: Physical Sciences, Inc., Alexandria, VA. ^Present address: Maxwell Laboratories, Inc., Albuquer- que, NM.
5Present address: Pennsylvania State University, State
College, PA. [III. Lindemuth and R. Kirkpatrick, Nucl. Fusion 23, 263
(1983). [2) J. Degnan et al, in Megagauss Technology and Pulsed
Power Applications, Fourth International Conference on Megagauss Magnetic Field Generation and Related Top- ics, edited by C. Fowler, R. Caird, and D. Erickson (Plenum Press. New York, NY, 1987). pp. 699-706.
[3] J. Degnan et al, in Megagauss Fields and Pulsed Power Systems, Fifth International Conference on Megagauss Magnetic Field Generation and Related Topics, edited by V. Titov and G- Shvetsov (Nova Science Publishers, Inc., New York, NY, 1990), pp. 623-630.
[4] S. Alikhanov.'V. Bakhtin, and D. Toporkov, in Ultrahigh Magnetic Fields-Physics, Techniques. Applications, Third International Conference on Megagauss Magnetic Field Generation and Related Topics, edited by V. Titov and G. Shvetsov (Nauka, Moscow, 1984), p. 213.
[5] A. Eskov, M. Kitayev, and R. Kurtmullayev, in Ultrahigh Magnetic Fields-Physics, Techniques, Applications (see Ref. [4]), p. 204.
[6] A. Petrukhin et al, in Ultrahigh Magnetic Fields-Physics, Techniques, Applications (see Ref. [4]), p. 406.
[7] V. Chemyshev et al, in Megagauss Technology and Pulsed Power Applications (see Ref. [2]), pp. 707-712.
[8] P. Turchi et al, in Megagauss Physics and Technology, Second International Conference on Megagauss Magnetic Field Generation and Related Topics, edited by P. Turchi (Plenum Press, New York, NY, 1980), p. 375.
[9] A. Sherwood et al, in Megagauss Physics and Technol- ogy (see Ref. [8]). pp.391-398.
[10] V. Goloviznin et al, in Megagauss Physics and Technol- ogy (see Ref. [8]), p. 415.
[11] V. Chemyshev et al, in "Sixth International Conference on Megagauss Magnetic Field Generation and Related Topics," edited by M. Cowan and R. Spielman (Nova Science Publishers, Inc., Commack, NY, to be published).
[12] V. Mokhov et al, Sov. Phys. Dokl. 24, 557 (1979). [13] R. Tipton, in Megagauss Technology and Pulsed Power
Applications (see Ref. [2]), p. 299. [14] R. Tipton, CALE Users Manual (Lawrence Livermore
National Laboratory, Livermore, CA, 1990).
101

PENNSTATE PtTrt-w** ix.
m INTEROFFICE CORRESPONDENCE
Intellectual Property Office 113 Technology Center
Date:
From:
May 16,1996
D.R. Patersq^tf^
y To: G.A. Smith
Subject: "Portable Antiproton R adioisotope Generator (PARG)M
By G.A. Smith PSU Invention Disclosure No. 96-1604
This memorandum is to formally acknowledge receipt of the subject invention disclosure. The disclosure is assigned file number 96-1604. To avoid confusion with future invention disclosures you may submit to our office, please use this number in future communications. We forwarded the original Invention Disclosure form to R.C. Meyer for signature.
According to the information contained in the disclosure, a manuscript was published in Hyperfine Interactions in 1993, and a presentation is scheduled for June 16-20, 1996 at the 1996 Annual Meeting of the American Nuclear Society. If the material published/presented is enabling (i.e. could a person skilled in the art duplicate the invention based on the material you presented/submitted), please consult with me before presenting the information and we can determine how the information relates directly to the subject invention. As you are aware, the ability to obtain patent rights and to maximize the commercial potential of the invention may be compromised by publication or public disclosure.
It is noted that the invention was made with sponsorship from AFOSR Grant No. F49620-94-1-0223 and JPL Contract No. 958301.
Please contact us if you have any questions related to this invention or other matters relating to intellectual property.
DRP/clw
c: RC. Meyer