Embed Size (px)
Citation preview
An Evaluation of Data from Drivers Arrested for Driving Under the Influence in Relation to Per se Limits for CannabisMay 2016
607 14th Street, NW, Suite 201 | Washington, DC 20005 | AAAFoundation.org | 202-638-5944
Saving lives through research and education
Title
An Evaluation of Data from Drivers Arrested for Driving Under the Influence in Relation to Per se Limits for Cannabis. (May 2016)
Authors
Barry Logan, Ph.D., F-ABFT1, Sherri L. Kacinko, Ph.D., F-ABFT1, Douglas J. Beirness, Ph.D.2
1Center for Forensic Science Research and Education 2Beirness and Associates, Inc. About the Sponsor
AAA Foundation for Traffic Safety 607 14th Street, NW, Suite 201 Washington, DC 20005 202-638-5944 www.aaafoundation.org Founded in 1947, the AAA Foundation in Washington, D.C. is a not-for-profit, publicly supported charitable research and education organization dedicated to saving lives by preventing traffic crashes and reducing injuries when crashes occur. Funding for this report was provided by voluntary contributions from AAA/CAA and their affiliated motor clubs, from individual members, from AAA-affiliated insurance companies, as well as from other organizations or sources. This publication is distributed by the AAA Foundation for Traffic Safety at no charge, as a public service. It may not be resold or used for commercial purposes without the explicit permission of the Foundation. It may, however, be copied in whole or in part and distributed for free via any medium, provided the AAA Foundation is given appropriate credit as the source of the material. The AAA Foundation for Traffic Safety assumes no liability for the use or misuse of any information, opinions, findings, conclusions, or recommendations contained in this report.
If trade or manufacturer’s names are mentioned, it is only because they are considered essential to the object of this report and their mention should not be construed as an endorsement. The AAA Foundation for Traffic Safety does not endorse products or manufacturers.
©2016, AAA Foundation for Traffic Safety
Executive Summary
Cannabis is in the spotlight in the United States due to increased levels of acceptance of its use for medical treatment, and for recreational use. Increasingly, states are proposing changes to their laws through legislative action or voter initiative to decriminalize and legalize its use. One of the major concerns shared by both opponents and proponents of greater access to cannabis is its impact on driver performance and relationship to adverse effects on traffic safety. While the exact relationship between cannabis use and increased risk for crash involvement remains unclear, both sides recognize that the cognitive and psychomotor effects of cannabis use in the period immediately after use can impact vehicle control and judgment and present some risk for deterioration in driving performance. These concerns have led to a strong desire among lawmakers and traffic safety advocates to consider laws that criminalize cannabis-involved driving including laws that set a quantitative threshold for concentration of delta-9-tetrahydrocannabinol (THC), the primary active component of cannabis, in a person’s blood. This threshold would constitute an offense per se in an effort to discourage cannabis-impaired driving. What that threshold should be is a subject of much debate, and this study was undertaken to determine whether data from the Drug Recognition Expert (DRE) program consisting of physiological indicators of drug use, and performance in roadside cognitive and psychomotor tests, supported any particular quantitative threshold for a per se law for THC.
Data from two sources were evaluated: 602 drivers arrested for impaired driving in which only THC was present, along with a sample of 349 drug-free controls, in which full records of the subjects’ performance in the DRE exam were available; and 4,799 drivers arrested for impaired driving who tested positive for one or more cannabinoids (THC, hydroxy-THC, and carboxy-THC), and for which demographic information and comprehensive toxicology testing results were available.
DRE Data
Evaluation of indicators from the DRE arrestees compared to drug free controls indicated poorer performance in the psychophysical tests for impairment (walk-and-turn test, one-leg-stand test, and finger-to-nose test). On the walk-and-turn test, 55.5 percent of drug free subjects were able to complete the test without errors while only 6.0 percent of the cannabis-positive subjects were able to do so. In the one-leg-stand test, 67.2 percent of drug-free subjects were able to complete the test with no errors, while only 24 percent of the cannabis-positive drivers were able to do so. On the finger-to-nose test 49.2 percent of the drug-free subjects performed the test without errors, compared to only 5.2 percent of the cannabis-positive subjects. Indicators of red, bloodshot and watery eyes, eyelid tremor, lack of convergence and rebound dilation all showed significantly greater (p<0.001) incidence in the cannabis-positive subjects. Cannabis-positive subjects were also more likely to have higher systolic blood pressure and higher pulse rates.
Having established differences in these parameters between cannabis-positive and negative subjects, we evaluated the relationship between blood THC concentration and performance on tests for impairment. We performed a bivariate correlation analysis of the indicators as a function of blood THC concentration. Neither the walk-and-turn, nor one-leg-stand tests showed increasing rates of error as a function of THC concentration across the range 1 to 47
1
ng/mL. Only the finger-to-nose test showed that subjects with higher THC concentrations made a greater number of misses than the subjects with lower THC concentrations.
A chi-squared analysis of the same data was conducted considering whether indicators of impairment differed between subjects with blood THC concentrations above or below 5 ng/mL, the threshold for per se driving under the influence of cannabis adopted in Colorado, Washington, and Montana. No differences were found in performance in the walk-and-turn, or one-leg-stand tests, according to whether subjects were in the higher (>5 ng/mL), or lower (<5 ng/mL) THC groups. The number of misses on the finger-to-nose test was higher in the elevated THC group.
We evaluated through logistic regression analysis whether the physiological, cognitive and psychomotor indicators from the DRE exam could predict THC concentration above or below a 5 ng/mL threshold and they could not. Additionally, assuming the validity of a 5 ng/mL threshold as defining impaired versus non-impaired subjects, we evaluated whether performance on any of the physiological, cognitive or psychomotor indicators correctly assigned the subject to the impaired or non-impaired group. None of the indicators met the 80 percent sensitivity threshold for correctly predicting impairment status.
Analysis of the sensitivity, specificity, and accuracy of various THC concentration threshold suggested the concentration threshold associated with the best sensitivity (80.4%) and accuracy (77.0%) was 1 ng/mL, which also had the lowest specificity (70.2%). Higher THC concentration values reduced sensitivity but increased specificity.
DUI Arrests
The distribution of THC concentrations in this large arrest population (4,799 subjects), indicated a median THC concentration of 4.0 ng/mL, which was telling in itself indicating that 50 percent of these subjects placed under arrest based on evidence of suspected impaired driving had blood THC concentrations of 4.0 ng/mL or below, significantly below the proposed or enacted THC per se threshold in some states. The population showed considerable combined alcohol and other drug and cannabis use, with only 23 percent of these DUI drivers being positive only for cannabinoids. Alcohol was present in 59 percent, and other drugs in 33 percent, of these cannabinoid-positive subjects. Of the subjects positive only for cannabis (N=1,117), the median THC concentration was 7.8 ng/mL, and the mean was 5.6 ng/mL. Applying different proposed per se thresholds to this group of drivers positive only for cannabis, 49 percent of drivers would be 5 ng/mL or greater, while 79 percent would be 2 ng/mL or greater, and 91 percent would be 1 ng/mL or greater. Considering the larger population of all subjects arrested for DUI with evidence of cannabis use, only 30 percent would have THC concentrations above a 5 ng/mL threshold.
Conclusions
There is no evidence from the data collected, particularly from the subjects assessed through the DRE exam, that any objective threshold exists that established impairment, based on THC concentrations measured in specimens collected from cannabis-positive subjects placed under arrest for impaired driving. An association between the presence and degree of indicators of impairment or effect from cannabis use were evident when comparing data from cannabis-positive and cannabis-negative subjects. However, when examining differences in performance in these parameters between subjects with high (>5
2
ng/mL) and low (<5 ng/mL) THC concentrations, minimal differences were found. There was no correlation between blood THC concentration and scores on the individual indicators, and performance on the indicators could not reliably assign a subject to the high or low blood THC categories. Analysis of the sensitivity, specificity, and accuracy of various per se thresholds suggested the highest sensitivity was found at 1 ng/mL: 80 percent of drivers who demonstrated impairment on the SFST had THC concentrations of 1 ng/mL or greater. However, 30 percent of drivers who did not demonstrate impairment on the SFST also had THC concentrations of 1 ng/mL or greater. Finally, among both samples of drivers who came into contact with law enforcement and were subsequently placed under arrest for DUI, only 30-49 percent would have been considered impaired under a per se standard set at 5 ng/mL, depending on whether alcohol or other drugs are detected and taken into consideration.
Based on this analysis, a quantitative threshold for per se laws for THC following cannabis use cannot be scientifically supported.
3
Introduction Objective The objective of this study was to assess available data from law enforcement agencies regarding their observations of behavioral clues related to cannabis use, and whether there was any correlation between the results of a subsequent quantitative chemical test of the individual’s blood specimen, and the presence and degree of the observed effects. Ultimately the goal of the assessment was to determine if the data supported a concentration of delta-9-tetrahydrocannabinol (THC, the primary active component in the cannabis plant) at which observed impairment becomes more likely. The justification for performing the assessment is the increased interest among traffic safety professionals, forensic toxicologists and legislators regarding the relationship between THC concentration, impairment and crash involvement and how it impacts enforcement practices, expert testimony, and legislation designed to prevent or reduce cannabis-impaired driving. Background Cannabis is a very popular recreational drug, second only to ethanol in its self-reported frequency of use in the United States [1]. It is also the second most frequently encountered drug after alcohol in various driving populations, including randomly surveyed drivers, arrested drivers, trauma patients, and fatally injured drivers [2]–[4].
Marijuana is the dried flowers and leaves of the plant cannabis sativa and other related strains, and is typically smoked or vaporized for its psychoactive effects. The plant material itself, or extracts from it, can be concentrated in the form of resin or oil which can also be ingested orally either directly or after being processed into various edible products, including brownies, or candy. We refer in this report to cannabis to mean all products, including plant material, oils, waxes, edibles, and plant extracts derived from the cannabis plant.
THC is the major psychoactive component in the cannabis plant. Once ingested, whether through the oral or smoked route, it is distributed through the blood and eventually to the brain, where it exerts its psychoactive effects. THC is a highly lipophilic compound and concentrates readily in fatty tissues including the brain. The body metabolizes or breaks down THC into two principle metabolites; 11-hydroxy-THC (hydroxy-THC) and 11-carboxy-THC (carboxy-THC). The former compound, formed principally in the liver, has psychoactive effects equal to or greater than THC, due to its increased ability to cross the blood-brain barrier. Carboxy-THC is an inactive metabolite [5].
Access to cannabis for medical or recreational purposes has become an increasingly contentious issue throughout North America. Although at the Federal level in the United States, the production, possession, sale and distribution of cannabis is illegal and subject to strict controls and sanctions, its use has become extremely widespread and even “normalized” in certain segments of the population. Many, particularly youth, view cannabis as a “safe” substance and a “natural” medicine used to treat disease and/or relieve the symptoms of a wide variety of medical conditions [6]. As of November 2015, many jurisdictions, including 23 US states and the District of Columbia, have approved the
4
possession and use of cannabis for medical purposes1, and four states (Washington, Colorado, Alaska and Oregon) and the District of Columbia have passed laws or voter initiatives legalizing the possession of small amounts of cannabis for personal use. This situation has created confusion and controversy about the status and safety of cannabis, including its use in relation to driving.
There is evidence that cannabis use may be increasing in the driving population. The 2007 National Roadside Survey reported 4.5 and 8.6 percent of daytime and nighttime drivers, respectively, tested positive for cannabis [4]. The 2013-2014 survey indicated an increase in nighttime drivers testing positive (12.6%) [7].
Currently, laws governing the use of a motor vehicle following the use of cannabis fall into one of three categories: 1) effect-based laws, 2) per se driving under the influence of drugs (DUID) laws and 3) “zero tolerance” laws. Effect-based laws require evidence of impairment to be presented in order to convict someone of driving under the influence. Under per se laws, a person is assumed to have committed a violation if the drug concentration exceeds a defined concentration (typically in the blood) and there is no requirement to obtain evidence of impairment beyond that required for the probable cause to obtain the specimen. Under zero tolerance laws, any detectable amount of the proscribed substance in the blood constitutes the offense.
From a legislative point of view, per se or zero tolerance laws have some appeal, as they send a message that there is a public safety concern about the practice of drug use and driving, and set an objective standard for what constitutes the offense. This approach potentially makes disposition of cases through the legal system more efficient, since the more qualitative consideration of whether a subject appears impaired is replaced by a numerical cut-off or threshold. The approach however creates other obstacles, such as greater litigation over the laboratory uncertainty or error in making the THC measurement, and the requirement for additional technical or expert testimony at trial. Critically, it also means that a numerical threshold has to be established in the law, and there is by no means consensus among the forensic toxicology, behavioral pharmacology, medical cannabis lobby, and legalization advocates on what the appropriate numerical threshold should be, which compounds should be proscribed under the law, or even which types of specimens (blood, urine or oral fluid) should be permitted. As discussed later, there is no generally agreed upon threshold concentration of THC, as measured at the time of the test which reflects a person’s degree of impairment at the time of driving. Setting the threshold too high means that many intoxicated individuals who are arrested, evaluated, and chemically tested end up with drug concentrations below the per se threshold. Setting the threshold too low creates the risk that individuals with a history of regular cannabis use could have THC concentrations in excess of the per se standard, even when they have not recently consumed cannabis.
In the case of decriminalization or legalization of cannabis use, a desire to address the potential for driving impairment has led to proposals or adoption of laws with non-evidence-based numerical thresholds ranging from 1 ng/mL to as high as 25 ng/mL in different body fluids.
1Theissueofthemedicalbenefitsofmarijuanafortreatingvariousconditionsfromseizuresandneuropathicpain,todepressionisitselfcontentiousandisnotthesubjectofthisreview.
5
The alternative to per se thresholds is the use of an impairment standard, where a person’s guilt or innocence is determined by the judge or jury, based on observations of signs and symptoms of being under the influence of a drug. In the United States and Canada, suspected drug-impaired drivers may be assessed using the Drug Evaluation and Classification (DEC) Program. The DEC program is supported by the National Highway Traffic Safety Administration (NHTSA) and coordinated by the Highway Safety Committee of the International Association of Chiefs of Police (IACP). In 1992, a set of minimum standards were adopted specifying the requirement for certification and re-certification of DREs and DRE instructors, standards for decertification and reinstatement of DREs, and standards for agency participation [8]. A technical advisory panel meets regularly to examine potential improvements to techniques and procedures.
As more states and local jurisdictions move towards expanded medical use cannabis, and decriminalization or legalization of recreational cannabis use, there is a need for better information about the relationship between cannabis use and its effects on driving, assessment of approaches for recognizing cannabis-related impairment in drivers, and determining whether there is a scientific basis for per se laws regarding thresholds above which driving is criminalized.
Reviews of laboratory-based research, driving simulator studies and on-road driving models show that cannabis has the potential to produce adverse effects on driving; however, outcomes-based on studies of crash risk have reported mixed results based on the models and the quality of the data used [9]. For example, two recent systematic reviews came to different conclusions about the risk of crash risk associated with cannabis use [10], [11]. Asbridge et al. concluded that acute cannabis consumption is associated with increased risk of serious injury or fatal motor vehicle crash, while Elvik et al. found an increased risk of non-injury crash. Furthermore, while Elvik et al. noted there was a tendency for the estimated effects of drug use on accident risk to be smaller in well-controlled studies than in poorly controlled studies, Asbridge et al. noted greater risk estimates for higher quality studies. A study by NHTSA, completed after the publication of the systematic reviews cited previously, estimated that drivers who tested positive for THC had slightly higher crash risk than cannabis-negative drivers (odds ratio 1.25, p=0.01), but that adjustment for demographic characteristics associated with both cannabis use and crash involvement reduced the adjusted odds ratio to 1.01 (p=0.65), thus providing no evidence of a causal relationship between having detectable levels of THC and risk of crash involvement [12].
The purpose of this assessment was to examine a population of drivers placed under arrest for impaired driving, and to identify whether indicators of impairment or physiological indicators of recent drug use were correlated with the measured THC concentrations in subsequently collected blood specimens. Ultimately, the goal was to determine whether data supports existing or proposed illegal per se limits for cannabis. An additional goal was to use the data to determine what an appropriate per se limit might be, and discuss how it could be implemented and enforced.
6
Methods
Data Sources
The project examined existing data on the blood THC and metabolite concentrations among two study populations:
Study Population 1 (Arrested Drivers with DRE assessments)
These were drivers arrested for suspected drug-impaired driving and subjected to a DRE assessment including an assessment of clinical indicators and behavioral tests, and for which THC was the only drug detected in blood. As described below, this pool also contains data from a group of individuals who were free of drugs;
Study Population 2 (Arrested Drivers without DRE assessments)
These were drivers arrested for DUI, and subjected to comprehensive drug and alcohol testing who subsequently tested positive for cannabinoids, but for whom there were no DRE field sobriety test or performance data provided;
Study Population 1 - Impaired Drivers with DRE Assessments Drivers who have been arrested for drug-impaired driving may be subject to an evaluation conducted by a specially trained and certified Drug Recognition Expert (DRE) officer using the protocol defined in the Drug Evaluation and Classification (DEC) Program. The DEC program is a systematic and standardized 12-step procedure in which DREs recognize, evaluate, and document behaviors and physiological indicators associated with seven drug categories: central nervous system (CNS) depressants; inhalants; dissociative anesthetics; cannabis; CNS stimulants; hallucinogens; and narcotic analgesics [13].
The DEC evaluation includes an assessment of psychophysical and physiological indicators. The psychophysical indicators allow officers to assess impairment of motor function (e.g. balance and coordination) and divided attention. These consist of the Walk-and-Turn Test and the One-Leg Stand Test, both of which are components of the Standardized Field Sobriety Test battery. In addition, a Finger-to-nose Test (the modified Romberg balance test) is also part of the DEC protocol and is used to assess coordination and divided attention. The details of the tests are provided in Appendix B.
The physiological indicators evaluated represent involuntary autonomic (e.g. heart rate, blood pressure, pupil size) responses to drug use that are used to assess which class or classes of drugs might be responsible for any observed impairment.
This portion of the assessment includes a check of the eyes for signs of drug use. Horizontal gaze nystagmus (HGN) and vertical gaze nystagmus (VGN) is a distinct jerkiness of the eyes when moved to the extreme horizontal or vertical position, respectively. Nystagmus becomes apparent in the presence of many drugs with central nervous system depressant effects. THC, however, does not produce HGN or VGN under typical use [13]. HGN was seen in 15 percent of subjects receiving only cannabis in an assessment of standardized field sobriety tests [14]. In addition, dilated pupils are a common indicator of cannabis use
7
(as well as use of stimulants and hallucinogens). In our data, cannabis-positive drivers were also more likely than controls to display red and/or bloodshot eyes, droopy eyelids, lack of convergence (LOC), eyelid tremors, or rebound dilation.
With the exception of depressants and narcotic analgesics, most other psychoactive drugs (including cannabis) increase heart rate. Increased heart rate is frequently associated with elevated blood pressure.
The purpose of the DEC procedure is to provide the officer with the necessary evidence to determine whether or not the subject is impaired, and whether the observed impairment is due to drugs or a medical condition. If impairment is present, the constellation of symptoms (the DRE Matrix, see Appendix C) helps the officer assess which category (or categories) of drugs might be responsible for the impairment. According to the DEC student manual, the process is systematic “because it is based on a complete set of observable signs and symptoms that are known to be reliable indicators of drug impairment [15].” The process is standardized because it is conducted in exactly the same way by every DRE for every subject, whenever possible. The results of the 12-step protocol, when corroborated by toxicological evidence of drug use, provide sufficient evidence to proceed with drug-impaired driving charges. The examination concludes with the collection of a specimen of urine, blood or oral fluid to be analyzed for drug content.
Data was provided by DRE Coordinators in Pennsylvania, Washington and Minnesota, and an aggregated data set of approximately 300 cases was provided by the International Association of Chiefs of Police (IACP), also including cases from the following states: Arizona, California, Colorado, Montana, Texas, and Wisconsin. Toxicology data was provided for all cases that were included in the analysis. Coordinators also provided the DEC evaluation “face sheets” or abstracted data provided in an excel spreadsheet. The face sheet is the cover sheet used to record the officer’s observations of the subjects’ statements about drug and alcohol use, medical conditions that could impact performance, times and nature recent drug or alcohol use, performance in field sobriety tests, physiological indicators (pulse, blood pressure, muscle tone, pupil diameter, etc.). Information collected and noted on the face sheet becomes the basis for the officer’s opinion about the presence of impairment and the drug or drugs responsible for it. An example of the DEC face sheet is shown in Appendix A. Coordinators also provided related documentation (narrative reports, toxicology reports) on cases where the subject was suspected of being under the influence of only cannabis based on the DRE officer’s opinion. Only cases with a blood specimen that had been subject to a comprehensive panel of drug testing aligned with the DRE categories, including confirmatory testing and quantitative THC analysis, were retained. Working with the toxicology labs and the police departments that submitted the blood specimens for analysis, we collected and reconciled the drug influence evaluation “face sheet” and the officer’s narrative report describing the driving behavior and arrest, to the toxicology results. Cases in which cannabis was used in combination with other substances were excluded. Due to inconsistencies in the way in which states collect, manage, and report data, of approximately 1000 cases collected, only 602 met the criteria for inclusion and were entered into a database for analysis. The primary reason for exclusion was lack of quantitative toxicological confirmation, along with incomplete evaluations, and additional drugs or alcohol being present.
8
In addition to the field sobriety test performance indicators listed in Appendix B, for each of these cases we recorded demographic, clinical, and behavioral indicators from the evaluation face sheet and the officer’s narrative report which were abstracted, coded, and entered into a database (SPSS for Windows version 22.0). Specific parameters captured included pupil size; presence of horizontal and vertical gaze nystagmus; lack of convergence; reddened conjunctiva; reaction to light; rebound dilation; body temperature; pulse; blood concentration of THC; elapsed time between the time of arrest, the start and end of the evaluation, and the time of specimen collection; and the reason for the traffic stop. The toxicology data were also entered, including the concentration of THC and other cannabinoids.
As a control population, we used a sample of 349 drug-free DEC evaluations for comparison with the sample of cannabis-positive drivers. Most of these drug-free subjects were volunteers who agreed to undergo a DEC evaluation for training purposes or for their own interest. Volunteers were asked about the use of drugs and medications and were excluded if they indicated any use, but were generally not drug-tested. In some cases, an oral fluid specimen was collected and found to be free of drugs. A small number of cases involved drivers who had been arrested and were subjected to a drug influence evaluation but were deemed not to be impaired, had no measurable blood THC and were free from other drugs.
Study Population 2 - Arrested Drivers without DRE Assessments Results from a cohort of drivers who had provided blood specimens subsequent to their arrest under suspicion of impaired driving were provided (NMS Labs, Willow Grove, PA), which originated from the following states: Alaska, Arizona, California, Colorado, Florida, Iowa, Idaho, Illinois, Kansas, Kentucky, Louisiana, Maryland, Maine, Michigan, Minnesota, Missouri, North Carolina, North Dakota, New Jersey, New Mexico, Nevada, New York, Ohio, Oklahoma, Oregon, Pennsylvania, South Dakota, Tennessee, Texas, Utah, Virginia, Vermont, Washington, West Virginia, and Wyoming. The specimens had been subjected to comprehensive drug and alcohol testing in suspected impaired drivers and surviving drivers in motor vehicle fatality investigations. The scope of testing in these cases was designed based on the National Safety Council’s Committee on Alcohol and Other Drugs (CAOD) 2007 and 2013 recommendations [16], [17] and the laboratory has used consistent cut-offs for drug screening and confirmation since the introduction of the test in 2009. This rich data set has information on age, gender, and test results for alcohol and other drugs, but lacks behavioral or crash data.
The laboratory compiled data from the blood specimens submitted from suspected drug-impaired drivers placed under arrest by police agencies, comprising 36,037 cases between August 2009 and December 2014. Screening for cannabis use by Enzyme Linked Immunosorbent Assay (ELISA) with a cutoff of 5 ng/mL returned presumptive positive results for 17,612 (48.8%) of these specimens. Of these 13,988 (79.4%) confirmed positive for THC (1 ng/mL), carboxy-THC, (5 ng/mL), and/or hydroxy-THC (5 ng/mL).
A subset of these data, all of which had all of age, gender, and alcohol/other drug data (4,799 cases or 34 percent of confirmed cannabinoid-positive cases, from January 2009 to June 2013) were further evaluated to examine variations in THC concentrations with comorbid drug use and the distribution of cases based on varying per se thresholds for driving under the influence of cannabis.
9
Analysis In recognition of the fact that we were relying on secondary data collected by a number of different agencies for purposes other than research, every effort was made to ensure the cases selected for inclusion were as complete as possible and contained the data elements required, and that data were coded consistently with only equivalent fields being included. In many cases, toxicology reports and/or narrative reports were not included with DEC program case files, and were unavailable from the agency. These cases were excluded. Some agencies (or officers) record data on the face sheets in slightly different ways (e.g., recording the number of times a clue was observed or simply noting its presence if it occurred). Hence, for consistency, the lowest level of data reported was used in data coding.
Results
Arrested Drivers
Study Population 1 - Impaired Drivers with DRE Assessments
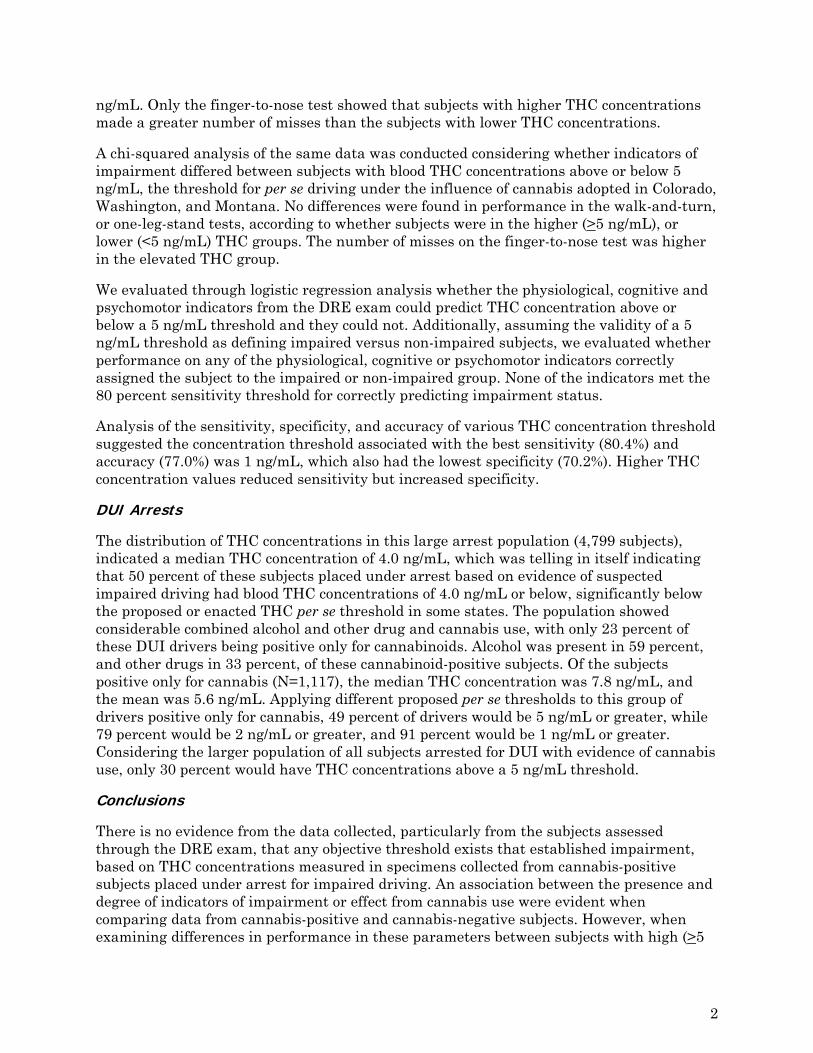
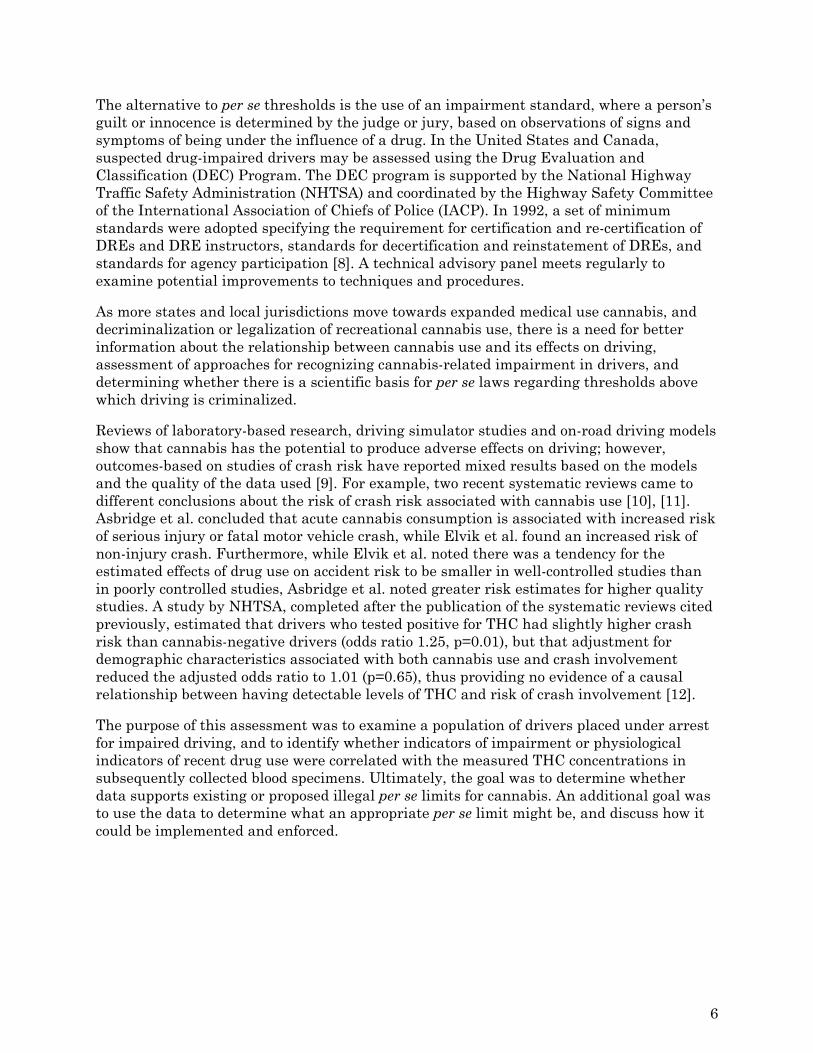
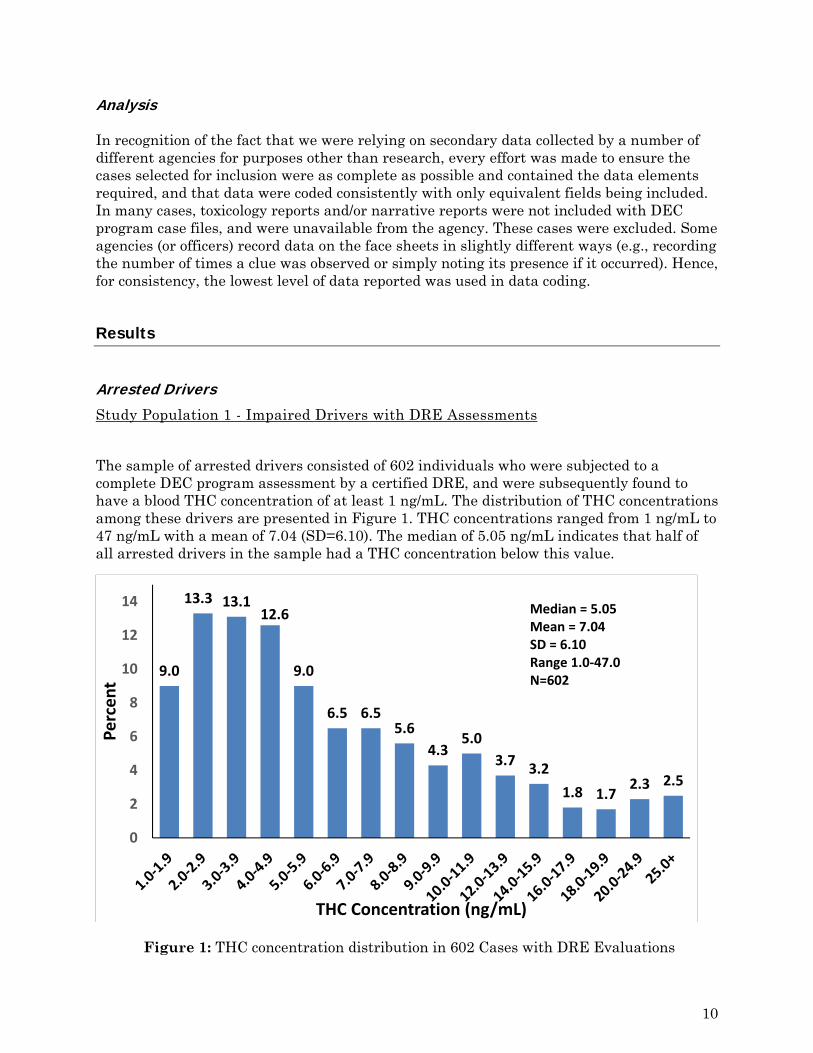
The sample of arrested drivers consisted of 602 individuals who were subjected to a complete DEC program assessment by a certified DRE, and were subsequently found to have a blood THC concentration of at least 1 ng/mL. The distribution of THC concentrations among these drivers are presented in Figure 1. THC concentrations ranged from 1 ng/mL to 47 ng/mL with a mean of 7.04 (SD=6.10). The median of 5.05 ng/mL indicates that half of all arrested drivers in the sample had a THC concentration below this value.
Figure 1: THC concentration distribution in 602 Cases with DRE Evaluations
9.0
13.3 13.112.6
9.0
6.5 6.55.6
4.35.0
3.73.2
1.8 1.72.3 2.5
0
2
4
6
8
10
12
14
Percent
THC Concentration (ng/mL)
Median = 5.05Mean = 7.04 SD = 6.10Range 1.0‐47.0N=602
10
A key consideration in evaluating this data is the fact that the THC concentrations measured are taken from blood specimens collected some finite time after driving and following the subject’s evaluation, arrest, and transportation for a blood draw. Wood et al. reported in 2015 that in Colorado the average time from law enforcement dispatch to blood draw in cases of vehicular homicide and vehicular assault was 2.32 hours (SD ± 1.31 hours), with a range of 0.83 to 8.0 hours, and a median of 2.0 hours [18]. As a result of the rapid distribution of THC out of the blood, which is discussed in more detail below, the THC concentration measured in a blood specimen collected hours after driving will not reflect the concentration in the blood at the time of driving, and in many cases will have fallen below the limits of detection used by the laboratories performing the testing. It is important to keep in mind that all these drivers had been placed under arrest presumably based on appropriate probable cause including the circumstances of driving, or crash involvement.
From cases in our data set where the information was available, the mean lag between arrest and blood draw was 74 minutes. The median value was 61 minutes and the maximum time delay was three hours and 45 minutes. The correlation between THC concentration and the time lag between arrest and blood draw was -0.176, indicating that longer intervals were associated with lower THC concentrations. The strength of the relationship, however, is not large with the time interval between arrest and blood draw accounting for about 3 percent of the variance in THC concentrations.
We assessed the proportion of cases with THC concentrations above or below certain proposed statutory thresholds for THC per se legislation. Of the 602 cases included, almost half (48.0%) the subjects had THC concentrations below 5 ng/mL, the per se threshold adopted in Washington, and Montana, and the threshold for a rebuttable presumption in Colorado; only 9.0 percent were below 2 ng/mL, the per se threshold in Ohio, and Nevada, and 90 percent had a THC concentration less than 15 ng/mL, the per se threshold proposed in Illinois in 2015.
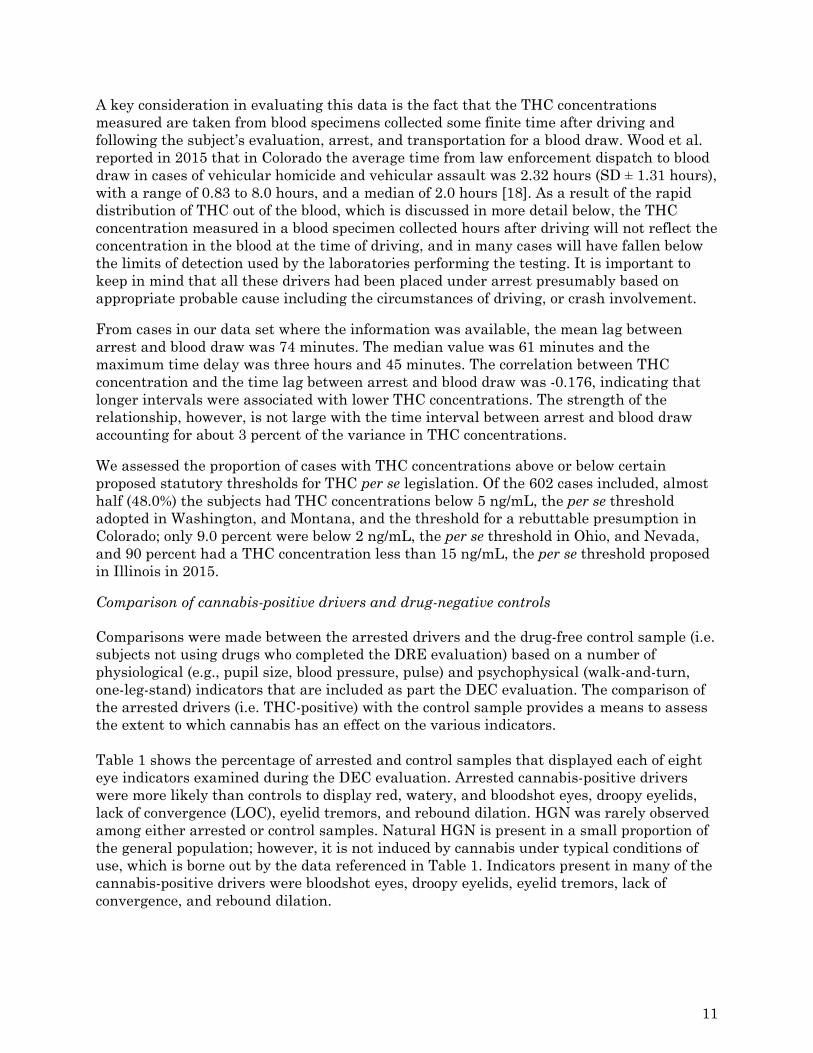
Comparison of cannabis-positive drivers and drug-negative controls Comparisons were made between the arrested drivers and the drug-free control sample (i.e. subjects not using drugs who completed the DRE evaluation) based on a number of physiological (e.g., pupil size, blood pressure, pulse) and psychophysical (walk-and-turn, one-leg-stand) indicators that are included as part the DEC evaluation. The comparison of the arrested drivers (i.e. THC-positive) with the control sample provides a means to assess the extent to which cannabis has an effect on the various indicators. Table 1 shows the percentage of arrested and control samples that displayed each of eight eye indicators examined during the DEC evaluation. Arrested cannabis-positive drivers were more likely than controls to display red, watery, and bloodshot eyes, droopy eyelids, lack of convergence (LOC), eyelid tremors, and rebound dilation. HGN was rarely observed among either arrested or control samples. Natural HGN is present in a small proportion of the general population; however, it is not induced by cannabis under typical conditions of use, which is borne out by the data referenced in Table 1. Indicators present in many of the cannabis-positive drivers were bloodshot eyes, droopy eyelids, eyelid tremors, lack of convergence, and rebound dilation.
11
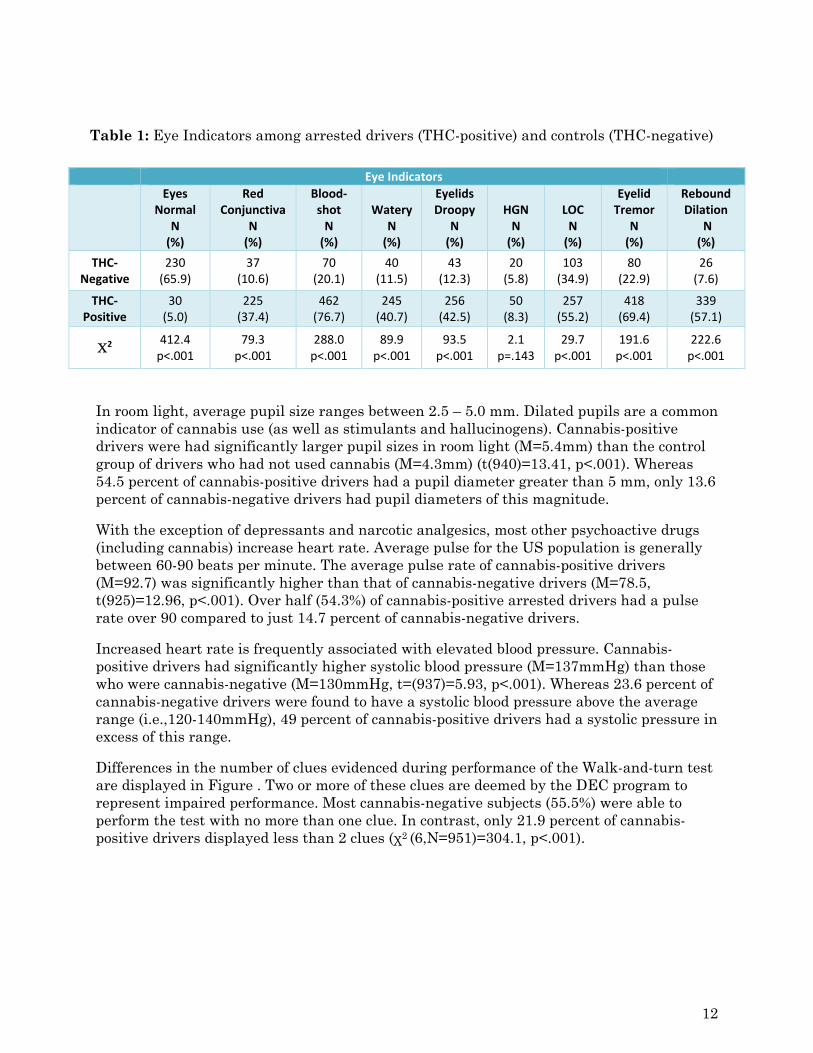
Table 1: Eye Indicators among arrested drivers (THC-positive) and controls (THC-negative)
In room light, average pupil size ranges between 2.5 – 5.0 mm. Dilated pupils are a common indicator of cannabis use (as well as stimulants and hallucinogens). Cannabis-positive drivers were had significantly larger pupil sizes in room light (M=5.4mm) than the control group of drivers who had not used cannabis (M=4.3mm) (t(940)=13.41, p<.001). Whereas 54.5 percent of cannabis-positive drivers had a pupil diameter greater than 5 mm, only 13.6 percent of cannabis-negative drivers had pupil diameters of this magnitude.
With the exception of depressants and narcotic analgesics, most other psychoactive drugs (including cannabis) increase heart rate. Average pulse for the US population is generally between 60-90 beats per minute. The average pulse rate of cannabis-positive drivers (M=92.7) was significantly higher than that of cannabis-negative drivers (M=78.5, t(925)=12.96, p<.001). Over half (54.3%) of cannabis-positive arrested drivers had a pulse rate over 90 compared to just 14.7 percent of cannabis-negative drivers.
Increased heart rate is frequently associated with elevated blood pressure. Cannabis-positive drivers had significantly higher systolic blood pressure (M=137mmHg) than those who were cannabis-negative (M=130mmHg, t=(937)=5.93, p<.001). Whereas 23.6 percent of cannabis-negative drivers were found to have a systolic blood pressure above the average range (i.e.,120-140mmHg), 49 percent of cannabis-positive drivers had a systolic pressure in excess of this range.
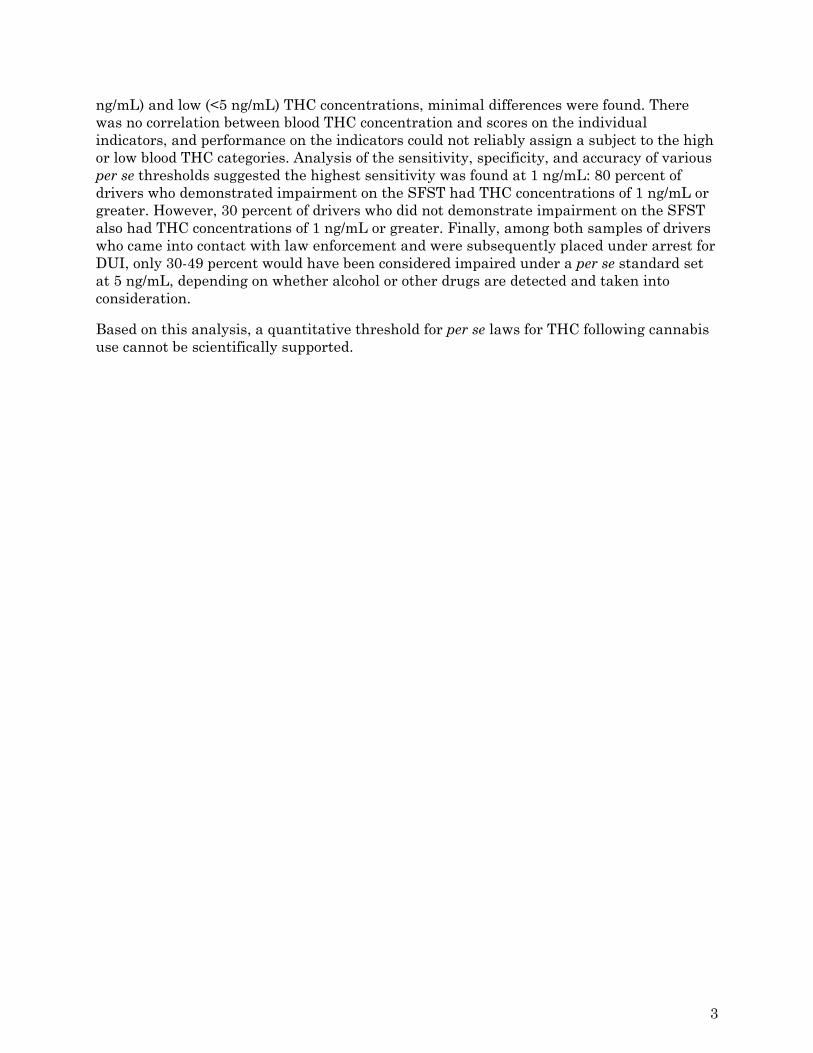
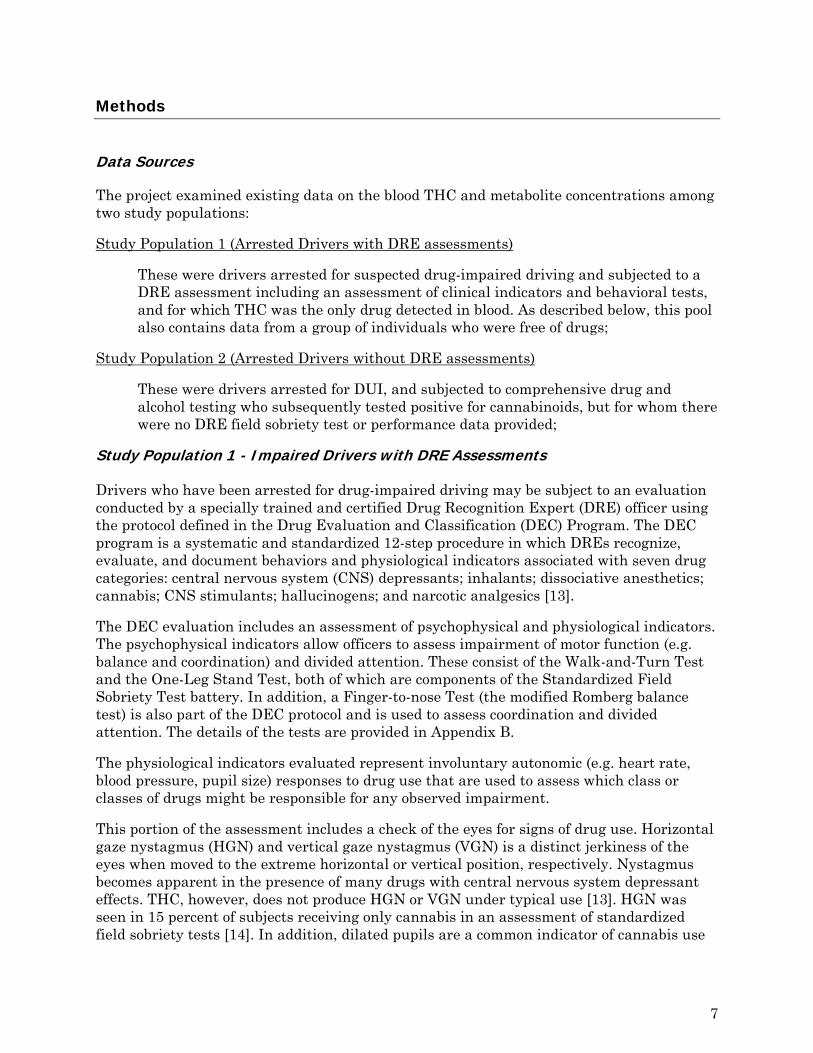
Differences in the number of clues evidenced during performance of the Walk-and-turn test are displayed in Figure . Two or more of these clues are deemed by the DEC program to represent impaired performance. Most cannabis-negative subjects (55.5%) were able to perform the test with no more than one clue. In contrast, only 21.9 percent of cannabis-positive drivers displayed less than 2 clues (χ2 (6,N=951)=304.1, p<.001).
Eye Indicators
Eyes Normal
N (%)
Red Conjunctiva
N (%)
Blood‐shot N (%)
Watery N (%)
Eyelids Droopy
N (%)
HGN N (%)
LOC N (%)
Eyelid Tremor
N (%)
Rebound Dilation
N (%)
THC‐Negative
230 (65.9)
37 (10.6)
70 (20.1)
40 (11.5)
43 (12.3)
20 (5.8)
103 (34.9)
80 (22.9)
26 (7.6)
THC‐Positive
30 (5.0)
225 (37.4)
462 (76.7)
245 (40.7)
256 (42.5)
50 (8.3)
257 (55.2)
418 (69.4)
339 (57.1)
2 412.4 p<.001
79.3 p<.001
288.0 p<.001
89.9 p<.001
93.5 p<.001
2.1 p=.143
29.7 p<.001
191.6 p<.001
222.6 p<.001
12
Figure 2: Total Walk and Turn Clues among THC-positive and THC-negative subjects
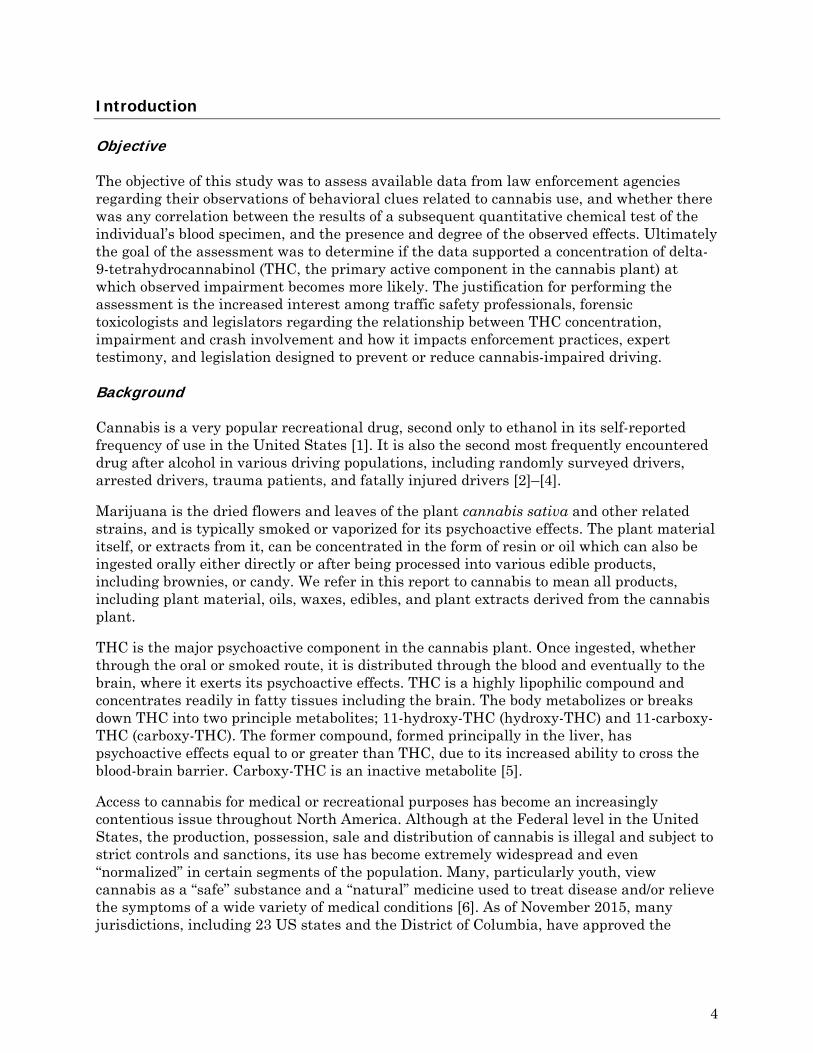
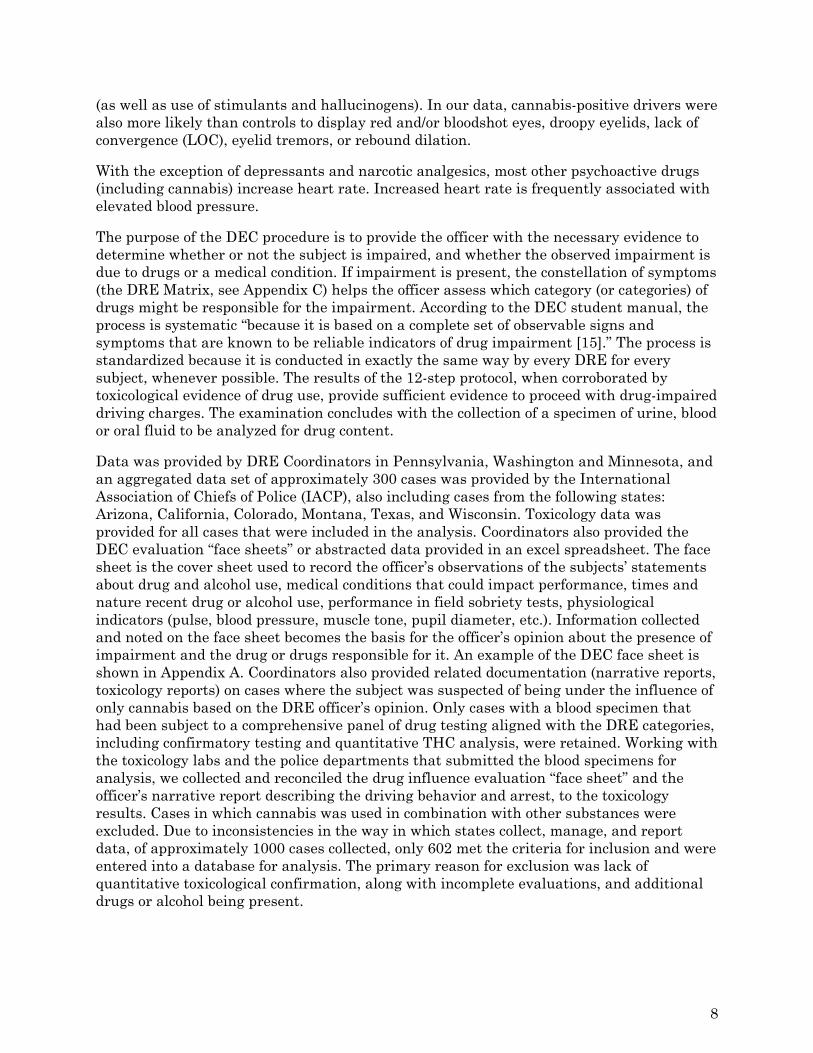
Figure 3 presents the number of clues on the one-leg-stand separately for THC-positive and THC-negative subjects. Two or more clues are deemed to be indicative of impaired performance. Whereas 67.2 percent of cannabis-negative displayed no clues, only 24.0 percent of THC-positive drivers were able to perform the test without errors (χ2
(4,N=939)=167.1, p<.001).
6.0
15.9
25.222.6
16.4
9.3
4.5
55.5
20.9
12.58.4
2.20.3 0.0
0
10
20
30
40
50
60
0 1 2 3 4 5 6+
Percent
Number of walk‐and‐turn clues
THC‐Positive THC‐Negative
13
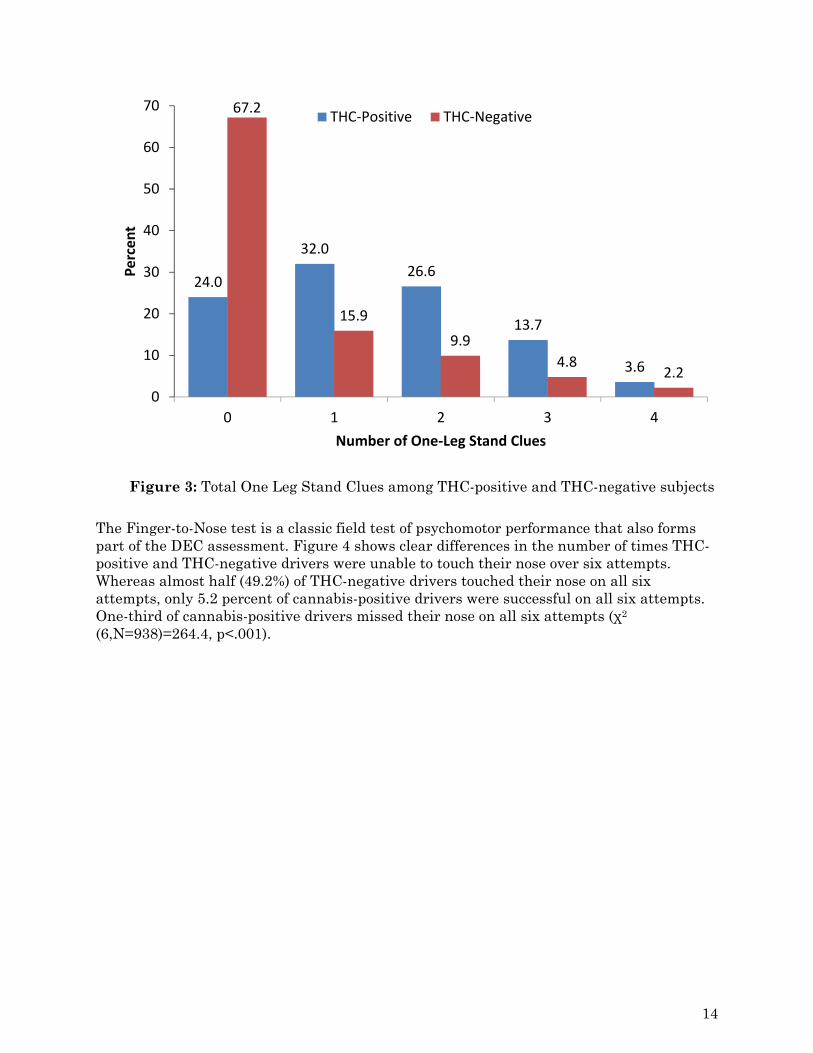
Figure 3: Total One Leg Stand Clues among THC-positive and THC-negative subjects
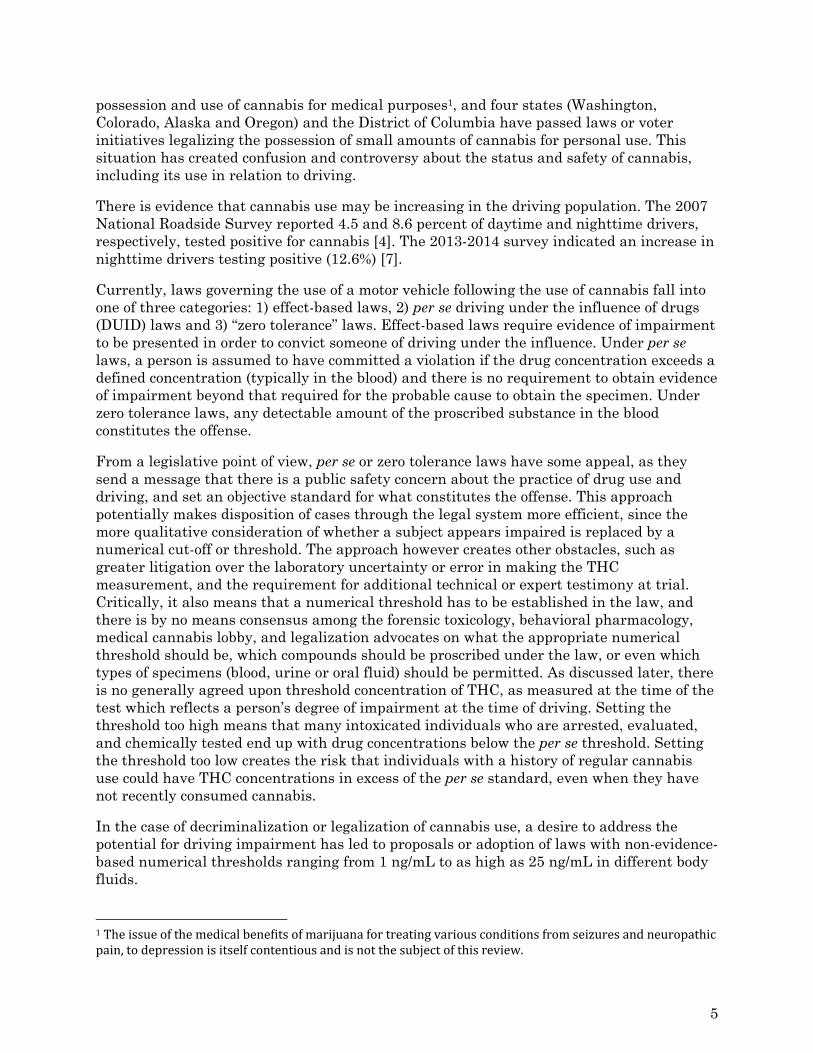
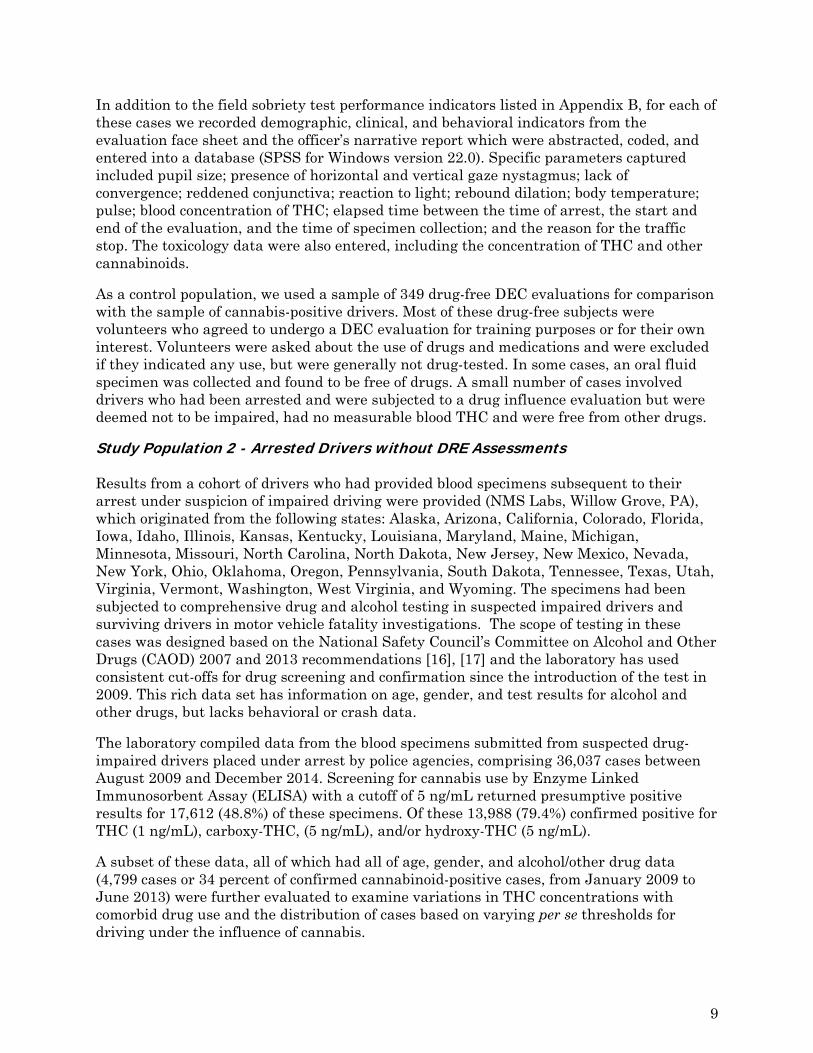
The Finger-to-Nose test is a classic field test of psychomotor performance that also forms part of the DEC assessment. Figure 4 shows clear differences in the number of times THC-positive and THC-negative drivers were unable to touch their nose over six attempts. Whereas almost half (49.2%) of THC-negative drivers touched their nose on all six attempts, only 5.2 percent of cannabis-positive drivers were successful on all six attempts. One-third of cannabis-positive drivers missed their nose on all six attempts (χ2
(6,N=938)=264.4, p<.001).
24.0
32.0
26.6
13.7
3.6
67.2
15.9
9.9
4.82.2
0
10
20
30
40
50
60
70
0 1 2 3 4
Percent
Number of One‐Leg Stand Clues
THC‐Positive THC‐Negative
14
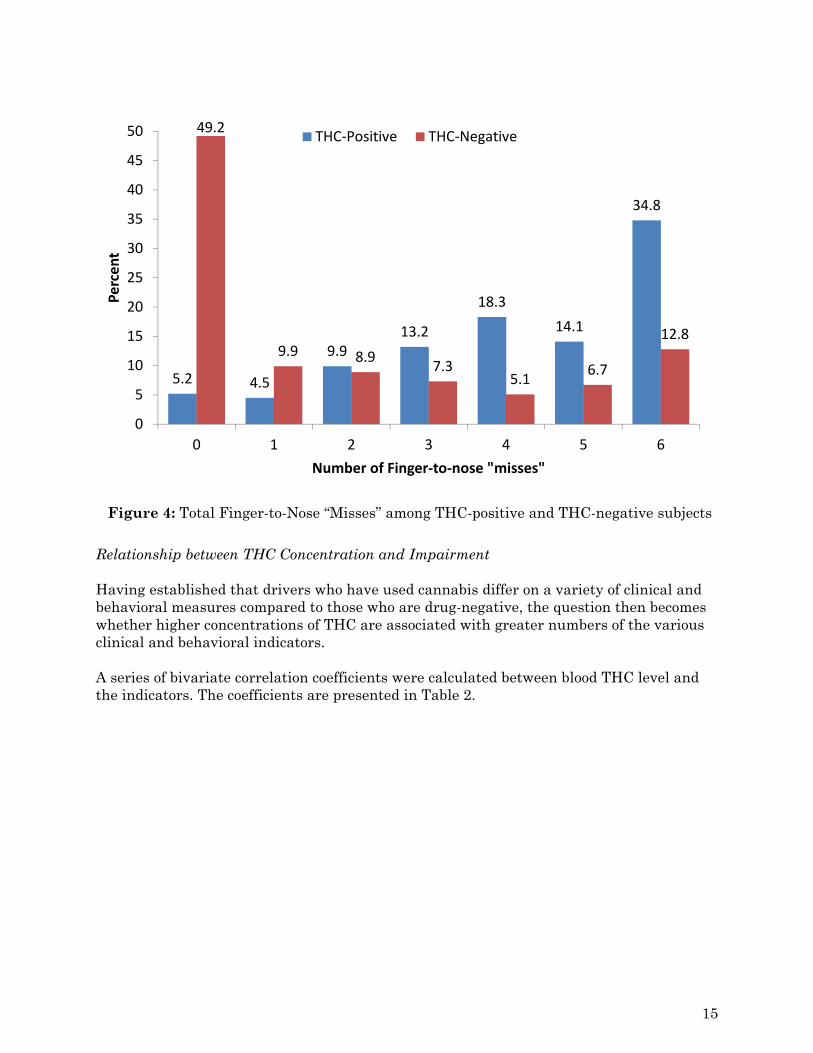
Figure 4: Total Finger-to-Nose “Misses” among THC-positive and THC-negative subjects
Relationship between THC Concentration and Impairment Having established that drivers who have used cannabis differ on a variety of clinical and behavioral measures compared to those who are drug-negative, the question then becomes whether higher concentrations of THC are associated with greater numbers of the various clinical and behavioral indicators. A series of bivariate correlation coefficients were calculated between blood THC level and the indicators. The coefficients are presented in Table 2.
5.2 4.5
9.913.2
18.3
14.1
34.8
49.2
9.9 8.97.3
5.16.7
12.8
0
5
10
15
20
25
30
35
40
45
50
0 1 2 3 4 5 6
Percent
Number of Finger‐to‐nose "misses"
THC‐Positive THC‐Negative
15
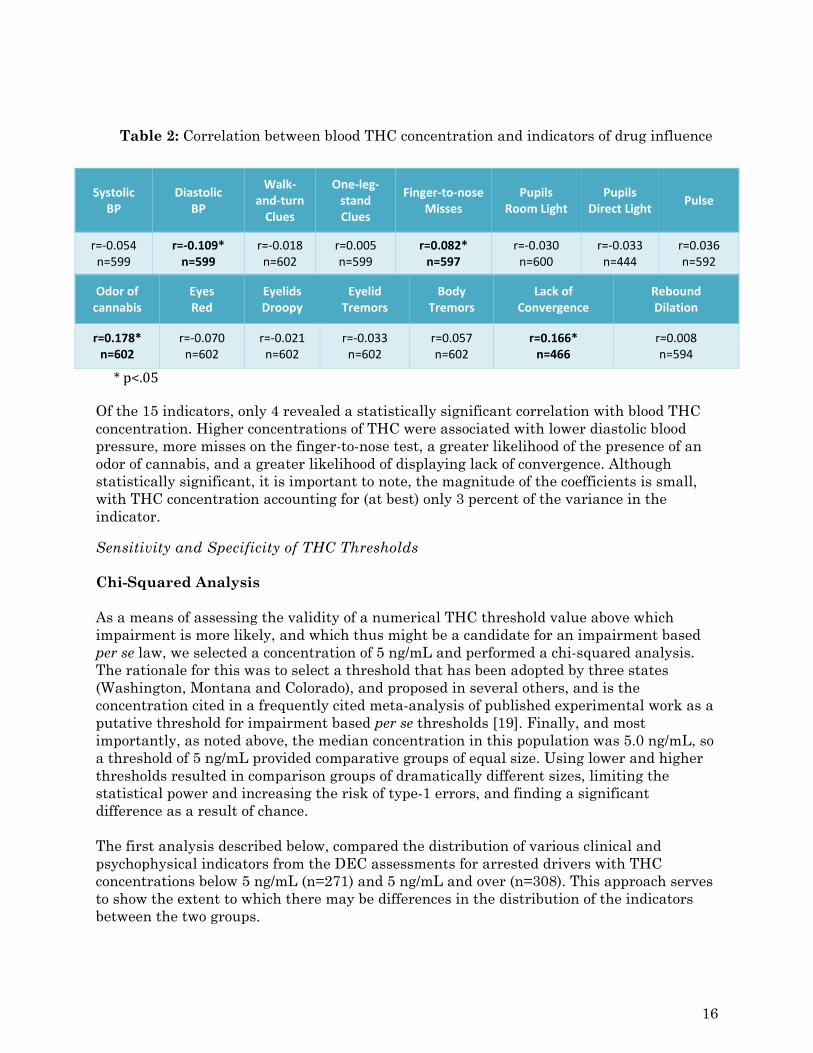
Table 2: Correlation between blood THC concentration and indicators of drug influence
Systolic BP
Diastolic BP
Walk‐and‐turn Clues
One‐leg‐stand Clues
Finger‐to‐noseMisses
Pupils Room Light
Pupils Direct Light
Pulse
r=‐0.054 n=599
r=‐0.109* n=599
r=‐0.018 n=602
r=0.005 n=599
r=0.082* n=597
r=‐0.030 n=600
r=‐0.033 n=444
r=0.036 n=592
Odor of cannabis
Eyes Red
Eyelids Droopy
Eyelid Tremors
Body Tremors
Lack of Convergence
Rebound Dilation
r=0.178* n=602
r=‐0.070 n=602
r=‐0.021 n=602
r=‐0.033 n=602
r=0.057 n=602
r=0.166* n=466
r=0.008 n=594
*p<.05
Of the 15 indicators, only 4 revealed a statistically significant correlation with blood THC concentration. Higher concentrations of THC were associated with lower diastolic blood pressure, more misses on the finger-to-nose test, a greater likelihood of the presence of an odor of cannabis, and a greater likelihood of displaying lack of convergence. Although statistically significant, it is important to note, the magnitude of the coefficients is small, with THC concentration accounting for (at best) only 3 percent of the variance in the indicator.
Sensitivity and Specificity of THC Thresholds Chi-Squared Analysis As a means of assessing the validity of a numerical THC threshold value above which impairment is more likely, and which thus might be a candidate for an impairment based per se law, we selected a concentration of 5 ng/mL and performed a chi-squared analysis. The rationale for this was to select a threshold that has been adopted by three states (Washington, Montana and Colorado), and proposed in several others, and is the concentration cited in a frequently cited meta-analysis of published experimental work as a putative threshold for impairment based per se thresholds [19]. Finally, and most importantly, as noted above, the median concentration in this population was 5.0 ng/mL, so a threshold of 5 ng/mL provided comparative groups of equal size. Using lower and higher thresholds resulted in comparison groups of dramatically different sizes, limiting the statistical power and increasing the risk of type-1 errors, and finding a significant difference as a result of chance. The first analysis described below, compared the distribution of various clinical and psychophysical indicators from the DEC assessments for arrested drivers with THC concentrations below 5 ng/mL (n=271) and 5 ng/mL and over (n=308). This approach serves to show the extent to which there may be differences in the distribution of the indicators between the two groups.
16
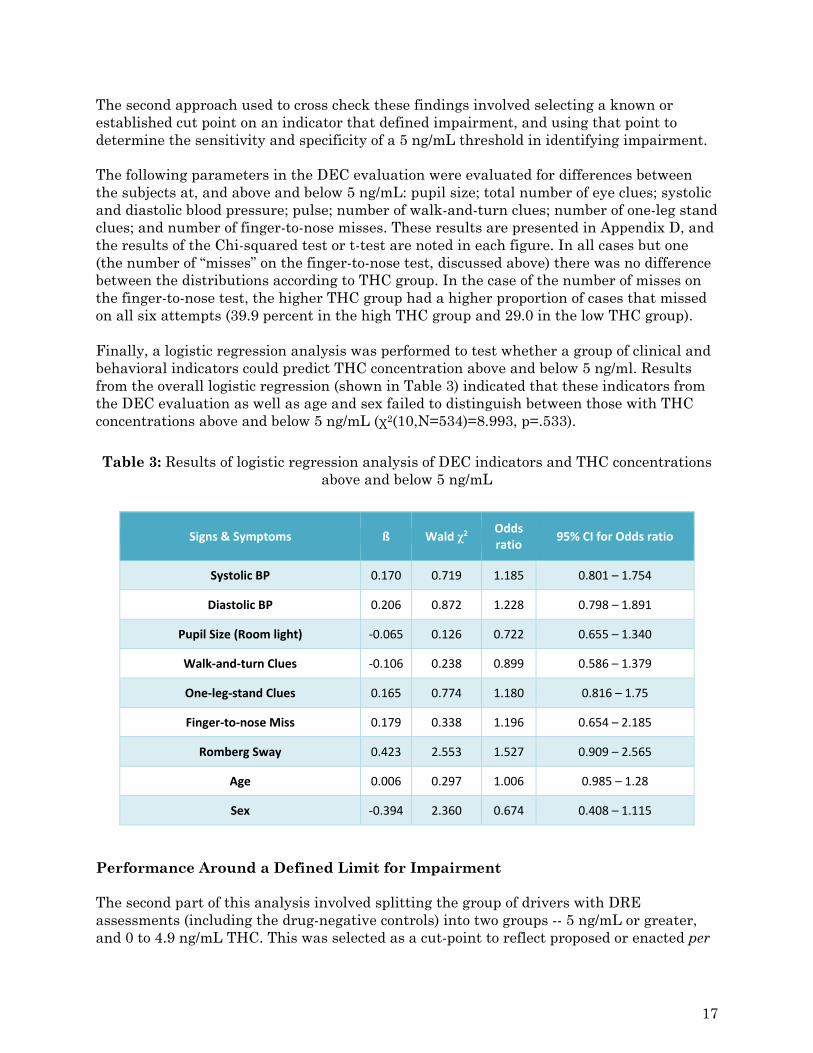
The second approach used to cross check these findings involved selecting a known or established cut point on an indicator that defined impairment, and using that point to determine the sensitivity and specificity of a 5 ng/mL threshold in identifying impairment. The following parameters in the DEC evaluation were evaluated for differences between the subjects at, and above and below 5 ng/mL: pupil size; total number of eye clues; systolic and diastolic blood pressure; pulse; number of walk-and-turn clues; number of one-leg stand clues; and number of finger-to-nose misses. These results are presented in Appendix D, and the results of the Chi-squared test or t-test are noted in each figure. In all cases but one (the number of “misses” on the finger-to-nose test, discussed above) there was no difference between the distributions according to THC group. In the case of the number of misses on the finger-to-nose test, the higher THC group had a higher proportion of cases that missed on all six attempts (39.9 percent in the high THC group and 29.0 in the low THC group). Finally, a logistic regression analysis was performed to test whether a group of clinical and behavioral indicators could predict THC concentration above and below 5 ng/ml. Results from the overall logistic regression (shown in Table 3) indicated that these indicators from the DEC evaluation as well as age and sex failed to distinguish between those with THC concentrations above and below 5 ng/mL (χ2(10,N=534)=8.993, p=.533).
Table 3: Results of logistic regression analysis of DEC indicators and THC concentrations above and below 5 ng/mL
Signs & Symptoms ß Wald χ2 Odds ratio
95% CI for Odds ratio
Systolic BP 0.170 0.719 1.185 0.801 – 1.754
Diastolic BP 0.206 0.872 1.228 0.798 – 1.891
Pupil Size (Room light) ‐0.065 0.126 0.722 0.655 – 1.340
Walk‐and‐turn Clues ‐0.106 0.238 0.899 0.586 – 1.379
One‐leg‐stand Clues 0.165 0.774 1.180 0.816 – 1.75
Finger‐to‐nose Miss 0.179 0.338 1.196 0.654 – 2.185
Romberg Sway 0.423 2.553 1.527 0.909 – 2.565
Age 0.006 0.297 1.006 0.985 – 1.28
Sex ‐0.394 2.360 0.674 0.408 – 1.115
Performance Around a Defined Limit for Impairment The second part of this analysis involved splitting the group of drivers with DRE assessments (including the drug-negative controls) into two groups -- 5 ng/mL or greater, and 0 to 4.9 ng/mL THC. This was selected as a cut-point to reflect proposed or enacted per
17
se laws for cannabis use and driving. In essence, a per se law for THC set at 5 ng/mL would operate in a manner similar to how 0.08 g/dL is used as a limit to define alcohol-impaired driving. Individuals with a THC concentration of 5 ng/mL or greater would be deemed to have committed the offence of “driving under the influence.”
It was then necessary to establish a threshold or cut point that would be used to define “impaired performance” for each indicator. This threshold then served as the criterion by which to assess the extent to which the two groups (i.e., 5 ng/mL or greater, and 0 to 4.9 ng/mL) would be deemed “impaired” or “not impaired”. Most of these threshold values were taken from the DEC program training manuals, and were established through research validating the indicator (e.g., for the SFST), taken from medical text books (e.g., pulse, blood pressure), or were simple dichotomies (i.e., presence or absence) based on known drug effects. A final threshold for impairment was calculated as at least one test of the SFST meeting the threshold of impairment – i.e., HGN, walk-and-turn, one-leg-stand.
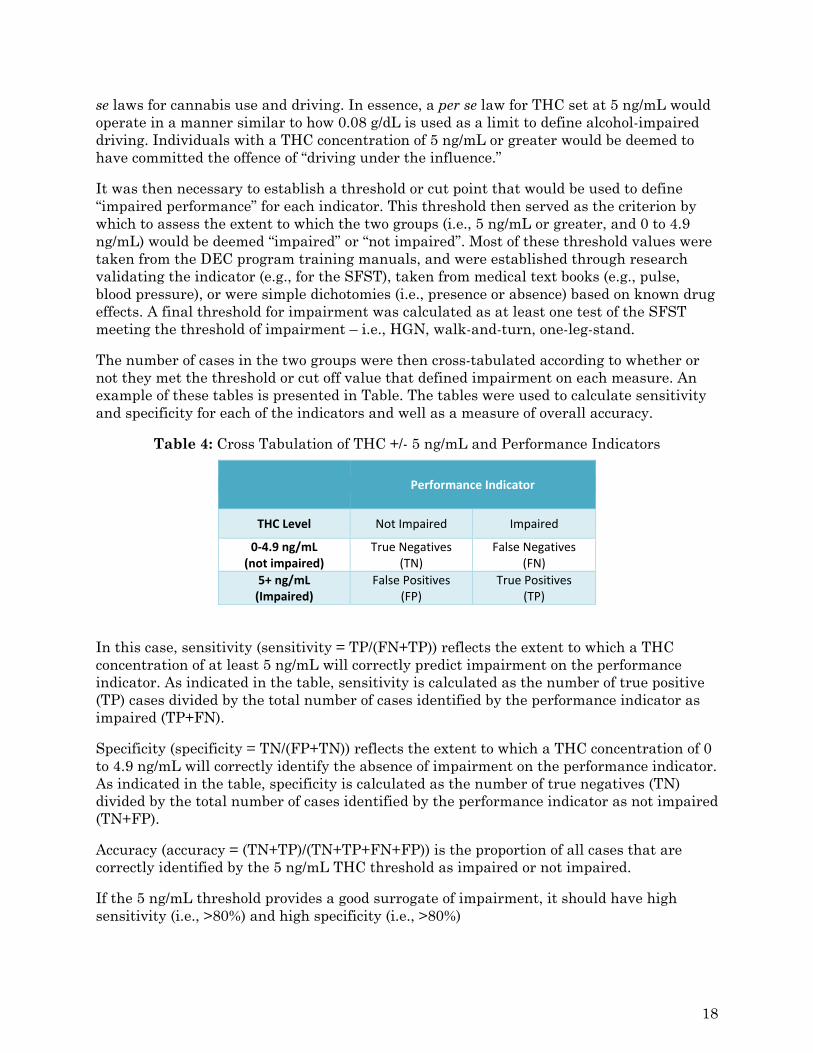
The number of cases in the two groups were then cross-tabulated according to whether or not they met the threshold or cut off value that defined impairment on each measure. An example of these tables is presented in Table. The tables were used to calculate sensitivity and specificity for each of the indicators and well as a measure of overall accuracy.
Table 4: Cross Tabulation of THC +/- 5 ng/mL and Performance Indicators
Performance Indicator
THC Level Not Impaired Impaired
0‐4.9 ng/mL (not impaired)
True Negatives(TN)
False Negatives (FN)
5+ ng/mL (Impaired)
False Positives(FP)
True Positives (TP)
In this case, sensitivity (sensitivity = TP/(FN+TP)) reflects the extent to which a THC concentration of at least 5 ng/mL will correctly predict impairment on the performance indicator. As indicated in the table, sensitivity is calculated as the number of true positive (TP) cases divided by the total number of cases identified by the performance indicator as impaired (TP+FN).
Specificity (specificity = TN/(FP+TN)) reflects the extent to which a THC concentration of 0 to 4.9 ng/mL will correctly identify the absence of impairment on the performance indicator. As indicated in the table, specificity is calculated as the number of true negatives (TN) divided by the total number of cases identified by the performance indicator as not impaired (TN+FP).
Accuracy (accuracy = (TN+TP)/(TN+TP+FN+FP)) is the proportion of all cases that are correctly identified by the 5 ng/mL THC threshold as impaired or not impaired.
If the 5 ng/mL threshold provides a good surrogate of impairment, it should have high sensitivity (i.e., >80%) and high specificity (i.e., >80%)
18
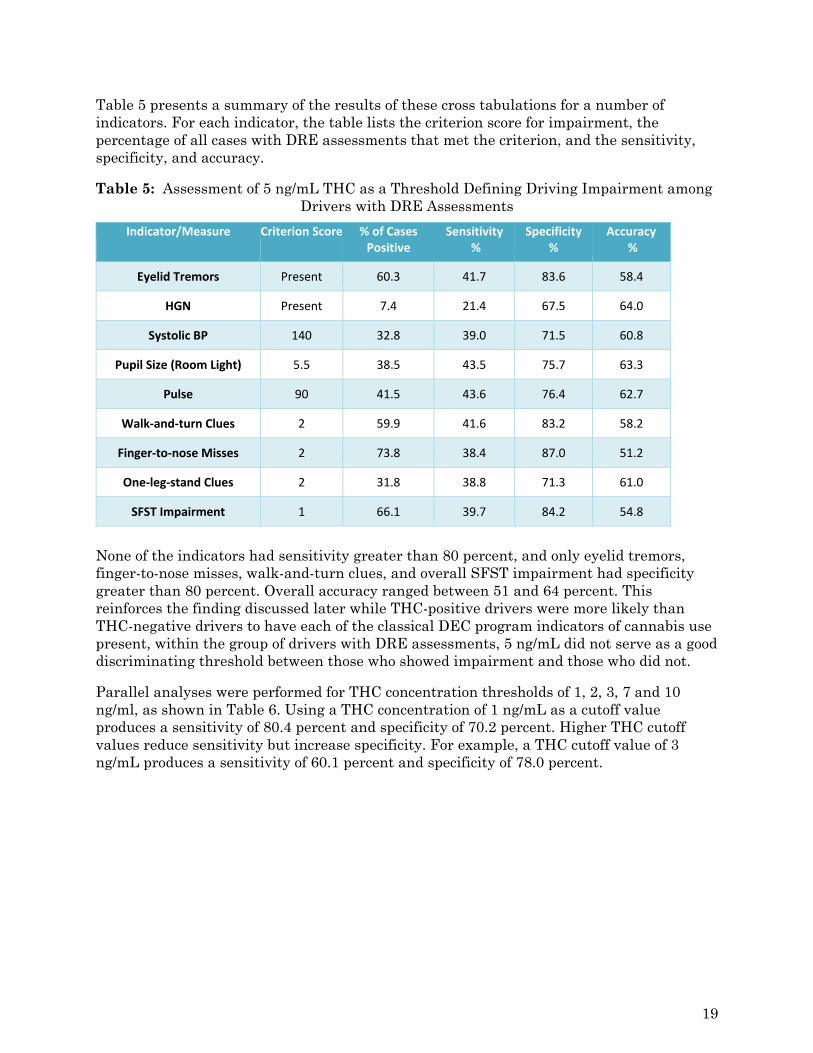
Table 5 presents a summary of the results of these cross tabulations for a number of indicators. For each indicator, the table lists the criterion score for impairment, the percentage of all cases with DRE assessments that met the criterion, and the sensitivity, specificity, and accuracy.
Table 5: Assessment of 5 ng/mL THC as a Threshold Defining Driving Impairment among Drivers with DRE Assessments
Indicator/Measure Criterion Score % of CasesPositive
Sensitivity %
Specificity %
Accuracy %
Eyelid Tremors Present 60.3 41.7 83.6 58.4
HGN Present 7.4 21.4 67.5 64.0
Systolic BP 140 32.8 39.0 71.5 60.8
Pupil Size (Room Light) 5.5 38.5 43.5 75.7 63.3
Pulse 90 41.5 43.6 76.4 62.7
Walk‐and‐turn Clues 2 59.9 41.6 83.2 58.2
Finger‐to‐nose Misses 2 73.8 38.4 87.0 51.2
One‐leg‐stand Clues 2 31.8 38.8 71.3 61.0
SFST Impairment 1 66.1 39.7 84.2 54.8
None of the indicators had sensitivity greater than 80 percent, and only eyelid tremors, finger-to-nose misses, walk-and-turn clues, and overall SFST impairment had specificity greater than 80 percent. Overall accuracy ranged between 51 and 64 percent. This reinforces the finding discussed later while THC-positive drivers were more likely than THC-negative drivers to have each of the classical DEC program indicators of cannabis use present, within the group of drivers with DRE assessments, 5 ng/mL did not serve as a good discriminating threshold between those who showed impairment and those who did not.
Parallel analyses were performed for THC concentration thresholds of 1, 2, 3, 7 and 10 ng/ml, as shown in Table 6. Using a THC concentration of 1 ng/mL as a cutoff value produces a sensitivity of 80.4 percent and specificity of 70.2 percent. Higher THC cutoff values reduce sensitivity but increase specificity. For example, a THC cutoff value of 3 ng/mL produces a sensitivity of 60.1 percent and specificity of 78.0 percent.
19
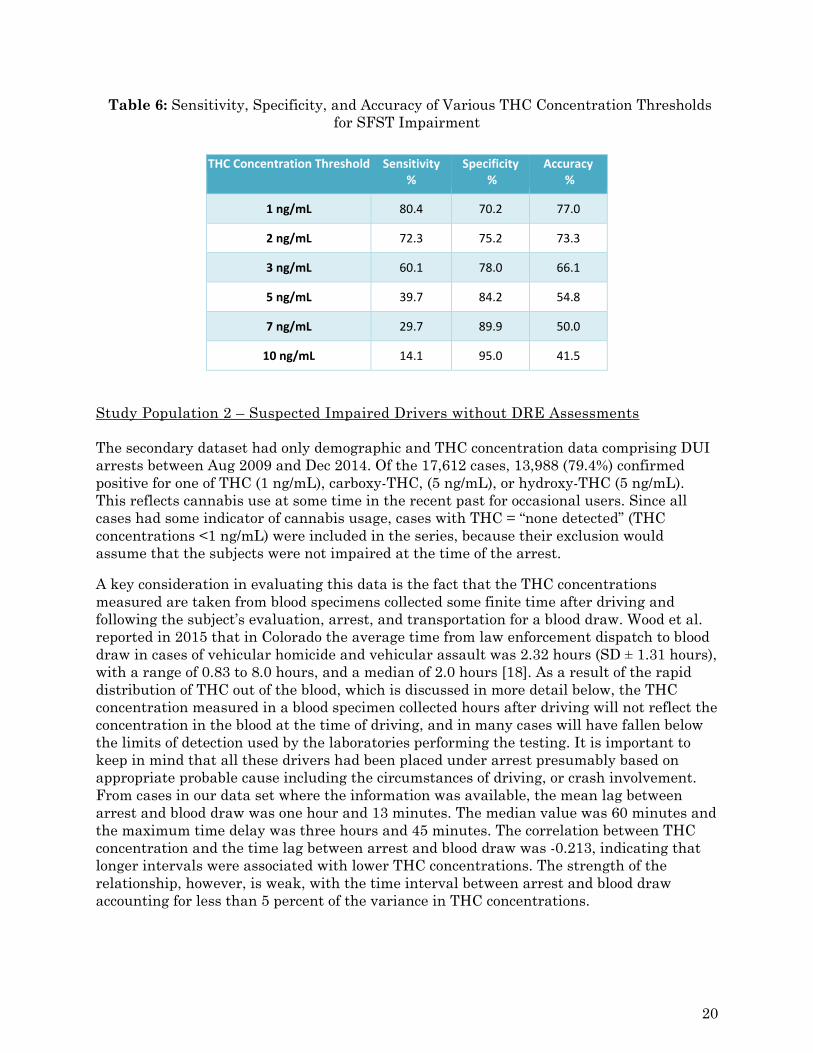
Table 6: Sensitivity, Specificity, and Accuracy of Various THC Concentration Thresholds for SFST Impairment
THC Concentration Threshold Sensitivity %
Specificity %
Accuracy %
1 ng/mL 80.4 70.2 77.0
2 ng/mL 72.3 75.2 73.3
3 ng/mL 60.1 78.0 66.1
5 ng/mL 39.7 84.2 54.8
7 ng/mL 29.7 89.9 50.0
10 ng/mL 14.1 95.0 41.5
Study Population 2 – Suspected Impaired Drivers without DRE Assessments The secondary dataset had only demographic and THC concentration data comprising DUI arrests between Aug 2009 and Dec 2014. Of the 17,612 cases, 13,988 (79.4%) confirmed positive for one of THC (1 ng/mL), carboxy-THC, (5 ng/mL), or hydroxy-THC (5 ng/mL). This reflects cannabis use at some time in the recent past for occasional users. Since all cases had some indicator of cannabis usage, cases with THC = “none detected” (THC concentrations <1 ng/mL) were included in the series, because their exclusion would assume that the subjects were not impaired at the time of the arrest.
A key consideration in evaluating this data is the fact that the THC concentrations measured are taken from blood specimens collected some finite time after driving and following the subject’s evaluation, arrest, and transportation for a blood draw. Wood et al. reported in 2015 that in Colorado the average time from law enforcement dispatch to blood draw in cases of vehicular homicide and vehicular assault was 2.32 hours (SD ± 1.31 hours), with a range of 0.83 to 8.0 hours, and a median of 2.0 hours [18]. As a result of the rapid distribution of THC out of the blood, which is discussed in more detail below, the THC concentration measured in a blood specimen collected hours after driving will not reflect the concentration in the blood at the time of driving, and in many cases will have fallen below the limits of detection used by the laboratories performing the testing. It is important to keep in mind that all these drivers had been placed under arrest presumably based on appropriate probable cause including the circumstances of driving, or crash involvement. From cases in our data set where the information was available, the mean lag between arrest and blood draw was one hour and 13 minutes. The median value was 60 minutes and the maximum time delay was three hours and 45 minutes. The correlation between THC concentration and the time lag between arrest and blood draw was -0.213, indicating that longer intervals were associated with lower THC concentrations. The strength of the relationship, however, is weak, with the time interval between arrest and blood draw accounting for less than 5 percent of the variance in THC concentrations.
20
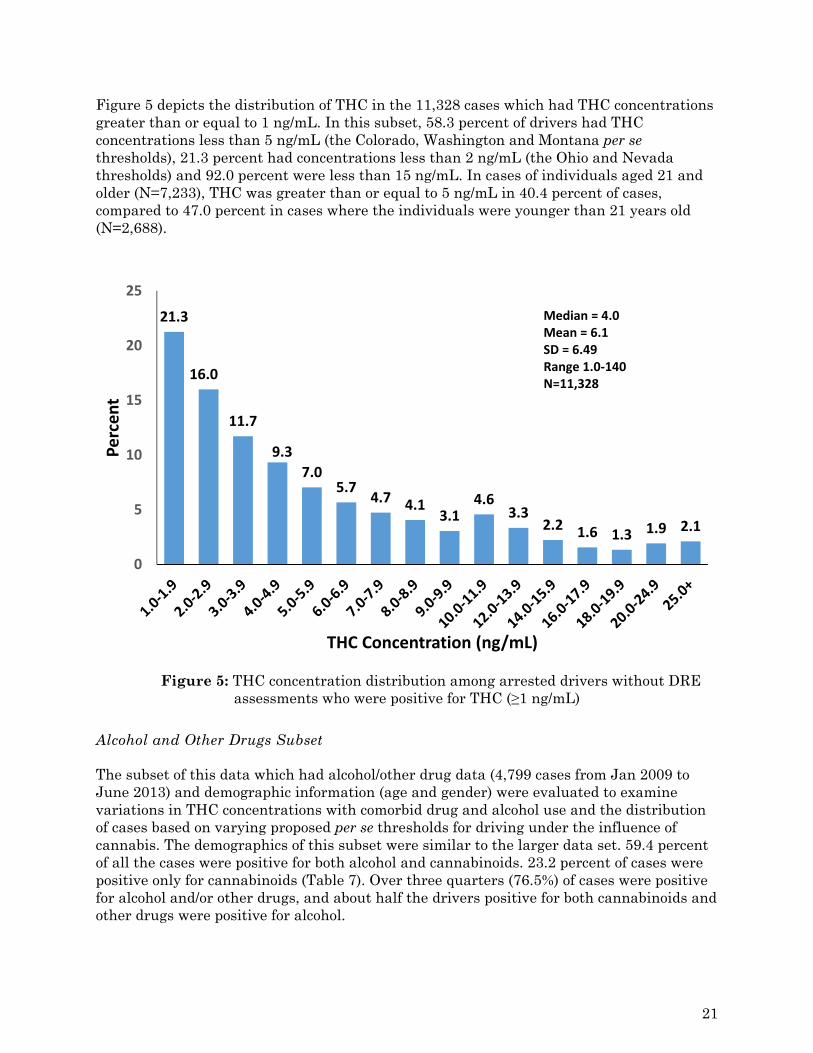
Figure 5 depicts the distribution of THC in the 11,328 cases which had THC concentrations greater than or equal to 1 ng/mL. In this subset, 58.3 percent of drivers had THC concentrations less than 5 ng/mL (the Colorado, Washington and Montana per se thresholds), 21.3 percent had concentrations less than 2 ng/mL (the Ohio and Nevada thresholds) and 92.0 percent were less than 15 ng/mL. In cases of individuals aged 21 and older (N=7,233), THC was greater than or equal to 5 ng/mL in 40.4 percent of cases, compared to 47.0 percent in cases where the individuals were younger than 21 years old (N=2,688).
Figure 5: THC concentration distribution among arrested drivers without DRE assessments who were positive for THC (≥1 ng/mL)
Alcohol and Other Drugs Subset The subset of this data which had alcohol/other drug data (4,799 cases from Jan 2009 to June 2013) and demographic information (age and gender) were evaluated to examine variations in THC concentrations with comorbid drug and alcohol use and the distribution of cases based on varying proposed per se thresholds for driving under the influence of cannabis. The demographics of this subset were similar to the larger data set. 59.4 percent of all the cases were positive for both alcohol and cannabinoids. 23.2 percent of cases were positive only for cannabinoids (Table 7). Over three quarters (76.5%) of cases were positive for alcohol and/or other drugs, and about half the drivers positive for both cannabinoids and other drugs were positive for alcohol.
21.3
16.0
11.7
9.3
7.05.7
4.7 4.13.1
4.63.3
2.2 1.6 1.3 1.9 2.1
0
5
10
15
20
25
Percent
THC Concentration (ng/mL)
Median = 4.0Mean = 6.1SD = 6.49Range 1.0‐140N=11,328
21
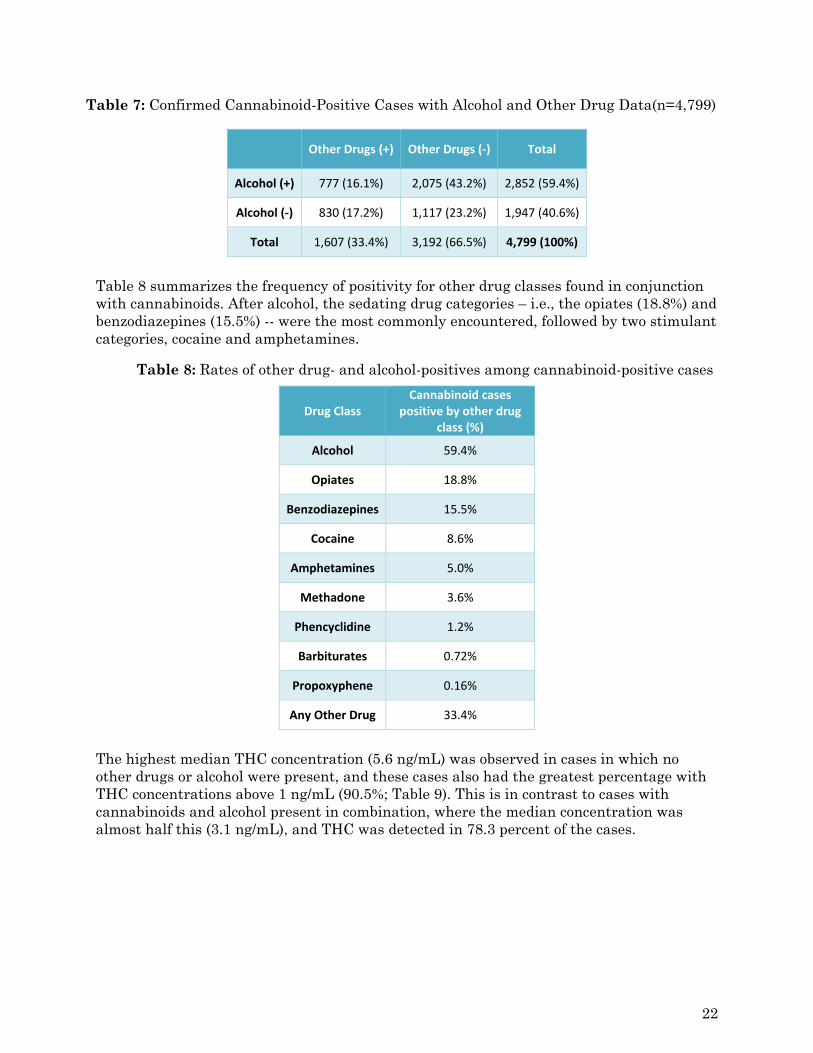
Table 7: Confirmed Cannabinoid-Positive Cases with Alcohol and Other Drug Data(n=4,799)
Other Drugs (+) Other Drugs (‐) Total
Alcohol (+) 777 (16.1%) 2,075 (43.2%) 2,852 (59.4%)
Alcohol (‐) 830 (17.2%) 1,117 (23.2%) 1,947 (40.6%)
Total 1,607 (33.4%) 3,192 (66.5%) 4,799 (100%)
Table 8 summarizes the frequency of positivity for other drug classes found in conjunction with cannabinoids. After alcohol, the sedating drug categories – i.e., the opiates (18.8%) and benzodiazepines (15.5%) -- were the most commonly encountered, followed by two stimulant categories, cocaine and amphetamines.
Table 8: Rates of other drug- and alcohol-positives among cannabinoid-positive cases
Drug Class Cannabinoid cases
positive by other drug class (%)
Alcohol 59.4%
Opiates 18.8%
Benzodiazepines 15.5%
Cocaine 8.6%
Amphetamines 5.0%
Methadone 3.6%
Phencyclidine 1.2%
Barbiturates 0.72%
Propoxyphene 0.16%
Any Other Drug 33.4%
The highest median THC concentration (5.6 ng/mL) was observed in cases in which no other drugs or alcohol were present, and these cases also had the greatest percentage with THC concentrations above 1 ng/mL (90.5%; Table 9). This is in contrast to cases with cannabinoids and alcohol present in combination, where the median concentration was almost half this (3.1 ng/mL), and THC was detected in 78.3 percent of the cases.
22
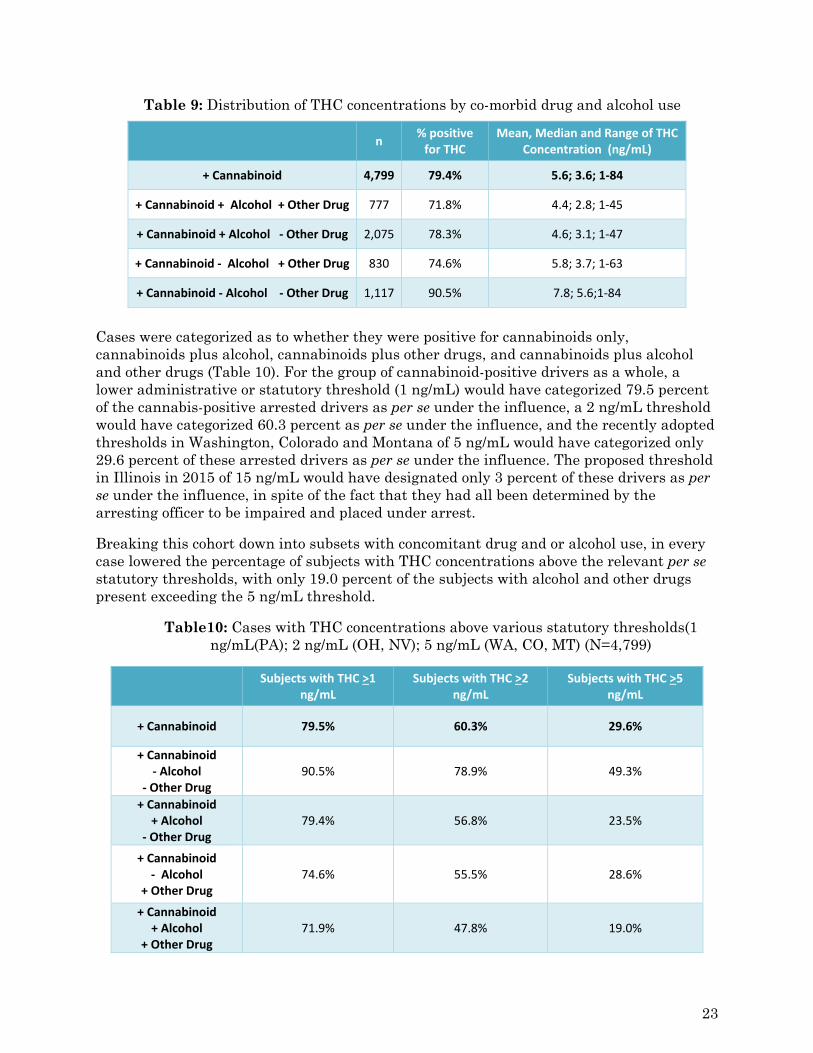
Table 9: Distribution of THC concentrations by co-morbid drug and alcohol use
n % positive for THC
Mean, Median and Range of THC Concentration (ng/mL)
+ Cannabinoid 4,799 79.4% 5.6; 3.6; 1‐84
+ Cannabinoid + Alcohol + Other Drug 777 71.8% 4.4; 2.8; 1‐45
+ Cannabinoid + Alcohol ‐ Other Drug 2,075 78.3% 4.6; 3.1; 1‐47
+ Cannabinoid ‐ Alcohol + Other Drug 830 74.6% 5.8; 3.7; 1‐63
+ Cannabinoid ‐ Alcohol ‐ Other Drug 1,117 90.5% 7.8; 5.6;1‐84
Cases were categorized as to whether they were positive for cannabinoids only, cannabinoids plus alcohol, cannabinoids plus other drugs, and cannabinoids plus alcohol and other drugs (Table 10). For the group of cannabinoid-positive drivers as a whole, a lower administrative or statutory threshold (1 ng/mL) would have categorized 79.5 percent of the cannabis-positive arrested drivers as per se under the influence, a 2 ng/mL threshold would have categorized 60.3 percent as per se under the influence, and the recently adopted thresholds in Washington, Colorado and Montana of 5 ng/mL would have categorized only 29.6 percent of these arrested drivers as per se under the influence. The proposed threshold in Illinois in 2015 of 15 ng/mL would have designated only 3 percent of these drivers as per se under the influence, in spite of the fact that they had all been determined by the arresting officer to be impaired and placed under arrest.
Breaking this cohort down into subsets with concomitant drug and or alcohol use, in every case lowered the percentage of subjects with THC concentrations above the relevant per se statutory thresholds, with only 19.0 percent of the subjects with alcohol and other drugs present exceeding the 5 ng/mL threshold.
Table10: Cases with THC concentrations above various statutory thresholds(1 ng/mL(PA); 2 ng/mL (OH, NV); 5 ng/mL (WA, CO, MT) (N=4,799)
Subjects with THC >1
ng/mL Subjects with THC >2
ng/mL Subjects with THC >5
ng/mL
+ Cannabinoid 79.5% 60.3% 29.6%
+ Cannabinoid ‐ Alcohol
‐ Other Drug 90.5% 78.9% 49.3%
+ Cannabinoid + Alcohol
‐ Other Drug 79.4% 56.8% 23.5%
+ Cannabinoid ‐ Alcohol
+ Other Drug 74.6% 55.5% 28.6%
+ Cannabinoid + Alcohol
+ Other Drug 71.9% 47.8% 19.0%
23
Discussion In response to the growing liberalization of laws governing the use of cannabis for medical and recreational purposes, both proponents and opponents of this trend have expressed concern about the potential for increased traffic crashes involving drivers whose ability to operate their vehicle has been compromised by the use of cannabis. In response, several states have implemented per se limits that define the offense of driving while impaired by cannabis, and others are actively considering such limits. However, legislators and scientists struggle with the question of determining an appropriate science-based limit for cannabis use by drivers. Unlike in the case of alcohol, where substantial experimental and epidemiological evidence was available to guide and support the setting of an evidence-based per se limit, the relevant research data relating to cannabis is limited and the findings are often inconclusive. The purpose of the present study was to provide guidance in determining an appropriate response to the issue of driving after cannabis use through a detailed examination of data available from cannabis-positive drivers arrested for suspected driving under the influence. We acknowledge that the number of cases we were able to consolidate which had the necessary comprehensive data to meet our criteria for inclusion limits the statistical power of our assessment.
Following cannabis use, THC concentrations decrease rapidly as a result of metabolism and distribution into tissues including the brain, and blood THC concentrations drop rapidly. In occasional marijuana users, the maximum THC blood concentration was achieved an average of 0.5 hours after smoking and the THC concentration dropped below 5 ng/mL in 1-2 hours [20]. In frequent smokers the drop below 5 ng/mL occurred 3-4 hours after smoking. This time lag is therefore a critical factor in determining how much THC remains in the subject’s venous blood at the time the specimen is collected. Blood specimens are generally taken following the DEC evaluation. In many cases this requires the driver to be taken to a health facility to have the specimen drawn by a qualified phlebotomist, all of which takes time, and contributes to a gap between the measured blood THC concentration and that present at the time of driving. In our study population I (DRE tested drivers) this time lag was 74.5 min (mean) and 61 minutes (median).
The DRE symptomatology matrix (Appendix C) indicates the following symptoms can be indicative of cannabinoid exposure: lack of convergence, dilated pupils, increased pulse rate and increased blood pressure [13]. The data we acquired regarding cannabis-positive drivers subjected to the DEC exam and arrested for suspected impaired driving provides supporting evidence that cannabis-positive suspected impaired drivers are more likely to present signs and symptoms associated with cannabis use than drug-negative subjects. Drivers positive for THC in blood were significantly more likely than cannabis-negative subjects to display bloodshot eyes, reddened conjunctivae, droopy eyelids, inability to cross one’s eyes, eyelid tremors, dilated pupils, rebound dilation, as well as elevated blood pressure and pulse. Cannabis-positive drivers also demonstrated more indicators of impairment on the walk-and-turn and one-leg-stand tests, more misses on the finger-to-nose test and greater sway on the Romberg balance test. Three previous controlled administration studies have reported diminished performance on the one-leg-stand test following cannabis use, but reported conflicting results for the walk-and-turn and HGN [14], [21], [22]. The findings of this study support generally poorer performance in the field sobriety tests among cannabis-positive subjects.
24
Blood THC concentrations in arrested drivers were quite variable and ranged from 1-47 ng/mL, which could reflect both different doses and different times since last use. Approximately half of all cases had a THC level of less than 5 ng/mL, the per se threshold for impaired driving in Montana and Washington, and the presumptive concentration in Colorado. The only indicator found to discriminate between drivers above and below this threshold was the number of misses on the finger-to-nose test. Drivers with THC concentrations of at least 5 ng/mL evidenced more “misses”. In particular, they were more likely to miss on all 6 attempts. These data indicate that drivers with THC concentrations below 5 ng/mL are just as likely as those with higher THC concentrations to show signs and symptoms consistent with cannabis use and impairment.
Can a science-based blood THC concentration per se threshold be established?
A key issue in this study is the utility and validity of establishing a threshold concentration that could be used to establish evidence of driver impairment. In particular, because Washington, Montana and Colorado have established 5 ng/mL THC in blood as a per se or presumptive limit for cannabis in drivers, attention has focused on this value. A variety of measures from the DEC program evaluations were examined to determine if there were differences in the rates of occurrence of indicators of drug influence and/or impairment between drivers with blood THC concentrations above and below 5 ng/mL.
The evidence was very clear that 5 ng/mL was not a good discriminator of impairment. There are reasonable pharmacokinetic characteristics of this drug that would make that finding unsurprising. For water-soluble drugs that have a long half-life of the order of several hours or days, the drug profile in the blood roughly mirrors the kinetics of the drugs distribution into the central nervous system, so the blood concentration is a good surrogate for the concentration in the brain, or at least the course of the effect from onset through peak effect to recovery. For drugs like THC that are lipid-soluble and have a short distribution half-life, the drug is taken up rapidly into the brain and other fatty tissues where it concentrates while the concentration in the blood declines rapidly. Consequently, the blood concentration is not a useful surrogate for the effect experienced by the subject, especially as the time between ingestion and specimen collection increases beyond a few minutes. The practical reality of identifying evaluating, arresting, and sampling suspected impaired drivers means that the THC concentration measured in the blood specimen reflects neither the concentration in the subject’s blood at the time of arrest, nor the concentration of active drug in the brain.
Based on the THC concentration distribution in the larger population 2 data set of arrested drivers and similar observations by other groups, indiscriminate selection of a 5 ng/mL threshold for per se laws virtually guarantees that approximately 70 percent of all cannabis using drivers, whose actions led to them being arrested, will escape prosecution under a 5 ng/mL per se standard.
The results of the analysis of various per se thresholds provided insight into the selection of the THC concentration that would best distinguish between drivers who were impaired and those who were not (as determined by performance on the SFST). Overall, THC concentration was only a fair indicator of impairment. As THC concentration used as a criterion score increased, sensitivity decreased. This means that the ability to accurately identify impaired drivers diminished as the concentration of THC used as a cutoff score (or
25
possible per se threshold) increased. The THC concentration which had the highest sensitivity (80.4%) for impaired performance on the SFST was 1 ng/mL. Even a small increase in the THC threshold to 3 ng/mL reduced sensitivity to 60.1 percent.
It can be argued that even with an ineffective per se standard in place, the statutory framework still allows for prosecution on an “affected by” standard. This is the case with alcohol, a legal substance where an impairment standard exists side-by-side with a quantitative per se standard. However, a distinguishing feature is that the alcohol per se standard is evidence based and based on scientific evidence of impairment in virtually all drivers at 0.08 g/dL [23]. Furthermore, experience has taught us that establishing a per se standard for impairment becomes viewed in the mind of much of the public as an “illegal limit”, and there are in our experience few prosecutions of drivers with blood alcohol concentrations below the 0.08 per se limit, which as our data illustrates in the case of THC, would be the majority of arrests. Jurisdictions choosing to adopt a per se standard for THC of 5 ng/mL would need to be prepared to educate the public that it is not necessarily “safe” to drive with a THC level between 0 and 5 ng/mL, and prosecutors would have to be prepared to prosecute these low THC cases when the objective evidence of impairment is present, irrespective of the THC concentration.
Considering a lower per se threshold starts to encompass individual heavy users of cannabis with residual THC concentrations long after use, or passive inhalation of THC from side-stream smoke under some extreme circumstances [24]. Higher concentrations, for example, 5ng/mL, result in increasingly smaller percentages of arrested, impaired drivers being over this arbitrary limit, to the point where the law becomes meaningless, and as discussed below runs the risk of diluting the message about the risks of cannabis-impaired driving.
An additional consideration that undermines the effectiveness and fairness of a per se standard for THC is that the cannabis user has no meaningful way of knowing what their blood THC concentration is either at the time of a driving event, such as an offense or crash, or predicting what it might be at the time of sampling, so can’t make an informed and responsible decision about whether to drive based on their concentration. In addition, the time between the event and collection of a blood specimen will affect the blood concentration observed in the test. Thus a subject arrested near a hospital will likely have a specimen with a higher concentration than a subject arrested in a rural area where transport time will be longer. Since this time factor is outside of the control of the subject, it makes at least a component of the per se law’s impact on the driver, arbitrary. Certainly the greater amount of time a cannabis user waits after their last inhalation of smoked cannabis, reduces their risk of being over the per se threshold.
Experimental studies have demonstrated under one smoking scenario in occasional and frequent cannabis users that effects such as feeling stoned, high, sedated, and restless persisted for up to three and a half hours after smoking, while studies of oral ingestion of THC suggest a longer window of self-perceived effect and demonstrable impairment of up to eight hours [25], [26]. Consequently, cannabis users could be counseled through public education campaigns to observe a time-based restriction on their driving of perhaps four to six hours following smoking, or six to eight hours following oral ingestion. This would significantly reduce the risk of them driving impaired, but would not eliminate it, due to factors such as the highly variable THC content of botanical cannabis and edible products, and influence of smoking pattern and physiology on THC concentrations. These factors
26
would render this responsible use “timeframe” advice as more general guidance, and wouldn’t necessarily prevent all impaired drivers from driving, depending on their individual physiology, tolerance, and circumstances/manner of use.
Part of the value of alcohol per se laws is the general deterrent impact. Research has demonstrated the impact of per se laws for alcohol [27], [28]. Drinkers know there is a limit so most at least attempt to control their consumption when driving. A cannabis per se law would be difficult to explain to the public but would likely have at least a small deterrent effect.
In the absence of a scientifically based cannabis per se law, there are several options. One is to train officers to detect the signs and symptoms of cannabis use in drivers stopped at roadside. Initial suspicion of cannabis use would lead to a field sobriety test (SFST). This process could be coupled with rapid, on-site oral fluid screening for evidence of drug use. The technology to detect certain drugs (including cannabis) in a specimen of oral fluid quickly at roadside is improving and could be used in a manner comparable to preliminary breath testing devices currently used to test for alcohol. The suspect would then be taken for a complete drug evaluation by a DRE. This approach requires enhancing the complement of DRE officers available to conduct assessments for impairment.
The DEC approach, however, does have limitations, including the availability of DRE certified officers to attend and evaluate subjects in a timely manner. The IACP 2014 DRE Section report indicates that in 2014, there were 26,471 enforcement evaluations performed in the United States by 5,098 DRE officers representing 2,176 police agencies or locations [29]. Agency policy of when DREs respond, interagency collaborations in providing DRE officers to cover each other’s’ cases, and DRE availability late at night when many of these arrests are made, all may limit the availability of a DRE to respond. In addition, the DEC program requires recertification every two years, and not all officers recertify.
This is not a rejection of the principle of the per se approach to illegal drugs other than cannabis that have slower elimination rates and for which a blood concentration taken at a later time reasonably reflects the amount of drug in the driver’s blood at the time of driving. However, there is no evidence we have been able to identify about how drug per se laws impact rates of prosecution or outcomes, in terms of arrests, convictions or fatalities.
Another approach based on that in place in Colorado would be to adopt a rebuttable presumption of impairment at a low blood THC concentration (i.e.1 or 2 ng/mL) and provide offenders with the opportunity to show they are not impaired. However, this approach can be cumbersome and lead to lengthy trials. It also raises inevitable objections that such laws are shifting the burden to the defendant to prove their innocence.
Consideration should also be given to a zero limit for THC for young drivers as is done under the Washington law, and for new and novice drivers. This approach has been found to be effective to some degree for alcohol [30], [31]. Given that a high proportion of cannabis users and of DUI arrestees are under the age of 24, the deterrent impact could be substantial. This is feasible because even states with recreational cannabis use prohibit its use by individuals under the age of 21.
A limitation of this approach to assessing impairment is that all our subjects have been identified as a result of being arrested for impaired driving, with exception of the drug-
27
negative controls in population 1. We have no information, therefore, on the extent of impairment or concentrations of THC among drivers who have not been arrested, and to what extent they overlap with this population. It could be argued that the lack of impairment among this latter group might have precluded their inclusion in one or the other of our study samples.
Nevertheless, our study provides valuable information about the THC concentrations among cannabis-positive individuals who have been arrested for impaired driving. The data do not support science-based per se limits for THC.
28
References
[1] “Results from the 2013 National Survey on Drug Use and Health: Summary of National Findings,” Substance Abuse and Mental Hea lth Services Administration, NSDUH Series H-48, HHS Publication No. (SMA) 14-4863, 2014.
[2] A. W. Jones, F. C. Kugelberg, A. Holmgren, and J. Ahlner, “Five-year update on the
occurrence of alcohol and other drugs in blood samples from drivers killed in road-traffic crashes in Sweden,” Forensic Sci. Int., vol. 186, no. 1–3, pp. 56–62, Apr. 2009.
[3] “The 2013 Annual Report of the Drug Recognition Expert Section,” International
Association of Chiefs of Police, Alexandria, VA, 2014. [4] Lacey, J.H, Kelley-Baker, T., Furr-Holden, D., Voas, R.B., Romano, Ed. Ramirez, A.,
Brainard, K., Moore, C, “2007 National Roadside Survey of Alcohol and Drug Use by Drivers: Drug Results,” NHTSA’s Office of Behavioral Safety Research, 2007.
[5] A. Orens, M. Light, J. Rowberry, J. Matsen, and B. Lewandowski, “Marijuana
Equivalency in Portion and Dosage,” Colorado Department of Revenue, 2015. [6] A. J. Porath-Waller, R. Notarandrea, and F. J. Vaccarino, “Young brains on cannabis:
It’s time to clear the smoke,” Clin. Pharmacol. Ther., vol. 97, no. 6, pp. 551–552, Jun. 2015.
[7] Berning A., Compton, R., Wochinger, K., “2013-2014 National Roadside Survey of
Alcohol and Drug Use by Drivers,” NHTSA’s Office of Behavioral Safety Research, 2015.
[8] “The DEC Standards Revision Subcommittee of the Technical Advisory Panel of the
IACP Highway Safety Committee,” International Association of Chiefs of Police (IACP), Alexandria, VA, 1999.
[9] M. Asbridge, “Driving after marijuana use: the changing face of ‘impaired’ driving,”
JAMA Pediatr., vol. 168, no. 7, pp. 602–604, Jul. 2014.
[10] M. Asbridge, J. A. Hayden, and J. L. Cartwright, “Acute cannabis consumption and motor vehicle collision risk: systematic review of observational studies and meta-analysis,” BMJ, vol. 344, p. e536, 2012.
[11] R. Elvik, “Risk of road accident associated with the use of drugs: a systematic review
and meta-analysis of evidence from epidemiological studies,” Accid. Anal. Prev., vol. 60, pp. 254–267, Nov. 2013.
[12] R. P. Compton and A. Berning, “Drug and alcohol crash risk,” National Highway
Traffic Safety Administration, Washington, DC, Research Note DOT HS 812 117, Feb. 2015.
29
[13] E. M. Kosnoski, R. L. Yolton, K. Citek, C. E. Hayes, and R. B. Evans, “The Drug Evaluation Classification Program: using ocular and other signs to detect drug intoxication,” J. Am. Optom. Assoc., vol. 69, no. 4, pp. 211–227, Apr. 1998.
[14] W. M. Bosker, E. L. Theunissen, S. Conen, K. P. C. Kuypers, W. K. Jeffery, H. C.
Walls, G. F. Kauert, S. W. Toennes, M. R. Moeller, and J. G. Ramaekers, “A placebo-controlled study to assess Standardized Field Sobriety Tests performance during alcohol and cannabis intoxication in heavy cannabis users and accuracy of point of collection testing devices for detecting THC in oral fluid,” Psychopharmacology (Berl.), vol. 223, no. 4, pp. 439–446, Oct. 2012.
[15] “Drug Evaluation and Classification Training: ‘The Drug Recognition Expert School,’
Student Manual,” National Highway Traffic Safety Administration, HS 172 R01/11, Jan. 2011.
[16] L. J. Farrell, S. Kerrigan, and B. K. Logan, “Recommendations for toxicological
investigation of drug impaired driving,” J. Forensic Sci., vol. 52, no. 5, pp. 1214–1218, Sep. 2007.
[17] B. K. Logan, K. J. Lowrie, J. L. Turri, J. K. Yeakel, J. F. Limoges, A. K. Miles, C. E.
Scarneo, S. Kerrigan, and L. J. Farrell, “Recommendations for toxicological investigation of drug-impaired driving and motor vehicle fatalities,” J. Anal. Toxicol., vol. 37, no. 8, pp. 552–558, Oct. 2013.
[18] E. Wood, A. Brooks-Russell, and P. Drum, “Delays in DUI blood testing: Impact on
cannabis DUI assessments,” Traffic Inj. Prev., p. 0, Jun. 2015. [19] F. Grotenhermen, G. Leson, G. Berghaus, O. H. Drummer, H.-P. Krüger, M. Longo,
H. Moskowitz, B. Perrine, J. G. Ramaekers, A. Smiley, and R. Tunbridge, “Developing limits for driving under cannabis,” Addict. Abingdon Engl., vol. 102, no. 12, pp. 1910–1917, Dec. 2007.
[20] N. A. Desrosiers, S. K. Himes, K. B. Scheidweiler, M. Concheiro-Guisan, D. A.
Gorelick, and M. A. Huestis, “Phase I and II cannabinoid disposition in blood and plasma of occasional and frequent smokers following controlled smoked cannabis,” Clin. Chem., vol. 60, no. 4, pp. 631–643, Apr. 2014.
[21] K. Papafotiou, J. D. Carter, and C. Stough, “An evaluation of the sensitivity of the
Standardised Field Sobriety Tests (SFSTs) to detect impairment due to marijuana intoxication,” Psychopharmacology (Berl.), vol. 180, no. 1, pp. 107–114, Jun. 2005.
[22] A. J. Porath-Waller and D. J. Beirness, “An Examination of the Validity of the
Standardized Field Sobriety Test in Detecting Drug Impairment Using Data from the Drug Evaluation and Classification Program,” Traffic Inj. Prev., vol. 15, no. 2, pp. 125–131, Feb. 2014.
30
[23] H. Moskowit and D. Fiorentino, “A Review of the Literature on the Effects of Low Doses of Alcohol on Driving-Related Skills,” U.S. Department of Transportation National Highway Traffic Safety Administration, Washington, DC, 2000.
[24] E. J. Cone, G. E. Bigelow, E. S. Herrmann, J. M. Mitchell, C. LoDico, R. Flegel, and
R. Vandrey, “Nonsmoker Exposure to Secondhand Cannabis Smoke. III. Oral Fluid and Blood Drug Concentrations and Corresponding Subjective Effects,” J. Anal. Toxicol., vol. 39, no. 7, pp. 497–509, Sep. 2015.
[25] N. A. Desrosiers, J. G. Ramaekers, E. Chauchard, D. A. Gorelick, and M. A. Huestis,
“Smoked cannabis’ psychomotor and neurocognitive effects in occasional and frequent smokers,” J. Anal. Toxicol., vol. 39, no. 4, pp. 251–261, May 2015.
[26] H. V. Curran, C. Brignell, S. Fletcher, P. Middleton, and J. Henry, “Cognitive and
subjective dose-response effects of acute oral Delta 9-tetrahydrocannabinol (THC) in infrequent cannabis users,” Psychopharmacology (Berl.), vol. 164, no. 1, pp. 61–70, Oct. 2002.
[27] A. S. Tippetts, R. B. Voas, J. C. Fell, and J. L. Nichols, “A meta-analysis of .08 BAC
laws in 19 jurisdictions in the United States,” Accid. Anal. Prev., vol. 37, no. 1, pp. 149–161, Jan. 2005.
[28] A. Villaveces, P. Cummings, T. D. Koepsell, F. P. Rivara, T. Lumley, and J. Moffat,
“Association of alcohol-related laws with deaths due to motor vehicle and motorcycle crashes in the United States, 1980-1997,” Am. J. Epidemiol., vol. 157, no. 2, pp. 131–140, Jan. 2003.
[29] “The 2014 Annual Report of the Drug Recognition Expert Section,” International
Association of Chiefs of Police, Alexandria, VA, Oct. 2015. [30] R. A. Shults, R. W. Elder, D. A. Sleet, J. L. Nichols, M. O. Alao, V. G. Carande-Kulis,
S. Zaza, D. M. Sosin, R. S. Thompson, and Task Force on Community Preventive Services, “Reviews of evidence regarding interventions to reduce alcohol-impaired driving,” Am. J. Prev. Med., vol. 21, no. 4 Suppl, pp. 66–88, Nov. 2001.
[31] Blomberg, RD, “Lower BAC limits for youth: evaluation of the Maryland .02 law.,”
National Highway Traffic Safety Administration, Washington, DC, DOT HS 807 859, 1992.
[32] E. Chamberlain, R. Solomon, and A. Kus, “Drug-Impaired Driving in Canada: Moving
Beyond American Enforcement Models,” Crim. LAW Q., vol. 60, no. 2, pp. 238–276, 2013.
[33] E. Chamberlain, R. Solomon, and A. Murie, “Reforming Canada’s new drug-impaired
driving law: the need for per se limits and random roadside screening,” presented at the International Conference on Alcohol, Drugs and Traffic Safety (T2013), 20th, 2013, Brisbane, Queensland, Australia, 2013.
31
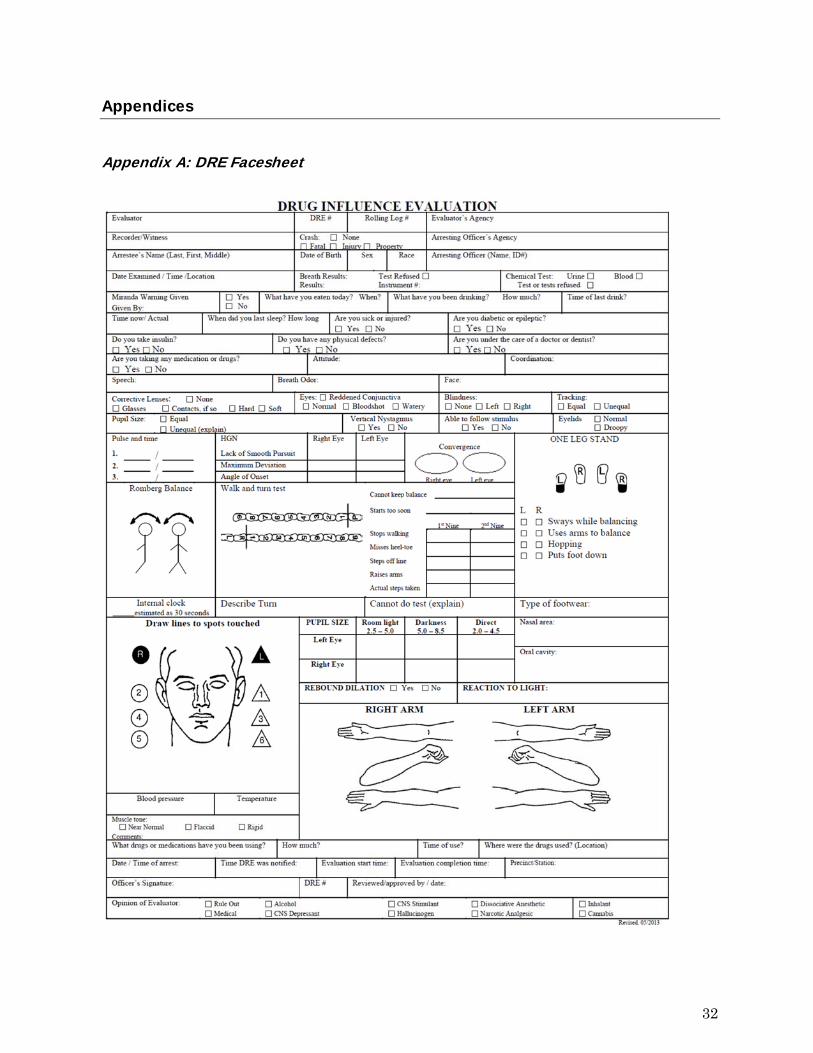
Appendices
Appendix A: DRE Facesheet
32

Appendix B: Psychophysical Tests
The Walk-and-Turn test involves taking nine heel-to-toe steps along a line, turning, and taking nine steps back according to instructions. There are eight validated clues that are scored:
Cannot keep balance Starts too soon Stops walking Misses heel to toe Steps off line Raises arms Incorrect number of steps Improper turn
Two or more of these clues are deemed by the DEC program to represent impaired performance.
The One-Leg Stand test requires the individual to stand on one foot while holding the other foot six inches above the ground for 30 seconds. There are four validated clues that are scored:
Sways while balancing Uses arms to balance Hopping Puts foot down
Two or more clues are deemed to be indicative of impaired performance. The Finger-to-Nose test (Modified Romberg Balance Test) is a classic field test of
psychomotor performance and forms part of the DEC assessment. The test requires the individual to stand with feet together, head tilted slightly back, hands at sides, with eyes closed, and on instruction touch the tip of the finger to the tip of the nose on six occasions.
33
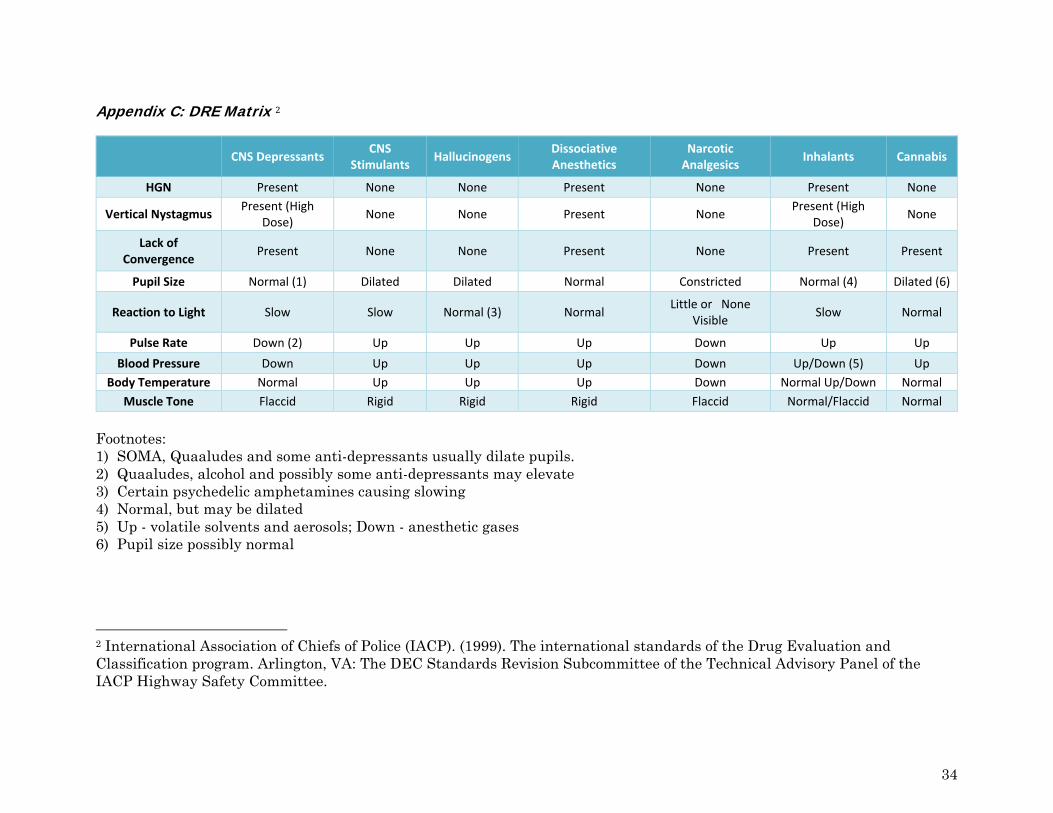
Appendix C: DRE Matrix 2
CNS Depressants CNS
Stimulants Hallucinogens
Dissociative Anesthetics
Narcotic Analgesics
Inhalants Cannabis
HGN Present None None Present None Present None
Vertical Nystagmus Present (High
Dose) None None Present None
Present (High Dose)
None
Lack of Convergence
Present None None Present None Present Present
Pupil Size Normal (1) Dilated Dilated Normal Constricted Normal (4) Dilated (6)
Reaction to Light Slow Slow Normal (3) Normal Little or None
Visible Slow Normal
Pulse Rate Down (2) Up Up Up Down Up Up
Blood Pressure Down Up Up Up Down Up/Down (5) Up
Body Temperature Normal Up Up Up Down Normal Up/Down Normal
Muscle Tone Flaccid Rigid Rigid Rigid Flaccid Normal/Flaccid Normal
Footnotes: 1) SOMA, Quaaludes and some anti-depressants usually dilate pupils. 2) Quaaludes, alcohol and possibly some anti-depressants may elevate 3) Certain psychedelic amphetamines causing slowing 4) Normal, but may be dilated 5) Up - volatile solvents and aerosols; Down - anesthetic gases 6) Pupil size possibly normal
2 International Association of Chiefs of Police (IACP). (1999). The international standards of the Drug Evaluation and Classification program. Arlington, VA: The DEC Standards Revision Subcommittee of the Technical Advisory Panel of the IACP Highway Safety Committee.
34
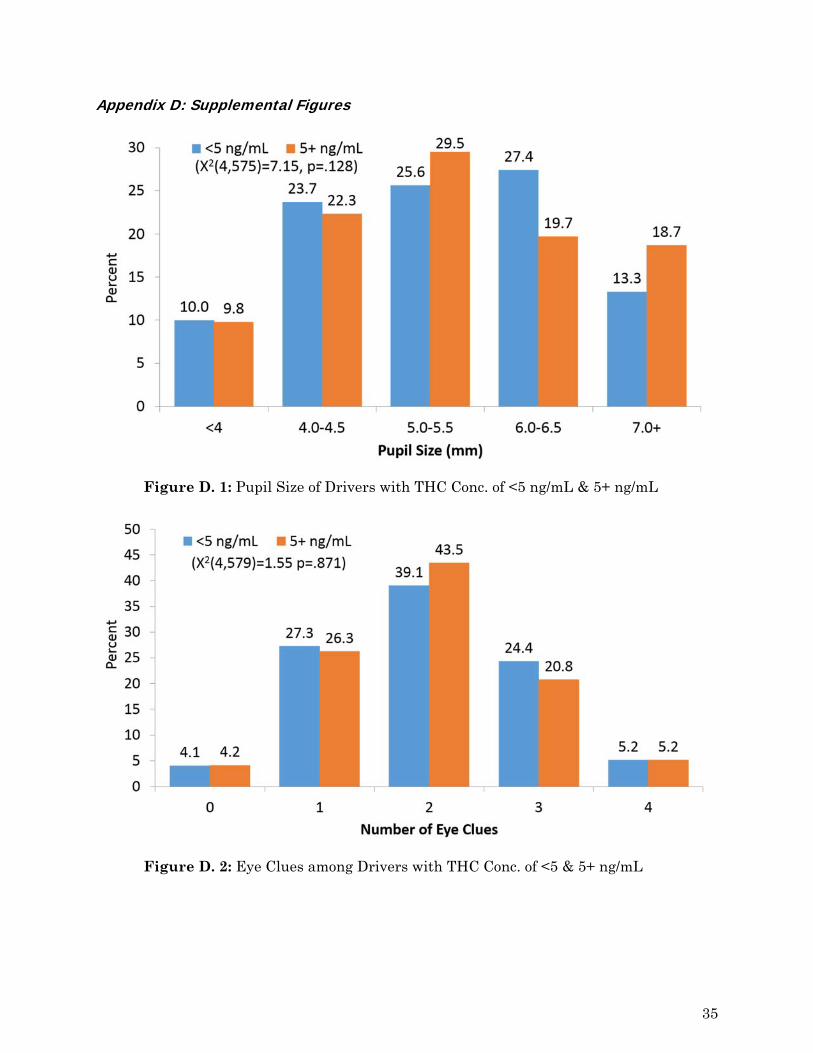
Appendix D: Supplemental Figures
Figure D. 1: Pupil Size of Drivers with THC Conc. of <5 ng/mL & 5+ ng/mL
Figure D. 2: Eye Clues among Drivers with THC Conc. of <5 & 5+ ng/mL
35
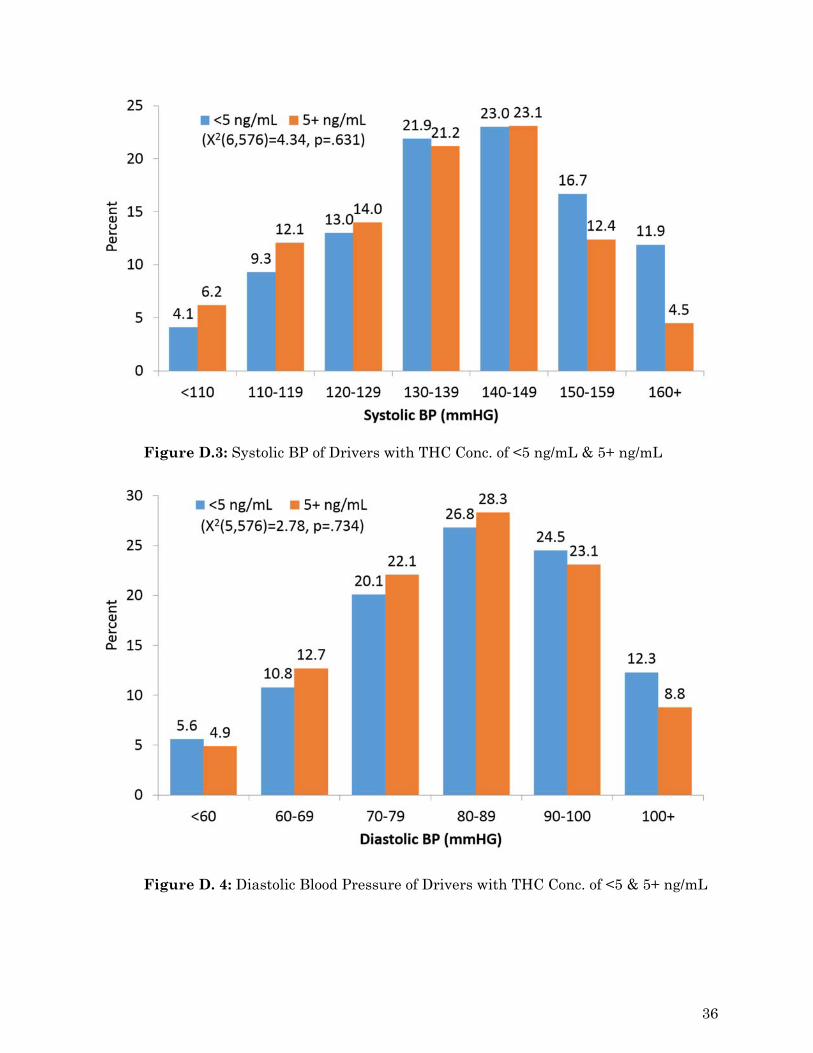
Figure D.3: Systolic BP of Drivers with THC Conc. of <5 ng/mL & 5+ ng/mL
Figure D. 4: Diastolic Blood Pressure of Drivers with THC Conc. of <5 & 5+ ng/mL
36
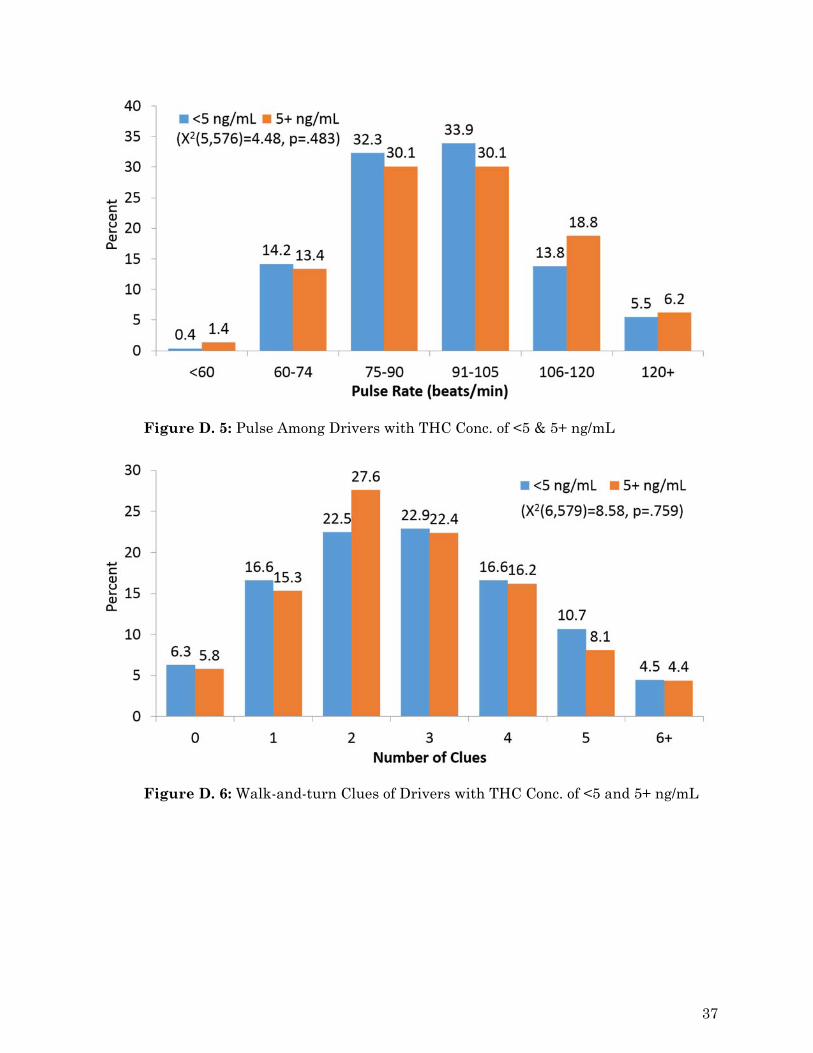
Figure D. 5: Pulse Among Drivers with THC Conc. of <5 & 5+ ng/mL
Figure D. 6: Walk-and-turn Clues of Drivers with THC Conc. of <5 and 5+ ng/mL
37
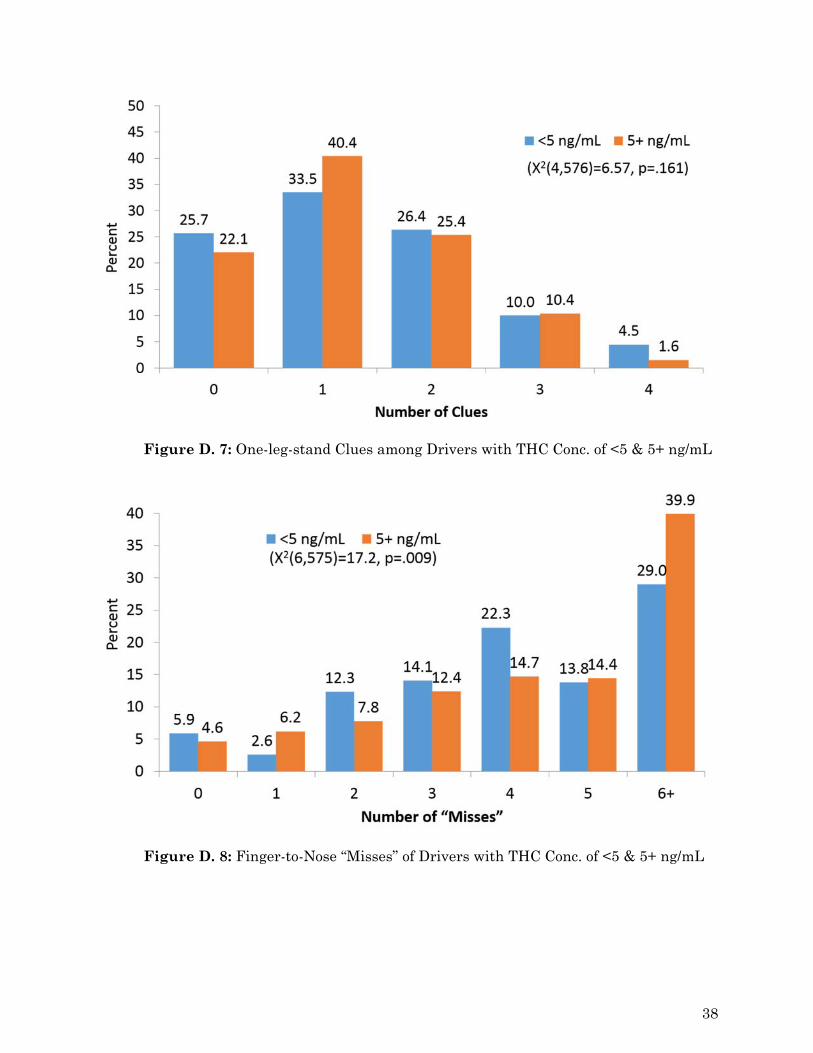
Figure D. 7: One-leg-stand Clues among Drivers with THC Conc. of <5 & 5+ ng/mL
Figure D. 8: Finger-to-Nose “Misses” of Drivers with THC Conc. of <5 & 5+ ng/mL
38
Appendix E: Literature Review
Introduction
The psychoactive effects of delta-9-tetrahydrocannabinol (THC) including relaxation, changes in perception, euphoria, feelings of well-being, reduced stress, and mild sedation have been cited as possible contributors to the documented rates of arrest and crash involvement in various driving populations. As there is an accelerating trend in the U.S. towards liberalization of laws around the cultivation, possession, and use of cannabis, either for medical purposes or more recently for recreational use, the question of the link between cannabis use and driver impairment has come to the forefront. Increasing attention is being paid by the public, legislators, and the criminal justice system, to the issue of drug impaired driving in the United States. This can be attributed to many factors including: increased training of police officers in recognizing signs of drug impairment, increased interest in prevalence, demographic and relative risk studies, and increasing (if uneven) resources being applied to drug testing suspected impaired drivers. Groups on both sides of the debate around liberalization of cannabis laws recognize the need for a better understanding of the risks and means by which to educate users about safe use of the drug as well as the need to control, regulate, legislate and subsequently enforce laws designed to reduce the risk of impairment, and associated injuries and deaths in motor vehicle crashes. The purpose of this review is to collect and summarize the current state of knowledge about the issue including information on the legal status of cannabis and state statutes which address driving under the influence of cannabis (DUIC), the prevalence of cannabis use in driving populations, the role of Drug Recognition Experts (DREs) in identifying drivers under the influence of cannabis, and the research on the potentially impairing effects of cannabis.
Legal Issues
Cannabis Possession Laws
While there has been no change to the legal status of cannabis at the federal level since the 1970’s, state laws for possession of small amounts (varies by state) continue to evolve and can loosely be divided into four groups: legalized for recreational use; decriminalized (civil offense) for recreational use; legalized for medical use; and illegal (Figure E.1). The National Organization for the Reform of Marijuana Laws (NORML) provides a thorough and regularly updated list of laws by state [1]. Legalization for recreational use in Colorado and Washington became effective in 2013 and in 2014, respectively; ballot initiatives legalizing recreational use passed in Oregon, Alaska and the District of Columbia in 2014, although implementation is still pending [1]. Some states such as Arizona and Montana have approved medical use of cannabis; however, possession without a proper prescription is punishable by incarceration. North Carolina, along with several cities and municipalities in other states, has decriminalized possession making it a civil instead of criminal offense. Decriminalization of drug possession on a municipal basis is complex, because while a city may decide not to prosecute possession as a criminal offense, the state may still do so. In addition, cannabis remains a Schedule I substance on the Federal Schedule, and the Federal Government can still prosecute possession or distribution of cannabis, arguably in
39
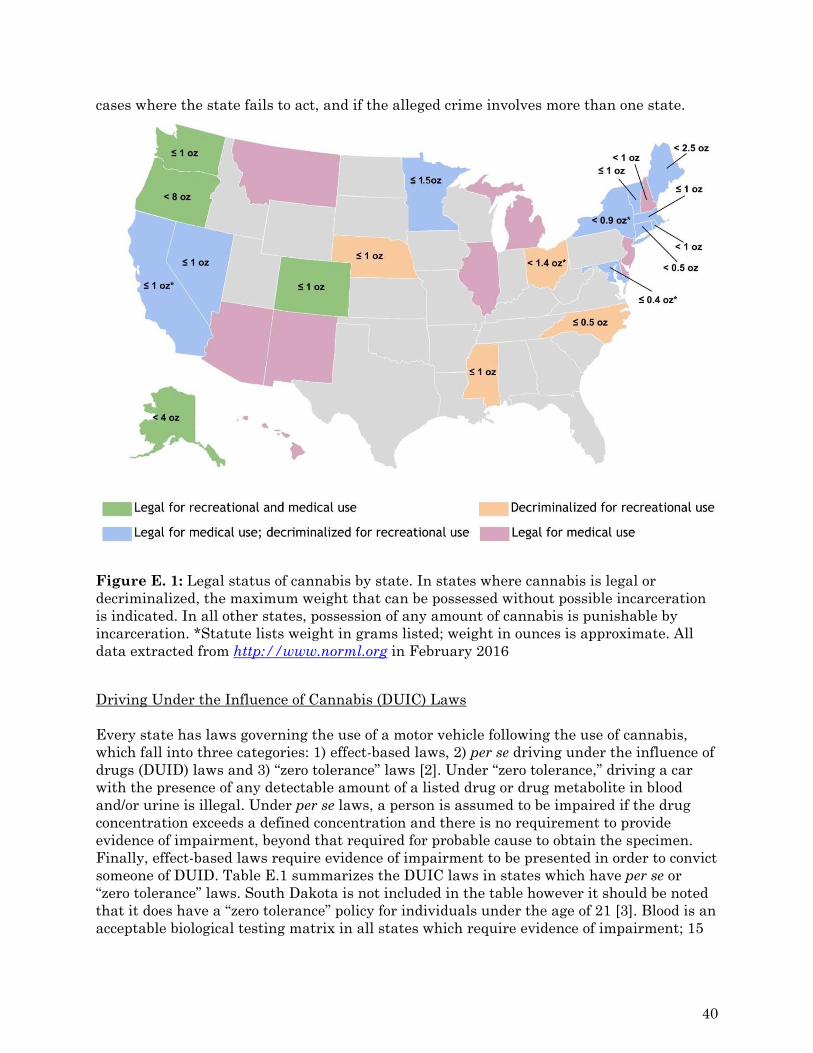
cases where the state fails to act, and if the alleged crime involves more than one state.
Figure E. 1: Legal status of cannabis by state. In states where cannabis is legal or decriminalized, the maximum weight that can be possessed without possible incarceration is indicated. In all other states, possession of any amount of cannabis is punishable by incarceration. *Statute lists weight in grams listed; weight in ounces is approximate. All data extracted from http://www.norml.org in February 2016
Driving Under the Influence of Cannabis (DUIC) Laws Every state has laws governing the use of a motor vehicle following the use of cannabis, which fall into three categories: 1) effect-based laws, 2) per se driving under the influence of drugs (DUID) laws and 3) “zero tolerance” laws [2]. Under “zero tolerance,” driving a car with the presence of any detectable amount of a listed drug or drug metabolite in blood and/or urine is illegal. Under per se laws, a person is assumed to be impaired if the drug concentration exceeds a defined concentration and there is no requirement to provide evidence of impairment, beyond that required for probable cause to obtain the specimen. Finally, effect-based laws require evidence of impairment to be presented in order to convict someone of DUID. Table E.1 summarizes the DUIC laws in states which have per se or “zero tolerance” laws. South Dakota is not included in the table however it should be noted that it does have a “zero tolerance” policy for individuals under the age of 21 [3]. Blood is an acceptable biological testing matrix in all states which require evidence of impairment; 15
40
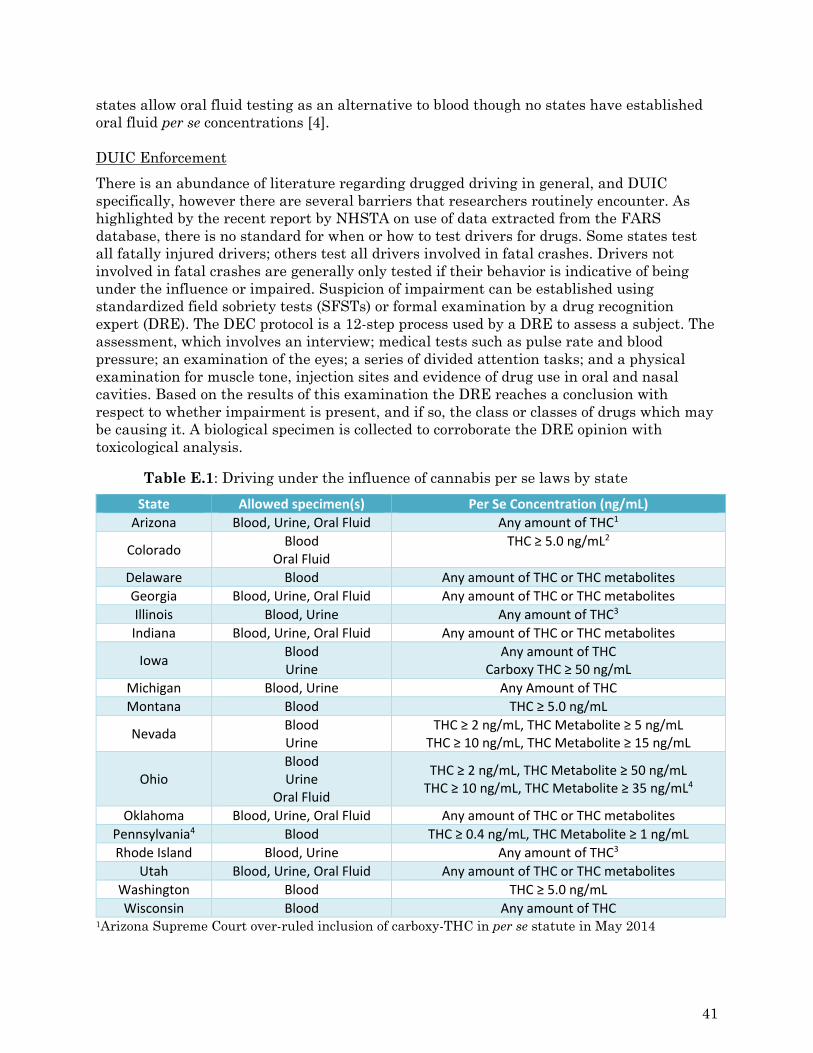
states allow oral fluid testing as an alternative to blood though no states have established oral fluid per se concentrations [4]. DUIC Enforcement
There is an abundance of literature regarding drugged driving in general, and DUIC specifically, however there are several barriers that researchers routinely encounter. As highlighted by the recent report by NHSTA on use of data extracted from the FARS database, there is no standard for when or how to test drivers for drugs. Some states test all fatally injured drivers; others test all drivers involved in fatal crashes. Drivers not involved in fatal crashes are generally only tested if their behavior is indicative of being under the influence or impaired. Suspicion of impairment can be established using standardized field sobriety tests (SFSTs) or formal examination by a drug recognition expert (DRE). The DEC protocol is a 12-step process used by a DRE to assess a subject. The assessment, which involves an interview; medical tests such as pulse rate and blood pressure; an examination of the eyes; a series of divided attention tasks; and a physical examination for muscle tone, injection sites and evidence of drug use in oral and nasal cavities. Based on the results of this examination the DRE reaches a conclusion with respect to whether impairment is present, and if so, the class or classes of drugs which may be causing it. A biological specimen is collected to corroborate the DRE opinion with toxicological analysis.
Table E.1: Driving under the influence of cannabis per se laws by state
State Allowed specimen(s) Per Se Concentration (ng/mL)
Arizona Blood, Urine, Oral Fluid Any amount of THC1
Colorado Blood
Oral Fluid THC ≥ 5.0 ng/mL2
Delaware Blood Any amount of THC or THC metabolites
Georgia Blood, Urine, Oral Fluid Any amount of THC or THC metabolites
Illinois Blood, Urine Any amount of THC3
Indiana Blood, Urine, Oral Fluid Any amount of THC or THC metabolites
Iowa Blood Urine
Any amount of THC Carboxy THC ≥ 50 ng/mL
Michigan Blood, Urine Any Amount of THC
Montana Blood THC ≥ 5.0 ng/mL
Nevada Blood Urine
THC ≥ 2 ng/mL, THC Metabolite ≥ 5 ng/mL THC ≥ 10 ng/mL, THC Metabolite ≥ 15 ng/mL
Ohio Blood Urine
Oral Fluid
THC ≥ 2 ng/mL, THC Metabolite ≥ 50 ng/mL THC ≥ 10 ng/mL, THC Metabolite ≥ 35 ng/mL4
Oklahoma Blood, Urine, Oral Fluid Any amount of THC or THC metabolites
Pennsylvania4 Blood THC ≥ 0.4 ng/mL, THC Metabolite ≥ 1 ng/mL
Rhode Island Blood, Urine Any amount of THC3
Utah Blood, Urine, Oral Fluid Any amount of THC or THC metabolites
Washington Blood THC ≥ 5.0 ng/mL
Wisconsin Blood Any amount of THC 1Arizona Supreme Court over-ruled inclusion of carboxy-THC in per se statute in May 2014
41
2Colorado’s law is a “permissible inference” standard not strictly “per se”, since the defendant can provide evidence in rebuttal to demonstrate that they were not impaired. 2Law specifies presence must be the result of unlawful use of cannabis 3If alcohol or other drugs are present the per se THC Metabolite concentrations are 15 and 5 ng/mL in Urine and Blood, respectively. 4The published limits can be introduced as evidence of violating the per se statute with respect to driving with any amount of a Schedule 1 substance in blood however they are not sufficient for the offense of driving while impaired. Individuals under the influence of cannabis commonly exhibit lack of convergence (inability of eyes to converge or “cross”), dilated pupils, and elevated pulse rate and blood pressure. General indicators of cannabis use include red eyes, body/eyelid tremors, and relaxed inhibitions [5].
The effectiveness of the DEC program to identify alcohol, cannabis, and cocaine use was evaluated in a laboratory study by administering each drug separately at two doses and a placebo to volunteers in separate sessions and having them evaluated by 28 DREs [6]. Of the 100 variables identified in the exam, 28 were determined to be best for predicting use of cannabis. Sensitivity and specificity of the top 28 and top five indicators with respect to identifying cannabis use were calculated. When 28 indicators were used the sensitivity (number of subjects who used cannabis that were properly identified as being exposed) was 100 percent and specificity (number of subjects who did not use drug that were properly identified) was 98.8 percent. Using the top five predictors, sensitivity and specificity were 90.6 and 92.6 percent, respectively. Overall the ability of the DRE to predict cannabis use increased with THC dose. Excluding cases with alcohol, the DRE conclusions with respect to which drug was responsible for the observed impairment were confirmed by toxicological analysis 44 percent of the time, but no breakdown by drug was provided. Despite this low rate, researchers conclude that the DEC program is useful in identifying cannabis as the drug responsible for observed impairment. Some possible explanations given for the seemingly low success rate include the absence of strong odor of cannabis as an indicator of use, lack of useful information obtained during the interview process in the field and the possibility that the evaluators were more liberal in their judgment since there were no legal implications related to their conclusions.
The validity of SFSTs in detecting drug impairment was evaluated by Porath-Waller and Beirness [7]. The study used the results of the Horizontal Gaze Nystagmus (HGN), One-leg-stand (OLS) and Walk-and-turn (WAT) tests extracted from data reported during DRE evaluations. These tests are widely recognized as acceptable means to identify impairment by alcohol when administered roadside. The OLS and WAT tests correctly identified cannabis use in 55.4 and 39.7 percent of cases, respectively.
Prevalence of Cannabis Use by Drivers
Roadside Surveys
In the United States, the National Highway Traffic Safety Administration (NHTSA) conducts a periodic National Roadside Survey (NRS) of drug and alcohol use by drivers. The most recently published data comes from the study conducted in 2007 and published in 2009 [8]. In contrast to the previous NRS reports the 2007 study included collection of blood and oral fluid specimens for drug testing. The 2013-2014 NRS expanded the research even further and examined drug use trends nationally by conducting surveys at over 300
42
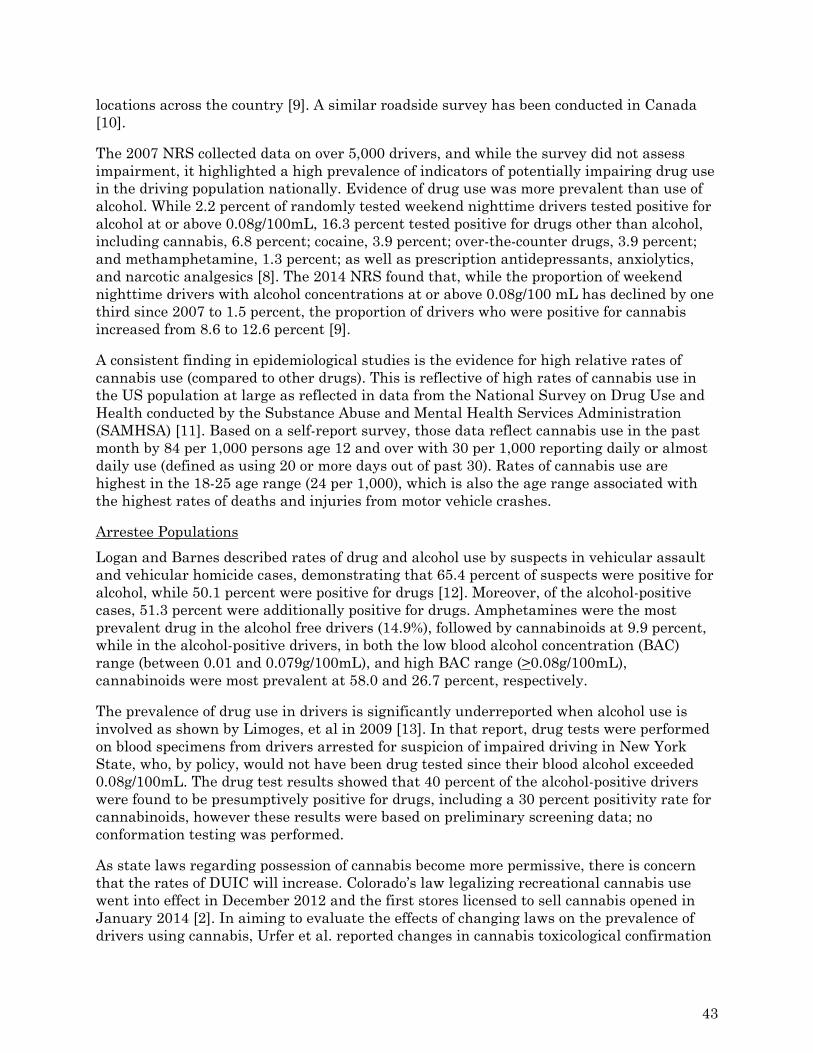
locations across the country [9]. A similar roadside survey has been conducted in Canada [10].
The 2007 NRS collected data on over 5,000 drivers, and while the survey did not assess impairment, it highlighted a high prevalence of indicators of potentially impairing drug use in the driving population nationally. Evidence of drug use was more prevalent than use of alcohol. While 2.2 percent of randomly tested weekend nighttime drivers tested positive for alcohol at or above 0.08g/100mL, 16.3 percent tested positive for drugs other than alcohol, including cannabis, 6.8 percent; cocaine, 3.9 percent; over-the-counter drugs, 3.9 percent; and methamphetamine, 1.3 percent; as well as prescription antidepressants, anxiolytics, and narcotic analgesics [8]. The 2014 NRS found that, while the proportion of weekend nighttime drivers with alcohol concentrations at or above 0.08g/100 mL has declined by one third since 2007 to 1.5 percent, the proportion of drivers who were positive for cannabis increased from 8.6 to 12.6 percent [9].
A consistent finding in epidemiological studies is the evidence for high relative rates of cannabis use (compared to other drugs). This is reflective of high rates of cannabis use in the US population at large as reflected in data from the National Survey on Drug Use and Health conducted by the Substance Abuse and Mental Health Services Administration (SAMHSA) [11]. Based on a self-report survey, those data reflect cannabis use in the past month by 84 per 1,000 persons age 12 and over with 30 per 1,000 reporting daily or almost daily use (defined as using 20 or more days out of past 30). Rates of cannabis use are highest in the 18-25 age range (24 per 1,000), which is also the age range associated with the highest rates of deaths and injuries from motor vehicle crashes.
Arrestee Populations
Logan and Barnes described rates of drug and alcohol use by suspects in vehicular assault and vehicular homicide cases, demonstrating that 65.4 percent of suspects were positive for alcohol, while 50.1 percent were positive for drugs [12]. Moreover, of the alcohol-positive cases, 51.3 percent were additionally positive for drugs. Amphetamines were the most prevalent drug in the alcohol free drivers (14.9%), followed by cannabinoids at 9.9 percent, while in the alcohol-positive drivers, in both the low blood alcohol concentration (BAC) range (between 0.01 and 0.079g/100mL), and high BAC range (>0.08g/100mL), cannabinoids were most prevalent at 58.0 and 26.7 percent, respectively.
The prevalence of drug use in drivers is significantly underreported when alcohol use is involved as shown by Limoges, et al in 2009 [13]. In that report, drug tests were performed on blood specimens from drivers arrested for suspicion of impaired driving in New York State, who, by policy, would not have been drug tested since their blood alcohol exceeded 0.08g/100mL. The drug test results showed that 40 percent of the alcohol-positive drivers were found to be presumptively positive for drugs, including a 30 percent positivity rate for cannabinoids, however these results were based on preliminary screening data; no conformation testing was performed.
As state laws regarding possession of cannabis become more permissive, there is concern that the rates of DUIC will increase. Colorado’s law legalizing recreational cannabis use went into effect in December 2012 and the first stores licensed to sell cannabis opened in January 2014 [2]. In aiming to evaluate the effects of changing laws on the prevalence of drivers using cannabis, Urfer et al. reported changes in cannabis toxicological confirmation
43
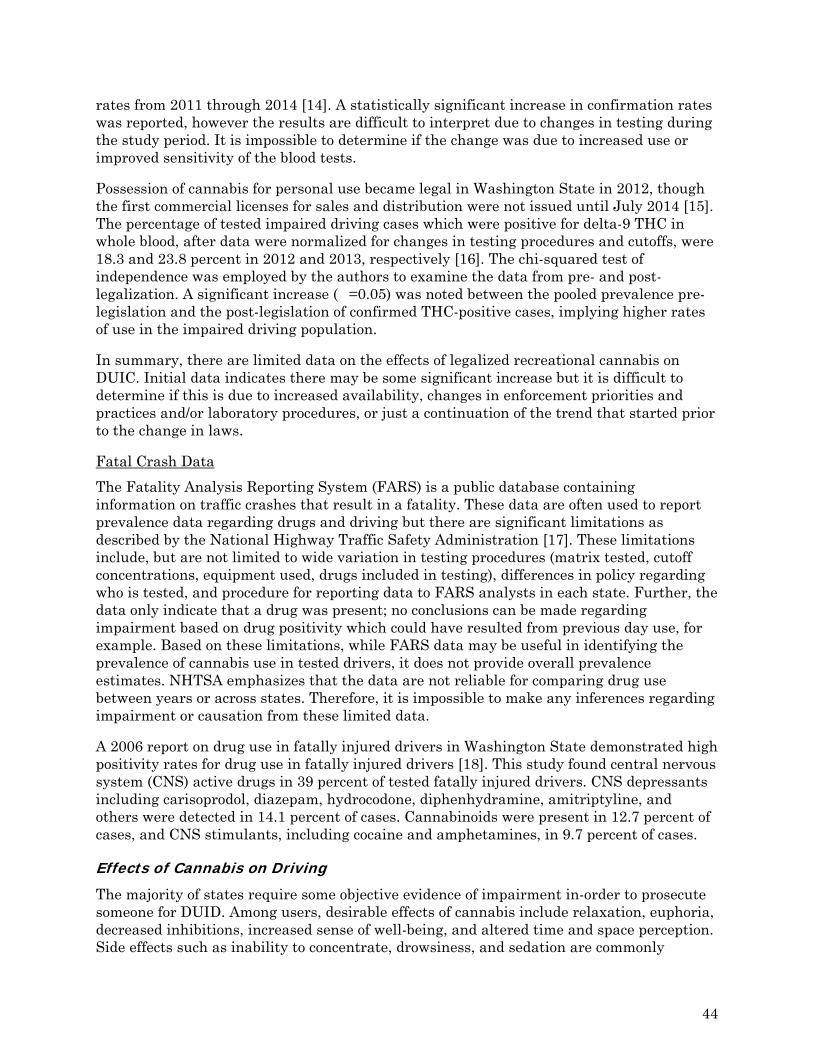
rates from 2011 through 2014 [14]. A statistically significant increase in confirmation rates was reported, however the results are difficult to interpret due to changes in testing during the study period. It is impossible to determine if the change was due to increased use or improved sensitivity of the blood tests.
Possession of cannabis for personal use became legal in Washington State in 2012, though the first commercial licenses for sales and distribution were not issued until July 2014 [15]. The percentage of tested impaired driving cases which were positive for delta-9 THC in whole blood, after data were normalized for changes in testing procedures and cutoffs, were 18.3 and 23.8 percent in 2012 and 2013, respectively [16]. The chi-squared test of independence was employed by the authors to examine the data from pre- and post-legalization. A significant increase (�=0.05) was noted between the pooled prevalence pre-legislation and the post-legislation of confirmed THC-positive cases, implying higher rates of use in the impaired driving population.
In summary, there are limited data on the effects of legalized recreational cannabis on DUIC. Initial data indicates there may be some significant increase but it is difficult to determine if this is due to increased availability, changes in enforcement priorities and practices and/or laboratory procedures, or just a continuation of the trend that started prior to the change in laws.
Fatal Crash Data
The Fatality Analysis Reporting System (FARS) is a public database containing information on traffic crashes that result in a fatality. These data are often used to report prevalence data regarding drugs and driving but there are significant limitations as described by the National Highway Traffic Safety Administration [17]. These limitations include, but are not limited to wide variation in testing procedures (matrix tested, cutoff concentrations, equipment used, drugs included in testing), differences in policy regarding who is tested, and procedure for reporting data to FARS analysts in each state. Further, the data only indicate that a drug was present; no conclusions can be made regarding impairment based on drug positivity which could have resulted from previous day use, for example. Based on these limitations, while FARS data may be useful in identifying the prevalence of cannabis use in tested drivers, it does not provide overall prevalence estimates. NHTSA emphasizes that the data are not reliable for comparing drug use between years or across states. Therefore, it is impossible to make any inferences regarding impairment or causation from these limited data.
A 2006 report on drug use in fatally injured drivers in Washington State demonstrated high positivity rates for drug use in fatally injured drivers [18]. This study found central nervous system (CNS) active drugs in 39 percent of tested fatally injured drivers. CNS depressants including carisoprodol, diazepam, hydrocodone, diphenhydramine, amitriptyline, and others were detected in 14.1 percent of cases. Cannabinoids were present in 12.7 percent of cases, and CNS stimulants, including cocaine and amphetamines, in 9.7 percent of cases.
Effects of Cannabis on Driving
The majority of states require some objective evidence of impairment in-order to prosecute someone for DUID. Among users, desirable effects of cannabis include relaxation, euphoria, decreased inhibitions, increased sense of well-being, and altered time and space perception. Side effects such as inability to concentrate, drowsiness, and sedation are commonly
44
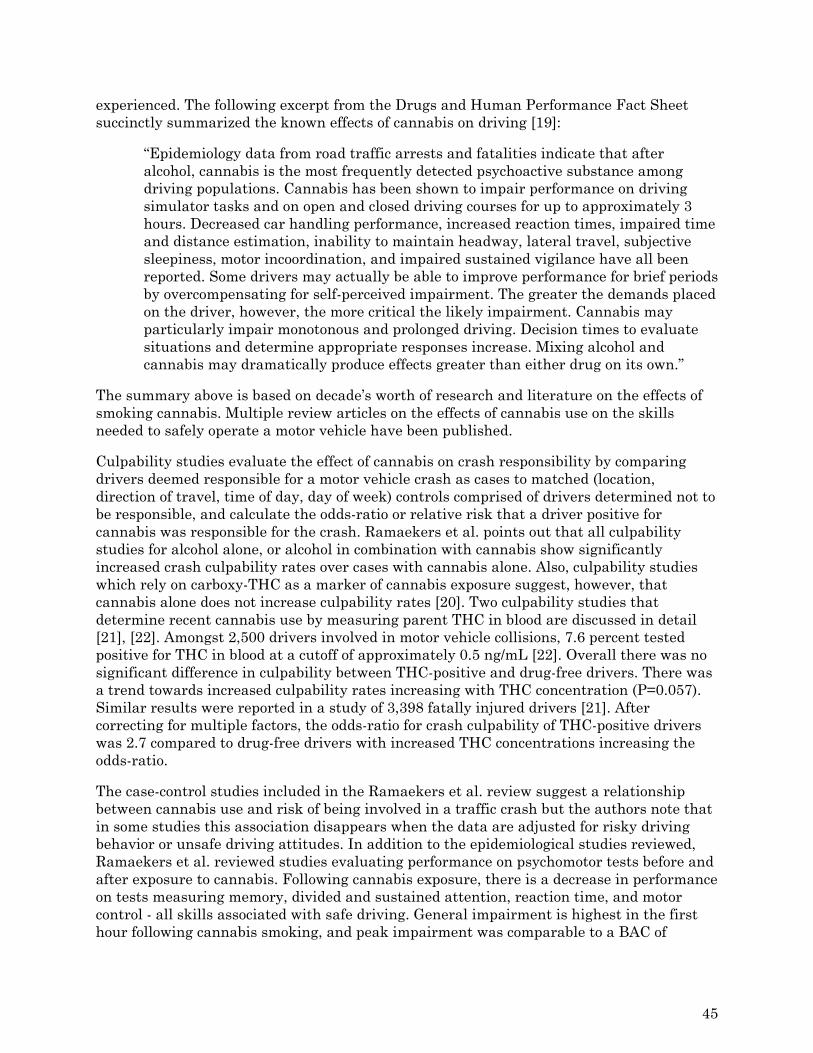
experienced. The following excerpt from the Drugs and Human Performance Fact Sheet succinctly summarized the known effects of cannabis on driving [19]:
“Epidemiology data from road traffic arrests and fatalities indicate that after alcohol, cannabis is the most frequently detected psychoactive substance among driving populations. Cannabis has been shown to impair performance on driving simulator tasks and on open and closed driving courses for up to approximately 3 hours. Decreased car handling performance, increased reaction times, impaired time and distance estimation, inability to maintain headway, lateral travel, subjective sleepiness, motor incoordination, and impaired sustained vigilance have all been reported. Some drivers may actually be able to improve performance for brief periods by overcompensating for self-perceived impairment. The greater the demands placed on the driver, however, the more critical the likely impairment. Cannabis may particularly impair monotonous and prolonged driving. Decision times to evaluate situations and determine appropriate responses increase. Mixing alcohol and cannabis may dramatically produce effects greater than either drug on its own.”
The summary above is based on decade’s worth of research and literature on the effects of smoking cannabis. Multiple review articles on the effects of cannabis use on the skills needed to safely operate a motor vehicle have been published.
Culpability studies evaluate the effect of cannabis on crash responsibility by comparing drivers deemed responsible for a motor vehicle crash as cases to matched (location, direction of travel, time of day, day of week) controls comprised of drivers determined not to be responsible, and calculate the odds-ratio or relative risk that a driver positive for cannabis was responsible for the crash. Ramaekers et al. points out that all culpability studies for alcohol alone, or alcohol in combination with cannabis show significantly increased crash culpability rates over cases with cannabis alone. Also, culpability studies which rely on carboxy-THC as a marker of cannabis exposure suggest, however, that cannabis alone does not increase culpability rates [20]. Two culpability studies that determine recent cannabis use by measuring parent THC in blood are discussed in detail [21], [22]. Amongst 2,500 drivers involved in motor vehicle collisions, 7.6 percent tested positive for THC in blood at a cutoff of approximately 0.5 ng/mL [22]. Overall there was no significant difference in culpability between THC-positive and drug-free drivers. There was a trend towards increased culpability rates increasing with THC concentration (P=0.057). Similar results were reported in a study of 3,398 fatally injured drivers [21]. After correcting for multiple factors, the odds-ratio for crash culpability of THC-positive drivers was 2.7 compared to drug-free drivers with increased THC concentrations increasing the odds-ratio.
The case-control studies included in the Ramaekers et al. review suggest a relationship between cannabis use and risk of being involved in a traffic crash but the authors note that in some studies this association disappears when the data are adjusted for risky driving behavior or unsafe driving attitudes. In addition to the epidemiological studies reviewed, Ramaekers et al. reviewed studies evaluating performance on psychomotor tests before and after exposure to cannabis. Following cannabis exposure, there is a decrease in performance on tests measuring memory, divided and sustained attention, reaction time, and motor control - all skills associated with safe driving. General impairment is highest in the first hour following cannabis smoking, and peak impairment was comparable to a BAC of
45
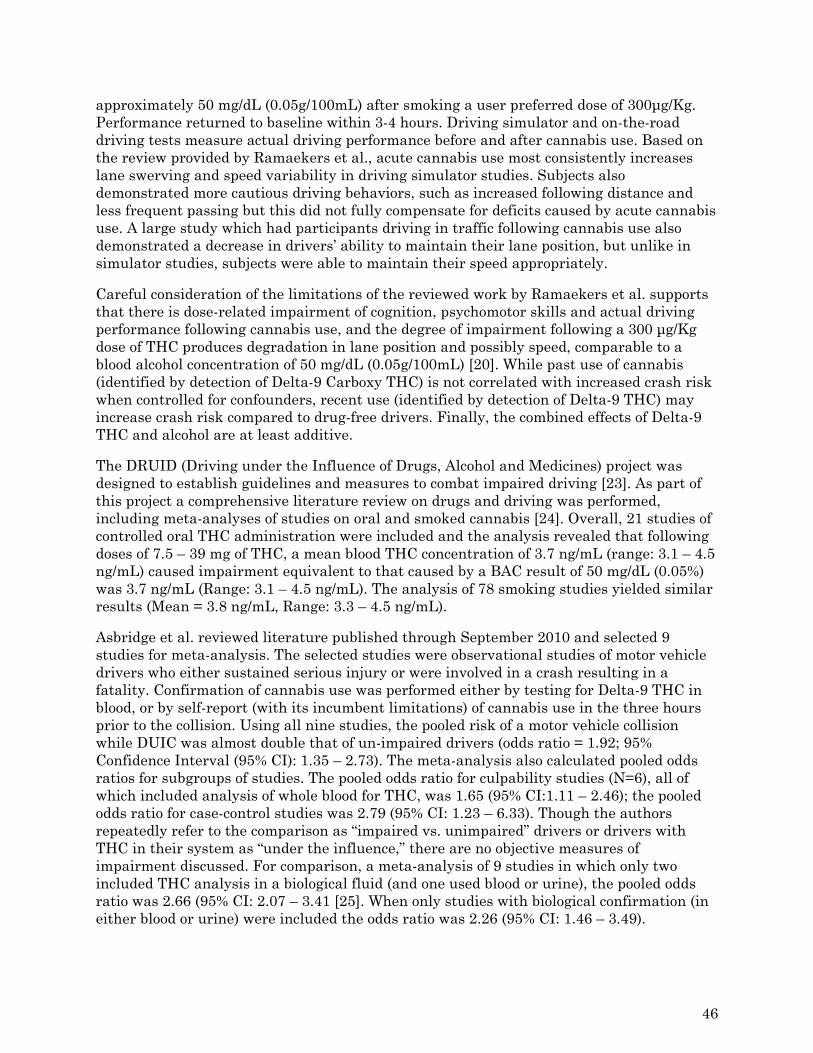
approximately 50 mg/dL (0.05g/100mL) after smoking a user preferred dose of 300μg/Kg. Performance returned to baseline within 3-4 hours. Driving simulator and on-the-road driving tests measure actual driving performance before and after cannabis use. Based on the review provided by Ramaekers et al., acute cannabis use most consistently increases lane swerving and speed variability in driving simulator studies. Subjects also demonstrated more cautious driving behaviors, such as increased following distance and less frequent passing but this did not fully compensate for deficits caused by acute cannabis use. A large study which had participants driving in traffic following cannabis use also demonstrated a decrease in drivers’ ability to maintain their lane position, but unlike in simulator studies, subjects were able to maintain their speed appropriately.
Careful consideration of the limitations of the reviewed work by Ramaekers et al. supports that there is dose-related impairment of cognition, psychomotor skills and actual driving performance following cannabis use, and the degree of impairment following a 300 μg/Kg dose of THC produces degradation in lane position and possibly speed, comparable to a blood alcohol concentration of 50 mg/dL (0.05g/100mL) [20]. While past use of cannabis (identified by detection of Delta-9 Carboxy THC) is not correlated with increased crash risk when controlled for confounders, recent use (identified by detection of Delta-9 THC) may increase crash risk compared to drug-free drivers. Finally, the combined effects of Delta-9 THC and alcohol are at least additive.
The DRUID (Driving under the Influence of Drugs, Alcohol and Medicines) project was designed to establish guidelines and measures to combat impaired driving [23]. As part of this project a comprehensive literature review on drugs and driving was performed, including meta-analyses of studies on oral and smoked cannabis [24]. Overall, 21 studies of controlled oral THC administration were included and the analysis revealed that following doses of 7.5 – 39 mg of THC, a mean blood THC concentration of 3.7 ng/mL (range: 3.1 – 4.5 ng/mL) caused impairment equivalent to that caused by a BAC result of 50 mg/dL (0.05%) was 3.7 ng/mL (Range: 3.1 – 4.5 ng/mL). The analysis of 78 smoking studies yielded similar results (Mean = 3.8 ng/mL, Range: 3.3 – 4.5 ng/mL).
Asbridge et al. reviewed literature published through September 2010 and selected 9 studies for meta-analysis. The selected studies were observational studies of motor vehicle drivers who either sustained serious injury or were involved in a crash resulting in a fatality. Confirmation of cannabis use was performed either by testing for Delta-9 THC in blood, or by self-report (with its incumbent limitations) of cannabis use in the three hours prior to the collision. Using all nine studies, the pooled risk of a motor vehicle collision while DUIC was almost double that of un-impaired drivers (odds ratio = 1.92; 95% Confidence Interval (95% CI): 1.35 – 2.73). The meta-analysis also calculated pooled odds ratios for subgroups of studies. The pooled odds ratio for culpability studies (N=6), all of which included analysis of whole blood for THC, was 1.65 (95% CI:1.11 – 2.46); the pooled odds ratio for case-control studies was 2.79 (95% CI: 1.23 – 6.33). Though the authors repeatedly refer to the comparison as “impaired vs. unimpaired” drivers or drivers with THC in their system as “under the influence,” there are no objective measures of impairment discussed. For comparison, a meta-analysis of 9 studies in which only two included THC analysis in a biological fluid (and one used blood or urine), the pooled odds ratio was 2.66 (95% CI: 2.07 – 3.41 [25]. When only studies with biological confirmation (in either blood or urine) were included the odds ratio was 2.26 (95% CI: 1.46 – 3.49).
46
Hartman and Huestis provided a thorough review of the literature on cannabis and driving, published through February 2012 [26]. The review included epidemiologic data on DUIC as well as experimental studies. A total of 10 studies investigating the relationship between motor vehicle crashes and cannabis were included in the review; six studies relied on self-report. Culpability studies included in the review showed odds ratios similar to those reported by Drummer, which were included in the Ramaekers et al. review. Among the included case-control studies the odds ratio was higher for studies with DUIC verified by toxicology (adjusted odds ratio = 0.9 – 9.0) compared to those which relied on self-report (adjusted odds ratio = 0.8 – 2.6). Experimental studies consisted of five controlled-administration studies that evaluated smoked cannabis’ effect on neurocognitive function and twelve studies on the effects of cannabis on simulated and on-road driving. The results from the experimental studies are varied but studies typically demonstrated impairment in reaction time, divided attention tasks, and ability to maintain driving lane [26]. Based on the literature reviewed the conclusions reached were similar to those of Ramaekers et al., primarily that driving within 1 hour of cannabis significantly increases crash risk and the combined effects of cannabis and alcohol are greater than for either used alone.
In 2015 NHTSA reported the results of a 20-month case-control crash risk study conducted in Virginia Beach, VA [27]. This large study included data collected from 3,000 drivers involved in crashes and 6,000 control drivers who were not. Researchers responded to crash incidents and then collected control cases by returning to the same location one week later. Blood or oral fluid specimens were collected from crash and control subjects and drivers whose biological specimen contained Delta-9 THC were considered to be “cannabis-positive”. The positivity rate for cannabis was 7.6 and 6.1 percent in crash-involved and control drivers, respectively. The unadjusted odds ratio suggests that THC-positive drivers had slightly higher crash risk than THC-negative drivers (odds ratio=1.25, p=0.01). However, adjustment for demographic characteristics associated with both cannabis use and crash involvement reduced the adjusted odds ratio to 1.01 (p=0.65), thus providing no evidence of a causal relationship between having detectable levels of THC and risk of crash involvement. Further, the study found no increased risk associated with the combined use of alcohol and THC as compared to alcohol alone.
A study by Schwope et al. (2012) evaluated psychomotor performance in heavy, chronic cannabis smokers following smoking of cannabis cigarettes [28]. Participants in the study reported using cannabis in at least 9 of the prior 14 days. Impairment was evaluated using the “critical tracking task” and the “divided attention task”. The “critical tracking task” requires participants to use a joystick device to return a cursor the midpoint of a horizontal scale. The time it takes to return the cursor to its central position is measured. During the “divided attention task”, participants have to return the cursor to the midpoint of the axis while responding to stimuli in the corner of the computer screen. Every time the pre-defined stimuli appears on the screen the participant is directed to remove their foot from a pedal switch. The two tasks were performed one after the other before smoking, and the results compared to those obtained when the tests were performed 1.5, 3 and 5.5 hours after smoking. No significant differences were reported at any time-point for the critical tracking task. A significant effect was observed for the divided attention task at the 3-hour post-smoking time-point. These results were consistent with those previously reported [26], [29].
47
Several studies have evaluated subjective effects, neurocognitive effects and specific driving parameters in participants who have been administered THC [30]–[32]. DeRosiers et. al. evaluated critical tracking, divided attention, working memory and risk taking in occasional and frequent cannabis users following controlled THC administration [32]. A significant difference was observed between the occasional and frequent users suggested frequent users may develop some tolerance to the effects of THC which may impair driving. A driving simulator was used to compare the standard deviation of lateral positions (SDLP) between occasional and frequent users following dosing alone and in combination with alcohol [30]. It was reported that THC blood concentrations of 8.2 and 13.1 ng/mL increased SDLP similarly to 0.05 and 0.08 g/210L breath ethanol concentrations.
48
References – Literature Review
[1] “NORML.org - Working to Reform Marijuana Laws.” [Online]. Available: http://norml.org/. [Accessed: 06-Dec-2014].
[2] “Colorado Legalization.” [Online]. Available: http://norml.org/legal/item/colorado-
legalization?category_id=1582. [Accessed: 06-Dec-2014]. [3] Driver under age of twenty-one operating vehicle after alcohol or drug consumption--
Misdemeanor--Suspension of license--Restricted driving privilege., vol. 32–23–21. [4] “StopDUID.org | Facts.” [Online]. Available: http://www.stopduid.org/facts.php#7.
[Accessed: 06-Dec-2014]. [5] E. M. Kosnoski, R. L. Yolton, K. Citek, C. E. Hayes, and R. B. Evans, “The Drug
Evaluation Classification Program: using ocular and other signs to detect drug intoxication,” J. Am. Optom. Assoc., vol. 69, no. 4, pp. 211–227, Apr. 1998.
[6] S. J. Heishman, E. G. Singleton, and D. J. Crouch, “Laboratory validation study of drug
evaluation and classification program: ethanol, cocaine, and marijuana,” J. Anal. Toxicol., vol. 20, no. 6, pp. 468–483, 1996.
[7] A. J. Porath-Waller and D. J. Beirness, “An Examination of the Validity of the
Standardized Field Sobriety Test in Detecting Drug Impairment Using Data from the Drug Evaluation and Classification Program,” Traffic Inj. Prev., vol. 15, no. 2, pp. 125–131, Feb. 2014.
[8] Lacey, J.H, Kelley-Baker, T., Furr-Holden, D., Voas, R.B., Romano, Ed. Ramirez, A.,
Brainard, K., Moore, C, “2007 National Roadside Survey of Alcohol and Drug Use by Drivers: Drug Results,” NHTSA’s Office of Behavioral Safety Research, 2007.
[9] Berning A., Compton, R., Wochinger, K., “2013-2014 National Roadside Survey of
Alcohol and Drug Use by Drivers,” NHTSA’s Office of Behavioral Safety Research, 2015.
[10] Beirness D, Beasley E, “Alcohol and Drug Use Among Drivers, British Columbia
Roadside Survey 2010,” CCSA-CCLAT, 2010. [11] Center for Behavioral Health Statistics and Quality., “2013 National Survey on Drug
Use and Health: Detailed Tables.,” Substance Abuse and Mental Health Services Administration, Rockville, MD, 2014.
[12] B. K. Logan and L. Barnes, “Combined drug and alcohol use in drivers of vehicular
assault and homicide (K27),” Proc. Am. Acad. Forensic Sciences Annu. Meet. Wash. DC, 2006.
49
[13] J. Limoges, A. Tandy, and H. Brown, “A retrospective study of drug prevalence in alcohol driving arrests (K33).,” Proc. Am. Acad. Forensic Sciences Annu. Meet. Chic. IL, 2009.
[14] S. Urfer, J. Morton, V. Beall, J. Feldmann, and J. Gunesch, “Analysis of Δ9-
tetrahydrocannabinol driving under the influence of drugs cases in Colorado from January 2011 to February 2014,” J. Anal. Toxicol., vol. 38, no. 8, pp. 575–581, Oct. 2014.
[15] “2014 Press Releases | Washington State Liquor Control Board,” 16-Jan-2014.
[Online]. Available: http://liq.wa.gov/pressreleases/2014-press-releases. [Accessed: 05-Dec-2014].
[16] F. J. Couper and B. L. Peterson, “The prevalence of marijuana in suspected impaired
driving cases in Washington state,” J. Anal. Toxicol., vol. 38, no. 8, pp. 569–574, Oct. 2014.
[17] A. Berning and D. Smither, “Understanding the Limitations of Drug Test Information,
Reporting, and Testing Practices in Fatal Crashes,” NHTSA’s Office of Behavioral Safety Research, Washington, DC, Nov. 2014.
[18] E. W. Schwilke, M. I. Sampaio dos Santos, and B. K. Logan, “Changing patterns of
drug and alcohol use in fatally injured drivers in Washington State,” J. Forensic Sci., vol. 51, no. 5, pp. 1191–1198, Sep. 2006.
[19] “Drugs and Human Performance FACT SHEETS - Cannabis / Marijuana (D 9 -
Tetrahydrocannabinol, THC).” [Online]. Available: http://www.nhtsa.gov/people/injury/research/job185drugs/cannabis.htm. [Accessed: 06-Dec-2014].
[20] J. G. Ramaekers, G. Berghaus, M. van Laar, and O. H. Drummer, “Dose related risk of
motor vehicle crashes after cannabis use,” Drug Alcohol Depend., vol. 73, no. 2, pp. 109–119, Feb. 2004.
[21] O. H. Drummer, J. Gerostamoulos, H. Batziris, M. Chu, J. R. M. Caplehorn, M. D.
Robertson, and P. Swann, “The incidence of drugs in drivers killed in Australian road traffic crashes,” Forensic Sci. Int., vol. 134, no. 2–3, pp. 154–162, Jul. 2003.
[22] M. C. Longo, C. E. Hunter, Lokan, Robert J., J. M. White, and M. A. White, “The
prevalence of alcohol, cannabinoids, benzodiazepines and stimulants amongst injured drivers and their role in driver culpability Part II: The relationship between drug prevalence and drug concentration, and driver culpability,” Accid. Anal. Prev., vol. 32, pp. 623–632, 2000.
[23] “Druid-Project - Homepage.” [Online]. Available: http://www.druid-
project.eu/Druid/EN/Home/home_node.html. [Accessed: 08-Dec-2014].
50
[24] G. Berghaus, G. Sticht, W. Grellner, D. Lenz, T. Naumann, and S. Wiesenmuller, “Meta-analysis of empirical studies concerning the effects of medicines and illegal drugs including pharmacokinetics on safe driving,” 1.1.2b, Dec. 2010.
[25] M.-C. Li, J. E. Brady, C. J. DiMaggio, A. R. Lusardi, K. Y. Tzong, and G. Li, “Marijuana
Use and Motor Vehicle Crashes,” Epidemiol. Rev., vol. 34, no. 1, pp. 65–72, Jan. 2012. [26] R. L. Hartman and M. A. Huestis, “Cannabis Effects on Driving Skills,” Clin. Chem.,
Dec. 2012. [27] R. Compton and A. Berning, “Drug and Alcohol Crash Risk,” NHTSA’s Office of
Behavioral Safety Research, DOT HS 812 117, Feb. 2015. [28] D. M. Schwope, W. M. Bosker, J. G. Ramaekers, D. A. Gorelick, and M. A. Huestis,
“Psychomotor Performance, Subjective and Physiological Effects and Whole Blood 9-Tetrahydrocannabinol Concentrations in Heavy, Chronic Cannabis Smokers Following Acute Smoked Cannabis,” J. Anal. Toxicol., vol. 36, no. 6, pp. 405–412, Jul. 2012.
[29] J. G. Ramaekers, G. Kauert, E. L. Theunissen, S. W. Toennes, and M. R. Moeller,
“Neurocognitive performance during acute THC intoxication in heavy and occasional cannabis users,” J. Psychopharmacol. Oxf. Engl., vol. 23, no. 3, pp. 266–277, May 2009.
[30] R. L. Hartman, T. L. Brown, G. Milavetz, A. Spurgin, D. A. Gorelick, G. Gaffney, and
M. A. Huestis, “Controlled vaporized cannabis, with and without alcohol: subjective effects and oral fluid-blood cannabinoid relationships,” Drug Test. Anal., Aug. 2015.
[31] R. L. Hartman, T. L. Brown, G. Milavetz, A. Spurgin, R. S. Pierce, D. A. Gorelick, G.
Gaffney, and M. A. Huestis, “Cannabis effects on driving lateral control with and without alcohol,” Drug Alcohol Depend., vol. 154, pp. 25–37, Sep. 2015.
[32] N. A. Desrosiers, J. G. Ramaekers, E. Chauchard, D. A. Gorelick, and M. A. Huestis,
“Smoked cannabis’ psychomotor and neurocognitive effects in occasional and frequent smokers,” J. Anal. Toxicol., vol. 39, no. 4, pp. 251–261, May 2015.
51


![arranged by tom wallace percussion by tony mccutchen 11 a a 10 aaa > e] aa aaa 6 aaa aaa aaa aaa aaa aaa 13 > 19 — 18 15 a a aa 16 a a 12 20 23 a > 24 aaa > 25 a > 26 aaa > 27 gÆ4k](https://img.pdfslide.us/doc/110x75/5e6c4dfc8bd84b079d5a5076/arranged-by-tom-wallace-percussion-by-tony-mccutchen-11-a-a-10-aaa-e-aa-aaa.jpg)