Embed Size (px)
Citation preview

USER MANUAL
Adash A4300 VA3 Pro
Version 1.29 – July, 21, 2021

ADASH Ltd. Adash 4300 – VA3Pro
Content:Before you read this manual......................................................................................7
Before Switching On...................................................................................................8General warnings...............................................................................................................8
Batteries and charging...............................................................................................9
General information..................................................................................................10A4300 VA3 Pro – general information and configuration..................................................10Switching on.....................................................................................................................10Battery..............................................................................................................................10Switching off.....................................................................................................................10The emergency switch off.................................................................................................11Memory capacity warning.................................................................................................11Connection to the computer..............................................................................................11The DSP board.................................................................................................................11The CPU status LED........................................................................................................12Virtual Analyzers Data Processing...................................................................................12
How to work with the menu and lists......................................................................13Special buttons.................................................................................................................13Item selection...................................................................................................................13User defined values..........................................................................................................15Lists..................................................................................................................................16
Input channels...........................................................................................................17IN1 input...........................................................................................................................17IN2 input...........................................................................................................................17TRIG input........................................................................................................................18Standard cable specifications...........................................................................................18
Input channels (ODU variation)...............................................................................19IN1 Socket........................................................................................................................19IN2 Socket........................................................................................................................19TRIG Socket.....................................................................................................................20
Main menu..................................................................................................................21Trigger..............................................................................................................................21Sensors............................................................................................................................23AC sensors.......................................................................................................................23DC sensors.......................................................................................................................25Tacho...............................................................................................................................25Global...............................................................................................................................27Date and Time..................................................................................................................29Update..............................................................................................................................29Export Logs......................................................................................................................29Screenshot.......................................................................................................................30
Update of the firmware.............................................................................................31
Update of the new measurement mode(s)..............................................................32
Info..............................................................................................................................33
The Main screen........................................................................................................34
Speed detection.........................................................................................................35
Meter...........................................................................................................................36Meter Settings..................................................................................................................36Sensors Settings..............................................................................................................37
2For further technical and contact information visit www.adash.com, email: [email protected]

ADASH Ltd. Adash 4300 – VA3ProUnit Settings.....................................................................................................................37Measurement...................................................................................................................37Status bar.........................................................................................................................37Measurement screens......................................................................................................37
Overall (RMS) and Peak (0-P) values 37Spectrum up to 200Hz – mechanical looseness detection 38Time signal for roller bearing diagnosis 38Vibration in frequency ranges - gearboxes/ bearings 38Displacement values 39Temperature 39
FASIT..........................................................................................................................40FASIT Settings.................................................................................................................40Sensors Settings..............................................................................................................41Units.................................................................................................................................41Measurement...................................................................................................................41FASIT screen...................................................................................................................41
Strobo.........................................................................................................................43Easy access.....................................................................................................................43
The Analyzer mode...................................................................................................44The Meas.........................................................................................................................44The Graph........................................................................................................................44The Set.............................................................................................................................44Analyzer menu.................................................................................................................44
New Set 44Copy Set 45Rename Set 45Delete Set 45Clear Set Data 45Notes 45
Readings (Measurements)...............................................................................................45New Meas........................................................................................................................45
New Meas (Basic) 45New Meas (Advanced) 46
Next Meas functions.........................................................................................................47Copy Meas 47Edit Meas 47Meas info 47Delete Meas 47Limits 47
Functions for Set..............................................................................................................51Save data 51Clear data 51View Trend/ View Actual 51Clear Last Data (if the trend is displayed) 51
Export...............................................................................................................................51Export to csv 51
Graph Max/Min.................................................................................................................52Graph Properties..............................................................................................................52
Scale 52View orbit 52Axis X, Axis Y 52Value Type 53Graph Lines 53
The Analyzer buttons description.....................................................................................53The F3 button (Start / Stop) 53The Shift button 53
3For further technical and contact information visit www.adash.com, email: [email protected]

ADASH Ltd. Adash 4300 – VA3ProBand fmin[Hz] - HP filtering..............................................................................................53FASIT measurement........................................................................................................54Overall measurement.......................................................................................................54Spectrum measurement...................................................................................................55Time signal measurement................................................................................................56G-demod spectrum measurement....................................................................................56G-demod time signal measurement..................................................................................57G-demod overall measurement........................................................................................571x amp+phase measurement...........................................................................................57Orbit measurement...........................................................................................................57Speed measurement........................................................................................................58ACMT measurement........................................................................................................58Orders measurement........................................................................................................59Phase shift measurement.................................................................................................59DC measurement.............................................................................................................59IR temperature measurement...........................................................................................60Center line measurement.................................................................................................60S-max measurement........................................................................................................60Ultrasound measurement.................................................................................................61Record..............................................................................................................................61
The Route mode........................................................................................................62Loading the route to the instrument..................................................................................62Creation of the route tree..................................................................................................62Route readings.................................................................................................................62Downloading the route to the computer............................................................................64Reference values..............................................................................................................64Manual entry.....................................................................................................................64Notes................................................................................................................................65Speed in the route............................................................................................................66
Speed entered in DDS 66Measured Speed 66
Limits................................................................................................................................66The Route buttons description..........................................................................................66
The Balancer..............................................................................................................67Introduction.......................................................................................................................67Planes and Points.............................................................................................................67The Project.......................................................................................................................67The Project Screen...........................................................................................................67The first screen.................................................................................................................67New project......................................................................................................................68Project menu....................................................................................................................68
Balancer Settings 68Rotor Settings 69Enter Trial 69Enter Values 69Enter DF 70Display DF 70Report 70Vector 70Total Mass 70
Single plane balancing.....................................................................................................71RUN 1 screen – Initial measurement 71RUN 2 screen – Measurement with trial 71RUN 2 - the RESULT screen 72The RUN 3 screen 73Trim Screens 74
Dual plane balancing........................................................................................................744
For further technical and contact information visit www.adash.com, email: [email protected]
ADASH Ltd. Adash 4300 – VA3ProRUN 1 screen 74RUN 2 with trial mass on Plane 1 75RUN 2 with trial mass on Plane 2 75RUN 2 - Result screen 75The RUN 3 screen 75Trim Screens 75
Balancing Errors...............................................................................................................76The effect of trial weight is low 76
Recorder.....................................................................................................................77Record length...................................................................................................................77First screen.......................................................................................................................77
New Project 77Copy Project 77Rename Project 77Delete Project 77Clear Project Data 78
Project screen..................................................................................................................78Record Settings................................................................................................................78Sensors settings...............................................................................................................79Recording.........................................................................................................................79Preview of recorded data..................................................................................................79Record analysis................................................................................................................80
Run Up........................................................................................................................81Measurement Control.......................................................................................................81Measurement settings......................................................................................................81Measurement...................................................................................................................81Trends..............................................................................................................................82Deleting trends.................................................................................................................82
Ultrasound..................................................................................................................83Introduction.......................................................................................................................83Sensor setting..................................................................................................................83Settings............................................................................................................................83Measurement...................................................................................................................84
Appendix A: Technical Specification......................................................................85Inputs...............................................................................................................................85
Dynamic Channels (AC) 85Tacho Channel 85Static Channels (DC) 85
Measurement Functions...................................................................................................85Stroboscope.....................................................................................................................86Other Accessories............................................................................................................86General:............................................................................................................................86
Appendix B: Standards for vibration measurements............................................87Adash Limit Values...........................................................................................................87
Machine Limits 88Bearing Limits 88
ISO 10816 limit values......................................................................................................89Classification according to machine type, nominal power or shaft height 89ISO Groups 1-4 classifications define the following types of machinery: 89Classification according to foundation 89Evaluation ranges 89Classification of vibration values for machines groups 1 and 3 90Classification of vibration values for machines groups 2 and 4 90
Appendix C : Phase measurement conventions....................................................91
5For further technical and contact information visit www.adash.com, email: [email protected]

ADASH Ltd. Adash 4300 – VA3ProSingle channel measurement with tacho..........................................................................91Dual channel measurement..............................................................................................94Last reminder...................................................................................................................94
6For further technical and contact information visit www.adash.com, email: [email protected]

ADASH Ltd. Adash 4300 – VA3Pro
Before you read this manualThe VA3Pro unit is continuously developed and new functions and features are added quite often. Such additions require changes in the manual and those changes are very time consuming for us. That is why we do not change all the pictures in the manual with each new version. We have not changed some pictures in the manual although they have been changed in the instrument already. This has only been done on places where such pictures have no consequence on the new function.
7For further technical and contact information visit www.adash.com, email: [email protected]

ADASH Ltd. Adash 4300 – VA3Pro
Before Switching On
General warnings
AC, DC channels - voltage higher then 28 V (peak) can damage the instrument.
Only suitable ICP powered sensors can be connected to the AC signal inputs.
If a measurement without ICP power is required, ICP power must be switched off. You can damage the external signal source, which is not protected against ICP powering.
Use only original cables designed for connection with the sensor.
If you are unsure, contact your distributor or the manufacturer.
A long push and hold of the POWER button switches the instrument off incorrectly. Data could be lost.
8For further technical and contact information visit www.adash.com, email: [email protected]
Ignoring any recommendations mentioned below may cause failure of the device.Operating with a power higher then 24 V can cause an accident.

ADASH Ltd. Adash 4300 – VA3Pro
Batteries and chargingUse only the original charger. If you need new one, contact your dealer.
The socket for the external charger (instrument accessory) is on the bottom side of the instrument.
The charger contains LED indication: orange: charger disconnected from unitquick green flashes (several times per second): charging in processslow green flashes (once per second) or continuous green: unit chargedslow orange flashes (once per second): pre-charging of deeply discharged battery (it can take hours, it depends on the level of the discharge)
The battery indicator on instrument screen doesn’t correctly display the charge level during the charging. The indicator checks in this case the voltage from charger not from battery. Always disconnect the charger to check the charge level.
Normally full charging takes 5 hours. It takes longer time, when unit is switched on during charging.
Never do short circuit the charger connectors.
Recommended charging temperature is 0-40°C (32-104°F).
Very high temperature over 50°C (122°F) decreases battery life. Don’t leave the instrument on direct sun light oron other heat source.
The battery capacity decreases with low temperatures (e.g. on –10°C (14°F) only 70% capacity is available). Keep the unit in normal temperature before you begin measurement.
Don’t leave the unit uncharged for the long time. The battery could be discharged completely. If you do not use the unit, charge it regularly every 6 months.
9For further technical and contact information visit www.adash.com, email: [email protected]

ADASH Ltd. Adash 4300 – VA3Pro
General information
A4300 VA3 Pro – general information and configurationThe A4300 VA3 Pro is a data collector and an analyzer for vibration diagnostics. There are 2 signal inputs and 1 tacho/trigger input. Input 2 offers connectivity to a triaxial sensor, therefore all 3 channels can be measured simultaneously. The expert system developed by Adash can automatically detect machine faults such as unbalance, looseness, misalignment and bearing faults.There is a non-contact IR temperature sensor (for immediate bearing temperature measurement) and a LED stroboscope/torch. The A4300 VA3 Pro is designed for one-handed operation. With a weight of just 780g and a battery life of more than 10 hours of operation, the unit is suitable for long route measurements. The A4300 VA3 Pro instrument can be configured according to your requirements by choosing optional modes e.g. analyzer, route, balancer. Optional modules can be purchased also additionally and downloaded to the instrument without the need of sending it back to the factory.At the moment there are 8 modes available. The modes FASIT (Expert system), Stroboscope and Meter are included in every unit.The modes: Analyzer, Route, Balancer, Recorder and Run Up are optional and it is up to you if you wish to have them in your A4300 VA3 Pro.
Switching onUse the POWER button to switch-on the device.
Push and hold the button until the right hand LED on the front panel (top right) changes colour from orange to green.
BatteryThe information about % of battery lifetime is displayed on the top right corner of the display. When the battery is charged more than 25% the battery symbol is green. When the battery is charged 5-25%, the yellow symbol is used. Under 5%, the red symbol appears.
Switching offSwitching off can be done on the instrument’s main screen. Press the POWER button and confirm by pressing Yes.
10For further technical and contact information visit www.adash.com, email: [email protected]

ADASH Ltd. Adash 4300 – VA3Pro
The emergency switch offThis is not the correct method of switching off the instrument. Using it can cause data corruption. Use this method only in cases when it is absolutely necessary.Push and hold the POWER button for about 5 seconds, then release the button. The instrument will switch off.
Memory capacity warningIf the memory capacity warning appears (see the picture below), you need to free up some memory space by removing some measurements or routes.
Connection to the computerUse the mini-USB cable, which is the standard accessory of the VA3Pro set, to connect the device to the computer. There is a mini-USB port on the top side of the VA3 device for the connection.
The VA3Pro unit should be switched off or on the main menu screen.When the VA3 is connected, the new device (new flash drive) appears on the computer. The name is VA3_DISC. If this operation fails, switch off the unit and try to connect it again.Always use the Safely remove hardware function before disconnecting the VA3Pro unit from the PC!The va3 folder (case sensitive) is automatically created on VA3_DISC.
The DSP boardThe DSP board is the most important part of the instrument. The special chip carries out all necessary operations which are required for achieving 3 channel synchronous data measurement.
The DSP status LED is the right hand LED on the top right corner and allows the operator to monitor the DSP board. Several states can appear:- Flashing green with 0.25 sec time interval (4Hz, four times per sec) - the measurement is running.- Flashing green with 1 sec time interval - STANDBY, the measurement is not running.- Red - the DSP board is not working properly.
11For further technical and contact information visit www.adash.com, email: [email protected]

ADASH Ltd. Adash 4300 – VA3Pro
The CPU status LEDThe CPU board contains the CPU chip.
The CPU status LED is the left hand LED on the top right corner and allows the operator to monitor the CPU. If this LED blinks (like a heart beat) the CPU is working properly.
Virtual Analyzers Data ProcessingMany analyzers take multiple readings step by step. This means that when the user wants to get for example acceleration overall, velocity overall, velocity time signal and velocity spectrum from one sensor, then the analyzers take the overall first, then the second overall with the integration, after that the time signal and finally the spectrum. The time which is required for all 4 readings is the sum of all 4 individual times.The VA3Pro instrument includes high speed chips and it uses a much more advanced concept. There is one virtual analyzer created in the instrument memory for every individual reading. All virtual analyzers read the datafrom the input DSP board and perform the required data acquisition at the same time.What does this mean? It means that the total required time is not equal to the sum of all individual times, but it isequal to the time required for the longest reading.
12For further technical and contact information visit www.adash.com, email: [email protected]

ADASH Ltd. Adash 4300 – VA3Pro
How to work with the menu and lists
Special buttonsThe F1, F2 and F3 buttons are on the top of the keyboard. These buttons have various functions depending on the actual running process.The description of their functions is displayed at the bottom of the screen, directly above them.
Example: F1 means Back and F3 means OK.
Item selectionBefore taking the readings you have to define several parameters. They can be set in the Menu Item. The operation procedure is the same for all menu items. We will describe it with an example - the sensor properties definition.
Press the Menu (F2) on the main screen.
Select the Sensors item and press OK. The sensors properties menu appears.
13For further technical and contact information visit www.adash.com, email: [email protected]

ADASH Ltd. Adash 4300 – VA3ProUse the arrow buttons for the item selection. Then press the OK button. The second menu appears.
Use the arrow buttons for the item selection again. Then press the right arrow button to display possible parameters of the selected item, e.g. for Sensitivity.
Use the arrow button for sensitivity selection (1,10,100, user).Press Ok or right arrow to confirm.Press Back (F1) or lefr arrow to escape.
14For further technical and contact information visit www.adash.com, email: [email protected]

ADASH Ltd. Adash 4300 – VA3Pro
User defined valuesIn most cases you would want to enter the user sensitivity according to the real sensor sensitivity of your sensor(e.g. 96,8 mV/g). Select the user and press OK. The next window appears and the buttons gets the numerical values entry functions.
Enter required value.
The F1 button changes the mode of keyboard. Two modes are available. The numerical and edit modes. In edit mode you can use arrows to move in field and Delete (9) and Backspace (7).
15For further technical and contact information visit www.adash.com, email: [email protected]

ADASH Ltd. Adash 4300 – VA3Pro
ListsKey up select upper itemKey down select lower itemKey 1 page upKey 3 page down
16For further technical and contact information visit www.adash.com, email: [email protected]

ADASH Ltd. Adash 4300 – VA3Pro
Input channels
The inputs labeled IN1, IN2 are used for AC/DC signals. The input labeled TRIG is used for trigger signals, usually tacho (speed probe). All inputs have several pins. IN2 allows the user to connect a tri-axial sensor.The AC inputs allow the measurement of a maximum voltage peak of +/-12V. The DC inputs allow the measurement of a maximum voltage peak of +/-24V.
IN1 input
1 – CH1 AC/DC INPUT2 – GROUND3 – NOT USED4 – SHIELDING5 – NOT USED6 – NOT USED7 – +5 V DC OUTPUT (max 100 mA) for ultrasound sensor powering Warning! Pin 7 of IN1 socket (ultrasound sensor powering) is internally connected with pin 4 of TRIG socket (tacho sensor powering).
IN2 input
1 – CH2 AC/DC INPUT2 – GROUND3 – CH1 AC/DC INPUT4 – SHIELDING5 – CH3 AC/DC INPUT
17For further technical and contact information visit www.adash.com, email: [email protected]
ADASH Ltd. Adash 4300 – VA3Pro6 – NOT USED7 – NOT USED
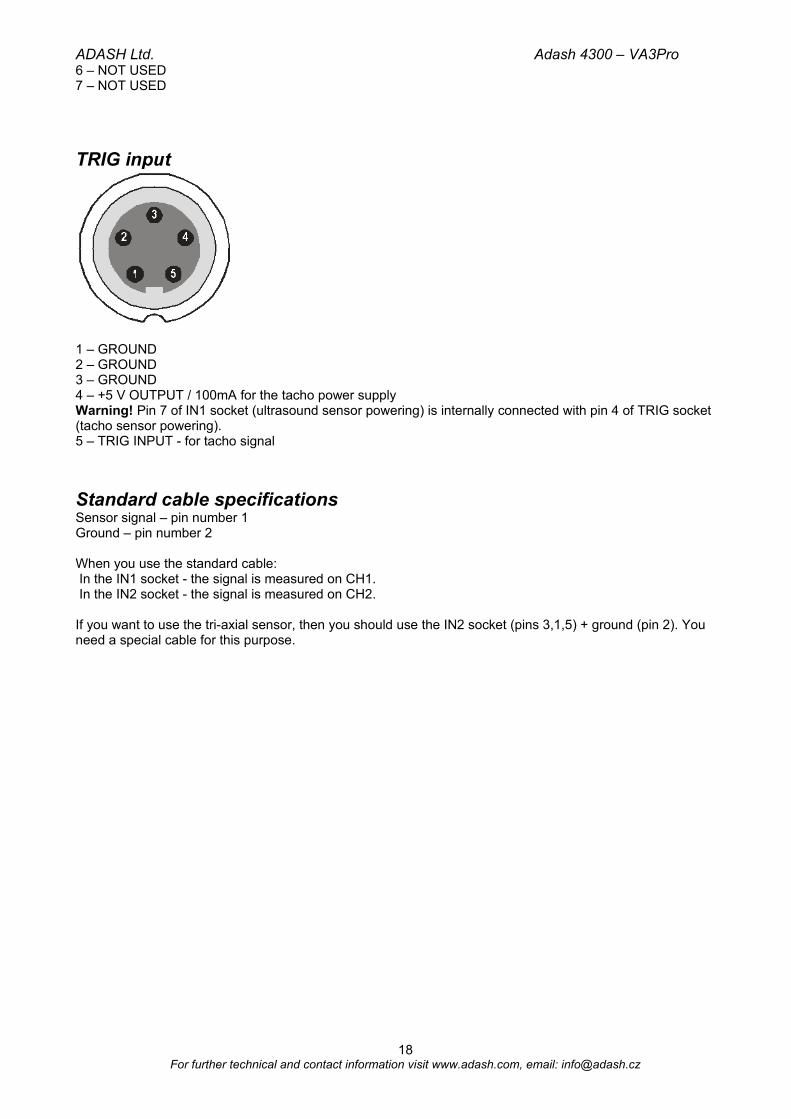
TRIG input
1 – GROUND2 – GROUND3 – GROUND4 – +5 V OUTPUT / 100mA for the tacho power supplyWarning! Pin 7 of IN1 socket (ultrasound sensor powering) is internally connected with pin 4 of TRIG socket (tacho sensor powering).5 – TRIG INPUT - for tacho signal
Standard cable specificationsSensor signal – pin number 1Ground – pin number 2
When you use the standard cable: In the IN1 socket - the signal is measured on CH1. In the IN2 socket - the signal is measured on CH2.
If you want to use the tri-axial sensor, then you should use the IN2 socket (pins 3,1,5) + ground (pin 2). You need a special cable for this purpose.
18For further technical and contact information visit www.adash.com, email: [email protected]

ADASH Ltd. Adash 4300 – VA3Pro
Input channels (ODU variation)
IN1 Socket
1 – GND2 – +5V/0.1A3 – NC4 – NC5 – SHLD6 – NC7 – GND8 – AC1 / DC1
Warning! Pin 2 of IN1 socket (ultrasound sensor powering) is internally connected with pin 2 of TRIG socket (tacho sensor powering).
IN2 Socket
1 – GND2 – NC3 – NC4 – AC3 / DC35 – SHLD6 – AC1 / DC17 – GND8 – AC2 / DC2
Pay attention to possibility of connecting all three channels to IN2.
19For further technical and contact information visit www.adash.com, email: [email protected]

ADASH Ltd. Adash 4300 – VA3Pro
TRIG Socket
1 – TRIG2 – +5V/0.1A3 – SHLD4 – GND5 – GND
Warning! Pin 2 of IN1 socket (ultrasound sensor powering) is internally connected with pin 2 of TRIG socket (tacho sensor powering).
20For further technical and contact information visit www.adash.com, email: [email protected]

ADASH Ltd. Adash 4300 – VA3Pro
Main menuSelect the Menu (F2) on the main screen. The main menu appears.
TriggerSelect the Trigger item and press OK.
Trigger Mode
single Only one reading is taken and displayed.
retrig When you use the analogue oscilloscope, you always see the current signal on the screen. The retrig mode means a similar thing. The reading repeats until you press the Stop button. Select the single option when you only want one reading.
Runup ModeDefines how often the data will be taken in the runup mode.
asap The next measurement is taken immediately after previous measurement without any delay.
manual The user starts next measurement manually.
speed The next measurement is taken when the speed is significantly different from the previous measurement speed. The user defines in Speed change item, what it is significant change.
time All measurement are taken with the same time interval between them. The time interval length is defined in Time Change.
time or speed This option is the combination of speed and time. The next measurement is taken when one of them is changed more then the value Speed change or Time Change.
Speed change see Runup Mode: speed (the previous section).
21For further technical and contact information visit www.adash.com, email: [email protected]

ADASH Ltd. Adash 4300 – VA3ProTime change(s) see Runup Mode: time (the previous section)
Trigger Source:freerun The measurement process begins immediately (after pressing the Start button -
Analyzer mode).
external The measurement process begins, when the external signal (voltage level higher than defined in External Trig Level) appears on the trigger input. Such a signal may be generated when the machine starts to work, for example. This type of signal is usually created in the control system.
manual The measurement process begins after pressing the Start button and then the OK button. The first press (Start) is for preparation, the second (OK) is for triggering.
manual sequential Similar to manual but every reading for averaging must be started separately. E.g. when AVG=10, then the OK button must be used 10 times.
amplitude The measurement process begins when the signal level exceeds the Ampl Trig Level, which is also set by the user in this menu. Both positive (rising edge) and negative (falling edge) levels are accepted. E.g entering 5g will trigger on 5g. The signal amplitude is taken directly from the sensor input, no additional filtering is applied.Examples:
the level is set to 100mV - triggered when the rising signal goes from e.g.99mV to 101mVthe level is set to -100mV - triggered when the falling signal goes from e.g.-99mV to -101mV
tacho The tacho is a special type of external trigger. When we say tacho, we mean a signal (usually a TTL) which contains one pulse during one rotation of the shaft. It can also be understood as a series of single external pulses. The measurement process begins when the external signal (a voltage level higher than the Tacho Trig Level defined in tacho sensor) appears on the trigger input (the same as an external item). Speed measurement, time signal averaging, aps and order analysis are only enabled when the tacho is set.
Use Ampl Tacho yes, no When yes is set, then the tacho pulses will be created by amplitude trigger level, not from tacho sensor. Set the channel and level by the same way as for amplitude trigger. Set the Ampl Tacho Hysteresis to 30-50% of levelto avoid creation of more pulses in near times. It could happen when signal is noisy. Sometimes you need to try more percentage values to find the correct one.
Ampl Trig Level (unit) value See the description of the amplitude mode (Trigger Source section). The unit is the unit of the sensor on the selected channel (Ampl Trig Channel).
Ampl Trig Channel ( 1,2,3) The number of channels, which will be used for amplitude triggering.
Ampl Tacho Hysteresis see Use Ampl Tacho
External Trig Edge rising, falling The edge used for triggering
External Trig Level[V] See the description in Trigger Source/ external
Pretrig (%) value in (100,-100) or user Usually the measurement process (e.g. time signal) begins exactly from the trigger moment. But in some applications you are also interested in knowing the signal before the trigger. The required time should be defined in seconds, but in signal analyzers it is usually defined as percentage part of the total signal length. When a 1 second time signal is measured and pretrigger=25, then 0,25s will be taken before the trigger and 0,75s after the trigger. Also a negative pretrigger could be used. It means that the time signal will be taken later then the trigger pulse.
22For further technical and contact information visit www.adash.com, email: [email protected]

ADASH Ltd. Adash 4300 – VA3Pro
SensorsWhen you connect the sensors to the instrument, you have to specify what kind of sensors you are using. The Sensors button is displayed on most of the screens and once it is there, it is on the bottom.
Push the Menu on the main screen and select Sensors. Push the OK button. In the next menu select the channel sensor you want to define.
AC1 – AC3 setting of each AC channel propertiesAll AC Sensors setting of all AC channels togetherDC1 – DC3 setting of each DC channel propertiesAll DC sensors setting of all DC channelsTacho setting of tacho channel propertiesSettling Prolongation if you need longer time for sensor settling, use this item
AC sensorsAC (alternate current) sensors are used for signals, e.g. vibrations.
ICP on, off (selection of required setting accordingly to the sensor type)Sensitivity[mV/unit] usually 1,10,100, userUnit the unit selected from the list or the user unit
Name undef, userYou can optionally enter a name of the sensor by choosing user item. Use undef item to reset the sensor name.
Saving sensorParameters of named sensor can be saved. After you enter the name open the Name menu again. New item save is available now. When you choose then this item the sensor will be saved.
23For further technical and contact information visit www.adash.com, email: [email protected]

ADASH Ltd. Adash 4300 – VA3Pro
Note! If you want to save a sensor with a name which has been already defined you'll be asked to rewrite its parameters.
Loading sensorsSaved sensors are displayed on when you open the Name menu item. Select a name of a saved sensor and press OK. Then its parameters are loaded.
Note! If you choose “user” option and then enter a name which has been already saved (e.g. “acc500”) you'll be asked to load its parameters.
Deleting sensorSelect a sensor which you want to delete. Open the Name menu again. Now new item delete appears. Select this item and press OK. The sensor will be removed from the list.
Position the angle of the sensor (see picture bellow). Usually used for proximity sensors.
24For further technical and contact information visit www.adash.com, email: [email protected]

ADASH Ltd. Adash 4300 – VA3Pro
DC sensorsDC sensors are used for discrete current signals, e.g. temperature, pressure, etc .
Sensitivity[mV/unit] sensitivity valueOffset[mV] offset valueUnit the unit selected from the list or the user unitName the name of sensor (see AC sensors for more details)Position the angle of sensor (see picture above). Usually used for proximity sensors and GAP measurement.
The used formula: output value in Unit = (input value in mV - Offset) / Sensitivity.
TachoThe speed is measured from the tacho channel. The signal contains one or more pulses per one rotation. The pulses can also trigger the measurement. The VA3 uses the falling edge of tacho signal for triggering.
25For further technical and contact information visit www.adash.com, email: [email protected]

ADASH Ltd. Adash 4300 – VA3Pro
On the picture are the tacho signal (magenta line), the trig level (grey line) and created tacho pulse (yellow line).
Tacho Trig Level [V] The tacho pulse is created on this level. We use the falling edge for that. This level must be between the minimum and maximum of tacho signal.The signal from tacho generally occurs in two forms. It differs in signal change during reflection from reflective tape. Positive reflection means that the voltage increases during reflection. Negative reflection means that the voltage decreases during reflection.Positive reflection example: 0V voltage increases to 5V during reflection.Negative reflection example: 5V voltage decreases to 0V during reflection.The A4300 – VA3 PRO instrument enables work with both types of reflection in -30V to +30V range. That means you can connect almost any kind of tacho sensor. You need to setup the Tacho Trig Level before measurement.We have three possibilities how to setup the level.
The factory value 6V should work for most of tacho sensors. However when the factory value doesn't work, thatis the instrument doesn't recognize tacho pulses and therefore the speed is not measured, you need to change the value.Easy way is to use detect function for correct value setting.Note! The tacho sensor must be connected and machine must be running, when you select the detect function.A Detecting level window appears during detection.
The min, max of signal and also the new trig level value will be displayed after detection.
The instrument doesn't remember the min and max values. These values will not be displayed again after you close and reopen the tacho menu.If the Signal swing is too small message is displayed, then the changes of tacho signal are too small for tachopulse creation.You can enter other value manually be selecting the user item. But to estimate functional value is not so simple.The value you need to enter is not a value directly from the sensor but after a signal processing in the tacho
26For further technical and contact information visit www.adash.com, email: [email protected]

ADASH Ltd. Adash 4300 – VA3Proinput, where a dc component of the tacho signal is removed and the signal is transformed to 0 - 10V range. The advice is to try 5V, 4.5, 5.5, 4.0, 6.0 3.5, 6.5 etc. so long until the triggering starts to work.
Pulses per rotation This value has to be set for correct speed evaluation, when more pulses are generated during one rotation. The Trigger Source=tacho is not available for more then one pulse.
Min Speed The lowest speed, which the user is interested to measure with tacho. We suppose that there is onepuls per one revolution. In other words, it means how long the instrument will wait for two tacho pulses (the speed is calculated from the time between two pulses). When the pulses are missing, then the NO SPEED erroris displayed. When you choose 1Hz, then the waiting interval is 1 second. When you enter 0.1Hz, then you will wait 10 seconds. You should be aware of time prolongation of each measurement.If the machine’s speed is lower than Min Speed, then tacho trigger will not be used.
GlobalThe parameters which have effect on all or many functions are understood as Global parameters. Press the Menu on the main screen and select Global. Press the OK button.
Route Auto Save off, on automatically saves the data after reading is taken (in route mode)
Route Auto Forward off, onThe list of measurement points is automatically displayed after data saving and next measurement point is selected. The necessary condition is, that all measurements from last point are taken and correctly saved.
Check Route Sensors yes, noEach point in the route contains the sensor setting, which is defined in DDS. The instrument contains also the sensors setting (Sensors button). Both settings are compared for each point during the route readings. When the sensor setting in point is not equal the sensor setting in instrument, then the Used sensor window appears. It is the warning to the user.
The user should connect the correct sensor to the unit with the parameters displayed in window. Confirm by pressing Ok. The setting in Sensors will be rewritten by point setting in route. You can make changes in setting now using the Sensors button.The sensor can have defined a name (e.g.ACC100). It should help the user in field to use correct sensor. Thesenames are checked in instrument. When the names are not the same, then the Used Sensor window appears. No checking of other parameters is done.
Language ENG, CZE
27For further technical and contact information visit www.adash.com, email: [email protected]

ADASH Ltd. Adash 4300 – VA3ProUnits metric, imperial
Value Type RMS, 0-P, P-P
Default value type for spectral amplitude values. E.g. spectral graph in analyzer module uses this type of amplitude but you can enter another value for particular graph in its Graph Properties menu.
Speed unit Hz, RPM, CPS, CPM
Frequency unit Hz, RPM, CPS, CPM
Phase Range -180,180
0, 360
Date Format yyyy/mm/dd
dd.mm.yy
mm/dd/yyyy
Enable screenshots yes, no the screenshot menu items will appear in menus
Power off [minutes] time period for switching off
Backgroud Color black/white background color of graphs
Advanced
The value of Advanced contains several various parameters itself. Every of them has only two available values ON and OFF. It is the same as the DIP switch in electronics.
Each individual switch is like the bit in computers. The bit also can have only two values, 1 (ON) and 0 (OFF). If we have eight bits (switches) then we can write them as the series of 0 and 1.
1 0 0 1 0 1 0 0If we are talking about eights bits, then we call it the byte. Computers use it in the same way.
People use the decimal system for counting. For example if have the number 8567, we look at this number as
8567 = 8 x 1000 + 5 x 100 + 6 x 10 + 7 x 1We can express it in better math formula
8567 = 8 x 10³ + 5 x 10² + 6 x 101 + 7 x 100
The number 10 is the base of decimal system. But also other values can be used for that. The computer uses number 2 and the binary system. It has the advantage, because every bit has only two possible values 0 and 1. In decimal system each bit should have to have 10 values.
If we use 8 bits in binary system, then value of byte (all 8 bits) is
b1 x 20 + b2 x 21 + b3 x 22 + b4 x 23 + b5 x 24 + b6 x 25 + b7 x 26 + b8 x 27
If we express it with decimal numbers, then it is
b1 x 1 + b2 x 2 + b3 x 4 + b4 x 8 + b5 x 16 + b6 x 32 + b7 x 64 + b8 x 128If all bits are equal 0, then result is equal 0. If all bits are equal 1, then result is equal 255.
The calculation for 8 bits ( any combination of 0 and 1) we can write in next form
1 0 0 1 0 1 0 0
x x x x x x x x
1 2 4 8 16 32 64 128
" " " " " " " "
28For further technical and contact information visit www.adash.com, email: [email protected]

ADASH Ltd. Adash 4300 – VA3Pro1 + 0 + 0 + 8 + 0 + 32 + 0 + 0 = 41.The result value 41 is expressed as one number and contains uniquely information about values off all bits.
Bit description
The instrument does not use all 8 bits yet.
b1 Do not display the window with question "Save data?"
The default value is 0. When you close the set of measurements or before the new measurement, the instrument asks you Save data?. Many users save data when they need it and this warning question is useless.If you set the B1 to 1, then this question will not be used.
b2 To cancel the measurement of point after the entering of manual values
The manually entered values are required before the measurements with sensor. If the b2=1, the new window appers after manual values entering. It asks Continue measuring? and you can or cannot continue to measurewith sensor. Default state is b2=0 and the measurement with sensor is always done.
Date and TimeDefine the date and time.
UpdateThe list of update files appears (files, which were saved to VA3). Select required version and press OK (F3).
Export LogsIt is the tool for firmware development. You can create the log file, which is saved in VA3_DISC/va3/logs.
29For further technical and contact information visit www.adash.com, email: [email protected]

ADASH Ltd. Adash 4300 – VA3Pro
ScreenshotOnly if enabled on Global. The screenshot image will be saved to disc - VA3_DISC/va3/screenshots.
30For further technical and contact information visit www.adash.com, email: [email protected]

ADASH Ltd. Adash 4300 – VA3Pro
Update of the firmwareDownload the latest firmware from www.adash.com / Downloads / Adash software / A4300-VA3 Pro
Firmware update instructions:- Download the firmware (e.g. A4300_ver0108.up) from above website and save it to your computer.- Connect the VA3 Pro instrument to the computer via USB cable. - Copy the firmware from the computer to the VA3_DISC /va3/ updates. (Newer devices appears on PC as e.g. VA3_626754. Depends on the serial number of the device.)- Use Safely remove hardware function and disconnect the instrument from the computer.- Switch-on the instrument and press Menu on the main screen.- Select the Update item and press OK.- Select the required firmware file from the list (more version files can be saved in the instrument). Press OK.- The list of commands appears.- The instrument is switched off.- Switch the instrument on again.
31For further technical and contact information visit www.adash.com, email: [email protected]

ADASH Ltd. Adash 4300 – VA3Pro
Update of the new measurement mode(s)
Once you will purchase additional measurement mode you will receive unique license file according to the serialnumber of your VA3 Pro instrument. The license file contains the information which measurement modes are included in particular VA3 Pro instrument.
License update instructions:- VA3 Pro instrument has to be switched off. Connect it with PC via USB cable.- Copy the license file (license file has .a43 extension) into VA3_DISC to va3 folder. (Newer devices appears on PC as e.g. VA3_626754. Depends on the serial number of the device.)- Disconnect the VA3 Pro from PC (always use safely remove feature to avoid failure).- Switch on the device
32For further technical and contact information visit www.adash.com, email: [email protected]

ADASH Ltd. Adash 4300 – VA3Pro
InfoIf you press Info (F1) on the main screen, the system information will be displayed.
33For further technical and contact information visit www.adash.com, email: [email protected]

ADASH Ltd. Adash 4300 – VA3Pro
The Main screenAfter switching the instrument on the Main screen appears. You can select required mode of the unit.
34For further technical and contact information visit www.adash.com, email: [email protected]

ADASH Ltd. Adash 4300 – VA3Pro
Speed detectionYou need to know the speed of the measured machine in some cases. We will describe here how the speed detection works. In the following text, this chapter can be mentioned.
Detection is done just before the measurement itself after pressing the Start button. During the detection there isinformation displayed in top right corner.
If the tacho probe is detected, no other speed detection will happen. The speed is measured by tacho probe.
The highest peaks are found and displayed in the list. The highest amplitude speed is on the top of list. The spectrum is displayed also. Select the correct value and press OK.
If you want to leave the speed undefined, then select unknown speed.If no value in the list is correct, then select manual entry and enter the speed manually.
The speed detection is available only when vibration sensor is used for point reading. In other cases the warning appears. Then the manual entry of speed is required.
If the measurement for speed detection fails, then error message appears. E.g. ICP error.
If the speed value is detected, it is automatically saved to the data header for following measurement in the same way as the speed value measured by tacho probe. If the speed is measured by tacho probe simultaneously, the value from the tacho probe has priority when saving.
35For further technical and contact information visit www.adash.com, email: [email protected]

ADASH Ltd. Adash 4300 – VA3Pro
MeterIt enables the user to perform basic vibrodiagnostics measurements.
Meter SettingsPress the Menu and select the Meter Settings.
Channel:Number of the input channelThe channel can be switched also outside the settings dialog using up and down arrows.
Vel fmin [Hz]:By default, the velocity measurement is taken in 10 – 1000 Hz range to detect the overall machine condition. This range is not convenient for low-speed machines (bellow 10 Hz = 600 RPM). Therefore, you can setup lower value of fmin.
Acc fmin [Hz]:By default, the acceleration measurement is taken in 500 – 25600 Hz range to detect bearing faults. Using the Acc fmin you can change the minimum frequency of the filter. E.g., in some cases, there may be vibrations above 500 Hz which are not caused by bearing faults and you know it. Then, you can set the Acc fmin value to 5000 Hz to filter these vibrations out.
Alarms:Settings of standards which define the limit values for warning (yellow color) and danger (red color); seeAppendix B: Standards for vibration measurements. When any alarms selected the measured values onfirst screen are displayed in traffic light colors.adash: Adash Limit Values, Speed detection needed.R13, F13, R24, F24: ISO 10816 limit values according to ISO 10-816, R means rigid, F means flexible, the number means machine group according to ISO 10816 standard.none: no traffic-light colors used
Additional options are available when Alarms are set as adash:Vel Limits Multiplier:
The Adash factory Machine Limits may be too much or too little for some machines. Therefore, for velocity measurements, you can adjust them using the Vel Limits Multiplier. Values greater than one increase the limits values (thus the alarm is less strict) and values less than one decrease them (alarm is stricter). A value of one means the limit remains as shown in the machine limits graph.
Acc Limits Multiplier:Same as Vel Limits Multiplier but used for Adash Bearing Limits.
Note! The Meter Settings are connected with the FASIT Settings. Thus, the values of parameters set in this menu are also used in the FASIT module. One exception is the Alarms parameter, which is not used in the FASIT settings because FASIT only uses Adash alarms.
36For further technical and contact information visit www.adash.com, email: [email protected]

ADASH Ltd. Adash 4300 – VA3Pro
Sensors SettingsIn the Sensors menu set up parameters for all channels you want to measure. All channels which have defined vibration sensor are measured together. Switch displayed channel by pressing up or down arrow.You need to use the accelerometer to display all possible measurements. If you use a velocity sensor, the acceleration values will not be measured. If you use a proximity sensor, the acceleration values and velocity values will not be measured.
Unit SettingsThe displayed units can be set up under the Global item. Set up the unit of speed (Hz, RPM, CPS, CPM) in the Speed Unit item. The vibration values are displayed according to the setting of Units (metric, imperial). The temperature can be displayed in degrees of Celsius or Fahrenheit.The units used are set up in Global/Units as follows:metric:
acceleration - gvelocity - mm/sdisplacement - µm
imperial:acceleration - g,velocity – in/sdisplacement – mil
Measurement Press Start to initiate the measurement. The speed detection runs first (see chapter Speed Detection).
Status bar There is a Status bar at the top part of the display. It provides information about the settings and status of the measurement. If the measurement is running there is a red icon labeled meas flashing in the top right corner.
Ch1:The number of the channel being shown
1140 RPM Auto:the value and unit of speed and the method of speed detection Auto: the speed is detected from the frequency spectrumManual: the speed is entered manually by the userTacho: the speed is detected by the tacho
Alarms:The standards used for stating the limit values
Measurement screensYou can switch between the measurement screens with the left and right arrow buttons.
Overall (RMS) and Peak (0-P) values
37For further technical and contact information visit www.adash.com, email: [email protected]

ADASH Ltd. Adash 4300 – VA3ProMeasurement of Overall and Peak value in the following frequency bands: velocity: 10 Hz - 1000 Hzacceleration: 0.5 kHz – 25.6 kHzThe colour describing the condition of the machine (green, yellow, red) is determined according to the speed value and vibration value (RMS, Peak).
Spectrum up to 200Hz – mechanical looseness detection
FFT analysis of vibrations in the range 2 Hz - 200 Hz in mm/s RMSThe 3 maximum peaks found are displayedThe peaks are arranged according to the vibration amplitude.
Time signal for roller bearing diagnosis
Measurement of time signal and vibrations in the range:0.5 kHz – 25.6 kHz in g.The screen shows the actual measured time signal and the Demod - gENV value.
Vibration in frequency ranges - gearboxes/ bearings
Measurement of RMS vibration values in the ranges:0.5 kHz - 1.5 kHz in g,1.5 kHz - 5 kHz in g,5 kHz – 25.6 kHz in g.It also displays the Overall RMS [g] value in the range 0.5 kHz – 25.6 kHz
38For further technical and contact information visit www.adash.com, email: [email protected]

ADASH Ltd. Adash 4300 – VA3Pro
Displacement values
The values of displacement in the range 2-100 Hz are displayed.
Temperature
The measured temperature is displayed in degrees Celsius and degrees Fahrenheit. The values are coloured according to the measured temperature.The ranges of colours are as follows: less than 30°C - green, 30-45°C - yellow, 45-60°C - orange, 60-75°C – red, more than 75°C – dark red.
39For further technical and contact information visit www.adash.com, email: [email protected]

ADASH Ltd. Adash 4300 – VA3Pro
FASITThe FASIT means the FAult Source Identification Tool. This mode should help beginners to determine the machine condition and bearing faults.
FASIT SettingsPress Menu and select FASIT Settings.
Note! The FASIT Settings are connected with the Meter Settings. Thus, the values of all parameters in this menu are remembered when you switch to the Meter module and select Alarms = Adash.
Channel:The number of the input channelThe channel can be switched also outside the settings dialog using up and down arrows.
Vel fmin [Hz]:By default, the velocity measurement is taken in 10 – 1000 Hz range to detect the overall machine condition. This range is not convenient for low-speed machines (bellow 10 Hz = 600 RPM). Therefore, you can setup lower value of fmin.
Acc fmin [Hz]:By default, the acceleration measurement is taken in 500 – 25600 Hz range to detect bearing faults. Using the Acc fmin you can change the minimum frequency of the filter. E.g., in some cases, there may be vibrations above 500 Hz which are not caused by bearing faults and you know it. Then, you can set the Acc fmin value to 5000 Hz to filter these vibrations out.
Vel Limits Multiplier:FASIT uses Adash Limit Values, according to which alarms are displayed. The factory Adash Machine Limits may be too or too little strict for some machines. Therefore, for velocity measurements, you can adjust them using the Vel Limits Multiplier. Values greater than one increase the limits values and values less than one decrease them. A value of one means the limit remains as shown in the machine limits graph.On following figures, you can see the effect of the multiplier. The first machine condition bar shows an alarm when the multiplier is set to 1. The second bar shows the same measurement, however the multiplier is set to 2, which means the limit value is twice as high as before. This means that FASIT is less strict and the alarm level is twice lower. The third case shows the situation with the multiplier set to 0.5.
Acc Limits Multiplier:Same as Vel Limits Multiplier but used for Bearing Limits.
40For further technical and contact information visit www.adash.com, email: [email protected]

ADASH Ltd. Adash 4300 – VA3Pro
Sensors SettingsIn the Sensors menu set up parameters for all channels you want to measure. All channels which have defined vibration sensor are measured together. Switch displayed channel by pressing up or down arrow.FASIT uses the measurement of acceleration or velocity from one channel. If you will use a velocity sensor, the bearing condition is not detected. For bearing condition detection the acceleration measurement is necessary.
UnitsThe displayed units can be set up under the Global item. Set up the unit of speed (Hz, RPM, CPS, CPM) in the Speed Unit item. The vibration values are displayed according to the setting of Units (metric, imperial). The units used are set up in Global/Units as follows:metric:
acceleration - gvelocity - mm/s
imperial:acceleration - g,velocity – in/s
MeasurementPress Start to initiate the measurement. The speed detection runs first (see chapter Speed Detection).
FASIT screen
The running measurement is indicated by a flashing red icon labeled meas in the top right corner.
Information about the measurement status and settings is displayed at the top of the screen: the number of the input channel shown, the overall RMS velocity and acceleration value, the speed value and the method of speed detection.
Auto: the speed is detected from the frequency spectrumManual: the speed is entered manually by userTacho: the speed is detected by the tacho
FASIT displays several graphs and the traffic light colours are used. Two main graphs show overall machine condition (left vertical bar) and bearing condition (right vertical bar). Next to the bearing condition bar there is a bar showing the temperature measurement. The range of the temperature bar is 100°C (212°F).
The bars show the severity of the following faults:
Overall machine condition, see Appendix C: Standards for vibration measurements
Overall bearing condition, see Appendix C: Standards for vibration measurements
Severity of unbalance fault
41For further technical and contact information visit www.adash.com, email: [email protected]

ADASH Ltd. Adash 4300 – VA3Pro
Severity of mechanical looseness
Severity of misalignment
The severity level of a different type of a fault.
The text message (e.g. Machine is in good condition) or the graph of the velocity spectrum is displayed at the bottom part of the screen. To switch between them press the Shift button or left/right arrow button.
42For further technical and contact information visit www.adash.com, email: [email protected]

ADASH Ltd. Adash 4300 – VA3Pro
StroboYou can use the instrument as a stroboscope in this mode. White LEDs on the top panel start to flash regularly with the frequency set up on the screen. When we have to study or to visually inspect machinery which has cyclically moving parts, then the stroboscope enables us to visually slow down or freeze this movement (rotation, cyclic movement, oscillation and vibrations). Imagine a rotating disc with one hole. When the flashes of light are synchronized with the disc rotation speed, then there is just one flash made during one rotation. It means that the disc is lit up when the hole is always in the same position. It is the principle of the illusion of frozen movement.
Press the Menu and select Strobo Settings. Define whether the tacho will be used or the user will select the frequency.
If the user frequency is selected then- use the right/left arrow for changing the frequency in Hz,- use the up/down arrow for changing the frequency in RPM.- use the F1/F2 button for divide/multiply frequency by 2
Easy accessThe Strobo mode could be ran from anywhere. You don’t need to be on the main screen. Turn the light on (press key 7). When the light is on, press 3 button. The Strobo mode opens.Warning! The Strobo mode cannot be opened during measurement.
43For further technical and contact information visit www.adash.com, email: [email protected]

ADASH Ltd. Adash 4300 – VA3Pro
The Analyzer mode
The Analyzer mode is the basic mode for signal analysis. If you have not prepared the Route readings, then youuse the Analyzer mode for analysis. All required parameters must be set manually or you can use the predefined parameters from memory.
The MeasThe Meas means one reading (measurement) as it is usually understood, e.g. overall value or time signal or spectrum or other.
The GraphThe graphical form of the reading displayed on the screen is called the Graph (overall value, time signal, spectrum, orbit, order analysis). One Graph works with data from one reading. You should keep in mind that one overall value is also the Graph.
The SetThe Set is the most important term in the Analyzer mode. The Set is the set (group) of one or more readings, which the user wants to take and display together. E.g. you want to take 4 readings together - overall acceleration, overall velocity, velocity time waveform and velocity spectrum. You prepare the Set, which includes these 4 required readings. The definition of Set is saved in the Analyzer memory. You can save many various Sets, which can contain your often used sets of readings. Then you select one Set and run it. The takingoff all readings included in the set is made simultaneously. See also Virtual Analyzers section for better understanding.
Analyzer menuThe first Analyzer screen contains the list of Sets saved in the memory (e.g.BASE1, BASE2, BASE3) or the empty list, when no Sets were created.The main analyzer menu enables to handle with sets.
New Set
Select the New Set and press OK. Enter the name and confirm by pressing OK. Use the Shift (F1) to change the keyboard function (abc, ABC, 123, <->). The last choice <-> enables to move in text by arrows and to delete characters (buttons 7 and 9). Press the Cancel button to cancel the New Set procedure (when the option <-> is on, otherwise the Cancel button is not available). When you do not enter the name of set and press OK, the procedure is cancelled as well.
44For further technical and contact information visit www.adash.com, email: [email protected]

ADASH Ltd. Adash 4300 – VA3ProCopy Set
Enables to copy the set to the new set.
Rename Set
Enables to rename the set.
Delete Set
Enables to delete the set.
Clear Set Data
Deletes all readings saved in the Set.
Notes
See the Route chapter for details
Readings (Measurements)Select one set from Set list (on the Analyzer main screen) and press OK. Press the Menu button (F2).
New Meas
New Meas (Basic)
List of predefined templates appears. You can select one of them.
45For further technical and contact information visit www.adash.com, email: [email protected]

ADASH Ltd. Adash 4300 – VA3ProNew Meas (Advanced)
The menu for definition of reading appears. The content of the menu changes according to the measurement Type selection (first row).
Channel, A channel number, B channel number 1, .., 3 Selection of the input signal source channel
Unit (name) The selection of the required unit to be displayed.
Detect Type RMS, Scaled 0-P, Scaled P-P, True 0-P, True P-P, AVG, Crest, Kurtosis The detected value property ( P means Peak).Scaled 0-P it is equal 1.414 * RMSTrue 0-P it is true 0-peak value in the waveform (the highest value captured in time signal).Scaled P-P it is equal 2.828 * RMSTrue P-P it is true peak-peak value in the waveform (the difference between highest positive and highest
negative value in signal)AVG it is average value of all samples (total sum of absolute values divided by number of samples)Crest it is equal True 0-P/ RMSKurtosis standard statistical formula for Kurtosis
Fmin [Hz] (value) The low cut-off frequency of band pass filter, which is applied to the signal before furtherprocessing (evaluation). The none value (available only when no integration is applied) means, that only input DSP filter is applied (approximately 0.6 Hz).
Fmax [Hz] (value) The high cut-off frequency of band pass filter, which is applied to the signal before further processing (evaluation). The information about sampling frequency (fs=) is displayed under this item.Warning! Maximum value of 90 kHz is available only for one channel.
DEMOD fmin [Hz] (value) The low cut-off frequency of band pass filter, which is applied to the signal (removing low frequencies).
DEMOD fmax [Hz] (value) The high cut-off frequency of band pass filter, which is applied to the signal (removing high frequencies).
ACMT FS [Hz] (value) The sampling frequency for ACMT evaluation. See the ACMT chapter for better understanding.
Samples (value) Number of samples (Speed control = off). The correspondent signal time length is displayed under this item.
Lines (value) Number of lines. The correspondent signal time length is displayed under this item.
Orders (1/2,1-5), (1-5), (1/2,1-10), (1-10)
Averaging linear, peak hold, time synchro (for spectrum)linear, maximum, minimum, median (for static values)
Time synchro averaging works in this way: the time signals are averaged (must be controlled by tacho in most cases) and from averaged time waveform is calculated the final spectrum. It can be set for non-enveloped and non-zoomed spectra.
Avg (value) averaging numberHow the averaging is used depends on the type of trigger:
freerun when the measurement is started, the signal needed for averaging is taken continuouslyexternal when the external trigger comes, the signal needed for averaging is taken continuously
without waiting for next triggertacho every signal for averaging is triggered (constant phase)amplitude every signal for averaging is triggered (constant phase)manual first signal for averaging is triggered manually, next signals are taken freerunmanual sequential every signal for averaging is triggered (constant phase)
Overlap (% value) Overlapping of signals in averaging.
Resolution speed / 4 – speed / 1024 When you use the tacho for e.g. APS measurement, thechoice of resolution is available. The number of FFT lines must be chosen in the computational procedure. The
46For further technical and contact information visit www.adash.com, email: [email protected]

ADASH Ltd. Adash 4300 – VA3ProFFT with fewer lines is faster and displays results more often. When you select higher resolution (e.g.speed / 64or even speed / 1024), then more lines must be used and you will wait for the results longer. If you have some considerable spectrum amplitude near the speed frequency, then you need to select the higher resolution. It eliminates the disturbing influence of the non speed frequency near the speed.Example: the speed is 25 Hz. The resolution is speed/4, i.e. 6.25 Hz. The speed line bandwidth in FFT will be 6.25Hz. It means, that speed line contains all frequencies in the interval (21.875 , 28.125). If any disturbing frequency is in that interval, then higher resolution must be used.
Frequency (speed, value) the frequency value for phase shift measurement can be entered manually (value) or the speed frequency from tacho sensor can be used.
Manual Entry If you want manually enter the value, then select Manual Entry = yes. All manual inputs are required before the measurement. The new window for each one appears.
Next Meas functions
Copy Meas
Copies the selected measurement to the new one.
Edit Meas
Enables changes in measurement properties.
Meas info
Displays measurement properties
Delete Meas
Deletes selected measurement.
Limits
You can define limit values for static measurement types (overall, speed, dc, …). Limits give a notice to you when a measured value is over some critical value. During the measurement and also during examining the measured values, the appropriate alarm is displayed in graph of measurement with defined limits. The alarm informs you about the severity of the measured value.Each limit value divides a numerical axis into two intervals, numbers bellow the limit value and numbers above it. You can edit the alarm for each interval. Alarm represents the severity or color for the values measured in theinterval. You can choose one from four severities for the alarm, Ok signaled with green color, Warning signaledwith yellow color, Alert signaled with orange color and Danger signaled with red color. It’s up to you what severity you assign to which interval. The particular alarm is displayed when the measured value is in appropriate interval. You can define more than one limit values and divide the numerical axis into more intervals. In the example bellow, we have defined two limit values, 1 and 4 mm/s. We have defined the alarm bellow 1 mm/s as Ok (green color), the alarm between 1 and 4 mm/s as Warning (yellow color) and the alarm above 4 mm/s as Danger (red color). In the first picture, you can see an actual measured value 2.61 mm/s which is greater than 1 and less than 4 (displayed as > 1, < 4 mm/s on the right side) and thus signaled as yellow color. The second picture shows a trend of values. You can see two limit lines in the trend, a yellow line on 1 mm/s and a red line on 4 mm/s. They represent the defined limit values and their colors correspond the alarms above the limit. Each value in the trend is drawn as a small colored circle whose color corresponds the alarm.
47For further technical and contact information visit www.adash.com, email: [email protected]

ADASH Ltd. Adash 4300 – VA3Pro
There are 3 ways how to create limits.
Adash Limits
The limits are derived from Adash rules, which are developed for many years of Adash history. These limits require to know the speed value. Adash limits are available for two data cells types:
velocity readings in frequency interval 10-1000Hz, which is very well suited for detecting the overall condition of the machineNote! fmin lower than 10 Hz is also accepted , it means Adash limits can be also used for velocity measurements with fmin lower than 10 Hz.
0,0
1,0
2,0
3,0
4,0
5,0
6,0
0 500 1000 1500 2000 2500 3000 3500 4000
speed [RPM] ---->
Vel
(10
-100
0H
z) m
m/s
RM
S ---
->
0
0,04
0,08
0,12
0,16
0,2
0,24
acceleration readings in frequency interval 500 - 16 000 Hz, which is very well suited for detecting the bearing conditionNote! fmin lower than 500 Hz and fmax higher than 16000 are also accepted, it means Adash limits canbe also used for acceleration measurements with fmin lower than 500 Hz and fmax higher than 16000 Hz
0,0
0,5
1,0
1,5
2,0
2,5
3,0
3,5
0 1000 2000 3000 4000 5000 6000 7000 8000
speed [RPM] ---->
Acc
g R
MS
---
->
48For further technical and contact information visit www.adash.com, email: [email protected]

ADASH Ltd. Adash 4300 – VA3ProThese limit values may be too or too little strict for some machines. Therefore, you can adjust them using the Limits Multiplier. Values greater than one increase the limits values and values less than one decrease them. A value of one means the limit remains as shown in the graphs above.On following figures, you can see the effect of the multiplier. The first graph shows an alarm when the multiplier is set to 1. The second graph shows the same measurement, however this time the multiplier is set to 2, which means the limit value is twice as high as before. This means the limit is less strict and the alarm level is twice lower. The third case shows the situation with the multiplier set to 0.5.
Note! For Adash limits, only the small colored circles are used in trends, the limit lines are not displayed. It is because of the relation to speed. Each reading can have different speed and therefore different limits.
ISO 10816
The limits are defined according the ISO 10816 standard and are available only for velocity readings in frequency interval 10 – 1000 Hz. The Machine Group and Machine Foundation has to be defined according to the ISO 10816 standard.
Group1: Large machines (rated power above 300kW) with a shaft height greater than 315 mm. Group2: Medium-sized machines (rated power from 15 kW to 300 kW) and electrical machines with a
shaft height between 160 and 315 mm. Group3: Pumps with multivane impeller and with separate driver with rated power above 15 kW. Group4: Pumps with multivane impeller and with integrated driver with rated power above 15 kW.
Note! The severity in ISO limits are marked also by letter A, B, C, D. Used group and foundation is also displayed in graph.
userUser can define your own limits.
By default, there is no limit value defined yet and the Alarm is set to Ok for all measured values. It is same as in DDS dialog for limits.
49For further technical and contact information visit www.adash.com, email: [email protected]

ADASH Ltd. Adash 4300 – VA3ProYou can add a limit value using an Add Limit Value item and enter the value (eg. 1).
Now you have defined one limit value (1 mm/s) which divides a numerical axis into two intervals (bellow 1 mm/s and above it). You can define alarm for each interval. Alarm 1 defines the alarm bellow the Limit Value 1 and Alarm 2 defines the alarm above the Limit Value 1. The same think can be done in DDS by clicking on symbol⊕and entering the number.
Same way you can add any number of limit values.
Limit values can be also edited or deleted using an appropriate Limit Value item.
Alarms are defined using an appropriate Alarm item.
50For further technical and contact information visit www.adash.com, email: [email protected]

ADASH Ltd. Adash 4300 – VA3Pro
Note! You can assign alarms in any order. It’s not required the Ok alarm to be the lowest. Eg., for displacement measurements, there is often the Ok alarm in the middle and Warning and Alert alarms are assigned to lower and higher intervals.
Functions for SetNext functions are available, when the Set is opened (it means the graphs are displayed).
Save data
It saves last measured data. When you close the Set without saving, the measured data will be lost.
Clear data
Deletes all saved data from the set.
View Trend/ View Actual
The switch for displaying of last measured data (Actual) and data saved in memory (Trend).
Clear Last Data (if the trend is displayed)
deletes last measured data in measurement point or set (according of displayed data).
ExportThe next menu appears.
Export to csv
Export to csv saves one selected measurement in csv format (not available for all types)Export to csv (all) saves all measurements in set in csv format (except types, where are csv not available)Csv means comma-separated values. It is the basic format for tables (MS Excel). We use semicolon as separator.
Exported csv files are saved to va3/csv folder. Files are saved to sub-folders. In case of route export is the sub-folder name created by route name_machine name_point name. In case of runup is added the date and time (set_yyyy_mm_dd_hh_mm_ss).
51For further technical and contact information visit www.adash.com, email: [email protected]

ADASH Ltd. Adash 4300 – VA3Pro
Export of last measurement (actual)The name has the format : position-number_name_yyyy_mm_dd_hh_mm_ss_msec.csv. The first line in the file contains information:
u: unit name (A4300-######, ###### = serial number)ch: channeln: number of samples (lines)d: delta x, step on X axe between sampleseu: engineering unitt: date and time of measurements: speed
Next lines contains measured data. Each line can contain several values.time time [s]; value; trigger;ACMT time [s]; value; trigger;orbit time [s]; valueA; valueB; valueX; valueY; trigger;spectrum frequency [Hz]; amplitude; phase [°];orders order; amplitude; phase [°];1x amp+phase 0; amplitude; phase [°];phase shift 0; B/A; ΦB-ΦA [°]; coherence;center line 0; valueA; valueB; valueX; valueY;other 0; value;
Export of trends (history)If you used View trend function, then for static measurement is exported complete trend to one csv file. The only one displayed dynamic measurement is exported - not all measurement in trend.The file name is position-number _name.csv. The first column always contains date and time of measurement.
Graph Max/MinMaximizes or minimizes the selected graph to the whole screen or returns back to the initial screen with more graphs.
Graph PropertiesThis menu item displays various options for graph displaying. The options depend on graph type.
Scale
Scale max Y autoscale for every new graph, but the range is increased when higher value comesauto Y autoscale according data values of every new measurementuser user defines Y range for all graphs independently of data values
Applied for time, g-demod time (time waveforms), orbit, spectrum, acmt.
View orbit
View orbit orbit standard 2D orbit view
AB two input time signals from channels A and BXY two time signals transferred to X and Y axis
Applied for orbit.
Axis X, Axis Y
Axis X - lin, logAxis Y - lin, log, dB
Applied for spectrum, g-demod spectrum.
52For further technical and contact information visit www.adash.com, email: [email protected]

ADASH Ltd. Adash 4300 – VA3ProValue Type
RMS, 0-P, P-P
Y axis typeApplied for spectrum, g-demod spectrum, orders.When the spectrum is displayed first time, then the global Spectrum Settings / Detect Type is used. You can change it here to other type.
Graph Lines
Graph Lines continuous, discrete the spectrum can be drawn as line through the tops of line or as discrete vertical line for each frequency
continuous discrete
Applied for spectrum, g-demod spectrum.
The Analyzer buttons description
The F3 button (Start / Stop)
The F3 button may have 2 functions.The Start button starts the reading (measurement).The Stop button stops the reading (measurement).
The Shift button
The Shift button switches the functions of the arrow buttons.
When Measurement Set is opened, press repeatedly the Shift button and notice that the mode of buttons changes. The name of the mode is written in the top left corner of the screen.
Selection - use the up and down arrow buttons to change the active graph (one graph is always selected)Position - use the up and down arrow buttons to change the position (order) of graphsCursor – use the left and right arrow buttons to move with cursor,Zoom - the arrow buttons make zoom-in or zoom-out functions on X or Y axis,Move - when the zoom-in is applied, then you can move with the signal by the arrow buttons Trend – when the trend is displayed, the left and right arrow buttons change the time
Band fmin[Hz] - HP filteringAlmost in all measurements you should define the HP filtering of input signal. You set it in Band fmin[Hz] parameter. You can select the none, 1, 2, 10 and user filter. The none value is available only for direct measurement without integration. The none value does not mean the DC part measurement. The HP filter on A/
53For further technical and contact information visit www.adash.com, email: [email protected]

ADASH Ltd. Adash 4300 – VA3ProD converter is always used. But no additional filter is used. The frequency range with none filtering begins on 0.5 Hz (-3dB point). See the response graph.
-5
-4,5
-4
-3,5
-3
-2,5
-2
-1,5
-1
-0,5
0
0 0,5 1 1,5 2 2,5 3 3,5 4 4,5 5 5,5 6 6,5Hz
dB
FASIT measurementThere is detailed description in the FASIT mode chapter.If the FASIT is measured, the speed detection is done before the measurement itself (see the Speed detection chapter).
Overall measurement
This is typical example of overall measurement. The RMS value of vibration velocity in frequency range 10-1000Hz is measured.
54For further technical and contact information visit www.adash.com, email: [email protected]

ADASH Ltd. Adash 4300 – VA3Pro
The first row contains used parameters. The 25.1Hz on the right is the speed, because the tacho sensor was used.
Change the Detect Type to 0-P.
Note, that the 2.22 is not 1.414 times bigger then 0.921. Some of users mistakenly think, that the formula 0-P=1.414*RMS is valid for every signal. It is not true. That formula is valid only for pure sine wave ! The true RMS and true peak measurement are generally independent. The only rule is that the peak value is always bigger then RMS value.
Let's change the Avg to 8. The eight individual values (1 sec length) will be taken and the result will be the linearaverage of them ( RV = (V1+V2+...+V8)/8). The indication 8/8 is on the right top.
Let's change the Avg back to off and change the samples number to 32768. The measurement will be 8 sec long.
You see that the result is different from the previous value. It is clear, the max 0-P value in 8 sec signal is not equal the average of 8 0-P values ( which takes 1 sec each).
Let's change the type back to RMS.
Now change the length to 1 sec (4096 samples) and Avg=8.
You see the same result. Both values are equal. The meaning of RMS differs from peak values. The RMS valuedepends only of total time of measurement. It does not care if one long signal was taken or several shorter signals were averaged.
Spectrum measurement
The fs below the Fmax means sampling frequency. The t below the Lines is the time signal length, which is used for one spectrum. The df is the frequency resolution between lines.
55For further technical and contact information visit www.adash.com, email: [email protected]

ADASH Ltd. Adash 4300 – VA3ProThe information in top right contains averaging (2/8) and speed (25.1Hz).The Band fmin defines the frequency of HP filtering, which is used for DC part removing. If you do not expect any important lines bellow 10Hz, use the 10 instead 1. The initialization time of 1Hz filter is much longer then 10Hz.
The Overlap enables to you to make the averaging faster. E.g. 75% overlap means, that ending 75% of actual time signal + 25% of new signal is used for next average.
Time signal measurement
Similar parameter like for overall is used. The red short vertical lines at the top of graph indicates the tacho inputs.
For averaging you need to set the Global/ Trigger Settings/ Trigger Source = tacho. Then define the number of averages.
You see the effect of averaging in decreasing of signal noise. The speed frequency is better seen. With the cursor values are displayed also totRMS and tot0P values.
G-demod spectrum measurement
Example: the demodulated frequency 1322Hz with harmonics.No integration of signal is enabled.
56For further technical and contact information visit www.adash.com, email: [email protected]

ADASH Ltd. Adash 4300 – VA3Pro
G-demod time signal measurement
This function enables to see the signal, when the standard envelope demodulation is used.The Unit cannot be changed, only the acceleration g unit can be used. No integration of signal is enabled.
G-demod overall measurement
It is very similar to standard overall measurement. The signal is filtered in ( DEMOD fmin, DEMOD fmax) range and demodulated then. The Unit cannot be changed, only the acceleration g unit can be used. No integration of signal is enabled.
1x amp+phase measurement
The smaller resolution means longer time signal for evaluation. We do not recommend to use always the minimum value ( speed/64), because you will wait for results longer (much longer). Use the small resolution onlyin cases, when your signal contains two close frequencies and you need to separate them. For 50Hz speed the speed/4 means the band (43.75Hz, 56.25Hz) and the speed/64 means (49.61Hz, 50.39Hz).
Orbit measurement
57For further technical and contact information visit www.adash.com, email: [email protected]

ADASH Ltd. Adash 4300 – VA3Pro
Correct sensors positions (angles) must be set for correct calculations (see Sensors definition).
Speed measurement
The machine speed (revolutions) is measured.When the tacho sensor is used (connected to the tacho input), then the impulses is added to all AC inputs. In the time signal graph are marked by short red lines.
The speed measurement is taken 8 times in every second. The value is evaluated from 3 tacho events in time signal. When the averaging is required, then more values is used. But keep in mind that only 8 values is taken inone second.
ACMT measurement
It enables to measure long time signals and compress them. It is used when you need high frequency range, forexample 25.6kHz. The highpass filtering is used (Band fmin). The basic property of ACMT is resampling initial high frequency sampling (64kHz) to low ACMT FS frequency sampling (usually 1kHz).
The compressed ACMT time signal can keep the RMS or TRUE PEAK of original signal. Use the Detect Type parameter for selection. RMS value enables better trending.
The original time signal 1 sec long, which contains shock. Signal contains 65536 samples.
58For further technical and contact information visit www.adash.com, email: [email protected]

ADASH Ltd. Adash 4300 – VA3Pro
The ACMT time signal. You can see the same shock, but signal contains only 1024 samples.
Orders measurementThis name means order analysis.
Phase shift measurement
The measurement of phase shift (between two channel A and B), amplitude ratio and coherence on speed frequency (with tacho) or manually entered frequency.
The result contains:- phase shift value in degrees,- amplitude ratio ( ampl B/ ampl A),- coherence
If the phase shift is reliable, then the coherence must be bigger then 0.8.
DC measurementThe direct DC signal can be measured by this function.
59For further technical and contact information visit www.adash.com, email: [email protected]

ADASH Ltd. Adash 4300 – VA3Pro
If you want manually enter the value, then select Manual Entry = yes. All manual inputs are required before themeasurement. The new window for each one appears.
IR temperature measurementTemperature measured from IR sensor. The sensor is on top panel of the instrument.
Center line measurementThis measurement is often used for turbines. The Center line values define the static position of shaft in bearing.The signals from proximity sensors must be connected to DC channels. We need to remove the AC part and to hold the DC part. The DC inputs work in that way.
The Center line is related to the orbit measurement. We also need two sensors with known angles of mounting. Correct dc sensors positions (angles) must be set for correct calculations (see Sensors definition).While in orbit we see the shape around the (0,0) position, in the center line we see the position of shaft center without shape of orbit.
Two couples of values are displayed - A+B and X+Y. The A,B values represent distances of sensors from the reference position defined by offset value. The X,Y values represent that positions according the Cartesian X,Y coordinates ( The position (0,0) correspond the position, where A,B are equal their offsets).
S-max measurement
60For further technical and contact information visit www.adash.com, email: [email protected]

ADASH Ltd. Adash 4300 – VA3Pro
It is standard S-max measurement as the maximum vector amplitude of displacement. Correct sensors positions (angles) must be set for correct calculations as for standard orbit graph (see Sensors definition).
Ultrasound measurement
Two values are displayed. The Level of sound in dB (30-50kHz range) and Shock Factor. The Shock factor is defined as Peak value divide by RMS value. It means value 1.4 for pure sine. Higher values means that transient shock events are in the sound signal.
Note: The ultrasound sensor (microphone) required.
There is detailed description in the Ultrasound mode chapter.
Record
Creates and saves the record. After the download to PC it is ready for using with Virtual Unit.There is detailed description in the Recorder mode chapter.
61For further technical and contact information visit www.adash.com, email: [email protected]

ADASH Ltd. Adash 4300 – VA3Pro
The Route mode
Loading the route to the instrumentThe DDS software is required for the route measurement. See also the DDS user manual for more details. We do not describe all details about the DDS function in this guide.Open the database in DDS which you want create the route from. Open the instrument window (Route/ A4300_VA3). The route window appears. Connect the instrument with a USB cable.Press the Connect button, the message window with connection process description should appear. The list of data saved in the instrument appears.Move the required points from the DDS tree to the route window (use mouse Drag’n’Drop).
You can see that the structure of the tree has changed. This is because the VA3 Pro strictly requires a tree with the following structure Tree_Name - Machine - Measuring Point - Data Cell. If there are more items in the DDS tree in a path between these items, the names of such items are combined together (like in this example “Turbo Generator/Fans/Fan 1“ or “Motor/L1RV” etc.). If the item name in a route tree is longer then 45 characters the DDS tries to shorten such names. To avoid this we recommend using shortcuts in the tree items (in this case “Turbo Generator” should be “TG”).
Press the Send button. The route data will be loaded from the computer to the instrument.
Creation of the route treeThe route tree can be created also in the VA3 directly. The new database must be created in DDS for it. See DDS guide for details.
Route readingsSelect the Route mode in the VA3Pro main screen. The list of routes in the memory is displayed.
Select one route and press OK. The list of machines appears.
62For further technical and contact information visit www.adash.com, email: [email protected]

ADASH Ltd. Adash 4300 – VA3Pro
Select one machine and press the right arrow to display the list of points.
Now you can start the measurement by pressing Start (F3) or display the list of measurements defined in this point by pressing the right arrow button.Use the left arrow button to return to the previous level in the tree.
When you press the Start button on the screen with the list of points, the graphs are displayed with the No Datamessage and the measurement begins. If the required sensor (defined in the route) is not compatible with the sensor connected to the channel input (Sensors properties) the instrument displays a warning. If this happens change the sensor or use a different sensitivity and press Continue.
All measurements defined in the point should be taken now. The measured data are displayed on the screen.
63For further technical and contact information visit www.adash.com, email: [email protected]

ADASH Ltd. Adash 4300 – VA3ProPress the Back button (F1) to return to the list of points. The measured point is labeled by the tick symbol √ (all defined measurements were taken) or by the exclamation mark symbol "!" (some readings were not taken due to error) or by the dot symbol "." (measurement not complete).
Downloading the route to the computerOpen the instrument window (Route/ A4300_VA3). The route window appears. Connect the instrument to a USB port. The information screen with the message Connected to PC appears on the VA3 Pro screen.Press the Connect button in DDS. The list of readings saved in the instrument appears (data saved in the instrument).Select the required route. Press the Store button. The data are transferred and saved to the database.
Reference valuesYou can download reference values from DDS to VA3 unit for spectrum and overall measurements. These values are displayed together with measured values.Reference spectrum is displayed together with measured spectrum in the same graph.Overall reference value is displayed in left side of graph and it is signed by “R:” or like a line in trend view.
Manual entryThe route may contain the measurements, which have to be entered manually ( e.g. temperatures read from analogue display). The measurement with subtype MANUAL in DDS is defined. Before beginning of measurements from sensors (after you press START button) the window for manual input appears ( one for each manual input ).
64For further technical and contact information visit www.adash.com, email: [email protected]

ADASH Ltd. Adash 4300 – VA3Pro
You can skip the value entering. Until the field for value entering is empty, the F3 button means Skip.
The measurement automatically begins after entering of all manual values. If you want to be able to cancel the measurement, set the b2=1 in Advanced parameter. See chapter Main menu / Global for details.
NotesSelect Notes item. The list of notes for point appears. It is empty, when no notes was created yet.
Use the Menu / Add Note to new note addition. The list of predefined notes appears.
The predefined notes are saved in instrument in va3/notes folder. The individual file exists for each language. The user can modify the notes or can add his own notes. Use any software for text files edit.
Select one note from the list and press Ok.If you want to enter the text, then select user text item. You can also edit the note which was selected from the predefined list. Then press Ok.
After pressing Ok you return back to the list of notes. The new note appears in the list.
Use the Menu / Edit Note to edit the selected note from the list.Use Menu / Delete Note to remove selected note.Press Ok to close the list.If the note exists for point, then the N letter is displayed behind the point name.
65For further technical and contact information visit www.adash.com, email: [email protected]

ADASH Ltd. Adash 4300 – VA3Pro
Speed in the routeThere are various ways how to get the speed and transfer it to DDS. The ways are described here in the order from the lowest priority to the highest priority.
Speed entered in DDS
The Default Speed can be set in DDS as a machine parameter (Tree Item Properties / Speed tab). This value is sent to the instrument and it is used in place of tacho sensor value. The three options of Default Speed are available for the machine item.Entered value - the value entered in Default speed is sent to the instrument. The value is used only for FASIT measurement. If the value is entered, then no speed detection is used.Detected option runs speed detection before measurement (see the Speed Detection chapter).Manually Entered option opens Enter the speed dialog, where you enter the value.Detected or manually entered speed is valid for whole machine. Unless you close the machine item, the same speed value is used.The Default Speed can be also set in other items, not only in the machine. In this case only numerical value is available. If you enter default speed value and in the same time you have set machine's default speed as Detected or Manually Entered, then the machine's setup has priority.
Measured Speed
If the speed is measured by tacho probe, it is saved always with data regardless the fact if there were already defined by one of the previous ways (speed entered in device or DDS).
Current entered or detected speed value (if defined) is displayed in information panel
LimitsIn DDS, you can define limit values and alarm colors (see the DDS manual to find out how to do it). For static data cells, these limits are transferred into the instrument together with the route. Exceeding the limit values is signaled during the measurement and also in trends.
The Route buttons descriptionButtons have same meanings as in the Analyzer mode.There is only one more functionality in route mode. If arrows function is set to Trend, then you can use up and down button to change displayed point while measured data are displayed.
66For further technical and contact information visit www.adash.com, email: [email protected]

ADASH Ltd. Adash 4300 – VA3Pro
The Balancer
IntroductionThe balancing process is based on standard measurements of amplitude and phase on the speed frequency. The VA3 balancer includes many special internal functions, which remove the influence of noise and speed changes etc. If you are not familiar with on-site balancing method, we recommend reading professional literature before you proceed.
Planes and PointsWe would like to explain the difference between the words 'plane' and 'point'. The sensor is mounted to the pointor points (dual channel reading). The trial mass and final masses are mounted to the plane or planes. Some people talk about measuring on planes, but this is not correct. In case of overhanging rotor there is no direct relationship between points and planes.We use the labels A and B for points and 1 and 2 for planes.
The ProjectThe Project is the base structure in the Balancer mode. It corresponds to one balancing job. You can use the same Project for repeated jobs on the same machine. The measured data will be re-written.The Project contains all measured or entered data, which are used during the job. The typical scheme looks likethe following list of steps:- Create the project.- Enter the parameters of the project.- RUN 1 - Initial measurement of the vibration amplitude and phase is taken at the required number of points.- Place a trial mass on the plane. Repeat this step on the second plane if required.- RUN 2 - Trial mass response measurement is taken. Repeat this step on the second plane if required.- Place final masses put on all planes.- RUN 3 – This checks the effect (success) of the balancing job.- Trim - Additional trimming can be carried out for better results.
The Project ScreenEvery step is displayed on its own screen. You can move between screens by pressing the left/right arrow buttons.
This movement enables you to return back anytime. Attention: When you return back to the job screens and take the reading again or enter the value, then the measured data will be erased in all screens after the current screen. The reason is simple; the implications are derived from every screen to the following screens. When you repeat the measurement, you change the parameters for those implications. That is why all the following screen implications must be removed and you have to take all the necessary readings again.
The first screenThe list of saved projects or the Empty label is displayed on the first screen. Select one project or use the Menu/New Project. The following functions for managing projects are also enabled (Menu button).
67For further technical and contact information visit www.adash.com, email: [email protected]
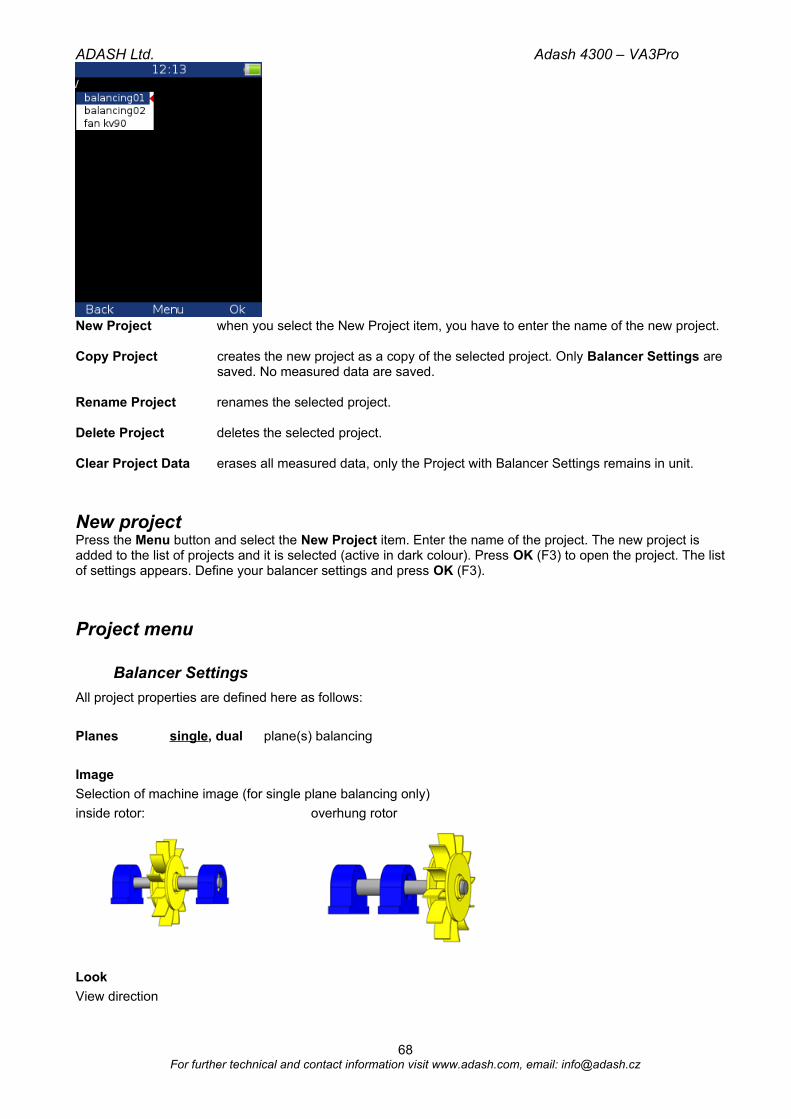
ADASH Ltd. Adash 4300 – VA3Pro
New Project when you select the New Project item, you have to enter the name of the new project.
Copy Project creates the new project as a copy of the selected project. Only Balancer Settings are saved. No measured data are saved.
Rename Project renames the selected project.
Delete Project deletes the selected project.
Clear Project Data erases all measured data, only the Project with Balancer Settings remains in unit.
New projectPress the Menu button and select the New Project item. Enter the name of the project. The new project is added to the list of projects and it is selected (active in dark colour). Press OK (F3) to open the project. The list of settings appears. Define your balancer settings and press OK (F3).
Project menu
Balancer Settings
All project properties are defined here as follows:
Planes single, dual plane(s) balancing
Image
Selection of machine image (for single plane balancing only)
inside rotor: overhung rotor
Look
View direction
68For further technical and contact information visit www.adash.com, email: [email protected]

ADASH Ltd. Adash 4300 – VA3Proleft: right:
Rotation CW, CCW clockwise or counterclockwise
Point A 1-3 the number of the AC input which will be used for the sensor mounted on point A
Point B 1-3 the number of the AC input which will be used for the sensor mounted on point B
Note: The point markings A and B have only a symbolic sense. They have no relation to the balancing planes 1 and 2 and to the balancing computational procedure. You can mark any measuring point as A and the second as B.
Remove Trial Mass yes, no
The trial mass can be left on the rotor or can be removed from the rotor after trial run.
Balancing Masses add (mount ) / remove (drill)
Blades the number of blades (for rotors with blades). This parameter is used in calculations to split the mass between blades.
Meas Mode single, online meter when you press the Start button, then only one measurement value can
be taken (single) or the continual measurement values displayed (online meter). In the online meter mode you can look at more values and evaluate their changes over time. When the valuewhich you want to use is displayed, you need to STOP the measurement.
Avg the averaging of more then one measured value is available
Resolution read the explanation in the Analyzer mode chapter: Meas functions/ New Advanced section.
Amplitude amplitude unit
Value type RMS, 0-P, P-P
Until you don't change this value the Global / Value Type is used.
Speed speed unit
Mass mass unit
Rotor Settings
Parameters of the rotor are defined here. All parameters are optional. It enables calculation of the balancing quality factor according to ISO1940.
Rotor mass rotor mass in kg
Radius radius to which the balancing mass will be mounted,
(could be different for each plane).
Balance Quality Grade demanded quality grade according to ISO 1940,
if entered, the recommended trial can be computed.
Enter Trial
For trial runs only. Enter the value of the trial mass.
Enter Values
You can manually enter the values instead of measuring them (balancing calculator function).
69For further technical and contact information visit www.adash.com, email: [email protected]

ADASH Ltd. Adash 4300 – VA3ProEnter DF
For trial runs only. You can enter a dynamic factor of balanced rotor instead of processing the trial run. The value of the dynamic factor is always calculated after the trial run and can be displayed using Menu / Display DF. If you balance the same rotor after some time, then there is no need to measure the trial run again. Instead,you can enter DFA (Dynamic Factor Amplitude) and DFP (Dynamic Factor Phase) values.
Display DF
For trial runs only. If the dynamic factor is not entered manually, but is calculated during balancing from the values of the measured or entered vibrations, then it is not displayed on the screen. You can display it using thismenu item.
Report
The function creates a balancing report in .rtf format (MS Word) and saves it to the VA3_DISC (directory va3/report) for PC downloading.
Vector
This shows the drawing of amplitude/phase vector development during the balancing process. The drawing is also included in the balancing report.
Description: R1-RUN1, R3-RUN3, T1-T3 -trims 1-3.
Total Mass
Displays the total balancing mass. It is a vector sum of all masses mounted to the rotor (basic + all trims).
70For further technical and contact information visit www.adash.com, email: [email protected]
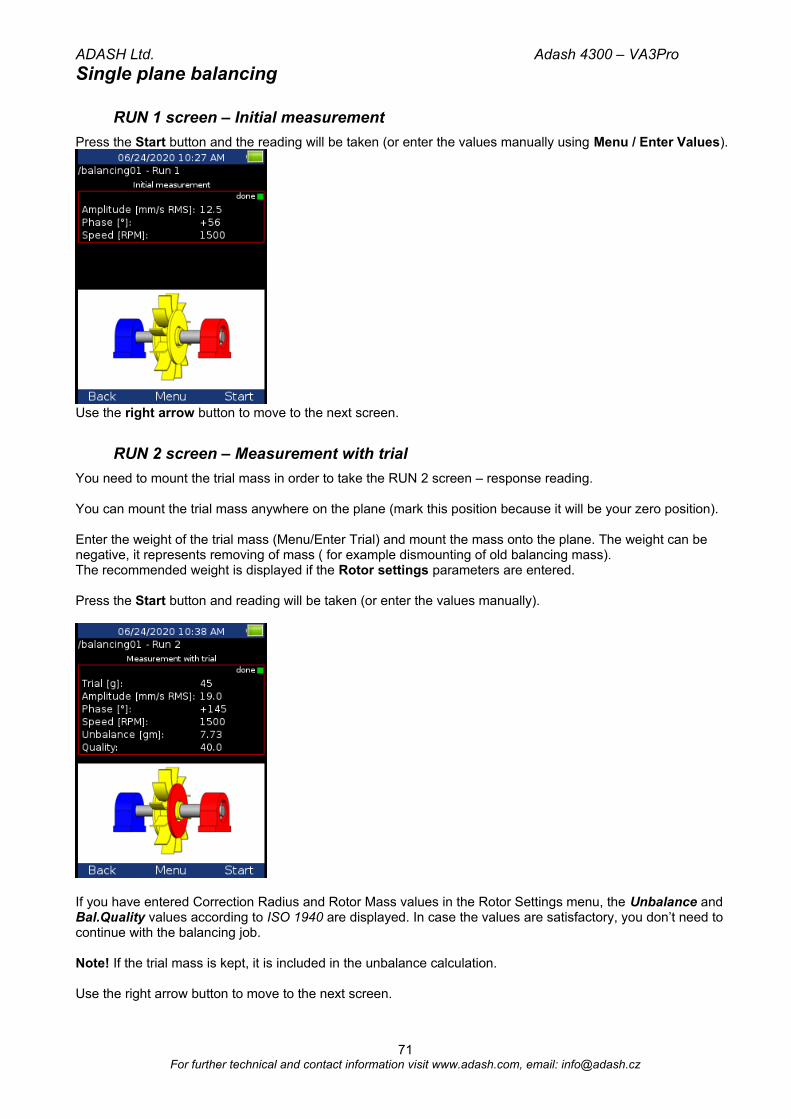
ADASH Ltd. Adash 4300 – VA3Pro
Single plane balancing
RUN 1 screen – Initial measurement
Press the Start button and the reading will be taken (or enter the values manually using Menu / Enter Values).
Use the right arrow button to move to the next screen.
RUN 2 screen – Measurement with trial
You need to mount the trial mass in order to take the RUN 2 screen – response reading.
You can mount the trial mass anywhere on the plane (mark this position because it will be your zero position).
Enter the weight of the trial mass (Menu/Enter Trial) and mount the mass onto the plane. The weight can be negative, it represents removing of mass ( for example dismounting of old balancing mass).The recommended weight is displayed if the Rotor settings parameters are entered.
Press the Start button and reading will be taken (or enter the values manually).
If you have entered Correction Radius and Rotor Mass values in the Rotor Settings menu, the Unbalance and Bal.Quality values according to ISO 1940 are displayed. In case the values are satisfactory, you don’t need to continue with the balancing job.
Note! If the trial mass is kept, it is included in the unbalance calculation.
Use the right arrow button to move to the next screen.
71For further technical and contact information visit www.adash.com, email: [email protected]

ADASH Ltd. Adash 4300 – VA3ProRUN 2 - the RESULT screen
The weight and phase(position) of the final balancing mass are displayed. Mount the final mass. The angle is applied from the trial mass position, which represents the 0 (zero) degrees. The direction of the angle is the same as the direction of rotation. E.g. +57 degrees means from the trial mass position in the direction of rotation. Minus degrees means against the direction of rotation.
You can split correction mass to two arbitrary angles (in case if it is not possible to place the correction mass into calculated position). Go to menu Menu / Split Balancing mass
Enter the value of the first angle.
Then enter the value of the second angle.
The balancing mass will be recalculated (split) into two required angles.
Select Menu / Set Default Angle to return back to the original calculation.
If the number of blades was defined, the final mass is divided between the two nearest blades to the exact balancing angle. The angle position is always measured from the position of the trial mass.
72For further technical and contact information visit www.adash.com, email: [email protected]

ADASH Ltd. Adash 4300 – VA3Pro
You can select other blades in case when you cannot mount weight to the nearest blade (blades). Select Menu / Change Blades menu item.Enter the number of the first blade.
Then enter the number of the second blade.
New balancing masses will be displayed.
Select Menu / Set Default Blades menu item to return to the original masses.
The RUN 3 screen
When the mass or masses are mounted then it is the time to check the balancing job. The screen is very similar to the RUN 1 screen.Take the reading or manually enter the values.
73For further technical and contact information visit www.adash.com, email: [email protected]

ADASH Ltd. Adash 4300 – VA3Pro
The Effect value represents the reduction of vibrations in % (the 1.1mm/s is 91.2% less than 12.5 mm/s from initial run). The Unbalance value represents residual unbalance after applying the correction mass.
Trim Screens
If you are not satisfied with the results then you can continue the balancing job after the RUN 3 measurement (press the right arrow button). These next steps do not require the trial mass measurements anymore. After each reading the next mass (or masses) is recommended. The trim screens are very similar to the screens described before.The recommended trim mass is displayed. After mounting the trim mass, press the right arrow button.The TRIM 1 screen appears. It is the same screen as the RUN 3 screen. Run the measurement or enter the values.Then the new results, effect and quality value are displayed.Press the right arrow and continue with TRIM 2 in same way as with TRIM 1. You can use as many trims as youwant. However, when the trim result is not better (or even is worse) it makes no sense to keep trimming.
Dual plane balancing
RUN 1 screen
The screen is divided into two parts. The upper part corresponds to Point A and the lower one to Point B.If you use only one sensor, then only one part is selected (red border). The other part is bordered in grey. Mountthe sensor to the selected point and take the reading. Use the up/down arrow buttons to change the selection of the Point. Do the same for the second point.With two sensors you take both points readings at once.
You can also enter the values manually.
74For further technical and contact information visit www.adash.com, email: [email protected]

ADASH Ltd. Adash 4300 – VA3Pro
RUN 2 with trial mass on Plane 1
This is similar to single plane balancing, except that two trial masses must be mounted onto the two planes.If you know the dynamic factor, then you can enter all 4 values manually and you do not need to measure the RUN 2.
Enter the weight of the trial mass (Menu/Enter Trial). The weight can be negative, it represents removing of mass ( for example dismounting of old balancing mass). The recommended weight is displayed if the Rotor settings parameters are entered.
After the reading at Point A take the reading at Point B (or take them both at the same time, if you are using 2 channels). The trial mass remains on Plane 1.After measuring both planes with the trial mass on Plane 1, remove the trial mass or keep it according the Remove Trial 1 settings.
Press the right arrow button.
RUN 2 with trial mass on Plane 2
Now we have to take the readings with the trial mass on Plane 2. The screen for those measurement is similar to the previous screen.
Press the right arrow button. You will be asked again about trial mass removal.
RUN 2 - Result screen
Mount the final masses onto both planes. The angle is applied from the trial mass position, which represents 0 (zero) degrees. The direction of the angle is the same as the direction of rotation. Final balancing masses can be split into two arbitrary angles the same way as in one plane balancing mode.If the number of blades was defined, the final mass is divided between the two nearest blades to the exact balancing angle. The angle position is always measured from the position of the trial mass. Blades can be changed the same way as in one plane balancing mode.
The RUN 3 screen
When the masses are mounted then it is the time to check the balancing job. The readings on both planes are required. The screen is similar to the screen in single plane balancing.
Trim Screens
If you are not satisfied with the results then you can continue the balancing job after the RUN 3 measurement (press the right arrow button). These next steps do not require trial mass readings anymore. After each readingthe next masses are recommended. The trim screens are similar to the screens in single plane balancing.
75For further technical and contact information visit www.adash.com, email: [email protected]

ADASH Ltd. Adash 4300 – VA3Pro
Balancing ErrorsBalancing errors and warnings can occur during the job.
The effect of trial weight is low
This message informs you that the effect of the trial mass is low.
The percentage value is derived from the ratio (amplitude of vector change/ amplitude of RUN 1 vector).
A warning is displayed when the change is less than 20% but bigger than 1%. You can continue with balancing after this warning and use these values.
An error is displayed when the change is less than 1%. You cannot continue with balancing after this error, because such a small change is not acceptable. You could get incorrect results.
76For further technical and contact information visit www.adash.com, email: [email protected]

ADASH Ltd. Adash 4300 – VA3Pro
RecorderSome of you maybe remember that in the past a signal was recorded to a tape-recorder and afterwards it was processed (analyzed) in an analyzer. This method had a huge advantage; the signal could be analyzed repeatedly over and over. If you wish to make all the requested analyses in real time, you are under time pressure. For example the runup of the machine can be run only once, you are under extreme pressure. The tape-recorder was an excellent solution for those cases. It is a simple unit with a simple operation and no danger of loosing the data.The recorder mode offers the same solution. The recorder mode enables you to record the raw signal from the sensor without any post-processing or filtering. It enables you to record all the channels (3 AC channels, 3 DC channels and a tacho channel) to the memory of the VA3 unit simultaneously. The sampling frequency is from 64 Hz to 65536 Hz. The record is saved in the memory and you can analyze it later according to your requirements.
Record lengthThe length of the record is limited to 1000 MB of data, which is 81 minutes of record from 1 AC channel with a sampling frequency of 65536 Hz.
First screenThe first screen of the record mode shows the list of saved projects or an empty list. The Menu is at the bottom (F2).
New Project
This creates a new project. Enter the name of the project and confirm by pressing OK.
Copy Project
This creates a new project with the same settings as the selected project. Enter the name of the new project and confirm by pressing OK.Note: Only project settings are copied, no measured data are copied.
Rename Project
This function renames the selected project. Enter the new name and confirm by pressing OK.
Delete Project
Deletes the selected project.
77For further technical and contact information visit www.adash.com, email: [email protected]

ADASH Ltd. Adash 4300 – VA3ProClear Project Data
Deletes the measured data in the project.
Project screenSelect the required project and press OK. If the selected project contains measured data, the record preview is shown. If there are no measured data, the record project settings appear.
Record SettingsPress Menu (F2) and select Record Settings.
Fs:Record sampling frequency (max 65536 Hz). The record frequency range is shown below.
AC1 – AC3:Switches the required AC channels on/off.
DC1 – DC3:Switches the required DC channels on/off.
Tacho:Switch this on if you wish to record the Tacho channel.
Length:
You can set up the required record length. You can enter the required length in minutes or seconds. If you select the option Manually stopped, the record will be stopped when you press the Stop button or when the available memory is full. The available space is displayed below – the available space in memory (MB) and possible record length (hh:mm:ss).If the entered length exceeds the 1000 MB limit, it will be shortened automatically. The message Required length shortened! appears in this case.
Start of Rec:
freerun The recording starts immediately after pressing Start (F3).
external The recording starts when the signal appears in Tacho channel.
amplitude The recording starts when the signal from the Tacho channel exceeds the amplitude trigger level (see Ampl Trig Level below
Pretrig:
You can enter the length of the record before the Trigger (in minutes or seconds).
78For further technical and contact information visit www.adash.com, email: [email protected]

ADASH Ltd. Adash 4300 – VA3ProAmpl Trig Level:
This is the level of the trigger in sensor units. You can enter either positive (rising edge) or negative (falling edge) level value. The signal amplitude is taken directly from the sensor input, no additional filtering is applied.Examples:
the level is set to 1 g - triggered when the rising signal exceed 1 gthe level is set to -1 g - triggered when the falling signal drops under -1 g
Ampl Trig Channel:The number of the channel which is used for amplitude triggering.
Sensors settingsSet up the parameters of sensors to be used in Menu/Sensors. The sensor settings will be saved in the project.
RecordingTo start recording, press the Start button (F3).
The recording stops when one of the following states appears:- the set-up time is over - you press the Stop button - the 1000 MB memory limit is reached - there is no free space in the memory
When the recording is on, the currently measured value is displayed next to the corresponding channel or there is information about ICP error and overload. There is the preview of the record of one AC channel at the bottom;you can switch between the preview of the recorded channels by pressing the up/down arrow buttons. There is information about the available memory and remaining signal length displayed at the top. The remaining signal time length is displayed in the format: hh:mm:ss.
Preview of recorded dataAfter the recording, the preview of measured data is displayed.
The setting of each channel is displayed. In the graph there is a preview of the record from 1 channel. You can change the displayed channel by pressing the up/down arrow buttons.
79For further technical and contact information visit www.adash.com, email: [email protected]

ADASH Ltd. Adash 4300 – VA3Pro
Record analysis For record analysis you need to use the A4410 Virtual Unit application. The A4410 Virtual Unit application can be downloaded from the Adash website for free:http://www.adash.com/downloads_software_adash.phpDownload the Virtual Unit application to the PC and you can analyze the signal in for example Analyzer mode. For more information see the A4400 VA4 manual, which describes the functions of the Virtual Unit.
80For further technical and contact information visit www.adash.com, email: [email protected]

ADASH Ltd. Adash 4300 – VA3Pro
Run Up
Measurement ControlWhen you need to measure Run Up or Coast Down of the machines, then you should use the Runup mode. It enables the same measurements as in Analyzer mode, but controlled by speed, time or uncontrolled.What does it mean "controlled"? In Analyzer mode you can measure the Set and then you have to save measurements manually.The Runup is different. The measurements are saved automatically and additionally the measurements are regularly repeated under the control. The trigger function is used for that control. The menu item Menu/Trigger/Runup mode is used for setting.Usually the speed is used for that control and new measurement is made, when the speed changes from previous measurement of defined value (e.g.10 RPM).Also the time can be used to control that procedure. Then you can take the measurement in defined time interval ( e.g. each 60 sec ).The asap is the next choice. It means no delay between measurements - As Soon As Possible. Be careful for such mode. You can use all memory quickly.The last choice is the Manual mode. You can press the Ok button at any suitable moment to make a new measurement.Available interval is displayed on the status bar before the start of measuring. The instrument enables save up to 1GB of data on each measurement (if enough memory available), but the limit of 1 million values per set cannot be exceeded.
Measurement settingsMeasurements are defined in sets, use the same way as in Analyzer mode.For example we define only one measurement in set. The proximity sensor on channel 1 is used.
The Runup mode is set to speed and the value is 1Hz.
MeasurementStart measurement - push Start button. After the final speed is achieved press Stop.
The last measured value is on the screen.
81For further technical and contact information visit www.adash.com, email: [email protected]

ADASH Ltd. Adash 4300 – VA3Pro
TrendsUse Menu/View Trend to display the list of measured trends. Every new measurement creates new item in this list. The date and time of measurement is displayed.
Select one trend from the list and press OK. The trend is loaded and displayed.
Use the Shift button to change arrow buttons meaning. Set the arrow buttons to trend.
Use left and right arrow buttons to change cursor position.
Deleting trendsWhen trend list is displayed, use Delete button to delete selected trend.
82For further technical and contact information visit www.adash.com, email: [email protected]

ADASH Ltd. Adash 4300 – VA3Pro
Ultrasound
IntroductionWe would like to explain a few terms in the beginning of this chapter.Higher frequency energy above 20kHz is best detected with an ultrasonic sensor. Most useful information is found between 30 and 50kHz. The Adash ultrasonic module enables monitoring ultrasonic energy.
Ultrasound utilizes a solid, liquid or gas to transmit (will not exist in a vacuum), and is a very directional and short waveform. It has several things in common with the vibration, for instance the ability to detect the ultrasound energy requires the sensor to be focused in the direction of the waveforms.
Field applications for airborne ultrasound detection:- Consider the wave energy is easily reflected and attenuated.- When looking to detect airborne ultrasound energy a rule of half distance twice amplitude is a good thingto consider, this is called the “inverse rule”. - Remember airborne ultrasound is easily reflected, when detecting a leak, you should turn in the other direction to determine if the sound is coming from behind you. - Use shields such as cardboard to isolate the potential defect from other sources.
For airborne ultrasound the instrument microphone attachment will detect:- Air leaks- Vacuum leaks- Electrical Arcing- Electrical Corona- Tightness testing where a signal generator is located within a sealed unit, then by scanning the sealed areas from the outside leaks can be detected.
The probe attachment that enables direct transmission ultrasound will detect:- Early signs of poor lubrication in anti-friction roller bearings- Impacting noise from defects in roller bearings including bearings with shaft speeds under 100 rpm. - Steam trap leakage and failures- Gearbox defects- Valve leakage- Actuator malfunctions
Sensor settingThe ultrasound measurement is available only on AC CH1. You need the ultrasound microphone for that. When you run the module, then the sensor is changed automatically to Pascal sensor.
Use the Menu / Sensors / AC1 to change the sensitivity if needed. The new setting is saved and used in next run.The original sensor is set, when you leave the module.
SettingsYou can set the range of measurement. Use Menu / Ultrasound Settings. Enter required range.
83For further technical and contact information visit www.adash.com, email: [email protected]

ADASH Ltd. Adash 4300 – VA3Pro
Measurement
Press Start button. Two values are displayed. The Level of sound in dB and Shock Factor. The Shock factor isdefined as Peak value divide by RMS value. It means value 1.4 for pure sine. Higher values means that transient shock events are in the sound signal.The time waveform is displayed at the bottom of the screen. Use arrow up button to fit the scale of the graph.Press Stop to stop the reading.
84For further technical and contact information visit www.adash.com, email: [email protected]
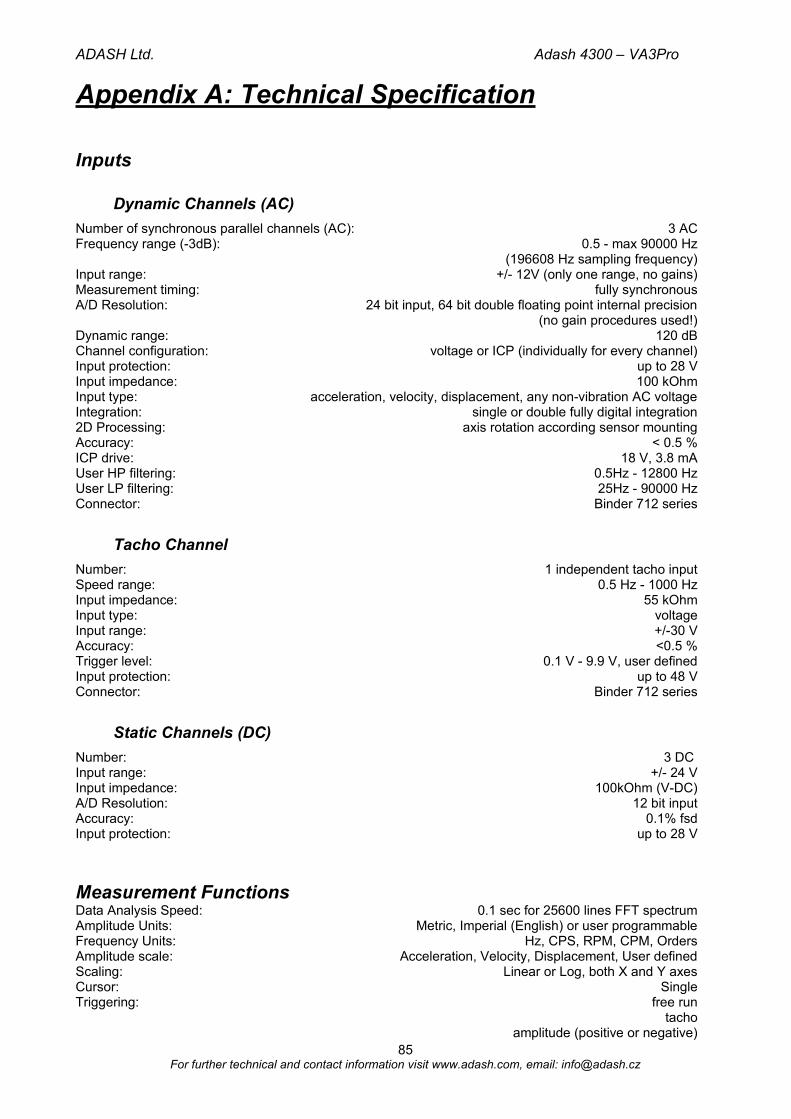
ADASH Ltd. Adash 4300 – VA3Pro
Appendix A: Technical Specification
Inputs
Dynamic Channels (AC)
Number of synchronous parallel channels (AC): 3 ACFrequency range (-3dB): 0.5 - max 90000 Hz
(196608 Hz sampling frequency)Input range: +/- 12V (only one range, no gains)Measurement timing: fully synchronousA/D Resolution: 24 bit input, 64 bit double floating point internal precision
(no gain procedures used!)Dynamic range: 120 dBChannel configuration: voltage or ICP (individually for every channel)Input protection: up to 28 VInput impedance: 100 kOhmInput type: acceleration, velocity, displacement, any non-vibration AC voltageIntegration: single or double fully digital integration2D Processing: axis rotation according sensor mountingAccuracy: < 0.5 %ICP drive: 18 V, 3.8 mAUser HP filtering: 0.5Hz - 12800 HzUser LP filtering: 25Hz - 90000 HzConnector: Binder 712 series
Tacho Channel
Number: 1 independent tacho inputSpeed range: 0.5 Hz - 1000 HzInput impedance: 55 kOhmInput type: voltageInput range: +/-30 VAccuracy: <0.5 %Trigger level: 0.1 V - 9.9 V, user definedInput protection: up to 48 VConnector: Binder 712 series
Static Channels (DC)
Number: 3 DC Input range: +/- 24 VInput impedance: 100kOhm (V-DC)A/D Resolution: 12 bit inputAccuracy: 0.1% fsdInput protection: up to 28 V
Measurement FunctionsData Analysis Speed: 0.1 sec for 25600 lines FFT spectrumAmplitude Units: Metric, Imperial (English) or user programmableFrequency Units: Hz, CPS, RPM, CPM, OrdersAmplitude scale: Acceleration, Velocity, Displacement, User definedScaling: Linear or Log, both X and Y axesCursor: SingleTriggering: free run
tachoamplitude (positive or negative)
85For further technical and contact information visit www.adash.com, email: [email protected]

ADASH Ltd. Adash 4300 – VA3Proexternal (voltage)
Signal Range: full, No Auto rangingData acquisition: TRUE RMS, TRUE PEAK, TRUE PEAK-PEAK overall or band values
user defined high, low and band pass filters for band measurementtime waveforms (65 536 samples max)
real-time FFTorder analysis
Amplitude + phase values on speed frequencyspeed measurement
process static DCEnvelope demodulation
ACMT procedure for low speed machines bearingsTime waveform samples: 256 – 65 536Waveform (ACMT) length: max 1024 secSpectrum ranges: 25 Hz – 25 600 HzSpectrum lines: 100 – 25 600Spectrum units: RMS, 0-P and P-PWindows: HanningOrder analysis parameters: 1/2 - 10th orderAveraging: 1-255Overlap: yes
StroboscopeFrequency Range: 1 Hz – 111 Hz (60 RPM – 6660 RPM)Stroboscope Frequency: User defined / Externally triggered
Other AccessoriesFlashlight: YesTemperature Measurement: YesTemperature Measurement Type: InfraredTemperature Range: -70 °C – 380 °C (-94 °F – 716 °F)
General:Processor: ARM Cortex A8RAM: 1 GBDisplay: TFT colour 117 x 88 mm (3.5’’ diagonal), 240x320 resolutionData Memory: 8 GB (Flash)Interface: USBPowering: Li-Ion battery pack (more then 8 hours of measurement)Operating temperature: -10 °C - +50 °C, 15°F-120°FDimensions: 230 x 82 x 32 mmWeight: 780 g
86For further technical and contact information visit www.adash.com, email: [email protected]

ADASH Ltd. Adash 4300 – VA3Pro
Appendix B: Standards for vibration measurementsUsing standards is a frequent topic in vibration diagnostics. As there are a lot of different types of machines it is impossible to determine the critical limits of vibrations for a wide range of machines. Its reliability would be then low. It could happen that you would repair a machine unnecessarily. The standards should rather be determinedfor a narrow range of machines.
Adash Limit ValuesAdash limits are not rewritten from any existing standard. It is a result of more than 20 years of the Adash engineering team's experience. It is difficult to invent a critical value definition which would be simple (which means not many parameters such as speed, power, bearing type, machine type and so on) and reliable.In the figures below you can see how to derive Adash limit values. There are three levels of machine condition defined: GOOD, ALERT (Machines that lay in this range are not acceptable for a long period of operation, they can be operated until time when they can be repaired) and DANGER (Vibration values in this range are considered as very dangerous and machines should not be operated). The corresponding colours are taken from traffic lights - green, yellow and red.All limit values are related to the speed value. Low speed machines should generate lower vibration than higher speed machines.
You can find three particular areas in the graphs below. The GOOD condition is the area up to the yellow line which means operation without restriction. The area above the yellow line and under the red line is the ALERT condition. It is possible to operate the machine but is has to be checked more frequently and it is necessary to determine the source of the worse condition and plan the repair (for instance change the bearing) or maintenance (balancing, alignment). The area above the red line is the DANGER condition and the machine should not be operated. The first figure contains the values for overall machine condition. The value of overall machine condition can determine unbalance, misalignment or mechanical looseness. They are called “overall” because we can measure them on most of the measuring points on the machine. The second figure contains the limit values of roller bearing condition. This condition is local and can be measured only on the appropriate bearing house.It is easy to understand the graphs below. It is necessary to know the speed. The instrument (A4900) determines the speed automatically or it can be entered manually by the user. Look at the graph and find the point on the horizontal axis which corresponds to the speed. You will find an intersection with the yellow and redlines above this point. Projections to the vertical axis will determine limit values for yellow (ALERT) or red (DANGER) states. If the measured value is lower than the yellow value the condition is GOOD – green. If the value is above the yellow value and under the red value then the condition is ALERT – yellow. If the measured value is higher then the red value then the condition is DANGER – red.
87For further technical and contact information visit www.adash.com, email: [email protected]

ADASH Ltd. Adash 4300 – VA3ProMachine Limits
The machine limits are used for velocity RMS value in 10-1000Hz frequency range.
0,0
1,0
2,0
3,0
4,0
5,0
6,0
0 500 1000 1500 2000 2500 3000 3500 4000
speed [RPM] ---->
Ve
l (1
0-1
00
0Hz)
mm
/s R
MS
---
->
0
0,04
0,08
0,12
0,16
0,2
0,24
Bearing Limits
The roller bearing limits are used for acceleration RMS value in 500-25600Hz frequency range.
0,0
0,5
1,0
1,5
2,0
2,5
3,0
3,5
0 1000 2000 3000 4000 5000 6000 7000 8000
speed [RPM] ---->
Ac
c g
RM
S -
--->
88For further technical and contact information visit www.adash.com, email: [email protected]

ADASH Ltd. Adash 4300 – VA3Pro
ISO 10816 limit valuesThere is a wide range of valid standards but we would like to mention ISO 10816. It has several sections and it also deals with procedures of obtaining limit values for particular machines. It contains 3 tables of values, which are applicable for the A4300 – VA3Pro unit.
Classification according to machine type, nominal power or shaft height
Select the group which best describes the general size, type, and speed of the machinery being measured. Note that these machine group classifications are set according to ISO 10816-3, which rates overall velocity vibration levels for industrial machines with rated power above 15kW and nominal speeds between 120 RPM and 15000 RPM when measured on site.
ISO Groups 1-4 classifications define the following types of machinery:
Group 1 Large machines (rated power above 300kW) with a shaft height greater than 315 mm. These machines are normally equipped with sleeve bearings.
Group 2Medium-size machines (rated power from 15 kW to 300 kW) and electrical machines with a shaft height between 160 and 315 mm.These machines are normally equipped with rolling element bearings.
Group 3Pumps with multi-vane impeller and with separate driver with rated power above 15 kW.
Group 4Pumps with multi-vane impeller and with integrated driver with rated power above 15 kW.
Classification according to foundation
An additional setting allows the specification (when defining the overall alarm levels) of measurements taken from machinery with Rigid or Flexible foundations.
Evaluation ranges
The following evaluation ranges are defined for evaluation of the machine health according to vibrations:
Range A: New machine vibrations should be occasionally in this range.
Range B: Machines in this range can be operated for unlimited period.
Range C: Machines in this range are not acceptable for a long period of operation; they can be operated until the repair time only.
Range D: Machines with vibration values in this range should not be operated. There is an acute danger of damage to the machine.
89For further technical and contact information visit www.adash.com, email: [email protected]

ADASH Ltd. Adash 4300 – VA3Pro
Classification of vibration values for machines groups 1 and 3
Foundation class RMS velocity values border zonemm/s in/s
Rigid (R13) 2,3 0,09 A/B4,5 0,18 B/C7,1 0,28 C/D
Flexible (F13) 3,5 0,14 A/B7,1 0,28 B/C11,0 0,43 C/D
Classification of vibration values for machines groups 2 and 4
Foundation class RMS velocity values border zonemm/s in/s
Rigid (R24) 1,4 0,06 A/B2,8 0,11 B/C4,5 0,18 C/D
Flexible (F24) 2,3 0,09 A/B4,5 0,18 B/C7,1 0,28 C/D
90For further technical and contact information visit www.adash.com, email: [email protected]

ADASH Ltd. Adash 4300 – VA3Pro
Appendix C : Phase measurement conventions
Single channel measurement with tachoLet’s assume the time signal defined as y=cos(ωt). We use the cosine function because FFT uses it too. It simplifies the calculations and understanding.
α
cos(α)
0°
90°
180 °
270 °
Our starting position of rotating vector V will be 90°, we will mark it as T0.
T0
V
When the vector V rotates for example 3 times, then we get the time signal as follows.
91For further technical and contact information visit www.adash.com, email: [email protected]

ADASH Ltd. Adash 4300 – VA3Pro
Now we assume the tacho signal. The tacho pulse we put to the T0 position.
T0
Corresponding time signal with tacho pulses is on the following picture.
Now we begin to assume the phase shift (marked as φ) of time signal vs. tacho signal. The signal formula changes to y=cos(ωt + φ). The previous picture corresponds with φ=0°. And this value is displayed on the instrument screen. When the tacho pulses are in the maximum time signal positions, then phase value is equal to zero.
Now assume the φ=45°. We use the degrees unit to make it simple for all readers. The radians have to be used in exact math formula.
V45°
92For further technical and contact information visit www.adash.com, email: [email protected]

ADASH Ltd. Adash 4300 – VA3Pro
On the next picture is the corresponding time signal with tacho pulses.
The time signal foreruns (gets ahead of) the tacho signal of the 45°. The 45° appears on instrument screen in this case.
Now we assume the φ=-45°.
V-45°
On the next picture is the corresponding time signal.
The time signal is delayed. The -45° appears on instrument screen in this case.
This approach is used for single channel measurement as 1xamp+phase and orders.
93For further technical and contact information visit www.adash.com, email: [email protected]

ADASH Ltd. Adash 4300 – VA3Pro
Dual channel measurementWe must always define the channels of A and B. For example we use channel 1 as A and channel 2 as B. You have to always assign the channel numbers of A and B. The A represents the input channel and B the output channel. You can imagine it as black box and you need to measure the phase response of that.
You see on the display for example this:
The logic is the same as for single channel measurement. The A has the same function as tacho signal. This 60° means that B is ahead (foreruns) the A of 60°.
This approach is used for double channel measurements as phase shift.
Last reminderWe talk about time signals and their positions in time in this chapter. We have used a words such as “signal is ahead”, “foreruns” and on the other side that signal is delayed.
You should always keep in mind:
To be ahead of for example 60° is the same as to be delayed of 300°. Don’t forget that we are working with periodic pure cosine time waveform.
94For further technical and contact information visit www.adash.com, email: [email protected]


![Session Notes - archives.who.intarchives.who.int/.../Session_Guides_Word/12_DISPSG.doc · Web viewA. WHO IS A DISPENSER? [VA3] Most of this session will discuss dispensing as if it](https://img.pdfslide.us/doc/110x75/5cd1c37688c99347028e2286/session-notes-web-viewa-who-is-a-dispenser-va3-most-of-this-session-will.jpg)