Embed Size (px)
Citation preview
Algebra 2 Connections 2
CHAPTER 1 Investigations and Functions
Welcome to Algebra 2! This chapter will introduce you to the ways you will be working as well as several of the big ideas in this course. You will share your current mathematical knowledge with your study team as you work together to solve problems, some of which you will revisit later in the course and connect to new mathematical ideas. You will learn to work with a graphing calculator to help you discover qualities of functions and systems of functions. This chapter will also introduce you to five Ways of Thinking that are threaded throughout the course. They are: justifying (explaining and verifying your ideas), generalizing (predicting results for any situation), choosing a strategy (deciding which solution methods make sense), investigating (gathering information and drawing conclusions), and reversing (solving problems backward and forward). Finally, this chapter is about problem solving. During this chapter, you will use a variety of problem-solving strategies that will remain useful throughout this course, including: Guessing and Checking Collecting and Organizing Data Finding Patterns Drawing a Graph Making a Table or List Working Backward
Section 1.1 In this section, you will get to know the members of your study team. You will work with your team to develop skills and techniques for using a graphing calculator to help you explore functions and intersections, and you will present your results to the class.
Section 1.2 Here, you will find multiple ways to represent a geometric relationship, summarize your results, and present your results to the class. You will also analyze the family of linear functions and investigate a non-linear function. You will begin to develop your understanding of what it means to investigate a function.
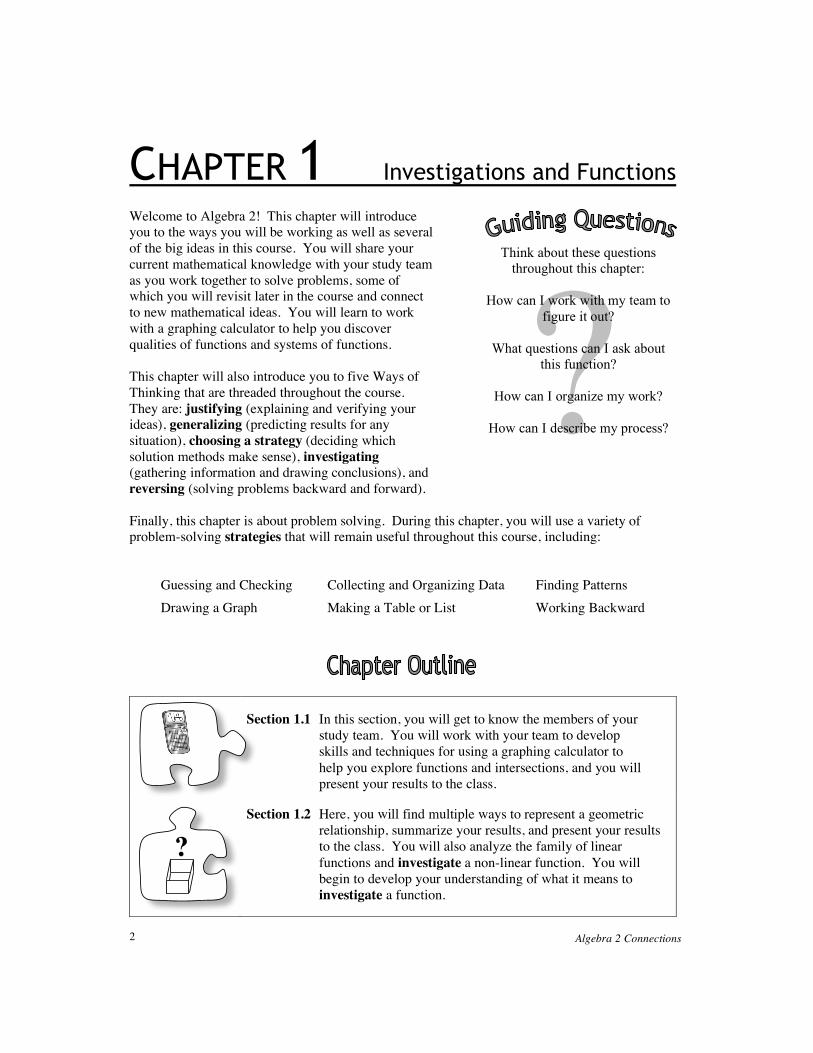
?
Think about these questions throughout this chapter:
How can I work with my team to
figure it out?
What questions can I ask about this function?
How can I organize my work?
How can I describe my process?
?

Chapter 1: Investigations and Functions 3
1.1.1 How can I work with my team to figure it out? • • • • • • • • • • • • • • • • • • • • • • • • • • • • • • • • • • • • • • • • • • • • • • • • • • • • • • • • • • • • • • • • • Solving Puzzles in Teams Welcome to Algebra 2! This chapter will challenge you to use different problem-solving strategies. You will also be introduced to different tools and resources that you can use throughout the course as you investigate new ideas, solve problems, and share mathematical ideas. 1-1. BUILDING WITH YARN Work with your team to make each of the shapes you see below out of a single loop of
yarn. You may make the shapes in any order you like. Before you start, review the team roles that are described on the next page. Use these roles to help your study team work together today. When you make one of the shapes successfully, call your teacher over to show off your accomplishment.
A Star
A Tetrahedron A Square-Based Pyramid
A Cube
An Octahedron

Algebra 2 Connections 4
Team Roles
Resource Manager – If your name comes first alphabetically:
• Make sure your team has all of the necessary materials, such as yarn for problem 1-1 or the resource pages for problem 1-2.
• Ask your teacher a question when the entire team is stuck. Before raising your hand, you might ask your team, “Does anyone have an idea? Should I ask the teacher?”
• Make sure your team cleans up materials by delegating tasks. You could say, “I will put away the ________ while you _________ .”
Facilitator – If your name comes second alphabetically:
• Start your team’s discussion by reading the question aloud and then asking, “Which shape should we start with?” or “How can we work together to make this shape?”
• Make sure that all of the team members get any necessary help. You do not need to answer all of the questions yourself. A good Facilitator regularly asks, “Do we understand what we are supposed to do?” and “Who can answer ________’s question?”
Recorder/Reporter – If your name comes third alphabetically:
• Be sure all team members are able to reach the yarn and have access to the resource pages. Make sure resource pages and work that is being discussed are placed in the center of the table or group of desks in a spot where everyone can see them.
• Be prepared to share your team’s strategies and results with the class. You might report, “We tried ___ , but it didn’t work, so we decided to try ___ .”
Task Manager – If your name comes fourth alphabetically:
• Remind the team to stay on task and not to talk to students in other teams. You can suggest, “Let’s try working on a different shape,” or “Are we ready to try the function machines in a different order?”
• Keep track of time. Give your team reminders, such as, “I think we need to decide now so that we will have enough time to …”

Chapter 1: Investigations and Functions 5
1-2. FUNCTION MACHINES Your teacher will give you a set of four function machines. Your team’s job is to get a
specific output by putting those machines in a particular order so that one machine’s output becomes the next machine’s input. As you work, discuss what you know about the kind of output each function produces to help you arrange the machines in an appropriate order. The four functions are reprinted below.
f (x) = x g(x) = !(x ! 2)2 h(x) = 2x ! 7 k(x) = !
x
2!1
a. In what order should you stack the machines so that when 6 is dropped into the first machine, and all four machines have had their effect, the last machine’s output is 11?
b. What order will result in a final output of 131,065 when the first input is 64?
Algebra 2 Connections 6
f (x) = x2+ 2x +1
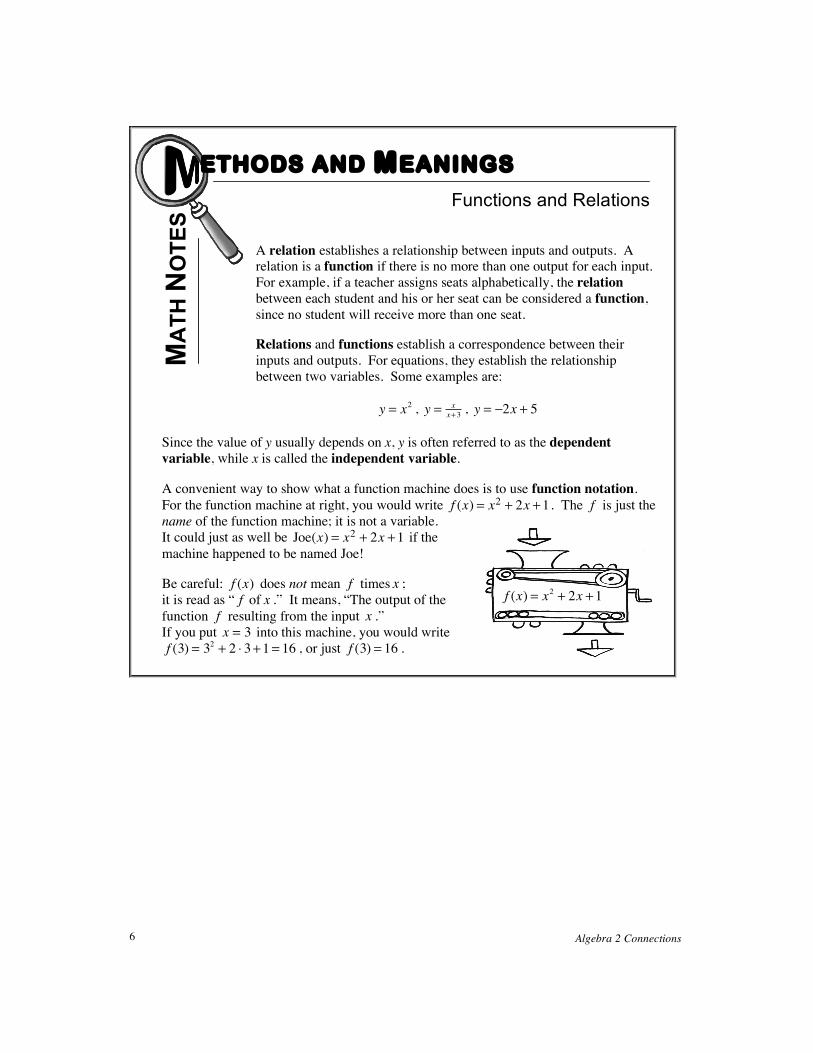
A relation establishes a relationship between inputs and outputs. A relation is a function if there is no more than one output for each input. For example, if a teacher assigns seats alphabetically, the relation between each student and his or her seat can be considered a function, since no student will receive more than one seat.
Relations and functions establish a correspondence between their inputs and outputs. For equations, they establish the relationship between two variables. Some examples are:
y = x2 , y = x
x+3, y = !2x + 5
Since the value of y usually depends on x, y is often referred to as the dependent variable, while x is called the independent variable.
A convenient way to show what a function machine does is to use function notation. For the function machine at right, you would write f (x) = x2 + 2x +1 . The f is just the name of the function machine; it is not a variable. It could just as well be Joe(x) = x2 + 2x +1 if the machine happened to be named Joe!
Be careful: f (x) does not mean f times x ; it is read as “ f of x .” It means, “The output of the function f resulting from the input x .” If you put x = 3 into this machine, you would write f (3) = 3
2+ 2 ! 3+1 = 16 , or just f (3) = 16 .
MA
TH N
OTE
S ETHODS AND MEANINGS
Functions and Relations

Chapter 1: Investigations and Functions 7
1-3. KEEPING A NOTEBOOK
You will need to keep an organized notebook for this course. Below is one method of keeping a notebook. Ask your teacher if you should follow these guidelines or if there is another system you should follow.
• The notebook should be a sturdy, three-ring, loose-leaf binder with a hard cover. • The binder should have dividers to separate it into five sections: TEXT TESTS AND QUIZZES HOMEWORK LINED AND GRAPH PAPER CLASSWORK/NOTES You should put your name inside the front cover of your notebook so it will be returned to you if you lose it. Put your phone number and address (or the school’s address, if you prefer) on the inside front cover. It will also help to put your name in large, clear letters on the outside so if someone sees it they can say, “Hey, Julia, I saw your notebook in the cafeteria under the back table.”
Your notebook will be your biggest asset for this course and will be the primary resource you will use to study, so take good care of it!
1-4. “Find f (3) ” means to find the output of function f (x) for an input of x = 3 . For the
function f (x) = 1x!2
, find each of the following values.
a. Find f (4) . (This means find the output of the function when x = 4 .)
b. Find x when f (x) = 1 . (This means find the input that gives an output of 1.) 1-5. Angelica is working with function machines. She has the two machines g(x) = x ! 5
and h(x) = x2 ! 6 . She wants to put them in order so that the output of the first machine becomes the input of the second. She wants to use a beginning input of 6.
a. In what order must she put the machines to get a final output of 5?
b. Is it possible for her to get a final output of –5? If so, show how she could do that. If not, explain why not.
Algebra 2 Connections 8
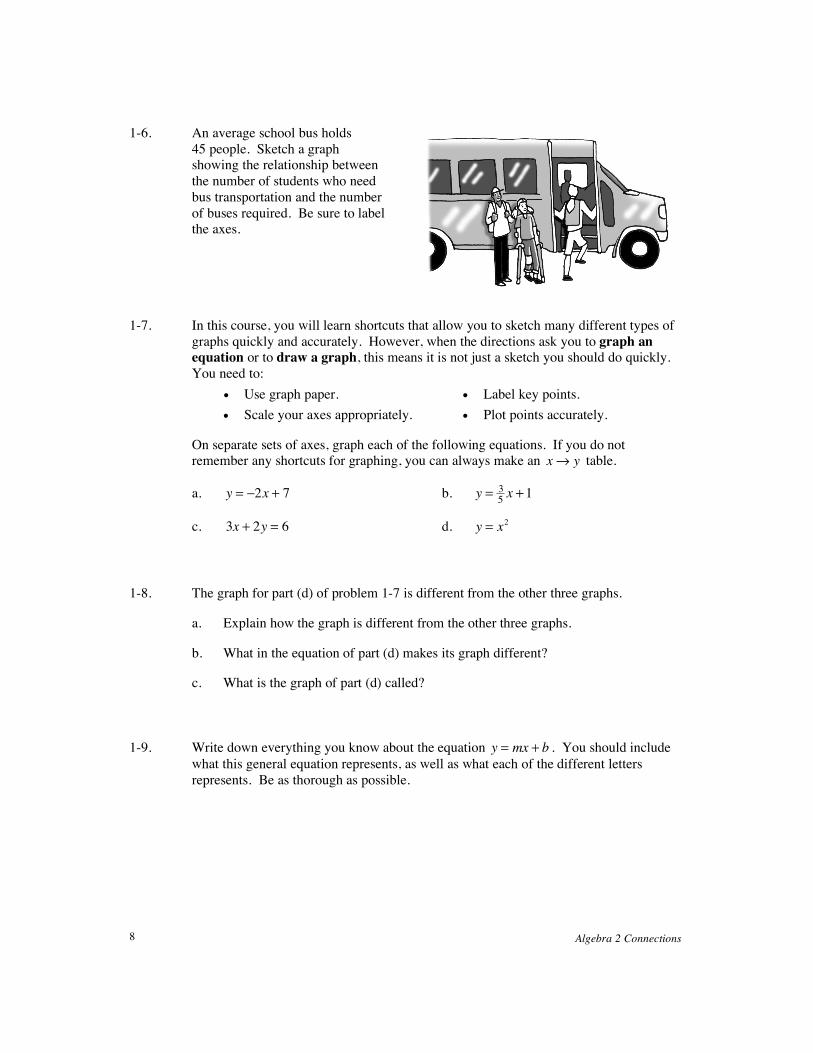
1-6. An average school bus holds 45 people. Sketch a graph showing the relationship between the number of students who need bus transportation and the number of buses required. Be sure to label the axes.
1-7. In this course, you will learn shortcuts that allow you to sketch many different types of
graphs quickly and accurately. However, when the directions ask you to graph an equation or to draw a graph, this means it is not just a sketch you should do quickly. You need to:
• Use graph paper. • Label key points. • Scale your axes appropriately. • Plot points accurately.
On separate sets of axes, graph each of the following equations. If you do not remember any shortcuts for graphing, you can always make an x! y table.
a. y = !2x + 7 b. y = 3
5x +1
c. 3x + 2y = 6 d. y = x2
1-8. The graph for part (d) of problem 1-7 is different from the other three graphs.
a. Explain how the graph is different from the other three graphs.
b. What in the equation of part (d) makes its graph different?
c. What is the graph of part (d) called? 1-9. Write down everything you know about the equation y = mx + b . You should include
what this general equation represents, as well as what each of the different letters represents. Be as thorough as possible.

Chapter 1: Investigations and Functions 9
1.1.2 How can I use my graphing calculator? • • • • • • • • • • • • • • • • • • • • • • • • • • • • • • • • • • • • • • • • • • • • • • • • • • • • • • • • • • • • • • • • • • • • • • • • • Using a Graphing Calculator to Explore a Function In Algebra 1 you learned that multiple representations such as situations, tables, graphs, and equations and their interconnections are useful for learning about functions. A graphing calculator can be a very useful tool for generating different representations quickly. Today, you will use this tool to explore a function. You will describe your function completely to the class. 1-10. Your team will use graphing calculators to learn about one of the
following functions.
i. y = 2 9 ! x ! 4 ii. y = 100 ! x2
iii. y = 3 x + 4 ! 6 iv. y = 3 4 ! x ! 3
v. y = !2 25 ! x2 + 8 vi. y = !3 x + 9 + 4
vii. y = 2 25 ! x2 !1 viii. y = 4 ! x !1 Your task: Describe your team’s function in as much detail as possible. Use your
graphing calculator to help you generate a table and a complete graph of your function. Remember that drawing a complete graph means:
• Use graph paper. • Scale your axes appropriately. • Label key points. • Plot points accurately.
As you work, keep your graphing calculators in the middle of your workspace, so that you can compare your screens and all team members can see and discuss your results. Be sure to record what you learn as you explore your function. As a team, you will be preparing a report about your function for the class. Consider the “Discussion Points” below as you work.
What are the key points on the graph? Where are they exactly?
Are there values of x or y that do not make sense?
How high or low does the graph go?
Did the graphing calculator show an accurate graph?
How can we be sure the graph is complete?

Algebra 2 Connections 10
1-11. Use your graphing calculator to view the graph in the standard window.
a. Enter the equation in your graphing calculator and view the graph. Use the r feature to identify at least five possible integer inputs that give integer values as outputs.
b. Verify that each integer input gives an integer value as an output, and record these points in a table.
c. Is there a largest or smallest input value you can use for x? Describe and explain any values that cannot be used.
d. Is there a largest or smallest value for y? Describe and explain any values that will not occur as outputs.
e. Are you sure you have a complete graph? How can you be sure?
1-12. When your team has completed a table and
drawn a complete graph, prepare a report for the whole class.
The class will get most out of your
presentation if you focus on what was particularly interesting about your function or what you learned. Rather than saying, “We plugged in a 2 and got a 5,” consider using statements such as, “We decided to try an input of 2 because we wanted to know what happened to the left of x = 3 .”
The following sentence starters can help you make a meaningful and interesting
presentation.
“At first we were confused by…”
“This makes sense because…”
“We weren’t sure about… , so we tried…”
“Something interesting that we noticed about our graph is…”
As you prepare your presentation, your teacher will provide you with an overhead transparency or poster paper. Reread the task statement of problem 1-10 (labeled “Your task”) and be sure to include all relevant information and ideas in your presentation.
Further Guidance section ends here.

Chapter 1: Investigations and Functions 11
ETHODS AND MEANINGS M
ATH
NO
TES
Linear Equations
A linear equation is an equation that forms a line when it is graphed. This type of equation may be written in several different forms. Although these forms look different, they are equivalent; that is, their
graphs are all the same line.
Standard Form: An equation in ax + by = c form, such as !6x + 3y = !18 .
Slope-Intercept Form: An equation in y = mx + b form, such as y = 2x ! 6 .
You can find the slope (also known as the growth factor) and the y-intercept of a line in y = mx + b form quickly. For the equation y = 2x ! 6 , the slope is 2, while the y-intercept is (0, –6).
1-13. Junior is saving money in his piggy bank. He starts with 10 cents and adds two
pennies each day. Create an x! y table and a graph for the function for which x represents the number of days since Junior started saving money and y represents the total money he has saved.
1-14. Use the Zero Product Property and factoring, when necessary, to solve for x. The Math
Notes box for Lesson 1.1.4 or problems 3-111 and 4-80 may be useful, if you need help.
a. (x +13)(x ! 7) = 0 b. (2x + 3)(3x ! 7) = 0
c x(x ! 3) = 0 d. x2! 5x = 0
e. x2! 2x ! 35 = 0 f. 3x
2+14x ! 5 = 0
slope y-intercept
y = 2x ! 6
1 2
y
x y-intercept
slope (growth factor)
x-intercept

Algebra 2 Connections 12
x2+ 2x +1
1-15. Terri’s project for the Math Fair was a magnificent black box that she called a function machine. If you put 3 into her machine, the output would be 8. If you put in 10, the output would be 29; and if you put in 20, it would be 59.
a. What would her machine do to the input 5? What about –1? What about x? Making an input! output table may help you figure this out.
b. Write a rule for Terri’s machine. 1-16. Nafeesa graphed a line with a slope of 5 and a y-intercept of (0, –2).
a. Find an equation for her line. b. Find the value of x when y = 0 . 1-17. In each of the following equations, what is y when x = 2 ? When x = 0 ? Where
would the graph of each equation cross the y-axis?
a. y = 3x +15 b. y = 3! 3x 1-18. Carmichael made a function machine. The inner workings
of the machine are visible in the diagram at right. What will the output be in each of the following cases?
a. If 3 is dropped in?
b. If – 4 is dropped in?
c. If –22.872 is dropped in?
3
8
Terri's

Chapter 1: Investigations and Functions 13
1-19. Does the temperature outside depend on the time of day, or does the time of day depend on the temperature outside? This may seem like a silly question, but to sketch a graph that represents this relationship, you first need to decide which axis will represent which quantity.
a. When you graph an equation such as y = 3x ! 5 , which variable (the x or the y) depends on the other? Which is not dependent? (That is, which is independent?) Explain.
b. Which variable is dependent: temperature or time of day? Which variable is independent?
c. Sketch a graph (with appropriately named axes) that shows the relationship between temperature outside and time of day.
1-20. Jill needs to cut a piece off of a 30-foot length of lumber. Create multiple
representations ( x! y table, graph, and equation) for the function with x-values that are the length of the piece Jill cuts off and y-values that are the length of the piece that is left over. Which representation best portrays the situation? Why? Explain.
1-21. Make a table and graph the function f (x) = 1
2x2 . Describe all of the possible input
and output values. 1-22. Given f (x) = – 2
3x + 3 and g(x) = 2x2 ! 5 , complete parts (a) through (f) below.
a. Calculate f (3) . b. Solve f (x) = !5 .
c. Calculate g(!3) . d. Solve g(x) = 9 .
e. Solve g(x) = 8 . f. Solve g(x) = !7 .

Algebra 2 Connections 14
1-23. Gerri made a function machine. Below are four pictures of her machine. (Note that these are all pictures of the same function machine.) Find the rule for Gerri’s function machine.
1-24. Examine each graph below. Based on the shape of the graph and the labels of the
axes, write a sentence to describe the relationship that each graph represents. Then state which axis represents the independent variable and which one represents the dependent variable.
a. b.
Problem continues on next page. →
3
27
Gerri's
!2
!8
Gerri's
0
0
Gerri's
!1
!1
Gerri's
1 2 3 4
4
3
2
1
Dol
lars
Gallons of Gas Age
Hei
ght (
in.)

Chapter 1: Investigations and Functions 15
1-24. Problem continued from previous page.
c. d.
e. What are all of the possible inputs of the graph in part (d)? What are all of the possible outputs?
1-25. Gregory planted a lemon tree in his back yard. When he planted the tree, it was 2 feet
tall. He noticed that it has been growing 3 inches every week.
a. Create multiple representations ( x! y table, graph, and equation) to represent the relationship between the days that have passed and the height of the tree.
b. If the tree continues growing at this rate, when will it be 6 feet tall? How can you see this in each of the representations?
c. State the possible inputs and outputs of the graph. 1-26. Find the error in the solution at right.
Explain what the error is and solve the equation correctly. Show how to check your solution to be sure that it is correct.
Note: The stoplight icon to the right of a problem indicates that there is an error in the
problem.
Year
Leve
ls o
f Ozo
ne
Con
cent
ratio
n
3(x ! 2) ! 2(x + 7) = 2x +17
3x ! 6 ! 2x +14 = 2x +17
x + 8 = 2x +17
!9 = x
30 60 90 120
4
3
2
1
Number of Students
Num
ber o
f Cla
ssro
oms

Algebra 2 Connections 16
1.1.3 Which values are possible? • • • • • • • • • • • • • • • • • • • • • • • • • • • • • • • • • • • • • • • • • • • • • • • • • • • • • • • • • • • • • • • • • Domain and Range In Lesson 1.1.2 you worked with your graphing calculator to see complete graphs of functions and to determine what information was useful to describe those functions completely. In this lesson you will look at more functions, this time thinking about what input and output values are possible. You will also learn about additional tools on your graphing calculator that allow you to see a complete graph. As you work with your team, remember to ask each other questions such as:
What values are possible?
Can we see the complete graph?
What other information can we use to describe the function?
1-27. Jerrod and Sonia were working with their team
on ordering the function machines in problem 1-2. The functions are reprinted for you below.
f (x) = x g(x) = !(x ! 2)2
h(x) = 2x ! 7 k(x) = !x
2!1
a. Jerrod first put an input of 6 into the function g(x) = !(x ! 2)2 and got an output of !16 . He wanted to try f (x) = x as his next function in the order, but he thinks there might be a problem using –16 as an input. Is there a problem? Explain.
b. Because it is not possible to take the square root of –16, it can be said that –16 is not in the domain of the function f (x) . The domain of a function is the collection of numbers that are possible inputs for that function. With your team, find two other numbers that are not part of the domain of f (x) . Then describe the domain. In other words, what are all of the numbers that can be used as inputs for the function f (x) ?
c. Sonia claimed that g(x) could not possibly be the last function in the order for problem 1-2. She justified her thinking by saying, “Our final output has to be 11, which is a positive number. The functiong(x)will always make its output negative, so it can’t come last in the order.” Discuss this with your team. Does Sonia’s logic make sense? How did she know that the output of g(x) would never be positive?

Chapter 1: Investigations and Functions 17
1-28. Use your graphing calculator to help you draw a complete graph of y = (x +1)(x ! 9) .
a. Describe the graph completely.
b. What window settings allow you to see the complete graph?
c. How are the settings related to domain and range? 1-29. Draw a complete graph of y = (x !12)2 +11 .
a. What happens when you use the standard window?
b. What window settings did you use to see enough of the graph to help you visualize and draw a complete graph?
c. What are the domain and range of the function? 1-30. Now you will reverse your thinking to create a graph with a given domain and range.
a. Sketch a relation that has a domain of all numbers between and including !3 and 10 (written !3 " x " 10 ) and a range of all numbers between and including – 4 and 6 (written !4 " y " 6 ). You do not have to write an equation for your relation. Verify your endpoints with your team. Be creative.
b. Sketch a relation with a domain of all real numbers (written !" < x < " ) and a range of all numbers greater than or equal to –2 (written y ! "2 ). (Note: The symbol ! means “infinity.”)
1-31. How can a graphing calculator help you find the solution to a system of equations?
Consider this system:
5x ! y = 35
3x + y = !3
a. First graph the system in a standard window. Can you see the solution on your screen?
b. To find the solution you will need to change the window on your calculator. Discuss with your team what maximum value, minimum value, and scale you should use for the x- and y-axes in order to see the intersection. After you have decided, check your conclusion on the graphing calculator.
c. Use the r button to find the solution from the graphs. Then solve the system algebraically.
d. Discuss the two methods with your team. Explain which one your team prefers and why.

Algebra 2 Connections 18
1-32. What does the graph of y = x + 1
(x+2)2! 3 look like? Graph the
equation on your calculator. Use the trace and/or zoom buttons to find the x- and y-intercepts. What is the domain of this function? What is the range?
1-33. Use your graphing calculator to help you sketch the graphs of
y = 1
x! 4 and y = 1
x!4. Are the graphs the same? Should they be?
Explain why or why not. 1-34. LEARNING LOG
Throughout this course, you will be asked to reflect on your understanding of mathematical concepts in a Learning Log. Your Learning Log will contain explanations and examples to help you remember what you have learned throughout the course, as well as questions you are trying to understand and answer. It is important to write each entry of the Learning Log in your own words so that later you can use your Learning Log as a resource to refresh your memory. Your teacher will tell you where to write your Learning Log entries and how to structure them. Remember to label each entry with a title and a date so you can refer to it later.
In your Learning Log today, describe everything you know about domain and range.
Include examples to illustrate your ideas. Title this entry “Domain and Range” and label it with today’s date.
The set of possible values for the input of a function has a special name. It is called the domain of the function. This set consists of every input value for x for which the function is defined. The range of a function is the set of possible values of the output. This set contains every y-value that the function can generate. Domain and range are often written with inequality notation as shown in the examples below.
If the domain is any number between and including –2 and 7: !2 " x " 7 If the range is any number greater than but excluding 4: y > 4 or 4 < y < !
If the domain is all numbers except for –3: x ! "3
MA
TH N
OTE
S
ETHODS AND MEANINGS Domain and Range

Chapter 1: Investigations and Functions 19
1-35. Examine g(x) graphed at right.
a. Which x-values have points on the graph? That is, describe the domain of g(x) .
b. What are the possible outputs for g(x) ? That is, what is the range?
c. Ricky thinks the range of g(x) is: –1, 0, 1, 2, and 3. Is he correct? Why or why not?
d. Draw a graph for another function with the same domain and range as g(x) . 1-36. Consider the functions f (x) = 3x2 ! 5 and g(x) = x ! 5 + 2 .
a. Find f (5) . b. Find g(5) .
c. Find f (4) . d. Find g(4) .
e. Find f (x) + g(x) . f. Find g(x) ! f (x) .
g. Describe the domain of f (x) . h. Describe the domain of g(x) .
i. Why is the domain of one of these functions more restrictive than the other? 1-37. Nissos and Chelita were arguing over a math problem. Nissos was
trying to explain to Chelita that she had made a mistake in finding the x-intercepts of the function y = x2 !10x + 21. “No way!” Chelita exclaimed. “I know how to find x-intercepts! You make the y equal to zero and solve for x. I know I did this right!” Here is Chelita’s work:
Step 1: x2!10x + 21 = 0 , so (x + 7)(x + 3) = 0 .
Step 2: Therefore, x + 7 = 0 or x + 3 = 0 .
Step 3: So x = !7 or x = !3 . Nissos tried to explain to Chelita that she had done something wrong. What is
Chelita’s error? Justify and explain your answer completely.
x
y

Algebra 2 Connections 20
1-38. As you have found when using a graphing calculator, equations must be solved for y; that is, they must be written in y-form. Rewrite each equation below so that it can be entered into a graphing calculator.
a. x = 3y + 6 b. x = 5y !10
c. x = y2 d. x = 2y2 ! 4
e. x = (y ! 5)2 1-39. Write and solve an equation or a system of equations to help you solve the following
problem.
A cable 84 meters long is cut into two pieces so that one piece is 18 meters longer than the other. Find the length of each piece of cable.
1-40. Consider triangles ABC and ADE at right. Give a
convincing argument why ∆ABC ~ ∆ADE. Then use what you know about similar triangles to complete each of the following ratios for the triangles shown below right.
a. y
x=?
? b. n
y=?
?
1-41. Solve each of the following equations. Be sure to check your solutions.
a. 4(x !1) ! 2(3x + 5) = !3x !1 b. 3x ! 5 = 2.5x + 3! (x ! 4)
A
B
D
EC
x y n
m

Chapter 1: Investigations and Functions 21
1.1.4 How can I represent intersections? • • • • • • • • • • • • • • • • • • • • • • • • • • • • • • • • • • • • • • • • • • • • • • • • • • • • • • • • • • • • • • • • • • • • • • • • • • • • • Points of Intersection in Multiple Representations Throughout this course, you will represent functions and relations in different ways, and you will find connections between these representations. These connections will give you new ways to investigate functions and to justify your conclusions. How can these connections help you understand more about systems of equations? In this lesson, you will make connections between ways of representing a system of equations as you use your graphing calculator to find the points of intersection in multiple representations. 1-42. INTERSECTION INVESTIGATION In Lesson 1.1.3, you used the rfeature of your graphing calculator to
find a point of intersection of two graphs. Can you use other representations as well? What about other strategies? Are all strategies equally accurate? Which do you prefer?
Your task: Work with your team to find as many ways as you can (with and without
your graphing calculator) to determine the points of intersection of the functions f (x) = 2x2 ! 5x + 6 and g(x) = !2x2 ! x + 30 . Be sure to think about tables, graphs,
and equations as you work. Be prepared to teach each of your methods to the class. Hint: Explore the 0, -, and / features on your graphing calculator.
How can we find it using graphs?
How can we find it in tables?
How can we find it using equations?
Graph Rule or Equation
Context
Table

Algebra 2 Connections 22
1-43. Jason and his team were working on finding the points of intersection of
f (x) = 2x2 ! 5x + 6 and g(x) = !2x2 ! x + 30 . He suggested, “Maybe we could start by looking at the graphs of the functions.”
a. Use your graphing calculator to help you graph f (x) and g(x) .
b. Adjust the viewing window so that you can see all of the points of intersection. How accurately can you approximate the coordinates of these points by looking at the graph? Give it a try.
c. Use the r feature to get a more accurate approximation of each of the points.
d. With your team, explore the / feature of your graphing calculator. Can you find a way to make the graphing calculator calculate your points of intersection for you? How accurate are your results? Be prepared to teach your method to the class.
1-44. Aria was in Jason’s team. She had another idea and asked, “Can’t we find the points
of intersection by comparing the tables of our two functions?”
a. What did Aria mean? How can you find points of intersection by looking at tables?
b. Use your graphing calculator to make tables for f (x) and g(x) . To do this, you will need to explore the 0and -features of your calculator.
c. Find all of the points of intersection in the tables. How accurate are these results?
d. Can you think of any circumstances in which using a table might not be an efficient or accurate strategy for finding points of intersection? Explain.
1-45. Delilah had been listening to Jason and Aria explain their ideas. She said, “I thought
of another way! We know a method for using the equations to find points of intersection even without the graphing calculator, don’t we?”
a. What method is Delilah referring to?
b. Use Delilah’s method to find the points of intersection of these two functions. Further Guidance
section ends here.

Chapter 1: Investigations and Functions 23
1-46. Rhianna says she can draw different functions that have the same x-intercepts and the same domain and range. Her teammates say, “No, that’s impossible!” But Rhianna insists, “It is possible if we just try to sketch the graphs.”
a. What if the x-intercepts are (–5, 0), (2, 0), and (6, 0), the domain is !5 " x " 7 , and the range is !4 " y " 10 ? Is more than one function possible? Give examples to help explain why or why not.
b. What if the x-intercepts are (– 4, 0) and (2, 0), the domain is all real numbers, and the range is y ! "8 ? Is there more than one function possible? Give examples of multiple functions or explain why there can be only one.
In a previous course, you learned how to solve quadratic equations (equations that can be written in the form ax2 + bx + c = 0 ). Review two methods for solving quadratic equations below.
Some quadratic equations can be solved by factoring and using the Zero Product Property. For example, because x2 ! 3x !10 = (x ! 5)(x + 2) , the quadratic equation x2 ! 3x !10 = 0 can be rewritten as (x ! 5)(x + 2) = 0 . The Zero Product Property states that if ab = 0, then a = 0 or b = 0 . So if (x ! 5)(x + 2) = 0 , then x ! 5 = 0 or x + 2 = 0 . Therefore, x = 5 or x = !2 .
Another method for solving quadratic equations is using the Quadratic Formula. This method is particularly helpful for solving quadratic equations that are difficult or impossible to factor. Before using the Quadratic Formula, the quadratic equation you want to solve must be in standard form (that is, written as ax2 + bx + c = 0 ).
In this form, a is the coefficient of the x2 -term, b is the coefficient of the x-term, and c is the constant term. The Quadratic Formula is stated at right.
This formula gives two possible answers, shown by the “± ” symbol. This symbol (read as “plus or minus”) is shorthand notation that tells you to calculate the formula twice: once using addition and once using subtraction. Therefore, every Quadratic Formula problem must be simplified twice to give:
x =!b + b2 ! 4ac
2a or x = !b ! b2 ! 4ac
2a
To solve x2 ! 3x !10 = 0 using the Quadratic Formula, substitute a = 1 , b = !3 , and c = !10 into the formula, as shown below, then simplify.
x =!(!3) ± (!3)2 ! 4(1)(!10)
2(1)!!=!!
3 ± 49
2!!=!!
3 ± 7
2!!!!!!!"!!x = 5!or !x = !2
MA
TH N
OTE
S
ETHODS AND MEANINGS Solving a Quadratic Equation
x =!b ± b2 ! 4ac
2a

Algebra 2 Connections 24
1-47. Use any method to find the point of intersection of f (x) = 3x ! 5 and g(x) = !4x + 9 . 1-48. Compute for f (x) = 1
x.
a. f (12) b. f ( 1
10) c. f (0.01) d. f (0.007)
1-49. Solve each of the following quadratic equations. If you need help, refer to the Math
Notes box for this lesson.
a. x2! 8x +15 = 0 b. 2x2 ! 5x ! 6 = 0
1-50. Consider the points (–5, 0) and (0, 3).
a. Plot the points and find the distance between them. Give your answer both in simplest radical form and as a decimal approximation.
b. Find the slope of the line that passes through both points. 1-51. Sketch a few different equilateral triangles. Create multiple representations
( x! y table, graph, equation) of the function with inputs that are the length of one side of an equilateral triangle and outputs that are its perimeter.
1-52. Find the error in the solution at right. Identify
the error and solve the equation correctly. 1-53. Solve each of the following equations.
a. 3.9x ! 2.1 = 11.2x + 51.7 b. 1
5x ! 2 =
13
25! 0.7x
4.1x = 9.5x + 23.7
!4.1x = !4.1x
5.4x = 23.7
5.4x
5.4=23.7
5.4
x = 4.39

Chapter 1: Investigations and Functions 25
1.2.1 How can I represent a function? • • • • • • • • • • • • • • • • • • • • • • • • • • • • • • • • • • • • • • • • • • • • • • • • • • • • • • • • • • • • • • • • • Modeling a Geometric Relationship Mathematics can be used to model physical relationships to help us understand them better. Mathematical models can assume the form of a series of diagrams, a context, a table, an equation, or a graph. In this course, you will be given situations to explore in which you gather and interpret data. You will learn to generalize your information so that you can make predictions about cases not actually tested. In this lesson, you will analyze a geometric relationship and look for connections among its multiple representations. 1-54. ANALYZING DATA FROM A GEOMETRIC RELATIONSHIP
Each team will make paper boxes using the instructions given below. Based on the physical models, your team will represent the relationship between the height of the box and its volume in multiple ways.
Cut a sheet of centimeter grid paper to match the dimensions that your teacher assigns your team. Cut the same size square out of each corner, and fold the sides up to form a shallow box (with no lid) as shown below.
Your task: As a team you will investigate the relationship between the height of a paper box (the input) and its volume (the output). You can build as many boxes as necessary to establish this relationship. Be sure to build all of your boxes out of paper of the same size. Record your information using multiple representations—including diagrams, a table, and a graph. Also record any thoughts, observations, and/or general statements that come up in your discussion of the problem.
How can we collect data for this relationship?
How much data is enough?
What are all the possible inputs for our function?
How are the different representations related?
Dimensions 22 cm ! 16 cm 18 cm ! 10 cm 22 cm ! 14 cm 15 cm ! 15 cm 20 cm ! 15 cm 15 cm ! 10 cm 20 cm ! 9 cm 12 cm ! 9 cm
Graph Rule or Equation
Context
Table
?
Algebra 2 Connections 26
1-55. Begin your investigation by building several boxes, taking measurements, and
collecting data.
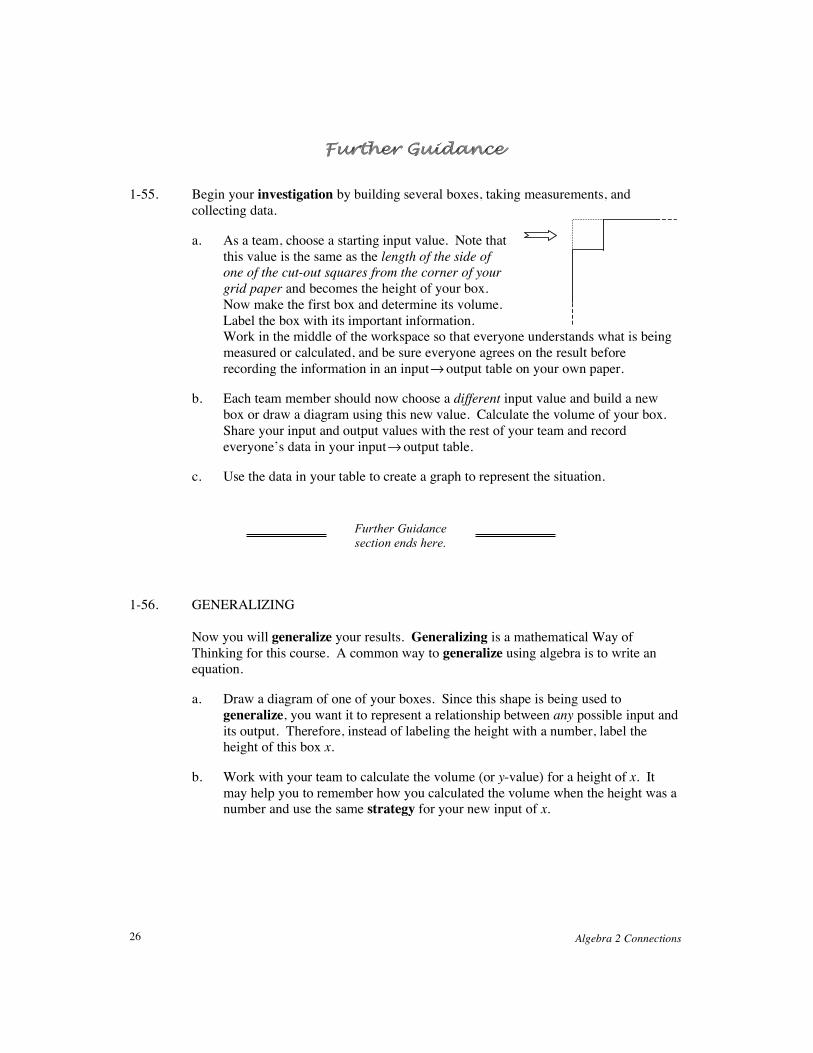
a. As a team, choose a starting input value. Note that this value is the same as the length of the side of one of the cut-out squares from the corner of your grid paper and becomes the height of your box. Now make the first box and determine its volume. Label the box with its important information. Work in the middle of the workspace so that everyone understands what is being measured or calculated, and be sure everyone agrees on the result before recording the information in an input! output table on your own paper.
b. Each team member should now choose a different input value and build a new box or draw a diagram using this new value. Calculate the volume of your box. Share your input and output values with the rest of your team and record everyone’s data in your input! output table.
c. Use the data in your table to create a graph to represent the situation. 1-56. GENERALIZING Now you will generalize your results. Generalizing is a mathematical Way of
Thinking for this course. A common way to generalize using algebra is to write an equation.
a. Draw a diagram of one of your boxes. Since this shape is being used to generalize, you want it to represent a relationship between any possible input and its output. Therefore, instead of labeling the height with a number, label the height of this box x.
b. Work with your team to calculate the volume (or y-value) for a height of x. It may help you to remember how you calculated the volume when the height was a number and use the same strategy for your new input of x.
Further Guidance section ends here.

Chapter 1: Investigations and Functions 27
1-57. LOOKING FOR CONNECTIONS
Put your x! y table, graph, and equation in the middle of your workspace. With your team, discuss the questions below.
As you address each question, remember to give reasons when you can. Also, if you make an observation, discuss how that observation relates to your table, graph, and equation.
a. Are there some input values that would not make sense? Why or why not? How can you tell using the graph? The x! y table? The equation? The boxes (or diagrams of boxes)?
b. What are all of the possible outputs (volumes)? Are there any outputs that would not make sense? Why or why not?
c. Should you connect the points on your graph with a smooth curve? That is, should your graph be continuous or discrete? Explain.
d. What is different about your graph from others you have seen in previous courses? What special points or features does it have?
e. Work with your team to find as many other connections as you can among your geometric models, your table, your equation, and your graph. How can you show or explain each connection?
1-58. What graph do you get when you use the graphing calculator to draw the
graph of your equation? Explain the relationship between this and the graph you made on your own paper.
1-59. Organize your findings into a stand-alone poster that shows everything you have
learned about all of the representations of your function as well as the connections between the representations. Use colors, arrows, words, and any other useful tools you can think of to make sure that someone reading your poster can understand all of your thinking.

Algebra 2 Connections 28
There are three trigonometric ratios you can use to solve for the missing side lengths and angle measurements in any right triangle: tangent, sine, and cosine. In the triangle below, when the sides are described relative to the angle θ, the opposite leg is y and the adjacent leg is x. The hypotenuse is h regardless of which acute angle is used.
tan ! =opposite leg
adjacent leg=
y
x
sin ! =opposite leg
hypotenuse=
y
h
cos ! =adjacent leg
hypotenuse=
xh
In general, for any uniquely determined triangle, missing sides and angles can be determined by using the Law of Sines or the Law of Cosines.
sinA
a=sinB
b=sinC
c
and c2= a
2+ b
2! 2abcosC
1-60. Make a table and graph for h(x) = x3 ! 4 . Find the domain, range, and intercepts. 1-61. For each diagram below, write and solve an equation to find the value of each variable.
Give your answer to part (d) in both radical and decimal form. For a reminder of the trigonometry ratios, refer to the Math Notes box for this lesson.
a. b. c. d.
MA
TH N
OTE
S ETHODS AND MEANINGS
Triangle Trigonometry
x
y
h
!
a
C
B c A
b
x 5"
x 15!
20 m x
15!
11' 10'
!
6
12

Chapter 1: Investigations and Functions 29
1-62. Consider the points (–2, 5) and (5, 2) as you complete parts (a) and (b) below.
a. Plot the points and find the distance between them. Give your answer both in simplest radical form and as a decimal approximation.
b. Find the slope of the line that goes through the two points. 1-63. Name the domain and range for each of the following functions.
a. b. c. d.
1-64. Find the error in the solution at right. Explain what the
error is and solve the equation correctly. Be sure to check your answer.
1-65. Solve each of the following equations. Be sure to check your answers.
a. 6
x= x !1 b. 9
x= x
1-66. Compute each of the following values for f (x) = 1
x!2.
a. f (2.5) b. f (1.75)
c. f (2) d. Justify your answer for part (c). 1-67. Graph the following functions and find the x- and y-intercepts.
a. y = 2x + 3 b. f (x) = 2x + 3
c. How are the functions in (a) and (b) the same? How are they different? 1-68. A 3-foot indoor kiddy slide must meet the ground very
gradually and make an angle of 155°, as shown in the diagram at right. Find the height of the slide (y) and the length of the floor it will cover (x).
155° y
x
3
x
y
x
y
x
y
x
y
5
x= x ! 4
x "5
x= x ! 4
5 = x ! 4
x = 9

Algebra 2 Connections 30
1-69. Write one or two equations to help you solve the following problem. A rectangle’s length is four times its width. The sum of its two adjacent sides is 22 cm.
How long is each side? 1-70. Solve each of the following equations.
a. 3
x+ 6 = !45 b. x!2
5=10!x
8
c. (x +1)(x ! 3) = 0 1-71. Consider f (x) = x2 ! 2x + 6 and g(x) = 2x +11.
a. Use any method to find the points of intersection of f (x) and g(x) .
b. Calculate f (x) + g(x) . c. Calculate f (x) ! g(x) . 1-72. Rearrange each equation below by solving for x. Write each equation in the form
x = ______ . (Note that y will be in your answer).
a. y = 3
5x +1 b. 3x + 2y = 6
c. y = x2 d. y = x2!100
1-73. Consider circles of different sizes. Create multiple representations of the function with
inputs that are the radius of the circle and outputs that are its area. 1-74. Consider the equation 4x ! 6y = 12 .
a. Predict what the graph of this equation looks like. Justify your answer.
b. Solve the equation for y and graph the equation.
c. Explain clearly how to find the x- and y-intercepts.
d. Which form of the equation is best for finding intercepts quickly? Why?
e. Find the x- and y-intercepts of 2x ! 3y = !18 . Then use the intercepts to sketch a graph quickly.

Chapter 1: Investigations and Functions 31
x2+ 2x +1
1-75. If the number 1 is the output for Carmichael’s function machine shown at right, how can you find out what number was dropped in? Find the number(s) that could have been dropped in.
1-76. What value of x allows you to find the y-intercept? Where
does the graph of each equation below cross the y-axis? Write each answer as an ordered pair.
a. y = 3x + 6 b. x = 5y !10
c. y = x2 d. y = 2x2 ! 4
e. y = (x ! 5)2 f. y = 3x3! 2x
2+13
1-77. Find the error in the solution at right.
Describe the error and solve the equation correctly.
3x + 2 = 10 ! 4(x !1)
3x + 2 = 6(x !1)
3x + 2 = 6x ! 6
8 = 3x!!so!x = 83

Algebra 2 Connections 32
1.2.2 How can I investigate a function? • • • • • • • • • • • • • • • • • • • • • • • • • • • • • • • • • • • • • • • • • • • • • • • • • • • • • • • • • • • • • • • • • • • • Function Investigation What does it mean to describe a function completely? In this lesson you will graph and investigate a family of functions with equations of the form f (x) = 1
x!h. As you work with your
team, keep the multiple representations of functions in mind. 1-78. INVESTIGATING A FUNCTION, Part One Your team will investigate functions of the form
f (x) = 1x!h
, where h can be any number. As a team, choose a value for h between –10
and 10. For example, if h = 7 , then f (x) = 1x!7
. Your task: On a piece of graph paper, write down
the function you get when you use your h-value. Then make an x! y table and draw a complete graph of your function. Is there any more information you need to be sure that you can see the entire shape of your graph? Discuss this question with your team and add any new information you think is necessary.
How can we be sure that our graph is complete?
How can we get output values that are greater than 1 or less than –1?
?
Chapter 1: Investigations and Functions 33
1-79. This function is different from others you have seen in the past. To get a complete
graph, you will need to make sure your table includes enough information.
a. Make an x! y table with integer x-values from 5 below your value of h to 5 above your value of h. For example, if you are working with h = 7 , you would start your table at x = 2 and end it at x = 12 . What do you notice about all of your y-values?
b. Is there any x-value that has no y-value for your function? Why does this make sense?
c. Plot all of the points that you have in your table so far.
d. Now you will need to add more values to your table to see what is happening to your function as your input values get close to your h-value. Choose eight input values that are very close to your value of h on either side. For example, if you are working with h = 7 , you might choose input values such as 6.5, 6.7, 6.9, 6.99, 7.01, 7.1, 7.3, and 7.5. For each new input value, calculate the corresponding output and add the new point to your graph.
e. When you have enough points to be sure that you know the shape of your graph, sketch the curve.
1-80. Now you will continue your investigation of f (x) = 1
x!h.
a. Each team member should choose a different value of h and make a complete x! y table and graph for your new function.
b. Examine all of your team’s functions. Together, generate a list of questions that you could ask about the functions your team created. Be as thorough as possible and be prepared to share your questions with the class.
c. As your teacher records each team’s questions, copy them into your Learning Log. Title this entry “Function Investigation Questions” and label it with today’s date.
Further Guidance section ends here.
Algebra 2 Connections 34
1-81. INVESTIGATING A FUNCTION, Part Two: SUMMARY STATEMENTS Now you are ready for the most important part of your investigation: summary
statements! Summary statements are a very important part of this course, so your team will practice making them. A summary statement is a statement about a function along with thorough justification. A strong summary statement should be justified with multiple representations ( x! y table, equation, graph, and situation, if applicable).
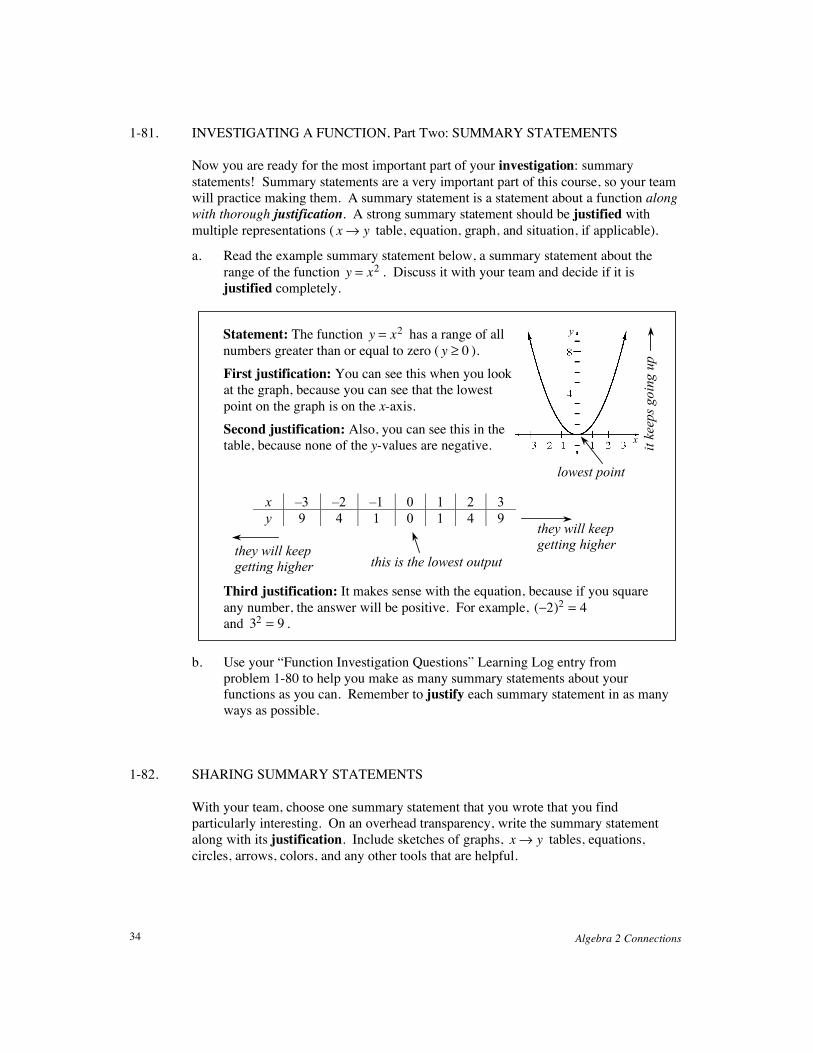
a. Read the example summary statement below, a summary statement about the range of the function y = x2 . Discuss it with your team and decide if it is justified completely.
Statement: The function y = x2 has a range of all numbers greater than or equal to zero ( y ! 0 ).
First justification: You can see this when you look at the graph, because you can see that the lowest point on the graph is on the x-axis.
Second justification: Also, you can see this in the table, because none of the y-values are negative.
Third justification: It makes sense with the equation, because if you square
any number, the answer will be positive. For example, (!2)2 = 4 and 32 = 9 .
b. Use your “Function Investigation Questions” Learning Log entry from
problem 1-80 to help you make as many summary statements about your functions as you can. Remember to justify each summary statement in as many ways as possible.
1-82. SHARING SUMMARY STATEMENTS With your team, choose one summary statement that you wrote that you find
particularly interesting. On an overhead transparency, write the summary statement along with its justification. Include sketches of graphs, x! y tables, equations, circles, arrows, colors, and any other tools that are helpful.
they will keep getting higher
x –3 –2 –1 0 1 2 3 y 9 4 1 0 1 4 9
this is the lowest output
they will keep getting higher
x
y
lowest point
it ke
eps g
oing
up

Chapter 1: Investigations and Functions 35
1-83. What will the graph of f (x) = 1x+25
look like?
a. Discuss this question with your team and make a sketch of what you predict the graph will look like. Give as many reasons for your prediction as you can.
b. Use your graphing calculator to graph f (x) = 1x+25
. Do you see what you expected to see? Why or why not?
c. Adjust the viewing window if needed. When you see the full picture of your graph, make a sketch of the graph on your paper. Label any important points.
d. How close was your prediction? 1-84. Use any method to find the points of intersection of f (x) = 2x2 ! 3x + 4 and
g(x) = x2 + 5x ! 3 . 1-85. Solve each equation for x.
a. !2(x + 4) = 35 ! (7 ! 4x) b. x!4
7=8!3x
5
1-86. Make a complete graph of the function f (x) = x ! 2 , label its x- and y-intercepts, and
describe its domain and range. 1-87. Given f (x) = 2x ! 7 , complete parts (a) through (c) below.
a. Compute f (0) . b. Solve f (x) = 0 .
c. What do the answers to parts (a) and (b) tell you about the graph of f (x) ? 1-88. Solve each equation below for the indicated variable.
a. y = mx + b (for x) b. A = !r2 (for r)
c. V = LHW (for W) d. 2x + 1
y= 3 (for y)

Algebra 2 Connections 36
1-89. What value of y allows you to find the x-intercept? For each of the equations below, find where its graph intersects the x-axis. Write each answer as an ordered pair.
a. y = 3x + 6 b. x = 5y !10
c. y = x2 d. y = 2x2 ! 4
e. y = (x ! 5)2 f. y = x3!13
1-90. Make a complete graph of the function h(x) = 2x2 + 4x ! 6 and describe its domain
and range. 1-91. Find the domain and the range for each of the following functions.
a. b. c. d. 1-92. Carlo got a pet snake as a birthday present. On his birthday, the baby snake was just
26 cm long. He has been watching it closely and has noticed that it has been growing 2 cm each week.
a. Create multiple representations of the function for which the inputs are the weeks since Carlo’s birthday and the outputs are the length of the snake.
b. If the snake continues to grow at the same rate, when will it be 1 meter (100 cm) long? How can you see this in each representation?
1-93. Create multiple representations of the function g(x) = 2
x. Then make as many
summary statements as you can.
y
x
y
x
y
x
y
x

Chapter 1: Investigations and Functions 37
1-94. Suppose you want to find where the lines y = 3x +15 and y = 3! 3x cross, and you want to be more accurate than the graphing calculator or graph paper will allow. You can use algebra to find the point of intersection.
a. If you remember how to do this, find the point of intersection using algebra and be prepared to explain your method to your team tomorrow in class. If you do not remember, then do parts (b) through (e) below.
b. Since y = 3x +15 and y = 3! 3x , what must be true about 3x +15 and 3! 3x when their y-values are the same?
c. Write an equation that does not contain y and solve it for x.
d. Use the x-value you found in part (c) to find the corresponding y-value.
e. Where do the two lines cross? 1-95. Salami and More Deli sells a 5-foot submarine sandwich for parties. It weighs
8 pounds. Assuming that the weight per foot is constant, what would be the length of a 12-pound sandwich?
1-96. If h(x) = x2 ! 5 , where does the graph of h(x) cross the x-axis? Make a sketch of the
graph. 1-97. Graph the following equations.
a. y ! 2x = 3 b. y ! 3 = x2
c. State the x- and y-intercepts for each equation.
d. Where do the two graphs cross? Show how you can find these two points without looking at the graphs.
1-98. Match the laws, rules, or formulas in Column I with the corresponding name from
Column II.
Column I Column II
a. x =!b± b
2!4ac
2a 1. Law of Cosines
b. sinA
a=sinB
b 2. Law of Sines
c. c2= a
2+ b
2 3. Pythagorean Theorem
d. c2= a
2+ b
2! 2abcosC 4. Quadratic Formula

Algebra 2 Connections 38
1.2.3 What do they have in common? • • • • • • • • • • • • • • • • • • • • • • • • • • • • • • • • • • • • • • • • • • • • • • • • • • • • • • • • • • • • • • • • • The Family of Linear Functions In Lesson 1.2.2, your team investigated functions of the form f (x) = 1
x!h, where h could be any
number. You learned that as you changed h, the graph changed, but the basic shape stayed the same. In this lesson, you will think about functions of the form f (x) = mx + b . 1-99. Consider functions of the form y = mx + b .
a. What do x and y represent in this function? What do m and b represent? Which ones can you change?
b. With the rest of the class, explore the effects of m and b on the function y = mx + b . What effect does m have on the graph? What effect does b have on the graph?
c. For this function, m and b are called parameters (as h was for f (x) = 1x!h
), whereas x and y are called variables. With your team, explain the difference between a parameter and a variable.
d. What do all of the functions of the form y = mx + b have in common? Since they all have the same basic relationship between x and y, they can be called a family of functions.
1-100. With your team, examine each of group of equations below and discuss what you
would see if you drew the graphs of the four equations on one set of axes. Write a description of what you imagine you would see. (You do not actually have to draw them.)
a. x + 2y = 10
y = !1
2x + 3
!4y = 2x + 8
y = !1
2x
b. 5x + y = !3
y = !1
2x ! 3
3x ! 4y = 12
5y ! 2x = !15
?

Chapter 1: Investigations and Functions 39
1-101. Below, (a) through (f), are six representations of a relationship between an input and an output. With your team, decide whether each relationship is linear and write a clear summary statement justifying your decision. If the relationship is linear, graph it and find its equation. If it is not linear, describe the growth.
a. b. c.
d. e. f.
1-102. Work with your team to create one new table and one new situation that display linear
relationships. Be sure to justify how you can tell that your table and situation are linear.
1-103. Without using a graph, decide whether the relationship shown in
the table at right is linear. Write a clear summary statement justifying your ideas. Be prepared to share your ideas with the class.
1-104. LEARNING LOG In your Learning Log, explain how you can recognize a linear
relationship in a table or the description of a situation. Be sure to include examples. Title this entry “Recognizing Linear Relationships” and label it with today’s date.
Pieces of
Bread
Grams of
Fiber 0 0 1 5 2 10 3 15 4 20
Killer Fried Chickens charges $7.00 for a basic bucket of chicken and $0.50 for each additional piece. The input is the number of extra pieces of chicken ordered, and the output is the total cost of the order.
x y 10 0 5 5 3 7 2 8 1 9 0 10
x y 10 1 5 2 4 2.5 2 5 1 10
0.5 20
James planted a bush in his yard. The year he planted it, the bush produced 17 flowers. Each year, the branches of the bush split, so the number of flowers doubles. The input is the year after planting, and the output is the number of flowers.
x y 0 –7 2 –2 4 3 6 8 8 13
x y 1 0.5 4 –7 10 –22 15 –34.5

Algebra 2 Connections 40
x
y
x
y
x
y
1-105. Find the slope and intercepts of 3x + 4y = 12 . Sketch a graph. 1-106. Write an equation for the line that passes through the points (2, 0) and (0, –3).
Remember that drawing a diagram (in this case, drawing the graph) can be very helpful.
1-107. Solve each equation below. Give solutions in both radical and decimal form.
a. x2+ 3x ! 3 = 0 b. 3x
2! 7x = 12
1-108. Jason loves to download music. Downloads R Us sells songs only in packages of
three, and it charges $2.00 for each package of three songs. Jason’s favorite group just released their Greatest Hits CD, which has 17 songs on it. Jason wants to buy all 17 songs from Downloads R Us. How much should Jason expect to pay?
1-109. Make a sketch of a graph showing the relationship between the number of people on
your school’s campus and the time of day. 1-110. For each graph below, what are the domain and range?
a. b. c.
1-111. Imagine that you add water to the beakers shown below (labeled A, B, and C). Sketch
a graph for each beaker to show the relationship between the volume of water added and the height of the water in each beaker. Put all three graphs on one set of axes (you may want to use colored pencils to distinguish the graphs). What are the independent and dependent variables?
A B C Hei
ght o
f Liq
uid
Volume of Water Added

Chapter 1: Investigations and Functions 41
1.2.4 What can I learn about it? • • • • • • • • • • • • • • • • • • • • • • • • • • • • • • • • • • • • • • • • • • • • • • • • • • • • • • • • • • • • • • • • • • • • • • Function Investigation Challenge In this lesson, you will have a chance to show off your understanding of investigation as you work with a new function. 1-112. In this activity you will investigate the function f (x) = 5
(x2 +1)!1 .
a. Take a moment to look over your Learning Log entry entitled “Function Investigation Questions.” Are there any questions you should add to your list? Discuss this with your team and make any necessary additions to your Learning Log.
b. Now investigate f (x) completely. Be sure to make clear summary statements that are justified using multiple representations.
1-113. Recently, Kalani and Lynette took a trip from
Vacaville, California to Los Angeles. The graph at right represents their trip.
a. Explain what each line segment in the graph represents.
b. About how many miles is it from Vacaville to Los Angeles? How do you know?
c. Using the graph shown above, sketch a graph that would represent their speed while traveling. Take your time to think this through carefully and be sure to label the axes.
1-114. Solve each equation below for x.
a. 10 ! 2(2x +1) = 4(x ! 2) b. 5 ! (2x ! 3) = !8 + 2x
?

Algebra 2 Connections 42
1-115. The right triangle shown at right has a height of 12 cm, and its area is 60 square cm. Find m!B and the length of the hypotenuse.
1-116. The longer leg of a right triangle is three inches more than three times the length of the
shorter leg. The area of the triangle is 84 square inches. Find the perimeter of the triangle.
1-117. Uyregor has a collection of normal, fair dice. He takes one out to roll it.
a. What are all possible outcomes that can come up?
b. What is the probability that a 4 comes up?
c. What is the probability that the number that comes up is less than 5? 1-118. Stacie says to Cory, “Reach into this standard deck of playing cards and pull out a
card at random. If it is the queen of hearts, I’ll pay $5.00.” What is the probability that Cory gets Stacie’s $5.00? What is the probability that Stacie keeps her $5.00? Justify your answers. (Note: A standard deck of playing cards contains 52 cards, each of which is unique.)
1-119. Have you ever wondered why so many equations are written with the variables
x and y? Suppose you are reaching into a bag that contains all the letters of the English alphabet, and you pull out one letter at random to use as a variable in equations. What is the probability that you pull out an x? If you got the x, now what is the probability that you pull out a y?
A
B
C
Chapter 1: Investigations and Functions 43
Chapter 1 Closure What have I learned? • • • • • • • • • • • • • • • • • • • • • • • • • • • • • • • • • • • • • • • • • • • • • • • • • • • • • • • • • • • • • • • • • • • • • • • • • • • • • • • Reflection and Synthesis The activities below offer you a chance to reflect on what you have learned in this chapter. As you work, look for concepts that you feel very comfortable with, ideas that you would like to learn more about, and topics with which you need additional help. Look for connections between ideas as well as connections with material you learned previously. TEAM BRAINSTORM With your team, brainstorm a list for each of the following three categories. Be as
detailed as you can. How long can you make your lists? Challenge yourselves. Be prepared to share your team’s ideas with the class.
Topics: What have you studied in this chapter? What ideas and words were important in what you learned? Remember to be as detailed as you can.
Investigations: What did you do to investigate mathematical relationships? What questions did you ask yourself? List as many aspects of investigations as you can.
Connections: How are the topics, ideas, and words that you learned in previous courses connected to the new ideas in this chapter? Again, make your list as long as you can.

Algebra 2 Connections 44
MAKING CONNECTIONS Below is a list of the vocabulary used in this chapter. Make sure that you are familiar
with all of these words and know what they mean. Refer to the glossary or index for any words that you do not yet understand.
dependent variable domain equation function generalize graph independent variable input investigate linear output range rule x-intercept x! y table
y-intercept Make a concept map showing all of the connections you can find among the key words
and ideas listed above. To show a connection between two words, draw a line between them and explain the connection, as shown in the example below. A word can be connected to any other word as long as there is a justified connection. For each key word or idea, provide a sketch of an example.
Your teacher may provide you with vocabulary cards to help you get started. If you
use the cards to plan your concept map, be sure either to re-draw your concept map on your paper or to attach the vocabulary cards to a poster with all of the connections explained for others to see and understand.
While you are making your map, your team may think of related words or ideas that
are not listed above. Be sure to include these ideas on your concept map. GROWTH OVER TIME This section gives you an opportunity to show growth in your understanding of key
mathematical ideas over time as you complete this course. In this section you will complete a problem on its own sheet of paper and will keep it separate from your other work or put it into a portfolio. You will need to refer back to the problem later in the course.
On a separate sheet of paper, explain everything you know about y = x2 ! 4 and
y = x + 4 .
Word A Example:
Word B Example:
These are connected because…

Chapter 1: Investigations and Functions 45
SUMMARIZING MY UNDERSTANDING This section gives you an opportunity to show what you know about certain math
topics or ideas. With your team, make a list of the big ideas of this chapter. Discuss the important
ideas of the chapter and try to agree on a short list of no more than five big ideas. Be prepared to share your list in a whole class discussion. When the class has reached agreement on a list, continue with parts (a) and (b) below.
a. Write your own description of each big idea.
b. For each big idea, provide one or two representative example problems. Solve each problem completely, using multiple representations, if applicable.
Your teacher may give you a “GO” page to work on (or you can download this from
www.cpm.org). “GO” stands for “Graphic Organizer,” a tool you can use to organize your thoughts and communicate your ideas clearly.
WHAT HAVE I LEARNED? This section will help you determine the types of problems with which you feel
comfortable and the types of problems with which you need help. This section will appear at the end of every chapter to help you check your understanding. These problems are intended for you to complete independently and outside of class. Even if your teacher does not assign this section, it is a good idea to try these problems and find out for yourself what you know and what you need to work on.
Solve each problem as completely as you can. The table at the end of this closure
section has answers to these problems. It also tells you where you can find additional help and practice with similar problems.
CL 1-120. Given the functions f (x) = x + 4 and g(x) = x2 ! x , find the value of each
expression below.
a. f (5) b. g(!1)
c. x if f (x) = 10 d. x if g(x) = 6 CL 1-121. Describe the domain and range for each function shown below.
a. b.
x
y
x
y

Algebra 2 Connections 46
CL 1-122. For each pair of equations below, determine where the graphs intersect.
a. y = 3x +15
y = 3! 3x
b. y = x2! 3x ! 8
y = 2
CL 1-123. Graph the function f (x) = x2 ! 2x ! 8 . Identify the domain and range, identify any
special points, and describe any symmetry. CL 1-124. Graph each equation below and find the x- and y-intercepts.
a. y = !3
2x + 8 b. 2x ! 3y = !6
CL 1-125. Find an equation for each line described below.
a. The line that passes through the point (2, 8) and has a slope of –5.
b. The line that passes through the points (–3, 4) and (5, – 4).
c. The line that passes through the points (–2, 4) and (4, –5). CL 1-126. Solve each equation below.
a. x+2
5=10!2x
3 b. 3
x!1 = 8 c. x
2+x
3= 7
CL 1-127. Solve for y.
a. b.
CL 1-128. Micah was given $200 for his birthday. Each week he spends $15 on comic books. In
how many weeks will his birthday money be gone? Create multiple representations ( x! y table, graph, and equation) for the relationship
between the weeks since Micah’s birthday and how much money he has left. How does each representation show the solution to the problem?
CL 1-129. Check your answers using the table at the end of this section. Which problems do you
feel confident about? Which problems were hard? Have you worked on problems like these in math classes you have taken before? Use the table to make a list of topics with which you need help and a list of topics you need to practice more.
5 3 y
9
20 m y
15!

Chapter 1: Investigations and Functions 47
HOW AM I THINKING?
This course focuses on five different Ways of Thinking: justifying, generalizing, choosing a strategy, investigating, and reversing. These are some of the ways in which you think while trying to make sense of a concept or attempting to solve a problem (even outside of math class). During this chapter, you have probably used each Way of Thinking multiple times without even realizing it!
This closure activity will focus on
one of these Ways of Thinking: investigating. Read the description of this Way of Thinking at right.
Think about the investigating that
you have done in this chapter. When have you tried something that you weren’t specifically asked to do? What did you do when testing your idea did not work as you expected? You may want to flip through the chapter to refresh your memory about the problems that you have worked on. Discuss any of the investigations you have made with your team.
Once your discussion is complete,
choose one problem you worked on in Chapter 1 in which you investigated.
a. Write down the problem and a description of how investigation helped you solve the problem or understand the mathematics involved.
b. Could you have investigated further? Write two new questions that you could have asked about the problem that may have furthered your investigation and helped you to learn more.
Investigating When you have questions about an idea and design a process to find answers to those questions, you are investigating. Investigating helps you explore an idea in depth to understand it more thoroughly. Common thoughts you might have when you are investigating are: “What relationships do I see?” “I wonder what would happen if I changed…” “Can I look at this differently…” or “What if I…” This multi-step process includes asking questions and coming up with answers, summary statements, or more specific questions in response to the original questions you posed.

Algebra 2 Connections 48
Answers and Support for Closure Activity #5 What Have I Learned?
Problem Solutions Need Help? More Practice CL 1-120.
a. 3 b. 2 c. x = 96 d. x = –2 or 3
Lesson 1.1.1 Problems 1-4, 1-5, 1-18, 1-22, and 1-36
CL 1-121.
a. Domain: !" < x < 6 Range: !" < y # 6
b. Domain: all real numbers Range: !3 " y " 3
Math Notes box in Lesson 1.1.3
Problems 1-21, 1-24, 1-25, 1-28, and 1-35
CL 1-122. a. (–2, 9) b. (5, 2), (–2, 2)
Checkpoint 4 Problems 1-94 and 1-97
CL 1-123. Domain: all real numbers; Range: y ! "9
Intercepts: (–2, 0), (4, 0), and (0, –8) Vertex: (1, –9) Symmetrical about the line x = 1
Math Notes box in Lesson 1.1.3
Problems 1-21, 1-46, 1-60, 1-81, 1-90, 1-96
CL 1-124.
a.
Intercepts: (5 13,0) and (0, 8)
b.
Intercepts: (–3, 0) and (0, 2)
Math Notes box in Lesson 1.1.2
Problems 1-7, 1-67, 1-74, and 1-105
f(x)
x
x
y
x
y

Chapter 1: Investigations and Functions 49
Problem Solutions Need Help? More Practice CL 1-125. a. y = !5x +18
b. y = !x +1
c. y = !3
2x +1
Math Notes box in Lesson 1.1.2
Problem 1-106, Checkpoint 10
CL 1-126. a. 44
13
b. 1
3
c. 42
5
Checkpoint 14 Problems 1-53, 1-64, 1-65, 1-70, and 1-85
CL 1-127. a. 27
5
b. ! 5.18
Math Notes box in Lesson 1.2.1
Problems 1-40, 1-61, and 1-68
CL 1-128. y = 200 !15x , where y represents the total amount of money left and x represents the numbers of weeks that have passed
Lesson 1.1.2 Problems 1-13, 1-20, 1-25, 1-92, and 1-101
Mon
ey
Weeks
Week 0 1 2 3 4 5
$ 200 185 170 155 140 125

Algebra 2 Connections 50