Embed Size (px)
Citation preview

4.5 Factors Controlling Population Size S. Preston 1
A2 Unit BY4: Metabolism, Microbiology and Homeostasis Name: Date: Topic 4.5 Factors Controlling Population Size – Booklet 1 Population Growth
Completed 1. Read and compete the questions on page 2. Read Toole and Toole p354-360 3. Be able to answer and discuss the following:
1. Describe and explain what is happening at each stage of population growth shown in the graph.
2. What determines the maximal growth in any population?
3. If an organism is grown within a flask it will experience growth as shown . Is a decline phase inevitable for all populations?
4. Predator prey relationships could be described as showing ‘negative feedback’. Explain this statement.
4. Practice past paper questions on csfca2biology.wikispaces.com 5. Read the BioFactsheets attached at the end which gives tips for
exams etc.

4.5 Factors Controlling Population Size S. Preston 2
End of topic checklist for 4.5 Factors Controlling Population Size Tick as appropriate: RED: I do not know about this AMBER: I have heard about this but have not learned this yet. I am unsure on this. GREEN: I have heard about this and I have learned this. I am confident about this.
Topic RED AMBER GREEN
1. Know that ecosystems are dynamic and subject to change. 2. Define the term ‘population’. 3. Population numbers will fluctuate and this is dependent on various factors. 4. Population numbers are dependent on the birth and death rates, and immigration
into the population and emigration away.
5. Populations will increase in size whilst death rate is lower than birth rate. 6. Some factors will slow down population rate and some will cause a population
crash.
7. Be able to draw a generalised graph of population growth (sigmoid curve) and label the stages of growth as shown by a liquid culture of yeast or bacteria.
8. Be able to plot graphs of population growth rate when provided with appropriate data.
9. Be able to interpret graphs of changes in population growth rate. 10. Weather, predation, parasitism (disease), food supply, living space and
competition may affect population growth.
11. The effect of density dependent factors varies with the size of the population whereas the effect of density independent will be the same regardless of the population size.
12. Be able to define the term ‘carrying capacity’; explain how this is dependent on the availability of resources (which, therefore act as density-dependent factors); how populations might then fluctuate about this set point.
13. Be able to describe the relative advantages and disadvantages of chemical and biological control in terms of efficiency, environmental damage, ease of use and effects on human life.
14. Appreciate the advantages of chemical control including rapid eradication of pest over a specified localised area and relative cost effectiveness. The disadvantages include the development of resistance and toxicity risks to non-target organisms.
15. Appreciate the advantages of biological control including its specificity, with no resistance, environmental damage or residues. Disadvantages include the initial cost of research required to evaluate the agent’s biology, in order to introduce adequate numbers into the pest population at the optimum time. Growers must be convinced that prevention of financial loss does not require complete eradication, but that the maintenance of control may necessitate repeat application.
16. Understand what is meant by organic breakdown and describe its importance to the ecosystem in the recycling of mineral nutrients.
17. Know that microorganisms play an important role in the process of decay, releasing compounds of essential chemical elements from the bodies of dead organisms.
18. Be able to draw a labelled diagram of the carbon cycle linking the processes of photosynthesis, respiration, decomposition, fossilisation and combustion (link to 5.8)
19. Know that nitrogen is found in all amino acids from which proteins are assembled. Nitrogen is available to plants only in the form of ammonium and nitrate ions; these ions being taken up by roots.
20. Link the uptake of nitrates with protein and nucleic acid synthesis. 21. Understand that the nitrogen cycle is the flow of organic nitrogen within an
ecosystem where there is an interchange between nitrogenous compounds and atmospheric nitrogen.
22. The main processes of the nitrogen cycle are putrefaction, nitrification, nitrogen fixation and denitrification.
23. Explain the activities of nitrifying, denitrifying and nitrogen fixing bacteria and know the generic names Nitrosomonas, Nitrobacter, Azotobacter and Rhizobium.
24. Ploughing and drainage are important in aeration of soil, producing the aerobic conditions required by nitrifying bacteria.

4.5 Factors Controlling Population Size S. Preston 3
Populations
This may be a population of deer colonizing a new area or a population of bacteria being cultured in a fermenter. The number of individuals in a population is called the population size. The four factors affecting population size are shown below:
The following can be used to describe a population that is stable in size:
B + I = D + E Write an equation to describe a population that is declining in size ________________________________ Write an equation to describe a population that is increasing in size _______________________________ Write an equation to describe change in population size = _______________________________________ Death rate is the number of deaths / number of people within the population/ Define birth rate:________________________________________________________________________ Birth and death rates are important. However, immigrations and emigrations can be important too. During the Irish potato famine from 1845 to 1849 the potato harvest was devastated by potato blight (a monoculture with little genetic variation that was susceptible to the fungal blight infection) and the population fell from about 9 million to 6.5 million!
POPULATION – a group of organisms of the same species living in the same area at the same time, and which are capable of interbreeding.
Population Size
Birth rate (B) Immigration rate (I)
Death rate (D) Emigration rate
(E)
4.5 Factors Controlling Population Size S. Preston 4
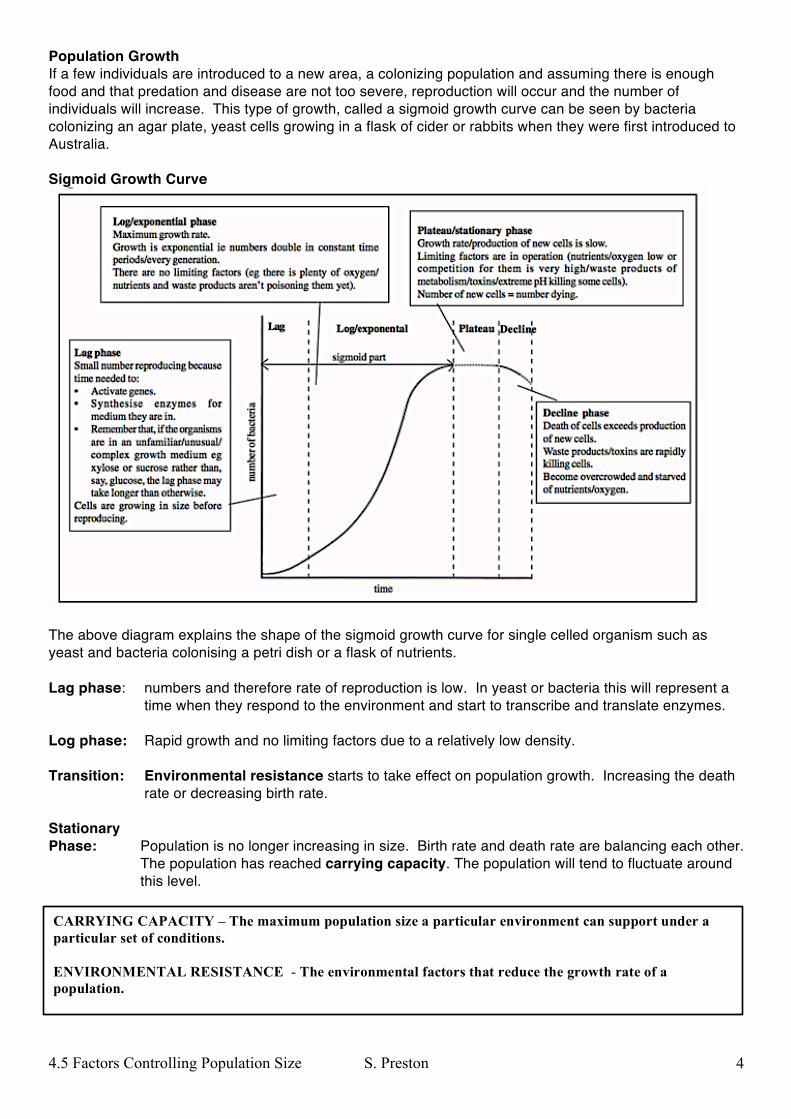
Population Growth If a few individuals are introduced to a new area, a colonizing population and assuming there is enough food and that predation and disease are not too severe, reproduction will occur and the number of individuals will increase. This type of growth, called a sigmoid growth curve can be seen by bacteria colonizing an agar plate, yeast cells growing in a flask of cider or rabbits when they were first introduced to Australia. Sigmoid Growth Curve
The above diagram explains the shape of the sigmoid growth curve for single celled organism such as yeast and bacteria colonising a petri dish or a flask of nutrients. Lag phase: numbers and therefore rate of reproduction is low. In yeast or bacteria this will represent a
time when they respond to the environment and start to transcribe and translate enzymes. Log phase: Rapid growth and no limiting factors due to a relatively low density. Transition: Environmental resistance starts to take effect on population growth. Increasing the death
rate or decreasing birth rate. Stationary Phase: Population is no longer increasing in size. Birth rate and death rate are balancing each other.
The population has reached carrying capacity. The population will tend to fluctuate around this level.
CARRYING CAPACITY – The maximum population size a particular environment can support under a particular set of conditions. ENVIRONMENTAL RESISTANCE - The environmental factors that reduce the growth rate of a population.
4.5 Factors Controlling Population Size S. Preston 5
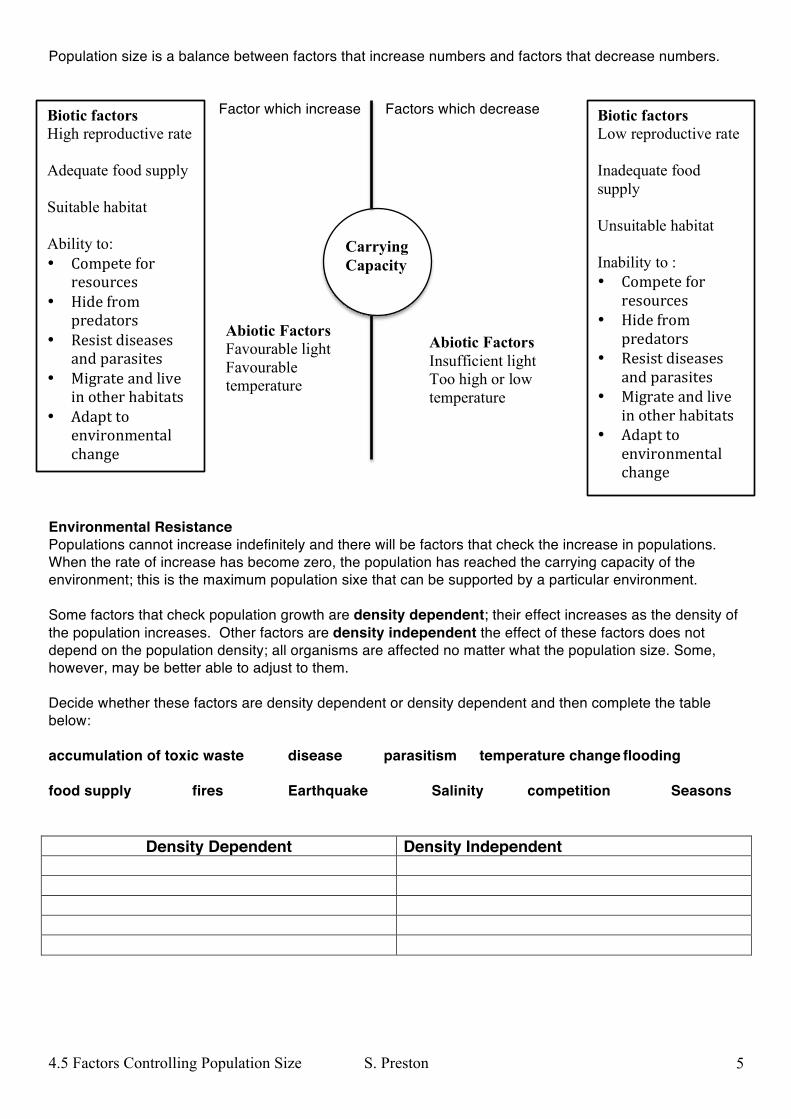
Population size is a balance between factors that increase numbers and factors that decrease numbers.
Factor which increase Factors which decrease
Environmental Resistance Populations cannot increase indefinitely and there will be factors that check the increase in populations. When the rate of increase has become zero, the population has reached the carrying capacity of the environment; this is the maximum population sixe that can be supported by a particular environment. Some factors that check population growth are density dependent; their effect increases as the density of the population increases. Other factors are density independent the effect of these factors does not depend on the population density; all organisms are affected no matter what the population size. Some, however, may be better able to adjust to them. Decide whether these factors are density dependent or density dependent and then complete the table below: accumulation of toxic waste disease parasitism temperature change flooding food supply fires Earthquake Salinity competition Seasons
Density Dependent Density Independent
Biotic factors High reproductive rate Adequate food supply Suitable habitat Ability to: • Compete for
resources • Hide from
predators • Resist diseases
and parasites • Migrate and live
in other habitats • Adapt to
environmental change
Biotic factors Low reproductive rate Inadequate food supply Unsuitable habitat Inability to : • Compete for
resources • Hide from
predators • Resist diseases
and parasites • Migrate and live
in other habitats • Adapt to
environmental change
Carrying Capacity
Abiotic Factors Favourable light Favourable temperature
Abiotic Factors Insufficient light Too high or low temperature

4.5 Factors Controlling Population Size S. Preston 6
Factors affecting population size Many different factors interact to affect population size, and it can be difficult to determine which factors are the most important. Abiotic Factors The population is obviously affected by the abiotic environment by factors such as: • Temperature; • Water • Humidity / Water • Soil (edaphic factors) such as mineral content • Topography (altitude, slope, aspect) • Catastrophes (floods, volcanoes, fire) In harsh environments (very cold, dry, hot, salty etc.) only a few species will have successfully adapted to the conditions and this reduces competition from other species. In harsh environments it is primarily the abiotic factors, which govern survival. Seasonal changes can results in changes in many abiotic factors and this can cause oscillations (fluctuations) in population sizes especially with species with short life cycles such as insects. Biotic Factors Food Supply A population is dependent upon the population of its food supply. All organisms need organic chemicals such as carbohydrates, proteins etc. to stay alive. For organisms that cannot synthesise their own there is
only one natural source of these compounds; the body or products of another organism. Most animals eat a number of different species, which limits the effect that any one-food source has on population growth. Other organisms eat very few species of food organism, for example the Australian koala only eats leaves of eucalyptus trees. Animals with restricted diets often show large fluctuations in the size of their populations compared with animals, which have range of foods in their diet. Suggest
why. Competition In most natural habitats there is a limit on the availability of essential resources such as food, space in which to grow or water. If there is not enough of one resource for all the members of a population, competition for that resource will occur. The effect of competition is to reduce the growth rate of populations. There are two main classes of competition: Intraspecific Competition Occurs between members of the same species. They will have identical resource requirements (niches) and will therefore compete for any in short supply. (Intraspecific competition results in changes in the frequency of favourable and unfavorable genes in the process of natural selection).

4.5 Factors Controlling Population Size S. Preston 7
Interspecific Competition The competition for resources such as food, space, water and light between different species. In general one species will outcompete the other. These are the results of a laboratory experiment in population increase. Twenty individuals of one species of Paramecium were put into a glass tube with a standard amount of bacteria as food. Each day the Paramecium were given food and every other day the mix was given a rinse to make sure that toxins did not build up in the tube. The experiment was done with two different species of Paramecium i.e. P. caudataum and P. aurelia. Paramecium multiplies by binary fission, which is dividing into two without sexual reproduction. Study the graphs below which show the two species grown separately and then together.
Graphs to shoe the population growth curves for two species of Paramecium. The population numbers are means of three repeat experiments for each species (Data from Gausse 1984). Questions 1. When was the highest number of each species reached when grown separately and together? 2. How long was the lag phase for each species when grown separately and together? 3. Which species had the largest carrying capacity? 4. Explain the graph when both species are grown together. The above graph demonstrates a concept referred to as the principle of competitive exclusion where one species is out competed by another.

4.5 Factors Controlling Population Size S. Preston 8
Competition between barnacles
Many rocky shores support populations of small crustaceans, called barnacles. These animals are fixed to a rock surface and feed on floating microscopic organisms during the hours when they are covered by sea. One common Atlantic species, Chthamalus stellatus, is able to grow over all parts of rocky shores. A second species, Balanus balanoides, cannot tolerate the dry conditions at the top of the shore but can live lower down the shore. Questions 1. What do you think is the key resource for which barnacles, like all sessile organisms compete? Balanus is the larger of the two, and has a faster growth rate: as a result, its shell forces Chthamalus off the rocks as it grows or Balanus simply grows over Chthamalus. 2. Why if an area of rock lower down the shore is kept clear of Balanus, will Chthamalus be able to
thrive? Predation and Grazing Predators and grazers consume all or parts of organisms. Predators eat all or parts of animals, called prey, whereas grazers consume plants. Predators and grazers are usually less abundant than the organisms on which they feed. The organisms, which they eat, are either killed or their reproductive rate is slowed so predators and grazers can reduce the population size and growth rate of the organisms they eat. Predator and prey populations are predicted to show regular cycles in their numbers.
Some mammals, particularly in seasonal environments exhibit regular cycles in their population numbers. Snowshoe hares in Canada exhibit cycles in their numbers over 9-11 years. Populations of lynx in the area show a similar periodicity. Early researchers suggested that the lynx controlled the size of the hare population however; it is thought the hare population is strongly controlled by other factors such as the

4.5 Factors Controlling Population Size S. Preston 9
availability of palatable grasses. The fluctuation in lynx numbers however is thought to be a direct result of the fluctuation in the numbers of hares.
Explain why there is a time lag between an increase in the hare population and the response of the lynx population. Parasitism and Disease Parasites are often more important than predators in keeping down population numbers because being small they have high rates of natural increase and can respond to quickly to changes in the numbers of their host.
Disease can spread more rapidly in crowded populations and can be a potent force in checking population growth.

4.5 Factors Controlling Population Size S. Preston 10

4.5 Factors Controlling Population Size S. Preston 11

4.5 Factors Controlling Population Size S. Preston 12

4.5 Factors Controlling Population Size S. Preston 13

4.5 Factors Controlling Population Size S. Preston 14

4.5 Factors Controlling Population Size S. Preston 15

4.5 Factors Controlling Population Size S. Preston 16

4.5 Factors Controlling Population Size S. Preston 17