Embed Size (px)
Citation preview

Where Do We Stand in 2011?
David M. Kendall, MD
Chief Scientific and Medical Officer
American Diabetes Association
Associate Professor of Medicine
University of Minnesota Medical School
A1c and Estimated Average Glucose:
From Diagnosis to Management

Disclosure - Duality of Interest
• Research committees and grant support
– HealthPartners (MN), National Kidney Foundation
• Consultant, Advisory Board, or Educational Activity
– Sanford – Burnham Medical Research Institute and the Florida Hospitals (TRI)
– Streilitz Diabetes Center – Oregon Health and Sciences University
• Employment
– Spouse current employee of Genentech (Roche)
The views and opinions presented herein are my own, and do not necessarily
reflect the official position of the American Diabetes Association.
All research, educational and consulting activities are performed under contract
to the American Diabetes Association Research Foundation. Dr Kendall
receives no personal or direct compensation for these activities.

Diabetes and CVD:
Impact of Other CVD Risk Factors
• Diabetes Burden
– Trends in prevalence, cost and health care burden
– The case for early detection
• Diabetes Diagnosis and Treatment Targets
– Using A1C for Diagnosis (2010 Standards of Care)
– Screening for diabetes and pre-diabetes
– Implications for prevention
• A1C and Estimated Average Glucse (eAG)
– What’s all the fuss?
– Role of A1C, eAG and self-monitored blood glucose (SMBG)
– Practical applications
Early Detection of
Type 2 Diabetes and Prediabetes
Implications for Intervention

Projecting the Future Diabetes Population
Size and Related Costs for the U.S.
Huang ES. Diabetes Care 32:2225–2229, 2009

Projecting the Future Diabetes Population
The Imperative for Change
Boyle JP. Population Health Metrics 2010, 8:29doi:10.1186/1478-7954-8-29
Published: 22 October 2010
14.5
17.5
20.4
23.2
25.6
28.7 29.631.4
32.7
0.0
5.0
10.0
15.0
20.0
25.0
30.0
35.0
2010 2015 2020 2025 2030 2035 2040 2045 2050
Perc
en
t o
f U
S P
op
ula
tio
n
wit
h D
iab
ete
s

Diabetes Prevention
Screening For Diabetes and Pre-Diabetes
• Early detection of Diabetes and Pre-Diabetes?
– Common clinical condition – affects 1 in 10 (1 in 5 undiagnosed)
– Simple screening tools (risk assessment + FPG or A1C)
• Type 2 diabetes is preventable
Diabetes risk reduced by 50% or more with lifestyle interventions
Early intervention most effective
Harris MI. Consultant 1997;37(suppl):S9
Pre
va
len
ce
Of
Reti
no
path
y 80
60
40
20
0
-12 -7 0 20
Years Since Diagnosis
Onset of type 2 diabetes
Onset of detectable
retinopathy

The Pathophysiology of Type 2 Diabetes
Impaired
incretin effect
Relative insulin
deficiency
Insulin
resistance
HyperglycemiaT2 diabetes and pre-diabetes
Adapted from Kendall DM, et al. Am J Med. 2009;122(6 Suppl):S37-50.

Glu
co
se
(m
g/d
L)
bo
dy w
eig
ht
Diabetes
diagnosis
50
100
150
200
250
300
350
Fasting glucose
Adapted from Kendall DM, et al. Am J Med. 2009;122(6 Suppl):S37-50.
Years
Re
lati
ve a
mo
un
t
-10 -5 0 5 10 15 20 25 30
Insulin resistance
Insulin level
Onset
High risk for diabetes
0
50
100
150
200
250
-15
Natural History of Type 2 DiabetesWhat Role Can Incretin-Based Therapy Play?
Post-meal glucose
Body weight

Adapted from Nathan DM, et al. Diabetes Care 2007; 30:753-759. Nathan DM, et al. Diabetes Care 2008; 31:173-175.
ADA. Diabetes Care 2008; 31:s12-s54.
Screen for Diabetes:Fasting plasma glucose
(and/or OGTT)
Lifestyle Intervention
IFG or IGT
Pre-diabetes
IFG or IGT (Pre-diabetes)
plus other features*
Lifestyle Intervention and/or Metformin
A Practical Approach to Pre-Diabetes and
Diabetes Prevention
Lifestyle plus Metformin
Established
Diabetes

Identifying Higher Risk Populations
A1C for Diagnosis
Screening, Detection and Diagnosis

Diabetes Screening and DiagnosisADA Criteria – Testing in Asymptomatic Adults
Testing should be considered in all adults who are overweight (BMI ≥ 25) and have additional risk factors:
• Family history of diabetes (1st degree relative)
• High risk populations group (AA, NA, Asian Am, Latino, API)
• Specific health conditions (CVD , hypertension, dyslipidemia)
• Past history of elevated blood glucose or A1C
• History of gestational diabetes or child > 9 lbs at birth
• Other conditions associated with insulin resistance
– Morbid obesity, polycystic ovarian syndrome (PCOS), acanthosis
In the absence of risk factors, testing should begin at age 45 years. If normal, testing should be repeated at least every 3 years in a clinic setting
American Diabetes Association. Standards of Medical Care in Diabetes – 2010
Diabetes Care 33; Suppl 1, S11-S61, 2010

Diabetes Risk – Identifying Risk
Screening Tools from the ADA and CDC

Diagnosis of Diabetes 2009• To test for pre-diabetes or diabetes:
– Fasting plasma glucose
– Oral Glucose Tolerance Test (75 gm),
– or both is appropriate.
• An OGTT may be considered in patients with impaired fasting
glucose (IFG)
ADA Clinical Practice Recommendations, Diabetes Care 32 (Suppl 1), 2009
PREDIABETES
IFG or IGT
2-h PG > 2002-h PG 140 – 199 (IGT)2-h PG < 140
FPG > 126FPG > 100 – 125 (IFG)FPG < 100
DIABETESNORMAL

Suadek CD. J Clin Endocrinol Metab 93: 2447–2453, 2008
International Expert Committee. Diabetes Care 32 (7):1327-1334, 2009
The Emergence of A1C as Diagnostic Tool

International Expert Committee Report on the
Role of A1C in the Diagnosis of Diabetes
6.5%
International Expert Committee. Diabetes Care 32 (7):1327-1334, 2009
• Diabetes should be diagnosed when A1C is ≥6.5% (and confirmed)
• Confirmation not required if symptomatic and glucose >200 mg/dl
– If A1C testing not possible, previously diagnostic methods (e.g., FPG or 2 hr PCG
with confirmation) are acceptable

Diagnosis of Diabetes 2010-11Simplified Screening and Detection
• A1C 6.5% (NGSP, DCCT* standard) – non-fasting test
– Fasting glucose 126 mg/dl (8 hour fast)
– 2 hour glucose 200 mg/dl during OGTT (WHO 75 g test)
• If symptoms of hyperglycemia = random glucose 200 mg/dl
PRE-DIABETES (IFG or IGT)
2-h PG > 2002-h PG 140 – 199 (IGT)2-h PG < 140
FPG > 126FPG > 100 – 125 (IFG)FPG < 100
DIABETESNORMAL
A1c > 6.5%A1c 5.7 – 6.4%A1c < 5.7%
American Diabetes Association. Diabetes Care 34 (Suppl 1), 2011

Use of HbA1C for Screening and Diagnosis
Pros and Cons
Pro• Does not require overnight fast
– Increased rate of screening
• Reflects long-term glycemicburden
– Less affected by acute events, physiologic stress
– Accepted and current guide in management of diabetes
• Laboratory methods now well standardized and reliable
Con• Greater cost of individual test
– Limited availability in certain regions
• Variable correlation between A1C and glucose testing
• Unresolved questions
– What is the “Gold Standard” for diagnosis?
• Potential variation by population group
Suadek CD. J Clin Endocrinol Metab 93: 2447–2453, 2008
International Expert Committee. Diabetes Care 32 (7):1327-1334, 2009
American Diabetes Association. Diabetes Care 34 (Suppl 1), 2011
The Role of Glycemic Testing
Use of A1C and Estimated Average
Glucose in Clinical Care

A Typical Patient Encounter circa 2008
“So, Mrs. Smith, it looks like
you have diabetes. Your
repeat fasting blood sugar
was 178, and as you recall
the first one was 187. A
glucose level over 126 is
classified as diabetes.”
In addition we measured your
hemoglobin A1c and this
level was also very high at
8.6%. Normal is less than
6%. Ideally we would like to
get it below 7%.”

A Typical Patient Response
“Um….what’s a hemoglobin
A1c…?
“Whatever you said? I do
recall that my hemoglobin
level was low when I was
pregnant.
“And what were those other
numbers?
“What do you mean, 7%...of
what?”
G
G
G
GG
GGG
G
= __%G
G
G
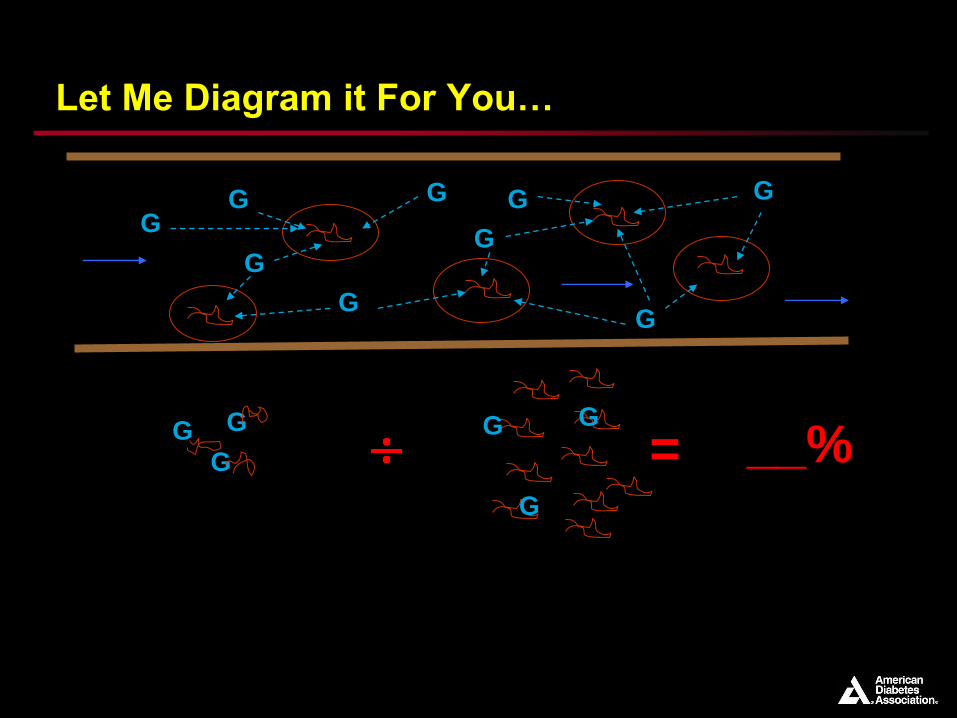
Let Me Diagram it For You…
G
G
G

The Concept of Average Glucose
• The Clinical Dilemma
– HbA1c: useful for research, risk prediction, target of therapy
– Well standardized measurement
– HOWEVER, difficult to explain to patients
• Clinical Utility of HbA1C
– We work to tell patients what the HbA1c represents…but concept of
% is difficult
– Glucose levels are familiar to patients from SMBG and lab
– Does the HbA1c test in fact represent an average glucose?

Historical Studies Examining Relationship
Between HbA1c and Mean Glucose
Study Year CohortStudy period
(weeks)SMBG tests/pt over 1-3 months
Svendsen 1982 Type 1 (n=15) 5 200-300
Nathan 1984 Type 1 (n=21) 8 200-300
DCCT 2002 Type 1 (n=1439) 12 7
Hempe 2002 Type 1 (n=128) 4 80
Murata 2004 Type 2 (n=182) 8 180
Nathan 2007Type 1 (n=22)
3 non-diabetes12
24,000(CGMS)
Need for systematic study of relationship between A1C and average glucose

Complications Risk in DiabetesThe Impact of Intensive Glycemic Control
0
2
4
6
8
6 7 8 9 10 11 12Hemoglobin A1c
Rela
tiv
e R
isk
of
Co
mp
licati
on
s
DM Kendall. International Diabetes Center
Adapted from: Skyler JS. Endocrinol Metab Clin North Am. 1996 Jun;25(2):243-54.
DCCT Study Group. N Engl J Med 329:977, 1993. UKPDS 35. Stratton IM. BMJ 321:405-412, 2000.
120 150 80 210 240 70 300Glucose

A1C Derived Average Glucose (ADAG)
International Study:

A1C Derived Average Glucose (ADAG) Study:
Objectives and Study Participants
To determine the mathematical relationship between HbA1c and
average glucose level
• To establish that the relationship is valid across:
– Diabetes types
– A wide range of HbA1c levels and age
– Across different population groups/ethnicities
• Recruitment of:
– Both type 1 and type 2 diabetes, as well as healthy volunteers
– Distribution by ethnicity and HbA1c (4-6.5%, 6.6-8.5%, >8.5%)
• Exclusion criteria
– Any condition that may interfere with measurement of A1c or glucose
ADAG Study Group. Diabetes Care 31:1473–1478, 2008

A1C Derived Average Glucose (ADAG) Study:
Measurements of Glycemia
• Continuous glucose monitoring
– Calibrated by 8-point glucose profiles
• Self monitored blood glucose (7-point profiles)
– 3 days per week
• HbA1c at baseline and monthly
– Utilizing DCCT-aligned assay in a central laboratory
ADAG Study Group. Diabetes Care 31:1473–1478, 2008
Total Enrolled 661
Eliminated from analysis 154 (23%)
Dropped out or excluded 91 (14%)
Inadequate CGM 11 (2%)
Inadequate HbA1c sample 52 (8%)

A1C Derived Average Glucose (ADAG) Study:
Baseline Participant Characteristics
Type 1 Type 2 Non-diabetes Total
Number 268 159 80 507
Age 43 + 13 56 + 9 40 + 14 46 + 14
Gender (% F) 52% 50% 69% 54%
Race/Ethnicity
White 93% 73% 71% 83%
African/Af-Am 2% (5) 13% (21) 15% (12) 8% (38)
Hispanic 6% (15) 8% (12) 15% (12) 8% (39)
Treatment
Pump 47%
MDI 53%
Diet only 10%
Oral agent only 52%
Insulin only 19%
Insulin & oral 19%
ADAG Study Group. Diabetes Care 31:1473–1478, 2008

A1C Derived Average Glucose (ADAG) Study:
Glucose Monitoring and Analysis
• CGM - mean of ~ 2,400 measurements per subject
• SMBG ~ mean of 300 measurements per subject
– Mean of ~ 25 measurements/wk. goal was minimum of 21 tests per week
– Total ~ 2,700 measurements/subject during 12 weeks
• Analysis
– CGM results corrected by factor of 1.05
– Glucose measure weighted in proportion to the inverse of total number of
measurements on that day
– Arithmetic mean glucose calculated for each subject
– Linear and quadratic regression used to estimate relationship
• More than 90% of individual subjects’ AG must fall within +/- 15% of
study wide calculated AG
ADAG Study Group. Diabetes Care 31:1473–1478, 2008

ADAG Study Group. Diabetes Care 31:1473–1478, 2008
Average Glucose (mg/dl) = 28.7 x HbA1c – 46.7
R2 = 0.84
P < 0.0001
A1C Derived Average Glucose (ADAG) Study:
Results
> 90% of cohort
Values fall
within + 15%
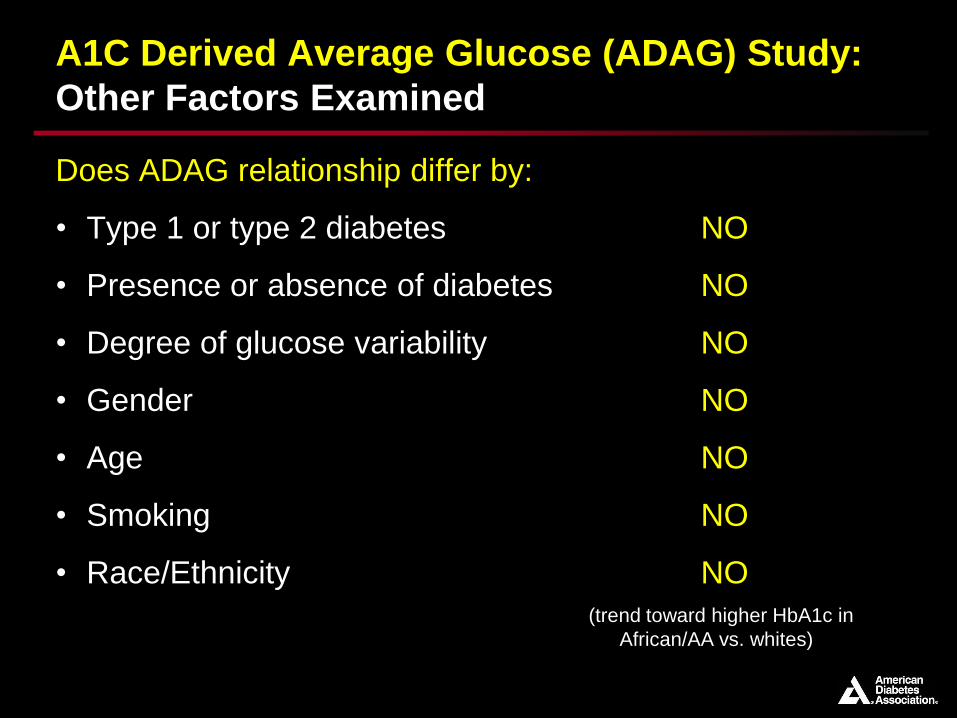
A1C Derived Average Glucose (ADAG) Study:
Other Factors Examined
Does ADAG relationship differ by:
• Type 1 or type 2 diabetes
• Presence or absence of diabetes
• Degree of glucose variability
• Gender
• Age
• Smoking
• Race/Ethnicity
NO
NO
NO
NO
NO
NO
NO
(trend toward higher HbA1c in
African/AA vs. whites)
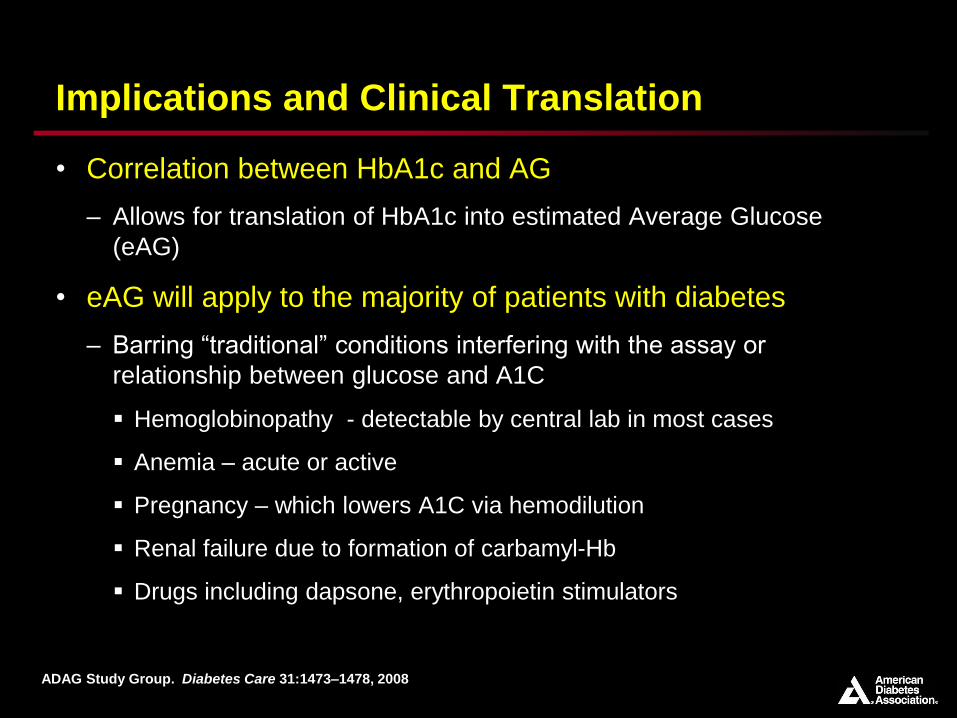
Implications and Clinical Translation
• Correlation between HbA1c and AG
– Allows for translation of HbA1c into estimated Average Glucose
(eAG)
• eAG will apply to the majority of patients with diabetes
– Barring “traditional” conditions interfering with the assay or
relationship between glucose and A1C
Hemoglobinopathy - detectable by central lab in most cases
Anemia – acute or active
Pregnancy – which lowers A1C via hemodilution
Renal failure due to formation of carbamyl-Hb
Drugs including dapsone, erythropoietin stimulators
ADAG Study Group. Diabetes Care 31:1473–1478, 2008
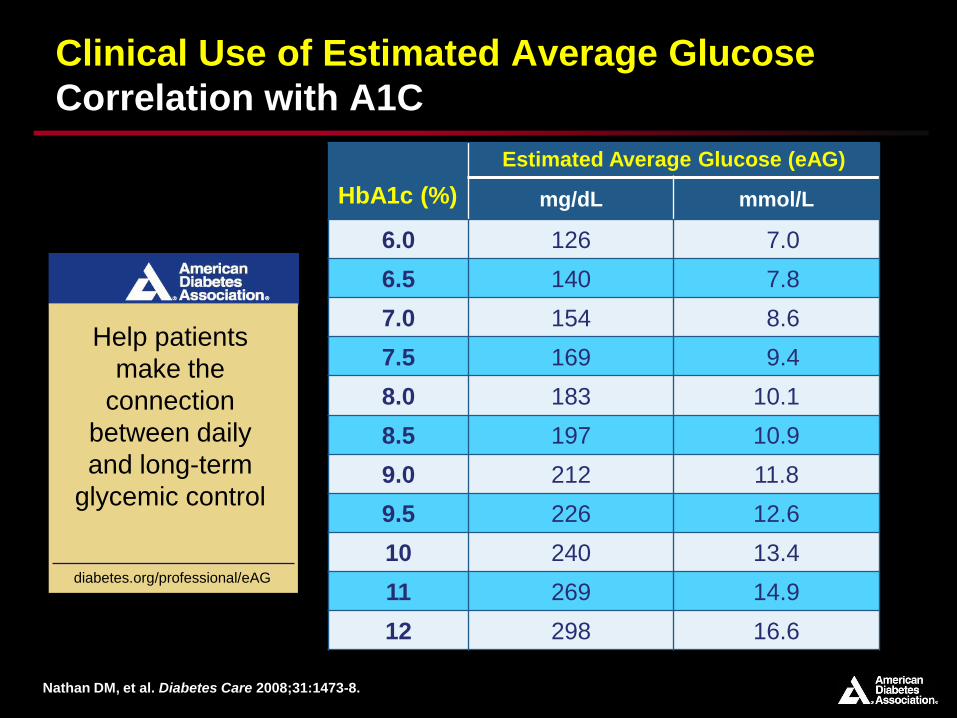
Clinical Use of Estimated Average Glucose
Correlation with A1C
Nathan DM, et al. Diabetes Care 2008;31:1473-8.
Help patients
make the
connection
between daily
and long-term
glycemic control
diabetes.org/professional/eAG
HbA1c (%)
Estimated Average Glucose (eAG)
mg/dL mmol/L
6.0 126 7.0
6.5 140 7.8
7.0 154 8.6
7.5 169 9.4
8.0 183 10.1
8.5 197 10.9
9.0 212 11.8
9.5 226 12.6
10 240 13.4
11 269 14.9
12 298 16.6

What Won’t Change…
And What’s New
• Clinical use of A1C
– No change in the standardized HbA1c assay
– eAG now added as an educational tool for patients, families, and
providers
– Links SMBG to A1C values – motivates and educates patients on
impact of daily blood glucose and overall glycemic control
• The “new” HbA1C assay report
– New standardized assay worldwide implemented worldwide (2009)
– Reporting % as currently used (DCCT values)
IFCC units reported in mmol HbA1c/mol Hb
eAG also reported in most laboratories (as mg/dl or mM)

Standardizing the HbA1C Report
The Era of IFCC and NGSP
IFCC HbA1c (mmol/mol)
NGSP HbA1c(%)
eAG(mg/dL)
eAG(mmol/l)
31 5 97 5.4
42 6 126 7.0
53 7 154 8.6
64 8 183 10.2
75 9 212 11.8
86 10 240 13.4
97 11 269 14.9
108 12 298 16.5
IFCC Working Group on Standardization of HbA1c. Clin Chem 2008; 54(8): 1379-8

Resources for Estimated Average Glucose
from the American Diabetes Association
• Provider education and materials
– Scientific Sessions, Post Graduate Course and other meetings
– eAG calculator (handheld by request and professional.diabetes.org)
• Patient education information
– Diabetes.org
– Diabetes Forecast, pamphlets and brochures
diabetes.org/living-with-diabetes/treatment-and-care
professional .diabetes.org/GlucoseCalculator.aspx

Resources for Estimated Average Glucose
from the American Diabetes Association
diabetes.org/living-with-diabetes/treatment-and-care
professional .diabetes.org/GlucoseCalculator.aspx

A Typical Patient Encounter circa 2011
“So, Mrs. Smith, it looks like you do have diabetes. Your average blood sugar is around 200. When people don’t have diabetes, this number is below 125.
We need to work with you to try to get this number, the average glucose, down below 150 over the next few months with some weight loss, exercise, and a medication. Let’s talk some more about what you can do…”

Complications Risk in DiabetesThe Impact of Intensive Glycemic Control
0
2
4
6
8
6 7 8 9 10 11 12Hemoglobin A1c
Rela
tiv
e R
isk
of
Co
mp
licati
on
s
DM Kendall. International Diabetes Center
Adapted from: Skyler JS. Endocrinol Metab Clin North Am. 1996 Jun;25(2):243-54.
DCCT Study Group. N Engl J Med 329:977, 1993. UKPDS 35. Stratton IM. BMJ 321:405-412, 2000.
126 154 183 212 240 269 298eAG – Glucose