Embed Size (px)
Citation preview
-A179 BgO BIOLOGICAL ENVIRONMENTAL ARCTC PROJECT CNNP) -1PRELIMINARY DATA (ARCTIC WEST SUMMER 1986 CRUISE)(U)NAVAL OCEAN SYSTEMS CENTER SAN DIEGO CA
UNLASIIE LPOA TAL NOV 86 NOSC/TO-i843 F/G 8/3 U
mhhhhmmmhmhu
V
1 3,2 2.
MICROCOPY RESOLUTION T EST[
CHART ' ,
NAII(INA L BUREADl C}k STANDARDS 1961 A'
Z .° % %
z l
, .. ,, . . . . " ,, % ,, 7 w, % ;,' . ,. .. , ,.. ,..,........, ., ., . ,.. . ,,,...... t , -
:: -. .,, .,, .,.,.,. L ,. , .. o. o~o.. ,. , o,..o..., o.:,o: ,o,, °,.,o.,..,o,. i
Technical Document 1043November 1986
Biological Environmental ArcticProject (BEAP) Preliminary Data
00 (Arctic West Summer 1986 Cruise)00
DTIC David LapotaELECTE Stephen H. Lieberman
,MAY 0 6 •
ID
illOrtgtial continsz~ ezore-
P1&t*J AlL P .ft oduilKId" T U be &blI d
STA
Approved for public release, distribution isulmited
87 5 6 008
,44 ~ ~ iil * P J1, 1*1 N
NAVAL OCEAN SYSTEMS CENTER
San Diego, California 92152-5000
E. G. SCHWEIZER, CAPT, USN R. M. HILLYERCommander Technical Director i1
ADMINISTRATIVE INFORMATION
This work was performed by the Environmental Sciences Division. Code 52.Naval Ocean Systems Center. for Director. Arctic Submarine Laboratory.
Released by Under authority ofE.J. Wesley. Head S. Yamamoto. HeadRadiation Physics Branch Environmental Sciences
Division
JG
W V-
UNCLASSIFIED '.SECURITY CLASSIFICAnON OF THIS PAGE
REPORT DOCUMENTATION PAGEI. REPORT SECURITY CLASSIFICATION lb RESTRICTIVE MARKINGS
UNCLASSIFIED
2, SECURITY CLASSIFICATION AUTHORITY 3 DISTRIBUTION/AVAILABIUTY OF REPORT
2b DECLASSIFICATION DOWNGRADING SCHEDULE Approved for public release; distribution is unlimited.
4 PERFORMING ORGANIZATION REPORT NUMBERIS) S MONITORING ORGANIZATION REPORT NUMBER(S)
TD 1043
6. NAME OF PERFORMING ORGANIZATION Eb OFFICE SYMBOL 7a NAME OF MONITORING ORGANIZATION0S spohO6,4
Naval Ocean Systems Center Code 524
6c ADDRESS rC'.c SIN,. ond ZIP Cod. 7b ADDRESS (City Stt. nd ZIP Code)
San Diego, CA 92152-5000
8a NAME OF FUNDING, SPONSORING ORGANIZATION Bb OFFICE SYMBOL 9 PROCUREMENT INSTRUMENT IDENTIFICATION NUMBERI Of .pphcbblejt .,.
Director, Arctic Submarine Laboratory Code 19
8c ADDRESS ICty Slte end ZIP Cede! 10 SOURCE OF FUNDING NUMBERSPROGRAM ELEMENT NO PROJECT NO TASK NO AGENCY
ACCESSION NO
Sai Diego, CA 92152-5000 OMN SUBPAC SUBPAC DNO88 580
I I TITLE nddc. S..... C,.sphe, ,on
Biological Environmental Arctic Project (BEAP) Preliminary Data (Arctic West Summer 1986 Cruise)12 PERSONAL AUTHORS) *
David Lapota and Stephen H. Lieberman
1 3. TYPE OF REPORT 13b TIME COVERED 14 DATE OF REPORT lYe, Month. OCFI 15 'PAGE COUNT
lnterim FROM Sep 86 Oct 86 November 1986 11216 SUPPLEMENTARY NOTATION
17 COSATI CODES 18 SUBJECT TERMS (Cofflnue on reversed nossw.v and ,dentft by block nu,,Ibs/
FIELD GROUP SUB-GROUP ,BioluminescenceTransmissometry
19 ABSTRACT /Conr na on rversed necessory nd ,donvfv by block nunb /
'The Biological Environmental Arctic Project measured in situ bioluminescence and transmissometry to establishcorrelates for a predictive model of bioluminescence in near-surface arctic waters. Data were collected during Arctic WestSummer 1986 from USCG POLAR STAR (WAGB 10). .
%.
J.2
20ODISTRIBUTION AVAILABILIT"Y OF ABSTRACT 21 ABSTRACT SECURITY CLASSIFICATION
C]UNCLASSIFIED UNLIMITED SAME AS RPT C] DTIC USERS UNCLASSIFIED
David Lapota (619) 225-7876 Code 524
DD FORM 1473, 84 JAN 53 APR EDITION MAY BE USED UNTIL EXHAUSTED UNCLASSIFIEDALL OTHER EDITIONS ARE OBSOLETE t
SECURIY CLASSIFICATION OF THS PAGE
•%%. %~J

UNCLASSIFIED
SECURITY CLASSiCICATOC OO THHS PAGE (Wham Dnate 3iae
.- &
N
D4..M 43 8 AUNCASIFI..I
S[.RT ;Ar. 1kOt O=
II PG[Ihi ~ [ ee)i
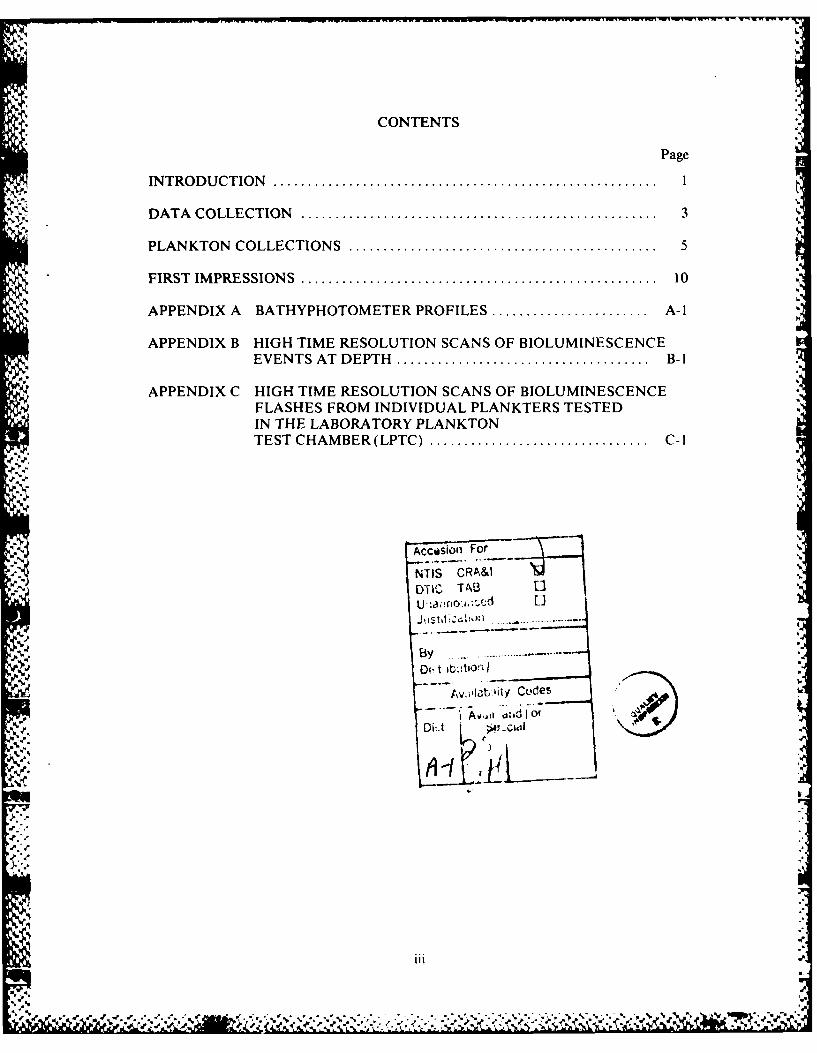
CONTENTS
Page
IN TRO D U CTIO N ........................................................ 1
DATA COLLECTION .................................................... 3
PLANKTON COLLECTIONS ............................................. 5
FIRST IMPRESSIONS ............................................. 10
APPENDIX A BATHYPHOTOMETER PROFILES ....................... A-I
APPENDIX B HIGH TIME RESOLUTION SCANS OF BIOLUMINESCENCEEVENTS AT DEPTH ..................................... B-i
APPENDIX C HIGH TIME RESOLUTION SCANS OF BIOLUMINESCENCEFLASHES FROM INDIVIDUAL PLANKTERS TESTEDIN THE LABORATORY PLANKTONTEST CHAMBER (LPTC) ................................ C-I
- o . .............
By . . . . .. .
Av.4."t.'itY CodesC ol j d es9Oi-.t
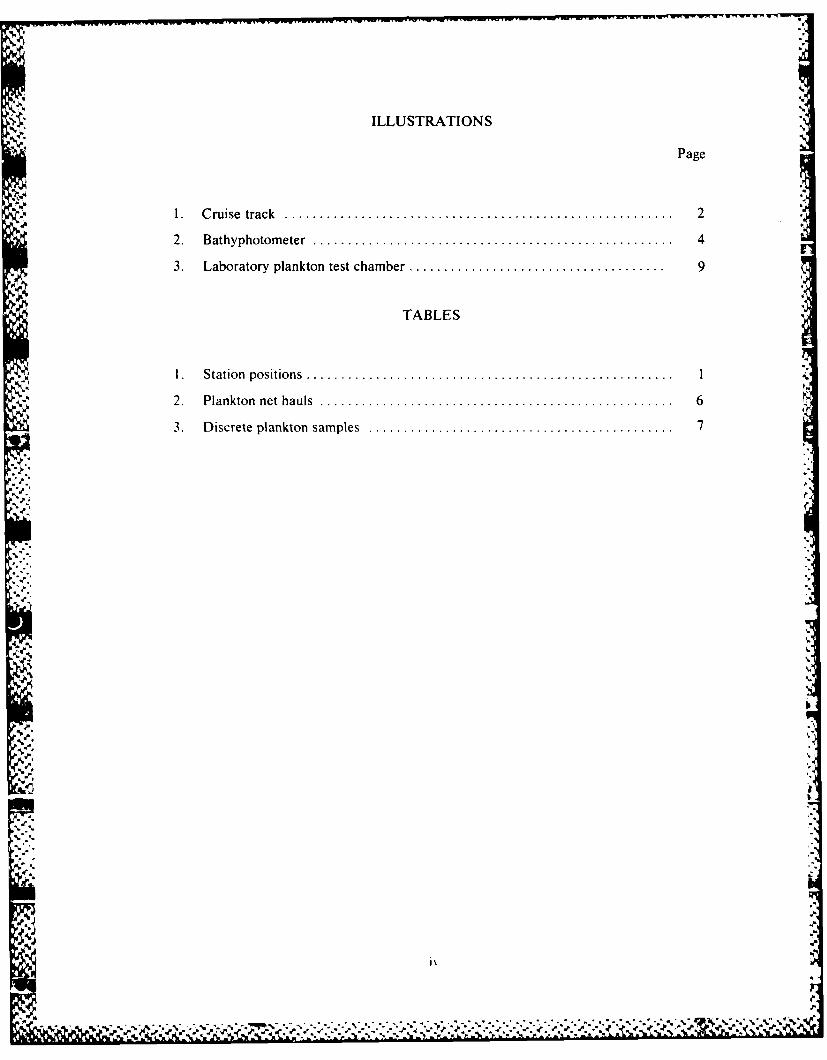
ILLUSTRATIONS
Page
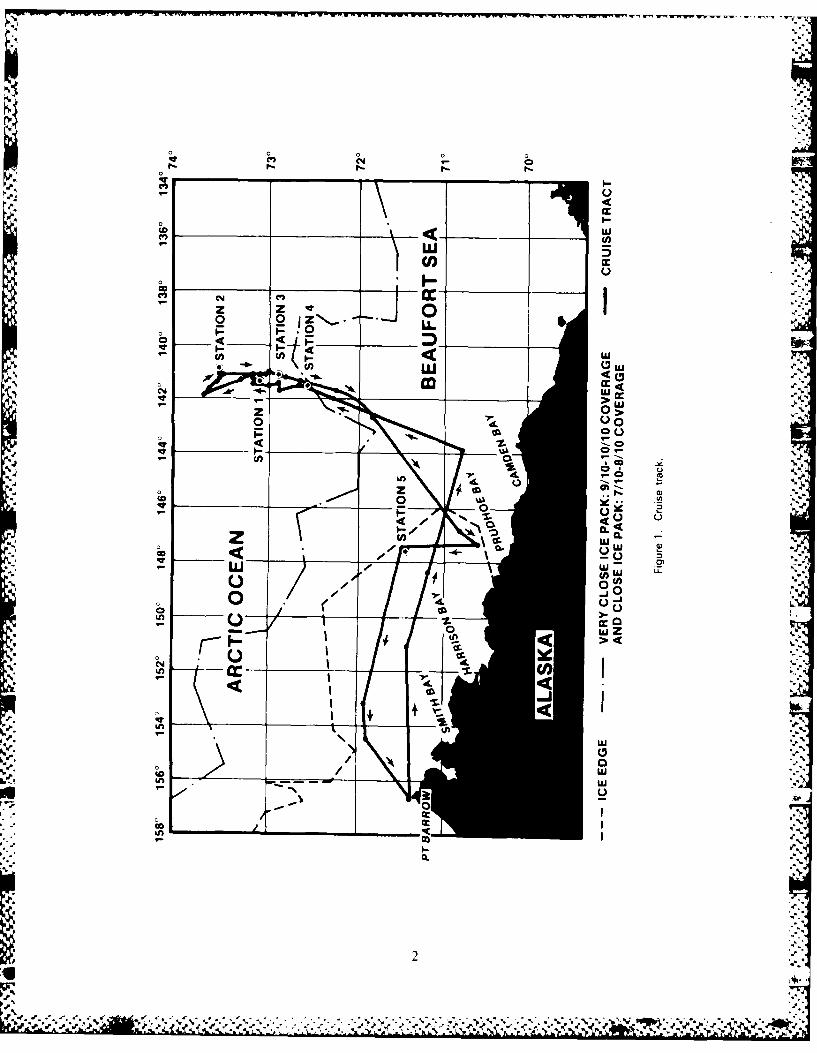
1 Cruise track ................................................... 2
2. B athyphotom eter .................................................... 4
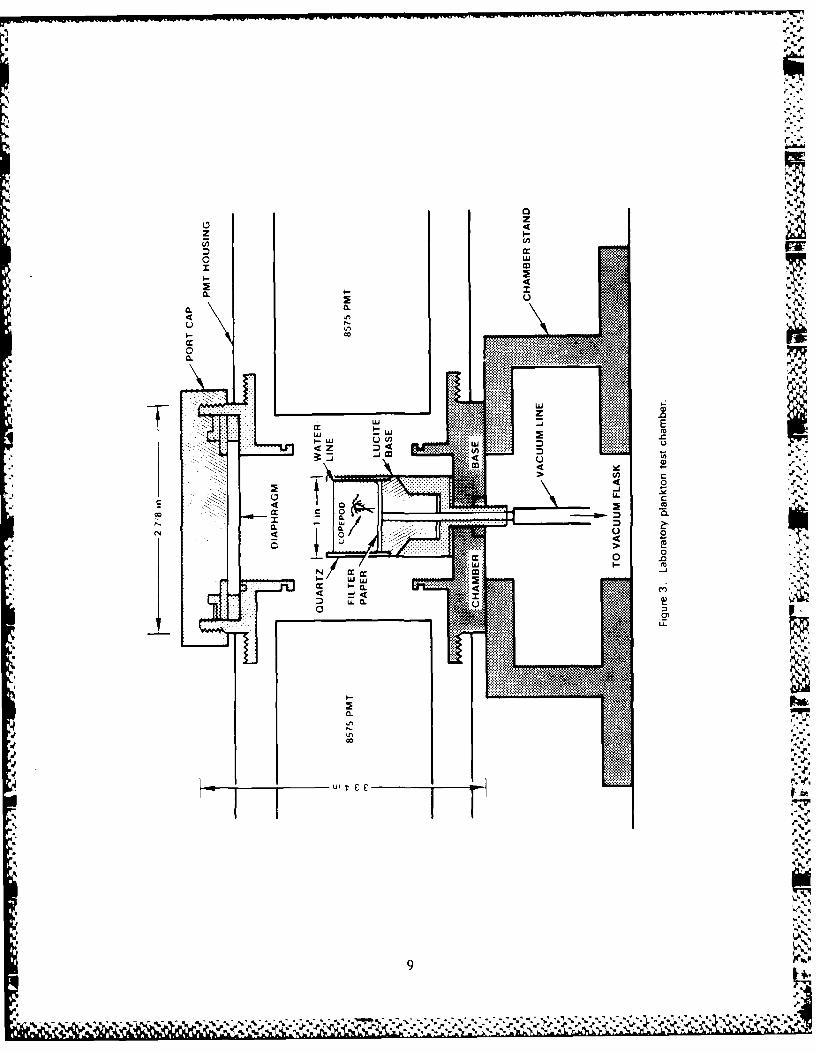
3. Laboratory plankton test chamber ..................................... 9
TABLES
I. Station positions .................................................... . I
2. Plankton net hauls ................................................... 6
3. D iscrete plankton sam ples ............................................ 7
j,-
C-.I
C.,
H. '.4
.C
'C C
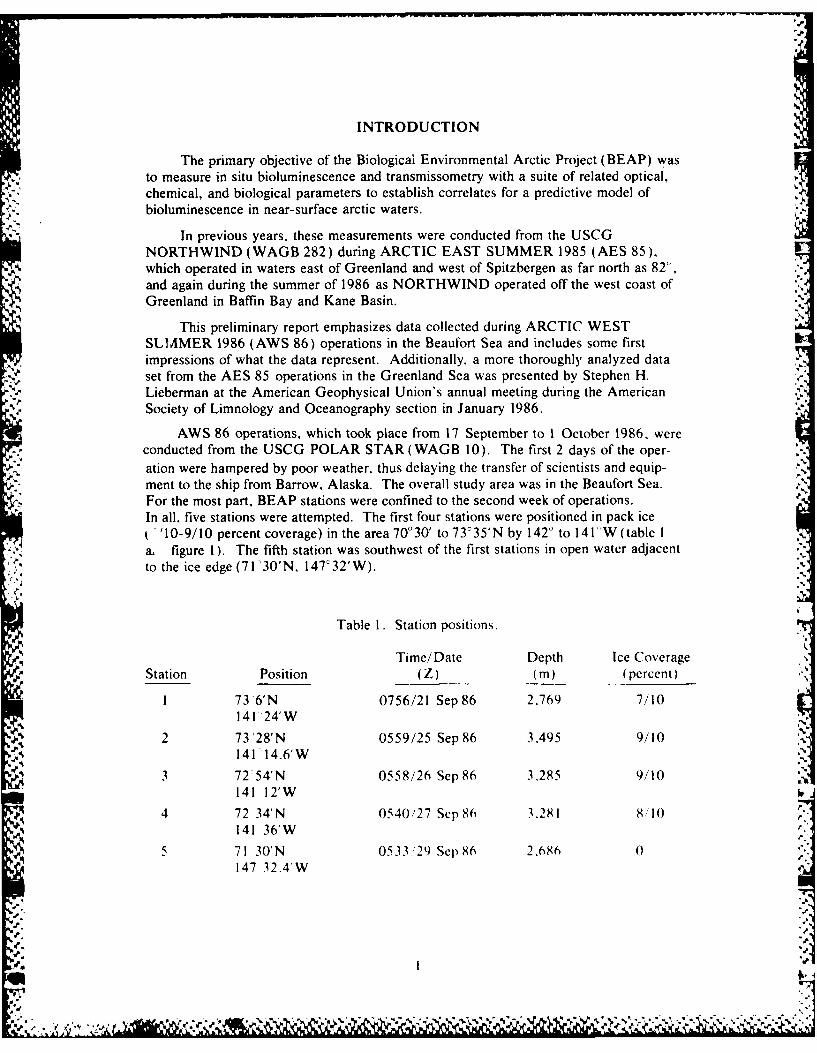
INTRODUCTION
The primary objective of the Biological Environmental Arctic Project (BEAP) wasto measure in situ bioluminescence and transmissometry with a suite of related optical,chemical, and biological parameters to establish correlates for a predictive model ofbioluminescence in near-surface arctic waters. -
In previous years, these measurements were conducted from the USCGNORTHWIND (WAGB 282) during ARCTIC EAST SUMMER 1985 (AES 85),which operated in waters east of Greenland and west of Spitzbergen as far north as 82',and again during the summer of 1986 as NORTHWIND operated off the west coast ofGreenland in Baffin Bay and Kane Basin.
This preliminary report emphasizes data collected during ARCTIC WESTSLIAMER 1986 (AWS 86) operations in the Beaufort Sea and includes some firstimpressions of what the data represent. Additionally. a more thoroughly analyzed dataset from the AES 85 operations in the Greenland Sea was presented by Stephen H.Lieberman at the American Geophysical Union's annual meeting during the AmericanSociety of Limnology and Oceanography section in January 1986.
AWS 86 operations, which took place from 17 September to 1 October 1986. wereconducted from the USCG POLAR STAR (WAGB 10). The first 2 days of the oper-ation were hampered by poor weather, thus delaying the transfer of scientists and equip-ment to the ship from Barrow. Alaska. The overall study area was in the Beaufort Sea.For the most part, BEAP stations were confined to the second week of operations.In all, five stations were attempted. The first four stations were positioned in pack ice
' "10-9/10 percent coverage) in the area 70030' to 73°35'N by 1420 to 141°W (table Ia. figure 1 ). The fifth station was southwest of the first stations in open water adjacentto the ice edge (71 '30'N, 147°32'W).
Table I. Station positions.
Time/Date Depth Ice CoverageStation Position (Z) (iM) (percent)
1 73 6'N 0756/21 Sep86 2.769 7/10141 '24'W
2 73 '28'N 0559/25 Sep 86 3,495 9/10141 '14.6'W
3 72 54'N 0558/26 Sep 86 3.285 9/10141 12'W
4 72 34'N 0540/27 Sep 86 3.281 8/10141 36'W
5 71 30'N 0533!29 Sep86 2.686 0147 32.4'W
, . ,"-
0 0 000
CM-
o
'u
z Z00 0 z -.
.00
0 ) 00L
z 0 >
o o
2 %
-II
IInS. W LU
co 0
40 0 LU L
0 0I_
In cc
Ln-In
DATA COLLECTION
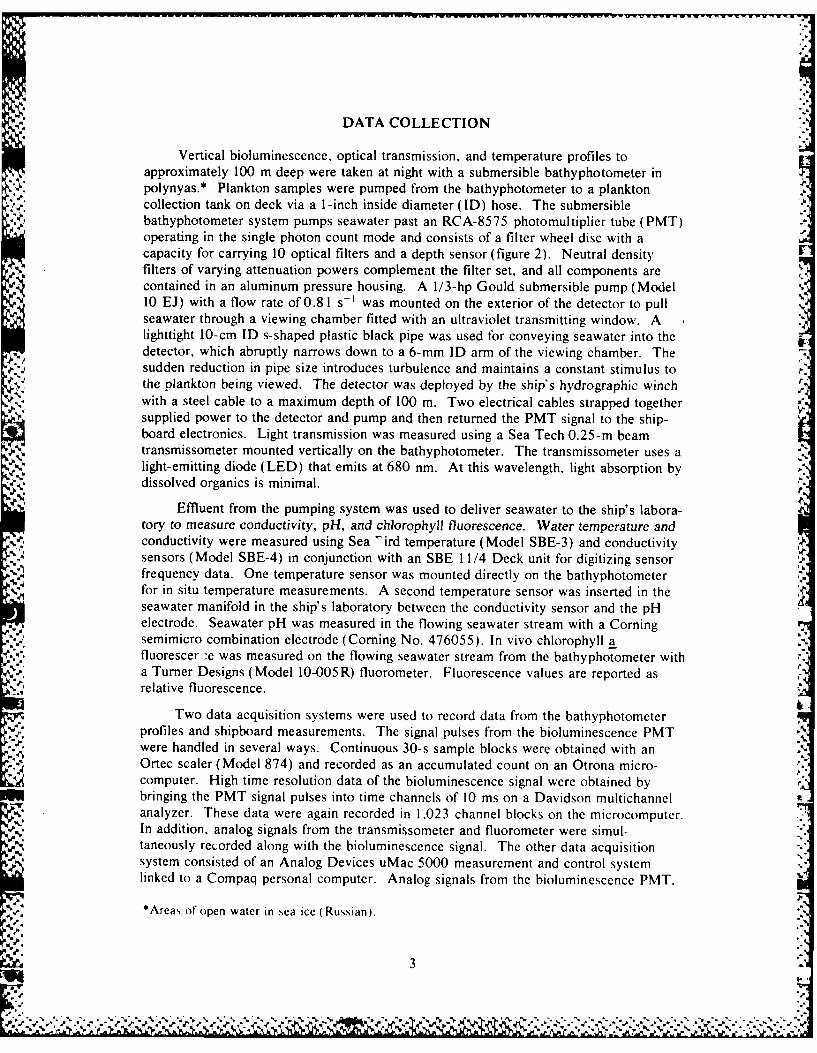
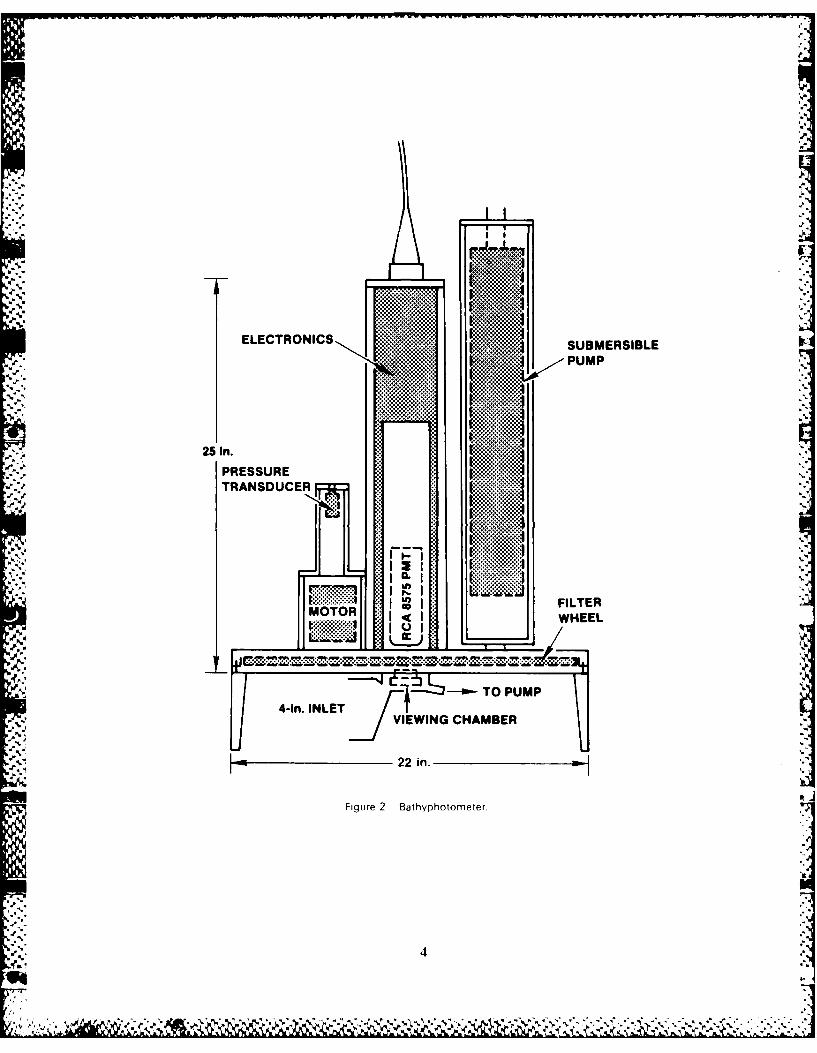
Vertical bioluminescence, optical transmission, and temperature profiles toapproximately 100 m deep were taken at night with a submersible bathyphotometer inpolynyas.* Plankton samples were pumped from the bathyphotometer to a planktoncollection tank on deck via a 1-inch inside diameter (ID) hose. The submersiblebathyphotometer system pumps seawater past an RCA-8575 photomultiplier tube (PMT)operating in the single photon count mode and consists of a filter wheel disc with acapacity for carrying 10 optical filters and a depth sensor (figure 2). Neutral densityfilters of varying attenuation powers complement the filter set, and all components arecontained in an aluminum pressure housing. A 1/3-hp Gould submersible pump (Model10 EJ) with a flow rate of 0.8 1 s- was mounted on the exterior of the detector to pullseawater through a viewing chamber fitted with an ultraviolet transmitting window. Alighttight 10-cm ID s-shaped plastic black pipe was used for conveying seawater into thedetector, which abruptly narrows down to a 6-mm ID arm of the viewing chamber. Thesudden reduction in pipe size introduces turbulence and maintains a constant stimulus tothe plankton being viewed. The detector was deployed by the ship's hydrographic winchwith a steel cable to a maximum depth of 100 m. Two electrical cables strapped togethersupplied power to the detector and pump and then returned the PMT signal to the ship-board electronics. Light transmission was measured using a Sea Tech 0.25-m beamtransmissometer mounted vertically on the bathyphotometer. The transmissometer uses alight-emitting diode (LED) that emits at 680 nm. At this wavelength, light absorption bydissolved organics is minimal.
Effluent from the pumping system was used to deliver seawater to the ship's labora-tory to measure conductivity, pH, and chlorophyll fluorescence. Water temperature andconductivity were measured using Sea -ird temperature (Model SBE-3) and conductivitysensors (Model SBE-4) in conjunction with an SBE 11/4 Deck unit for digitizing sensorfrequency data. One temperature sensor was mounted directly on the bathyphotometerfor in situ temperature measurements. A second temperature sensor was inserted in theseawater manifold in the ship's laboratory between the conductivity sensor and the pHelectrode. Seawater pH was measured in the flowing seawater stream with a Comingsemimicro combination electrode (Coming No. 476055). In vivo chlorophyll afluorescer :e was measured on the flowing seawater stream from the bathyphotometer witha Turner Designs (Model 10-005R) fluorometer. Fluorescence values are reported asrelative fluorescence.
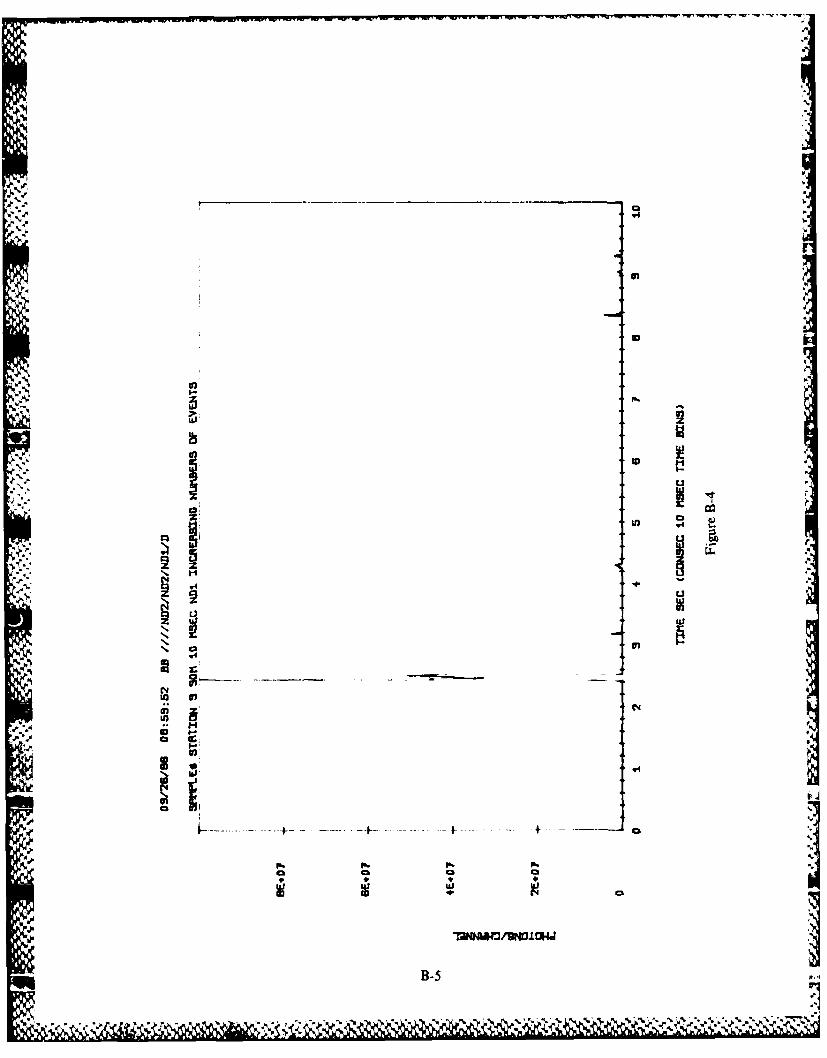
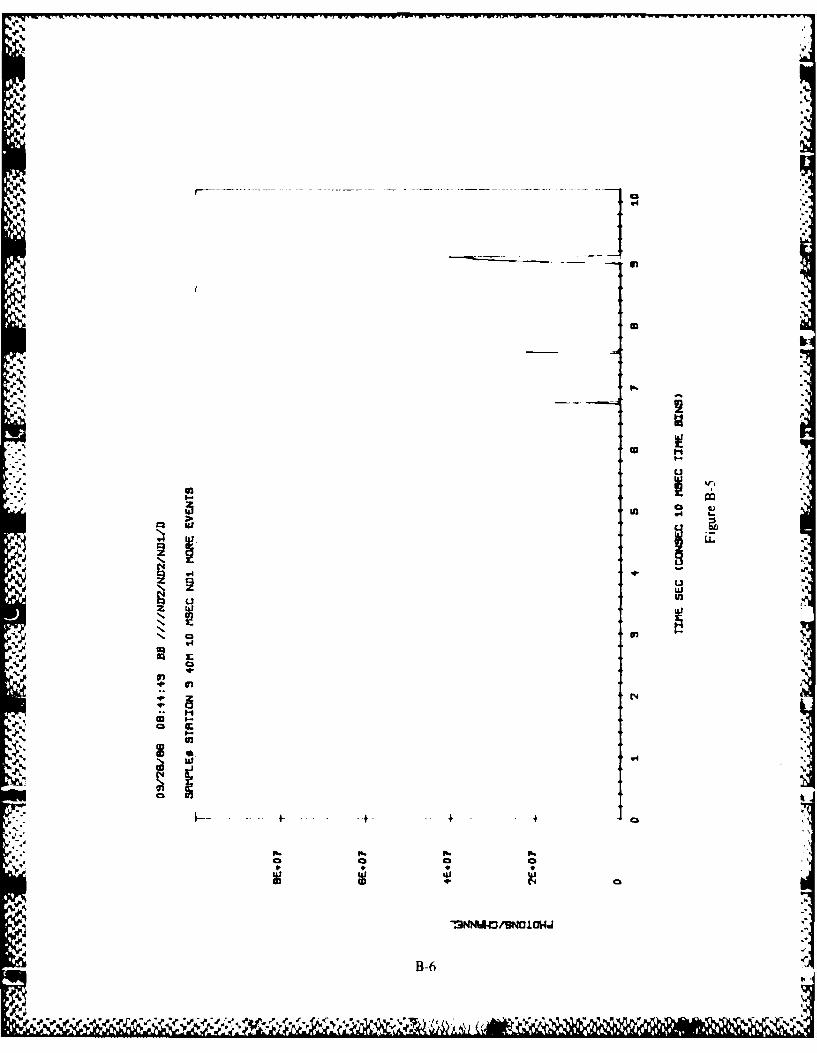
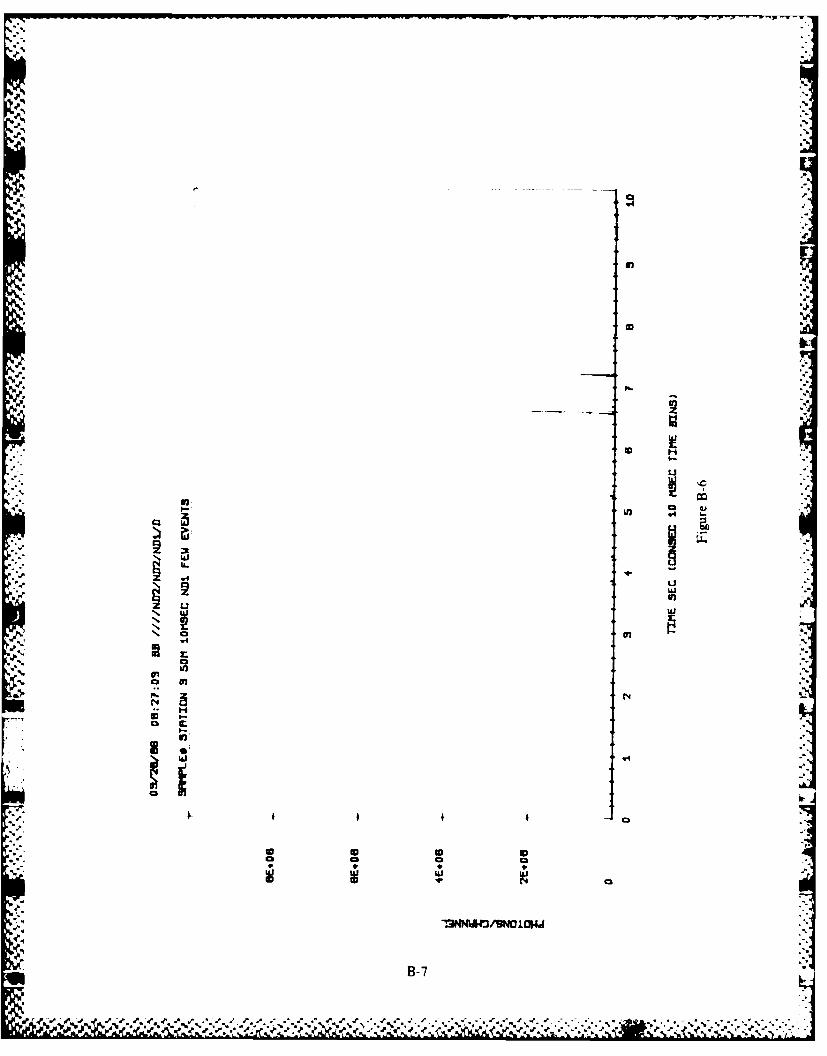
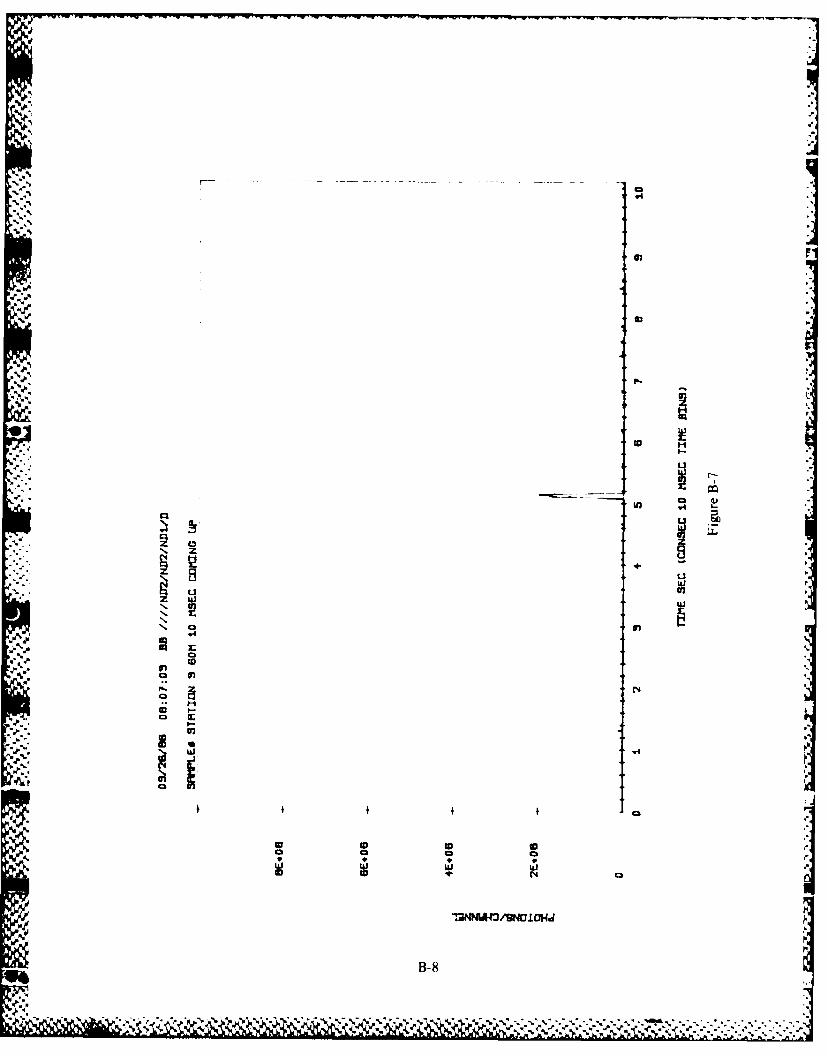
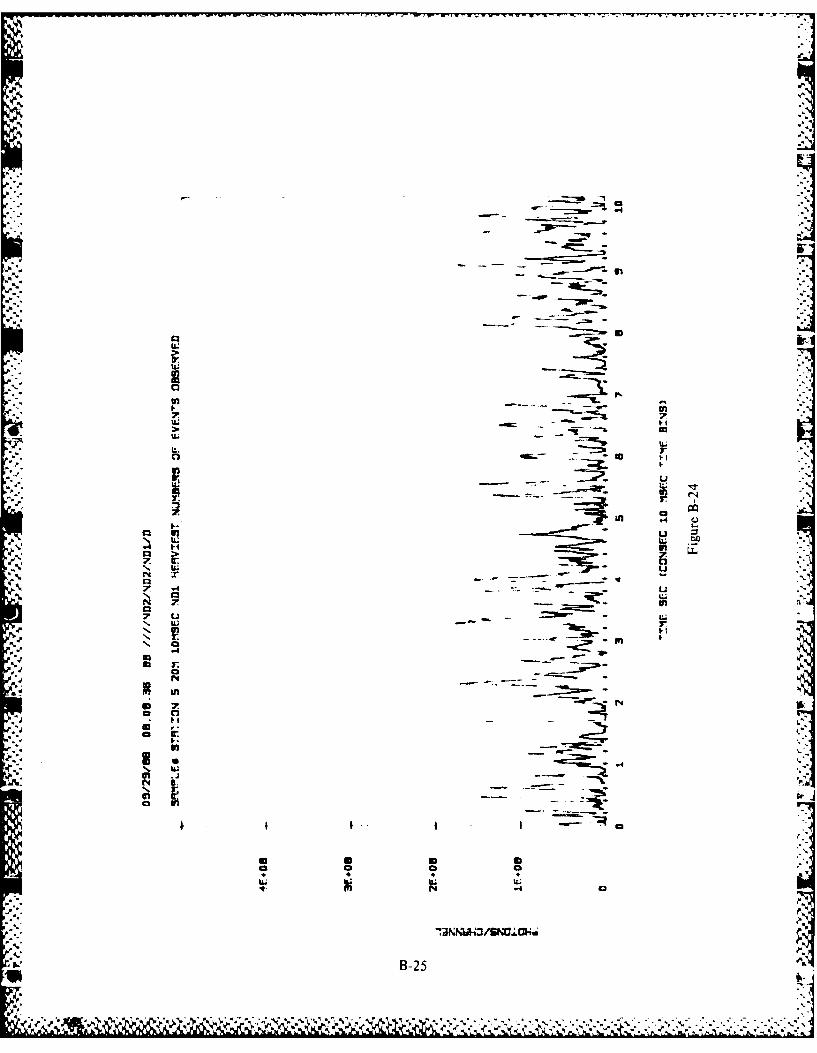
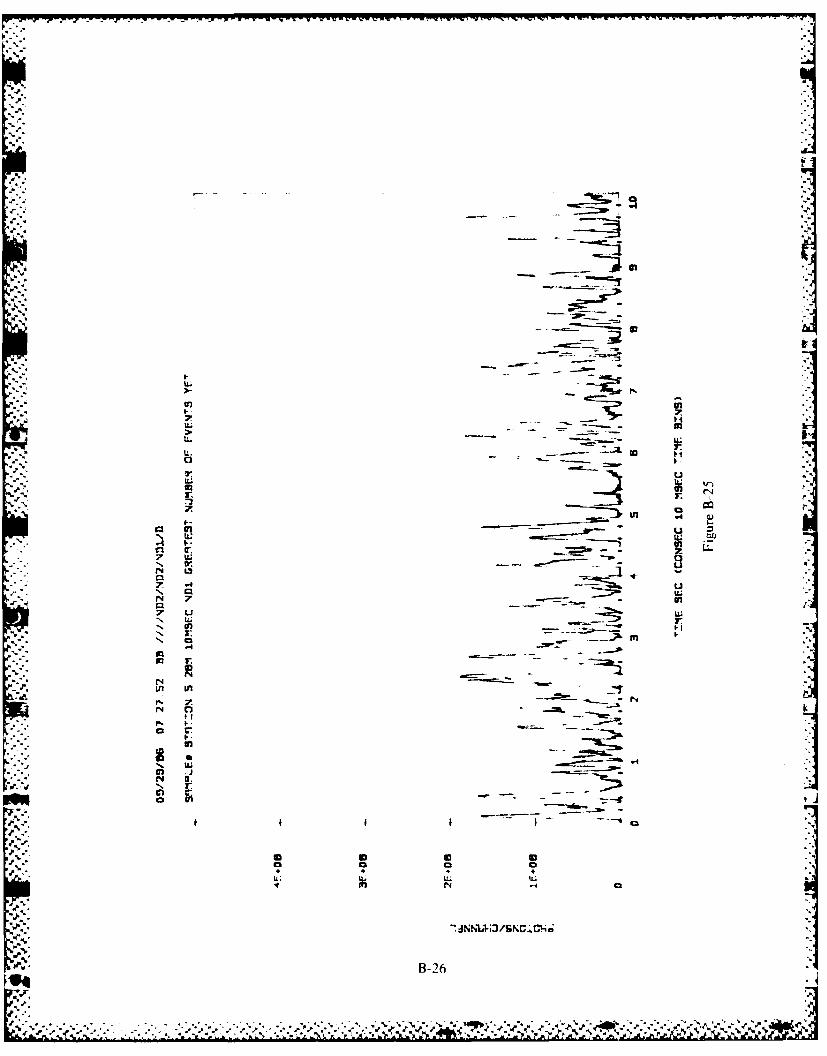
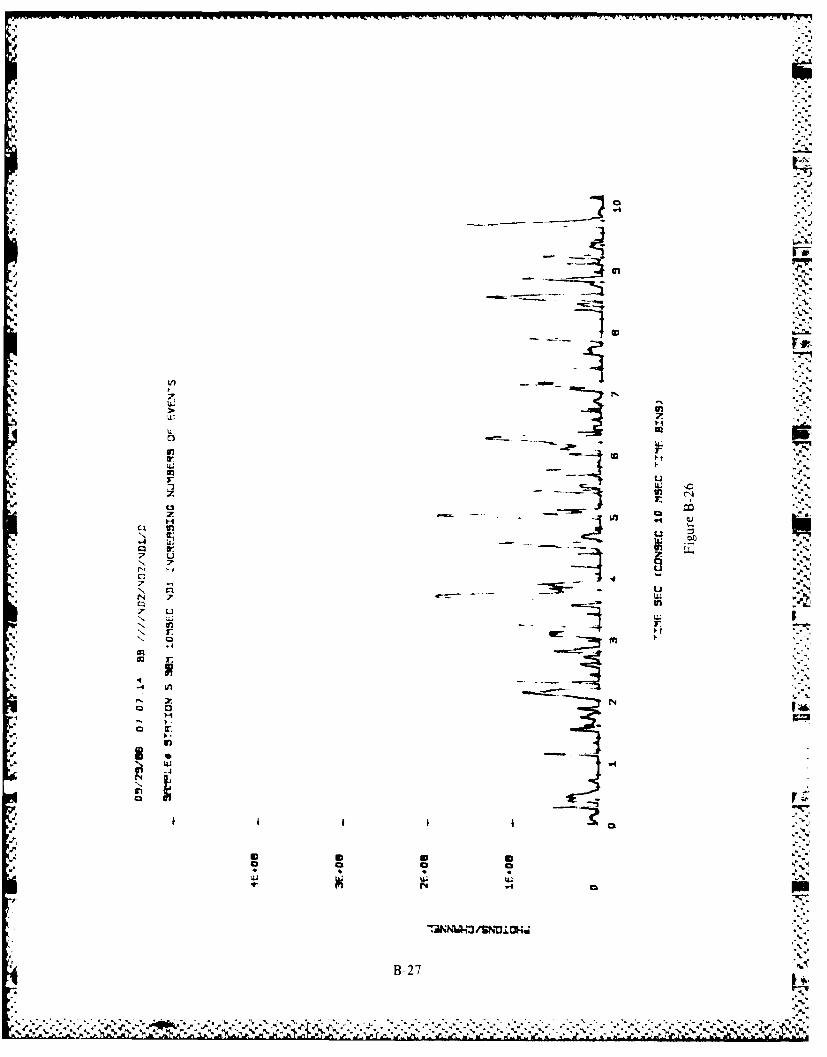
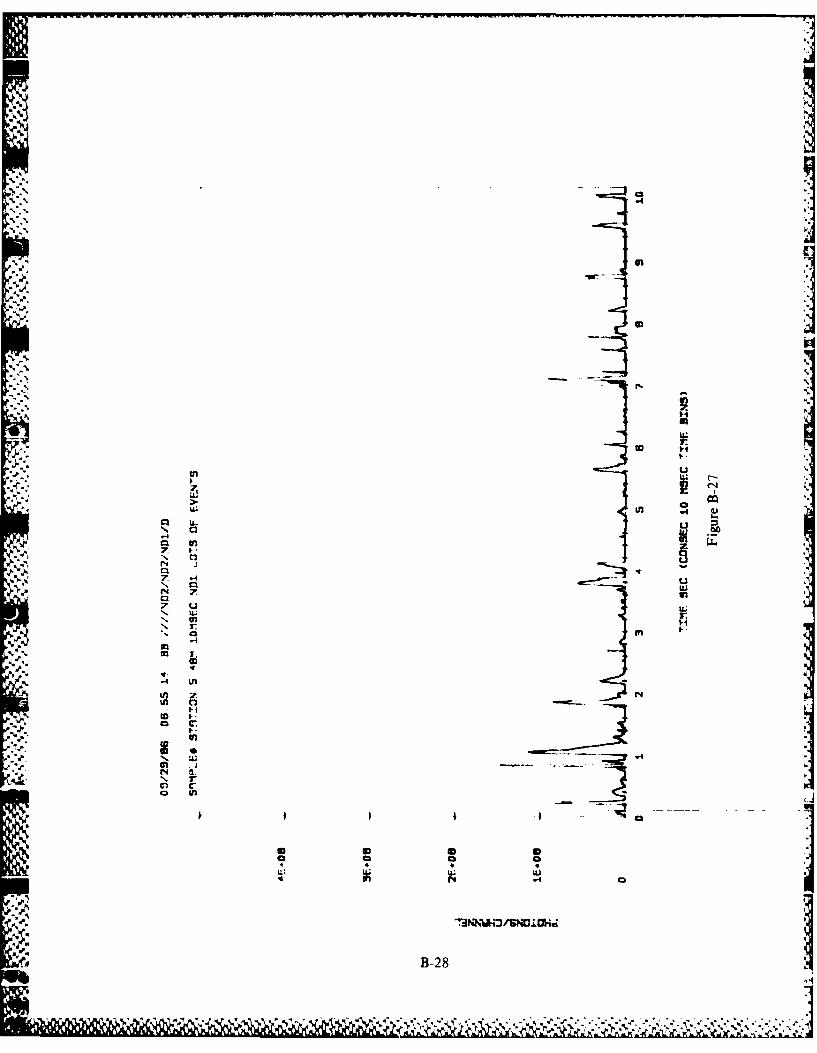
Two data acquisition systems were used to record data from the bathyphotometerprofiles and shipboard measurements. The signal pulses from the bioluminescence PMTwere handled in several ways. Continuous 30-s sample blocks were obtained with anOrtec scaler (Model 874) and recorded as an accumulated count on an Otrona micro-computer. High time resolution data of the bioluminescence signal were obtained bybringing the PMT signal pulses into time channels of 10 ms on a Davidson multichannelanalyzer. These data were again recorded in 1,023 channel blocks on the microcomputer.In addition, analog signals from the transmissometer and fluorometer were simul-taneously recorded along with the bioluminescence signal. The other data acquisitionsystem consisted of an Analog Devices uMac 5000 measurement and control systemlinked to a Compaq personal computer. Analog signals from the bioluminescence PMT.
*Areas of open water in sea ice (Russian).
3,qe
•
1. , a ::- N.ft _ A
J
ELECTRONICS SUBMERSIBLE b
*PUM
: . .... .....................
25 In.
" PRESSURE"- m"E .'/ " TRANSDUCER
ILI
ELECTRONICS .:: : .::*.:: SUBFILTERMOTOR
MMiiiii~ii! . M =7::7
:.-'2...
4-In. INLET T
22 in.
II
Figure 2 Bathyphotometer.
w %
y! I

it.
depth transducer. transmissometer, pH electrode. fluorometer signal, and fluorometerrange were sampled using an integrating analog to digital (A/D) board on the uMacprocessor and combined with digital signals from the temperature and conductivitysensors. During vertical profiling, a 2-s sampling rate was used and a bathyphotometerlowering rate of 8 m min corresponds to a vertical spatial sampling resolution of about
, 0.3 m.
,it" PLANKTON COLLECTIONSt.Q
The 1 -inch ID hose used for pumping plankton samples at depth to the shipboard-plankton collection tank separated from the pump at depth at stations 2 and 4. Discrete
plankton samples (40 1 ) at various depths were collected at stations 3 and 5. Severalvertical plankton net tows (1/2-m ring, 2-m length, 500-pm net, and collection cupporosity netting) accompanied each of the five stations either from 300 m-0 and/or
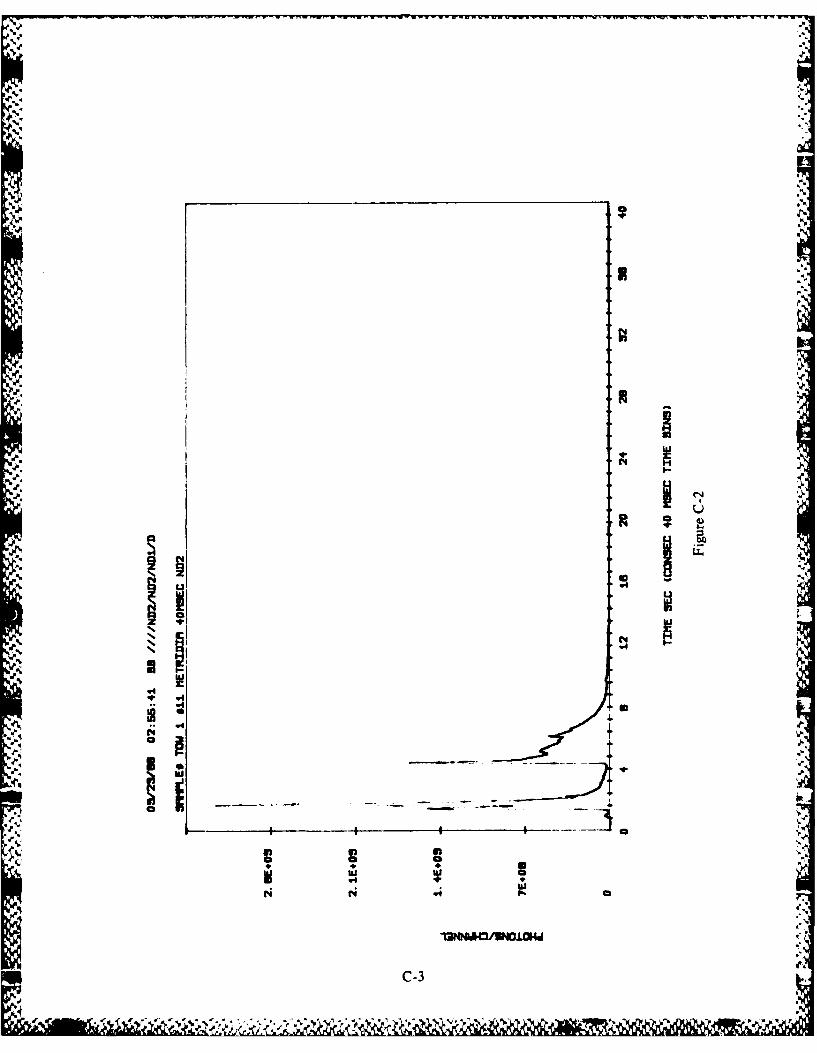
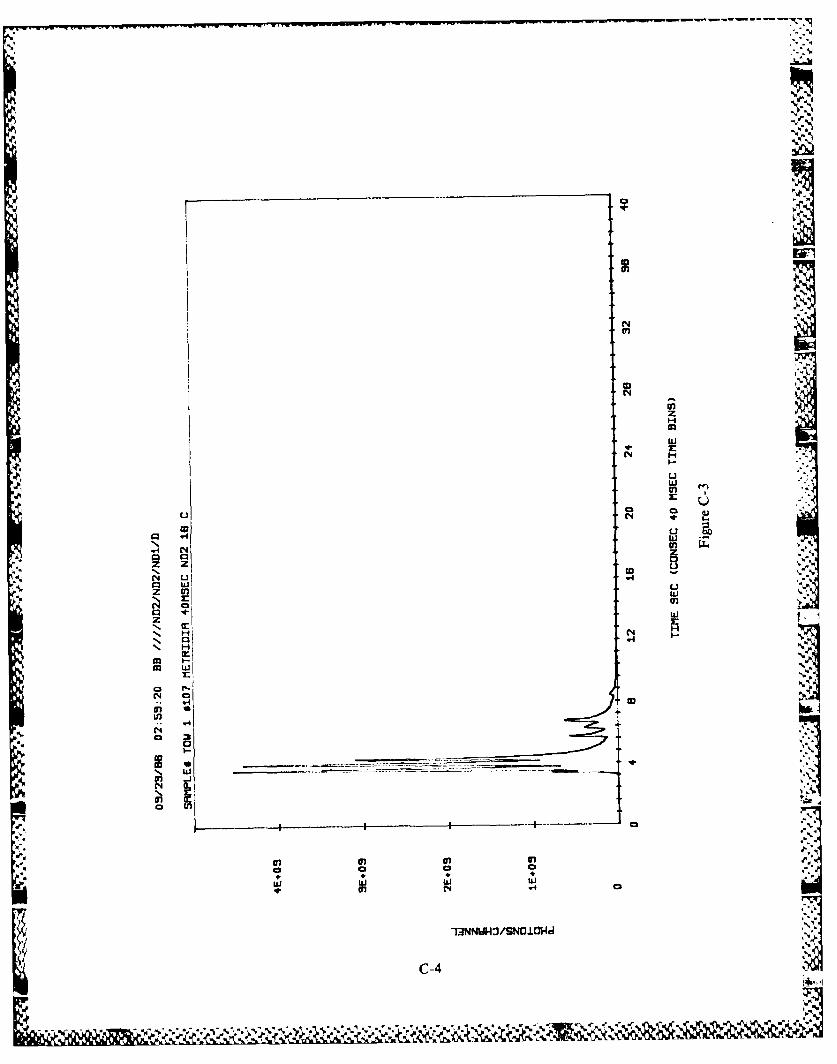
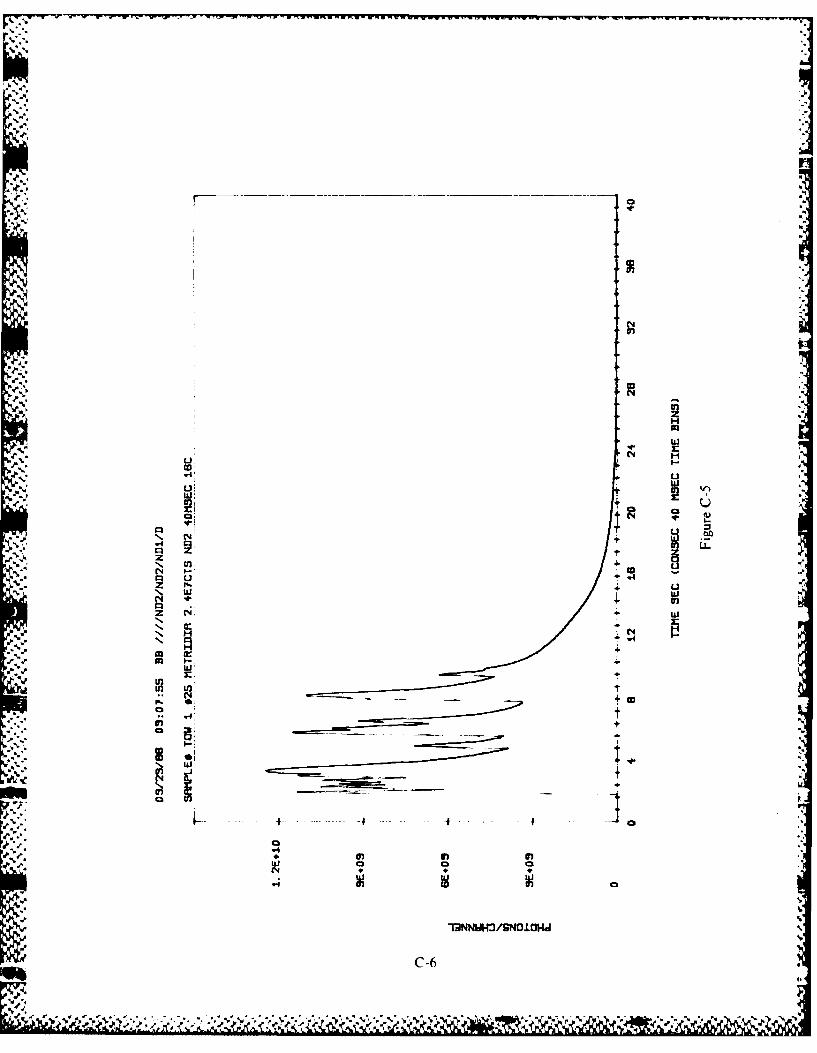
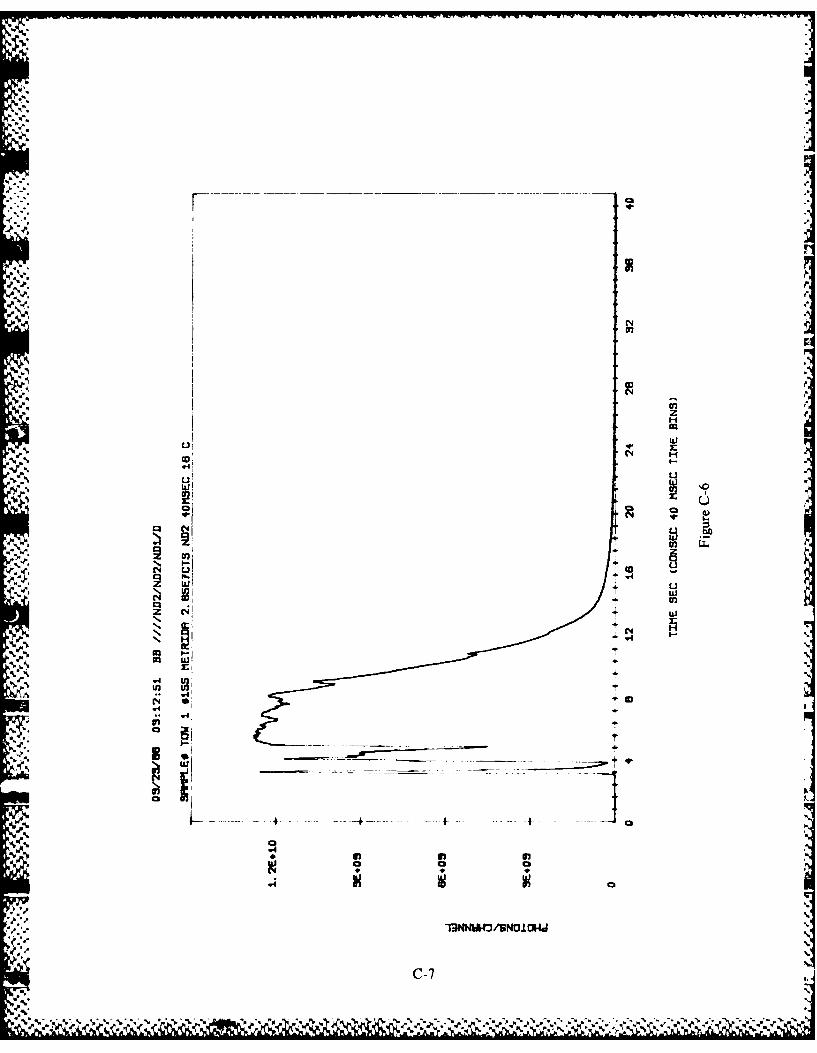
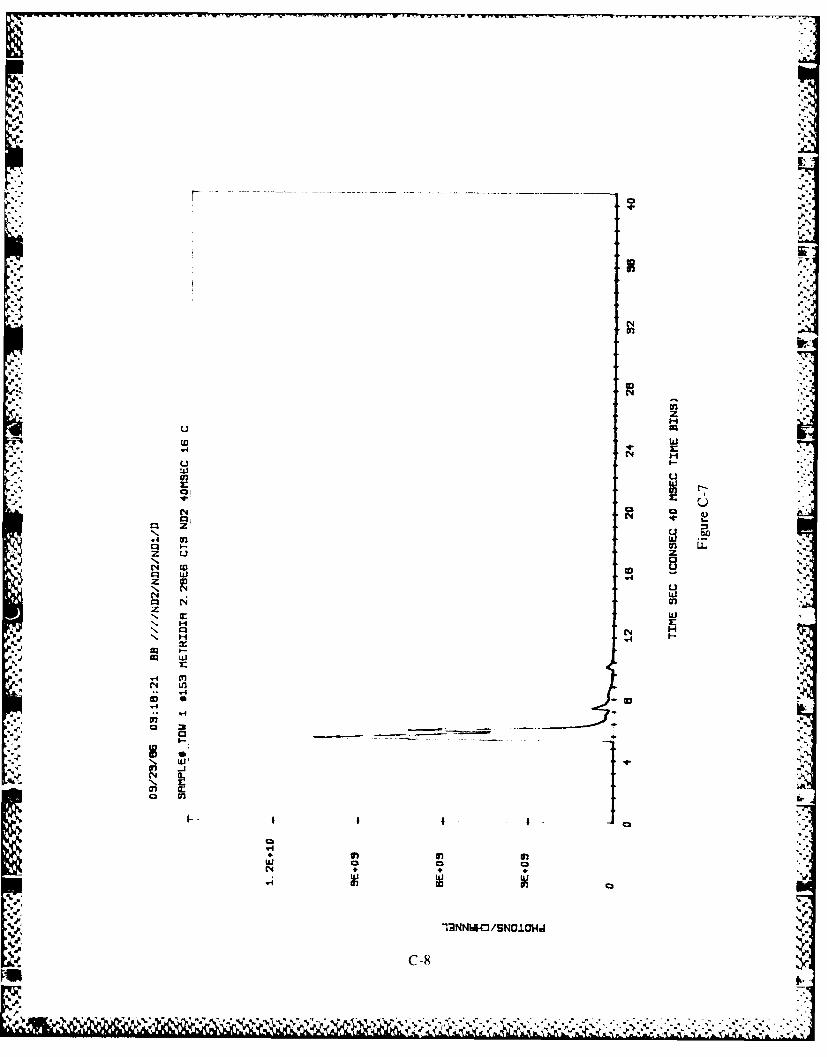
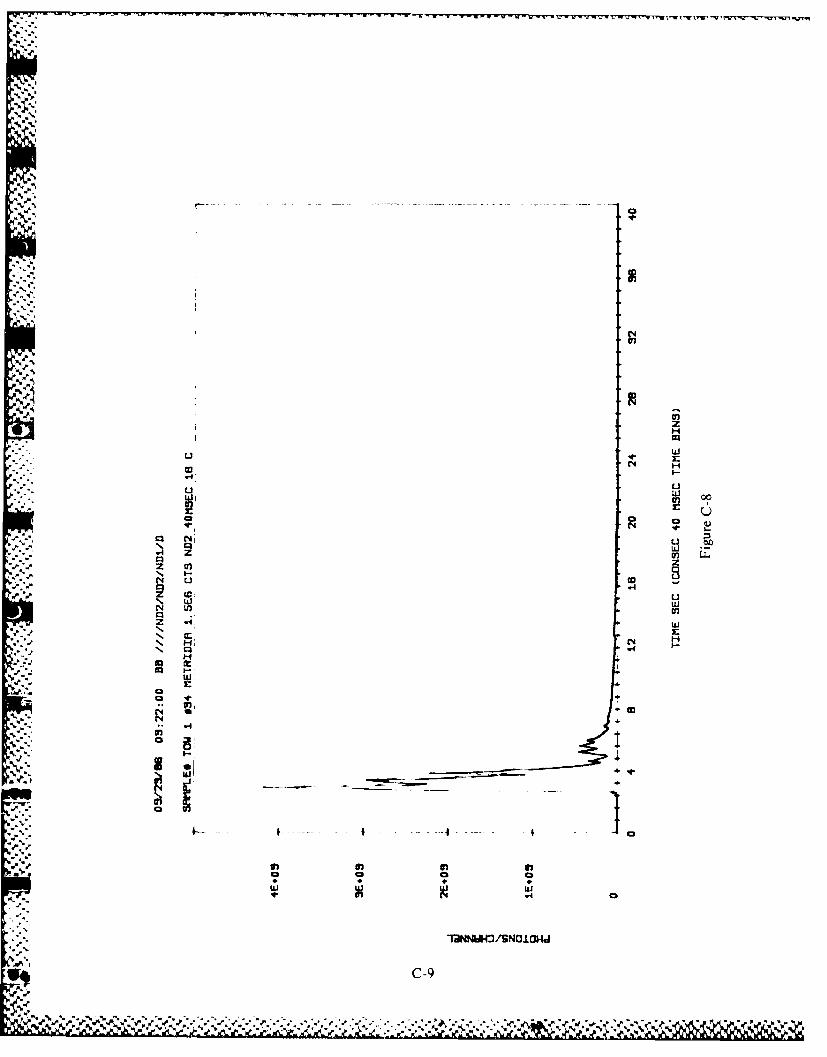
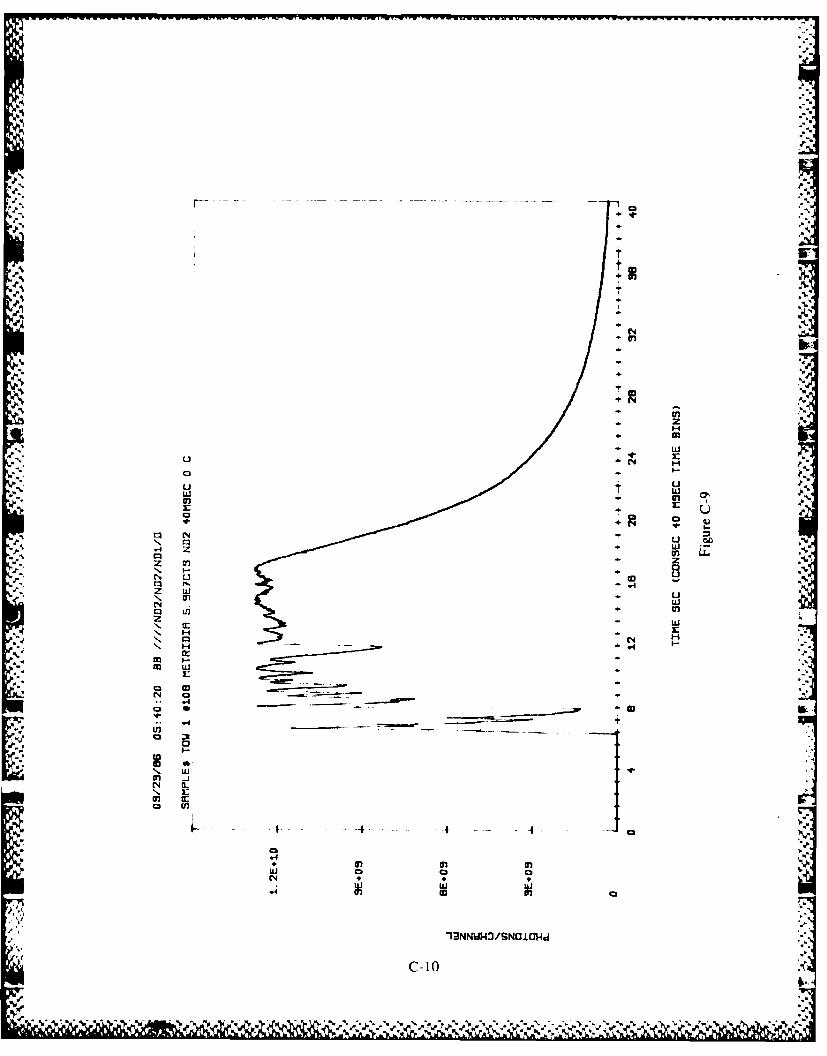
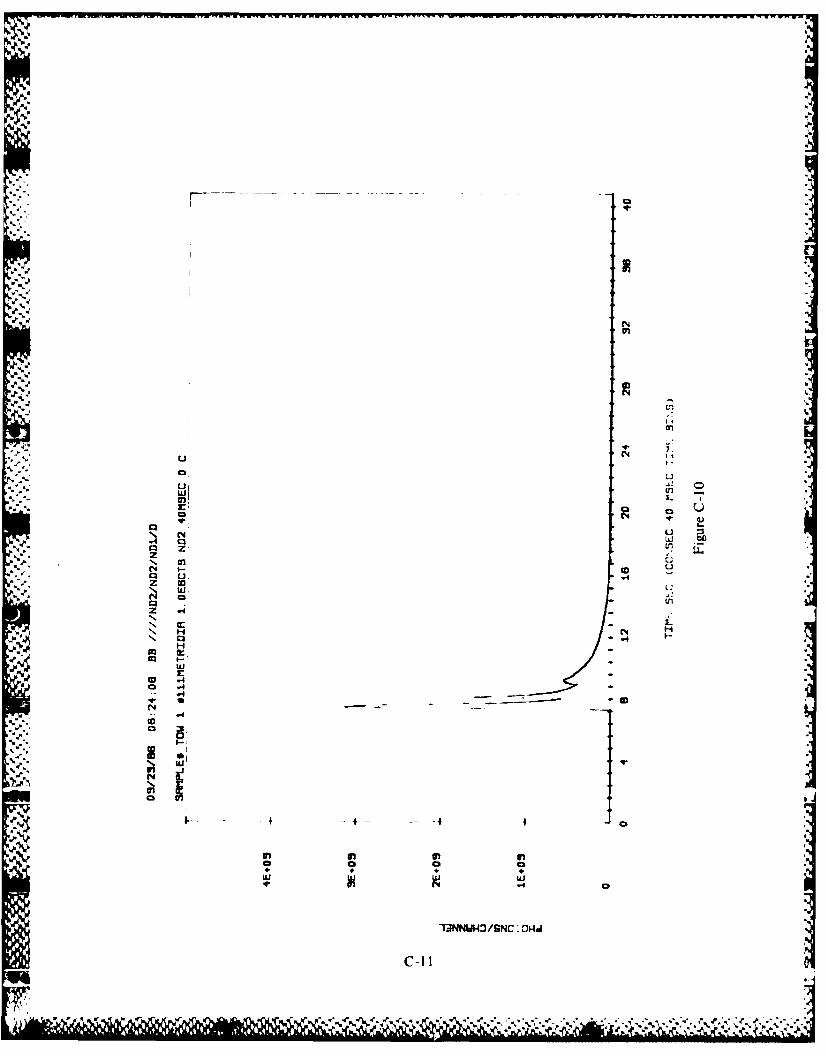
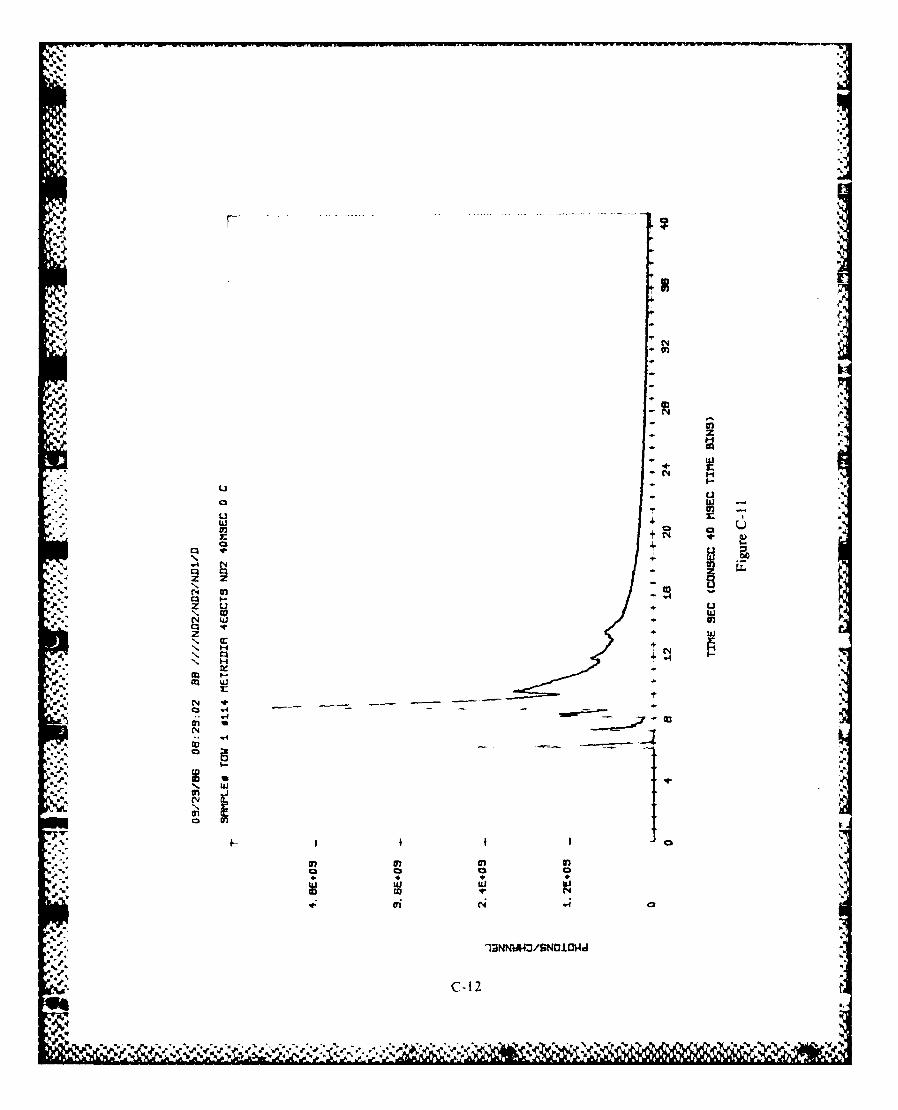
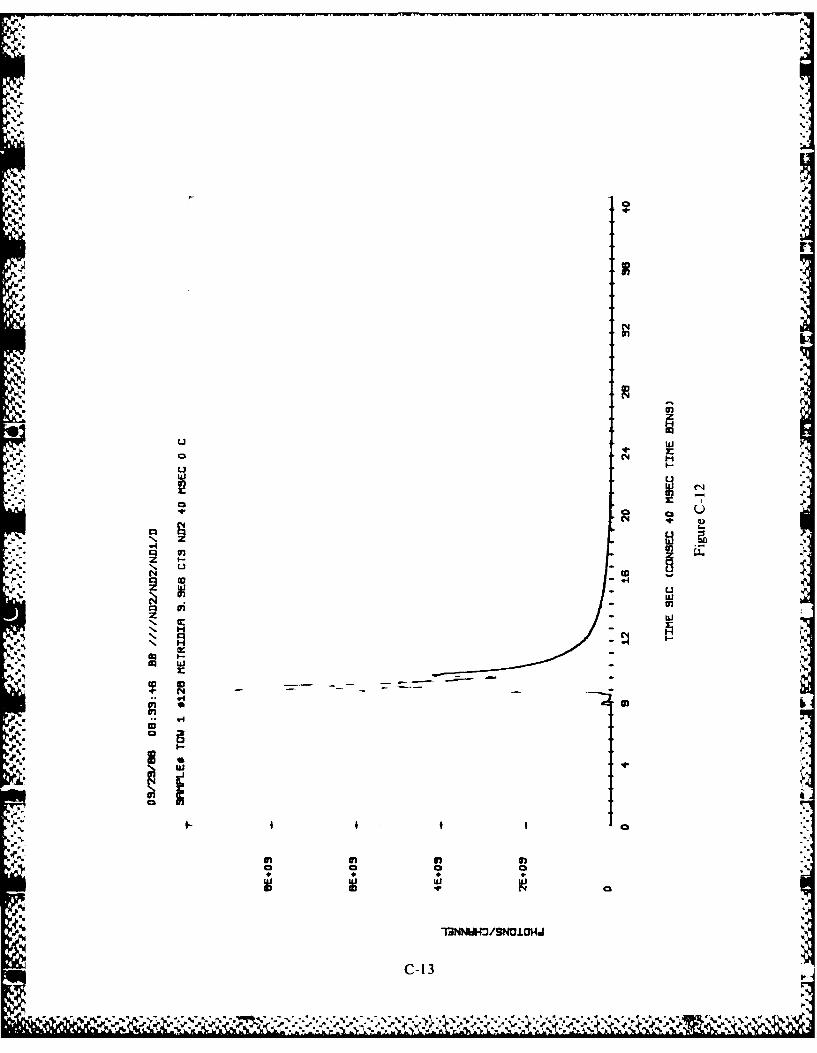
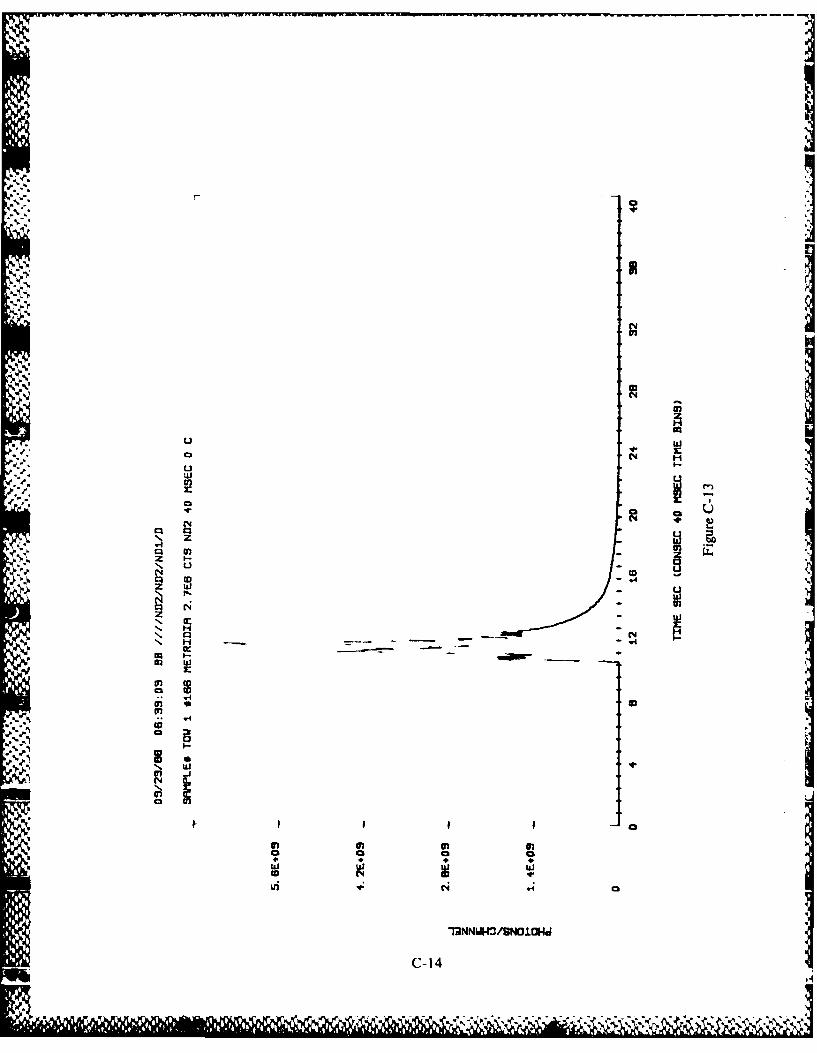
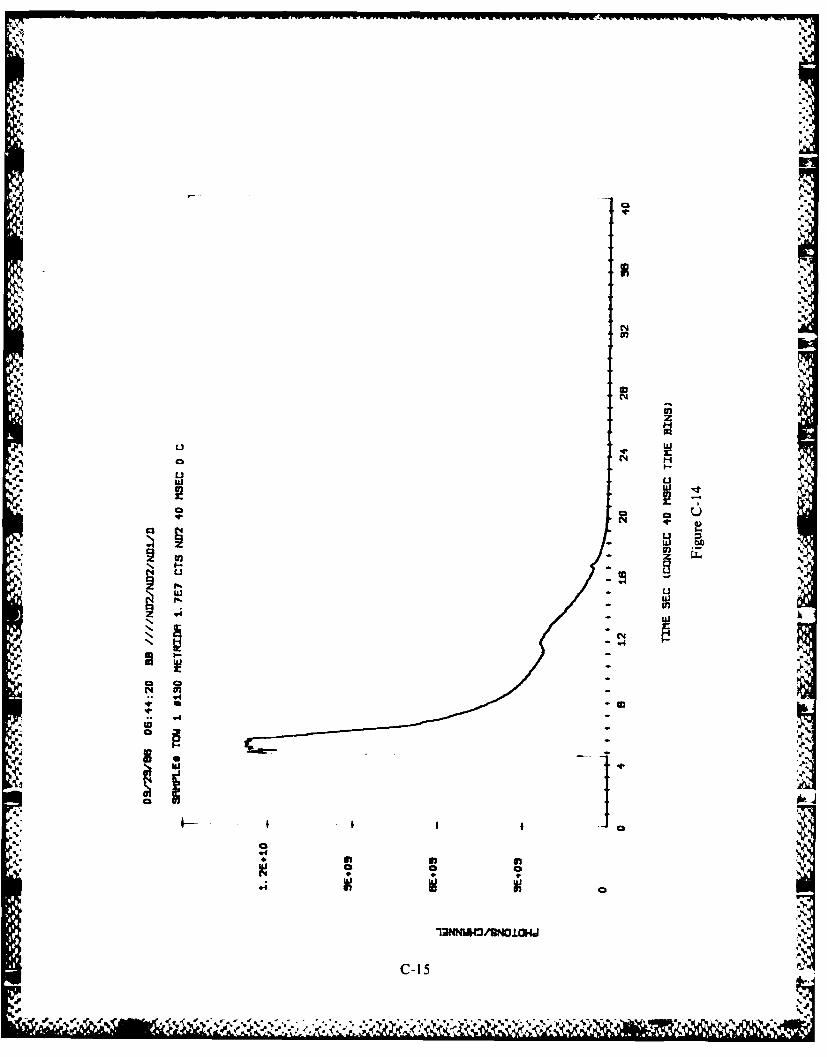
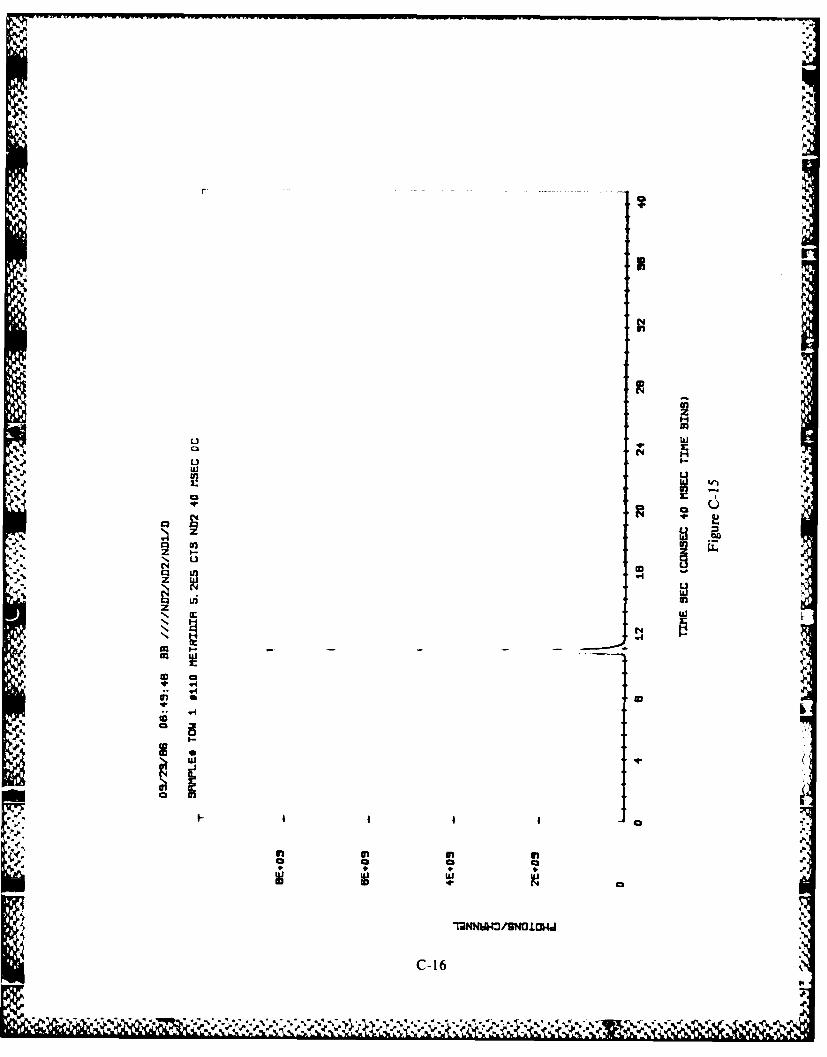
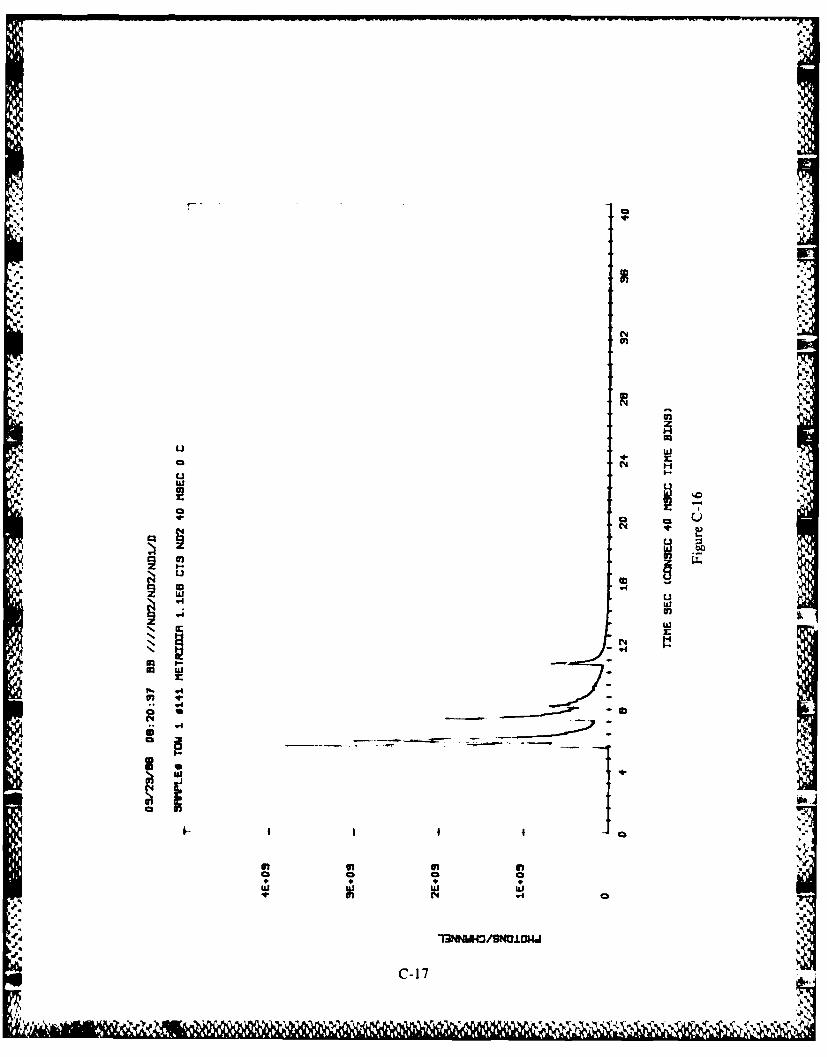
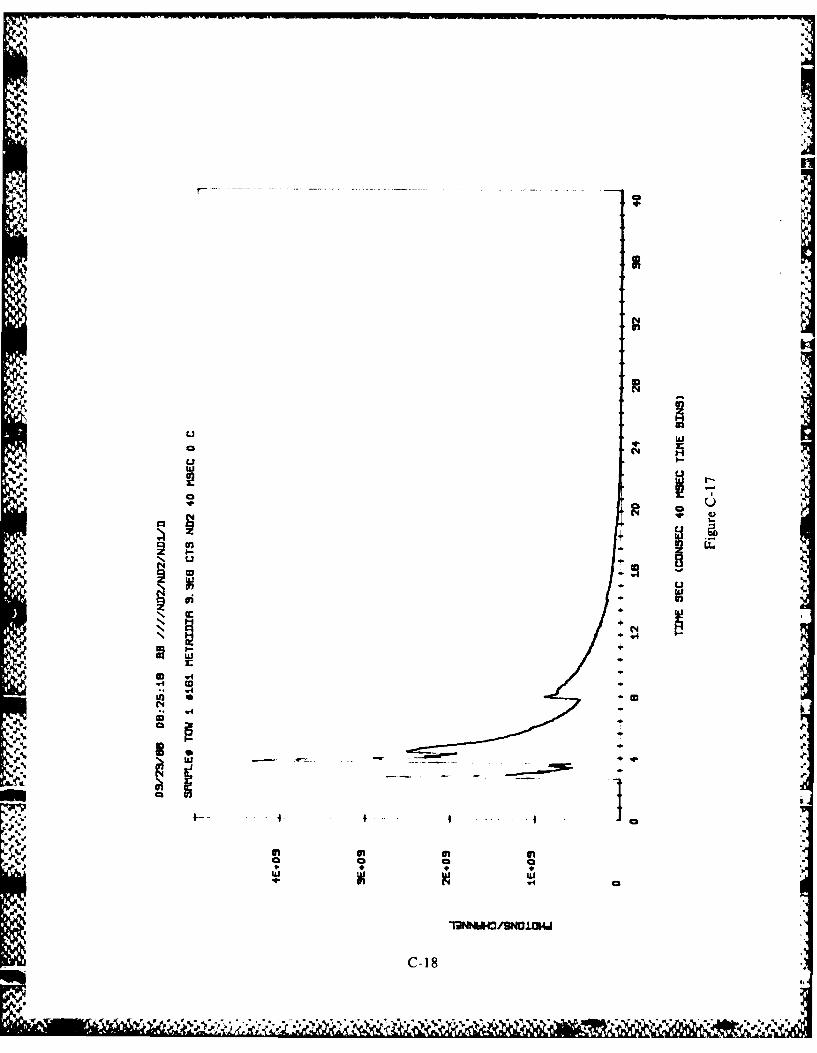
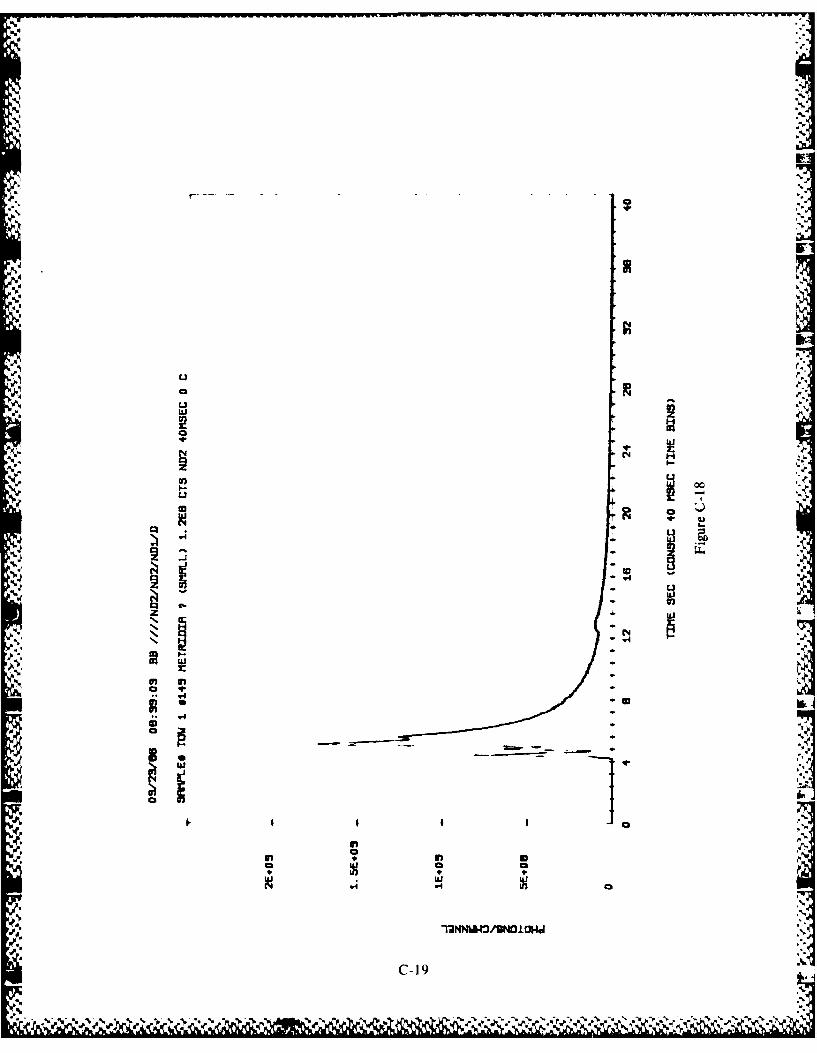
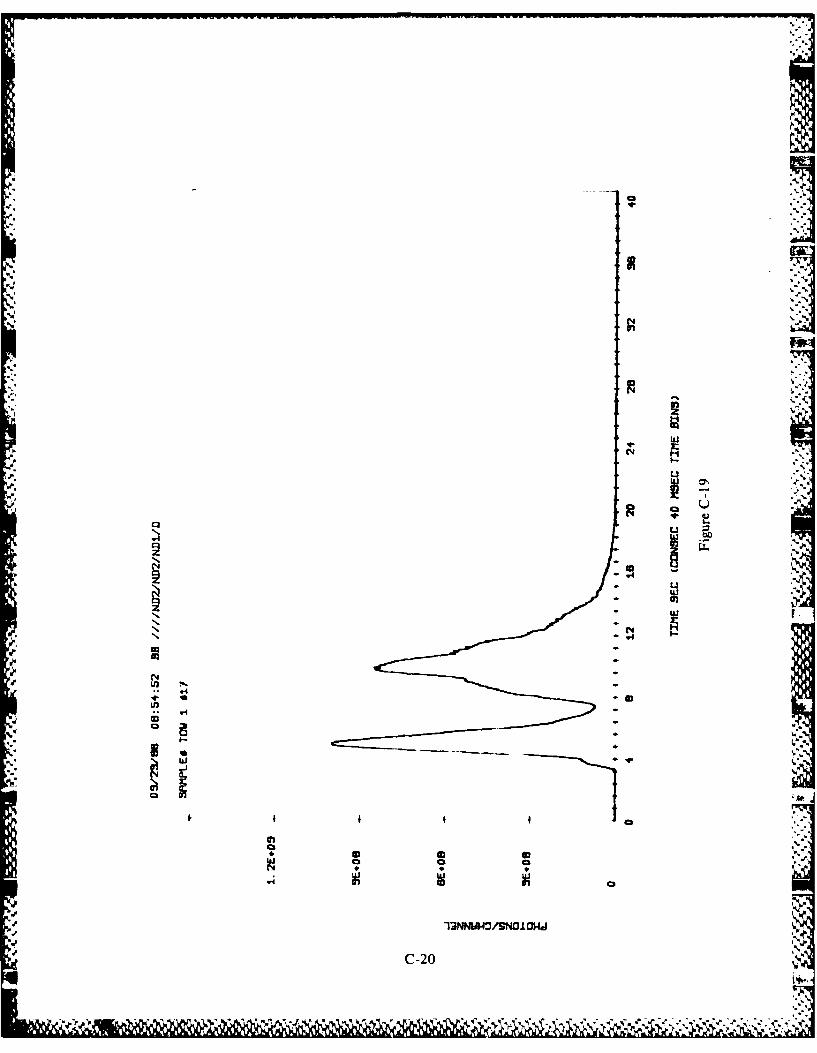
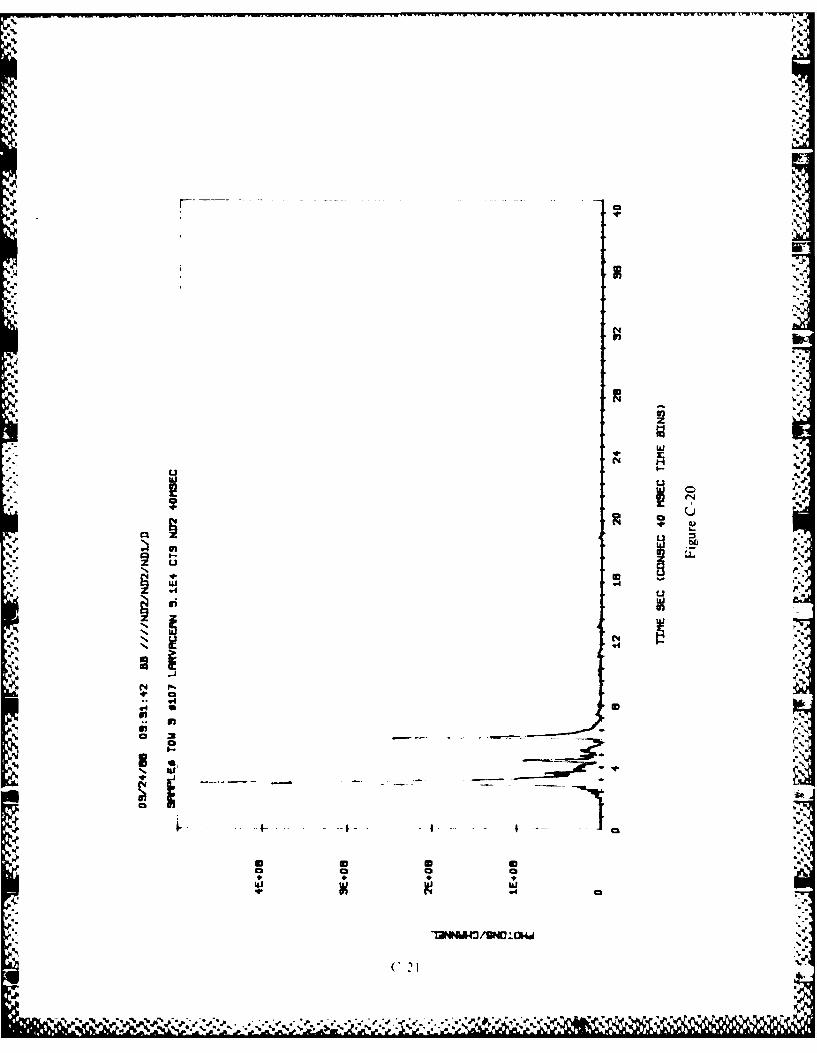
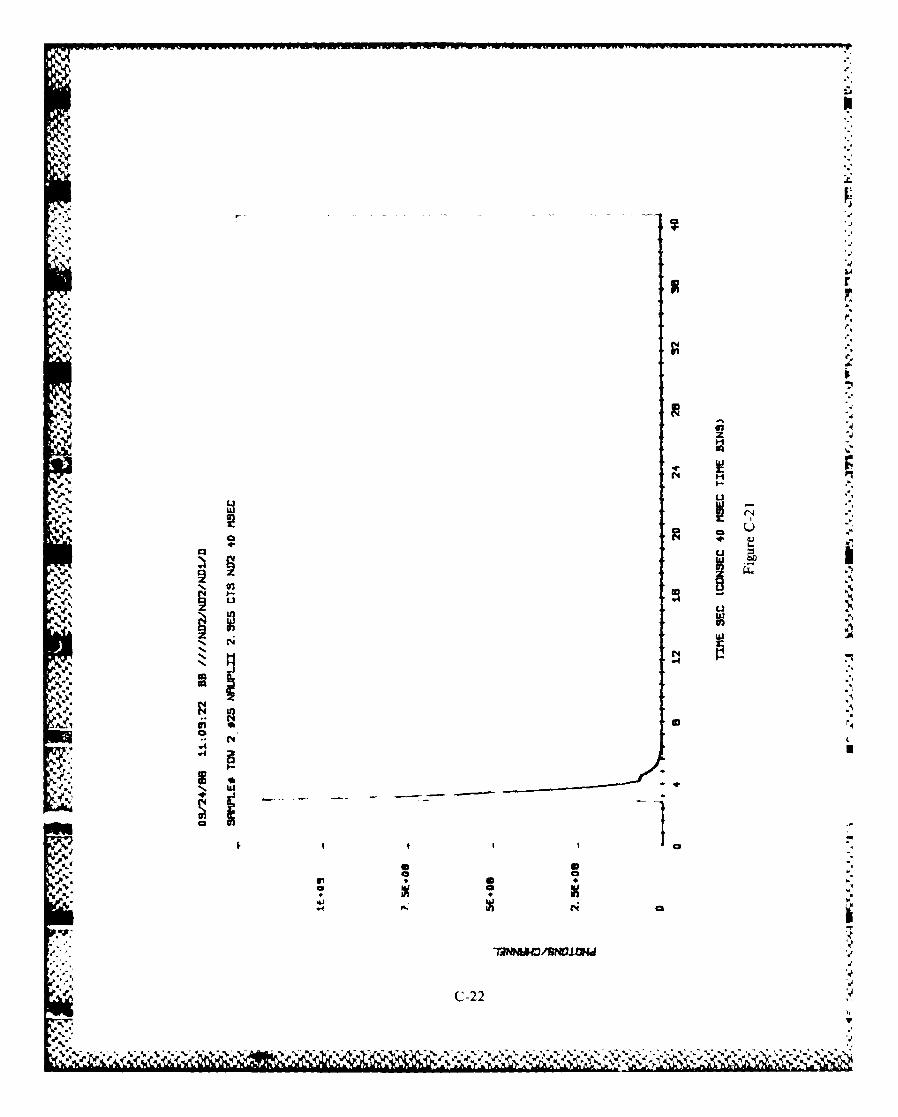
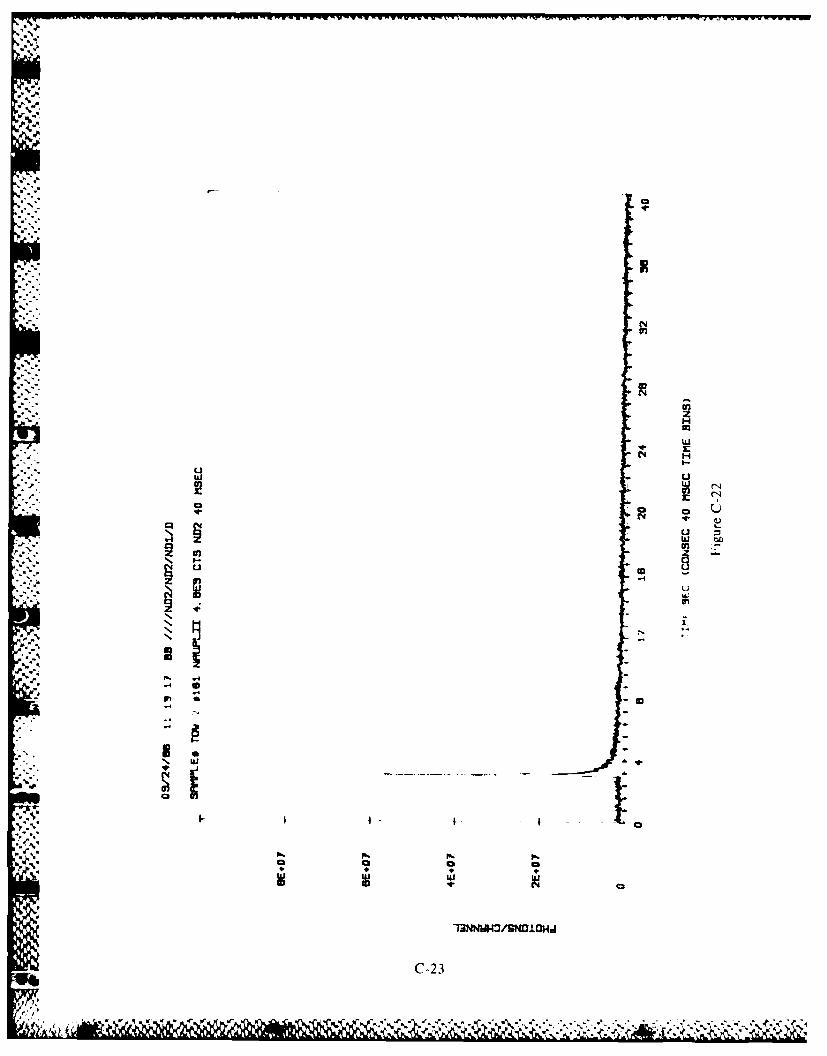
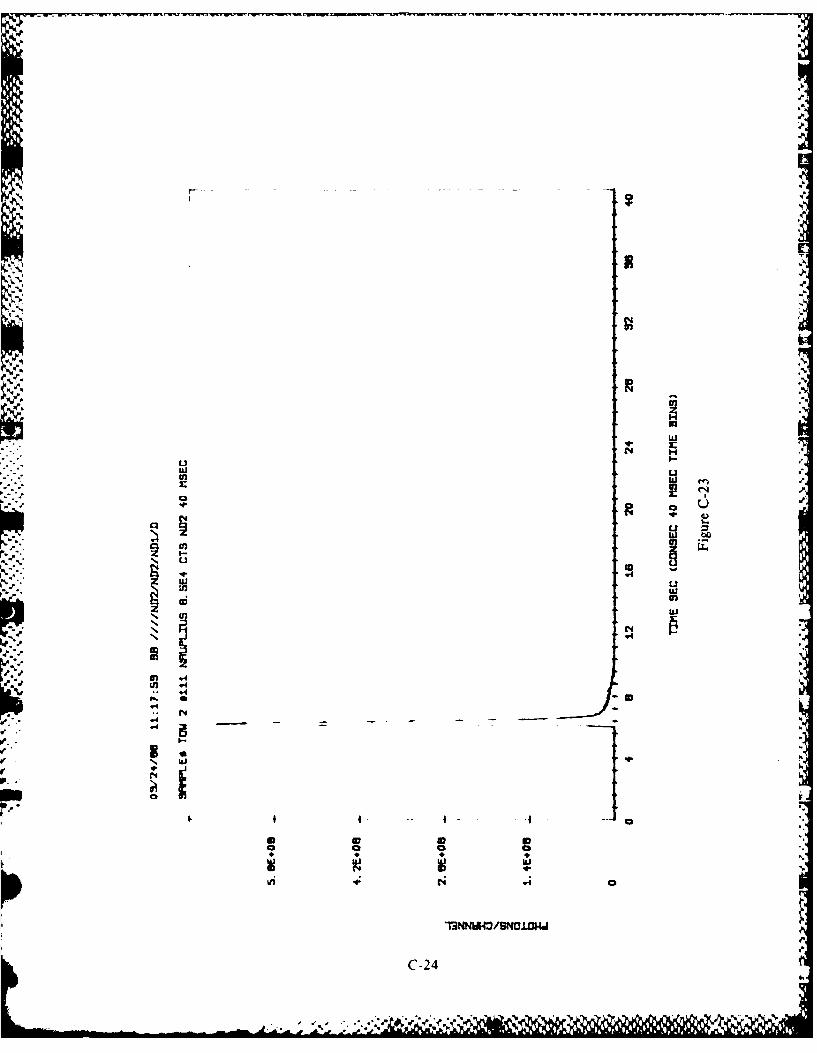
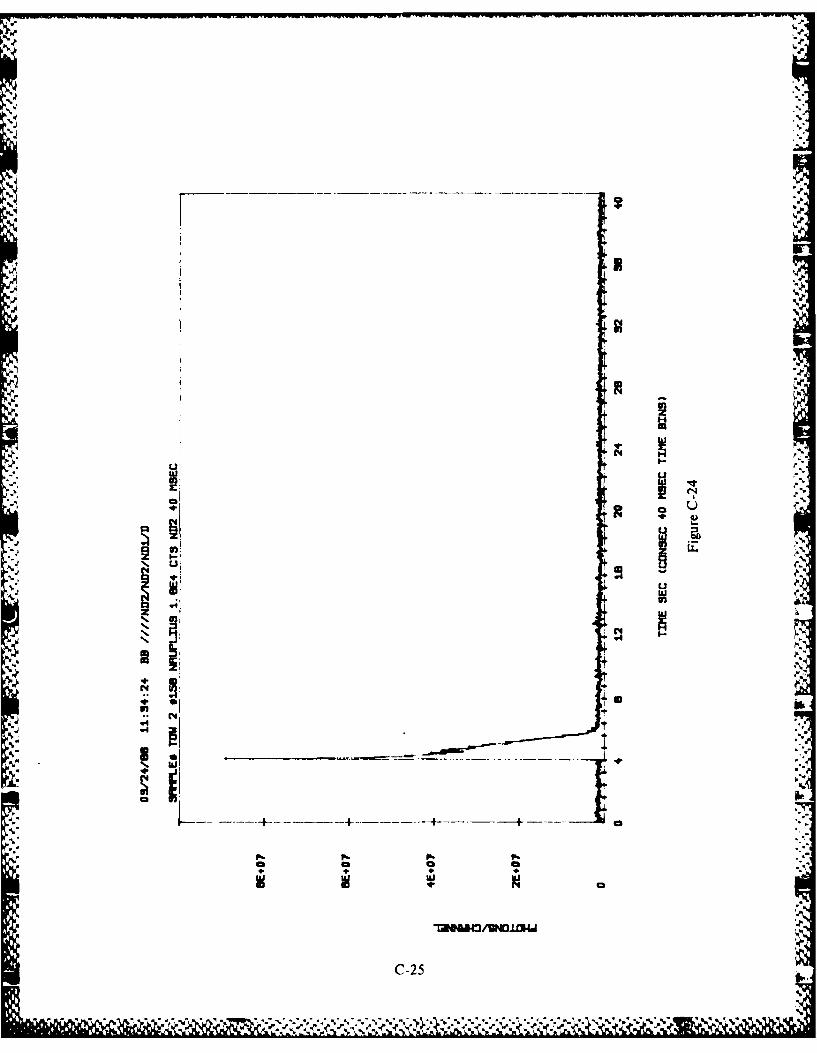
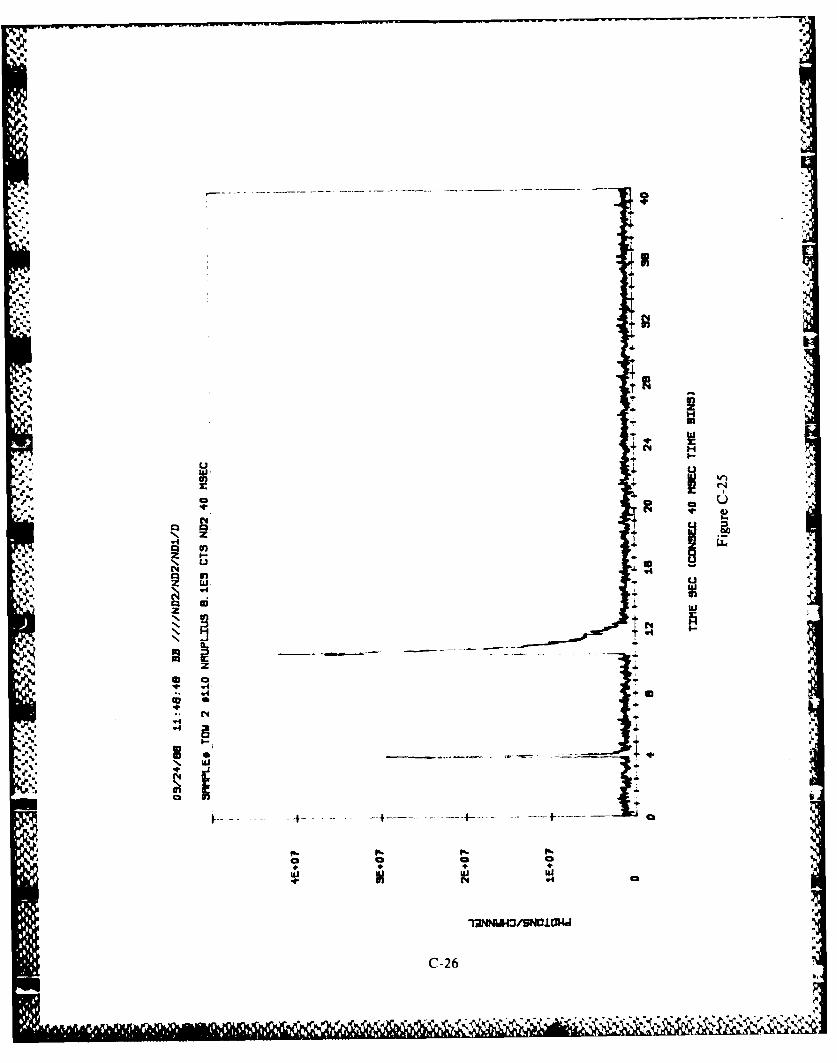
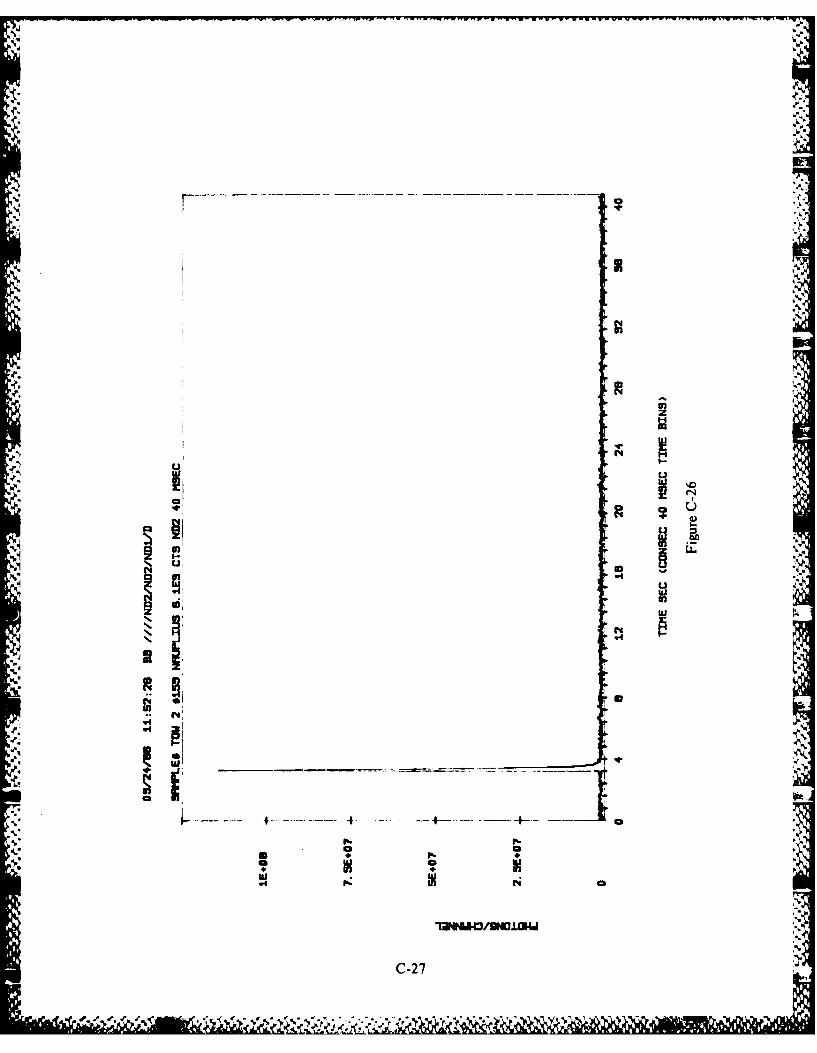
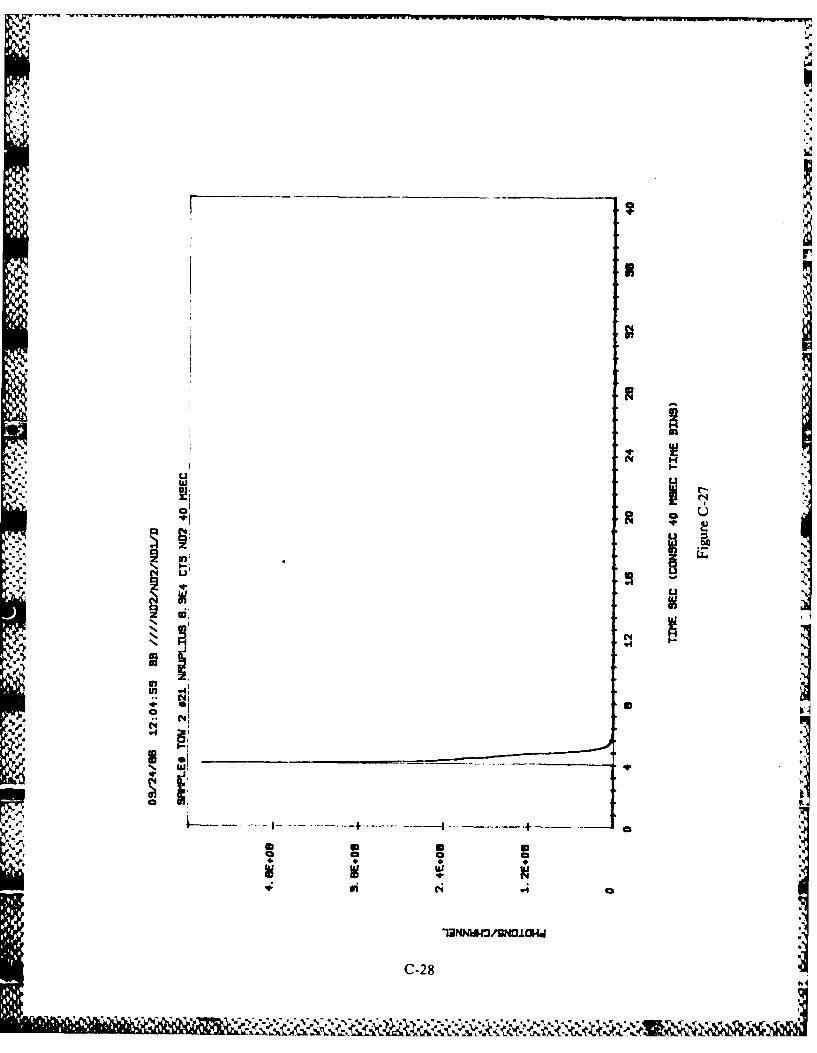
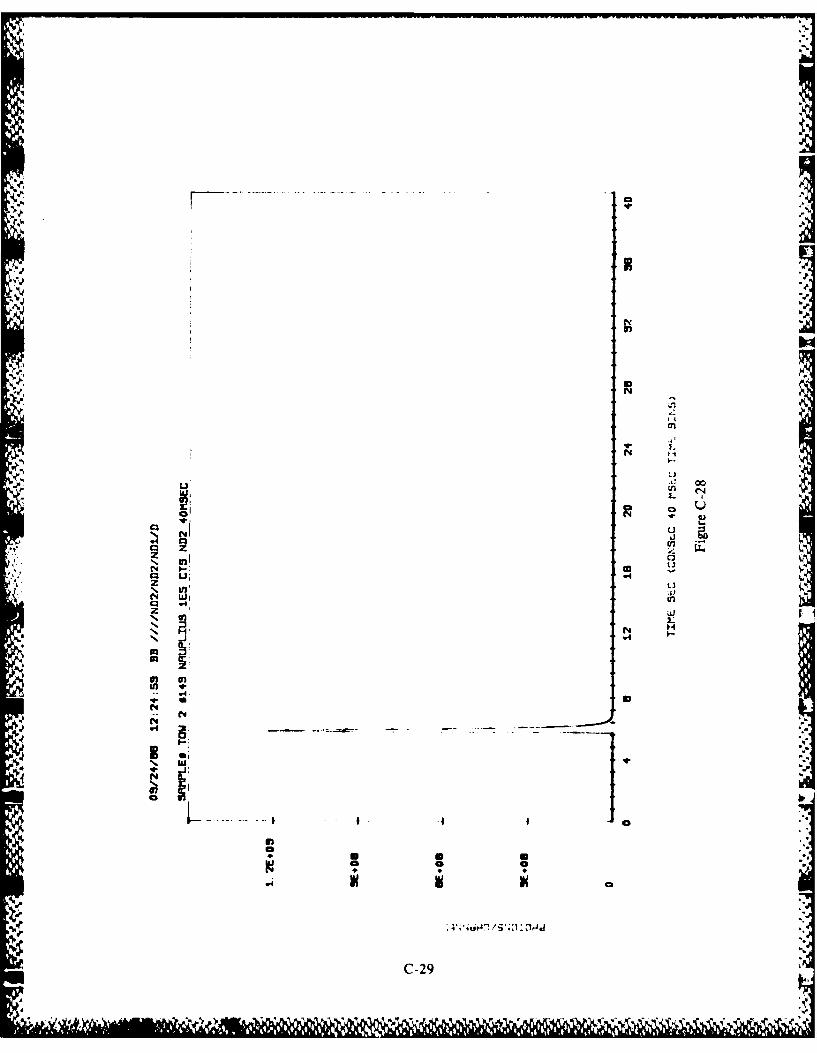
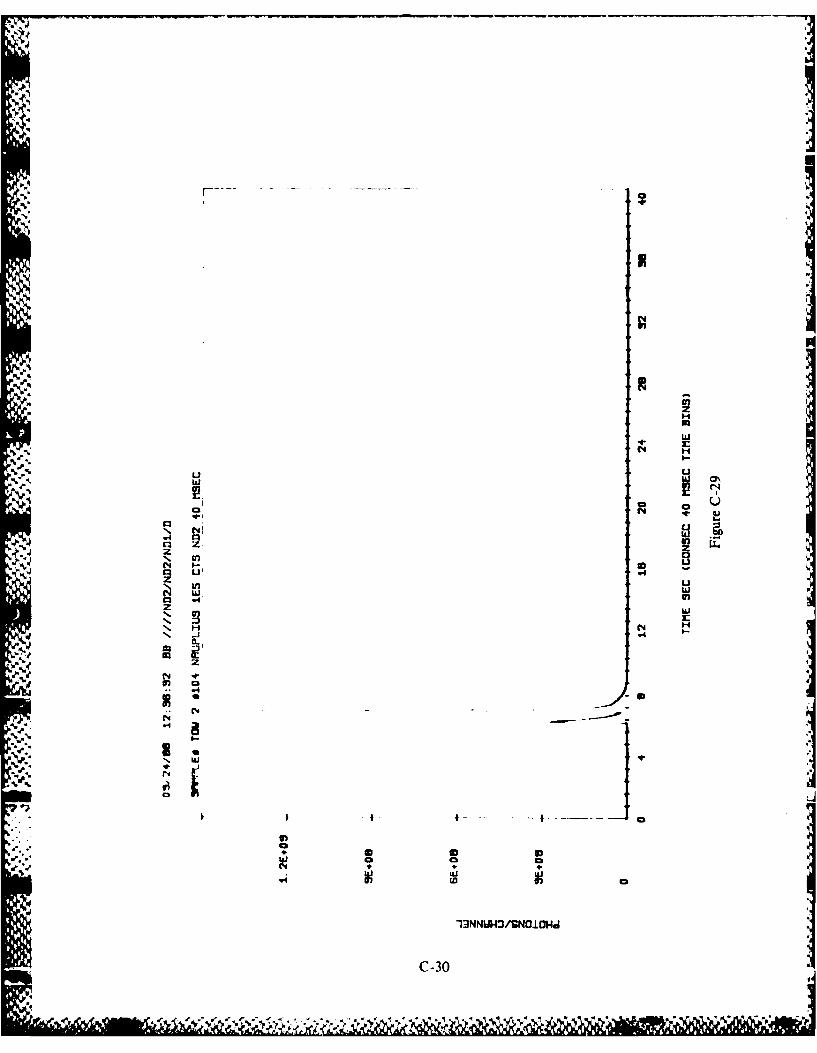
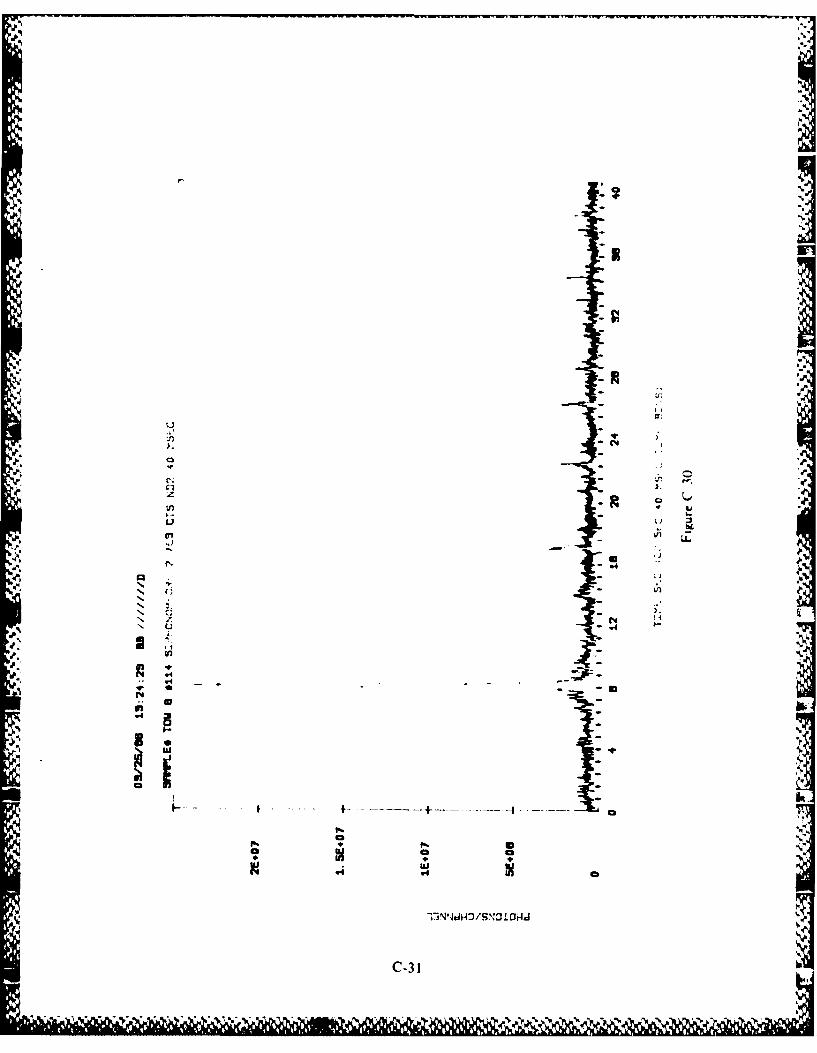
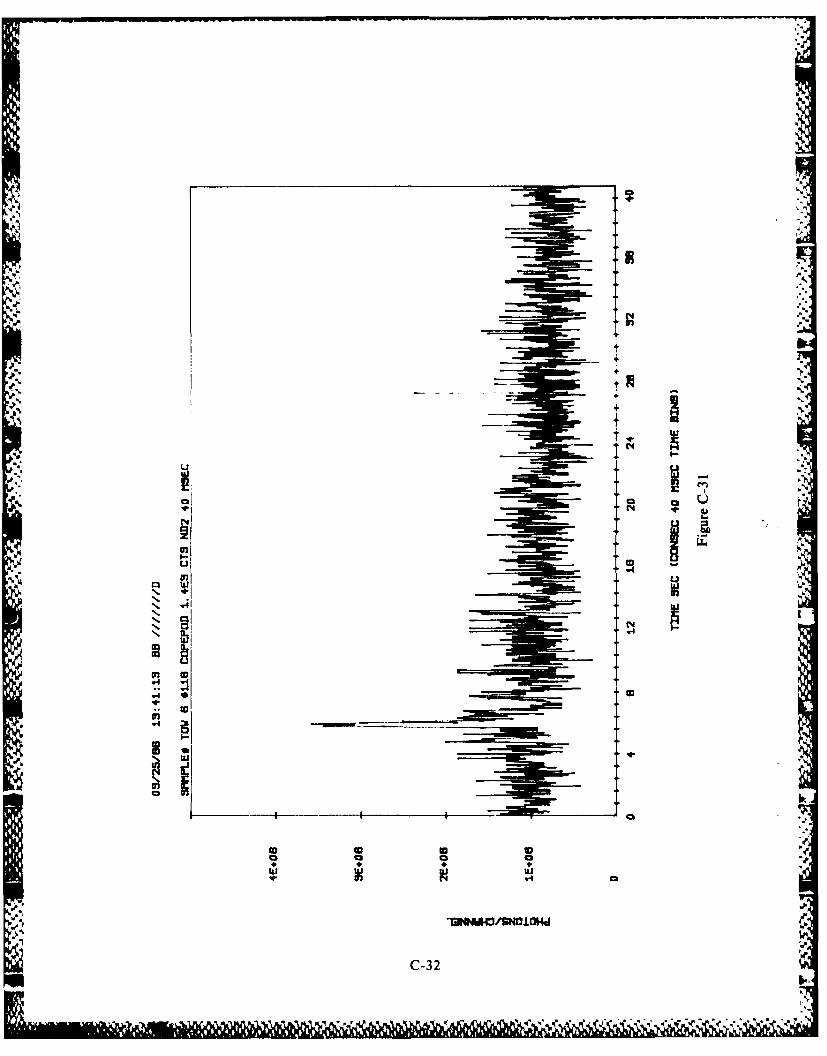
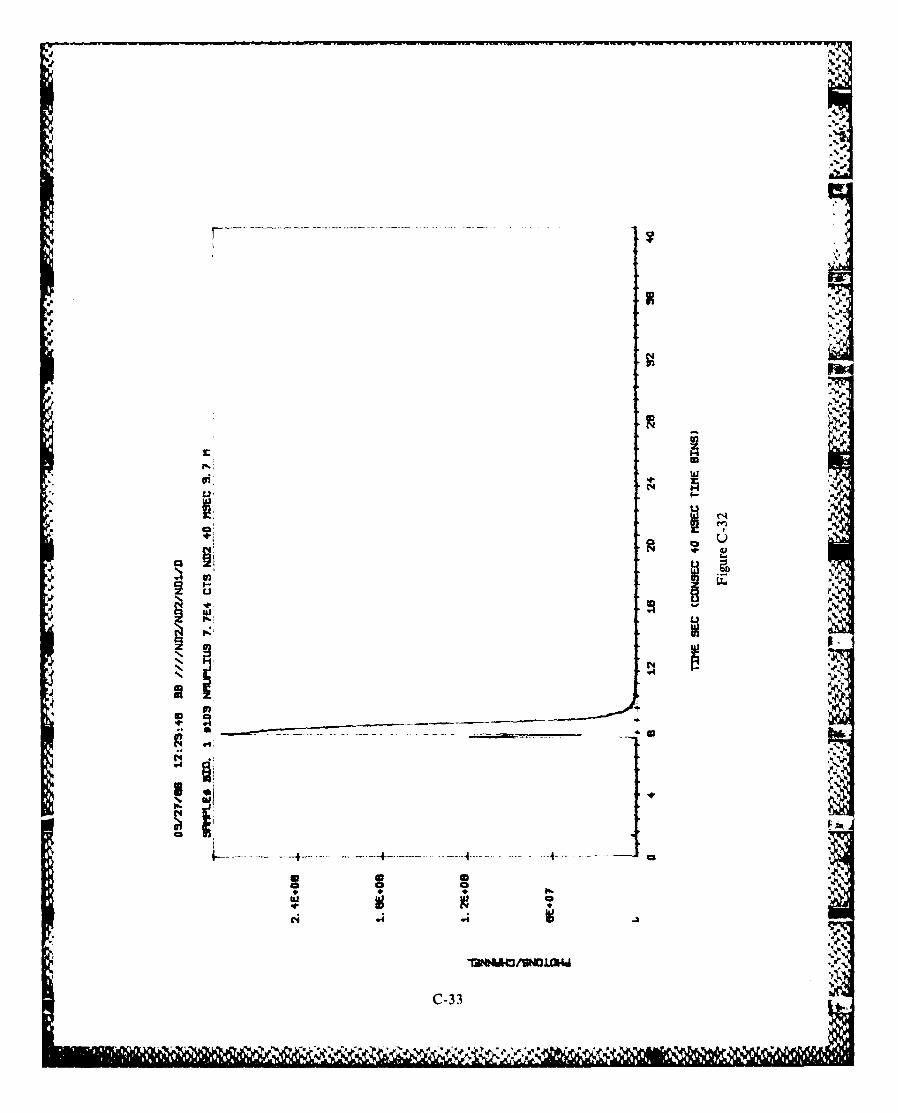
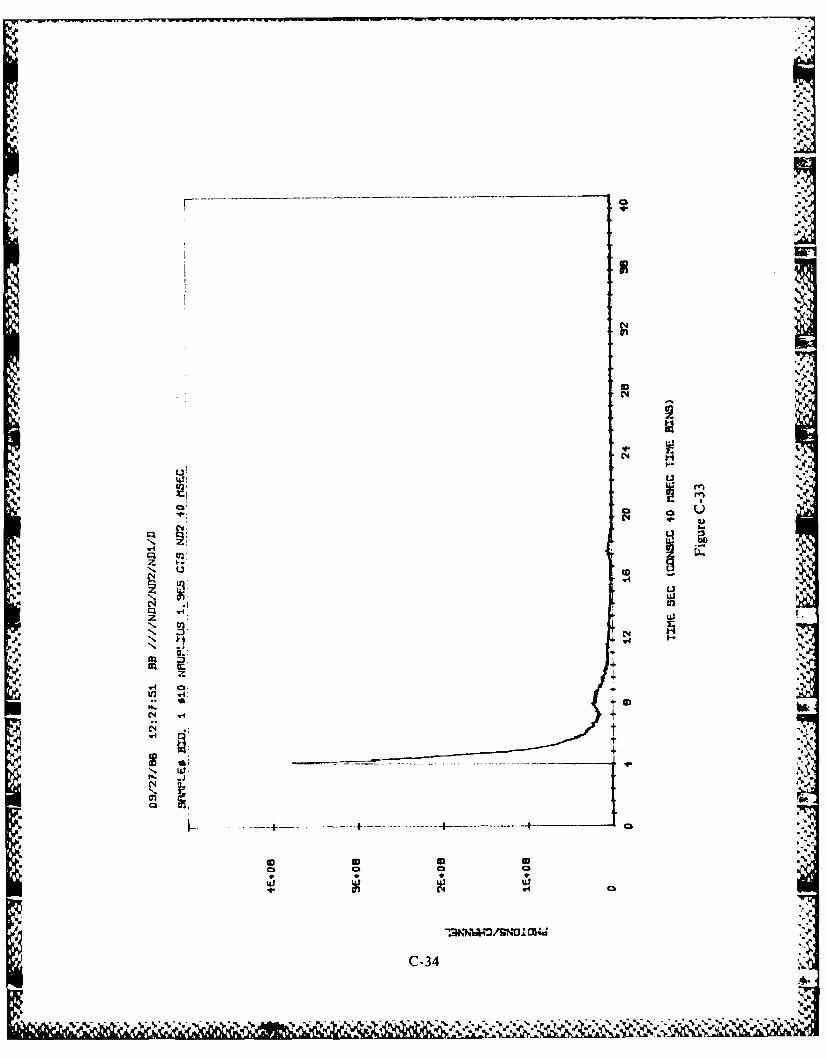
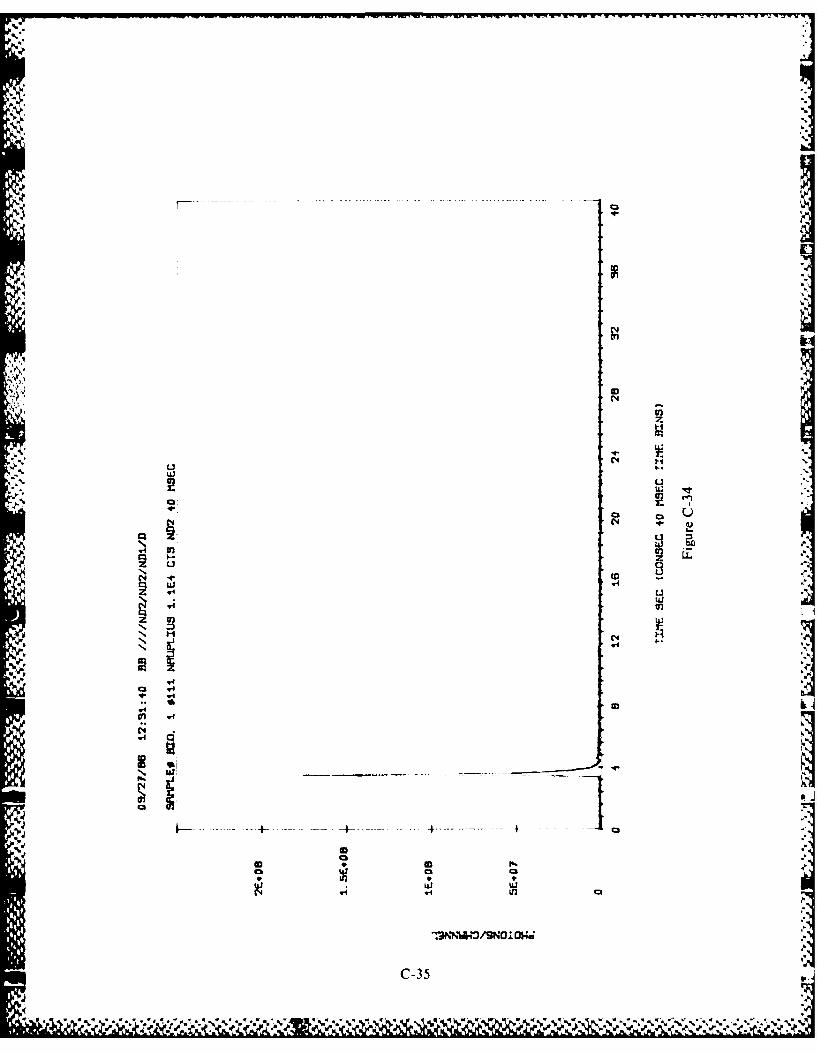
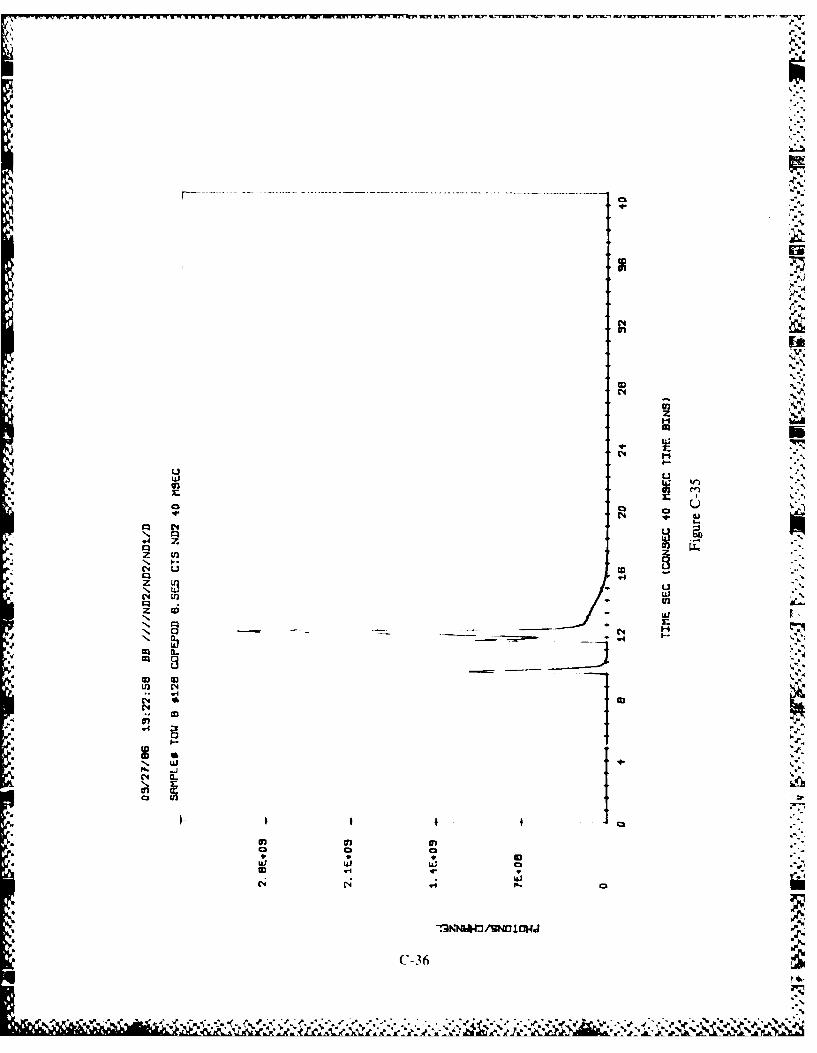
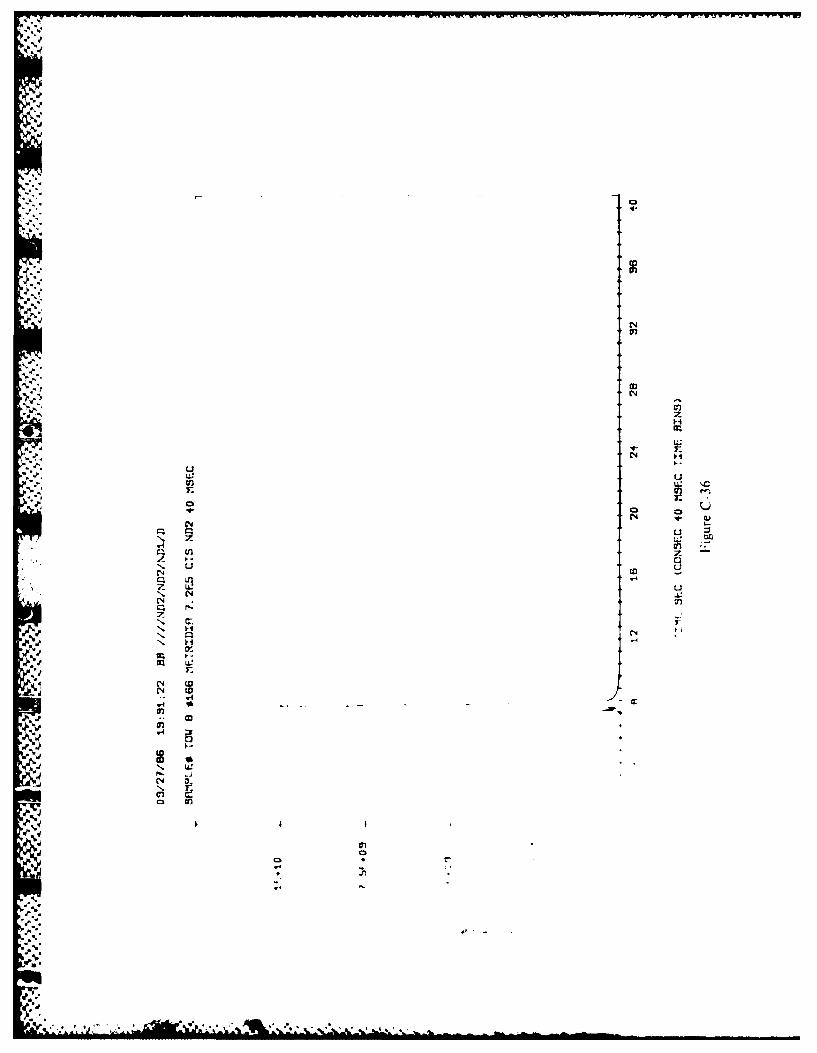
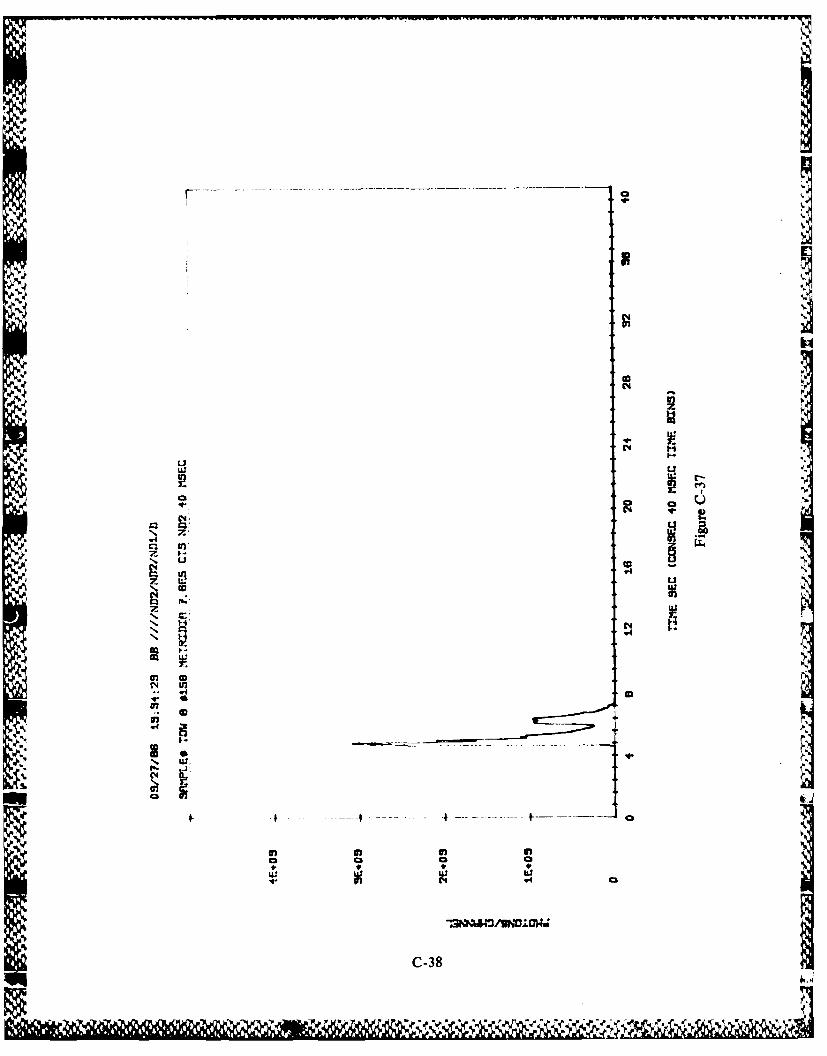
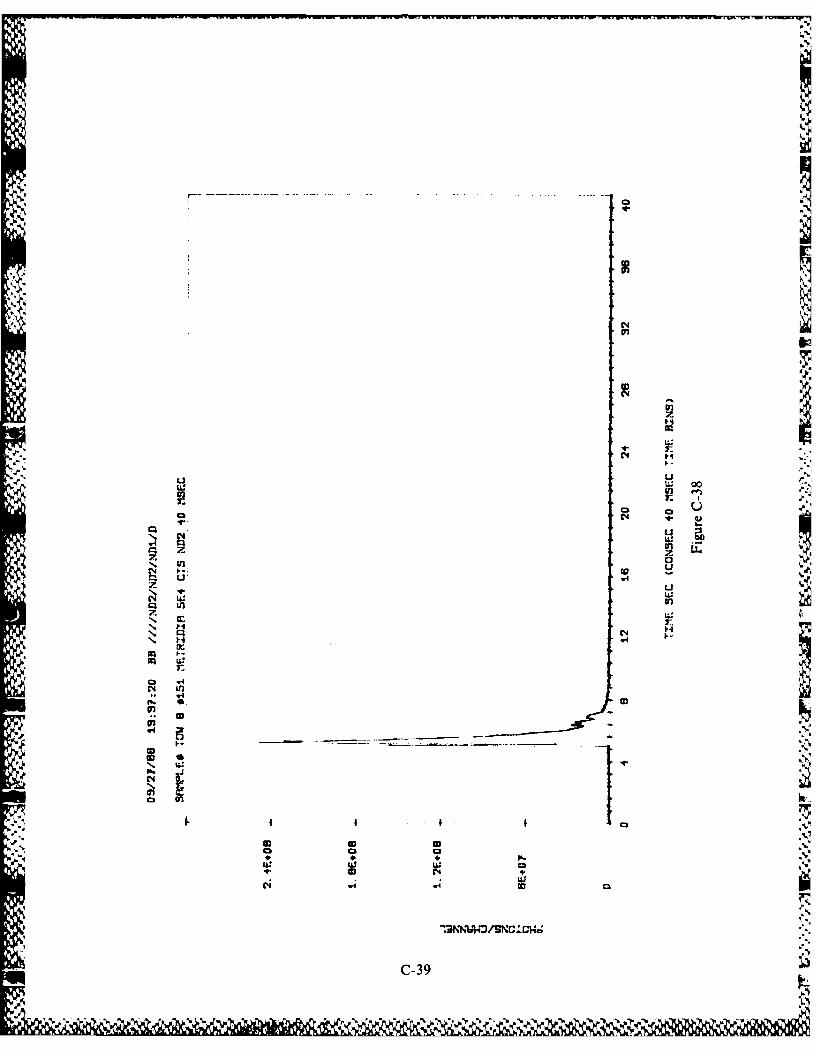
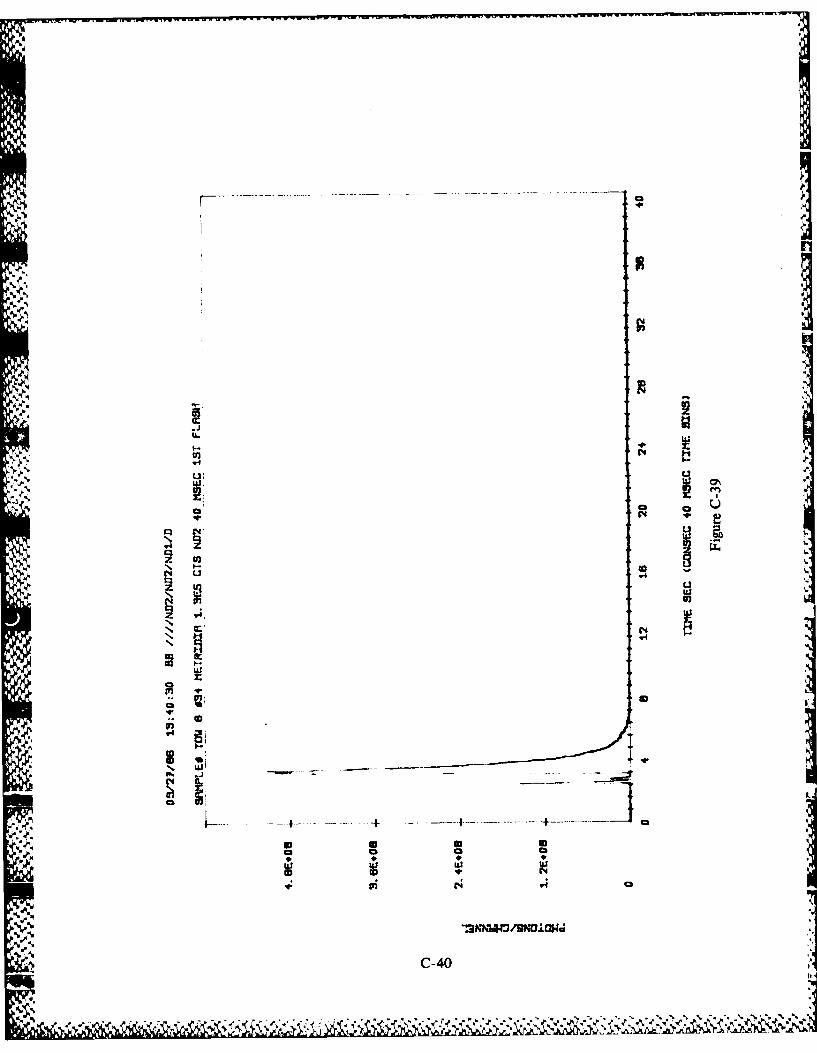
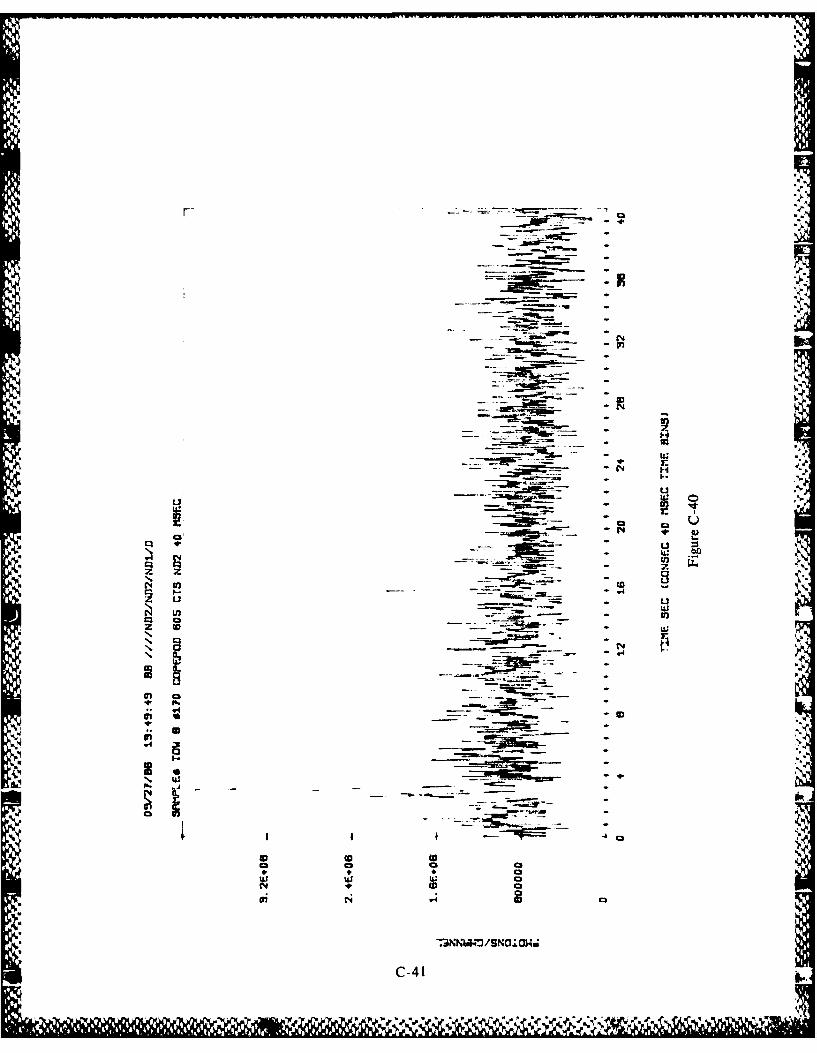
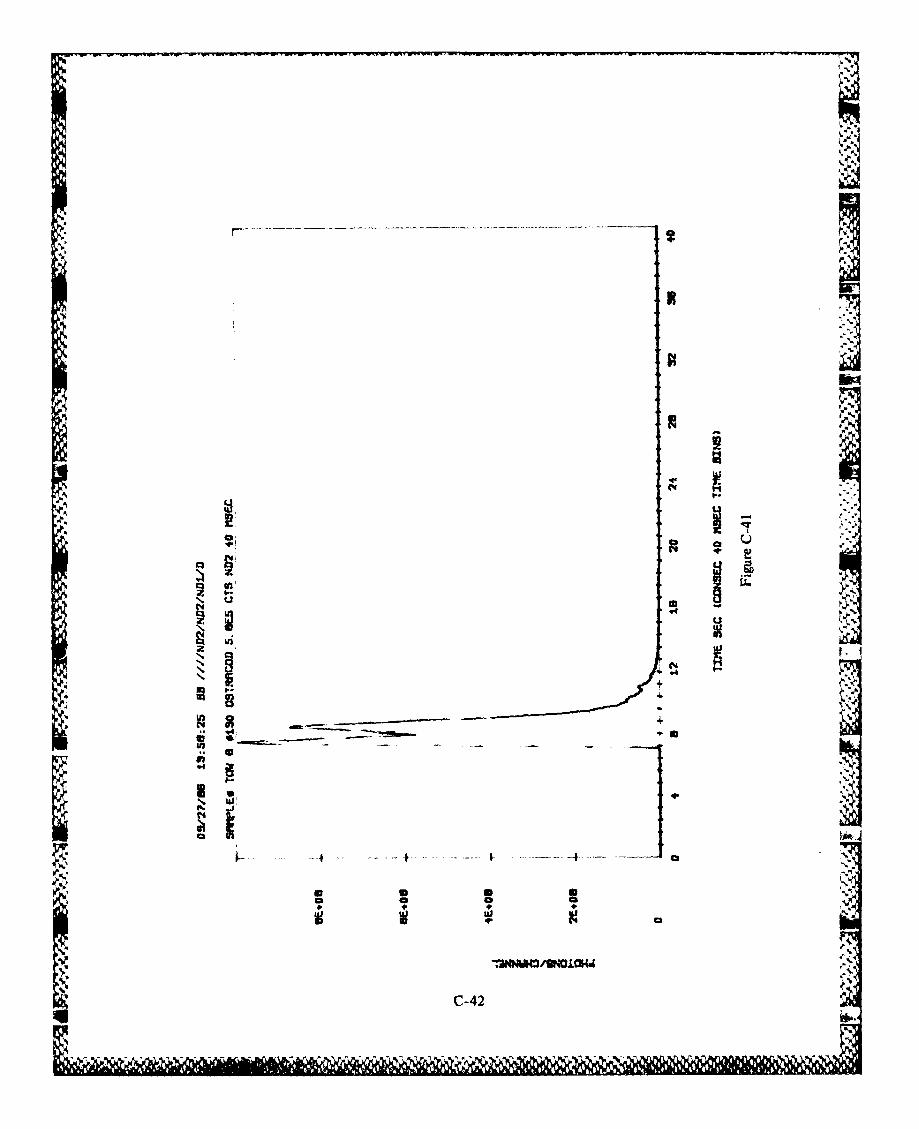
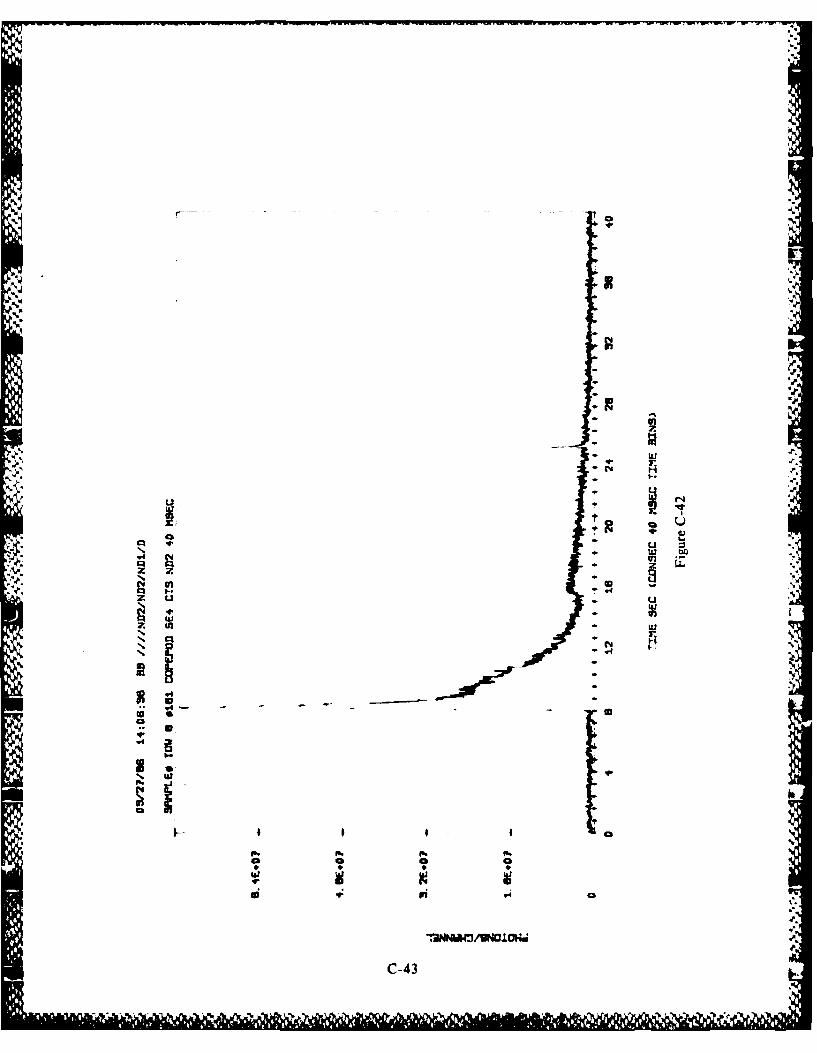
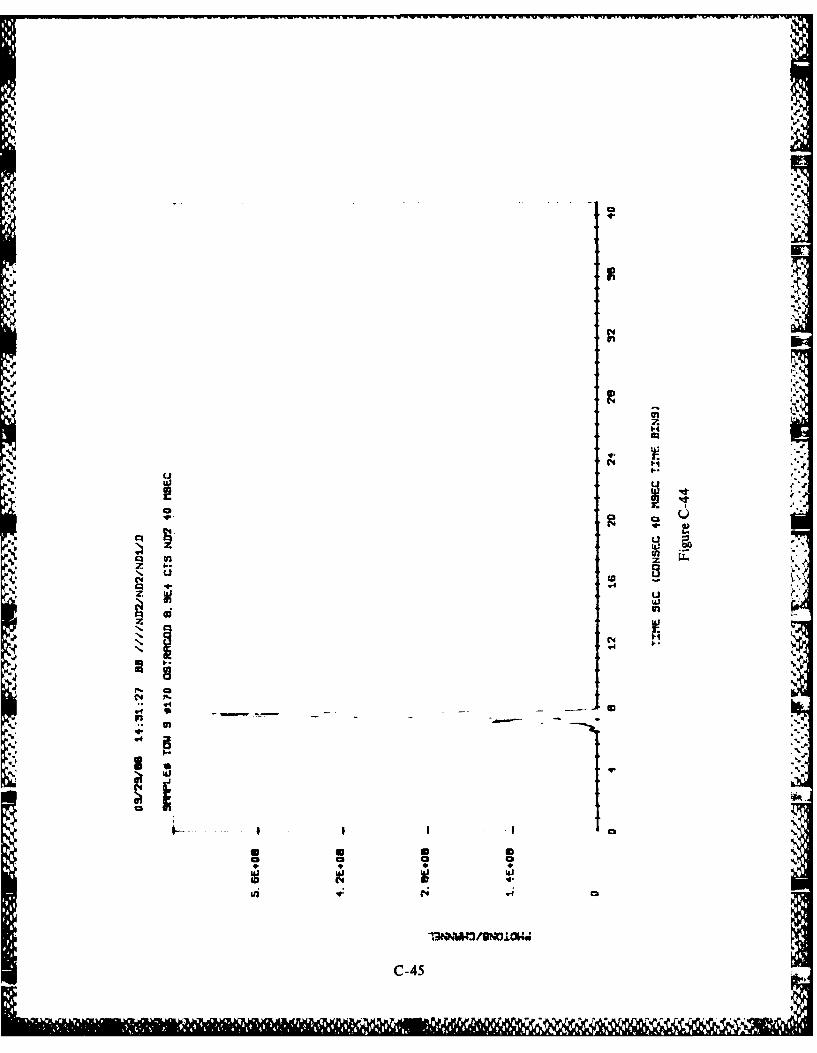
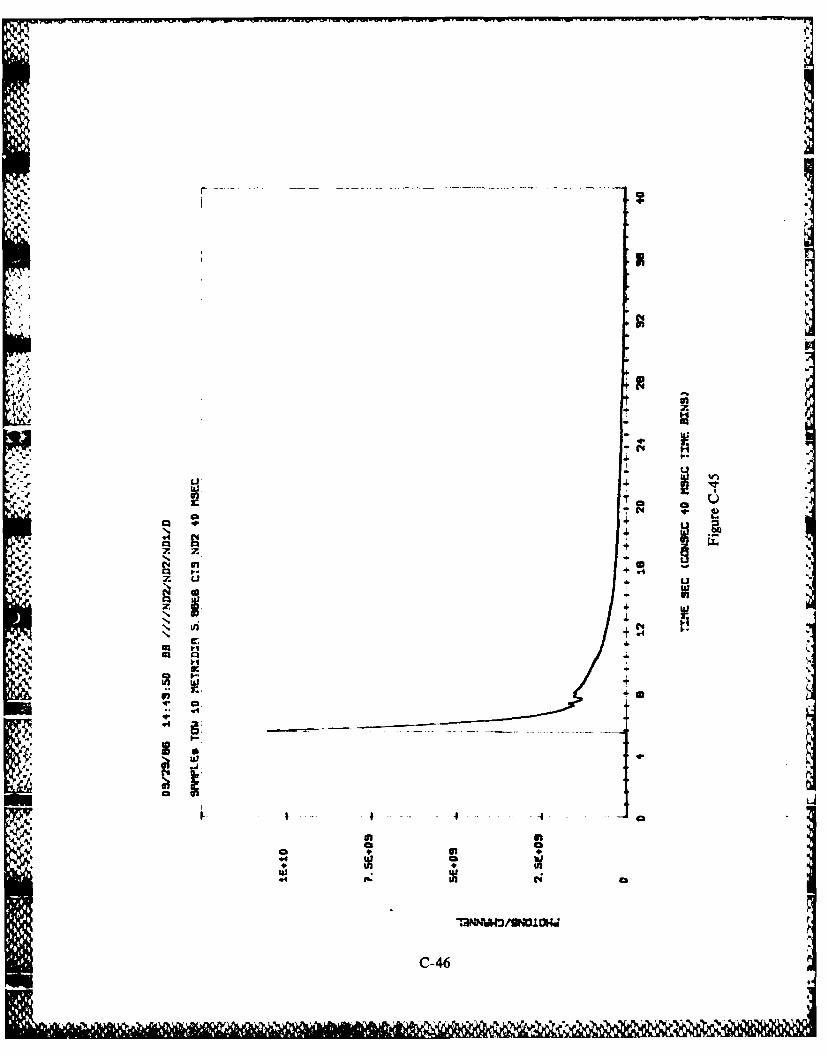
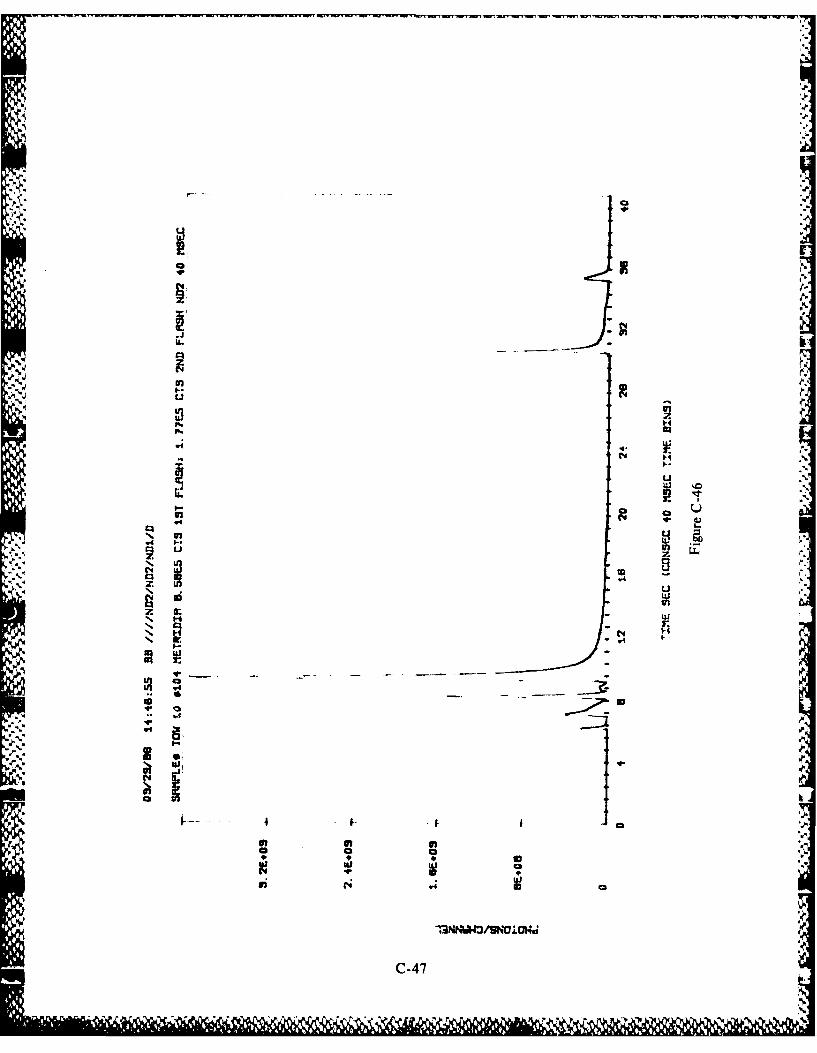
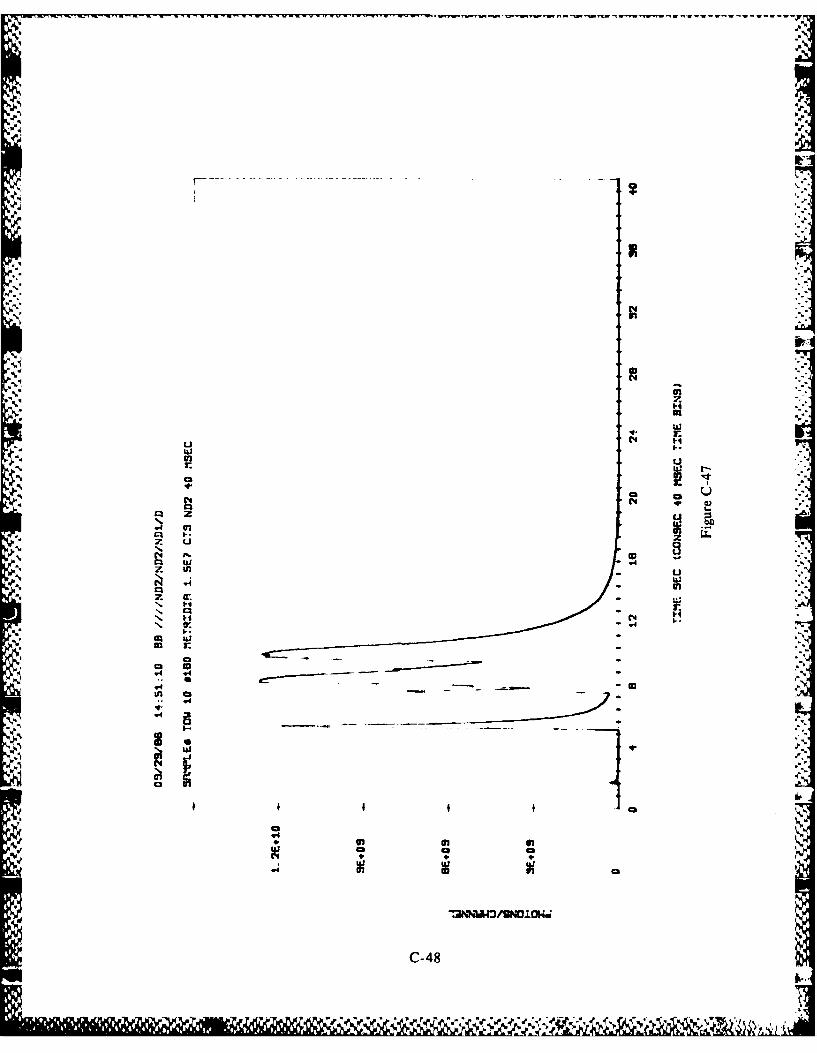
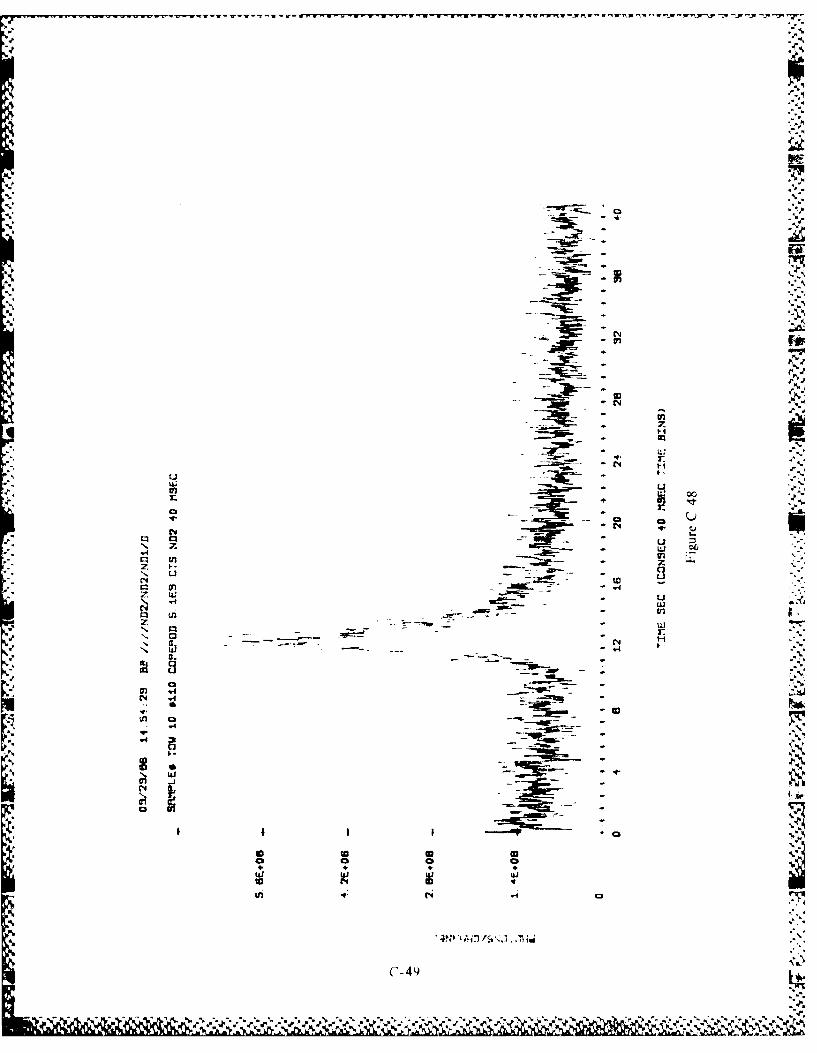
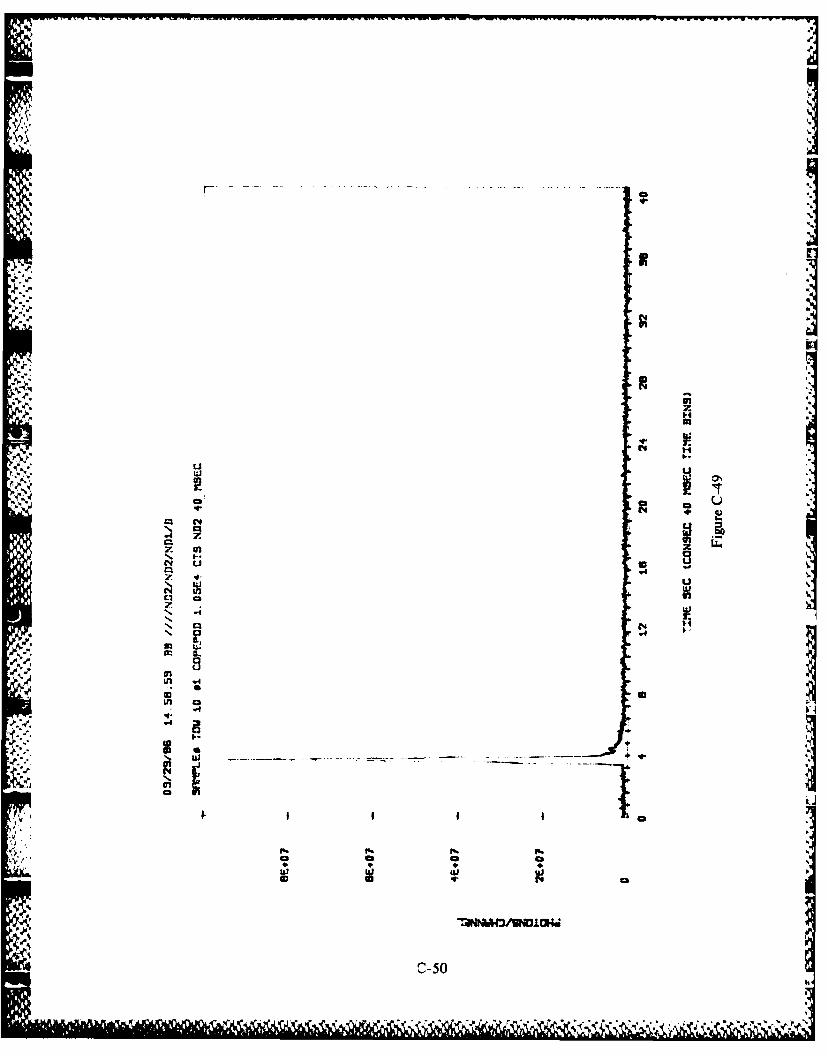
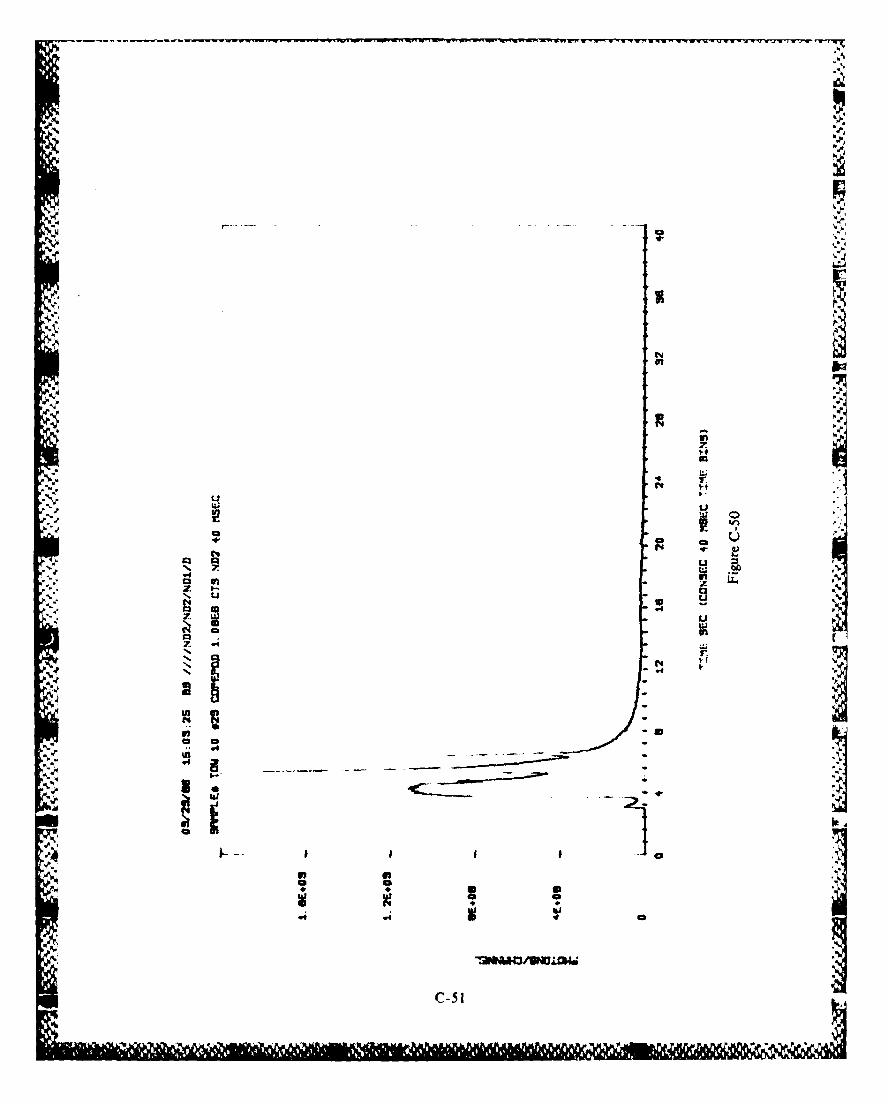
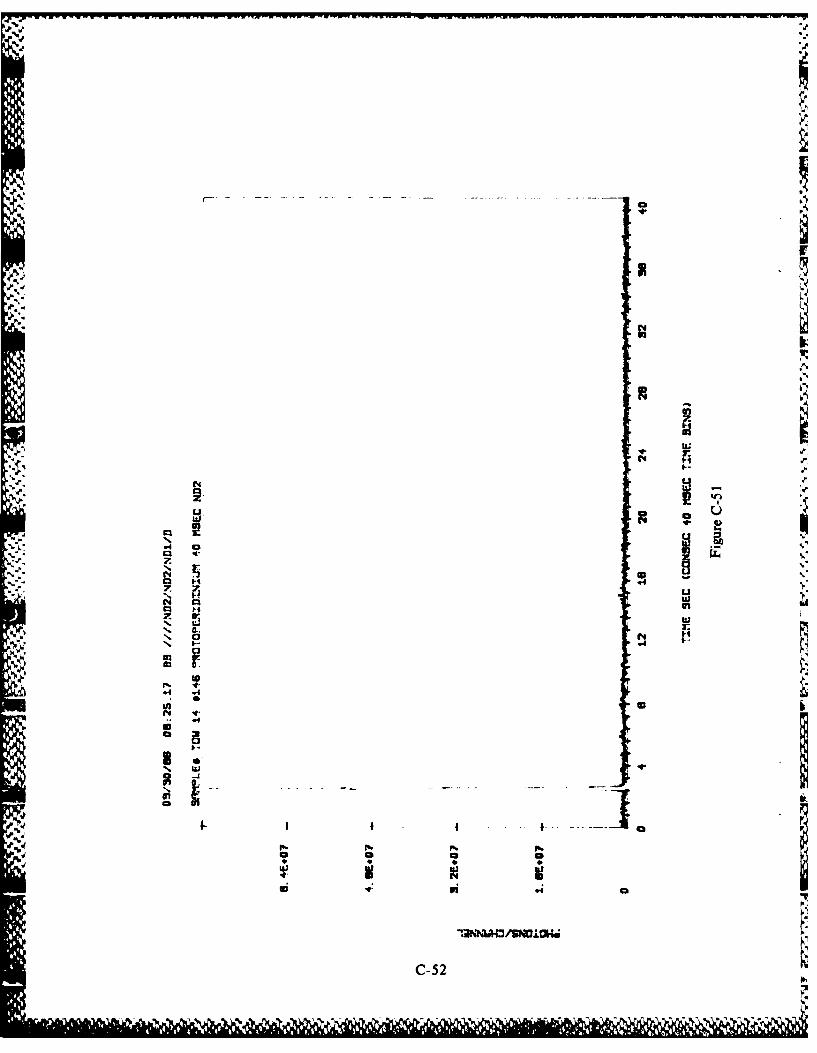
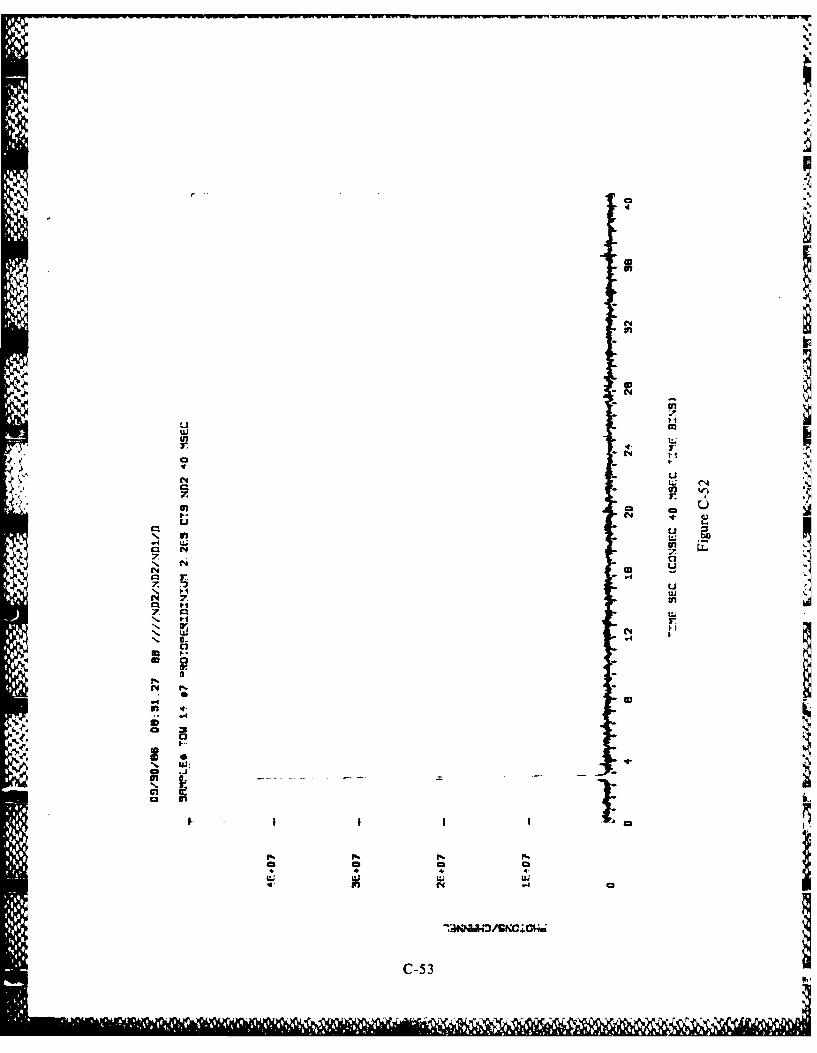
"-, 100 m-0. Supplemental drifting plankton net collections were also examined on board theship for identifying luminous plankton species responsible for the measured biolumin-escence (see tables 2 and 3). Individual phvto- and zooplanktcrs were isolated fromthe plankton tows and individually tested for bioluminescence in the laboratory planktontest chamber (LPTC) (figure 3). To facilitate this testing, isolated organisms were placedinto quartz sample holders with 6 ml of filtered seawater. The lucite base of the sampleholders was drilled to accommodate water removal by an applied vacuum, while precutWhatman GF/C filter discs lined the bottoms of the holders to retain the test organismfollowing water removal. To observe the luminescence from the vacuum stimulztedorganisms, an RCA 8575 PMT was mounted onto the test chamber port. The output ofthe PMT (high time resolution) was displayed as a time sequence of counts/40 ms timechannel from the induced flash. The -instantaneous" intensity of the signal is proportional to the number of counts in each channel. Recovery of the luminous plankter
" was made by several washings of the sample vial with filtered seawater into a beaker andthen preserved in a buffered 2.5-percent formalin solution for later identification. In all,187 plankters were tested and of these, 53 proved to be luminescent. The luminescent"'isolate'" data represented by dinoflagellates. larval, and adult copepods identify whichspecies contributed to the measured bioluminescence. All collected plankton sampleswere washed into sample jars with filtered seawater and preserved in a buffered solutionof 2.5-percent formalin. Analysis of these samples will be completed in FY 87.
-it,
_7_
-A
e. di" it,
, , - ON
% .... ........
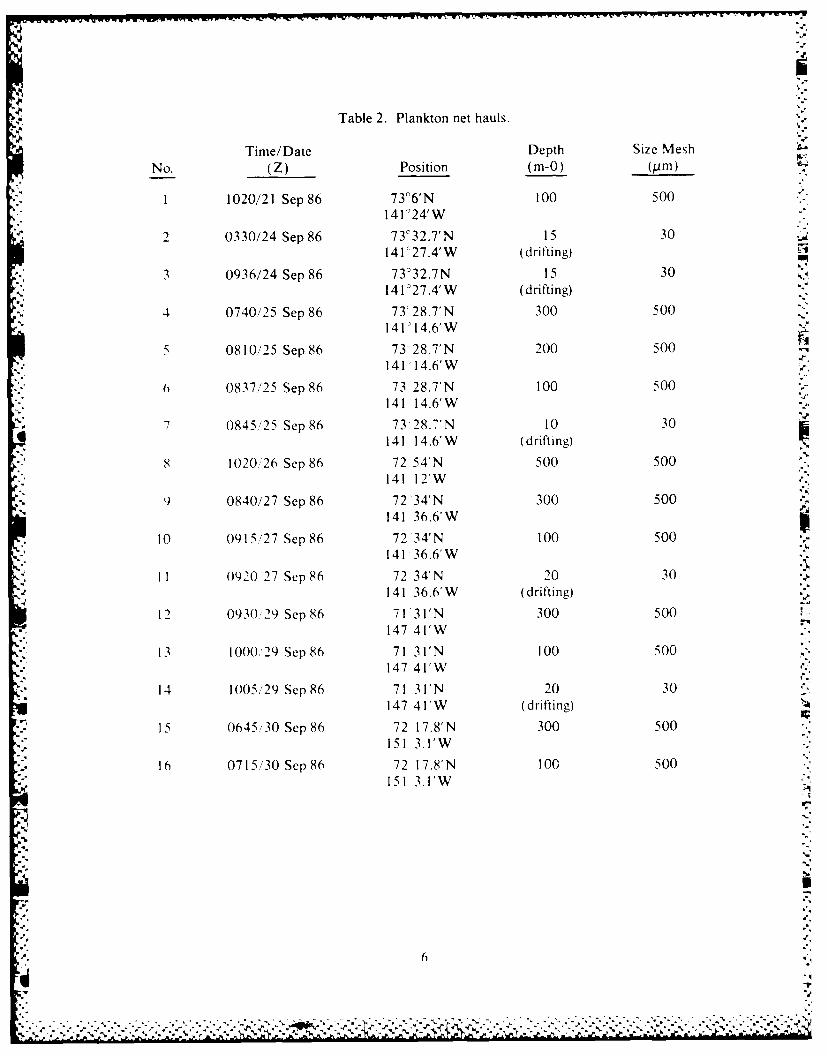
Table 2. Plankton net hauls.
Time/Date Depth Size Mesh "
No. (Z) Position (m-O) (pim)
1 1020/21 Sep 86 73°6'N 100 500141o24'W
2 0330/24 Sep 86 73:32.7'N 15 30141 ° 27.4'W (drifting)
3 0936/24 Sep 86 73°32.7N 15 30141 °27.4'W (drifting)
4 0740/25 Sep 86 73 28.7'N 300 5001411A4.6'W
0810/25 Sep 86 73-28.7'N 200 500141:14.6'W
6 0837,25 Sep 86 73 28.7'N 100 500u.
141 14.6'W -4,
7 0845/25 Sep 86 73 28.7'N 10 30141 14.6'W (drifting)
8 1020/26 Sep 86 72 54'N 500 500141 12'W
9 0840/27 Sep 86 72 34'N 300 500141 36.6'W
10 0915/27 Sep 86 72 34'N 100 500141 36.6'W
11 0920 27 Sep 86 72 34'N 20 30 .
141 36.6'W (drifting)
12 0930 29 Sep 86 71 31'N 300 500147 41'W
13 1000'29 Sep 86 71 31'N 100 500147 41'W
14 1005/29 Sep 86 71 31'N 20 30147 4 I'W (drifting)
15 0645/30 Sep 86 72 17.8'N 300 500151 3.1'W
16 0715/30 Sep8 6 72 17.8'N 100 500
151 3.I'W
S-A€ 4"
-4. 6
- ' - . - . , .. . -. ' -. .- . , ;
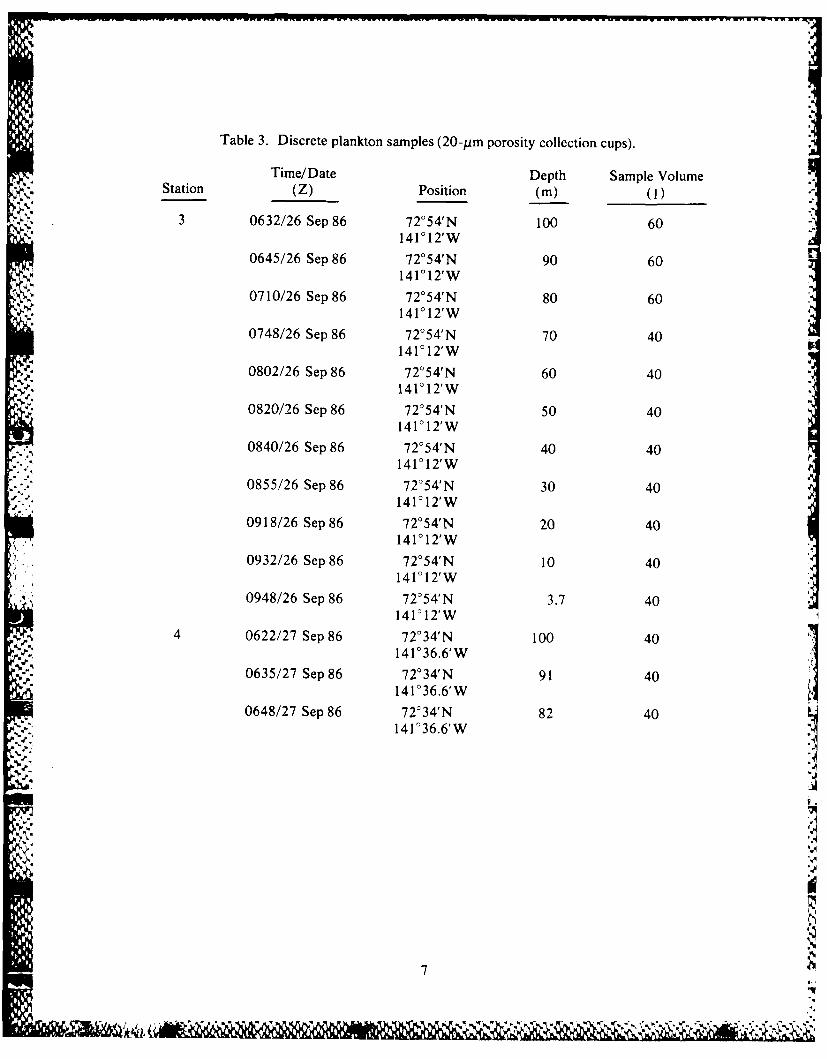
Table 3. Discrete plankton samples (20-pm porosity collection cups).
Time/Date Depth Sample VolumeStation (Z) Position (M) (j)
3 0632/26 Sep 86 72054'N 100 60*" 141 012'W
0645/26 Sep 86 72054'N 90 60141 0 12'W
0710/26 Sep 86 72 054'N 80 60141 0 12'W
0748/26 Sep 86 72°54'N 70 40141 0 12'W
0802/26 Sep 86 72°54'N 60 40141 012'W
0820/26 Sep 86 72054'N 50 40141012'W
0840/26 Sep 86 72054'N 40 40141012'W
0855/26 Sep 86 72054'N 30 40141012'W
0918/26 Sep 86 72054'N 20 40141012'W
0932/26 Sep 86 72054'N 10 40141012'W
0948/26 Sep 86 72054'N 3.7 401410 12'W
4 0622/27 Sep 86 72034'N 100 40• "141 036.6'W
0635/27 Sep 86 72034'N 91 40141 036.6'W
0648/27 Sep 86 72034'N 82 40141 036.6'W
J,.°7
RIIpE *
o\:,
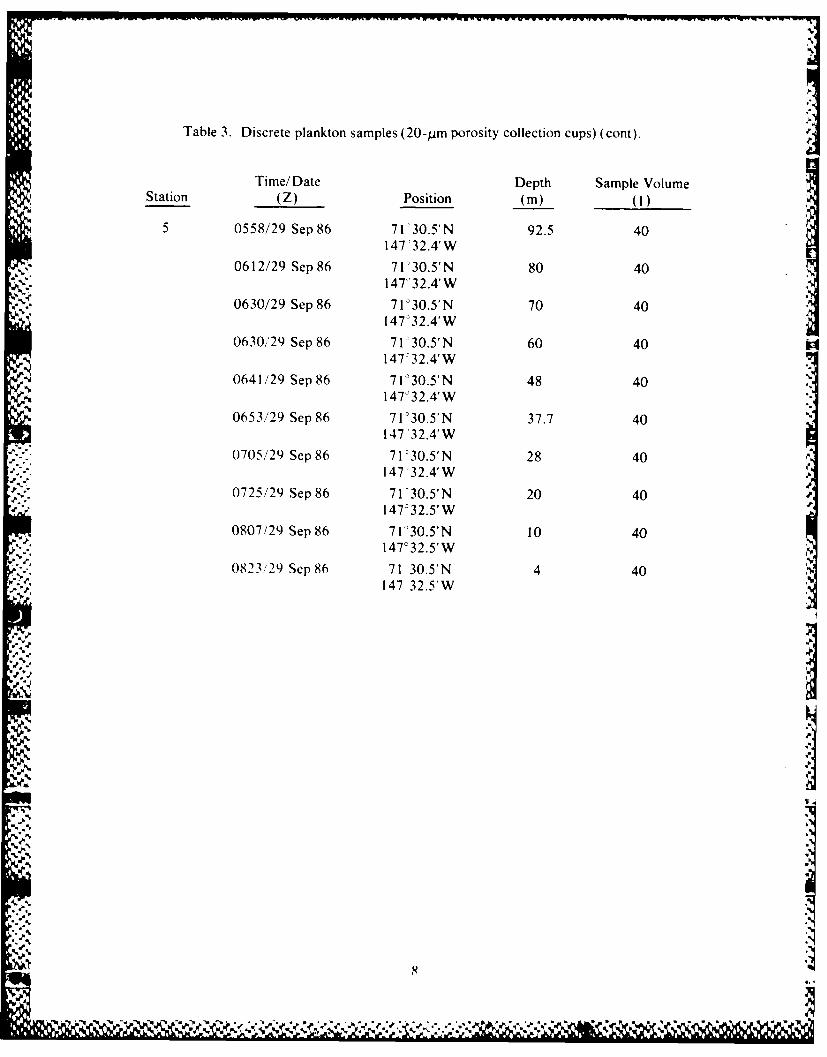
Table 3. Discrete plankton samples (2 0-pm porosity collection cups) (cont).
Time/Date Depth Sample VolumeStation (Z) Position (M) (I)
5 0558/29 Sep 86 71 30.5'N 92.5 40147 32.4'W
0612/29 Sep 86 71 '30.5'N 80 40147 32.4'W
0630/29 Sep 86 71-30.5'N 70 40=, 14732.4'W
0630/29 Sep 86 71'30.5'N 60 40147"32.4'W
0641/29 Sep 86 71 9 30.5'N 48 40147"32.4'W
0653/29 Sep 86 71-30.5'N 37.7 40147'32.4'W
0705/29 Sep 86 71 30.5'N 28 40147,32.4'W
0725/29 Sep 86 7 1'30.5'N 20 4014732.5'W
0807/29 Sep 86 71'30.5'N 10 40147032.5'W
0823/29 Sep86 71 30.5'N 4 40147 32.5'W
Pdr
8
I- 4
oc
N LA.
...........-
a -N
.cc
4'r
a.~0 Utut
I i7
iaK
7 7
Le),co IN
Ut9
FIRST IMPRESSIONS
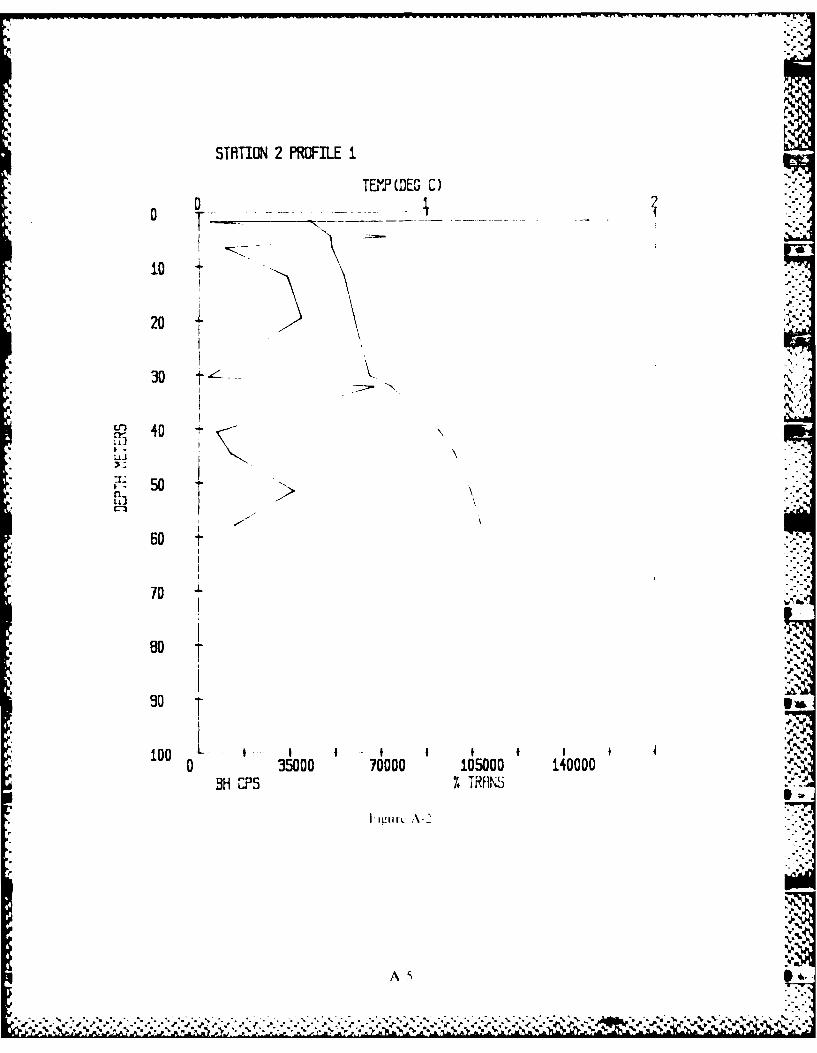
Of the five stations attempted, the last four yielded information that is interesting K4and unique. Instrumentation problems were experienced at a depth of 60 m during thefirst station, and any acquired data must be considered suspect. The entire system waschecked, cleaned, and reassembled. BNC cables were replaced from the cable junctionbox to the multiplex module while the submarine cable connector plug was recleaned andtightened. No further problems were experienced with the fish during the remainingstations. While Sea Bird temperature frequency was recorded on both data acquisitionsystems, one of the algorithms used for interpreting seawater temperature was inappropriatefor use in the cold arctic waters and must be recalibrated. Temperature profiles areincluded for completeness and will be corrected as soon as data from CTD cast taken justprior to the bathyphotometer drop become available and are compared with values _'recorded by the uMac-5000 measurement and control system.
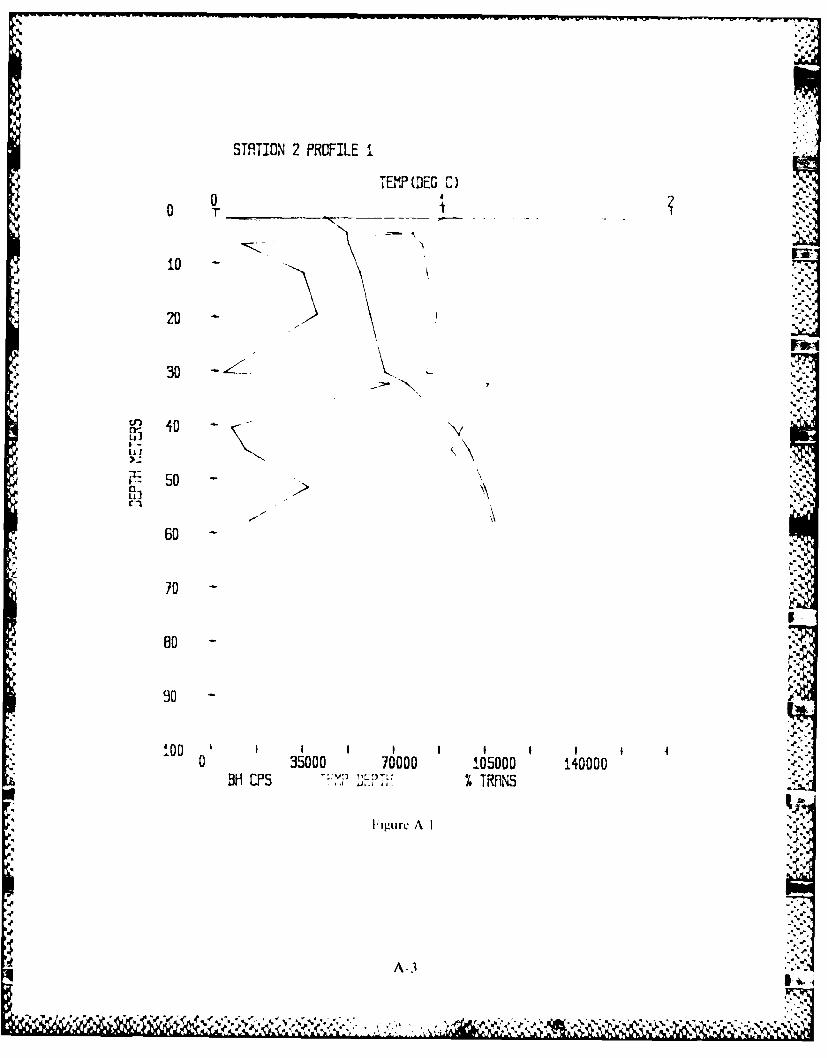
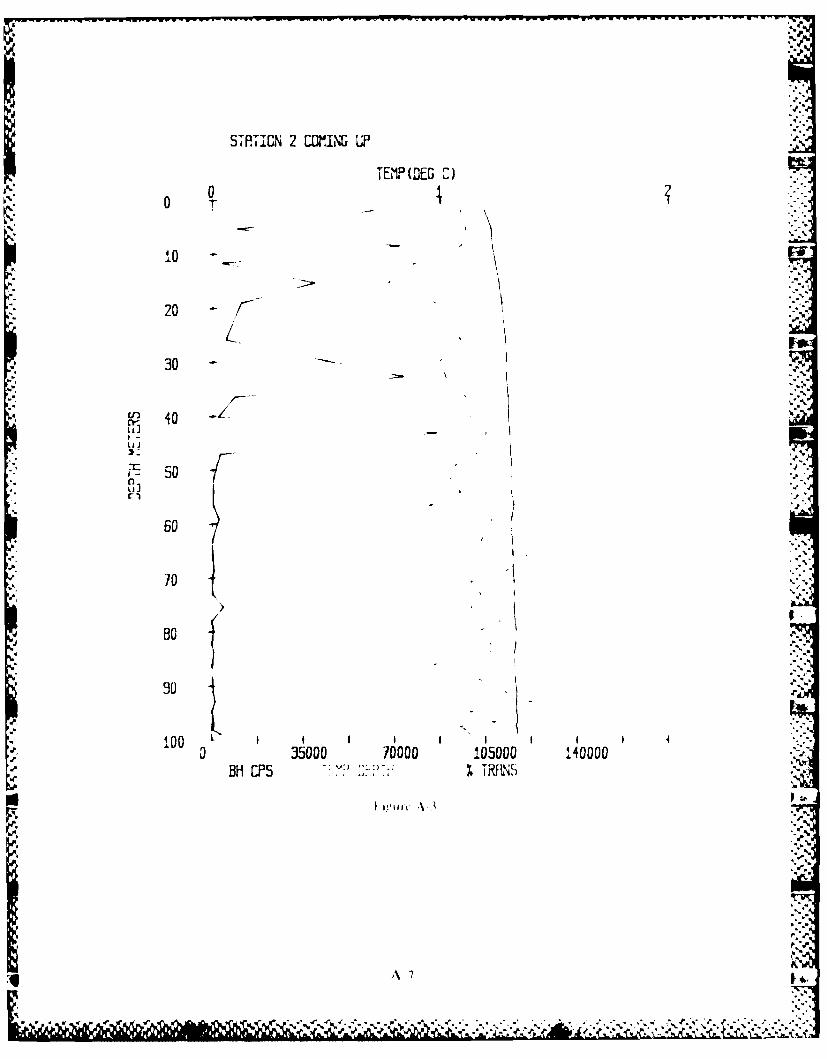
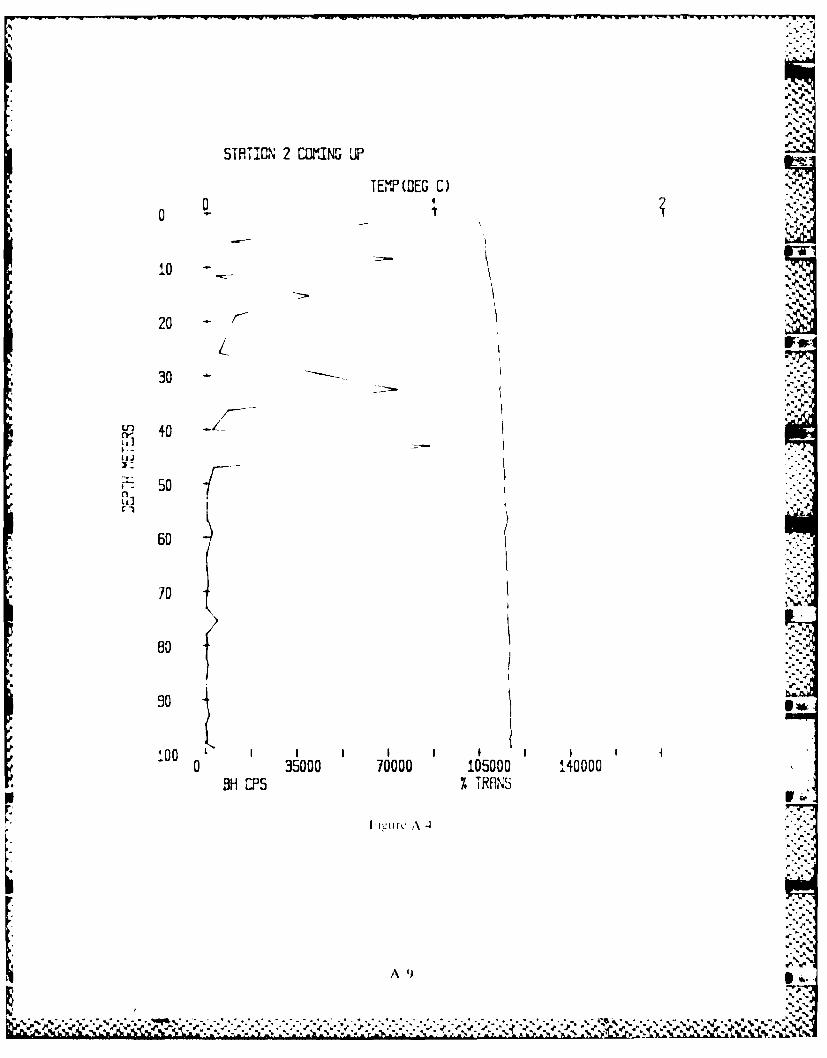
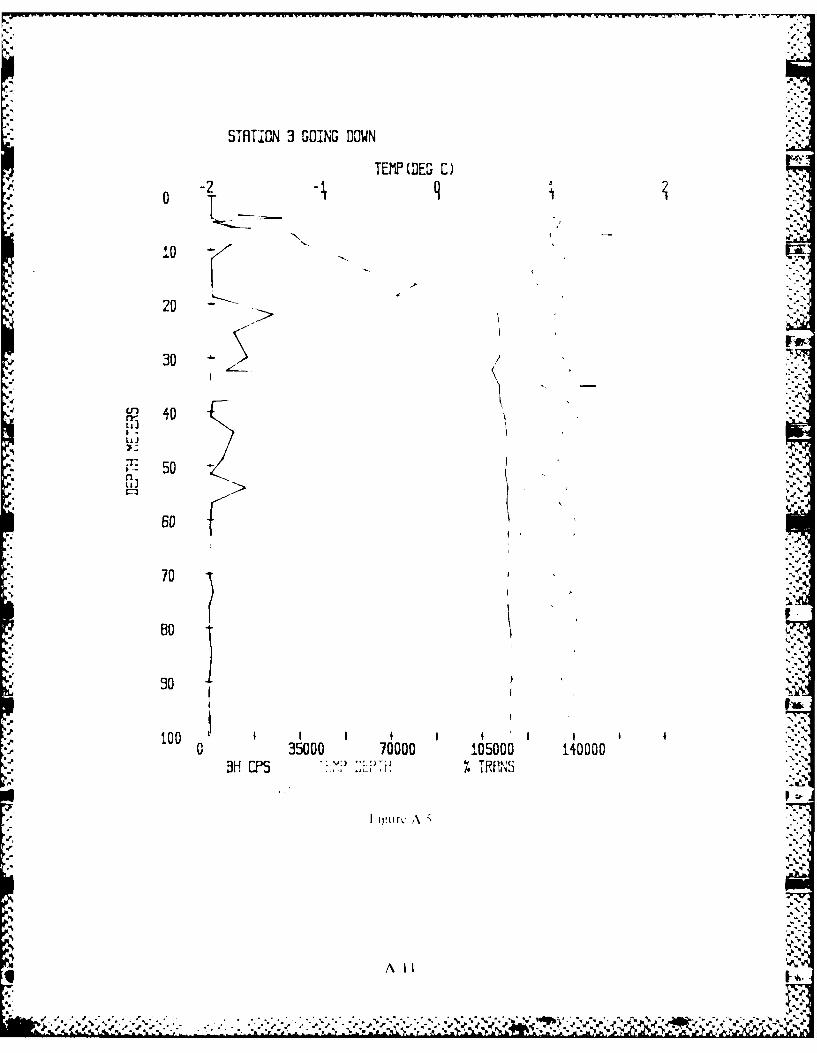
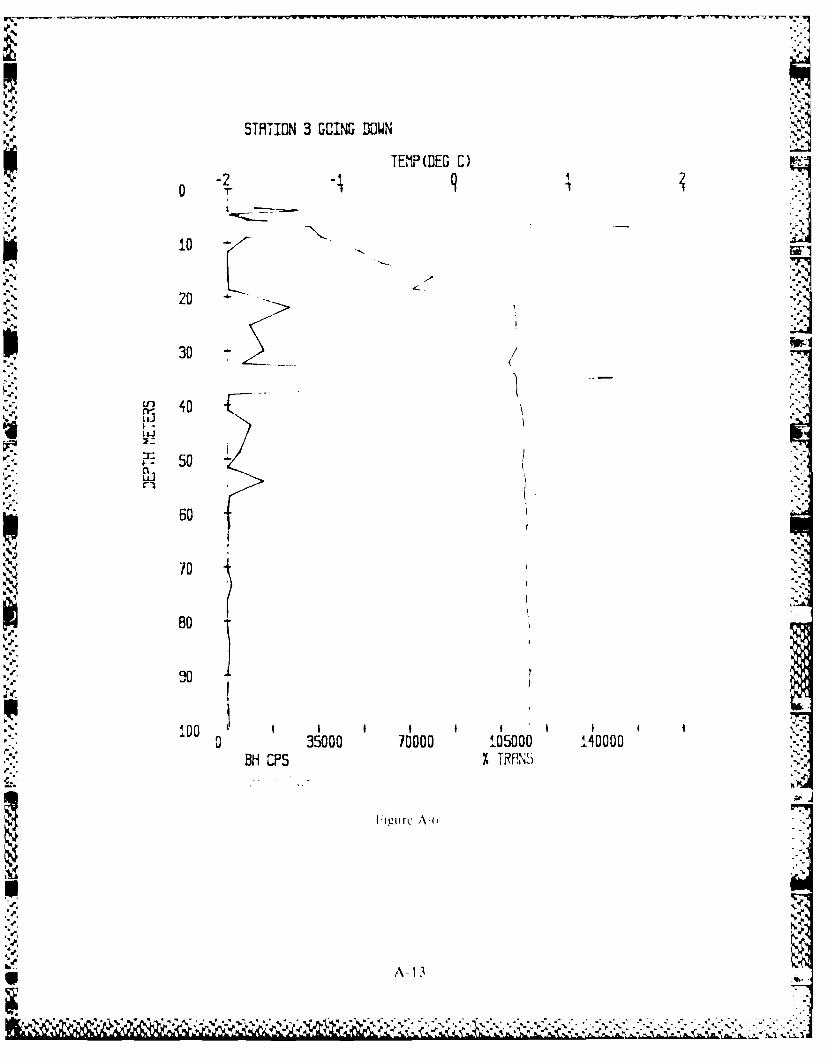
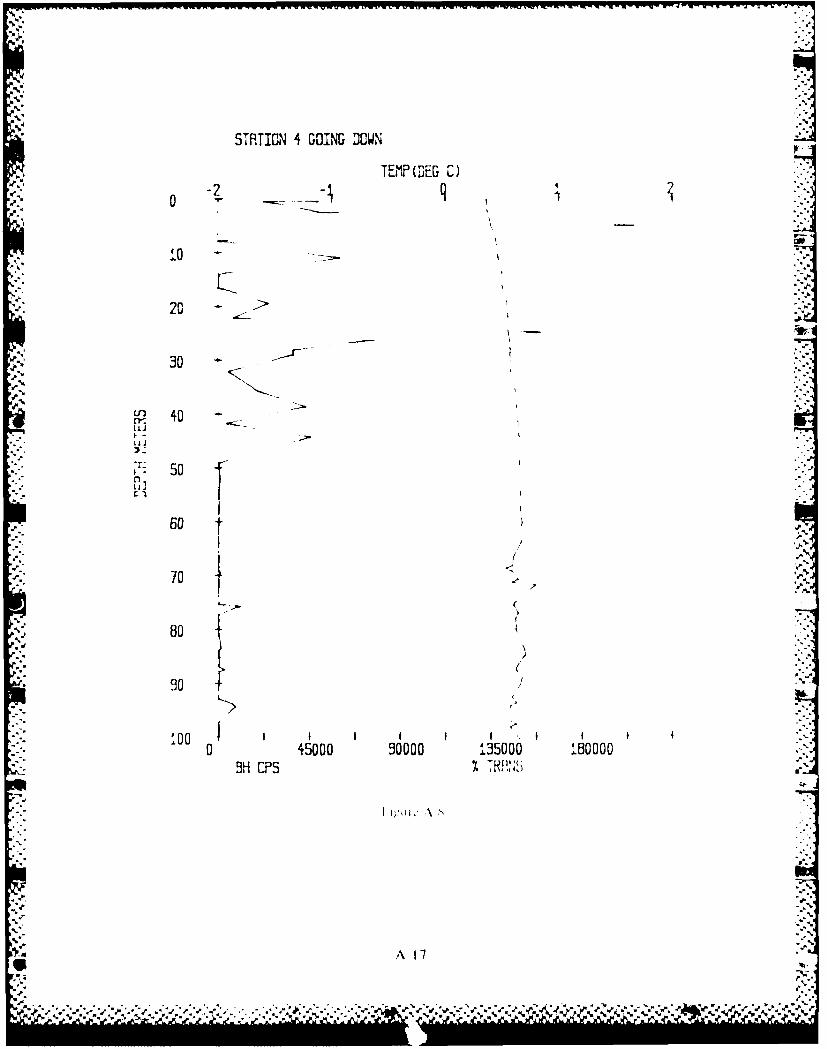
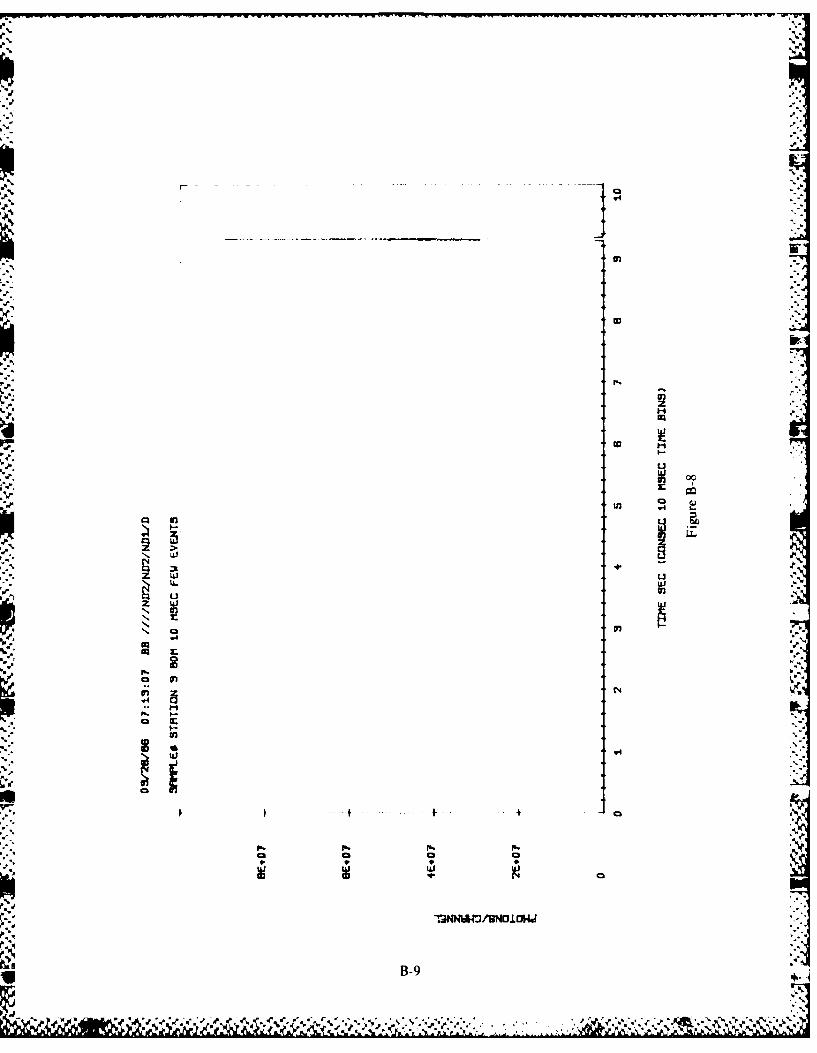
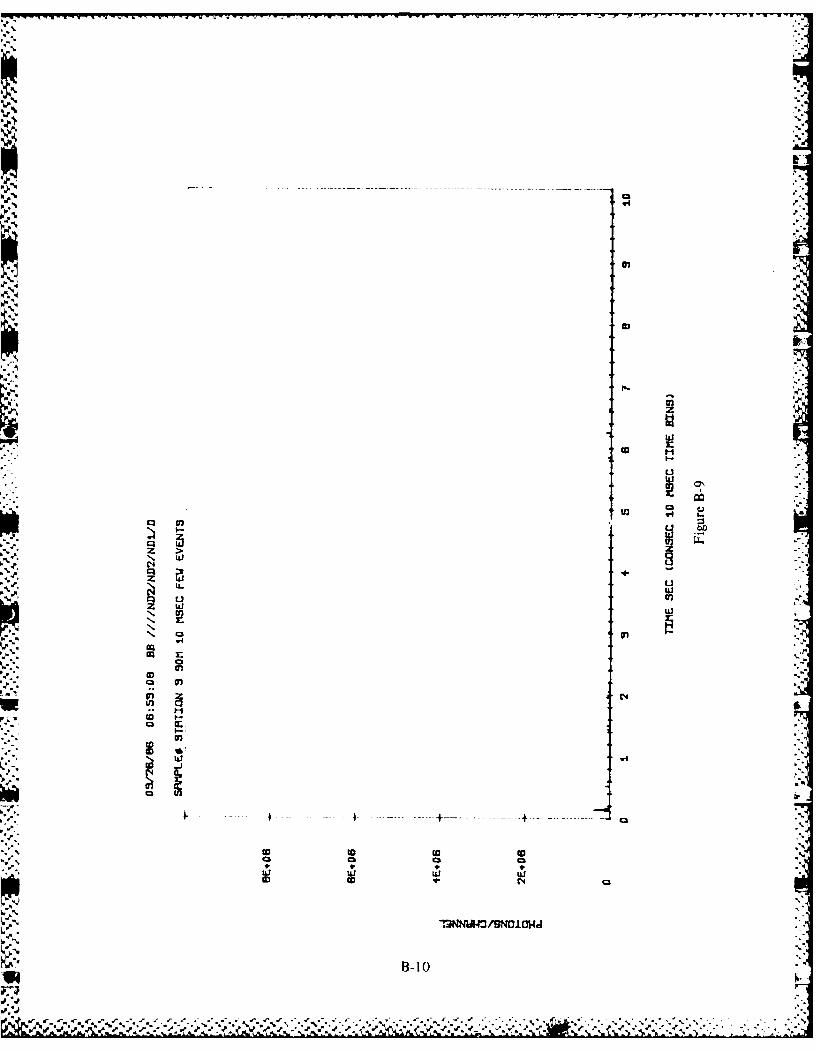
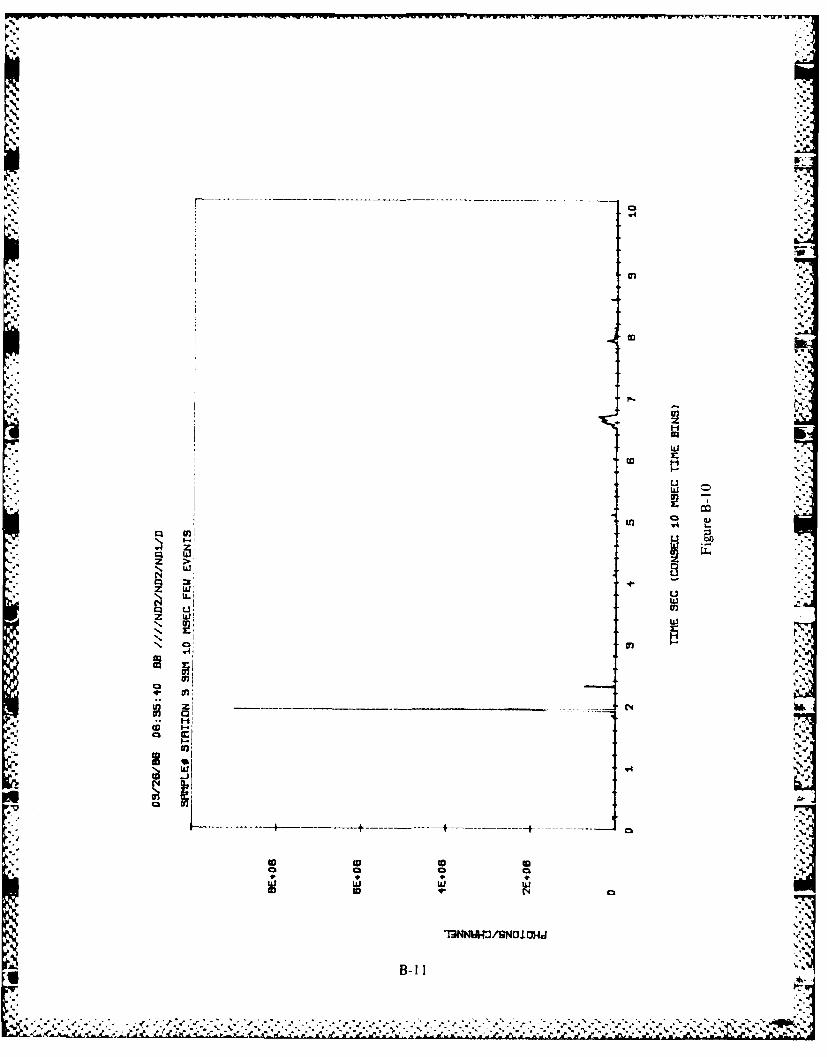
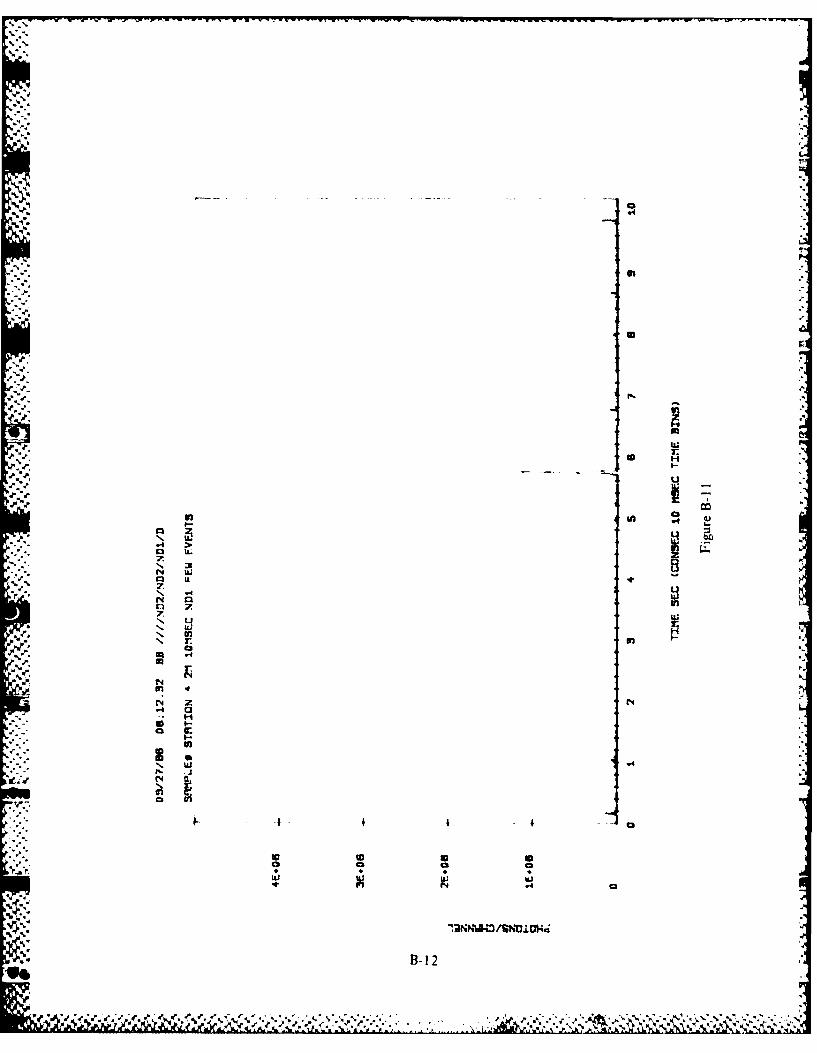
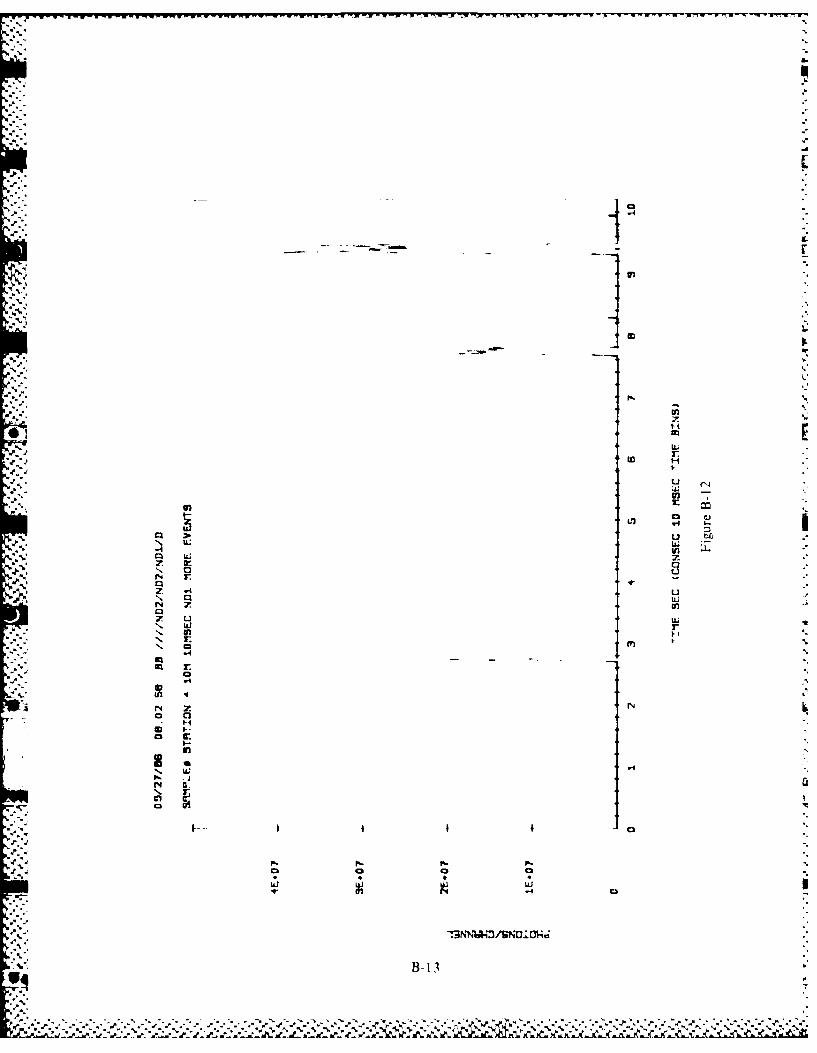
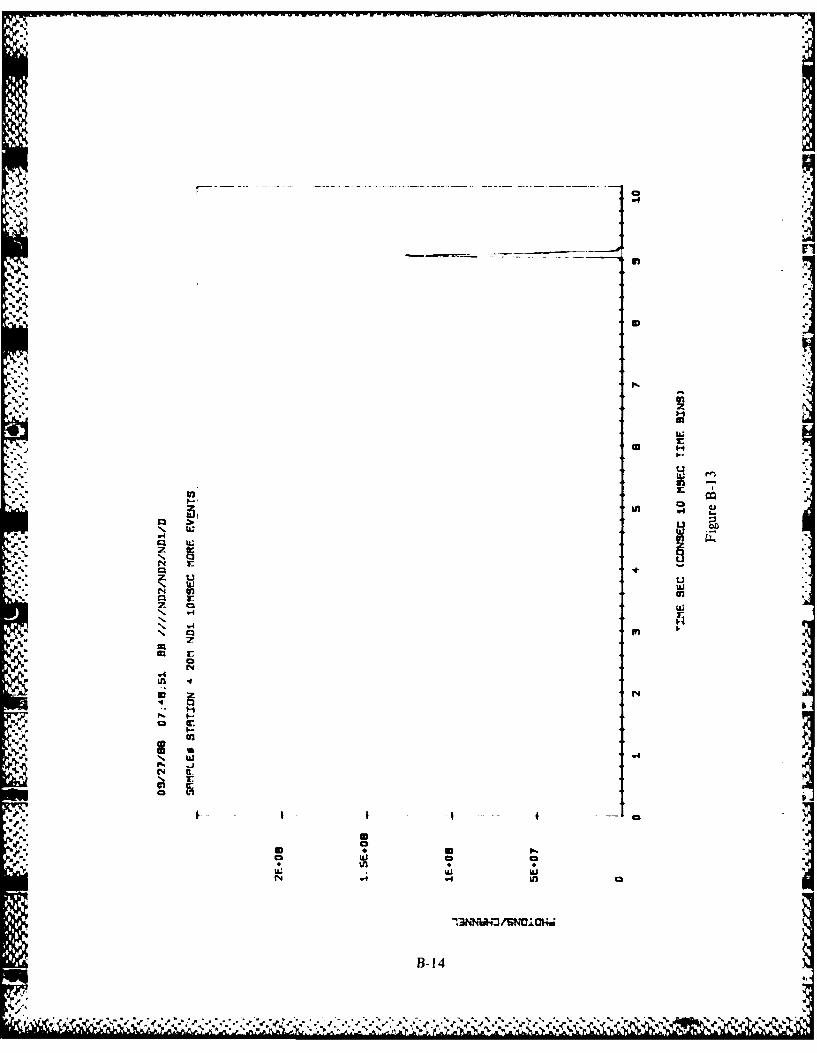
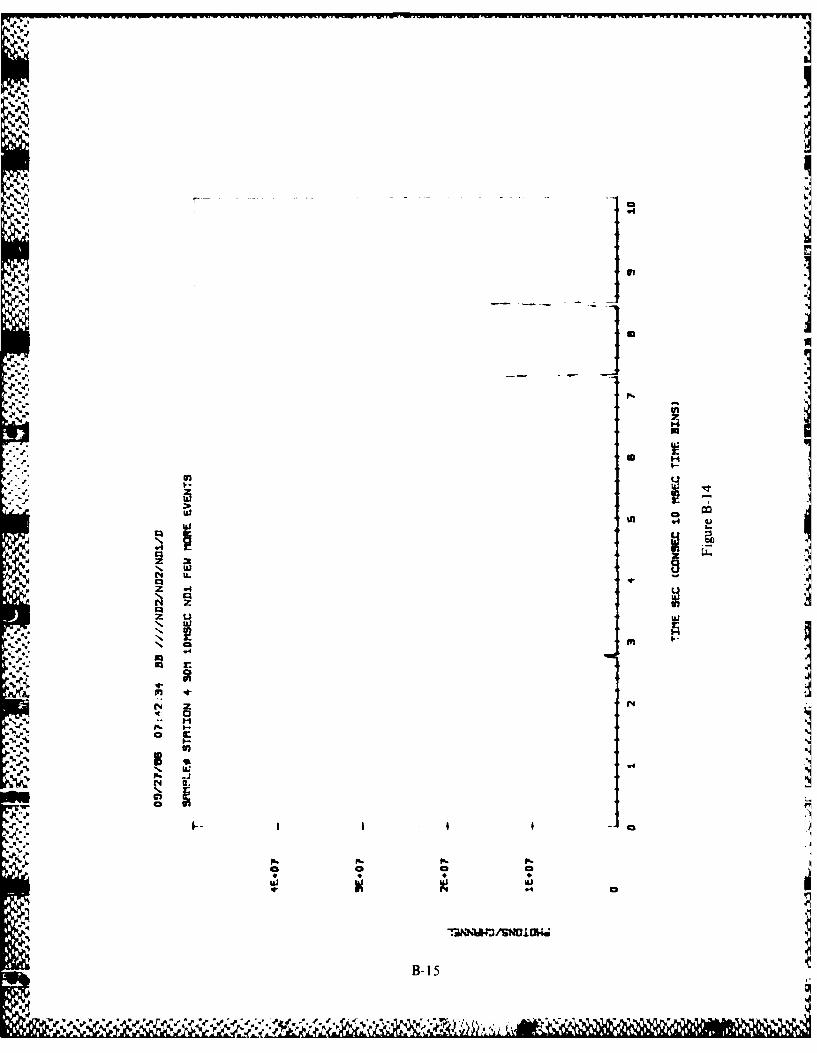
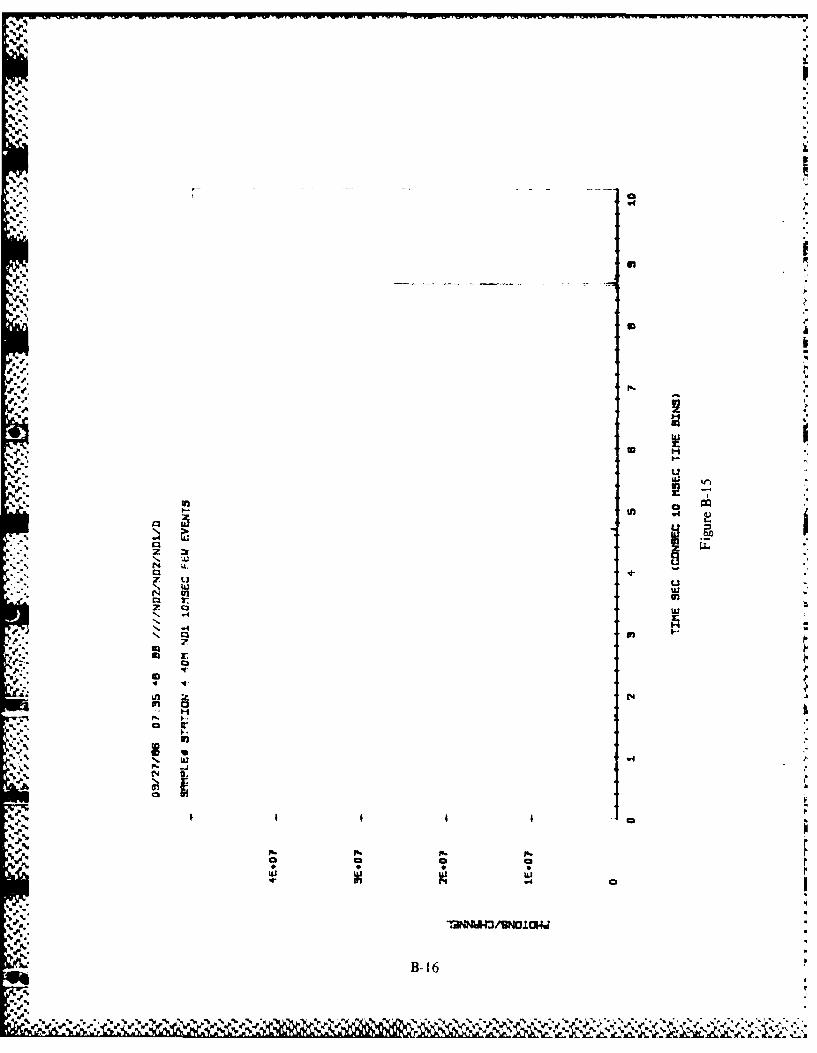
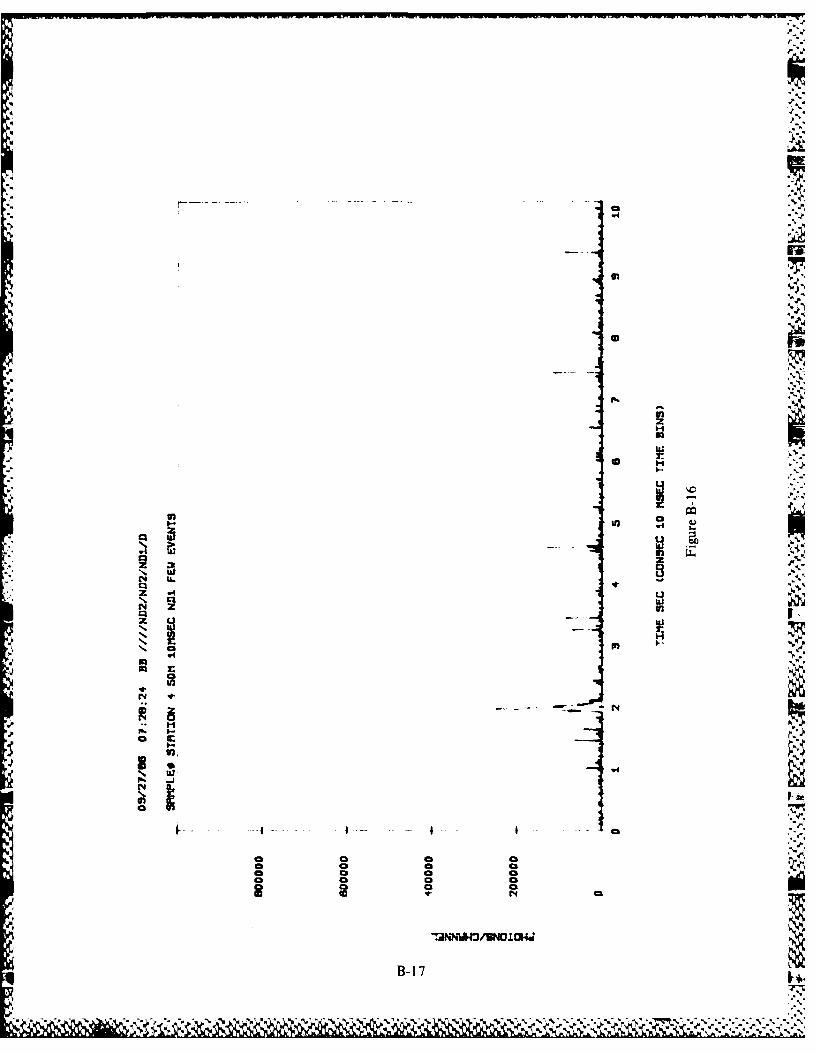
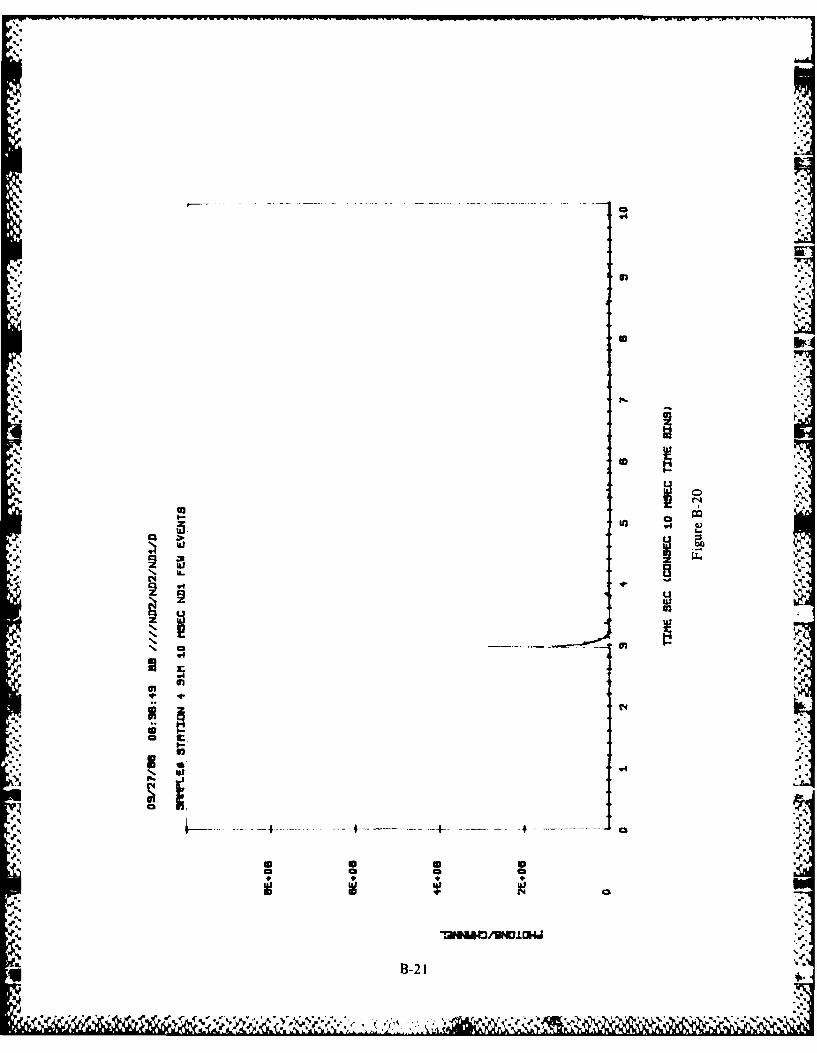
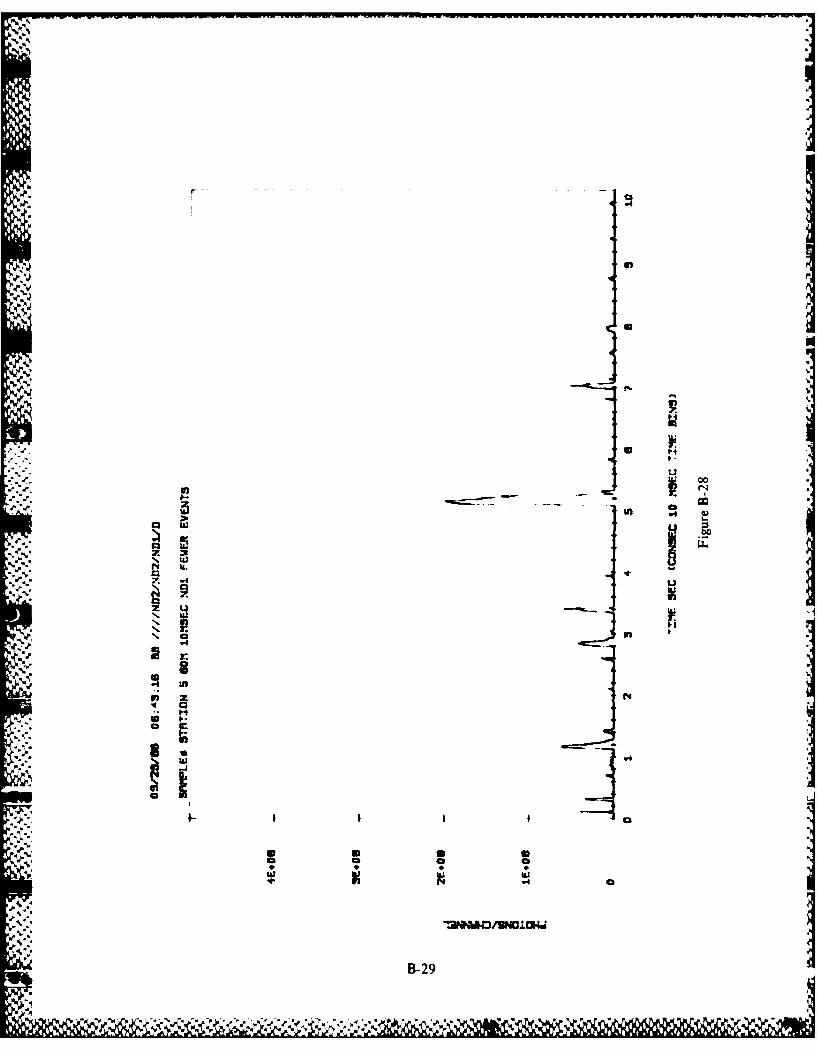
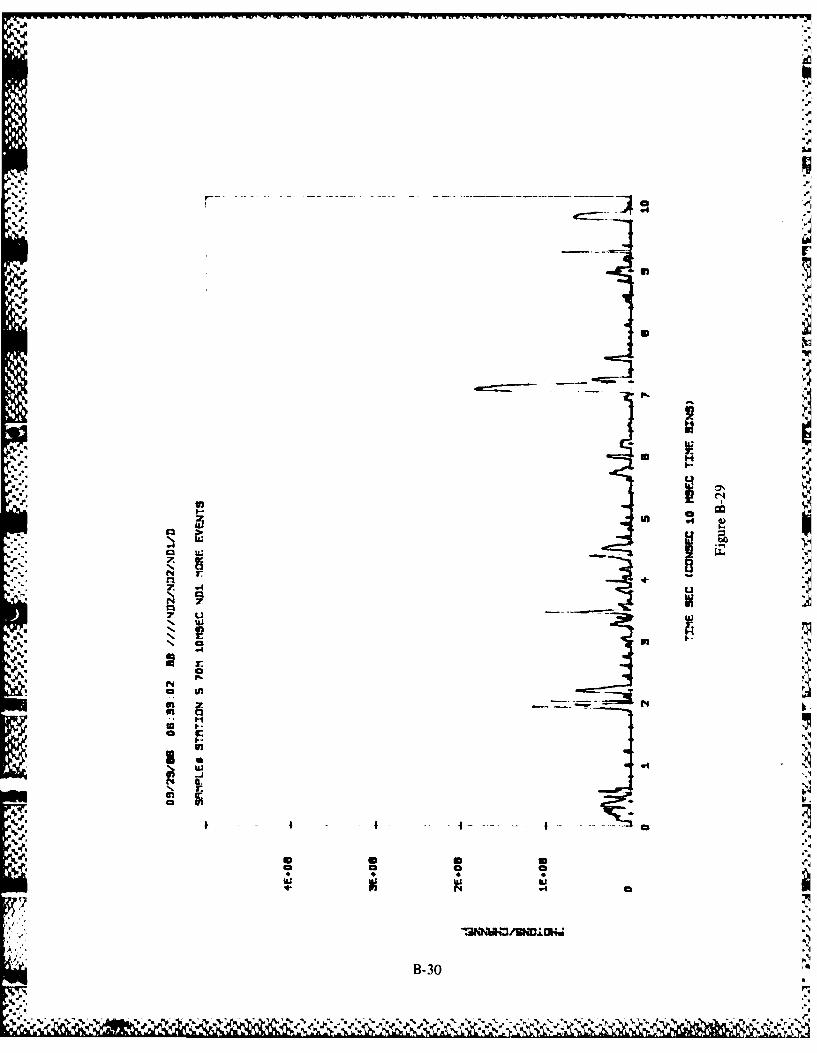
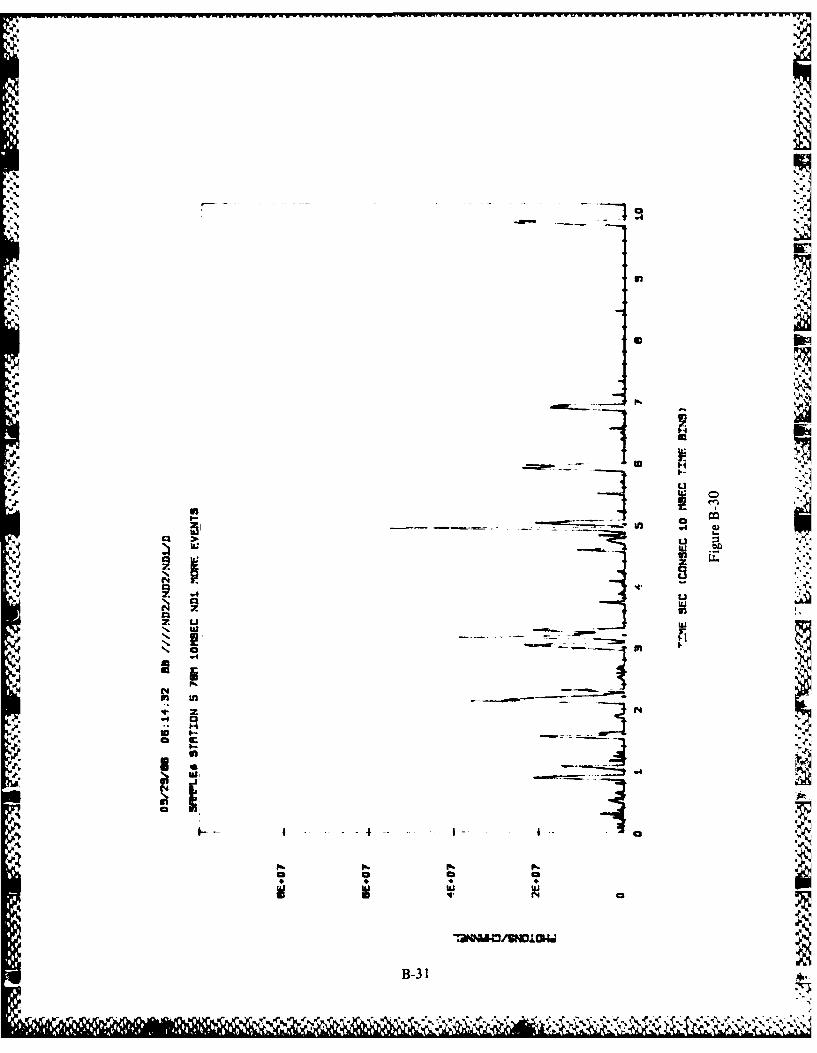
-.. B ioluminescence structure and intensity were very similar at stations 2, 3, and 4.In each of these profiles, the lowering rate was held as constant as possible, but betweenstations, the lowering rate ranged from 3.1 m min-I to 9 m min-1 with samplingresolution of 1.55 to 4.5 m. The spatial sampling resolution with the uMac-5000measurement and control system ranged from 0.1 to 0.3 m. Several distinct layers werealways observed within the upper 50 m of the profile. Below 50 m, the bioluminescence
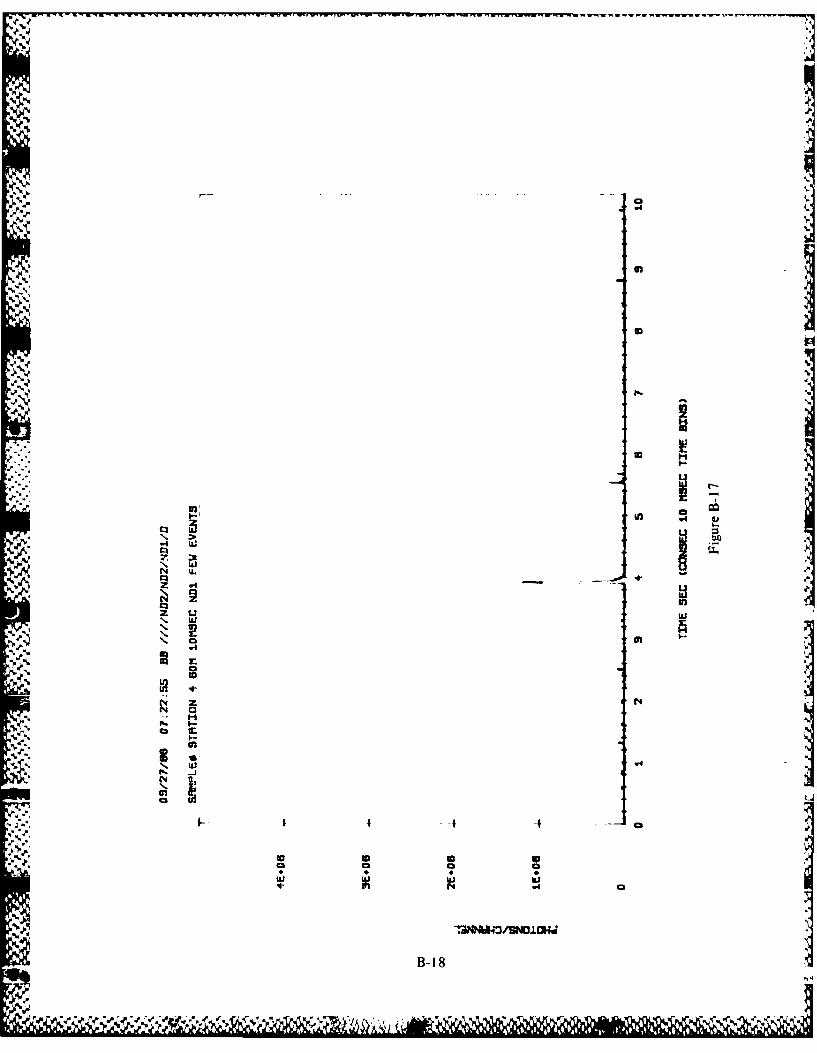
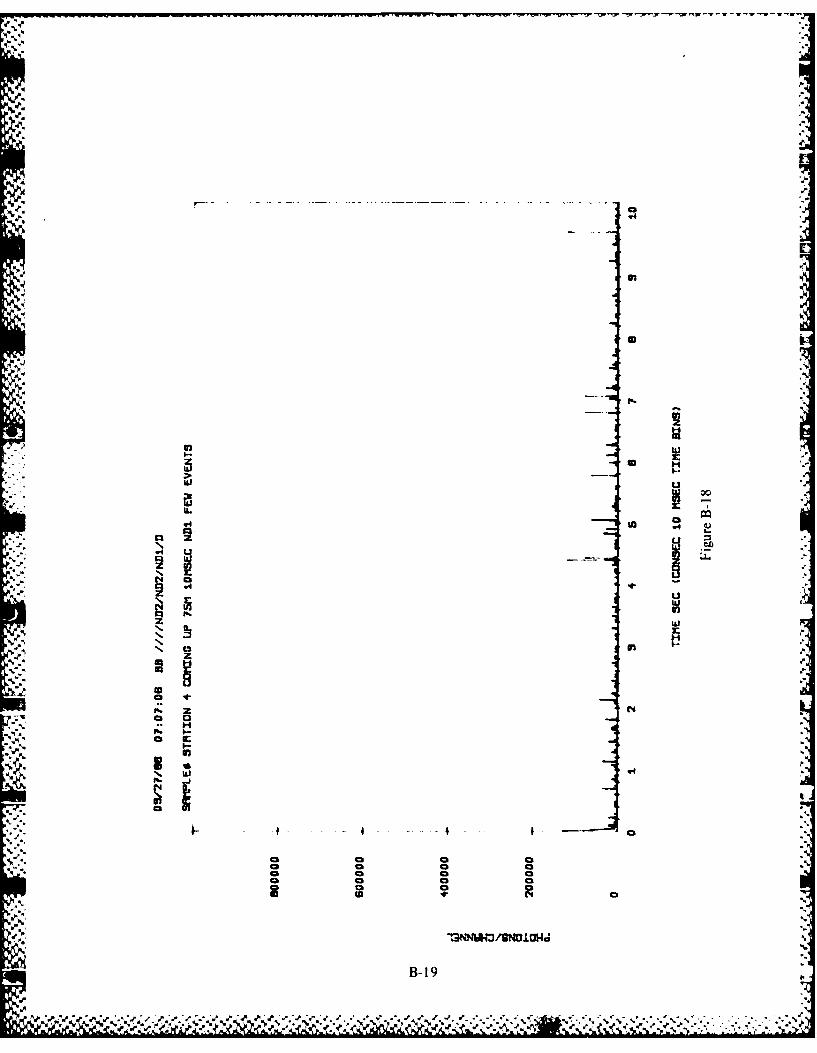
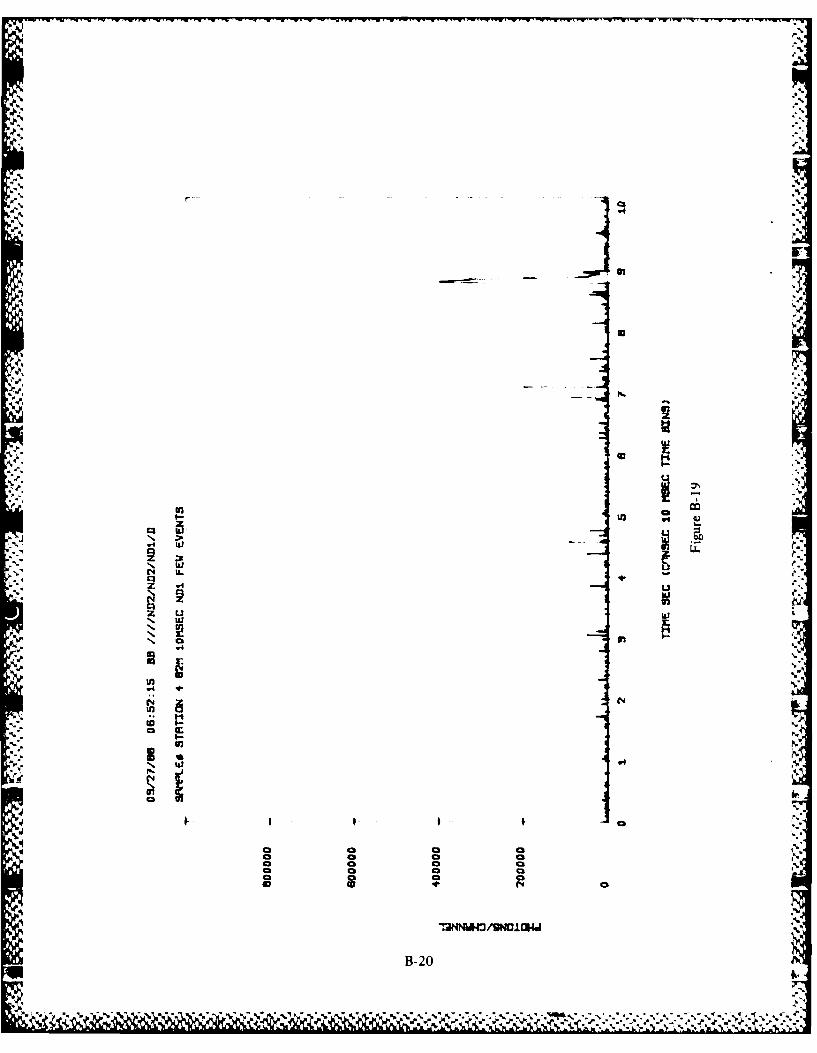
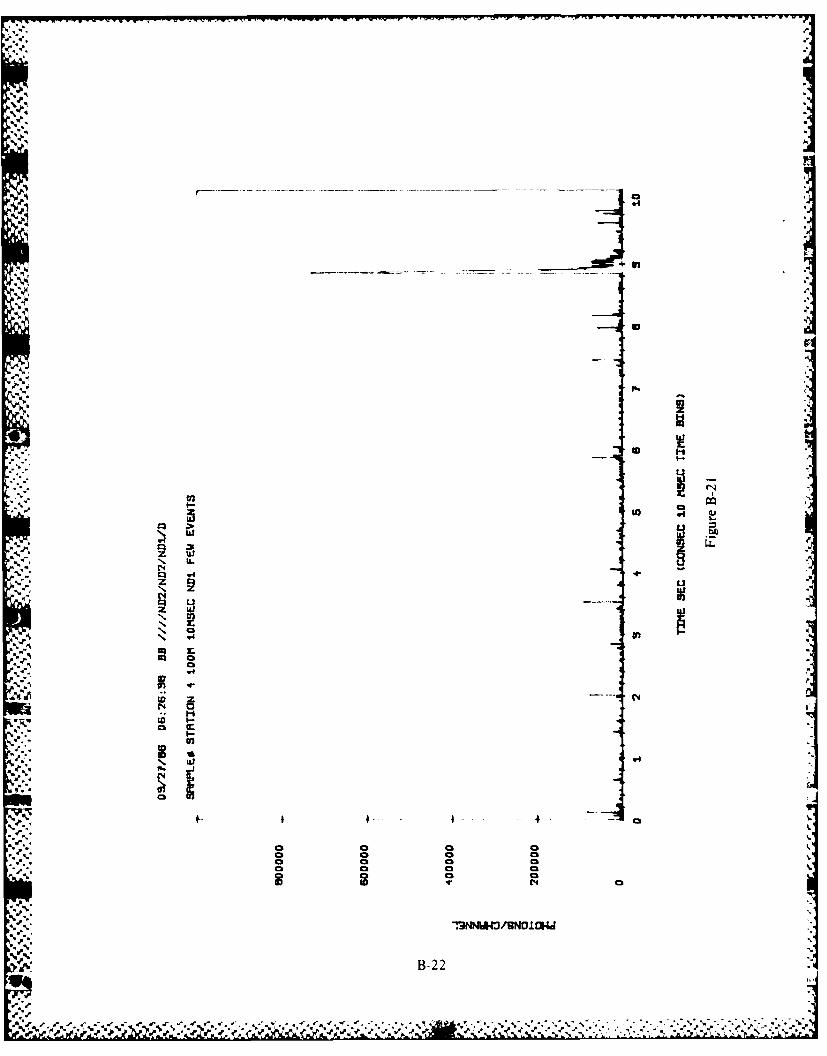
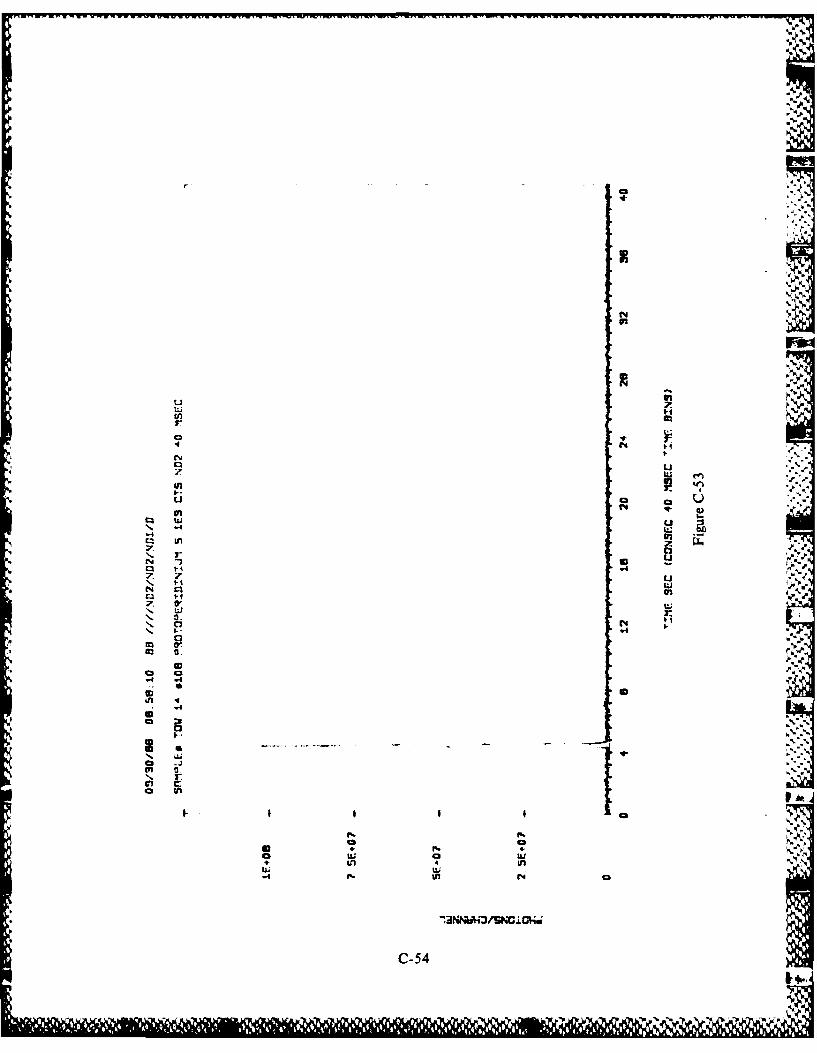
intensity was markedly less. The intensity associated with these layers was 1 x 10⁵ PMTcounts s- ! (3 x 10⁶ photons s- 1 cc- 1 of seawater) and is characteristic of that found inother open ocean measurements. By testing some of the plankton collections, weobserved that the only plankton capable of emitting light sampled by the bathyphotometerin this area, below the ice pack, were nauplii or larval stages of a luminescent copepodMetridia longa (see appendix C). The adults were sampled by the detector, but lessfrequently. Many dinoflagellate cells of Protoperidinium and Ceratium were tested,
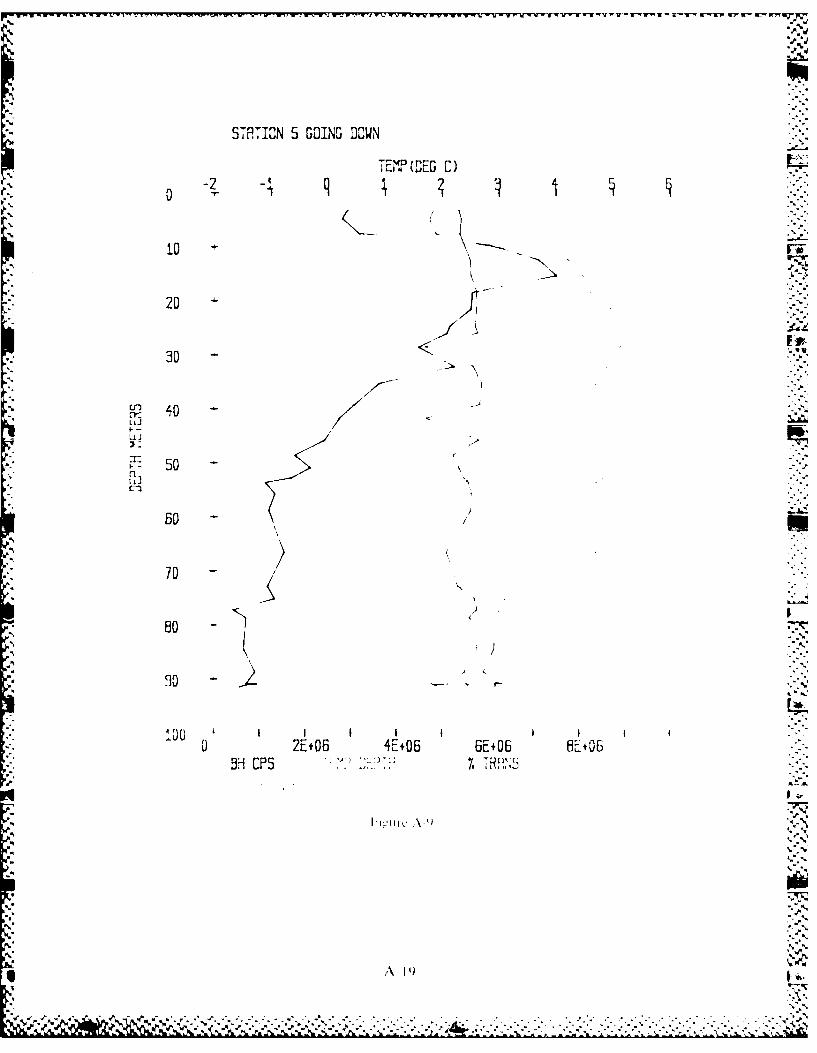
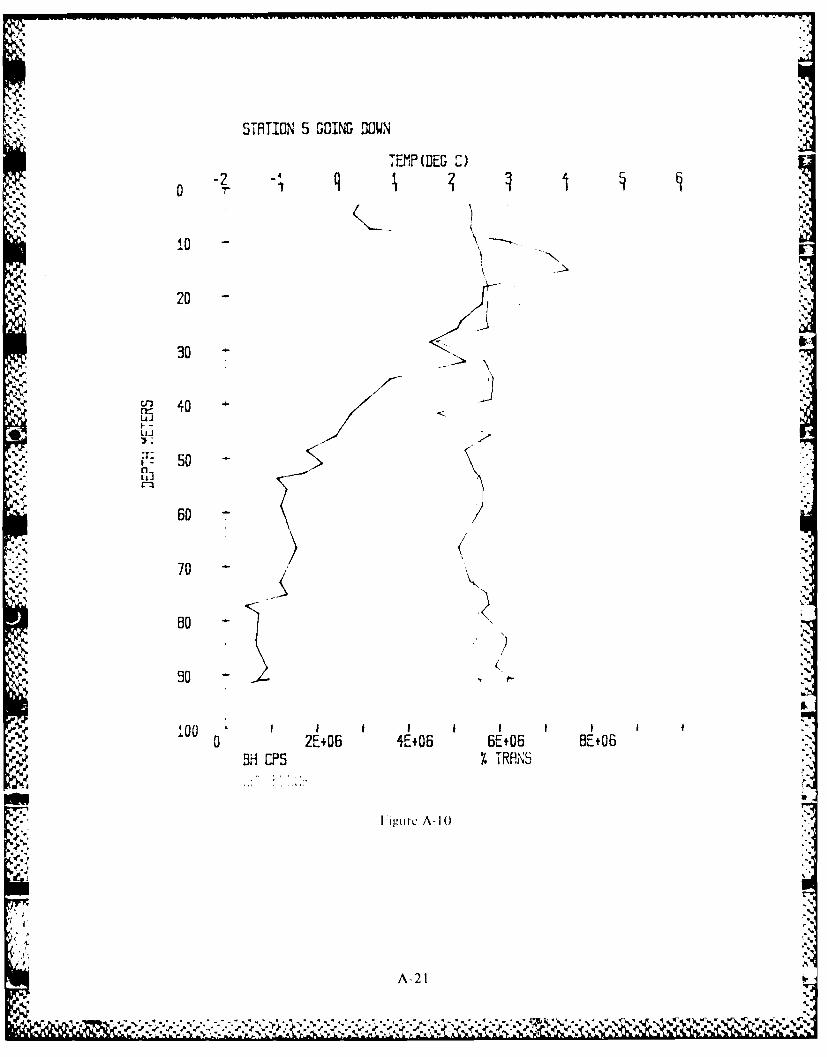
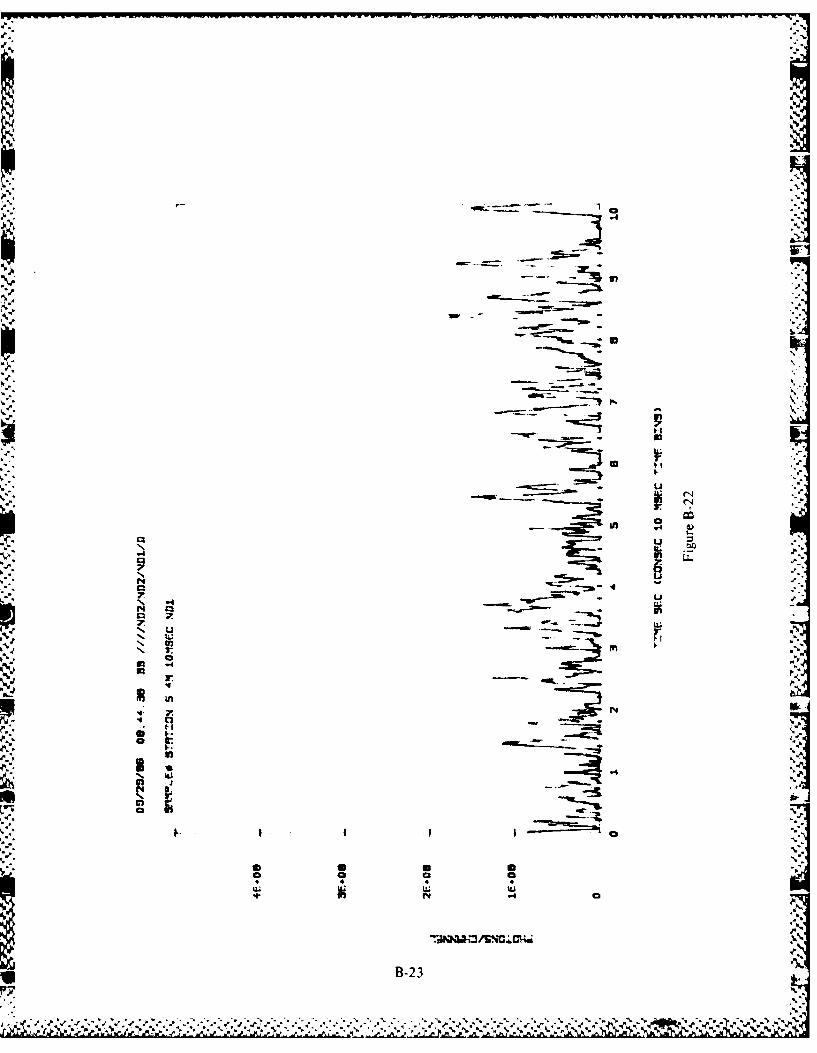
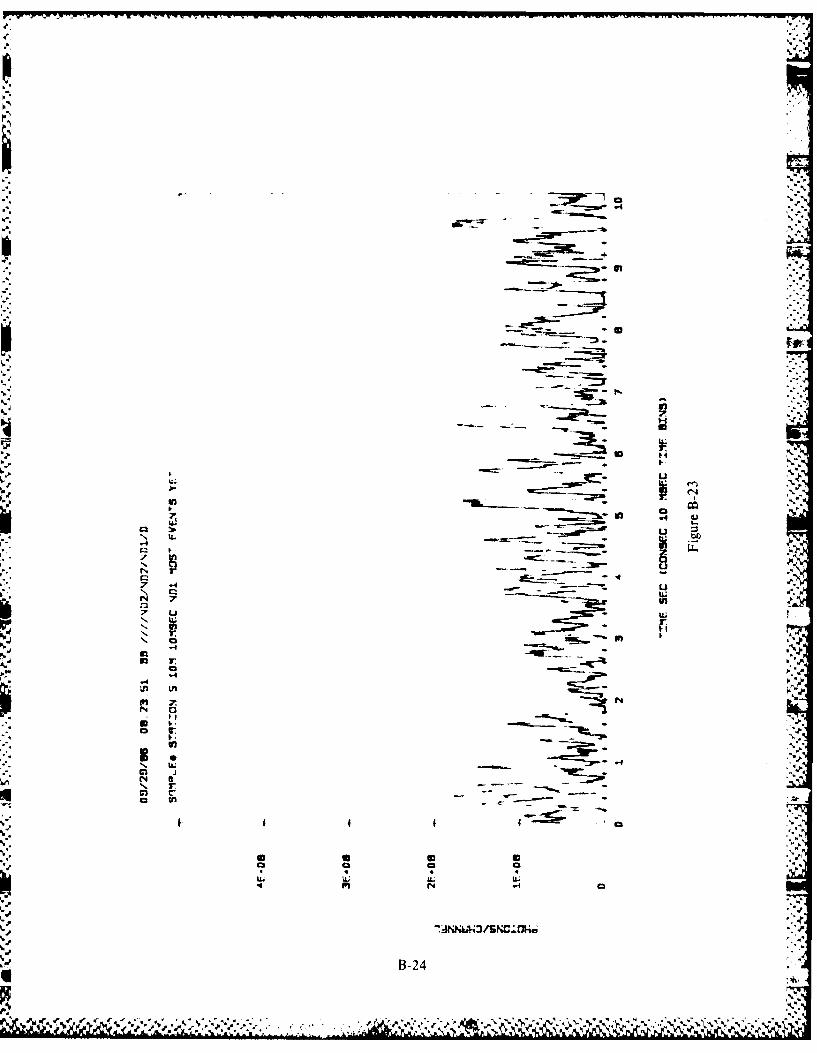
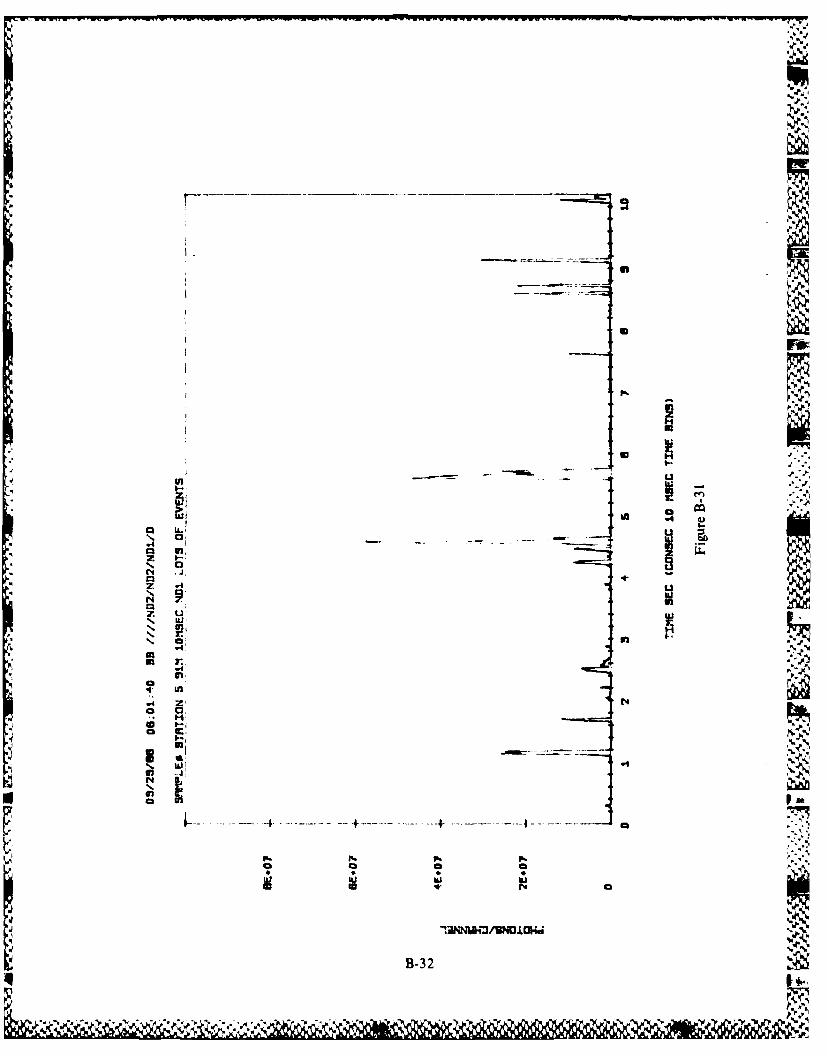
however, no luminescence was observed. Other larger zooplankters captured in deepernet tows were observed to luminesce. At station 5. the bioluminescence structure andintensity were completely different from preceding stations. The peak intensity wascentered at about 15 m below the sea surface and exhibited an intensity of approximately7.5 x 106 PMT counts s- I (2.3 x 10⁸ photons s- 1 cc- I of seawater) or a factor of 75greater than the peak intensity values exhibited at the pack ice stations. The intensitydropped by a factor of 50 from its peak value at 15 m to that found at 92 m. This stationshows a warm water intrusion within the cold arctic water. The dynamics of the cold andwarm water mixing appear to have imparted some spatial structure to the optical 'p.
transmission of seawater and chlorophyll fluorescence. The biological collections taken atthis station show the presence of not only luminous larval stages of copepods but asignificant contribution by several other species of the luminescent dinoflagellateProtoperidinium.
10
,..I7 "

APPENDIX A
BATHYPHOTOMETER PROFILES
I'
.4 .
i, -,
STATION 2 PROFILE I
10 "
20
30 z2 "
40 " "
L I
50 -
IL).60 -
70
80.
90
100 I I I I I I I I0 35000 70000 105000 140000BH CPS TRA2 2"-:h "'NS
* liglirc Al I
A.-
A- 3 ,I'
.,. , , , , ,< - '-.' - , - ' - ,. ,- - . .. , ,- . .,,. "',
STRTION 2 PROFILE 1
TEVP(DEG C)
_o_ _-- I0 0
20 t
n 0 i.
Lu I
60 t
7090 40al
70 f 4 4
0 35000 70000 105000 1400003H P5 7. TRhNf
A S 4 .
~ ~ . Co- P--
STPTION 2 COMhING UPTEBI (DEG C) '..
0
m 40
0 -
30 -
50
03
- 1 • .' %
.
70
8.
.
1 00
BH CPS.1, TRM
A 7
f...
.t 7 4 ft. . - .-
.- a -x .& 9 . . --- }-. . . & .. *% [. ". .,"L. i." - .-e.,.-i---..-" .'Z-... _,-[, ,,.* . ,'-' .) ,'-,"..I -
.-.-.7
STHTION 2 COIN UP
TE1P(DEG C)0
010 <
20 -
30
404mi 40 ..Z ?
50 -
60 W.
o
Io I
I0 o- o t
0 35000 70000 105000 140000
B3H CPS T TRAN5
A [-
[-r
[.A
l47
IN 4l,,.
STRTION 3 GOING DOWN
TEMP (DEC- C) ,A, -2 -; q 4'' -'.
10
20
:i=_30 "
40
70 I -50
70800
10 0A & I I I I .. .0 35000 70000 105000 140000
BH Cf5 C PIFINS
I , !Lii",. ., , -
A 11
"" A I '
• .
STRTION 3 GOING DOWN
-1 - TEPR(DEG C)
10
20 "r
30
L. °-
Ln 40
50
1 o99-
100 , 9 o I ..--0 35000 70000 105000 140000
B3H CPS 7 TRR i"-5.
A 13.U,., -.

STATION 4 GOING DCWN
TE P(DEG C)-22' .
"I ZZ-;. . .,o .°
20- -t
30 - - i % ] '. 4,. ..
~P 40 -- 4..-
50
500 1
I /
70 . ;-
BO :,-,
) I..-.° °
' '.'-
045004O001300 80044-".,>,*
BH ": ' '.17A I SN5./,.
-~~~~~, -------- ------
*00
STATION 440ING DOWNTEIP (DEG, 0 "- '
990
-.
20 - 4500 9 18.,.-
'-N ~ 40 " '"L U- qI,.J---
;rJ !
.
I I .,*-, -
80 * '
A o /'<
lO II I I t I t1 t 4 ",.000 45000 90000 135000 80O000 "'H [PS %, TIf! (.BN5"
A I17 '
Na ~--..-- .N . - N a 9 a**~ ~' -' .--
• , *J
A-m
STPTION 5 GOING DOWN
0- - - q *Ei1P(DE ::)
1n ------
20 j
,. o - K '
S 40 -...-UIjLLJ
Li I
50 - --
70
4 80 7F,m, (
0 2Ei06 4E+06 6E+06 E+06* HH [PS ' )7. T R2X
.-.
- -'-
g A+ I')|A.
- , .
SIRTION 5 GOING DOWIN
7MrP(DEG ~
4* 4-0
j 4
50 -
LLI
70-
L &i
.4 4.0
50 2E0/E+6 E0 E
A-2
APPENDIX BIGH TIME RESOLUTION SCANS OF
BIOLUMINESCENCE EVENTS AT DEPTH
--.
i~4'
q.-: -"]
.p "-
-4..
JI
'4B-I
I
LLIto
N.1
T T-
NIS.,
'-B-2
IIi.4 v
cl gh
%.%C3
ina
a, N.4f
a3
C3
7
0.C.
-B-
93'
r---------- - -------------- _
Cc'
CD
a.4
C4'
I.--
U)U'U '4k3
-UNM/NIMc
f-BA
'S.
a.4
4., .~.
SI
S.
~'4
I.-
7.
-'
II wI
4.. .4.
~. a.4
~ 2:
c~.4in ui
Iin 0**14 S.
SIa C,4.
4.' '4
~~.1a .4
- '---- --- I---- ---~**--t--- --.--. ~-- + - a
p. Is. p.a a a a9 9
Iii
... 4. - S ;; >- ~ *?* a j
*4C3
ID
U--
B-6.
Ao.
.4 .
Li2
rmm
"4.
lid
B-7-
.%i
I--0 t !o m.!,°-'1
'-4
S .- 37
'IA
V.O
H,,
C34
401
N cm
B-8-
1 a
I EwH
uij
.. ui
u M
IILNB-9
-. Vrr~Vr -- u-u-- wr r r - --- ,
030
94gIzLL. u
In '
co in
ZL2
N c
B-1
ini
p.'.
z >z
944
r ..N I I'
1* UP
a C
La va
9A 9
ra r''4
0l
at4 .4
0 W.
.1.fa
B- 12
0 0 zJLMt I'A -.-
a.a
inE
-ta-7.-
1C04LL..
z u
7 Ena.-.
02
C22
Ni z
ID I-Qz
N 12.
cn &
9.4
. .. . . . .
nrnn~~~~ ----------~. --------,.... -
U7.
rn rC,
z ca
4H
N Ln a
B-14
0 r ._.r O
j
In
U3U
U3 U
LLI-
Il ILL
z in
NI
-o I-
.-"3
IVA .1
.44
4. 12 MINIM
' in
IDE
- 3ul
z U UN in
'p.r.
IDI
at a
LLSI
144
n. N w6. coo
inp
to.
9.'
I-- - - - - - - - - - -- --..
4.j
B-17-
U3;1
1%.
4.
N.j
0 0I.--
ul
rd.4 4
LI3I
.4WB-18
in-
zm9
a:-, H
CAj
U3
ac
0 @3
a 0
B-1
I.-1
c01
LL.Z
01 w
I-
w
ILl
zs 0
0 01
ca N
"pB-20
f
S.t -"m
.1,
w
In 6-
B-21
4. -::.
~ w m r ~ rrr rr n r-rr rrV n'rr V -- --- ---- ---
.44
C31.. 4
"44
ca 10
to
B-22-
14~
M 7
4.. n1:.1
-- 4 N i
in
B-23-
F..,;
U;
In r
in L- n
00
7 -. 4
7 B-24
2,°o-
fn:
7°
o - -.H
-. ... ....
I, t - - -I -. ,
I-t-
g u - T " "-' -0 .- 7
.4 ., -
' 0 . .
L1 U'
7 U -B-25
w~~~ -~ -_ -:- - m
>L -
o. t-.1
U ;
.4 -.
14 Q.5
7 u U;
N 0.
I'% 7 N~-V
Ue -4
Us U.;IN m
Iofsj.- Ip -mf
rnr~-.4 -- .. S ~ r w-.. r W-- '. ~ v 'UT '' ir-v -4 - '-- y- v - - - .4 ,--Q
.4Al
in
.4
1%
LL; 7
u.cl-
-W )
10a. v
CA fn
.7..
N ~N6
NB-2
% % %
In
U
m
7. u.
N 7.C.2fi
7 u 4
*4 Ln
7l r
.44
B-2
ii.,, 4
to .0
In
Ln
m
in_
4 . •
,, . . I..~tO ,
w'.4.4.
-- B-
.4%4
4B-2
I4.
44La44*44~
- .--------- -- ------ --
___
-~ r
4.
* N:
- -~ N
.pq2U
J4I.;'4.
'4
32
I-
IN ~
7: .4
7 U
WIN C
4 p. .4
"432 7:WIU I'.t-1~I"U.WI
'N
rn~ -
I. - 4 - I --- C
4.
.1
C* U U UC C CIa.21~
iaJ I7
~3NI'~WSNO.LOI4.~
4~4.4
AA,
B-30.d.
4... 4*' ~ ~ 44 ~ >:~*'?
4 ~ ~ *44
4,.
.4.*4. ~ ~ -
aS.3
S."4
Am
la I
'P -6
B-31
I.!
-- - -
In -
4 I
0!- - - .. . .. .
Z,2
B-32
.4.
APPENDIX C
HIGH TIME RESOLUTION SCANS OF BIOLUMINESCENCE FLASHES FROMINDIVIDUAL PLANKTERS TESTED IN THE LABORATORY PLANKTON
TEST CHAMBER (LPTC)
"I.p. 4.
: o . . . .. .. . . . . . . . . .. . . . . •.. .. .9.

- ---------------- -- ----- ----
N
uu
in H.4 M
Q -
Z 0N IN
P
z u"I z ULNI 0 iP~ -j Uz Iii
N H
03 4-
UC 4.
C, -1
0 Z
oo
N ELt4N .
F- - -4 - --- -- -------- ---- --
al cn U 0
19NNUH34/SNCOHJ
C-2
V
IS.
5ihi
4*.
ISi.. *
Si.i's.
.1
a
Ii-Si
.5 -%'ii. .4
Si.. **~ .p.
.5...1~- I aia a a
A-i £54 .4 a S.
* .- W-~~-S~*.,i~5
i *~~p5
*~i~*'s ~ ~ ~h
to
go 11
14
u,z
f Hi
Li
N
z z
z in 'U
r inQ
wNN
o w--
+
I C2
cn In
N -4
C-4

C31
fn)
-- pl
Q m z
C'4 u
CLL
CD 4-
-4 clU
cN
JN 0 U4~~
N H
00
CC-
M4 - V-V-
V.3
H
LilW:
I~Ll
n Li
ui w
z '-
N
N
% W,
in I
Si a. V
'I.4
C-6
0'~
.4,~44
4 -
* - a.4.
,~.. -..
NI m
p
zHmaLLI
cj~ E(N Hma
-AUIaj~
UaI'E 4.
:~* ~ Zma
N. B
C-,
~ * maZ N!
~z .4
4. 5..A ma i-ma w~.4 InU2 L12' 4.
.4 4.0C*4 *'.4 -
.44
V.. I- ____
* -~: --- ~ - ____
t- 4 - -- 4 -
* 4/..
m m mA a a a
.4 a
5.
'5' 1NNI143/SNOIOHeI 'SS..
.5
C-7- 'S
------------------
M- W.
zuH
UD w
W tj
C3 U
4. LLzP CL
z w -
N Uj *
zN H4
m Lii
N H.4I-
U L
N L12
C -8
.. j
'-I..?.
cSCP
-.. .X
cl z
.4 I-u
.4 5
ini
kN In-i
maz
-- - -- --.--- ----- -- - ------- -.-
'.4in
u Ld
tl N
z z p
N LLH
m tj
LnL
cn I-
N zL
-4 - -4 -4
al in i
N. ON
N. e
N.i Hjk
+
Q LI
0 ~04. )
C2 u 6.
P-a&a, -z
zL
a to
LLL
-44
1I. .4C
-41
ao
4r
z* i
al-
C4-
c~co
4,,
cri O0
-. c6"43iNO.-v
z U C. U
u ui
C2
~ft'
.4.ft.
ai
03. 4
010'S
5,NH/W Ilc
04t
,'Cf13
N -'Sz
iu
CL
uiel 2-
C-14
z IM
ca
L)w
UU.J. 2 ii u
~~ u
uJ
v4.
I~In
'OR
C-1
-4x
I&
uj H
'4 C,
ci ao
w4
rW-
0 a
C-16
1%E : XN
.1u
4U
w4
Imw
1-'W
0~Cb
C-1-
CCU I-
ui)
.4 U
- U
to9
.616 InIn-in.i
us .9.
LC 18
-0..
C-,It
iuxw
In-
0
ti C-19
ri
L22
tto
C02
-.- -
g]w
U) ?'-
'V.
\h.
- .9.
.1~'.4.
- -- a4.
* *
N..
-u NN~.
* C,
r4HI-
-N.J.U
p p..-N. p.N.. ~ ILL.N,
-' 0 "N.
.4 .- p.
.9.' Ii N
9...' .4 'N
'N
-~ 'N'.
('4* a.4
94 S 62I,
'p.62a ~ . (N*~,aI-. , N
1* - - -- .- =-": N.
N'.9.'
'a V
S U 0 62 N.P a a a a
9 9 9 9bJ a1* .4
~NF'M4~/3NO~.c34~ -N.
'N'p
'N
'.9(~ 21 -N.
.9
.5,o.
4 '
N 4.
._ 4
U 'Li
.L
.
1
,- ,.) ,0
S. 1-1 .
U) -S..
,* - . -. -• .* , . +• - - I - + -,,-+1 + +, - + .% -. .% " " , -'% , '% "% % -% .-. "- o . , + + - - ', ," .." :, tPX+l' ' "t * ' ( "" "" '.* . ,, ' "" .., '
U,
w Li
0 o
W)
cc
Li
C-23
r IL
cs Cs
t4
U I-DuNJ
C-2
4.4.
__ _--__-~__ _______
4.-
U4.
4'
4.
mwH p -
p.
p.
a' U
'~ U U
-if'
~ WI U
4' Iii p
re.4
j -l U.+
~; et MI
4~* ..A _______________
~ -- .-----..----- - ----- -
* ~ I
* £4 CI ___~~-±~~~~~-~~t I~ I.
It.. p. 9% 9%
a a a a* a
iIINI~aIa/uNo±a4.I .4.
C-25.i.
- '~ ~: ~ q
.5
5%
5;.
a-h
.5.-.v-h.5..
NSI.
*5~ 'U
5.,'.,5~4~
a gF
.4.
T
.4Si
'4.H
Li a-ILl' 5/~)
a.. ~s.
C
- 554w "aI
S.. ~ .J.~4
m~
-~
zN tNNNI
-------
SW * a1* .4'
F .4*4.
.4
a'a...' I-.
S-F.
4. 711a a a a 'a.*
Ul Mi ui a* 9,
~~NNlIa/3NOIOS4~I
C-26 5,
(5.
.4. - -
F----a,
"p 1I -p
p.'
p..
4...a pI-
- I.
zHmw
.4.
Il-I "p
h~.
*0* ~ CU4. V
I-
ZIU) w'r.~ "pp.
% UU) 9 .4p ~.4
wUU)
S.9-
Fj re.4
-~
* a(54 *In
(54
___ __ 4.4 ----.-- ~-~--- *------_____
_ ~~~1'p.
I.. p.a C0 pp p
'p 4'U C.4
p..
~NNM4~~-p
,p..
p.'C-27
' -, '*~. V
4 N4
400fiI
3.a 0
mmml
-MNNWW/WMIM
C-28.
0 10
a! 0-4V] LI
c~.4
14*
C-29,
I PAI
07
H
C4 H
aj w
z
z in
w
-1 .
CC
4.w
.4..ii
C-30
I-3 5
0 S.
.... 0
C-3
*11
U%
ca,
t~i
C-32.
J
4,.9
.9..9
* V
* S
* ~,1
up
9,. '9.;U 6-
* U* I.. ~
aI*4 L.
I-Z u 5. w
-4'9.
B.N.N.N.N.
S a. ~ ---- - 4. U
9.
g*4 .9
4* '9
'9. ir'
S---4------- --- 4-----+ - - -- - a
* S 0 Sq
a 0 0* * * 19.WI*re .4 -4 -~
.9,..
C-33
~ *W),.9AS~ -~ - ~ * * SSW *P-'
ont
4.P
F4)
V.
.9 .-
.41 L
N. 1-4 .
C4..... -' -----
C-34
(4.4.," t-" "'" "'""- ". . V" : " '"" ""'. ." " '" -' "" M '' ' "
C3
co
040.
L) zC4 w
C41
C4
C D
C3 0
.4 C3
C-35
p C14
z to
LI
I o _
4i U; .40
P.J
.C-36
Tw
-. 4:
zzL
.4
*N tn.
-. U-
N-11U
-.4
ol
4-AI79 818 BIOLOGICAL ENVIRONMENTAL ARCTIC PROJECT (BEAP) 2/2
PRELIMINARY DATA (ARCTIC WEST SUMMER 1986 CRUISE)(U)N AVAL OCEAN SYSTEMS CENTER SAN DIEGO CA
UNLRi~,FED D APTAETAL NOV 86 NOSC/TD-i@43 F/G 8/3 U
El.".n
MCII
1 Q5
MICROCOPY RESOLUTION TEST CHART -
NM UNA UI) Aj fl A
N e. . .
,'I, .. .,- ,"% . ,.,' , ,, % . ,.% , , ,",. .%
Z.
u
$ &'4,,
N.J
l
! U
C-38
C-3-
.4 N
InI
p '
z --
Q Li L
ucac
C3
C3 cm
U:U
z~ NI
jt
P. j
U-3
aLai
C-4-
-' --: - -~ --
S3
I~IWO
-CD
C3 0
443
C-41U
Z o -4
I
ri.4..
z ' I.-
N .4N
e "'N
C -4) C 4J.
N U
.9 a4.
p.4.9.99
.9
:d..'.1*
* .1*,I~
- VI
9. U' J~.* 4.A 14 4
UP --
1* ~4.
.4 N 4.* ~
N - pC' Vi *94 §5q ,-.z U 4. U
Ia3VI
7~ ui * Iii-% * EN g (~4 4.4
N N p *'.~ V54* N Eu
-~ - -* S
943
I-
4.
j'p'.5
I- I 9 9 0'9
p. i~. F. F.a a a a4.
'Si4.* 4 WI '.4 C
i.
43N~~4I/3NO±OI4J .4.
C-43
.9 ~4.

0
uiC4.
m~. 4
z0 *
aC
0 -
z C-44
%W6
ind
.4-
r a
.44
C-45
S5
~S.M
011
7. 7.
I.. %
.6.
Nn w
C-4-
L)i
* Zui
.4 .
C-46
I-
U- -. -
m
0-.
LU
N H
ore
In-
0 0
C-47
gal&=
ti'
LOK
.4.
(%4
caca cca
C-4-
-W U.
JIM-
Z-4-
044
717
.4 7:
U .-.7w-A
(n .-
LL, LL
10 4-e
N U -+
0j LO Ll'-to- -
ai q: C3
7 C-49
N. u
LLI
'A.r
404
k!.4 4
u u
Cllei
7144
4
faa
7 I-.u
91.
C-514
caa
a44
zU
*C3
a 4
7.
Ca
P f re-52
C4).4.
.4 .4
N w.
NOC-52
.Ig
Laa
14~
In
N 7.S
NN
t--4
0 J
*o A
-- --
Lr.-N
NNU'
I.-.
4
Q 1-l
7. l, w 9 ..C7
I--
c.P u
*% , U .p.J"
." . . .
.., ~ ..
', a %
in
a aa.4 4.L
C-54

*
p
y.
'-4
b
*1~~4
'Ii..


![[2009] [09] [10] Innovative ship design Naval Architecture & Ocean … · 2018. 1. 30. · Department of Naval Architecture and Ocean Engineering, Seoul National University of College](https://img.pdfslide.us/doc/110x75/61084308178c4026a909d1d7/2009-09-10-innovative-ship-design-naval-architecture-ocean-2018-1.jpg)