Embed Size (px)
Citation preview

Supporting document 1
Risk and technical assessment – Application A1102
L-carnitine in food
Executive summaryThis application seeks permission for the voluntary addition of L-carnitine and L-carnitine-L-tartrate, as nutritive substances, to a range of general purpose and special purpose foods.
The risk and technical assessment includes: (i) a food technology assessment of L-carnitine and L-carnitine-L-tartrate; (ii) a hazard assessment to identify potential adverse effects associated with L-carnitine intake, the intake levels associated with any such effects, and an estimate of a safe upper level of intake; (iii) a dietary intake assessment to estimate the total dietary intake of L-carnitine and L-carnitine-L-tartrate due to baseline intake and intake resulting from the addition of L-carnitine/L-carnitine-L-tartrate to the proposed foods; and (iv) a risk characterisation comparing dietary intake levels (at baseline and under a possible addition scenario) with the highest intake associated with no adverse effects in human studies.
The food technology assessment concluded that the L-carnitine and L-carnitine-L-tartrate substances proposed for addition to foods are well characterised, with appropriate specifications and methods of analysis. The two substances are highly soluble in water with acceptable stability and would be expected to be readily incorporated into various food matrices.
The hazard assessment considered information on the physiology, biochemistry and pharmacokinetics of L-carnitine, L-carnitine-L-tartrate, L-carnitine chloride, acetyl L-carnitine and data from animal and human studies investigating a wide range of parameters relevant to safety. In vitro and animal studies showed that L-carnitine and L-carnitine chloride are not genotoxic and are of low acute oral toxicity. A subchronic dietary toxicity study in rats did not show any adverse effects at doses of up to 3934 mg/kg bw/day L-carnitine-L-tartrate in males, and 5042 mg/kg bw/day in females. While some adverse effects were observed in repeated dose animal studies using L-carnitine chloride these are most likely to be attributable to the chloride ion, and therefore are not relevant to the safety of L-carnitine or L-carnitine-L-tartrate. The available evidence supports a conclusion that L-carnitine and its salts are not likely to be carcinogenic, or reproductive or developmental toxicants.
In human studies, L-carnitine doses as high as 7 g/day for durations of up to 12 months have been investigated, including in studies in elderly subjects, and in pregnant women, and no adverse effects attributable to L-carnitine intake have been identified at doses of up to 3 g/day. At doses >3 g/day, nausea, gastrointestinal disturbances, and fishy body and/or urine odour have been the only treatment-related adverse effects observed. Recently published studies have raised potential concerns for an increased risk of cardiovascular disease due to a metabolite of L-carnitine (trimethylamine N-oxide, TMAO). FSANZ has considered the relevant scientific literature and concludes that the evidence does not support
1

TMAO playing a causal role in initiating or promoting adverse cardiovascular effects.
The dietary intake assessment accounted for naturally occurring L-carnitine concentrations in foods, the maximum levels for existing L-carnitine permissions, and the additional permissions requested by the Applicant. Modelling was conducted for a number of scenarios. For the Baseline scenario, which includes naturally occurring L-carnitine and the current permissions for L-carnitine addition in formulated supplementary sports foods, the range of estimated dietary intakes of L-carnitine for various Australian age groups is 17–137 mg/day (mean) and 33–268 mg/day (P90).
The scenario with the highest estimated dietary L-carnitine intakes for all population groups except sports food / beverage consumers is the Consumer behaviour model that takes into account naturally-occurring L-carnitine concentrations in food plus all permissions requested in the application, at 100% market penetration into each category. The range of dietary intakes for this scenario are 288 – 736 mg/day at the mean and 546 – 1,384 mg/day at the P90. For the general populations of Australians aged 2 years and above and New Zealand aged 5 years and above, the P90 (‘high consumer’) dietary intake of L-carnitine estimated from the applicant’s request is approximately 0.9 – 1.1 g per day.
For sports food / beverage consumers, the scenario with the highest estimated dietary intakes includes L-carnitine intakes from ‘Baseline’ plus L-carnitine intakes from the recommended number of serves of sports food / beverage per day, as provided by the Applicant (four serves per day to achieve a total intake of 2,000 mg L-carnitine per day from sports food / beverages). The mean and 90th percentile dietary intakes could increase to 2,076–2,081 mg/day and 2,152–2,218 mg/day, respectively, under this scenario. This highest estimated P90 intake level (approximately 2.2 g/day) is below the highest intake of L-carnitine that has not been associated with adverse effects in human studies (3 g/day). Therefore, there are no public health and safety concerns from the addition of L-carnitine / L-carnitine-L-tartrate to a range of general purpose and special purpose foods, as requested in the application.
2

Table of ContentsEXECUTIVE SUMMARY.................................................................................................................................. 1
1 INTRODUCTION................................................................................................................................... 4
2 FOOD TECHNOLOGY ASSESSMENT..................................................................................................4
2.1 CHEMICAL STRUCTURES AND PROPERTIES.......................................................................................................42.2 MANUFACTURING METHODS.......................................................................................................................52.3 ANALYTICAL METHODS...............................................................................................................................62.4 SPECIFICATIONS........................................................................................................................................62.5 STABILITY IN FOOD....................................................................................................................................82.6 FOOD TECHNOLOGY CONCLUSION.................................................................................................................8
3 RISK ASSESSMENT............................................................................................................................ 9
3.1 HAZARD ASSESSMENT................................................................................................................................93.1.1 Biochemistry and physiology of L-carnitine.....................................................................................93.1.2 Absorption, distribution, metabolism and excretion........................................................................93.1.3 In vitro studies and animal toxicity studies....................................................................................103.1.4 Human studies investigating safety...............................................................................................123.1.5 Cardiovascular outcomes and plasma concentrations of L-carnitine and TMAO...........................133.1.6 Safety of tartrate intake from ingestion of L-carnitine-L-tartrate..................................................143.1.7 Hazard assessment – Discussion and conclusions..........................................................................14
3.2 DIETARY INTAKE ASSESSMENT....................................................................................................................153.2.1 Approach to estimating dietary intake of L-carnitine....................................................................153.2.2 Estimated population dietary intakes of L-carnitine......................................................................283.2.3 Major foods contributing to L-carnitine dietary intakes................................................................343.2.4 Dietary intake assessment summary.............................................................................................43
3.3 RISK CHARACTERISATION..........................................................................................................................44
4 REFERENCES....................................................................................................................................... 45
APPENDIX 1: EVALUATION OF IN VITRO AND ANIMAL TOXICITY STUDIES ON L-CARNITINE..........................52
APPENDIX 2: DIETARY INTAKE ASSESSMENTS AT FSANZ..............................................................................79
A2.1 FOOD CONSUMPTION DATA USED...............................................................................................................79A2.1.1 2011-12 NNPAS.........................................................................................................................79A2.1.2 2002 New Zealand National Children’s Nutrition Survey (2002 NZNNS)....................................80A2.1.3 2008/09 New Zealand Adult Nutrition Survey (2008 NZANS)....................................................80
A2.2 LIMITATIONS OF DIETARY INTAKE ASSESSMENTS............................................................................................80
APPENDIX 3: DIETARY INTAKE ASSESSMENT RESULTS..................................................................................81
APPENDIX 4: TMAO AND MORTALITY AND CARDIOVASCULAR DISEASE.....................................................117
3

1 INTRODUCTIONApplication A1102 requests permission for the voluntary addition of L-carnitine and L-carnitine-L-tartrate, as nutritive substances, to a range of general purpose and some special purpose foods including:
Dairy products, excluding butter and butter fat, e.g. flavoured milk, yoghurt, yoghurt drinks
Cereal and cereal products, e.g. hot cereals, some ready to eat cereals, cereal bars Non-alcoholic beverages, e.g. fruit and vegetable juices, energy drinks, regular soft
drinks Confectionery, e.g. chocolate, candy, bubble gum, chewing gum Some foods intended for particular nutritional uses, e.g. formulated meal replacement
drinks, biscuits and bars; sports bars and sports drinks
This risk and technical assessment includes:
A food technology assessment of the L-carnitine and L-carnitine-L-tartrate substances intended to be added to foods
A hazard assessment of L-carnitine and L-carnitine-L-tartrate to identify potential adverse effects, the intake levels associated with any such effects, and an estimate of a safe upper level of intake
A dietary intake assessment to estimate the total dietary intake of L-carnitine and L-carnitine-L-tartrate resulting from baseline intake and intake resulting from the addition of L-carnitine and L-carnitine-L-tartrate to the proposed foods
A risk characterisation that compares estimated dietary intake levels with the highest intake associated with no adverse effects in human studies.
2 FOOD TECHNOLOGY ASSESSMENT2.1 Chemical structures and properties
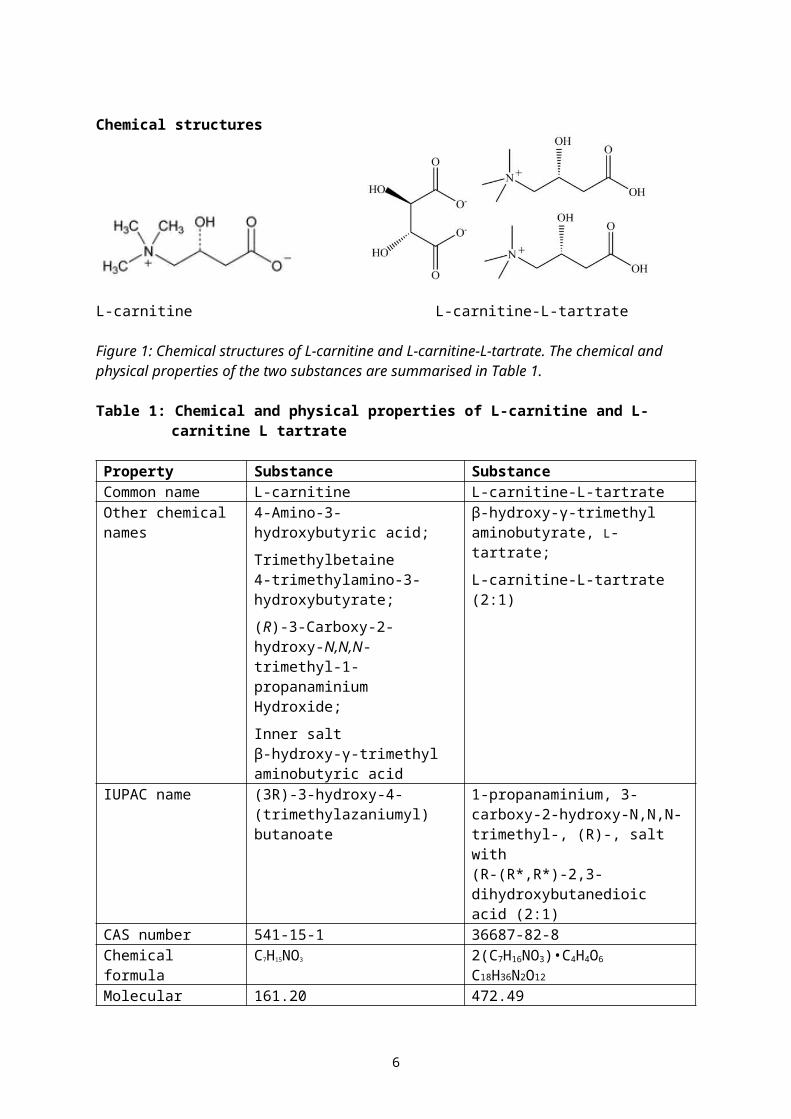
L-carnitine is commercially available to be added to food in several forms including L-carnitine and L-carnitine-L-tartrate which are both crystalline powders. L-carnitine-L-tartrate is produced as a combination salt of crystalline free base L-carnitine with L-tartaric acid, and exists as a 2:1 molar ratio, being two molecules of L-carnitine to one molecule of L-tartaric acid. See the chemicals structures of the two substances in Figure 1.
4

Chemical structures
L-carnitine L-carnitine-L-tartrate
Figure 1: Chemical structures of L-carnitine and L-carnitine-L-tartrate. The chemical and physical properties of the two substances are summarised in Table 1.
Table 1: Chemical and physical properties of L-carnitine and L-carnitine L tartrate
Property Substance SubstanceCommon name L-carnitine L-carnitine-L-tartrateOther chemical names
4-Amino-3-hydroxybutyric acid; Trimethylbetaine4-trimethylamino-3-hydroxybutyrate;(R)-3-Carboxy-2-hydroxy-N,N,N-trimethyl-1-propanaminium Hydroxide; Inner saltβ-hydroxy-γ-trimethyl aminobutyric acid
β-hydroxy-γ-trimethyl aminobutyrate, L-tartrate;L-carnitine-L-tartrate (2:1)
IUPAC name (3R)-3-hydroxy-4-(trimethylazaniumyl) butanoate
1-propanaminium, 3-carboxy-2-hydroxy-N,N,N-trimethyl-, (R)-, salt with (R-(R*,R*)-2,3-dihydroxybutanedioic acid (2:1)
CAS number 541-15-1 36687-82-8Chemical formula C7H15NO3 2(C7H16NO3)•C4H4O6
C18H36N2O12
Molecular weight g/mol
161.20 472.49
Appearance White crystals or white crystalline powder
White crystals or white crystalline powder
Water solubility (g/L at 20°C)
Highly soluble, 2,500 Highly soluble, >1,000
Melting point (°C) 185-195, decomposition without melting
171.1-173.7 (approx. 170 with decomposition)
2.2 Manufacturing methods
L-carnitine
L-carnitine is produced via a two-step chemical synthesis process. Step one hydrogenates a solution of ethyl 4-chloroacetoacetate in ethanol using a chiral catalyst. The product of this
5
reaction, ethyl (R)-4-chloro-3-hydroxybutyrate is then aminated using trimethylamine and hydrolysed with aqueous sodium hydroxide to produce L-carnitine. The aqueous L-carnitine solution is electrodialysed, precipitated and recrystallised in an organic solvent to purify the product, and subsequently dried.
L-carnitine-L-tartrate
L-carnitine-L-tartrate is produced by combining a solution of L-tartaric acid in an organic solvent to an aqueous solution of L-carnitine. The combined solution is cooled to precipitate out the crystals of L-carnitine-L-tartrate which is removed by centrifugation and then dried.
2.3 Analytical methods
EFSA (2012) provides information relating to the analysis of L-carnitine and L-carnitine-L-tartrate as animal feed additives, in premixtures, in feedingstuffs and in water, in Appendix A of the report. These analytical methods were detailed in the dossier supplied by the Applicant for this L-carnitine application; (i.e. Lonza Benelux BV) to the European Commission for EFSA to complete the assessment. It is explained that the analytical method relies on an enzymatic reaction with L-carnitine-acetyl-transferase which is specific for L-carnitine. The enzymatic reaction is then measured by various spectrophotometric methods. Different methods are used for different matrices as noted below:
Premixtures: ion chromatography with electrical conductivity detection (IC-ECD) Feedingstuffs: reverse-phase High Performance Liquid Chromatography (RP-
Hpropionyl L-carnitine) with fluorimetric detector Water: potentiometric titration with hydrochloric acid
It is noted that L-carnitine is released from the L-carnitine-L-tartrate salt during sample treatment (enzymatic reaction) so that any of the above analytical methods for determining L-carnitine in the different matrices are suitable to determine L-carnitine-L-tartrate, expressed as L-carnitine.
The analytical methods discussed in the EFSA (2012) report and noted above are relatively specialised and have been developed in-house by the Applicant. If analytical methods are required to be developed for enforcement purposes then full analytical methods and assistance may need to be requested from the Applicant. It is noted that L-carnitine is already permitted to be added to some types of food products within Schedule 29 (Special purpose foods): infant formula products (S29—5), formulated supplementary sports foods (S29—19) and foods for special medical purposes (permitted form only) (S29—20).
2.4 Specifications
All nutritive substances permitted to be added to food are required to have a specification of their identity and purity written into the Code with which the substances need to comply. Such specifications are contained within Schedule 3 (Identity and Purity) of the Code. Section S3—2 provides a list of primary sources of specifications which includes the Food Chemicals Codex (FCC) (paragraph S3—2(1)(c)) and the Joint FAO/WHO Expert Committee on Food Additives (JECFA) Combined Compendium of Food Additives specifications (paragraph S3—2(1)(b)). The European Commission Regulation (EU) No 231/2012 is also a primary reference of specifications (paragraph S3-2(1)(d)).
Food Chemicals Codex contains a specification for L-carnitine but not for the salt of L-carnitine and L-tartaric acid, which is L-carnitine-L-tartrate. JECFA and the EU do not have specifications for L-carnitine. However L(+)-tartaric acid (INS 334) has its own specifications in Food Chemicals Codex, the JECFA Combined Compendium of Food Additives
6
specifications and the European Commission Regulation (EU) No 231/2012.
Table 2 Specifications of L-carnitine compared to FCC specifications
Parameter FCC Applicant’s specifications
Purity 97.0 – 103 0 % 99.0 – 101.0 % Water ≤4.0% ≤4.0% Residue on ignition
≤0.5% ≤0.1%
Specific rotation [α]D
20 Between -29.0° and -32.0°
Between -29.0° and -32.0°
Lead mg/kg ≤1 ≤10 for heavy metals as lead
Table 3 Specifications of L(+)-tartrate, comparison of JECFA, FCC and EU
Parameter JECFA FCC EU Assay ≥ 99.5% dried
basis ≥ 99.7%, ≤100.5% dried basis
≥ 99.5% dried basis
Loss on drying
≤0.5% (3 hr over P2O5)
≤0.5% (3 hr over P2O5)
≤0.5% (3 hr over P2O5)
Melting point (°C)
168-170
Specific rotation
[α]D20
Between +11.5° and +13.5°
[α]D25
Between +12.0° and +13.0°
[α]D20
Between +11.5° and +13.5°
Sulphated ash
≤0.1% ≤0.05% ≤0.1% (1000 mg/kg)
Lead (mg/kg) ≤2 ≤2 ≤2 Mercury (mg/kg)
≤1
The Applicant has provided their specifications for L-carnitine-L-tartrate and compared it to a draft 2010 Therapeutic Goods Administration (TGA) draft compositional guideline. The Applicant’s specifications are provided in Table 4.
Table 4 The Applicant’s specification for L-carnitine-L-tartrate
Parameter Applicant’s specifications Purity (%w/w) L-carnitine L-tartaric acid
67.2-69.2 30.8-32.8
Water ≤0.5% Residue on ignition ≤0.1% Specific rotation [α]D
20 Between -9.5.0° and -11.0°
Heavy metals (as Lead) mg/kg
≤10
Since L-carnitine-L-tartrate is a simple salt complex of the two individual chemicals there is possibly no need to develop a new stand-alone specification for this compound in Schedule 3 but rely on the specifications for the two individual substances and the general heavy metal contaminant requirements of section S3—4.
The only specification issue noted from the Tables is the difference in heavy metal limits,
7

specifically lead for L-carnitine which is due to use of different analytical methods. The Applicant uses the United States Pharmacopeia (USP) analytical method USP 231 (limit test) for heavy metals (measured as lead). The United States Pharmacopeia (USP) 231 (heavy metals limit test) is a wet chemistry method where various heavy metals in a solution form a complex with sulphide ion which are coloured and so are measured colourimetrically via comparisons with standard solutions. The alternative analytical method used for the measurement of lead, is listed in the Food Chemicals Codex in Appendix III which uses an atomic adsorption method specific for lead and has a lower limit of detection.
2.5 Stability in food
The Applicant provided data and information indicating that the two chemicals, L-carnitine and L-carnitine-L-tartrate are very stable under both ambient room temperature and humidity, and also at elevated temperature and humidity. For ambient conditions (25±2°C, 60±5% relative humidity) both substances were stable for at least four years. At elevated temperature and humidity (40±2°C and 75±5% relative humidity) both substances were stable for at least one year.
Information on stability and homogeneity of both substances used as a feed additive in premixtures, feed and water are summarised in the EFSA (2012) report along with information provided by the Applicant. L-carnitine incorporated in a vitamin-mineral premixture for animal feed containing L-carnitine at 8,000 mg/kg was stable with no losses after storage at 25°C for six months. L-carnitine incorporated into mash and pelleted feed for piglets at 50 mg/kg indicated no loss of L-carnitine after processing or storage for three months at 25°C. No reduction in L-carnitine was observed when both L-carnitine and L-carnitine-L-tartrate were added to water at concentrations of 1 g/L when stored for 24 h at 25°C.
No data were provided by the Applicant in relation to the stability of L-carnitine-L-tartrate except a statement that L-carnitine-L-tartrate has similar stability to L-carnitine when incorporated into premixtures and animal feed.
2.6 Food technology conclusion
The food technology assessment concludes that both L-carnitine and L-carnitine-L-tartrate are well known and understood chemicals for which there are relevant specifications and analytical methods for their addition to food. There are specifications for both L-carnitine and L-tartrate in monographs within Schedule 3. There is not a specification for the L-carnitine-L-tartrate salt but because this compound is produced by combining the two chemicals with their own specifications together there should not be any need to write a specific specification into Schedule 3 for this substance. The two substances are expected to be readily incorporated into various food matrices being very soluble in water and are also expected to be quite stable in food.
8

3 RISK ASSESSMENT3.1 Hazard Assessment
The hazard assessment considered information on the physiology, biochemistry and pharmacokinetics of L-carnitine, L-carnitine-L-tartrate, other available forms of L-carnitine and data from animal and human studies investigating a wide range of parameters relevant to safety.
3.1.1 Biochemistry and physiology of L-carnitine
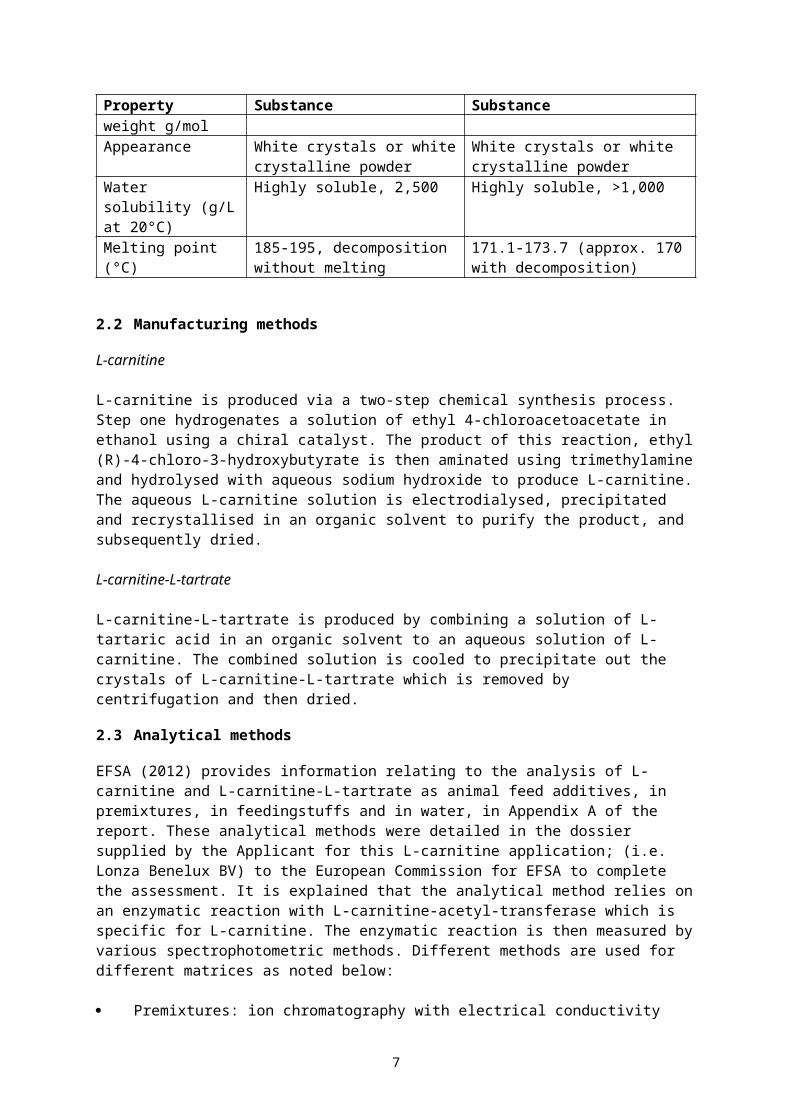
Carnitine, a -amino β-hydroxyl acid, was originally isolated from bovine muscle and subsequently shown to be exclusively the L-isomer (Figure 2).
L-carnitine plays an essential role in metabolism due to its involvement in the transport of fatty acids from the cytoplasm to the mitochondria, where β-oxidation takes place. The biochemical pathway starts with the reaction of the L-carnitine hydroxyl group with acyl co-enzyme A esters of fatty acids to form the corresponding acylcarnitines. The reaction is reversible and is catalysed by the family of enzymes known as L-carnitine acyltransferases. The acyl co-enzyme A esters that are substrates for L-carnitine acyltransferases have chain lengths that range from two to twenty-two carbon atoms and include branched chain fatty acids that are metabolically derived from amino acids.
The acylcarnitines formed by trans-esterification are subsequently transported from the cytosol of the cell into the mitochondria. After transport, the acylcarnitines transfer their acyl groups to co-enzyme A within the mitochondria to form the corresponding acyl co-enzyme A thioesters. The acyl groups are catabolised by the biochemical process known as β-oxidation to produce acetyl co-enzyme A, which enters the citric acid cycle to produce energy for cellular processes.
Body stores of L-carnitine are maintained by the consumption of foods containing L-carnitine and by endogenous synthesis from the amino acids lysine and methionine. Biosynthesis primarily occurs in the kidney and liver.
3.1.2 Absorption, distribution, metabolism and excretion
A comprehensive review of the pharmacokinetics of L-carnitine and acylcarnitines is available (Reuter and Evans 2012). The bioavailability of L-carnitine from a normal Western diet has been estimated to be 54–87% (Rebouche and Chenard 1991; Rebouche 2004), whereas bioavailability at higher oral doses, achievable from dietary supplements (0.5–6 g), has been estimated at 14–18%. Time to maximum plasma concentration (Tmax) after oral administration of L-carnitine at doses of 0.5 to 6 g is 3–5 hours (Reuter and Evans 2012).
Circulating L-carnitine is distributed to two kinetically defined compartments: one large and slow-turnover (muscle), and another which is relatively small and with rapid-turnover (liver, kidney and other tissues). Approximately 97% of total body carnitine is present in muscle, with only ~0.1% in plasma. The mean residence time (turnover time) of L-carnitine in skeletal muscle has been reported to be 105 hours (Reuter and Evans 2012).
9
Figure 2: Chemical structure of L-carnitine

L-carnitine that is not absorbed following oral ingestion undergoes degradation by intestinal microbiota to trimethylamine (TMA) which is absorbed and then metabolised to trimethylamine-N-oxide (TMAO; abbreviated as TMNO in some publications) by flavin mono-oxygenase 3 (FMO3) in the liver. Gut microbiota also convert L-carnitine to -butyrobetaine which is primarily excreted in faeces (Figure 3).
Efficient renal reabsorption of L-carnitine occurs at normal circulating concentrations. After high-dose intravenous or oral administration of L-carnitine, efficiency of renal reabsorption decreases and clearance increases, resulting in rapid decline of blood L-carnitine concentrations to baseline (Rebouche 2004). TMAO is excreted in urine (Taesuwan et al. 2017).
Figure 3: Metabolic fate of unabsorbed L-carnitine
3.1.3 In vitro studies and animal toxicity studies
An evaluation of in vitro and animal toxicity studies on L-carnitine, L-carnitine-L-tartrate and other L-carnitine salts is provided in Appendix 1. The majority of studies were conducted using L-carnitine chloride which dissociates in the gastrointestinal tract to liberate free L-carnitine. However, in studies in which the test article is L-carnitine chloride, some effects such gastrointestinal irritation and increased water intake are likely to be effects of chloride ions rather than of L-carnitine.
The oral LD50 in rats was greater than 2000 mg/kg bw. L-carnitine chloride was also of low acute oral toxicity in mice, rats, rabbits and dogs.
Dietary administration of L-carnitine to rats at 14 mg/kg bw/day for up to 30 days was not associated with any signs of toxicity (Clouet et al. 1996). There were no adverse effects in male New Zealand White rabbits given L-carnitine in drinking water, at an average intake of 170 mg/kg bw/day for four weeks (Seccombe et al. 1987). No toxicologically significant effects were observed in a 13-week study of L-carnitine L-tartrate in rats at 5.0% w/w L-carnitine L tartrate in the diet, equivalent to a mean intake of 3934 mg/kg bw/day in males, and 5042 mg/kg bw/day in females (LPT 2003).
Subchronic studies using L-carnitine chloride were also available in rats and dogs. Treatment-related mortality was observed in rats administered L-carnitine chloride by oral gavage for 13 weeks at 5000 mg/kg bw/day. Adverse clinical signs and effects on body weight were seen at 1500 mg/kg bw/day. The NOAEL was 450 mg/kg bw/day L-carnitine chloride (Yamate et al. 1988). Beagle dogs administered carnitine chloride at 800 mg/kg bw/day for 13 weeks showed an increased incidence of vomiting and diarrhoea. These adverse effects are consistent with acute irritation of the gastrointestinal tract by the test material, which was administered as dry powder in gelatin capsules, and do not provide evidence of systemic toxicity. The NOAEL was 200 mg/kg bw/day L-carnitine chloride.
Administration of L-carnitine to rats in drinking water, at doses ≤ 351.9 mg/kg bw/day, had no effect on survival, bodyweight, histology of colon or heart, or group mean values for weights of liver, kidney or spleen (Empl et al. 2015; Weinert et al. 2016). The NOAEL in a twelve
10

month oral gavage study of L-carnitine chloride in rats was 737 mg/kg bw/day due to mortalities, adverse clinical signs and effects on body weight at 2000 mg/kg bw/day (Kudow et al. 1988b). Kikumori et al. (1988c) identified a NOAEL of 200 mg/kg bw/day for L-carnitine chloride in a chronic oral capsule study in Beagle dogs, on the basis of adverse effects on the gastrointestinal tract at higher doses. As above, the effects are consistent with the irritation of the gastrointestinal tract by the test material and do not provide evidence of systemic toxicity related to the test material.
No lifetime (104 week) carcinogenicity studies were located. L-carnitine and L-carnitine chloride were not genotoxic and the available evidence from subchronic and chronic studies does not suggest any potential for carcinogenicity.
The available evidence from two species supports a conclusion that L-carnitine and its salts are not reproductive or developmental toxicants. Brandsch and Eder (2003) concluded that addition of L-carnitine to the diet of rats, up to 1 g/kg of diet, had no effect on reproductive performance of rats. No adverse effects of L-carnitine chloride on reproductive function were found in male or female rats at the highest dose of 3000 mg/kg bw/day (Itabashi et al. 1988a) in which dosing was from prior to mating to GD 7, or at the highest dose 2700 mg/kg bw/day in the study of Nakamura et al. (1988) in which dosing was from GD 7 to GD 17. No teratogenic effects were found in the rat pups, even at doses at which mild maternal toxicity was evident (Itabashi et al. 1988a,b; Nakamura et al. 1988). In rabbits, Toteno et al. (1988) identified a NOAEL for maternal toxicity of 316 mg/kg bw/day L-carnitine chloride, but a NOAEL for fetuses at a maternal dose of 1000 mg/kg bw/day.
Other studies
A number of animal studies have investigated the potential effects of L-carnitine on atherosclerosis. Two such studies were conducted in ApoE-/- mice, a commonly used model of human atherosclerosis. Koeth et al. (2013) concluded from their study in female ApoE-/- mice that dietary L-carnitine promotes atherosclerosis when administered in drinking water at a dose of 1700 mg/kg bw/day for 15 weeks. The authors suggested that L-carnitine promotes atherosclerosis, not directly, but through production of atherogenic metabolites by intestinal microbes. However Collins et al. (2016) found the opposite effect in male ApoE-/- mice that expressed human cholesteryl ester transfer protein (CETP) given L-carnitine at doses of 87 and 352 mg/kg bw/day by oral gavage. In both groups treated with L-carnitine, analysis of atherosclerotic lesion size at the aortic root showed a very small but significant decrease in group mean lesion size compared to the control group. When the 352 mg/kg bw/day group was compared to the control group, there was a significant inverse correlation between lesion size at the aortic root and plasma TMAO. Likewise, using morphometric analysis data, a significant inverse correlation was found between plasma TMAO and thoracic aorta lesion area.
Spagnoli et al. (1995) reported that dietary propionyl L-carnitine reduced the size and thickness of atherosclerotic plaques in rabbits with induced hypercholesterolaemia, and was associated with a lower level of proliferative activity of both macrophages and smooth muscle cells. Similarly, Sayed-Ahmed et al. (2001) found that intraperitoneal supplementation with L-carnitine prevented progression of atherosclerosis in rabbits with induced hypercholesterolaemia. Seccombe et al. (1987) reported that dietary L-carnitine supplementation of rabbits was associated with decreased plasma VLDL-cholesterol, although Spagnoli et al. (1995) and Sayed-Ahmed et al. (2001) found that L-carnitine did not affect plasma total cholesterol. A chronic study of L-carnitine in drinking water of rats (Empl et al. 2015; Weinert et al. 2016) did not lead to any adverse effects on the cardiovascular system, and was also not associated with any preneoplastic or neoplastic changes in the colon.
11
Overall, the weight of evidence in animal studies does not support the hypothesis that L-carnitine is a significant risk factor for atherosclerosis.
3.1.4 Human studies investigating safety
A large number of human intervention studies with L-carnitine have been conducted in healthy subjects and in subjects with medical conditions. Many of the studies investigating the potential beneficial effects of L-carnitine have also included assessment of safety parameters. There are also studies on L-carnitine-L-tartrate that are valuable for hazard assessment.
A review published in 2006 considered findings from 27 studies in humans administered L-carnitine, or its salts or esters, at oral doses of up to 7 g/day and durations of up to 12 months (Hathcock and Shao 2006). Fishy body and/or urine odour were reported in some subjects at the highest doses tested (6–7 g/day L-carnitine). This was likely due to conversion of unabsorbed L-carnitine to TMAO by gut microbiota (Ayesh et al. 1993).
The studies summarised below were considered to be particularly valuable for hazard assessment because they: (i) used high daily oral doses for long durations in a large number of males and females (6 g/day for 12 months; Iliceto et al. 1995); (ii) investigated clinical chemistry and haematology parameters (Rubin et al. 2001; Keller et al. 2009; Badrasawi et al. 2016); (iii) provided information on doses resulting in treatment-related adverse effects (Villani et al. 2000; Bain et al. 2006); (iv) investigated safety during pregnancy (Keller et al. 2009); and (v) investigated safety in elderly subjects (Badrasawi et al. 2016).
In a randomized, double-blind, placebo-controlled trial, L-carnitine was administered to 472 male and female patients (mean age 59 y) that had experienced an acute myocardial infarction. Subjects received either placebo (239 patients) or L-carnitine (233 patients) within 24 h of onset of chest pain. Placebo or L-carnitine was given at a dose of 9 g/day intravenously for the first 5 days and then 6 g/day orally for the next 12 months. Treatment did not have to be interrupted in any of the patients because of adverse events. After discharge, there were no statistically significant differences between the L-carnitine and placebo groups in the incidence of ischemic events or in the combined incidence of congestive heart failure and death (Iliceto et al. 1995).
In a study of 18 moderately overweight premenopausal women (age range 19–48 y) given L-carnitine at an oral dose of 4 g/day for 8 weeks, five subjects experienced nausea or diarrhoea that may have been treatment-related. No other adverse effects were reported (Villani et al. 2000).
A tolerance study in 10 healthy males (mean age 24 y) included investigation of the potential effects of L-carnitine-L-tartrate on standard clinical chemistry and haematology parameters. The study was a random, double-blind, cross-over design, with a one-week washout period. L-carnitine-L-tartrate or placebo was ingested orally as capsules at a dose of 1.5 g twice daily for 3 weeks. The daily dose of 3 g L-carnitine-L-tartrate is equivalent to an L-carnitine dose of 2 g/day. Blood samples were taken at the end of the 3-week period for routine clinical chemistry and haematology investigations. No adverse effects were reported by any subjects and there were no effects on haematological or clinical chemistry parameters related to L-carnitine-L-tartrate administration (Rubin et al. 2001).
In a dose-escalation study, 7 healthy adult males (mean age 32 y) were administered L-carnitine doses of 0.5, 1 and 2 g three times a day for 7 days at each dose level. One subject at the 1.5 g/day dose and 2 subjects at the 6 g/day dose reported nausea, 2 subjects at the 6 g/day dose reported diarrhoea, and one subject at the 6 g/day dose reported a metallic taste (Bain et al. 2006).
12

In a placebo-controlled, single-blind study, healthy pregnant women (n = 26) were randomly assigned to two groups receiving either an L-carnitine supplement (500 mg L-carnitine per day as L-carnitine-L-tartrate) (n = 13) or placebo (n = 13) from the 13th week of gestation to term. There were no statistically significant differences in neonatal characteristics between the two groups, namely, gestational age, neonatal weight, and neonatal body length. There were no statistically significant differences in maternal haematology parameters at delivery (leukocyte, thrombocyte and erythrocyte counts, haemoglobin, haematocrit, mean cell volume, mean cell haemoglobin, mean corpuscular haemoglobin concentration, and ferritin) (Keller et al. 2009).
In a double-blind, placebo-controlled study, 50 elderly subjects (mean age 68 y) were randomised into two groups: an L-carnitine group (n = 26; 1.5 g/day for 10 weeks) and a placebo group (n = 24). There were no statistically significant changes in body composition, performance on a cognitive function test, fasting blood sugar, glycated haemoglobin, lipid profile, liver function and kidney function. No subjects reported diarrhoea, nausea or any other adverse effects (Badrasawi et al. 2016).
3.1.5 Cardiovascular outcomes and plasma concentrations of L-carnitine and TMAO
Since 2013, several studies have reported positive associations between plasma concentrations of L-carnitine and/or TMAO and adverse cardiovascular outcomes, and there are also studies reporting no associations.
The first report was an observational study investigating the relationship between fasting plasma L-carnitine and TMAO concentrations and cardiovascular disease (CVD) risk in a cohort of subjects (n = 2595) undergoing cardiac evaluation (Koeth et al. 2013). Seventy-four percent of the subjects had prior coronary artery disease (CAD). Plasma L-carnitine quartile values in the cohort were <31.6, 31.7–37.8, 37.9–45.1 and >45.1 µM. Positive associations between L-carnitine plasma concentrations and risk of CAD, peripheral artery disease (PAD), and overall CVD were observed (p < 0.05), and these associations remained statistically significant (p < 0.05) following adjustments for traditional CVD risk factors (age, gender, diabetes mellitus, systolic blood pressure, former or current cigarette smoking, LDL-cholesterol, and HDL-cholesterol).
As described in Appendix 4, a number of additional papers describing the incidence of major adverse cardiac events (MACE: death, myocardial infarction, stroke) after three years of follow-up or all-cause mortality after 5 years of follow-up have been reported for an extended version of the cohort of subjects described by Koeth et al. (2013). In the patients undergoing elective coronary angiography, the median plasma TMAO concentration in this cohort was 3.7 µM and the interquartile range 2.4–6.2 µM. In participants without events (n = 3494) the median plasma TMAO concentration was 3.5 µM (interquartile range 2.4–5.9 µM). In participants with events (n = 513) the median plasma TMAO concentration was 5.0 µM (interquartile range 3.8–8.8 µM). Increased plasma concentrations of TMAO were associated with an increased risk of a major adverse cardiovascular event (hazard ratio (HR) for highest vs. lowest TMAO quartile: 1.43; 95% CI, 1.05 to 1.94) after adjustment for traditional risk factors (Tang et al. 2013).
Other research groups have investigated other groups of patients with heart disease or renal failure to determine whether TMAO predicts future cardiovascular events or mortality (See Appendix 4). Most studies report an increase in their outcome of less than 2-fold for the highest versus lowest TMAO group, although some authors report no association. While most studies calculate the HR for the highest versus lowest quartile, there is no obvious increase in HR as the difference in TMAO concentration increases between these two groups which might be expected if a dose-response relationship existed. However it is
13

possible that there are too many other differences between the cohorts to allow a dose-response to be seen via an inter-cohort comparison, even if a dose-response truly exists. There are also a small number of studies which find no association. Some research groups have also examined the incidence of prostate or colorectal cancer in pre-existing studies with variable results (See Appendix 4).
There are several other findings that are inconsistent with the possibility that increased plasma TMAO concentration is a causal factor for adverse cardiovascular outcomes. For example, plasma TMAO concentration has been shown to increase from 4 µM (baseline) to 9 µM one year after bariatric surgery, a procedure which is known to reduce CVD risk (Trøseid et al. 2016). Also, in a feeding trial in healthy men, consumption of fish resulted in ~50-times higher postprandial plasma TMAO concentrations compared with the consumption of eggs or beef (Cho et al. 2017). In addition, no health benefits were identified in individuals who produce very low amounts of endogenous TMAO due to impaired FMO3 activity (Fennema 2016). Furthermore, Fukami et al. (2015) found that blood pressure decreased and several favourable changes in relevant biochemical marker following administration of 900 mg L-carnitine/day for six months to patients with renal failure receiving haemodialysis who were carnitine deficient, despite a large increase in TMAO concentration.
FSANZ concludes that there is insufficient information available at present to determine whether TMAO might be a surrogate marker for another factor (e.g. a better indicator of declining renal function than the currently available estimation equations) or a new modifiable risk factor.
3.1.6 Safety of tartrate intake from ingestion of L-carnitine-L-tartrate
The Joint FAO/WHO Expert Committee on Food Additives (JECFA) recently reaffirmed a group Acceptable Daily Intake (ADI) of 0–30 mg/kg bw for L-tartaric acid and its sodium, potassium and potassium–sodium salts, expressed as L-tartaric acid (WHO 2017). In the study used to derive the ADI, no treatment-related adverse effects were observed in rats at dose levels up to 3200 mg/kg bw per day, the highest dose tested. For a 70 kg adult, L-tartaric acid intake of 30 mg/kg bw is equivalent to 2.1 g, an amount present in 6.7 g of L-carnitine-L-tartrate. In addition, the application indicated that the 90th percentile estimated dietary exposure to tartrate, calculated using the proposed use levels of L-carnitine-L-tartrate, would not exceed 18% of the group ADI. Based on these considerations, it is concluded that intake of tartrate from ingestion of L-carnitine-L-tartrate does not pose safety concerns.
3.1.7 Hazard assessment – Discussion and conclusions
The hazard assessment considered information on the physiology, biochemistry and pharmacokinetics of L-carnitine/ L-carnitine-L-tartrate and other L-carnitine salts, and data from animal and human studies investigating a wide range of parameters relevant to safety.
Studies in animals showed that L-carnitine and L-carnitine chloride are not genotoxic and are of low acute toxicity. A subchronic dietary toxicity study in rats did not show any adverse effects at doses of up to 3934 mg/kg bw/day L-carnitine-L-tartrate in males, and 5042 mg/kg bw/day in females. In studies with L-carnitine chloride effects such as gastrointestinal irritation and increased water consumption were observed in animals, however these are likely to be attributable to the chloride ion. This is also likely to explain increased mortality, clinical signs and body weight effects in some studies at higher doses with L-carnitine chloride but not L-carnitine. The available evidence supports that L-carnitine and its salts are not likely to be carcinogenic, or reproductive or developmental toxicants.
A large body of human data support the safety of L-carnitine at doses higher than what can
14

be expected from normal dietary intake (typically about 50 mg/day for omnivores: Stephens et al. 2011). L-carnitine doses as high as 7 g/day for durations of up to 12 months have been investigated, including in studies in elderly subjects, and in pregnant women, and no adverse effects attributable to L-carnitine intake have been identified at doses of up to 3 g/day. At doses >3 g/day, nausea, gastrointestinal disturbances, and fishy body and/or urine odour have been the only treatment-related adverse effects observed.
Since 2013, a number of published studies have raised potential concerns for an increased risk of cardiovascular disease due to TMAO, a metabolite of L-carnitine. FSANZ has considered the relevant scientific literature and concludes that there is insufficient information available at present to determine whether TMAO might be a surrogate marker for another factor (e.g. a better indicator of declining renal function than the currently available estimation equations) or a new modifiable risk factor. It is noted that recent publications have cast doubt on the possibility that elevated plasma TMAO concentration is a causal factor for adverse cardiovascular outcomes (Cho and Caudill 2017; Landfald et al. 2017).
Furthermore, there is no relationship between plasma concentrations of carnitine and TMAO. The normal range for plasma carnitine concentration is approximately 25–65 µM, and intake of L-carnitine supplements by healthy subjects, at doses as high as ~4 g/day, has been shown to increase plasma carnitine concentrations by no more than approximately 2-fold (see Supporting Document 2). (Larger increases can be achieved in haemodialysis patients that have depleted carnitine stores, see e.g. Fukami et al. 2015). In contrast, consumption of food rich in TMAO (e.g. fish) can result in ~50-fold higher postprandial plasma TMAO concentrations compared with concentrations that can be achieved from the consumption of eggs or beef (Cho et al. 2017).
Based on the above considerations, it is concluded that intake of L-carnitine at up to 3 g/day does not pose a public health and safety concern.
3.2 Dietary intake assessment
3.2.1 Approach to estimating dietary intake of L-carnitine
Dietary intake assessments require data on the concentrations of the chemical of interest in the foods requested, and consumption data for the foods that have been collected through a national nutrition survey.
The dietary intake of L-carnitine was estimated using (1) naturally occurring L-carnitine concentrations and the Maximum Permitted Levels (MPL) for existing L-carnitine permissions and the permissions requested in this application; and (2) food consumption data from the most recent Australian and New Zealand national nutrition surveys. The dietary intake assessment was undertaken using FSANZ’s dietary modelling computer program, Harvest1. An evaluation of L-carnitine intakes from dietary supplements was also conducted.
A summary of the general FSANZ approach to conducting the dietary intake assessment for this application is at Appendix 2. A detailed discussion of the FSANZ methodology and approach to conducting dietary intake assessments is set out in Principles and Practices of Dietary Exposure Assessment for Food Regulatory Purposes (FSANZ 2009).
Consumption data used
The permissions contained in the Australia New Zealand Food Standards Code (the Code) 1 Harvest is FSANZ’s custom-built dietary modelling program that replaced the previous program, DIAMOND, which does the same calculations just using a different software program.
15

apply to foods sold in both Australia and New Zealand, therefore dietary intake assessments were undertaken for both countries.
The food consumption data used for the dietary intake assessments were: 2002 New Zealand National Children’s Nutrition Survey (2002 NZNNS), one 24-hour
food recall covering 3,275 New Zealand school children aged 5-14 years. 2008/09 New Zealand Adult Nutrition Survey (2008 NZANS), one 24 hour food recall
covering 4,721 New Zealanders aged 15 years and above. 2011-12 Australian National Nutrition and Physical Activity Survey (2011-12 NNPAS),
one 24 hour food recall survey of 12,153 Australians aged 2 years and above, with a second 24-hour recall undertaken for 64% of respondents. Only those respondents who had two days of food consumption data (n=7,735) were used in the assessment of dietary intakes.
The design of these nutrition surveys vary and the key attributes of each, including survey limitations, are set out in Appendix 2.
Consumption data for dietary supplements was from the 2011-12 NNPAS, as this was collected from respondents during the 24-hour recalls. Label dosage information was also used.
The hazard identification and characterisation did not identify any population sub-groups for which there were specific safety considerations in relation to intake of L-carnitine. In addition, the food categories requested in the application for addition of L-carnitine are consumed by all sectors of the Australian and New Zealand populations. A dietary intake assessment was conducted for children because children generally have higher intakes due to their smaller body weight, and they consume more food per kilogram of body weight compared to adults. The population groups listed in Table were used for the dietary intake assessment.
In addition, dietary intakes of L-carnitine were estimated for some specific groups of consumers in the population. These specific groups were identified as target consumers in the application and are: respondents who didn't consume meats (including. poultry, seafoods & game) or meat products (e.g. fish sauce)) in the nutrition surveys as a proxy for 'vegetarians'; consumers of weight management or meal replacement products; and consumers of sports foods ± protein supplements (e.g. bars / powders). These groups were assessed for Australians aged 2 years and above and New Zealanders 15 years and above. New Zealand children were not included in this evaluation as there were no consumers of sports foods or weight reduction foods.
The population group of the elderly (71 years and above) is considered to be a specific consumer group in this assessment and is discussed separately to the general population groups. However, consumers aged 71 years and above are included in the assessment of the general population groups of Australians age 2 years and above and New Zealanders aged 15 years and above.
16
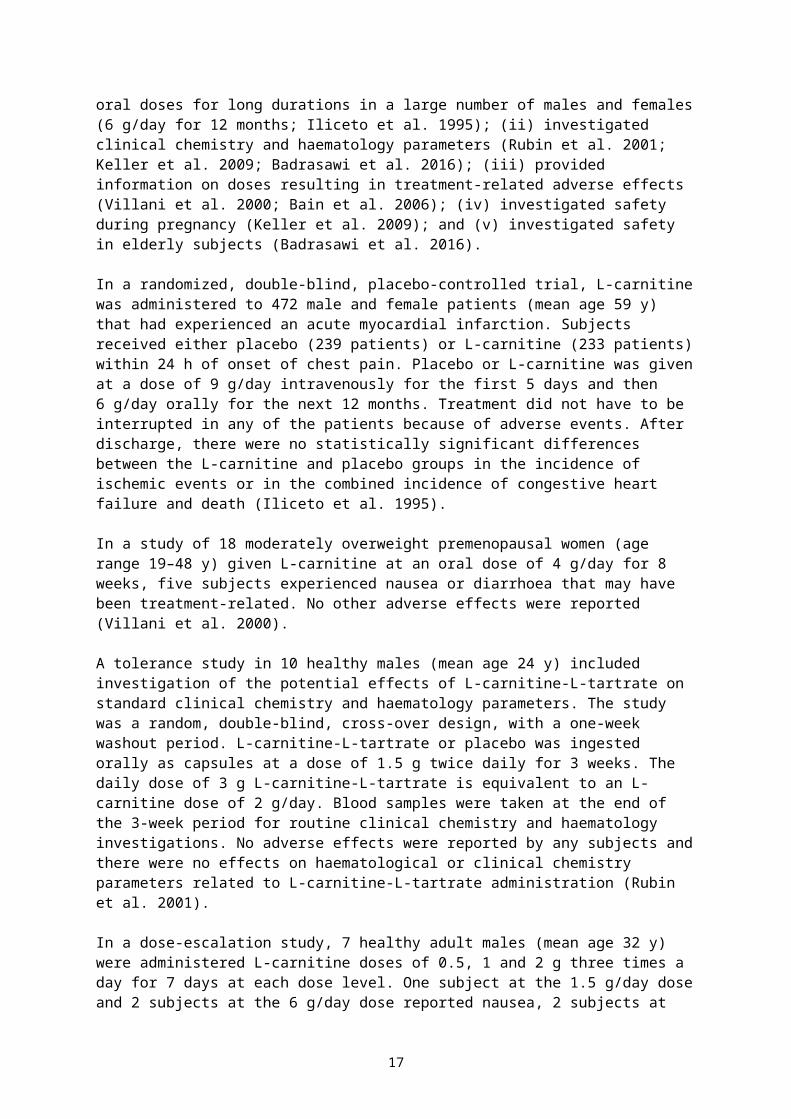
Table 5: Population groups used in the dietary intake assessment
Country Survey Age groupNo.
respondents (Day 1 only)
No. respondents (Day 1 and 2)
Australia 2011-12 NNPAS 2 – 6 years 779 479
7 – 17 years 1,753 1,127
18 – 70 years 8,599 5,477
71 years and above 1,023 652
2 years and above 12,153 7,735
New Zealand 2002 NZNNS 5 – 14 years 3,275 n/a
2008 NZANS 15 years and above 4,721 n/a
18 – 70 years 3,992 n/a
71 years and above 463 n/a
Proposed food categories and concentrations of L-carnitine
L-carnitine occurs naturally in foods and is currently permitted to be added to a) Formulated Supplementary Sports Foods with a Maximum amount added per one-day quantity of 100 mg; and b) Infant Formula Products at a minimum of 0.21 mg/100 kJ and maximum of 0.8 mg/100 kJ. These current permissions are considered as a part of the ‘Baseline’ scenario along with naturally occurring L-carnitine.
The application requested permissions for L-carnitine addition to products including flavoured milk, cultured dairy products (e.g. yoghurts), chocolate, sugar confectionary (including intensely sweetened chewing gum), cereals, muesli, cereal bars, foods intended for particular nutritional uses, a variety of non-alcoholic beverages and gels.
A dietary intake assessment was conducted for a number of scenarios: ‘Baseline’: includes naturally occurring L-carnitine and the current permissions for L-
carnitine addition in formulated supplementary sports foods and infant formula products.
‘Sports food increase’ scenario: as per Baseline plus the requested L-carnitine permission for sports foods from the application, at 100% market penetration into the category.
‘Consumer behaviour’ scenario: as per Baseline plus all permissions requested in the application, at 100% market penetration into each category. This scenario represents where a consumer, based on the foods they would normally eat, intentionally chooses the L-carnitine fortified version of each food in every product category where it is proposed that L-carnitine addition would be permitted.
‘Baseline (excluding sports and weight management foods)’: includes naturally occurring L-carnitine and the current permissions for L-carnitine addition in infant formula products. This scenario excludes the contribution of sports food / beverages, weight management food / beverages and meal replacement food / beverages. This scenario is only used for the target group of sports food / beverage consumers.
17

‘Recommended number of serves sports foods’: includes L-carnitine intakes from Baseline (excluding sports and weight management foods) plus L-carnitine intakes from the recommended number of serves of sports food / beverage per day as provided by the Applicant (four serves per day to achieve a total intake of 2,000 mg L-carnitine per day from sports food/ beverages). This scenario is only used for the target group of sports food / beverage consumers.
Naturally occurring concentrations were assigned to a broad range of foods including dairy products, meats, fruits and vegetables. The concentrations were derived from papers submitted by the Applicant (Rebouche and Engel 1984; Demarquoy et al. 2003) and from other published sources (Gustavsen 2000; Broad et al. 2006; Rigault et al. 2007; Özogul et al. 2013).
The food category codes used by the Applicant were based on the Australia New Zealand Food Classification System (ANZFCS) in Standard 1.3.1 – Food Additives of the Code and its related Schedules. However, the food classification codes in Harvest can vary slightly and may also be split into sub-groups. To assess the populations’ dietary intake of L-carnitine, the food categories proposed by the Applicant and the data provided on naturally-occurring L-carnitine were assigned to the relevant Harvest food classification codes. The food categories and concentrations used in the dietary intake assessment are detailed in able 6.
The concentrations of L-carnitine in dietary supplements was derived from the food composition databases for the nutrition surveys as well as label information.
18

1. Select the type of model
Food additive model in Harvest (best matches food groups requested in application)
2. Select the form of L-carnitine to use in the assessment
Total L-carnitine
3. Select the national nutrition surveys to use in the dietary exposure assessment
Australia: 2011-12 National Nutrition and Physical Activity Survey(2011-12 NNPAS) (2 years & above)
New Zealand:
2002 National Children's Nutrition Survey (5-14 years)2008/9 Adults Nutrition Survey (15 years & above)
4. Select the population group(s) to assess
a. Whole population (2 years & above (Au); 15 years & above (NZ))b. Children (2-6 years (Au); 7-17 years (Au); 5-14 years (NZ))c. Adult age group 18 - 70 yearsd. Elderly 71 years & abovee. Respondents who didn't consume meats (incl. poultry, seafoods & game) or meat
products (e.g. fish sauce)) in the nutrition surveys as a proxy for 'vegetarians'f. Consumers of weight management or meal replacement productsg. Consumers of sports foods ± protein supplements (e.g. bars / powders)
5. Determine the scenarios to model
5a. 'Baseline'To assess intake of L-carnitine, including naturally-occurring sources and extension of use permissions (at the maximum permitted level) for sports foods
5b. 'Sports food increase' ScenarioTo assess intake of L-carnitine, including naturally-occurring sources and extension of use permissions (at the maximum requested level) for sports foods
5c. 'Consumer behaviour' ScenarioTo assess intake of L-carnitine, including naturally-occurring sources and extension of use permissions (at the Maximum Permitted Level) for all food categories requested.
5d. 'Baseline (excluding sports and weight management foods)' ScenarioTo assess current intake of L-carnitine, including naturally-occurring sources and current permissions in infant formula products. Excludes contribution of sports, weight management and meal replacement food / beverages. Only used for the target group of sports food / beverage consumers.
5e. 'Recommended number of serves sports foods’ ScenarioTo assess intake of L-carnitine, including naturally-occurring sources and current permissions in infant formula products plus L-carnitine intakes from the recommended number of serves of sports food / beverage per day as provided by Applicant (four serves per day to achieve a total intake of 2,000 mg L-carnitine per day from sports food/ beverages). Only used for the target group of sports food / beverage consumers.
Figure 4: Dietary modelling approach used for assessing dietary intake of L-carnitine for Australia and New Zealand
19

Table 6: L-carnitine concentrations used for the dietary intake assessment
Harvest Food Category Code Food Category Name
Concentration used in dietary intake estimation (mg/kg)
BaselineBaseline (excluding sports and weight
management foods)Ω
Sports food increase Consumer
behaviour
1 Plain milk 37 37 37 37
1.1.2 Liquid milk products & flavoured liquid milk 37 37 37 1,000
1.2.1 Fermented & rennetted milk, unflavoured 37 37 37 1,666
1.2.2 Fermented & rennetted milk prod, flavoured 37 37 37 1,666
1.3 Condensed milk & evaporated milk 90 90 90 901.4 Cream & cream products 32 32 32 321.5.1 Dried milk, milk powder 37 37 37 371.5.2 Dried cream powder 32 32 32 321.5.3 Dried yoghurt powder 37 37 37 371.6 Cheese & cheese products 33 33 33 33
2.2Oil emulsions (water in oil) (excluding butter; butter products; and oil emulsions (<80% oil), dairy blends))
0.5 0.5 0.5 0.5
2.2.1.1 Butter 11 11 11 112.2.1.2 Butter products 11 11 11 112.2.2.2 Oil emulsions (<80% oil), dairy blends 11 11 11 11
3.1.1.2 Ice confection, sold liquid at room temp, dairy 37 37 37 37
3.2 Ice cream 37 37 37 37
4Fruit & vegetables (including fungi/ nuts/ seeds/ herbs/ spices) (excluding category 4 foods listed below)
2.9 2.9 2.9 2.9
20

Table 6: L-carnitine concentrations used for the dietary intake assessment
Harvest Food Category Code Food Category Name
Concentration used in dietary intake estimation (mg/kg)
BaselineBaseline (excluding sports and weight
management foods)Ω
Sports food increase Consumer
behaviour
4.1.0.1 Grapes packed with permeable envelopes 1.6 1.6 1.6 1.6
4.1.0.2 Longans 1.6 1.6 1.6 1.64.1.1.1 Untreated fruits & vegetables, fungi 30 30 30 304.1.1.2 Untreated fruits & vegetables, nuts 4.1 4.1 4.1 4.14.1.1.3 Untreated fruits & vegetables, seeds 4.1 4.1 4.1 4.14.1.1.4 Untreated fruits & vegetables, herbs 26 26 26 26
4.1.1.5.1 Untreated fruits, other including raw & cooked 1.6 1.6 1.6 1.6
4.1.1.5.2 Untreated vegetables, other including raw & cooked 3.7 3.7 3.7 3.7
4.1.2.1 Surface treated citrus fruit 0.1 0.1 0.1 0.1
4.1.2.2 Surface treated walnut & pecan nut kernels 2.5 2.5 2.5 2.5
4.1.3.1.1 Products for manufacturing purposes, apple 0.5 0.5 0.5 0.5
4.1.3.1.2 Products for manufacturing purposes, potato 2.3 2.3 2.3 2.3
4.1.3.2 Root & tuber vegetables 5.9 5.9 5.9 5.94.2.1.1 Frozen unprocessed fruits, avocado 4.2 4.2 4.2 4.2
4.3.0.1 Mushrooms in brine/water & not commercially sterile 30 30 30 30
4.3.0.2 Preserved cherries (maraschino/ cocktail/ glace cherries) 8 8 8 8
4.3.0.3 Tomato products pH <4.5 1.1 1.1 1.1 1.1
21

Table 6: L-carnitine concentrations used for the dietary intake assessment
Harvest Food Category Code Food Category Name
Concentration used in dietary intake estimation (mg/kg)
BaselineBaseline (excluding sports and weight
management foods)Ω
Sports food increase Consumer
behaviour
4.3.0.4 Processed fruits & vegetables, ginger only 2 2 2 2
4.3.1Dried fruits & vegetables (excluding dried & rehydrated legumes and dried herbs & spices)
8 8 8 8
4.3.1.3.1 Dried & rehydrated legumes 7.5 7.5 7.5 7.54.3.1.4 Dried herbs & spices 1.4 1.4 1.4 1.44.3.3.1 Canned fruits 1.6 1.6 1.6 1.64.3.3.2 Canned vegetables 3.7 3.7 3.7 3.74.3.5 Candied fruits & vegetables 8 8 8 84.3.6.3 Nut butter 0.8 0.8 0.8 0.84.3.6.5 Seed butter 0.8 0.8 0.8 0.85.1 Chocolate & cocoa products 80 80 80 1,666
5.2 Sugar confectionery (excluding bubble gum & chewing gum) 0 0 0 3,333
5.2.1 Bubble gum & chewing gum 0 0 0 12,500
6
Cereals & cereal products (excluding oats; rice; wheaten flours, meals & starches and flour products (including noodles & pasta))
3.4 3.4 3.4 3.4
6.1.1 Plain oats (dry) 0.6 0.6 0.6 5,0006.1.2 Cereals, whole & broken grains, rice 1.4 1.4 1.4 1.46.2.1 Flours, meals & starches, wheat only 7 7 7 7
6.4 Flour products (including noodles & pasta) 2.8 2.8 2.8 2.8
22
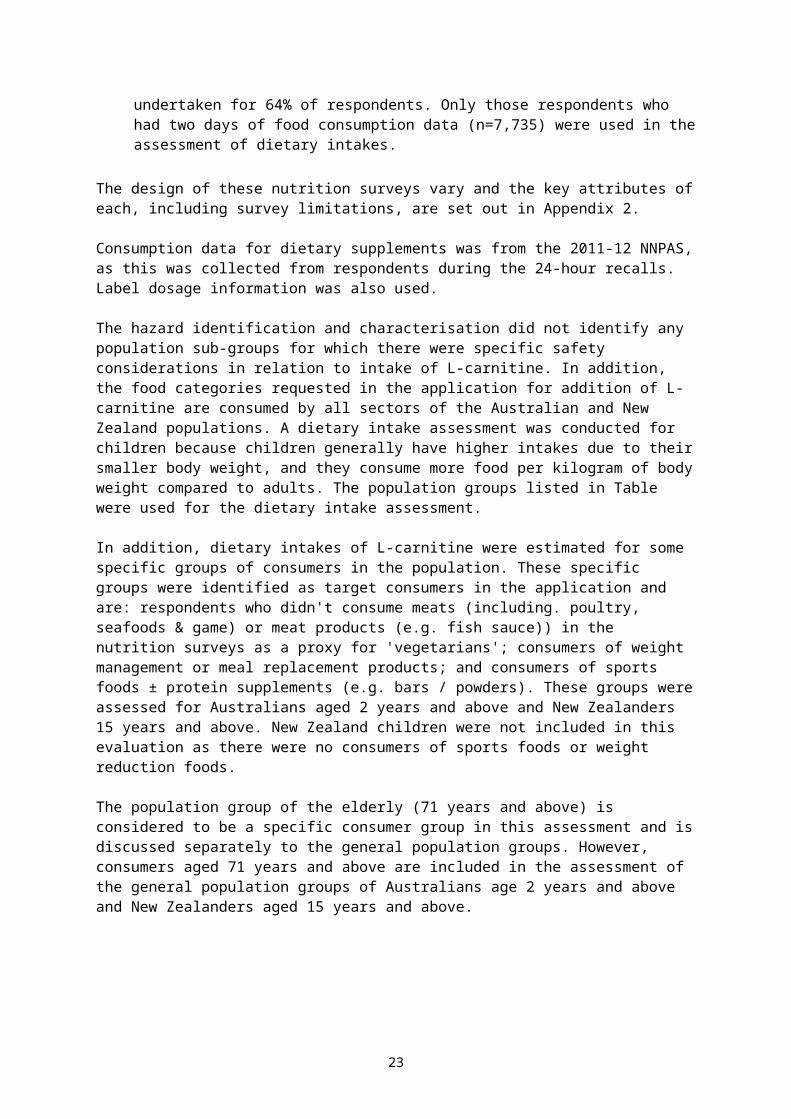
Table 6: L-carnitine concentrations used for the dietary intake assessment
Harvest Food Category Code Food Category Name
Concentration used in dietary intake estimation (mg/kg)
BaselineBaseline (excluding sports and weight
management foods)Ω
Sports food increase Consumer
behaviour
7 Breads & bakery products 2.9 2.9 2.9 2.98.1.1 Poultry (excluding duck) 102 102 102 1028.1.1.2 Poultry, duck only 288 288 288 2888.1.2 Game meat 1,387 1,387 1,387 1,3878.1.3.2 Meat not poultry/game, red 733 733 733 7338.1.3.3 Meat not poultry/game, white 197 197 197 1978.1.4 Offal, all types 126 126 126 126
8.2Processed meat/ poultry/ game products in whole/ cut pieces (e.g. ham, bacon, smoked chicken)
223 223 223 223
8.3 Processed comminuted meat, poultry & game products 156 156 156 156
8.3.2 Sausage & sausage meat 184 184 184 184
9 Fish & fish products (excluding category 9 foods listed below) 40 40 40 40
9.1.2 Unprocessed crustacea 41 41 41 419.1.3 Molluscs 87 87 87 87
9.2.1 Processed fish & fish products, crustacea 41 41 41 41
9.3 Semi-preserved fish & fish products 38 38 38 38
9.4 Fully preserved fish including canned fish products 17 17 17 17
10 Egg & egg products 8 8 8 812.5 Yeast & yeast products 11 11 11 11
23
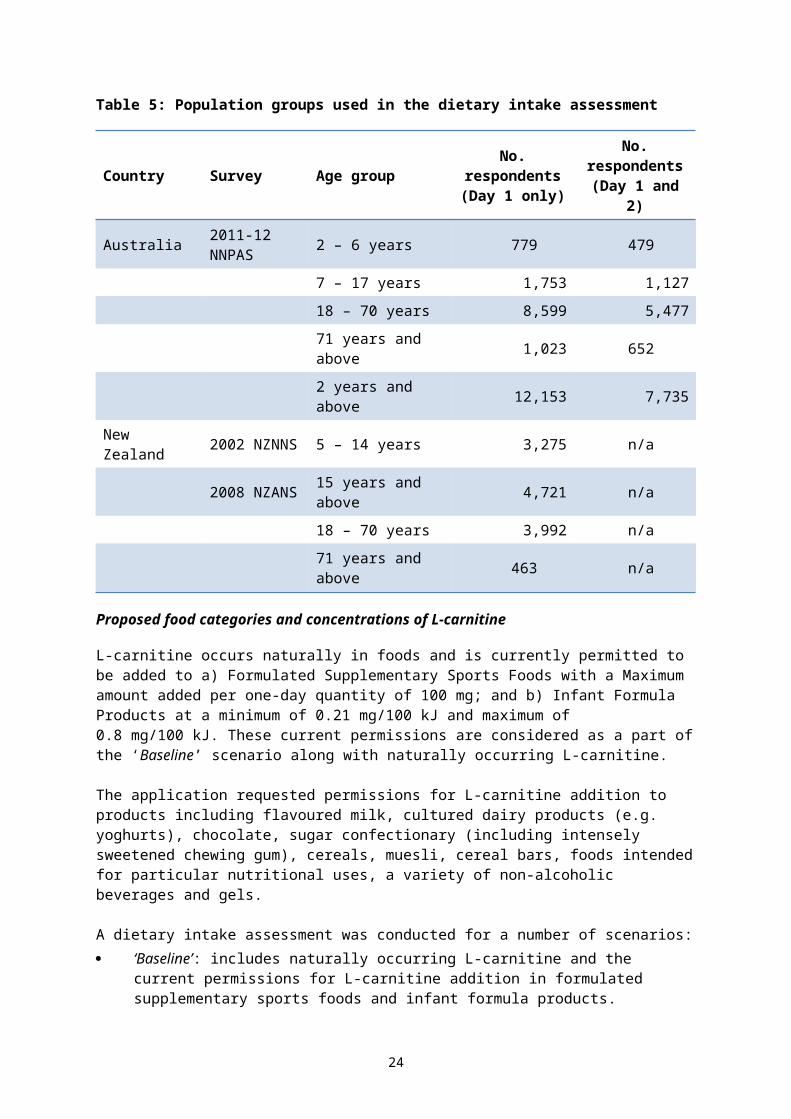
Table 6: L-carnitine concentrations used for the dietary intake assessment
Harvest Food Category Code Food Category Name
Concentration used in dietary intake estimation (mg/kg)
BaselineBaseline (excluding sports and weight
management foods)Ω
Sports food increase Consumer
behaviour
13.1 Infant formula products 21 21 21 2113.2.1 Infant cereal products 3.4 3.4 3.4 3.413.2.2 Infant fruit 1.6 1.6 1.6 1.613.2.3 Infant dairy desserts 37 37 37 3713.2.4 Infant gels & juices 0.05 0.05 0.05 0.05
13.3.1 Solid formula meal replacement & formulated supplementary foods 259 259 259 5,555
13.3.2 Liquid formula meal replacement & formulated supplementary foods 37 37 37 833
13.4.1 Solid formulated supplementary sports foods 2,222 2,222 11,111 11,111
13.4.2 Liquid formulated supplementary sports foods 200 200 1,000 1,000
13.5 Toddler formula products (excluding soy based) 37 37 37 37
13.5.1 Toddler formula products, soy based 2.5 2.5 2.5 2.5
14.1.2 Fruit & vegetable juices & fruit & vegetable juice products 0.05 0.05 0.05 400
14.1.2.1.1 Coconut milk, coconut cream & coconut syrup 0.05 0.05 0.05 0.05
14.1.3 Soft drinks (excluding intensely sweetened) 0 0 0 1,000
14.1.3.1.1.1.2 Non-brewed soft drink, carbonated, kola, intensely sweetened 0 0 0 0
14.1.3.1.1.2.1 Non-brewed soft drink, carbonated, not kola type, intensely sweetened 0 0 0 0
24

Table 6: L-carnitine concentrations used for the dietary intake assessment
Harvest Food Category Code Food Category Name
Concentration used in dietary intake estimation (mg/kg)
BaselineBaseline (excluding sports and weight
management foods)Ω
Sports food increase Consumer
behaviour
14.1.3.2.1 Brewed soft drinks, intensely sweetened 0 0 0 014.1.3.1.1.3 Energy drink 0 0 0 2,000
14.1.5Coffee (or substitute), tea, herbal infusion & similar (excluding caffeinated instant tea)
0.01 0.01 0.01 0.01
14.1.5.3.1.1 Tea, caffeinated, Instant 0 0 0 1,00014.1.6 Beverage base 37 37 37 3714.1.7 Soy beverage 2.5 2.5 2.5 1,00014.1.8 Cereal beverages 0.14 0.14 0.14 0.14
14.2
Alcoholic beverages (including no & low alcohol) (excluding beer & related products wine, sparkling wine & fortified wine)
0.38 0.38 0.38 0.38
14.2.1 Beer & related products 0.6 0.6 0.6 0.614.2.2 Wine, sparkling wine & fortified wine 0.15 0.15 0.15 0.15
14.3 Alcoholic beverages not included in item 14.2 0.38 0.38 0.38 0.38
20.1.1.5 Beverages, non-alcoholic, coffee, dry mix 12,300
20.2.2.3 Cereal products, bars 10,00020.3.1 Ready-to-eat mueslis 6,25020.3.2 Flavoured oat porridges, dry 5,000
25

Ω all concentrations for the Recommended number of serves sports foods scenario are the same as the Baseline (excluding sports and weight management foods) scenario. In the Recommended number of serves sports foods scenario, the L-carnitine intakes from the recommended number of serves of sports food / beverage per day as provided by Applicant (four serves per day to achieve a total intake of 2,000 mg L-carnitine per day from sports food/ beverages) are added manually to dietary intakes of L-carnitine.
26

Dietary modelling approach used for assessing intake of L-carnitine
The dietary modelling approach used for this assessment is summarised in Figure 4.
Assumptions and limitations of the dietary intake assessment
The aim of the dietary intake assessment was to make the most realistic estimation of dietary L-carnitine intake possible. However, where significant uncertainties in the data existed, conservative assumptions were generally used to ensure that the estimated dietary intake was not an underestimate of intake.
Assumptions made in the dietary intake assessment included: Those persons who do not eat any animal (including poultry and seafood) flesh or
marine animal roe in any form or product, whether whole or as an ingredient, can be used as a proxy for ‘vegetarians’, irrespective of whether those respondents identified as a vegetarian in the short questions from the survey or not. In this report, these respondents are referred to by the term “people who don’t eat meat”
for the purposes of the L-carnitine dietary intake assessment, sports foods/beverages are considered to be those foods/ food types listed in Table 7
for the purposes of the L-carnitine dietary intake assessment, weight management and meal replacement products are considered to be those foods/ food types listed in Table 8
unless otherwise specified, all foods within a category contain L-carnitine at the concentrations specified in Table 6
where a food was not included in the intake assessment, it was assumed to contain a zero concentration of L-carnitine
if there were no total L-carnitine concentration data available for a food but there is a free L-carnitine concentration, then free L-carnitine = total L-carnitine
where a food was assigned a L-carnitine concentration, this concentration was carried over to mixed foods where the food had been used as an ingredient (e.g. meat used in homemade casseroles; milk in homemade cakes etc.)
the request for L-carnitine permissions in yoghurt includes frozen yoghurts cultured dairy products and yoghurt beverages are “liquid yoghurts” the request for L-carnitine permissions in “6.3 Hot cereal” is oat porridges including
flavoured and plain the request for L-carnitine permissions in “6.3 Ready-to-eat (RTE), flaked, extruded
muesli” includes heavy muesli (e.g. toasted muesli) and lighter-style muesli (e.g. sultanas and bran flakes cereal; mixed puffed/flaked grains and fruit muesli)
intensely sweetened soft drinks are excluded from the requested L-carnitine permissions in “14.1.3 Water-based flavoured drinks”
one serve of sports food beverages is 500 grams one serve of solid sports foods is 45 grams at Baseline, the 100 mg/day limit for L-carnitine in sports foods is in one serve of
sports foods (i.e. this equates to 200 mg/kg sports beverages and 2,222 mg/kg in solid sports foods such as bars)
under the Sports food increase and Consumer behaviour scenarios, the 2,000 mg/day limit for L-carnitine in sports foods is in four serves of sports foods per day (i.e. this equates to 1,000 mg/kg sports beverages and 11,111 mg/kg in solid sports foods such as bars)
27

there was no contribution to L-carnitine intake through the use of complementary or other medicines.
In addition to the specific assumptions made in relation to this dietary intake assessment, there are a number of limitations associated with the nutrition surveys from which the food consumption data used for the assessment are based. A discussion of these limitations is included in Section 6 of the Principles and Practices of Dietary Exposure Assessment for Food Regulatory Purposes (FSANZ 2009).
Table 7: Foods considered to be “sports foods/ beverages”, for the purposes of the L-carnitine dietary intake assessment
Amino acid or creatine drinks
High protein bars
Protein drinks, including powders*
Protein supplement bars
Sports drink, ready to drink (including “sugar-free”)
Sports drink, concentrate*
Sports drink, powder** sports drink concentrates and powders were converted to their reconstituted form
Table 8: Foods considered to be weight management and meal replacement products, for the purposes of the L-carnitine dietary intake assessment
High protein bars
Meal replacement bars
Meal replacement drinks, including powders*
Protein drinks, including powders*
Protein supplement bars
Very low energy diet soups, including powders*
Very low energy diet drinks, including powders** meal replacement powders, very low energy diet soup powders and very low energy diet drink powders were converted to their reconstituted form
3.2.2 Estimated population dietary intakes of L-carnitine
General population groups
Australia
At Baseline, estimated mean and P90 consumer dietary intakes of L-carnitine for Australian general age groups assessed aged 2 years and above are 38 – 71 mg/day and 73 – 138 mg/day respectively. Adults aged 18-70 years have the highest mean and P90 dietary intakes on a mg/day basis.
In the Sports food increase scenario, estimated mean and P90 consumer dietary intakes of L-carnitine for Australian general age groups assessed aged 2 years and above are 38 –
28

87 mg/day and 73 –153 mg/day respectively. Adults aged 18-70 years have the highest mean and P90 dietary intakes on a mg/day basis. L-carnitine dietary intakes increase by 0 – 23% from Baseline.
In the Consumer behaviour scenario, estimated mean and P90 consumer dietary intakes of L-carnitine for Australian general age groups assessed aged 2 years and above are 288 – 449 mg/day and 546 – 952 mg/day respectively. Adults aged 18-70 years have the highest mean and P90 dietary intakes on a mg/day basis. L-carnitine dietary intakes increase by approximately 530 – 690% from Baseline.
The Applicant provided data on the estimated mean and P90 “All User” intakes of L-carnitine for the total US population of 658 mg/person/day and 1,398 mg/person/day. This is higher than the mean and P90 Consumer behaviour dietary intakes for Australians aged 2 years and above of 426 mg/person/day and 897 mg/person/day, respectively.
For further details, see Figure 5 and Table A3.1 in Appendix 3.
New Zealand
At Baseline, estimated mean and P90 consumer dietary intakes of L-carnitine for all New Zealand general age groups assessed aged 5 years and above are 60 – 76 mg/day and 131 –162 mg/day respectively. Adults aged 18-70 years have the highest mean and P90 dietary intake on a mg/day basis.
In the Sports food increase scenario, estimated mean and P90 consumer dietary intakes of L-carnitine for New Zealand general age groups assessed aged 15 years and above are 60 – 78 mg/day and 131 – 167 mg/day respectively. Adults aged 18-70 years have the highest mean and P90 dietary intakes on a mg/day basis. L-carnitine dietary intakes for New Zealanders increase by 0 – 3% from Baseline.
In the Consumer behaviour scenario, estimated mean and P90 consumer dietary intakes of L-carnitine for New Zealand general age groups assessed aged 15 years and above are 456 – 515 mg/day and 917 – 1,154 mg/day respectively. Adults aged 18-70 years have the highest mean and P90 dietary intakes on a mg/day basis. L-carnitine dietary intakes for New Zealanders increase by approximately 570 – 660% from Baseline.
As discussed above, the Applicant provided data on the estimated mean and P90 “All User” intakes of L-carnitine for the total US population of 658 mg/person/day and 1,398 mg/person/day. This is higher than the mean and P90 Consumer behaviour dietary intakes for New Zealanders aged 15 years and above of 501 mg/person/day and 1,096 mg/person/day, respectively.
For further details, refer to Figure 6 and Table A3.1 in Appendix 3.
29

Figure 5: Estimated mean and P90 dietary L-carnitine intakes for Australian population groups
30

Figure 6: Estimated mean and P90 dietary L-carnitine intakes for New Zealand population groups
31

Elderly aged 71 years and above
Baseline dietary L-carnitine intakes for the elderly aged 71 years and above are similar between Australia and New Zealand: Australian mean and P90 dietary intakes are 61 mg/day and 115 mg/day respectively; New Zealand mean and P90 dietary intakes are 57 mg/day and 125 mg/day respectively. Baseline intakes for the New Zealand elderly are lower than for the general New Zealand population aged 15 years and above whereas the Australian elderly have a similar intake to the general Australian population aged 2 years and above.
In the Sports food increase scenario, estimated mean and P90 consumer dietary intakes of L-carnitine for the elderly are 66 mg/day and 120 mg/day for Australia and 57 mg/day and 125 mg/day for New Zealand. L-carnitine dietary intakes increase in the Sports food increase scenario by 0 – 8% from Baseline.
In the Consumer behaviour scenario, estimated mean and P90 consumer dietary intakes of L-carnitine for the elderly are 304 mg/day and 603 mg/day for Australia and 299 mg/day and 655 mg/day for New Zealand. L-carnitine dietary intakes increase in the Consumer behaviour scenario by 400 – 430% from Baseline.
For further details, refer to Figure 5, Figure 6 and Table A3.1 in Appendix 3.
People who consume sports foods/beverages
The foods considered to be sports foods/ beverages are listed in Table 7. Australian mean and P90 Baseline L-carnitine dietary intakes for sports food/ beverage consumers are 137 mg/day and 249 mg/day respectively. The New Zealand Baseline mean and P90 dietary L-carnitine intakes for sports food/ beverage consumers are 109 mg/day and 238 mg/day. These intakes are higher than for the general populations of Australians aged 2 years and above and New Zealanders aged 15 years and above.
In the Sports food increase scenario, estimated mean and P90 consumer dietary intakes of L-carnitine for sports food/beverage consumers are 378 mg/day and 801 mg/day for Australia. The mean and P90 dietary L-carnitine intakes for New Zealand sports food/ beverage consumers aged 15 years and above are 217 mg/day and 522 mg/day respectively. L-carnitine dietary intakes increase in the Sports food increase scenario by 100 – 220% from Baseline.
In the Consumer behaviour scenario, estimated mean and P90 consumer dietary intakes of L-carnitine for sports food/beverage consumers are 806 mg/day and 1,567 mg/day for Australia. The mean and P90 dietary L-carnitine intakes for New Zealand sports food/ beverage consumers aged 15 years and above are 714 mg/day and 1,384 mg/day respectively. L-carnitine dietary intakes increase in the Consumer behaviour scenario by 480 – 560% from Baseline.
Refer to Figure 5, Figure 6 and Table A3.1 in Appendix 3 for further details.
People who consume weight management or meal replacement products
The foods considered to be weight management or meal replacement products are listed in Table 8. Baseline dietary L-carnitine intakes for the Australian and New Zealand populations that consume weight management or meal replacement products are higher than those for the general populations. Australian mean and P90 Baseline intakes are 104 mg/day and 217 mg/day respectively. New Zealand mean and P90 Baseline intakes are similar to those for Australian weight management or meal replacement product consumers with dietary intakes at 109 mg/day and 268 mg/day respectively.
32

In the Sports food increase scenario, estimated mean and P90 consumer dietary intakes of L-carnitine for Australian weight management or meal replacement product consumers are 249 mg/day and 761 mg/day. For New Zealanders aged 15 years and above, the mean and P90 dietary L-carnitine intakes are 191 mg/day and 421 mg/day. L-carnitine dietary intakes increase in the Sports food increase scenario by 55 – 250% from Baseline.
In the Consumer behaviour scenario, estimated mean and P90 consumer dietary intakes of L-carnitine for Australian weight management or meal replacement product consumers are 597 mg/day and 1,227 mg/day, respectively. The mean and P90 dietary L-carnitine intakes for New Zealand weight management or meal replacement product consumers aged 15 years and above are 736 mg/day and 1,384 mg/day respectively. L-carnitine dietary intakes increase in the Sports food increase scenario by 420 – 580% from Baseline.
Refer to Figure 5, Figure 6 and Table A3.1 in Appendix 3 for further details.
People who don’t eat meat
Dietary L-carnitine intakes for the Australian and New Zealand populations that don’t eat meat are lower than in the general population. Australian mean and P90 Baseline intakes for people who don’t eat meat are 28 mg/day and 50 mg/day respectively. New Zealand Baseline mean and P90 dietary intakes are 17 mg/day and 33 mg/day, respectively.
In the Sports food increase scenario, estimated mean and P90 consumer dietary intakes of L-carnitine for people who don’t eat meat are 42 mg/day and 52 mg/day for Australia and 17 mg/day and 33 mg/day for New Zealanders aged 15 years and above who don’t eat meat. L-carnitine dietary intakes increase in the Sports food increase scenario by approximately 0 – 50% from Baseline.
In the Consumer behaviour scenario, estimated mean and P90 consumer dietary exposures to L-carnitine for people who don’t eat meat are 381 mg/day and 828 mg/day for Australia and 513 mg/day and 1,248 mg/day for New Zealanders aged 15 years and above who don’t eat meat. L-carnitine dietary intakes increase in the Consumer behaviour scenario by approximately 1,260 – 3,680% from Baseline.
Refer to Figure 5, Figure 6 and Table A3.1 in Appendix 3 for further details.
Dietary supplements
Consumption of L-carnitine containing supplements from nutrition survey data
In the 2011-12 NNPAS, only 0.04% of the population with two days of food consumption data consumed an L-carnitine containing dietary supplement on either Day 1 or Day 2 of the survey or on both days. None of the consumption of L-carnitine supplements was by the elderly (71 years and above), people who consumed sports foods, people who consumed weight reduction or weight management products, or people who didn’t eat meat on the day of the survey. L-carnitine containing supplement consumers were aged 4 – 62 years and had a dietary intake over the two days of the NNPAS of 404 – 1,000 mg L-carnitine per day from supplements (expressed as L-carnitine).
In the 2008 NZANS, only 0.01% of the population aged 15 years and above consumed an L-carnitine containing dietary supplement (i.e. a tablet or capsule containing L-carnitine). None of the consumption of L-carnitine supplements was by people in the survey who consumed sports foods ± protein supplements (e.g. bars / powders), people who consumed weight management or meal replacement products, or people who didn’t eat meat (incl. poultry, seafoods & game) or meat products (e.g. fish sauce)) on the day of the survey. There was an insufficient number of consumers to derive a reliable estimate of L-carnitine intake from dietary supplements for New Zealand.
33
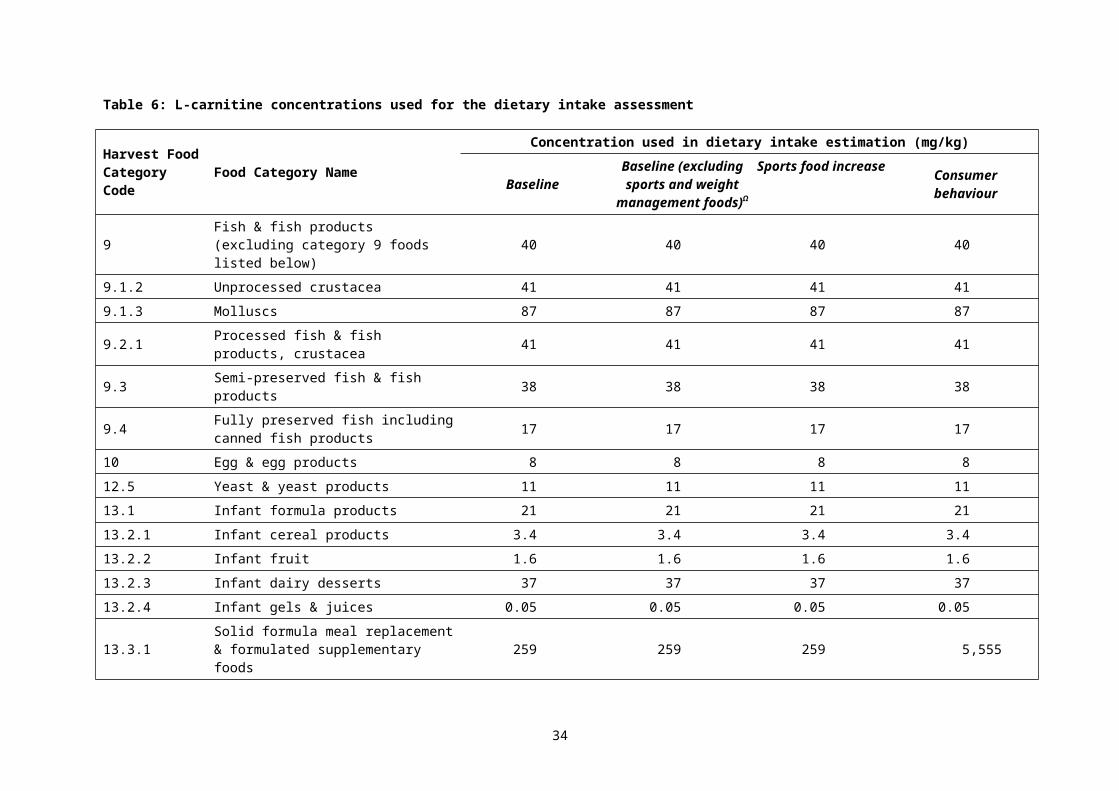
Dosage instructions on L-carnitine containing supplements on the market
There is a range of dosages for L-carnitine containing supplements in tablet or capsule form that are on the market in Australia and New Zealand. These supplements are in the form of L-carnitine, acetyl L-carnitine and acetyl L-carnitine HCl. If the dosage instructions on these supplements is followed, L-carnitine intakes (expressed as L-carnitine) would be in the range of 336 – 2,046 mg per day. If the mid-point of the dosage ranges is assumed, the intake of L-carnitine (expressed as L-carnitine) would be around 1,500 mg/day. This differs to the intake of L-carnitine from supplements in the 2011-12 NNPAS. The intakes from the NNPAS were lower, however they were based on the average reported intakes across two survey days as opposed to daily label directions.
Estimated population dietary intakes of L-carnitine, considering consumption of four serves of sports food / beverages per day
The consumption of 2,000 mg L-carnitine from sports food / beverages per day was recommended by the Applicant, spread over four serves per day. In order to assess the L-carnitine intakes of Australian and New Zealand sports food / beverage consumers when the recommended amount of L-carnitine is consumed per day, a Baseline intake was estimated excluding the current contribution of these foods and weight management products and meal replacement products to L-carnitine dietary intakes (‘Baseline (excluding sports and weight management foods)’ scenario). The recommended amount of L-carnitine was added to this alternate Baseline (‘Recommended number of serves sports foods’ Scenario). New Zealand children were not included in this evaluation as there were no consumers of sports foods in the 2002 NZNNS.
The ‘Baseline (excluding sports and weight management foods)’ estimated mean and P90 dietary intakes of L-carnitine are 76 and 152 mg/day for Australia and 81 and 218 mg/day for New Zealand sports food / beverage consumers, respectively (see Table 9) under the ‘Recommended number of serves sports foods’ scenario.
Table 9: Estimated dietary intake of L-carnitine for Australian and New Zealand sports food / beverage consumers for the Baseline (excluding sports and weight management foods) and Recommended number of serves sports foods scenarios
Country Age Group
No. of Sports Food /
Beverage Consumer
Estimated dietary intake of L-Carnitine (mg/day)Mean P90
Baseline (excluding sports and
weight management
foods)
Recomm. no. of serves
sports foods = 2g/day
Baseline (excluding sports and
weight management
foods)
Recomm. no. of serves sports foods = 2g/day
Australia 2 years and above 419 76 2,076 152 2,152
New Zealand
15 years and above 61 81 2,081 218 2,218
Based on consumption data from Day 1 and 2 Based on consumption data from Day 1 only
3.2.3 Major foods contributing to L-carnitine dietary intakes
The food category contributors to estimated L-carnitine intakes were calculated from consumers’ dietary intakes from all foods consumed that were proposed to contain L-carnitine and from naturally occurring sources. Food categories were considered to be major contributors if their contribution was ≥5%.
34

Australian general population groups (aged 2 years and above)
Baseline
At Baseline, Meat & meat products (including poultry and game) (57 – 72%) and Dairy products (excluding butter and butter fats) (15 – 33%) are the major contributing food categories to L-carnitine dietary intakes. For all population groups except children aged 2-6 years (2%), Foods intended for particular dietary uses is also a major contributing food category (5 – 6%).
Within the Dairy products (excluding butter and butter fats) food category, Plain milk is the major contributing food group (11 – 25%) to L-carnitine dietary intakes.
Within the Meat & meat products food category, Red meat excluding game is the major contributing food group (40 – 54%) to L-carnitine dietary intakes for all general age groups assessed, followed by Poultry (6 – 7%). For children aged 7-17 years, Processed meat/ poultry/ game products in whole/ cut pieces (e.g. ham, bacon, smoked chicken) is a major contributor to L-carnitine intakes (5%).
Within the Foods intended for particular dietary uses food category, Liquid formulated supplementary sports foods is a major contributing food group (5%) to L-carnitine dietary intakes for adults aged 8-70 years.
See Table A3.2 in Appendix 3 for further details.
Sports food increase scenario
Under the Sports food increase scenario, Meat & meat products (including poultry and game) (56 – 60%) and Dairy products (excluding butter and butter fats) (12 – 33%) are the major contributing food categories to L-carnitine dietary intakes. For all general age groups except children aged 2-6 years (3%), Foods intended for particular dietary uses (17 – 24%) is also a major contributing food category.
Within the Dairy products (excluding butter and butter fats) food category, Plain milk is the major contributing food group (9 – 25%) to L-carnitine dietary intakes.
Within the Meat & meat products food category, Red meat excluding game is the major contributing food group (40 – 44%) to L-carnitine dietary intakes for all general age groups, followed by Poultry (6%).
Within the Foods intended for particular dietary uses food category, Liquid formulated supplementary sports foods is the major contributing food group (16 – 20%) to L-carnitine dietary intakes for all general age groups assessed, except for children aged 2-6 years (<1%).
See Table A3.2 in Appendix 3 for further details.
Consumer behaviour scenario
The food categories that contribute to L-carnitine dietary intakes change under the Consumer behaviour scenario in comparison to the Baseline. Non-alcoholic and alcoholic beverages (27 – 44%) is the major contributing food category for all age groups assessed, followed by Dairy products (excluding butter and butter fats) (13 – 35%), Commercial mixed foods (16 – 19%), Meat & meat products (including poultry and game) (8 – 11%) and Foods intended for particular dietary uses (5 – 7%). The food group of Cereals & cereal products is a major contributor for adults aged 18-70 years and for the general Australian population aged 2 years and above (6%). Confectionary (5 – 6%) is a major contributor for children aged 2-17 years.
35

Within the Non-alcoholic and alcoholic beverages food category, Soft drinks (excluding intensely sweetened) (9 – 29%) is the major contributing food group, followed by Fruit & vegetable juices & fruit & vegetable juice products (7 – 15%).
Within the Dairy products (excluding butter and butter fats) food category, Flavoured fermented & rennetted milk products (e.g. flavoured yoghurt) is the major contributing food group (6 – 24%) to L-carnitine dietary intakes for all age groups assessed. Liquid milk products and flavoured liquid milk is a major contributor for children aged 7-17 years (5%).
Cereal bars (5 – 12%) is the major contributing food group within the Commercial mixed foods category. For all aged groups except for children aged 2-6 years (3%), the food group of Ready-to-eat mueslis is a major contributor (5 – 12%).
Within the Foods intended for particular dietary uses category, Liquid formula meal replacement & formulated supplementary foods is a major contributor (5%) for Australian children aged 2-17 years.
Within the Meat & meat products food category, Red meat excluding game is the major contributing food group (5 – 8%) to L-carnitine dietary intakes for all age groups assessed.
Within the Cereals & cereal products food category, Plain oats is the major contributor for adults aged 18-70 years and for the general population aged 2 years and above (5%). When Flavoured oat porridge mixes are taken into account (from the Commercial mixed foods category) with Plain oats (from the Cereals & cereal products category), all oat porridges contribute to 6% of L-carnitine dietary intakes for Australian adults aged 18-70 years and for the general population aged 2 years and above.
See Table A3.2 in Appendix 3 for further details.
New Zealand general population groups (aged 5 years and above)
Baseline
At Baseline, Meat & meat products (including poultry and game) (73 – 78%) and Dairy products (excluding butter and butter fats) (14 – 17%) are the major contributing food categories to L-carnitine dietary intakes.
Within the Dairy products (excluding butter and butter fats) food category, Plain milk is the major contributing food group (10 – 14%) to L-carnitine dietary intakes.
Within the Meat & meat products food category, Red meat excluding game is the major contributing food group (50 – 52%) to L-carnitine dietary intakes for all general age groups assessed, followed by Game meat (5 – 8%) and Poultry (5%). For all age groups except for children aged 5-14 years (4%), Processed meat/ poultry/ game products in whole/ cut pieces (e.g. ham, bacon, smoked chicken) is a major contributor to L-carnitine intakes (5%). Sausages and sausage meat is a major contributing food group for children aged 5-14 years.
See Table A3.6 in Appendix 3 for further details.
Sports food increase scenario
Under the Sports food increase scenario, Meat & meat products (including poultry and game) (73 – 77%) and Dairy products (excluding butter and butter fats) (14 – 17%) are the major contributing food categories to L-carnitine dietary intakes.
Within the Dairy products (excluding butter and butter fats) food category, Plain milk is the major
36

contributing food group (10 – 14%) to L-carnitine dietary intakes.
Within the Meat & meat products food category, Red meat excluding game is the major contributing food group (50 – 51%) to L-carnitine dietary intakes for all general age groups, followed by Game meat (5 – 7%) and Poultry (5%). For all age groups except for children aged 5-14 years (4%), Processed meat/ poultry/ game products in whole/ cut pieces (e.g. ham, bacon, smoked chicken) is a major contributor to L-carnitine intakes (5%). Sausages and sausage meat is a major contributing food group for children aged 5-14 years.
See Table A3.6 in Appendix 3 for further details.
Consumer behaviour scenario
The food categories that contribute to L-carnitine dietary intakes change under the Consumer behaviour scenario in comparison to the Baseline. Non-alcoholic and alcoholic beverages (33 – 39%) is the major contributing food category for all age groups assessed, followed by Dairy products (excluding butter and butter fats) (17 – 18%), Commercial mixed foods (18 – 19%), Meat & meat products (including poultry and game) (10 – 12%) and Confectionary (6 – 14%). Cereals & cereal products (5%) is a major contributor for adults aged 18-70 years and for the general population aged 15 years and above.
Within the Non-alcoholic and alcoholic beverages food category, Soft drinks (except intensely sweetened) (25 – 26%) is the major contributing food group for all age groups assessed, followed by Fruit & vegetable juices & fruit & vegetable juice products (5 – 6%). Energy drinks is a major contributor (6 – 7%) for adults aged 18-70 years and for the general population aged 15 years and above.
Within the Dairy products (excluding butter and butter fats) food category, Liquid milk products & flavoured liquid milk (8 – 10%) is the major contributing food group to L-carnitine dietary intakes for all New Zealand general age groups assessed, followed by Flavoured fermented & rennetted milk products (e.g. flavoured yoghurt) (5 – 6%).
Cereal bars (7 – 15%) is the major contributing food group within the Commercial mixed foods category. Ready to eat muesli is a major contributor for New Zealanders aged 18-70 years and 15 years and above (10%). Within the Cereals & cereal products food category, Plain oats is the major contributor for adults aged 18-70 years and for the general population aged 15 years and above (5%). When Flavoured oat porridge mixes are taken into account (from the Commercial mixed foods category) with Plain oats (from the Cereals & cereal products category), all oat porridges contribute to 5 – 6% of L-carnitine dietary intakes for New Zealander adults aged 18-70 years and for the general New Zealand population aged 15 years and above.
Within the Meat & meat products food category, Red meat excluding game is the major contributing food group (7 – 8%) to L-carnitine dietary intakes.
Within the Confectionary food category, Sugar confectionery (excluding bubble gum & chewing gum) (8%) and Chocolate and cocoa products (5%) are major contributing food groups for New Zealander children aged 5-14 years.
See Table A3.6 in Appendix 3 for further details.
Elderly Australians and New Zealanders aged 71 years and above
Baseline
At Baseline, Meat & meat products (including poultry and game) (Au 74%; NZ 74%) and Dairy
37

products (excluding butter and butter fats) (Au 16%; NZ 17%) are the major contributing food categories to L-carnitine dietary intakes for Australian and New Zealand elderly aged 71 years and above.
Within the Dairy products (excluding butter and butter fats) food category, Plain milk is the major contributing food group to L-carnitine dietary intakes for both Australian (13%) and New Zealand (13%) elderly aged 71 years and above.
Within the Meat & meat products food category, Red meat excluding game is the major contributing food group (Au 57%; NZ 51%) to L-carnitine dietary intakes for the elderly aged 71 years and above. Processed meat/ poultry/ game products in whole/ cut pieces (e.g. ham, bacon, smoked chicken) (Au 5%; NZ 5%) is also a major contributing food group for both countries. Game meat is a major contributor for New Zealand elderly (NZ 6%). Poultry (Au 5%) is a major contributor for Australian elderly.
See Table A3.3 and Table A3.7 in Appendix 3 for further details.
Sports food increase scenario
Under the Sports food increase scenario, Meat & meat products (including poultry and game) (Au 68%; NZ 73%) and Dairy products (excluding butter and butter fats) (Au 15%; NZ 17%) are the major contributing food categories to L-carnitine dietary intakes for Australian and New Zealand elderly aged 71 years and above. For the Australian elderly, Foods intended for particular dietary uses (Au 10%) is also a major contributing food category.
Within the Dairy products (excluding butter and butter fats) food category, Plain milk is the major contributing food group to L-carnitine dietary intakes for both Australian (12%) and New Zealand (13%) elderly aged 71 years and above.
Within the Meat & meat products food category, Red meat excluding game is the major contributing food group (Au 52%; NZ 51%) to L-carnitine dietary intakes for the elderly aged 71 years and above. Game meat (NZ 6%) and Processed meat/ poultry/ game products in whole/ cut pieces (e.g. ham, bacon, smoked chicken) (NZ 5%) are major contributors for New Zealand elderly. Poultry (Au 5%) is a major contributor for Australian elderly.
Within the Foods intended for particular dietary uses food category, Solid formulated supplementary sports foods (5%) and Liquid formulated supplementary sports foods (5%) are major contributing food groups to L-carnitine dietary intakes for Australian elderly aged 71 years and above.
See Table A3.3 and Table A3.7 in Appendix 3 for further details.
Consumer behaviour scenario
The food categories that contribute to L-carnitine dietary intakes change under the Consumer behaviour scenario in comparison to the Baseline. Commercial mixed foods (Au 26%) is the major contributing food category for Australian elderly aged 71 years and above, followed by Non-alcoholic and alcoholic beverages (Au 22%), Dairy products (excluding butter and butter fats) (Au 16%), Meat & meat products (including poultry and game) (Au 15%), and Cereals & cereal products (Au 12%). For New Zealand elderly, the major contributing food category is Dairy products (excluding butter and butter fats) (NZ 29%), followed by Cereals & cereal products (NZ 17%), Commercial mixed foods (NZ 18%), Meat & meat products (including poultry and game) (NZ 14%), and Non-alcoholic and alcoholic beverages (NZ 14%).
Within the Commercial mixed foods food category, Ready-to-eat muesli is the major contributor for Australian and New Zealand elderly (Au 21%; NZ 13%). Within the Cereals & cereal products food
38

category, Plain oats is the major contributor for the elderly aged 71 years and above (Au 12%; NZ 17%). When Flavoured oat porridge mixes are taken into account (from the Commercial mixed foods category) with Plain oats (from the Cereals & cereal products category), all oat porridges contribute to 17% of L-carnitine dietary intakes for the New Zealand elderly aged 71 years and above and 13% for Australian elderly.
Within the Dairy products (excluding butter and butter fats) food category, Flavoured fermented & rennetted milk products (e.g. flavoured yoghurt) is the major contributing food group to L-carnitine dietary intakes for Australian and New Zealand elderly (Au 8%; NZ 9%). For New Zealand elderly, Liquid milk products and flavoured liquid milk (NZ 14%) is a major contributing food group.
Within the Non-alcoholic and alcoholic beverages food category, Soft drinks (except intensely sweetened) (Au 11%; NZ 8%) is the major contributing food group, followed by Fruit & vegetable juices & fruit & vegetable juice products (Au 8%; NZ 5%).
Within the Meat & meat products food category, Red meat excluding game is the major contributing food group (Au 11%; NZ 10%) to L-carnitine dietary intakes for the elderly aged 71 years and above.
See Table A3.3 and Table A3.7 in Appendix 3 for further details.
People who consume sports foods/beverages
Baseline
At Baseline, Meat and meat products (including poultry and game) (Au 43%; NZ 51%), Foods intended for particular dietary uses (Au 44%; NZ 25%), and Dairy products (excluding butter and butter fats) (Au 9%; NZ 17%) are the major contributing food categories to L-carnitine dietary intakes for Australian aged 2 years and above and New Zealanders aged 15 years and above who consume sports foods/ beverages.
Within the Dairy products (excluding butter and butter fats) food category, Plain milk (Au 6%; NZ 14%) is the major contributing food group to L-carnitine dietary intakes for Australian sports food/ beverage consumers aged 2 years and above.
Within the Meat & meat products food category, Red meat excluding game (Au 31%; NZ 34%) is the major contributing food group to L-carnitine dietary intakes for sports food/ beverage consumers for both countries. Processed comminuted meat, poultry and game products except sausages and sausage meat is a major contributor for New Zealand (NZ 5%).
Within the Foods intended for particular dietary uses category, Liquid formulated supplementary sports foods (Au 37%; NZ 21%) is a major contributing food group for both Australian and New Zealand sports food/beverage consumers. For Australian sports food/beverage consumers, Solid formulated supplementary sports foods (Au 7%) is a major contributing food group.
See Table A3.3 and Table A3.7 in Appendix 3 for further details.
Sports food increase scenario
Under the Sports food increase scenario, Foods intended for particular dietary uses (Au 80%; NZ 62%), and Meat and meat products (including poultry and game) (Au 16%; NZ 26%) are the major contributing food categories to L-carnitine dietary intakes for Australian aged 2 years and above and New Zealanders aged 15 years and above who consume sports foods/ beverages. For New Zealand sports food/beverage consumers, Dairy products (NZ 8%) was also a major contributing food category.
39

Within the Meat & meat products food category, Red meat excluding game (Au 11%; NZ 17%), is the major contributing food group to L-carnitine dietary intakes for Australian and New Zealand sports food/ beverage consumers.
Within the Foods intended for particular dietary uses category, Liquid formulated supplementary sports foods (Au 68%; NZ 53%) and Solid formulated supplementary sports foods (Au 12%; NZ 9%) are the major contributing food groups.
Within the Dairy products (excluding butter and butter fats) category, Plain milk (Au 2%; NZ 7%) is a major contributing food group for New Zealand sports food/beverage consumers.
See Table A3.3 and Table A3.7 in Appendix 3 for further details.
Consumer behaviour scenario
The food categories that contribute to L-carnitine dietary intakes change under the Consumer behaviour scenario in comparison to the Baseline. Foods intended for particular dietary uses (Au 40%; NZ 20%), Non-alcoholic and alcoholic beverages (Au 24%; NZ 22%), Commercial mixed foods (Au 12%; NZ 18%), Dairy products (excluding butter and butter fats) (Au 10%; NZ 15%), and Meat & meat products (including poultry and game) (Au 7%; NZ 8%) are the major contributing food categories for sports food/ beverage consumers. For New Zealanders, Cereals and cereal products (NZ 10%) and Confectionary (NZ 6%) are also major contributing food categories.
Within the Foods intended for particular dietary uses food category, Liquid formulated supplementary sports foods (Au 32%; NZ 16%) and Solid formulated supplementary sports foods (Au 6%) are the major contributing food groups to L-carnitine dietary intakes.
Within the Non-alcoholic and alcoholic beverages food category, Soft drinks (except intensely sweetened) (Au 15%; NZ 11%) and Energy drinks (NZ 6%) are the major contributing food groups.
For Australia and New Zealand, Ready-to-eat muesli is a major contributing food group (Au 8%; NZ 9%) group within the Commercial mixed foods food category. Cereal bars are also a major contributing food group for New Zealand sports food/beverage consumers (NZ 9%).
Within the Cereals & cereal products food category, Plain oats (NZ 10%) is the major contributing food group for New Zealand.
Within the Dairy products (excluding butter and butter fats) food category, Liquid milk products and flavoured liquid milk is the major contributing food group to L-carnitine dietary intakes for New Zealand sports food/beverage consumers (NZ 8%). Flavoured fermented & rennetted milk products (e.g. flavoured yoghurt) is a major contributing food group for Australian sports food/beverage consumers (Au 5%).
Within the Meat & meat products (including poultry and game) food category, Red meat excluding game is the major contributing food group for both countries (Au 5%; NZ 5%).
See Table A3.3 and Table A3.7 in Appendix 3 for further details.
People who consume weight management or meal replacement products
Baseline
At Baseline, Meat & meat products (including poultry and game) (Au 50%; NZ 56%), Foods intended for particular dietary uses (Au 37%; NZ 20%) and Dairy products (excluding butter and butter fats) (Au 9%; NZ 17%) are the major contributing food categories to L-carnitine dietary intakes
40
for Australians and New Zealanders who consume weight management or meal replacement products.
Within the Meat & meat products food category, Red meat excluding game is the major contributing food group (Au 37%; NZ 41%) to L-carnitine dietary intakes for Australians aged 2 years and above and New Zealanders aged 15 years and above who consume weight management or meal replacement products. Poultry (Au 5%) is a major contributor for Australia. Processed meat/ poultry/ game products in whole/ cut pieces (e.g. ham, bacon, smoked chicken) is a major contributor to L-carnitine intakes for New Zealand consumers of weight management or meal replacement products (NZ 5%).
Within the Dairy products (excluding butter and butter fats) food category, Plain milk is the major contributing food group (Au 7%; NZ 15%) to L-carnitine dietary intakes.
Within the Foods intended for particular dietary uses category, Liquid formulated supplementary sports foods is the major contributing food group (Au 19%; NZ 15%). Solid formulated supplementary sports foods is a major contributing food group for Australian consumers of weight management or meal replacement products (Au 14%).
See Table A3.3 and Table A3.7 in Appendix 3 for further details.
Sports food increase scenario
Under the Sports food increase scenario, Foods intended for particular dietary uses (Au 73%; NZ 55%) and Meat & meat products (including poultry and game) (Au 21%; NZ 32%) are the major contributing food categories to L-carnitine dietary intakes for Australians and New Zealanders who consume weight management or meal replacement products. For New Zealanders, Dairy products (excluding butter and butter fats) is a major contributing food category (NZ 10%).
Within the Foods intended for particular dietary uses category, Liquid formulated supplementary sports foods (Au 41%; NZ 43%) and Solid formulated supplementary sports foods (Au 30%; NZ 11%) are the major contributing food groups for Australian and New Zealand weight management or meal replacement product consumers.
Within the Meat & meat products food category, Red meat excluding game is the major contributing food group (Au 16%; NZ 23%) to L-carnitine dietary intakes for Australians aged 2 years and above and New Zealanders aged 15 years and above who consume weight management or meal replacement products.
Within the Dairy products (excluding butter and butter fats) food category, Plain milk is the major contributing food group (NZ 8%) to L-carnitine dietary intakes for New Zealanders aged 15 years and above who consume weight management or meal replacement products. The Dairy products (excluding butter and butter fats) food category is not a major contributor for Australian weight management or meal replacement product consumers under the Sports food increase scenario.
See Table A3.3 and Table A3.7 in Appendix 3 for further details.
41

Consumer behaviour scenario
The food categories that contribute to L-carnitine dietary intakes change under the Consumer behaviour scenario in comparison to the Baseline. Foods intended for particular dietary uses (Au 42%; NZ 19%) is the major contributing food category for weight management or meal replacement product consumers, followed by Non-alcoholic and alcoholic beverages (Au 22%; NZ 21%), Dairy products (excluding butter and butter fats) (Au 10%; NZ 14%), Commercial mixed foods (Au 10%; NZ 19%) and Meat & meat products (including poultry and game) (Au 8%; NZ 8%), and Cereals and cereal products (NZ 11%). For New Zealanders, Confectionary (7%) is a major contributing food category.
Liquid formulated supplementary sports foods (Au 16%; NZ 11%), Solid formulated supplementary sports foods (Au 12%) and Liquid formula meal replacements and formulated supplementary foods (Au 12%) are the major contributing food groups within the Foods intended for particular dietary uses category.
Within the Non-alcoholic and alcoholic beverages food category, Soft drinks (except intensely sweetened) (Au 14%; NZ 10%) is the major contributing food group. For New Zealanders, Energy drinks (NZ 6%) is also a major contributor.
Within the Dairy products (excluding butter and butter fats) food category, Flavoured fermented & rennetted milk products (e.g. flavoured yoghurt) (Au 5%) is a major contributing food group to L-carnitine dietary intakes for Australian consumers of weight management or meal replacement product consumers aged 2 years and above. For New Zealanders, Liquid milk products and flavoured liquid milk (NZ 8%) was a major contributing food group.
Ready-to-eat muesli is the major contributing food group within the Commercial mixed foods category (Au 7%; NZ 8%). Cereal bars was the major contributing food group within this category for New Zealanders (11%).
Within the Meat & meat products food category, Red meat excluding game is the major contributing food group (Au 6%; NZ 6%) to L-carnitine dietary intakes for Australian and New Zealand weight management or meal replacement product consumers aged 2 years and above and 15 years and above, respectively.
Plain oats (NZ 11%) is a major contributor within the Cereals and cereal products food category for New Zealand consumers of weight management / meal replacement products.
See Table A3.3 and Table A3.7 in Appendix 3 for further details.
People who don’t eat meat
Baseline
At Baseline, Dairy products (excluding butter and butter fats) (Au 75%; NZ 75%), and Fruit and vegetables, including fungi, nuts, seeds, herbs, spices (Au 11%; NZ 11%) are the major contributing food categories to L-carnitine dietary intakes for Australians aged 2 years and above and New Zealanders aged 15 years and above who did not consume meat on the day(s) of the NNSs.
Within the Dairy products (excluding butter and butter fats) food category, Plain milk is the major contributing food group (Au 63%; NZ 43%) to L-carnitine dietary intakes. Milk powder (NZ 10%), Liquid milk products & flavoured liquid milk (NZ 8%) and Flavoured fermented & rennetted milk products (e.g. flavoured yoghurt) (NZ 7%) are major contributors for New Zealanders aged 15 years and above.
42

See Table A3.3 and Table A3.7 in Appendix 3 for further details.
Sports food increase scenario
Under the Sports food increase scenario, Dairy products (excluding butter and butter fats) (Au 75%; NZ 75%), and Fruit and vegetables, including fungi, nuts, seeds, herbs, spices (Au 11%; NZ 11%) are the major contributing food categories to L-carnitine dietary intakes for Australians aged 2 years and above and New Zealanders aged 15 years and above who did not consume meat on the day(s) of the NNSs. This is the same as at Baseline.
Within the Dairy products (excluding butter and butter fats) food category, Plain milk is the major contributing food group (Au 63%; NZ 43%) to L-carnitine dietary intakes. Milk powder (NZ 10%), Liquid milk products & flavoured liquid milk (NZ 8%) and Flavoured fermented & rennetted milk products (e.g. flavoured yoghurt) (NZ 7%) are major contributors for New Zealanders aged 15 years and above. This is the same as at Baseline.
See Table A3.3 and Table A3.7 in Appendix 3 for further details.
Consumer behaviour scenario
The food categories that contribute to L-carnitine dietary intakes change under the Consumer behaviour scenario in comparison to the Baseline. Non-alcoholic and alcoholic beverages (Au 30%; NZ 43%) is the major contributing food category for Australians aged 2 years and above and New Zealanders aged 15 years and above who didn’t eat meat on the day(s) of the NNSs, followed by Commercial mixed foods (Au 32%; NZ 17%), Dairy products (excluding butter and butter fats) (Au 17%; NZ 26%), and Cereals and cereal products (Au 14%; NZ 8%).
Within the Non-alcoholic and alcoholic beverages food category, Soft drinks (except intensely sweetened) (Au 16%; NZ 28%), Soy beverage (Au 12%; NZ 6%) and Fruit & vegetable juices & fruit & vegetable juice products (NZ 7%) are the major contributing food groups.
Ready-to-eat muesli (Au 19%; NZ 9%), and Cereal bars (Au 11%; NZ 6%) are the major contributing food groups within the Commercial mixed foods food category.
Within the Dairy products (excluding butter and butter fats) food category, Flavoured fermented & rennetted milk products (e.g. flavoured yoghurt) (NZ 10%), Liquid milk products and flavoured liquid milk (NZ 11%), and Unflavoured fermented & rennetted milk products (e.g. natural/ plain yoghurt) (Au 7%) are the major contributing food groups to L-carnitine dietary intakes.
Within the Cereal and cereal products food category, Plain oats is the major contributing food group (Au 14%; NZ 8%).
See Table A3.3 and Table A3.7 in Appendix 3 for further details.
3.2.4 Dietary intake assessment summary
At Baseline, estimated dietary intakes of L-carnitine for the Australian and New Zealander general and specific population groups examined are 17 – 137 mg/day at the mean and 33 –268 mg/day at the P90. The lowest dietary intakes of L-carnitine at Baseline are for New Zealand consumers aged 15 years and above who don’t eat meat.
Under the Sports food increase scenario, estimated dietary intakes of L-carnitine for the Australian and New Zealander general and specific population groups examined are 17 – 378 mg/day at the mean and 33 – 801 mg/day at the P90. Estimated mean and P90 consumer dietary intakes of L-carnitine increase by 0 – 23% and 0 – 3% from Baseline for Australian and New Zealand general
43

age groups aged 2 years and above and 5 years and above, respectively. For Australian and New Zealand elderly aged 71 years and above, dietary L-carnitine intakes increase by 0 – 8% from Baseline. For sports food/beverage consumers, dietary L-carnitine intakes increase by 100 – 220% from Baseline, with weight management or meal replacement product consumers having 55 – 250% increases from Baseline. L-carnitine dietary intakes increase by approximately 0 – 50% from Baseline for people who don’t eat meat. The lowest dietary intakes of L-carnitine under the Sports food increase scenario are for New Zealand consumers aged 15 years and above who don’t eat meat.
Under the Consumer behaviour scenario, estimated dietary intakes of L-carnitine for the Australian and New Zealander general and specific population groups examined are 288 – 806 mg/day at the mean and 546 – 1,567 mg/day at the P90. Estimated mean and P90 consumer dietary intakes of L-carnitine increase by 530 – 690% and 570 – 660% from Baseline for Australian and New Zealand general age groups aged 2 years and above 5 years and above, respectively. For Australian and New Zealand elderly aged 71 years and above, the increase is 400 – 430% from Baseline. The increase in L-carnitine dietary intakes from Baseline is similar for sports food/beverage consumers (480 – 560%) and weight management or meal replacement product consumers (420 – 580%). The largest percentage increase in L-carnitine dietary intakes from Baseline is for people who don’t eat meat (1,260 – 3,680%). The lowest dietary intakes of L-carnitine under the Consumer behaviour scenario are for Australian children aged 2-6 years.
The impact of Australian (2 years and above) and New Zealand (15 years and above) sport food/beverage consumers consuming 2,000 mg L-carnitine per day from sports foods/ beverages was assessed in addition to their intake from all other foods. The mean and P90 dietary intakes in this scenario are 2,076 – 2,081 mg/day and 2,152 – 2,218 mg/day, respectively.
3.3 Risk characterisation
The highest 90th-percentile intake of L-carnitine estimated from the dietary intake assessment is approximately 2.4 g per day which comes from a scenario which adds four serves per day of sports food / beverages containing L-carnitine at 500 mg/serve to the baseline L-carnitine intake. This highest estimated intake level is below 3 g/day, the highest intake of L-carnitine that has not been associated with adverse effects. Therefore, there are no public health and safety concerns from the addition of L-carnitine / L-carnitine-L-tartrate to a range of general purpose and special purpose foods, as requested in the application.
44

4 ReferencesAyesh R, Mitchell SC, Zhang A, Smith RL (1993) The fish odour syndrome: biochemical, familial, and clinical aspects. BMJ 307(6905):655–657
Badrasawi M, Shahar S, Zahara AM, Nor Fadilah R, Singh DK (2016) Efficacy of L-carnitine supplementation on frailty status and its biomarkers, nutritional status, and physical and cognitive function among prefrail older adults: a double-blind, randomized, placebo-controlled clinical trial. Clin Interv Aging 11:1675–1686
Bae S, Ulrich CM, Neuhouser ML, Malysheva O, Bailey LB, Xiao L, Brown EC, Cushing-Haugen KL, Zheng Y, Cheng TY, Miller JW, Green R, Lane DS, Beresford SA, Caudill MA (2014) Plasma choline metabolites and colorectal cancer risk in the Women's Health Initiative Observational Study. Cancer Res 74(24):7442–7452
Bain MA, Milne RW, Evans AM (2006) Disposition and metabolite kinetics of oral L-carnitine in humans. J Clin Pharmacol 46(10):1163–1170
Boden WE, O’Rourke RA, Teo KK, Hartigan PM, Maron DJ, Kostuk WJ, Knudtson M, Dada M, Casperson P, Harris CL, Chaitman BR, Shaw L, Gosselin G, Nawaz S, Title LM, Gau G, Blaustein AS, Booth DC, Bates ER, Spertus JA, Berman DS, Mancini GB, Weintraub WS (2007) Optimal medical therapy with or without PCI for stable coronary disease. N Engl J Med 356:1503–1516
Brandsch C and Eder K (2003) Reproductive performance of rats supplemented with L-carnitine. Journal of Animal Physiology and Animal Nutrition 87:301–308
Cho CE, Taesuwan S, Malysheva OV, Bender E, Tulchinsky NF, Yan J, Sutter JL, Caudill MA (2017) Trimethylamine-N-oxide (TMAO) response to animal source foods varies among healthy young men and is influenced by their gut microbiota composition: a randomized controlled trial. Mol Nutr Food Res 61(1)
Cho CE, Caudill MA (2017) Trimethylamine-N-oxide: friend, foe, or simply caught in the cross-fire? Trends Endocrinol Metab 28(2):121–130
Clarke R, Shipley M, Lewington S, Youngman L, Collins R, Marmot M, Peto R (1999) Underestimation of risk associations due to regression dilution in long-term follow-up of prospective studies. Am J Epidemiol 150(4):341–353
Clouet P, Semporé G, Tsoko M, Gresti J, Demarquoy J, Niot I, Bézard J, and Martin-Privat P (1996) Effect of short-and long-term treatments by a low level of dietary L-carnitine on parameters related to fatty acid oxidation in Wistar rat. Biochemica et Biophysica Acta 1299:191–197
Collins HL, Drazul-Schrader D, Sulpizio AC, Koster PD, Williamson Y, Adelman SJ, Owen K, Sanli T, Bellamine A (2016) L-carnitine intake and high trimethylamine N-oxide plasma concentrations correlate with low aortic lesions in ApoE-/- transgenic mice expressing CETP. Atherosclerosis 244:29–37
Demarquoy J, Georges B, Rigault C, Royer M-C, Clairet A, Soty M et al. (2003) Radioisotopic determination of L-carnitine content in foods commonly eaten in Western countries. Food Chem 86(1):137–142
Demarquoy J, Rigault C, Le Borgne F (2012) L-Carnitine. Ch 5 In: Nollet L, Toldra F (eds) Handbook of analysis of active compounds in functional foods. CRC Press, Boca Raton, pp. 87–104
45

EFSA (2003) Opinion of the scientific panel on food additives flavourings, processing aids, and materials in contact with food (AFC) related to L-carnitine-L-tartrate for use in foods for particular nutritional purposes. EFSA Journal 19:1–13
EFSA (2012) EFSA panel on additives and products or substances used in animal feed (FEEDAP); Scientific Opinion on the safety and efficacy of L-carnitine and L-carnitine-L-tartrate as feed additives for all animal species based on a dossier submitted by Lonza Benelux BV. EFSA Journal 10(5):2676. Available online: http://www.efsa.europa.eu/en/efsajournal/pub/2676
Empl MT, Kammeyer P, Ulrich R, Joseph JF, Parr MK, Willenberg I, Schebb NH, Baumgartner W, Rohrdanz E, Steffen C, Steinberg P (2015) The influence of chronic L-carnitine supplementation on the formation of preneoplastic and atherosclerotic lesions in the colon and aorta of male F344 rats. Arch Toxicol 89(11):2079–2087
EU (2012) Commission Regulation (EU) No 231/2012 of 9 March 2012 laying down specifications for food additives. http://eur-lex.europa.eu/legal-content/EN/TXT/PDF/?uri=CELEX:32012R0231&from=EN
Fennema D, Phillips IR, Shephard EA (2016) Trimethylamine and trimethylamine N-oxide, a flavin-containing monooxygenase 3 (FMO3)-mediated host-microbiome metabolic axis implicated in health and disease. Drug Metab Dispos. 44(11):1839–1850
FCC (2014) Food Chemicals Codex 9th Edition, United States Pharmacopeial Convention (2014), Rockville, MD
FSANZ (2009) Principles and Practices of Dietary Exposure Assessment for Food Regulatory Purposes. http://www.foodstandards.gov.au/science/exposure/documents/Principles%20_%20practices%20exposure%20assessment%202009.pdf
FSANZ (2014) Protecting 'high consumers'.http://www.foodstandards.gov.au/science/exposure/Pages/protectinghighconsum4441.aspx
Fukami K, Yamagishi S, Sakai K, Kaida Y, Yokoro M, Ueda S, Wada Y, Takeuchi M, Shimizu M, Yamazaki H, Okuda S (2015) Oral L-carnitine supplementation increases trimethylamine-N-oxide but reduces markers of vascular injury in hemodialysis patients. J Cardiovasc Pharmacol 65(3):289–295
Guertin KA, Li XS, Graubard BI, Albanes D, Weinstein SJ, Goedert JJ, Wang Z, Hazen SL, Sinha R (2017) Serum trimethylamine N-oxide, carnitine, choline, and betaine in relation to colorectal cancer risk in the Alpha Tocopherol, Beta Carotene Cancer Prevention Study. Cancer Epidemiol Biomarkers Prev 26(6):945–952
Gustavsen HSM (2000) Measurement of the L-carnitine content in fresh and processed food of plant and animal origin. Hannover: School of Veterinary Medicine.
Hamai Y, Kojima M and Wada Y (1988) Studies on the mutagenicity of L-carnitine chloride. Iyakuhin Kenkyu 19(3):522–528
Hartiala JA, Tang WHW, Wang Z, Crow AL, Stewart AFR, Roberts R, McPherson R, Erdmann J, Willenborg C, Hazen SL, Allayee H (2016) Genome-wide association study and targeted metabolomics identifies sex-specific association of CPS1 with coronary artery disease. Nat Commun 7:10558
46

Hathcock JN, Shao A (2006) Risk assessment for carnitine. Regul Toxicol Pharmacol 46(1):23–28
Harlan Laboratories (2008a) Acute oral toxicity study in rats. (Lonza report No. 4318. Study No. C12086)
Harlan Laboratories (2008b) Chromosome aberration test in human lymphocytes in vitrowith LZ1000. (Lonza report No. 4322, Study No. 1208500)
Heianza Y, Ma W, Manson JE, Rexrode KM, Qi L. Gut Microbiota Metabolites and Risk of Major Adverse Cardiovascular Disease Events and Death: A Systematic Review and Meta-Analysis of Prospective Studies. J Am Heart Assoc. 2017 Jun 29;6(7). pii: e004947. doi: 10.1161/JAHA.116.004947.
Higgins JPT, Green S (2011) Cochrane Handbook for Systematic Reviews of Interventions. The Cochrane Collaboration, 2011. www.cochrane-handbook.org
Iliceto S, Scrutinio D, Bruzzi P, D'Ambrosio G, Boni L, Di Biase M, Biasco G, Hugenholtz PG, Rizzon P (1995) Effects of L-carnitine administration on left ventricular remodeling after acute anterior myocardial infarction: the L-carnitine ecocardiografia digitalizzata infarto miocardico (CEDIM) Trial. J Am Coll Cardiol 26(2):380–387
Itabashi M, Watanabe H, Yamate J, Takehara K, Tajima M and Wada Y (1988a) Reproduction studies of L-carnitine chloride in rats by oral administration prior to mating and in the early stage of gestation. Iyakuhin Kenkyu 19(3):454–464
Itabashi M, Yamashita K, Inoue T, Yamate J, Takehara K, Tajima M and Wada Y (1988b) Reproduction studies of L-carnitine chloride in rats by oral administration during the perinatal and lactating periods. Iyakuhin Kenkyu 19(3):490–509
Kaysen GA, Johansen KL, Chertow GM, Dalrymple LS, Kornak J, Grimes B, Dwyer T, Chassy AW, Fiehn O (2015) Associations of trimethylamine N-oxide with nutritional and inflammatory biomarkers and cardiovascular outcomes in patients new to dialysis. J Ren Nutr 25(4):351–356
Keller U, van der Wal C, Seliger G, Scheler C, Röpke F, Eder K (2009) Carnitine status of pregnant women: effect of carnitine supplementation and correlation between iron status and plasma carnitine concentration. Eur J Clin Nutr 63(9):1098–1105
Kikumori M, Kida S, Watanabe K, Nishida I, Tobita K and Wada Y (1988a) Acute toxicity study of L-carnitine chloride in Beagles. Iyakuhin Kenkyu 19(2):238–243
Kikumori M, Kida S, Watanabe K, Kubo T, Nishimori T, Nishimura T and Wada Y (1988b) Subacute toxicity study of L-carnitine chloride in Beagles. Iyahukin Kenkyu 19(2):244–260
Kikumori M, Kida S, Watanabe K, Nishizawa Y, Nishimori T, Nishimura T, Kitamura G, Asahara Y, Tobita K and Wada Y (1988c) Chronic toxicity study of L-carnitine chloride in Beagles. Iyakuhin Kenkyu 19(2):261–281
Kim RB, Morse BL, Djurdjev O, Tang M, Muirhead N, Barrett B, Holmes DT, Madore F, Clase CM, Rigatto C, Levin A; CanPREDDICT Investigators (2016) Advanced chronic kidney disease populations have elevated trimethylamine N-oxide levels associated with increased cardiovascular events. Kidney Int 89(5):1144–1152
47

Koeth RA (2013) Dietary trimethylamines, the gut microbiota, and atherosclerosis. PhD thesis. Department of Pathology, Case Western Reserve University, Available at https://etd.ohiolink.edu/!etd.send_file?accession=case1369997123&disposition=inlineKoeth
Koeth RA, Wang Z, Levison BS, Buffa JA, Org E, Sheehy BT, Britt EB, Fu X, Wu Y, Li L, Smith JD, DiDonato JA, Chen J, Li H, Wu GD, Lewis JD, Warrier M, Brown JM, Krauss RM, Tang WH, Bushman FD, Lusis AJ, Hazen SL (2013) Intestinal microbiota metabolism of L-carnitine, a nutrient in red meat, promotes atherosclerosis. Nat Med 19(5):576–585
Koeth RA, Levison BS, Culley MK, Buffa JA, Wang Z, Gregory JC, Org E, Wu Y, Li L, Smith JD, Tang WH, DiDonato JA, Lusis AJ, Hazen SL (2014) Gamma-butyrobetaine is a proatherogenic intermediate in gut microbial metabolism of L-carnitine to TMAO. Cell Metab 20(5):799–812
Kudow S, Watanabe H, Hisashi S, Shibuya K, Ishizaka K, Sannai S, Nakajima K and Tajmia M (1988a) Acute toxicity study of L-carnitine chloride in 10- and 22-day-old and 5-week-old rats. Iyakuhin Kenkyu 19(4):689–699 [abstract only]
Kudow S, Watanabe H, Maruyama Y, Yamate J, Takehara K, Tajima M, Wada Y, Kuwahara K and Fujita K (1988b) Chronic toxicity study of L-carnitine chloride in rats. Iyahukin Kenkyu 19(2):221–237
Landfald B, Valeur J, Berstad A, Raa J (2017) Microbial trimethylamine-N-oxide as a disease marker: something fishy? Microb Ecol Health Dis. 28(1):1327309
Lever M, George PM, Slow S, Bellamy D, Young JM, Ho M, McEntyre CJ, Elmslie JL, Atkinson W, Molyneux SL, Troughton RW, Frampton CM, Richards AM, Chambers ST (2014) Betaine and trimethylamine-N-oxide as predictors of cardiovascular outcomes show different patterns in diabetes mellitus: an observational study. PLoS One 9:e114969
Li XS, Obeid S, Klingenberg R, Gencer B, Mach F, R€aber L, Windecker S, Rodondi N, Nanchen D, Muller O, Miranda MX, Matter CM, Wu Y, Li L, Wang Z, Alamri HS, Gogonea V, Chung YM, Tang WH, Hazen SL, Lüscher TF (2017) Gut microbiota-dependent trimethylamine N-oxide in acute coronary syndromes: a prognostic marker for incident cardiovascular events beyond traditional risk factors. Eur Heart J 38:814–824
Li XS, Wang Z Cajka T, Buffa JA, Nemet I, Hurd AG, Gu X, Skye SM, Roberts AB, Wu Y, Li L, Shahen CJ, Wagner MA, Hartiala JA, Kerby RL, Romano KA, Han Y, Obeid S, Lüscher TF, Allayee H, Rey FE, DiDonato JA, Fiehn O, Tang WHW, Hazen SL (2018) Untargeted metabolomics identifies trimethyllysine, a TMAO-producing nutrient precursor, as a predictor of incident cardiovascular disease risk. JCI Insight pii:99096
LPT Laboratory of Pharmacology and Toxicology (2003) 90-day Subchronic Toxicity Study of LZ1780 by Repeated Oral Administration via the Diet to CD® Rats – According to OECD Guideline 408. (Lonza report no 3704, teil 1)
McLennan W, Podger A (1998) National Nutrition Survey Nutrient Intakes and Physical Measurements Australia 1995. Australian Bureau of Statistics, Canberra
Missailidis C, Hällqvist J, Qureshi AR, Barany P, Heimbürger O, Lindholm B, Stenvinkel P, Bergman P (2016) Serum trimethylamine-N-oxide is strongly related to renal function and predicts outcome in chronic kidney disease. PLoS One 11(1):e0141738
Mondul AM, Moore SC, Weinstein SJ, Karoly ED, Sampson JN, Albanes D (2015) Metabolomic analysis of prostate cancer risk in a prospective cohort: the alpha-tocopherol, beta-carotene cancer prevention (ATBC) study. Int J Cancer 137(9):2124–2132
48

Mueller DM, Allenspach M, Othman A, Saely CH, Muendlein A, Vonbank A, Drexel H, von EA (2015) Plasma concentrations of trimethylamine-N-oxide are confounded by impaired kidney function and poor metabolic control. Atherosclerosis 243(2):638–644
Nakamura A, Ueno H, Igarashi E, Fukasawa N, Katsumata Y, Tamura K, Suzuki T and Wada Y (1988) Teratogenicity study of L-carnitine chloride in rats by oral administration. Iyakuhin Kenkyu 19(3):465–489
Narita N, Yamate J, Takehara K, Tajima M, Wada Y and Hirose Y (1988) Acute toxicity study of L-carnitine chloride in rats. Iyakuhin Kenkyu 19(2):191–196
Obeid R, Awwad HM, Rabagny Y, Graeber S, Herrmann W, Geisel J (2016) Plasma trimethylamine N-oxide concentration is associated with choline, phospholipids, and methyl metabolism. Am J Clin Nutr 103(3):703–11
Ottiger M, Nickler M, Steuer C, Odermatt J, Huber A, Christ-Crain M, Henzen C, Hoess C, Thomann R, Zimmerli W, Mueller B, Schuetz P (2016) Trimethylamine-N-oxide (TMAO) predicts fatal outcomes in community-acquired pneumonia patients without evident coronary artery disease. Eur J Intern Med 36:67–73
Özogul Y, Boga E, Özogul F, Deniz A (2013) L-carnitine content in seafoods commonly eaten in middle eastern countries. Journal of Food Biochemistry 37(6):702–707
Poesen R, Evenepoel P, de Loor H, Bammens B, Claes K, Sprangers B, Naesens M, Kuypers D, Augustijns P, Meijers B (2016) The influence of renal transplantation on retained microbial-human co-metabolites. Nephrol Dial Transplant 31(10):1721–1729
Ramanau A, Kluge H and Eder K (2005) Effects of L-carnitine supplementation on milk production, litter gains and back-fat thickness in sows with a low energy and protein intake during lactation. British Journal of Nutrition 93:717–721
Rebouche C, Engel A (1984) Kinetic compartmental analysis of carnitine metabolism in the human carnitine deficiency syndromes: evidence for alternations in tissue carnitine transport. Journal Clinical Investigation 73(3):857–867
Rebouche CJ, Chenard CA (1991) Metabolic fate of dietary carnitine in human adults: identification and quantification of urinary and fecal metabolites. J Nutr 121(4):539–546
Rebouche CJ (2004) Kinetics, pharmacokinetics, and regulation of L-carnitine and acetyl-L-carnitine metabolism. Ann N Y Acad Sci 1033:30–41
Reuter SE, Evans AM (2012) Carnitine and acylcarnitines: pharmacokinetic, pharmacological and clinical aspects. Clin Pharmacokinet 51(9):553–572
Rigault C, Mazué F, Bernard A, Demarquoy J, Le Borgne F (2007) Changes in L-carnitine content of fish and meat during domestic cooking. Meat Science 78:331–335
Robinson-Cohen C, Newitt R, Shen DD, Rettie AE, Kestenbaum BR, Himmelfarb J, Yeung CK (2016) Association of FMO3 variants and trimethylamine N-oxide concentration, disease progression, and mortality in CKD Patients. PLoS One 11(8):e0161074
Rubin MR, Volek JS, Gómez AL, Ratamess NA, French DN, Sharman MJ, Kraemer WJ (2001)Safety measures of L-carnitine-L-tartrate supplementation in healthy men. J Strength Cond Res 15(4):486–490
49

SafePharm Laboratories (2008) LZ1000: Reverse mutation assay “Ames test” using Salmonella typhimurium and Escherichia coli. (Lonza report no 4226, SPL project number: 0102/0584)
Sayed-Ahmed MM, Khattab MM, Gad MZ and Mostafa N (2001) L-carnitine prevents the progression of atherosclerotic lesions in hypercholesterolaemic rabbits. Pharmacological Research 44(3):235–242
Schiattarella GG, Sannino A, Toscano E, Giugliano G, Gargiulo G, Franzone A, Trimarco B, Esposito G, Perrino C (2017) Gut microbe-generated metabolite trimethylamine-N-oxide as cardiovascular risk biomarker: a systematic review and dose-response meta-analysis. Eur Heart J 38(39):2948–2956
Seccombe DW, James L, Hahn P and Jones E (1987) L-carnitine treatment in the hyperlipidaemic rabbit. Metabolism 36(12):1192–1196
Senthong V, Wang Z, Wu Y, Tang WH, Hazen SL (2015) Elevated plasma trimethylamine N-oxide is associated with poor prognosis in patients with peripheral artery disease. J Am Coll Cardiol 65(10S) A2076.
Senthong V, Wang Z, Fan Y, Wu Y, Hazen SL, Tang WH (2016a) Trimethylamine N-oxide and mortality risk in patients with peripheral artery disease. J Am Heart Assoc 5(10) pii:e004237
Senthong V, Wang Z, Li XS, Fan Y, Wu Y, Tang WH, Hazen SL (2016b) Intestinal microbiota-generated metabolite trimethylamine-N-oxide and 5-year mortality risk in stable coronary artery disease: the contributory role of intestinal microbiota in a COURAGE-like patient cohort. J Am Heart Assoc 5(6) pii:e002816
Skagen K, Troseid M, Ueland T, Holm S, Abbas A, Gregersen I, Kummen M, Bjerkeli V, Reier-Nilsen F, Russell D, Svardal A, Karlsen TH, Aukrust P, Berge RK, Hov JE, Halvorsen B, Skjelland M (2016) The carnitine-butyrobetaine-trimethylamine-N-oxide pathway and its association with cardiovascular mortality in patients with carotid atherosclerosis. Atherosclerosis 247:64–69
Spagnoli LG, Orlandi A, Marino B, Mauriello A, De Angelis C and Ramacci MT (1995) Propionyl L-carnitine prevents the progression of atherosclerotic lesions in aged hyperlipemic rabbits. Atherosclerosis 114:29–44
Stephens FB, Marimuthu K, Cheng Y, Patel N, Constantin D, Simpson EJ, Greenhaff PL (2011) Vegetarians have a reduced skeletal muscle carnitine transport capacity. Am J Clin Nutr 94(3):938–944
Suzuki T, Heaney LM, Jones DJ, Ng LL (2017) Trimethylamine N-oxide and risk stratification after acute myocardial infarction. Clin Chem 63:420–428
Taesuwan S, Cho CE, Malysheva OV, Bender E, King JH, Yan J, Thalacker-Mercer AE, Caudill MA (2017) The metabolic fate of isotopically labeled trimethylamine-N-oxide (TMAO) in humans. J Nutr Biochem 45:77–82
Tang WH, Wang Z, Levison BS, Koeth RA, Britt EB, Fu X, Wu Y, Hazen SL (2013) Intestinal microbial metabolism of phosphatidylcholine and cardiovascular risk. N Engl J Med 368(17):1575–1584
Tang WH, Wang Z, Fan Y, Levison B, Hazen JE, Donahue LM, Wu Y, Hazen SL (2014) Prognostic value of elevated levels of intestinal microbe-generated metabolite trimethylamine-N-oxide in patients with heart failure: refining the gut hypothesis. J Am Coll Cardiol 64:1908–1914
50

Tang WH, Wang Z, Kennedy DJ, Wu Y, Buffa JA, Agatisa-Boyle B, Li XS, Levison BS, Hazen SL (2015) Gut microbiota-dependent trimethylamine N-oxide (TMAO) pathway contributes to both development of renal insufficiency and mortality risk in chronic kidney disease. Circ Res 116(3):448–455
Toshida K and Wada Y (1988) Acute toxicity studies of L-carnitine chloride in mice and rabbits. Iyakuhin Kenkyu 19(3):446-453
Toteno I, Furukawa S, Haguro S, Matsushima T, Awazu K, Morinaga T, Fujii S, Terada T and Wada Y (1988) Teratogenicity study of L-carnitine chloride in rabbits. Iyakuhin Kenkyu 19(3):510–521
Trøseid M, Hov JR, Nestvold TK, Thoresen H, Berge RK, Svardal A, Lappegård KT (2016) Major increase in microbiota-dependent proatherogenic metabolite TMAO one year after bariatric surgery. Metab Syndr Relat Disord 14(4):197–201
Villani RG, Gannon J, Self M, Rich PA (2000) L-carnitine supplementation combined with aerobic training does not promote weight loss in moderately obese women. Int J Sport Nutr Exerc Metab 10(2):199–207
Wang Z, Klipfell E, Bennett BJ, Koeth R, Levison BS, Dugar B, Feldstein AE, Britt EB, Fu X, Chung YM, Wu Y, Schauer P, Smith JD, Allayee H, Tang WH, DiDonato JA, Lusis AJ, Hazen SL (2011) Gut flora metabolism of phosphatidylcholine promotes cardiovascular disease. Nature 72(7341):57–63
Wang Z, Tang WH, Buffa JA, Fu X, Britt EB, Koeth RA, Levison BS, Fan Y, Wu Y, Hazen SL (2014) Prognostic value of choline and betaine depends on intestinal microbiota-generated metabolite trimethylamine-N-oxide. Eur Heart J 35:904–910
Weinert CH, Empl MT, Krüger R, Frommherz L, Egert B, Steinberg P and Kulling SE (2016) The influence of a chronic L-carnitine administration on the plasma metabolome of male Fischer 344 rats. Molecular Nutrition and Food Research DOI 10:1002/mnfr.201600651
WHO (2012) Combined Compendium of Food Additive Specifications, Joint FAO/WHO Expert Committee on Food Additives (JECFA). JECFA food additive specifications can be retrieved at: http://www.fao.org/ag/agn/jecfa-additives/search.html?lang=en
WHO (2017) Evaluation of certain food additives: eighty-fourth report of the Joint FAO/WHO Expert Committee on Food Additives (JECFA). WHO technical report series; No. 1007. World Health Organization.
Yamate J, Shinoda S, Maruyama Y, Kudow S, Takehara K, Tajima M, Wada Y, Hirose Y and Kuwahara K (1988) Subacute toxicity study of L-carnitine chloride in rats. Iyakuhin Kenkyu 19(2):197–220
51

Appendix 1: Evaluation of in vitro and animal toxicity studies on L-carnitine
Acute studies; L-carnitine
Acute oral toxicity study of L-carnitine in rats (Harlan Laboratories 2008a).
Subjects for this GLP-compliant study were female Wistar rats, aged 11 weeks at time of treatment. The rats were group-housed, 3/cage, under standard laboratory husbandry conditions. The test substance was identified as LZ1000, with a purity of approximately 99%. According to the applicant, LZ1000 is L-carnitine. The vehicle was deionised water. The rats were assigned to two groups of three rats each, and both groups were treated with the test substance. Rats were fasted for 16.5 to 17 hours, with access to water, prior to administration of the test substance at 2000 mg/kg bw, at a dose volume of 10 mL/kg bw, by oral gavage. The rats were permitted ad libitum access to food from 3 hours after dose administration. Rats were observed for clinical signs 1, 2, 3 and 5 hours after dose administration, and daily thereafter, in addition to twice-daily cageside checks for moribundity or mortality. Bodyweights were recorded on test days 1, 8 and 15. Rats were killed by CO2 asphyxiation on Day 15, and were subjected to gross necropsy.
All rats survived to the end of the study period and no treatment-related clinical signs, or effects on bodyweight, were observed. No lesions were discovered on gross necropsy. It was concluded that the acute oral LD50 of L-carnitine in the Wistar rat is >2000 mg/kg bw.
Acute studies; L-carnitine chloride
Acute toxicity studies of L-carnitine chloride in mice and rabbits (Toshida and Wada 1988)
The acute toxicity of L-carnitine chloride by the oral, intravenous, subcutaneous and intraperitoneal routes in ddY mice, and by the oral and intravenous routes in Japanese white rabbits, were reported in this publication. Only the results of oral administration are reviewed here, because the other routes are not relevant to food safety.
Mice were four weeks old at the time of purchase and were acclimated to standard laboratory husbandry conditions for one week prior to dose administration. They were group-housed, 5/cage, with ad libitum feed and water. Male and female mice, 10/sex/group, were assigned to the study groups. The purity of the L-carnitine chloride was not stated, but the doses were described as 6000, 7200, 8640, 10400 and 12400 mg/kg bw. The test material was dissolved in distilled water and administered by oral gavage at a dose volume of 2 mL/100 g bw. After dosing, mice were observed for 4 to 6 hours, and then daily for the rest of the in-life phase. Bodyweights were determined on days 0,1,3,7,10 and 14. Food consumption was recorded on Days -2, -1, 0, 1, 3, 7, 10 and 14. Mice found dead, and mice that survived to termination on day 14, were subject to prompt gross necropsy.
All mice treated with 12400 mg/kg bw died, the males within three hours of dosing and females within 2 days of dosing. Nine of 10 males, and 16 of 19 females dosed with 10400 mg/kg bw, died, all within one day of treatment. The mortality rate in mice dosed with 8640 mg/kg bw was 7/10 for males and 4/10 for females, all deaths occurring within one day of dosing. The mortality rate in mice dosed with 7200 mg/kg bw, on the other hand, was 2/10 for males and 3/10 for females, all within 2 days of treatment. There were no mortalities in either sex at 6,000 mg/kg bw. It was calculated that the acute oral LD50 of L-carnitine chloride is 8200 mg/kg bw in the male mouse and 8000 mg/kg bw in the female mouse.
The Japanese white rabbits were purchased at 12 weeks of age, and acclimated for three weeks
52

before dosing. They were individually housed under standard laboratory husbandry conditions, with ad libitum access to feed and water. Five rabbits/sex/group were assigned to treatment groups and gavaged with L-carnitine chloride at 3610, 4330, 5200, 6240 or 7490 mg/kg bw. Rabbits were observed for 4 to 13 hours on the day of dosing, and daily thereafter until 14 days after dosing. Bodyweights were recorded on days 0, 1, 3, 7, 10 and 14, and food consumption was recorded on days -2, -1, 0, 1, 3, 7, 10 and 14. Rabbits found dead, and rabbits that survived to scheduled termination on day 14, were subjected to necropsy.
All rabbits dosed with 7490 mg/kg bw, and 4 out of 5 rabbits of each sex dosed with 6240 mg/kg bw, died within 2 days of dosing. The mortality rate at 5200 mg L-carnitine chloride was 1/5 in male rabbits and 3/5 in female rabbits. One male and one female rabbit dosed with 4330 mg/kg bw died, whereas all rabbits dosed with 3610 mg/kg bw survived to scheduled termination. It was calculated that the acute oral LD50 of L-carnitine chloride in the male rabbit is 5400 mg/kg bw whereas in the female rabbit, it is 6000 mg/kg bw.
Acute toxicity study of L-carnitine chloride in rats (Narita et al. 1988)
The acute toxicity of L-carnitine chloride to five week old Crj:CD rats by the oral intraperitoneal, subcutaneous and intravenous routes was reported in this study, but only the oral toxicity will be reviewed here, because the other routes are not relevant to the safety of L-carnitine or L-carnitine chloride in food.
Male and female rats, 10/sex/group, were maintained under standard laboratory husbandry conditions. They were fasted for 16 hours before administration of a single dose of L-carnitine chloride by oral gavage. The purity of the test material was not stated. The dose groups for males were 0, 6200, 7130, 8200, 9430, 10845 and 12470 mg/kg bw. The dose groups for females also included a 5390 mg/kg bw group, but were otherwise the same. The dose volume was 20 mL/kg. The vehicle, and negative control material, was distilled water. On the day of dosing, clinical observations were made immediately after dosing and at 0.5, 1, 3 and 6 hours after dosing. Clinical observations were made twice daily from the day after dosing. Body weights were recorded on days 2, 3, 5, 8, 11, 13 and 15. Rats that died during the course of the study, and rats killed at scheduled termination on day 14, were subject to gross necropsy, and histopathological examination of liver, kidneys, spleen, heart, lungs, brain, stomach, jejunum, ileum, caecum and colon.
Clinical signs included piloerection, hypersalivation, pallor of the pinnae, diarrhoea, polydipsia, and decreased activity. Some rats exhibited exophthalmos and abnormal movements. The distribution of clinical signs with regard to dose groups is unclear. All control rats, all the females dosed with 5390 mg/kg bw, and all male rats dosed with 6200 mg/kg bw, survived to scheduled termination. Mortalities occurred from 30 minutes to 4 days after dosing, with a time to death inversely related to dose. Mortality rates were 2/10 for females dosed with 6200 mg/kg bw, 6/10 for males and 6/10 for females dosed with 7130 mg/kg bw, and 10/10 for both sexes at dose levels ≥8200 mg/kg bw. Necropsy findings in unscheduled mortalities included congestion and haemorrhaging of the gastric mucosa, oedema of the intestinal mucosa, and general visceral congestion. Negative effects on bodyweight or bodyweight gain were limited to the first three days after dose administration, with subsequent recovery of bodyweight gain. No abnormalities were found at gross necropsy or histopathological examination of rats that survived to scheduled termination.
The calculated acute oral LD50 (95% confidence limit) for L-carnitine chloride was 6900 (6330–7521) mg/kg bw in male rats and 6890 (6380–7441) mg/kg bw in female rats.
Acute toxicity study of L-carnitine chloride in rats (Kudow et al. 1988a)
Only the abstract of this study is available in the English language. The study was conducted in Crj:CD rats of different ages. Acute oral toxicity was determined for rats of 10 days old and 22 days old, while intraperitoneal and 5 weeks old. Both male and female rats were used in the study, and
53

both oral and intraperitoneal toxicity was investigated. The number of rats/sex/group, and the method used to calculate the LD50 is not evident from the abstract. The acute oral LD50 (95% confidence limit) of L-carnitine chloride in 10 day old rats was determined to be 4374 (3995-4790) in males and 4578 (4128-5093) in females. The acute oral LD50 (95% confidence limit) of L-carnitine chloride in 22 day old rats was determined to be 4374 (3995-4790) in males and 4578 (4128-5093) in females.
Acute toxicity study of L-carnitine chloride in Beagles (Kikumori et al. 1988a)
Male and female Beagle dogs were purchased at approximately six months of age and acclimated to the laboratory husbandry conditions for a month before the start of the in-life phase. Male dogs weighed 8.4 to 10.7 kg, and female dogs weighed 8.0 to 9.7 kg, at the time of dosing. It was found in a preliminary study that administration of a single dose of 1000 mg/kg bw, or two 800 mg/kg bw doses at 2- or 4-hour intervals, resulted in vomiting in all dosed dogs. Therefore, the dosing regimens selected for the definitive study were a single oral dose of 800 mg/kg bw or two oral doses of 800 mg/kg bw with a two-hour interval between the doses. The test material was administered in gelatin capsules. The purity of the test material was not stated. Three male and three female dogs were assigned to each group. After dose administration, all dogs were maintained on study for 14 days before being killed and necropsied. Parameters included clinical observations, food consumption, water consumption and bodyweight. All dogs survived to the end of the in-life phase. Mild gastroenteric signs of vomiting and transient diarrhoea were observed in most dogs within 24 hours of dosing. Food consumption was unaffected in most dogs. One female in the group dosed with two doses of 800 mg/kg bw exhibited a transient decrease in food consumption on Day 4 after dose administration, but it is not clear that this was a treatment-related effect. Water intake was not affected in any dogs, and all the dogs gained weight between dose administration and scheduled termination on Day 14. No treatment-related lesions were discovered at scheduled necropsy. It was concluded that the acute oral LD50 of L-carnitine chloride in the Beagle dog is >1600 mg/kg bw.
Subacute and subchronic studies; L-carnitine
Subacute and subchronic dietary studies of L-carnitine in the Wistar rat (Clouet et al. 1996)
This publication describes two separate experiments, of which one had an in-life phase of 10 days and the other had an in-life phase of 30 days. The husbandry, dose group assignment and dose administration of the two experiments were the same. For each experiment, male Wistar rats were obtained at 8 weeks of age and acclimated to standard laboratory husbandry conditions, in individual housing, for one week prior to assignment to two groups of 12 rats/group. Rats were fed powdered diet that was identical except that the diet of the control group was wetted with a controlled volume of water and the diet of the treated group was wetted with an aqueous solution of L-carnitine. The basal level of L-carnitine in the powdered diet was not reported. The volume of water or L-carnitine solution was based on the bodyweight of the rat, and in the treated rats provided 14 mg/kg bw/day L-carnitine. Food was provided daily at a level anticipated to be 80% of maximum daily intake, and drinking water was provided ad libitum. Rats were fasted, with access to water, from the day before scheduled termination. Two hours prior to scheduled euthanasia, they were administered tritiated water intraperitoneally for determination of in vivo lipogenesis as determined from tissue samples collected following euthanasia.
This study was not designed to be a toxicology study, and most endpoints determined in the study are not directly relevant to toxicology. Parameters measured during the in-life phase of each experiment included bodyweight, food intake and, in six rats/group housed for eight hours in metabolism cages, urinary carnitine excretion. Blood collected on the day of scheduled termination was analysed for ketone bodies, free and total carnitine, triacylglycerols and glucose in whole blood or plasma. Tissues, including liver, kidneys, heart, skeletal muscle and periepididymal adipose tissue were collected and weighed at scheduled necropsy, and analysed as appropriate for parameters which included free and total carnitine content, lipid analysis, lipogenesis, and hepatic
54

fatty acid oxidising system activity.
Findings relevant to the assessment of preclinical toxicology of L-carnitine were that all rats survived to scheduled termination, and that dietary administration of L-carnitine at 14 mg/kg bw/day had no significant effects on body weights. Organ weights were unaffected with the exception of a significant decrease in the absolute and relative weights of periepididymal adipose tissue, which was not associated with any histopathological findings. No adverse effects on lipid metabolism, including ketone body formation, were found.
Subacute and subchronic studies; salts of L-carnitine
13-week dietary study of L-carnitine-L-tartrate in rats (LPT 2003)
This GLP-compliant study was conducted with CD® rats as the test system. The test material was identified as LZ1780, with a stated purity of 99.9%. According to the application, this test material is L-carnitine-L-tartrate. Rats were aged 41 to 43 days at the start of the study. The target dietary concentrations of test material were 0, 0.25%, 1.25% and 5.0% w/w in the diet. Group sizes were 10 rats/sex/group for the low and mid-dose groups (0.25 and 1.25% w/w in the diet) and 15 rats/sex/group for the control and high-dose groups (0 and 5.0% w/w in the diet). Ten rats/sex/group were scheduled to be killed at the end of the 90-day dosing period, while 5 rats/sex/group in the control and 5.0% groups were scheduled for a 4-week recovery period after the end of dosing before being killed. Rats were individually housed under standard laboratory environmental conditions and provided with food and water ad libitum. Concentration, stability and homogeneity of the test material in the diet was confirmed. Endpoints determined during the in-life phase were survival, daily cageside clinical observations, weekly detailed in-hand clinical observations, weekly bodyweights, weekly food consumption, and quantitative water consumption in weeks 6 and 12. Ophthalmoscopic examination was conducted on all surviving rats in the week prior to their scheduled termination. Urine was collected overnight from fasted rats, and blood for haematology and clinical chemistry collected under light anaesthesia, during the week prior to their scheduled termination. Anesthetised rats were killed by exsanguination and a gross necropsy was performed. Gross necropsy was also performed on rats that did not survive to scheduled termination. Fresh weights were recorded for adrenal glands, brain, heart, kidneys, liver, lungs, gonads, pituitary gland, salivary glands (mandibular, sublingual and parotid), spleen, thymus, and thyroids including the parathyroid glands. In addition, fresh weights of prostate and seminal vesicles of males, and uterus of females, were recorded. A comprehensive list of organs and tissues were preserved in 7% buffered formalin for histopathological examination. In addition, testes were preserved in Bouin’s solution and frozen sections of heart, liver and kidney were prepared and stained with Scarlet R (a stain for fats and oils). Histopathological examination of tissue sections stained with haematoxylin and eosin (HE), and the frozen sections stained with Scarlet R, was performed for rats in the control and 5.0% (high dose) group.
There were two unscheduled deaths, those of one male in the main cohort and one female in the recovery cohort of the 5.0% group, but both were due to the blood collection procedure prior to scheduled termination and their deaths were not therefore attributable to consumption of the test material. Clinical observations during the study were limited to soft faeces in all animals in the 5.0% group. The same group exhibited significantly increased water consumption. These changes were all rapidly reversible during the recovery period. Rats in the 5.0% group also exhibited marginal decreases in body weight, which did not reach statistical significance. Group mean values for food consumption and water intake of rats of both sexes in the 5.0% group were increased, effects attributed to treatment.
Organ weights were unaffected by treatment, with the exception of group mean absolute and relative weights of seminal vesicles in the 5.0% males, which were decreased relative to those of the control males. This was considered to be an effect of treatment, although there was no associated histopathology, and was reversible, in that it was not apparent at necropsy of males in the recovery
55
cohort. Dietary exposure to L-carnitine-L-tartrate had no effect on haematology, clinical chemistry, urinary electrolytes, ophthalmologic findings, gross necropsy findings or histopathological findings. There was a slight but statistically significant decrease in group mean urinary pH, and a slight but statistically significant increase in group mean urine specific gravity in both sexes the 5.0% group. These changes disappeared during the recovery phase and were considered to be possibly test material-related, but not adverse.
Test material consumption relative to bodyweight was calculated. Daily test material consumption in the 0.25% group fell in the range 116 to 276 mg/kg bw in males and 150 to 285 mg/kg bw in females. In the 1.25% group, daily test material consumption fell in the range 637 to 1399 mg/kg bw in males and 781 to 1454 mg/kg bw in females. Mean values for test material consumption in the 0.25%, 1.25% and 5.0% groups were 179, 936 and 3934 mg/kg bw/day respectively for males, and 220, 1107 and 5042 mg/kg bw/day respectively for females.
The no-observed-adverse-effect level (NOAEL) was 5.0% w/w L-carnitine-L-tartrate in the diet, equivalent to a group mean of 3934 mg/kg bw/day for males and 5042 mg/kg bw/day for females. This NOAEL differs from that identified by the study authors because FSANZ did not consider the marginal, reversible effects noted at 5 % w/w L-carnitine-L-tartrate to be toxicologically significant.
13-week oral gavage study of L-carnitine chloride in rats (Yamate et al. 1988)
Crj:CD rats, aged between 23 and 25 days, were acclimated for 7 to 10 days prior to study start. Rats were individually housed under standard laboratory environmental conditions and provided with food and water ad libitum. Based on data from a dose-range finding study, the dose levels selected for this study were 0, 100, 450, 1500 and 5000 mg/kg bw/day. The group sizes were 15/sex/group for the 100 and 450 mg/kg bw/day groups and 25/sex/group for the control, 1500 and 5000 mg/kg bw/day groups. Recovery cohorts of 10/sex/group from the control, 1500 and 5000 mg/kg bw/day groups were assigned to a 35-day recovery period at the end of the 13 weeks of consecutive daily dosing. The test material was administered in distilled water and administered at a dose volume of 10 mL/kg bw by oral gavage.
Parameters in the in-life phase were survival, clinical observations, food consumption, water intake, and ophthalmologic findings on Day 45 and in Week 13. Urine was collected over 24 hours prior to termination for urinalysis and blood was collected for haematology and clinical chemistry from fasted, anaesthetised rats prior to termination. Rats were subject to necropsy, and fresh weights were recorded for liver, spleen, kidneys, heart, adrenal glands, thymus, pituitary gland, thyroid gland, submandibular gland, brain, caecum with contents, and gonads. A comprehensive list of tissues was preserved and processed for histopathology.
There were no deaths attributed to the test material in rats dosed with ≤ 1500 mg/kg bw/day L-carnitine chloride. However in the 5000 mg/kg bw/day group, deaths of 17/25 males and 18/25 females were attributed to adverse effects of the test material. Clinical signs of loose faeces, attributed to dosing with L-carnitine chloride were observed only in groups dosed with ≥ 1500 mg/kg bw/day. There were few other clinical signs, and none attributed to the test material, in rats dosed with ≤1500 mg/kg bw/day. Treatment had no effect on ophthalmological findings. A significant treatment-related negative effect on food consumption and bodyweight gain was observed in males assigned to the main cohort, and both males and females in the recovery cohort, in the 1500 mg/kg bw/day group. This negative effect was reversible during the recovery period. Water intake was increased during the dosing phase in both male and female rats in the 1500 mg/kg bw/day group, but this effect was reversible during the recovery phase.
Treatment-related changes in urine of males treated with 1500 mg/kg bw/day were increased specific gravity, potassium and chloride, and decreases in sodium and in pH. Females in the same dose group also showed an increase in chloride and a decrease in pH. These effects were
56

reversible during the recovery period. Rats in the 1500 mg/kg bw/day group also had significant decreases in group mean total WBC and lymphocyte count, which were reversible. Significant differences in group mean blood biochemistry values observed in females but not males were increased total protein, albumin, total cholesterol, triglycerides, creatinine and LDH in the 1500 mg/kg bw/day group, and increased phospholipids at ≥ 450 mg/kg bw/day. Both sexes in the 1500 mg/kg bw/day group had significantly decreased group mean serum sodium and chloride compared to sex-matched controls. At the end of the recovery period, group mean serum creatinine of the 1500 mg/kg bw/day females was lower than that of female controls, although LDH was higher.
Group mean absolute organ weights of treated rats generally showed no effects that could plausibly be treatment-related, with the exception of caecal weights of males treated with ≥ 450 mg/kg bw/day and females treated with 1500 mg/kg bw/day. The caecum-to-bodyweight ratios for those groups were also increased. In males but not females in the 1500 mg/kg bw/day, group mean liver and kidney weights, relative to body weights, were also significantly higher than those of controls. In the recovery cohorts, the only one of these effects that was still apparent was elevated group mean relative caecal weight in the 1500 mg/kg bw/day males.
Grossly, distension of the caecum was observed in the majority of rats of both sexes in the 1500 mg/kg bw/day group at the end of the treatment period, and this was also apparent in the one surviving male rat in the 5000 mg/kg bw/day group. There were no other treatment-related gross lesions in the rats that survived to scheduled termination, and no treatment-related histopathological findings.
The NOAEL for this study was 450 mg/kg bw/day, on the basis of the decreased food consumption and bodyweight gain observed at 1500 mg/kg bw/day.
13-week oral capsule study of L-carnitine chloride in Beagle dogs (Kikumori et al. 1988b)
The Beagles used for this study were approximately 6 months old and ranged in bodyweight from 6 to 12 kg. Dogs were individually housed under standard laboratory environmental conditions. Food and water were provided ad libitum. Of 25 dogs/sex acclimated in the laboratory, 22/sex were assigned to the study. Dose levels of L-carnitine chloride were 0, 50, 200 and 800 mg/kg bw/day. Six dogs/sex were assigned to the 0, 200 and 800 mg/kg bw/day groups, and of these dogs, 2/sex were assigned to the recovery cohort. The 50 mg/kg bw/day group comprised 4 dogs/sex and there was no recovery cohort for this group. The test material was weighed into gelatin capsules and administered daily at a rate of one capsule/day. Dogs in the control group were administered an empty gelatin capsule daily.
In-life endpoints included clinical observations, food consumption, water intake, and weekly bodyweight. Electrocardiographs were recorded pre-study, on Day 7, during Week 13 and during Week 5 of the recovery phase. Ophthalmological examinations, otological examinations, urine collection and blood collection were conducted according to the same schedule as the electrocardiography. Four dogs/sex/group were killed at the end of the dosing phase in Week 13, and the remaining dogs were killed at the end of five weeks of the recovery phase. Dogs were subject to detailed gross necropsy, and fresh organ weights were recorded for brain, pituitary gland, thyroid gland, submandibular salivary gland, thymus, heart, lungs, liver, kidneys, adrenal glands, spleen, and testes or ovaries according to sex. Tissues were preserved for routine HE histopathology from cerebrum, cerebellum, liver, kidneys, lungs, heart, spleen, pituitary gland, thyroid gland, adrenal glands, thymus, submandibular salivary gland, testes, ovaries, prostate gland, uterus, mesenteric lymph nodes, bladder, pancreas, stomach, duodenum, jejunum, ileum, caecum, colon, rectum, femoral bone marrow, parathyroid and eyeballs, including optic nerve.
There were no unscheduled deaths during the study, and treatment had no effects on food consumption, water intake, electrocardiographic findings, ophthalmologic findings, otological findings, urinalysis, haematology or serum biochemistry. Vomiting at around 30 min after dosing,
57

and diarrhoea at around 4 h after dosing, were frequently observed in the 800 mg/kg bw/day group, with no apparent sex predilection. Vomiting and less frequently diarrhoea were also observed in the control, 50 and 200 mg/kg bw/day groups, but these observations were not more common in dogs treated with ≤200 mg/kg bw/day than in controls. Females in the 800 mg/kg bw/day group showed a slightly lower group mean bodyweight gain than control females, but this did not reach statistical significance and there was no corresponding effect in males. There were no test material-related findings on gross necropsy or histopathological examination, or treatment-related effects on absolute or relative organ weights.
The authors speculated that the timing of the vomiting relative to dosing, and the frequent finding of partially dissolved capsule in the vomitus, might indicate that the test material either directly irritated the gastric mucosa, or acted rapidly on the vomiting centre in the central nervous system after absorption. The authors noted that the vomiting and diarrhoea had no effects on body condition.
On the basis of the increased incidence of vomiting and diarrhoea, both of which showed a temporal relationship to dose administration, at 800 mg/kg bw/day, the NOAEL was 200 mg/kg bw/day.
Nine-month dietary study of propionyl L-carnitine in hyperlipaemic rabbits (Spagnoli et al. 1995).
Subjects of this study were NZW rabbits that were already aged, in the range 5 to 6 years old, at study start. Rabbits were individually housed, although other environmental conditions are not specified. Both male and female rabbits were used. Prior to commencement of the study, 25 rabbits were fed a standard diet enriched with 0.2% cholesterol, while a further 10 rabbits received the standard diet without cholesterol. After one month, blood was collected and rabbits that showed no response to the cholesterol supplement were eliminated from selection for the study. The rabbits that responded were assigned to groups that did not differ with regard to age, plasma cholesterol and triglycerides, and arterial pressure. Sex distribution across the groups is not specified. Seven rabbits were assigned to the group fed the cholesterol-rich diet. A further seven were assigned to a group fed the cholesterol-rich diet and also received 100 mg/kg bw/day propionyl L-carnitine in their drinking water. Ten rabbits were assigned to a group that received the standard, unsupplemented diet but also received 100 mg/kg bw/day propionyl L-carnitine in their drinking water, and three rabbits were assigned to the final group, that received the standard unsupplemented diet and water. Food and water were provided ad libitum to all groups.
Rabbits were maintained on their respective food and water regimens for nine months. Water and food intake were measured daily, while body weights were determined monthly. Systemic arterial pressure was measured at study start and at intervals during the study. Fasted blood samples were collected at study start and at 1, 5 and 9 months for determination of plasma concentrations of carnitine, lipoproteins, cholesterol, triglycerides, phospholipids, albumin and alanine aminotransferase activity. Rabbits were killed after nine months on study. Prior to scheduled killing, three rabbits/group were injected intravenously with 30 mg/kg bw bromodeoxyuridine. All rabbits were anaesthetised, perfused with Karnovsky’s fixative, and subject to necropsy with removal and post-fixation of aortas. Aortas were processed for histopathology and transmission electron microscopy. Histopathology included morphometrical analysis to measure the extent of atherosclerotic lesions. Immunohistochemical studies of the cells of the aortic lesions were conducted using antibodies against rabbit macrophages, against smooth muscle actin, against human recombinant macrophage colony-stimulating factor (MCSF) which is antigenically related to rabbit MCSF, and against bromodeoxyuridine as a marker of proliferative activity.
Four rabbits did not survive to the end of the study, due to diseases or injuries unrelated to the treatment. There were no significant gross findings in rabbits that did survive to scheduled necropsy. Treatment had no effect on mean systolic arterial pressure. Food consumption of the cholesterol-supplemented diet was lower than that of the standard diet, but there was no difference in food consumption between the rabbits fed the cholesterol supplement and drinking plain water, and the rabbits fed the cholesterol diet and drinking propionyl L-carnitine-supplemented water. Treatments
58

had no effect on plasma albumin or ALT activity. The diet supplemented with cholesterol resulted in a significant increase in group mean plasma cholesterol, ranging from three-fold to four-fold that of rabbits on the standard diet, and propionyl L-carnitine treatment did not have a significant effect on this increase. Treatment with with cholesterol-supplemented diet also resulted in a marked increase (143%) in plasma triglycerides, compared to that of controls on the standard diet. However this effect was decreased by concurrent administration of propionyl L-carnitine, to the extent that total plasma triglyceride was lower in rabbits fed the cholesterol supplement but also given propionyl L-carnitine, than in rabbits fed the standard diet. Group mean total plasma carnitine was significantly increased by administration of propionyl L-carnitine in the water. At the end of the experiment, the group mean total plasma carnitine of the group given both cholesterol and propionyl L-carnitine was 181%, and group mean total plasma carnitine of the rabbits fed the standard diet but administered propionyl L-carnitine was 154%, that of rabbits fed cholesterol but not given propionyl L-carnitine.
The intimal surface of aortas of the rabbits not fed the cholesterol supplement were grossly free of lesions, while rabbits in both groups that had been fed the cholesterol-supplemented diet had focal raised plaques, which histologically had the features of atherosclerosis including foam cells, cholesterol clefts and smooth muscle cells. Morphometric analysis showed that the group fed the cholesterol-supplemented diet, but given plain water to drink, had a higher percentage (321%) of areas in the aorta that stained with lipid stain Sudan III than the group fed the cholesterol-supplemented diet but also given propionyl L-carnitine in water.
Results of immunohistochemistry showed that rabbits fed the cholesterol-supplemented diet, but also given propionyl L-carnitine in water, had a significantly lower percentage (72%) of macrophages, but a significantly higher (156%) percentage of smooth muscle cells. Treatment with propionyl L-carnitine was associated with significantly fewer (42%) nuclei positive for bromodeoxyuridine. Combined immunohistochemistry showed that both macrophages and smooth muscle cells labelled for bromodeoxyuridine. The majority of proliferating foam cells were labelled for MCSF and as macrophages, supporting the conclusion that they are foamy macrophages.
Under the conditions of this study, propionyl L-carnitine had anti-atherogenic potential, leading to reduction in size and thickness of atherosclerotic plaques, and a lower level of proliferative activity of both macrophages and smooth muscle cells.
Chronic studies; L-carnitine
Twelve month study of L-carnitine administered in drinking water to rats (Empl et al. 2015; Weinert et al. 2016)
The purpose of this study was to investigate whether chronic administration of L-carnitine affected the incidence of aberrant crypt foci (ACF) in the colon, and atherosclerotic lesions in the aorta, of rats. ACF are considered to be preneoplastic lesions associated with colorectal cancer.
Eighty male Fischer 344 DuCrl (F344) rats were used in this study. Rats were pair-housed in polycarbonate cages under standard laboratory environmental conditions. Rats were purchased at 5 to 6 weeks of age but because of an outbreak of sialodacryoadenitis virus during the prestudy acclimation period, the study did not commence until 5 weeks later. Rats were assigned, 20/group, to four groups. The drinking water of the control group was tap water, autoclaved to prevent microbial contamination. The other three groups received autoclaved drinking water supplemented with 1, 2 or 5 g L-carnitine per litre. The L-carnitine was Carnipure® with a purity of 99.5 to 99.9%, and the stability of L-carnitine in water for 7 days, under experimental conditions, was confirmed. Measurements during the in-life phase included bodyweights, measured weekly, and water consumption, measured twice weekly. Urine was collected from 4 rats/group in the penultimate week of study that were individually housed in metabolism cages for 24 hours. Urine was analysed for N-nitrosodimethylamine (NDMA) concentration. After 52 weeks of continuous treatment, rats were decapitated under anaesthesia with collection of blood. The gastrointestinal tract was removed
59

and preserved for examination for ACF. Fresh weights of liver, kidney and spleen were recorded, and heart, thoracic aorta and liver were preserved for histopathology.
Plasma from blood collected when the rats were killed was later analysed (Weinert et al. 2016) to assess whether L carnitine supplementation changes overall metabolism or causes the formation of previously unknown metabolites.
All rats in the 5 g/L group, and 19/20 rats in each of the other groups, survived to the scheduled end of the study. Supplementation with L-carnitine had no effect on group mean bodyweight or on the group mean values for weights of kidney, liver or spleen. The rats in the 5 g/L group had a slightly higher group mean daily water intake, approximately 4% higher than that of controls, a difference that was statistically significant. Calculated group mean intakes of L-carnitine for the 1, 2 and 5 g/L groups were 70.4, 140.8 and 351.9 mg/kg bw/day, respectively. Treatment with L-carnitine had no effect on the incidence of ACF or on the number of crypts per focus. No rats developed any neoplasms of the gastrointestinal tract. Treatment with L-carnitine also had no effect on degenerative changes in the aorta; in fact, the only rat with foci of degeneration in the aorta was in the control group, and the lesion was not an atherosclerotic one. Background lesions that were frequently found in all groups included lymphohistiocytic myocarditis, myocardial degeneration, myocardial fibrosis, suppurative necrotising hepatitis and bile duct hyperplasia, but treatment with L-carnitine had no effect on the incidence of any of these lesions. The authors noted that all these lesions are well-recognized to occur commonly in male rats of this strain.
Supplementation with L-carnitine did not affect urinary excretion of NDMA. The authors noted that there was considerable variation in urinary NDMA excretion between individual rats. L-carnitine supplementation did result in a dose-related increase in group mean plasma TMAO concentration. The group mean TMAO level of the 5 g/L group was 25.0 µM, tenfold that of the control group, which was 2.5 µM. Plasma concentrations of only 29 out of 359 metabolites measured showed statistically significant changes, and the induced changes were generally relatively small.
The chronic administration of L-carnitine to male F344 rats at doses ≤ 351.9 mg/kg bw/day did not lead to any adverse effects on the colon or the incidence of cardiovascular lesions.
Chronic studies; L-carnitine chloride
Twelve month oral gavage study of L-carnitine chloride in rats (Kudow et al. 1988b)
The subjects of this experiment were Crj:CD rats. They were purchased at 23-25 days old and acclimated for 8 days prior to study start. They were individually housed under standard laboratory environmental conditions and provided with ad libitum access to food and water. Rats, 30/sex/group, were assigned to groups with dose levels of L-carnitine chloride of 0, 100, 272, 737 and 2000 mg/kg bw/day. The solvent, and negative control material, was distilled water. Dose administration was by daily oral gavage, at a volume of 5 mL/kg. Stability of the test solutions under the conditions of study was confirmed.
The duration of the dosing period was 12 months. Parameters determined during the in-life phase included clinical observations, bodyweight, food consumption and water intake. On day 182 of the study and at the end of the study, rats were subject to ophthalmological examination and collection of urine. Prior to being killed at the end of the study, rats were deeply anaesthetised and blood was collected for haematology and biochemistry. All rats, both unscheduled deaths and those surviving to scheduled termination, were subject to detailed gross necropsy. Fresh organ weights were recorded at scheduled necropsies for liver, spleen, kidneys, heart, lungs, adrenal glands, thymus, pituitary gland, salivary glands, brain, and caecum with contents. In addition, fresh weights of testes, epididymides, and prostate gland were recorded at scheduled necropsies of males, and fresh weights of ovaries and uterus were recorded at scheduled necropsies of females. A comprehensive list of organs and tissues were preserved for histopathology from all rats, both unscheduled and
60

scheduled deaths. Histopathological examination was limited to rats in the 0, 737 and 2000 mg/kg bw/day rats, with the exception of rats in the 100 and 272 mg/kg bw/day groups that died before the completion of the scheduled in-life phase.
The unscheduled mortality rate in the 2000 mg/kg bw/day group was significantly higher than that of the control group. The rats in the 2000 mg/kg bw/day group also had increased incidence of abnormal clinical observations that included abnormal respiratory sounds, soft faeces and, in females, ‘loss of vigour’. Group mean bodyweight gain was significantly suppressed from week 25 for males, and week 21 for females, through to the end of the study. Corresponding, but not statistically significant, effects on bodyweight gain were observed in male rats dosed with 272 or 737 mg/kg bw/day and in female rats in the 737 mg/kg bw/day group. Food consumption was generally comparable between all groups, although there were a small number of weeks in which group mean food consumption was significantly decreased in male and/or female rats in the 2000 mg/kg bw/day group. Group mean water intake of male rats in the 2000 mg/kg bw/day group was significantly increased, relative to that of male controls, in most weeks, but this effect was not observed in females.
Both sexes in the 2000 mg/kg bw/day group had a significantly lower group mean terminal bodyweight than those of sex-matched controls, and the group mean absolute and relative weight of heart was significantly lower than that of sex-matched controls for both sexes. Males, but not females in the 2000 mg/kg bw/day group had decreased absolute, but not relative, liver weight. Group mean absolute, but not relative thymus weight in both sexes was decreased at 2000 mg/kg bw/day. Group mean absolute caecal weight was decreased at 2000 mg/kg bw/day in females, and in 753 and 2000 mg/kg bw/day males, with an apparent dose-response relationship. Group mean absolute prostate and epididymal weights were decreased in 2000 mg/kg bw/day males, but of these weights, only epididymal weights were also decreased relative to bodyweight. Group mean organ weights that showed a statistically significant difference to those of controls when expressed relative to bodyweight, although not in absolute terms, were limited to the 2000 mg/kg bw/day groups increased kidney, lung, adrenal, salivary gland, and brain weights in both sexes, and testes in males.
Significant increases, relative to those of controls, in group mean values for urine volume and urinary chloride concentration were found in male, but not female, rats in the 2000 mg/kg bw/day group at the week 26 urine collection. At the week 52 urine collection, the group mean urine volume in 2000 mg/kg bw/day males was significantly increased and the group mean sodium concentration was significantly decreased. In female rats in the same group, group mean sodium and potassium concentrations were significantly decreased.
The group mean percentage of segmented neutrophils was significantly increased, and the group mean percentage of lymphocytes significantly decreased, in female rats in the 2000 mg/kg bw/day. The total WBC count was lower than that of female controls, but not to a statistically significant degree. Absolute counts were not reported.
Group mean serum triglyceride was significantly decreased in 2000 mg/kg bw/day rats of both sexes in week 53. Other changes in serum biochemistry that showed a possible dose-response relationship but which were limited to only one sex were decreased group mean total protein in 2000 mg/kg bw/day males, increased group mean BUN in 2000 mg/kg bw/day males, decreased group mean creatinine in males dosed with ≥737 mg/kg bw/day, decreased group mean glucose in 2000 mg/kg bw/day females, increased group mean alkaline phosphatase in 2000 mg/kg bw/day females, and decreased free fatty acids in female rats treated with ≥737 mg/kg bw/day.
Male rats in the 2000 mg/kg bw/day group, both those that died during the study and those killed at the end of the in-life phase, showed increased incidences in gross findings of poor body condition, stained fur, congestion of liver and lungs, pulmonary emphysema, distension of stomach and caecum, and prostatic atrophy. Female rats in the same group, both those that died during the study
61

and those killed at the end, showed significant increases in incidence of gross lesions of coarse or stained fur, hepatic congestion, and reddish-brown foci in lungs and pituitary glands.
Histopathological lesions that were significantly more common in 2000 mg/kg bw/day rats than in sex-matched controls were hepatic congestion in both sexes, splenic sinus dilation in males, splenic siderosis in females, atrophy of red and white pulp of the spleen in both sexes, renal congestion in both sexes, renal tubular epithelial degeneration in males, renal interstitial lymphocyte aggregation in females, protein casts in the kidneys of both sexes, myocardial fibrosis and atrophy in males, pulmonary congestion in both sexes, smooth muscle degeneration in bronchi and pulmonary blood vessels in male rats, calcification of the pulmonary artery wall in female rats, degeneration of arteriolar smooth muscle in the gastrointestinal tract in male rats, pancreatic acinar degeneration in both sexes, epithelial degeneration in the choroid plexus in both sexes, choroid plexus congestion in females, adrenal congestion in both sexes, adrenal haemorrhage in males, pituitary haemorrhage in females, atrophy of haematopoietic bone marrow in both sexes, parathyroid main cell degeneration in males, follicle atrophy in mesenteric lymph nodes in both sexes, aggregation of foam cells in mesenteric lymph nodes of males, epidermal vacuolation in males, salivary acinar cell degeneration in both sexes, corneal epithelial degeneration in both sexes, lacrimal gland acinar cell degeneration in male rats, transitional epithelial cell hyperplasia and degeneration of arteriolar smooth muscle in urinary bladder in both sexes, foam cell aggregation in submandibular lymph nodes of males, submandibular lymph node follicle atrophy in females, and, in males, medial degeneration of testicular arteries, diminished spermatogenesis, and epithelial degeneration of the epididymides.
Interpretation of findings of neoplastic lesions is confounded by the group sizes of the study, which are smaller than is recommended for a carcinogenicity study, as well as the lack of historical control data for the laboratory, and the very small numbers of neoplastic lesions found. However the authors of the study concluded that there was no treatment-related effect on neoplasia.
The authors of the study concluded that the NOAEL identified in this study was 272 mg/kg bw/day. However, the effects at 737 mg/kg bw/day which the authors interpreted as adverse, including decreased serum creatinine in males, decreased serum free fatty acids in females, and increased caecal weight in males, are not usually interpreted as adverse. FSANZ therefore concludes that the NOAEL for this study is 737 mg/kg bw/day.
Chronic 53-week oral capsule study of L-carnitine chloride in Beagles (Kikumori et al. 1988c)
This study was conducted using Beagle dogs, 4/sex/group. Dogs were approximately 6 months old at time of arrival, and were individually housed under standard animal laboratory environmental conditions. Dose groups for this study were 0, 50, 200, 800 and 1600 mg/kg bw/day. Test material was administered in a gelatin capsule, with the amount of test material individually measured according to the dog’s bodyweight at the beginning of each week. For the 1600 mg/kg bw/day group, the daily dose was split into two separate capsules administered 4 to 6 hours apart, because prior experience had shown that a bolus dose of 1600 mg/kg bw was likely to induce vomiting. All other doses were administered as a single daily capsule. Control animals were administered an empty gelatin capsule. Assessment of general condition was made twice daily during the in-life phase, while food consumption and water intake were measured daily. Bodyweight was recorded weekly. Electrocardiographs were recorded prior to study start and during weeks 7, 13, 26 and 53. The same schedule was used for ophthalmological and ontological examinations, collection of urine and collection for blood for haematology and serum biochemistry. At the end of study week 53, all surviving dogs were exsanguinated under anaesthesia, and gross necropsies were conducted. Fresh weights of brain, pituitary gland, thyroid gland, submandibular gland, thymus, heart, lungs, liver, kidneys, adrenal grands, spleen, testes epididymis, prostate gland, ovaries, and uterus were recorded. Tissues preserved for histopathology were cerebrum, cerebellum, pituitary, thyroid gland, parathyroid gland, submandibular gland, thymus, heart, lungs, liver, kidneys, adrenal glands, spleen, pancreas, stomach, duodenum, jejunum, ileum, caecum, colon, rectum, testes, epididymides, prostate, ovaries, uterus, mesenteric lymph nodes, femoral bone marrow, eyeballs, urinary bladder
62

and skeletal muscle.
All dogs survived to scheduled termination and, although males in the 1600 mg/kg bw/day group showed a slight decrease in group mean food consumption from around Week 28, there was no loss of condition in any dogs. There were no treatment-related effects on electrocardiographic findings, ophthalmologic findings, or otological findings. The most common clinical observations related to the gastrointestinal tract. Diarrhoea was common in all dogs in the 1600 mg/kg bw/day group and in three of each sex in the 800 mg/kg bw/day group. Diarrhoea in these groups tended to worsen over the course of the study, with diarrhoea becoming watery by late in the study. Diarrhoea occurred sporadically in dogs in the 50 and 200 mg/kg bw/day groups, but was not more frequent than in the control dogs. Vomiting was observed in all groups but was most frequent in dogs dosed with ≥800 mg/kg bw/day. Vomiting most commonly occurred within 30 minutes of dose administration. Vomiting in dogs treated with ≤200 mg/kg bw/day was not more common than in control dogs. The gastrointestinal clinical signs notwithstanding, male dogs treated with ≥800 mg/kg bw/day showed greater bodyweight gain over the course of the study than controls. Females in the 1600 mg/kg bw/day group showed lower weight gain than female controls in the first 7 or 8 weeks on study, but then caught up with female controls. By the end of the study, these females had a higher group mean bodyweight than control females. There were no variations in organ weights that showed any dose-response relationship.
Male dogs in the 1600 mg/kg bw/day group, and females in the 800 and 1600 mg/kg bw/day groups, showed slight increases in water intake throughout the study, when compared to sex-matched controls, and there was an associated increase in group mean urine volume in these groups. Dogs of both sexes dosed with ≥800 mg/kg bw/day tended to have more acidic urine than dogs in lower dose groups or control groups. Treatment had no apparent effects in urine sediment findings.
There were no differences in group mean haematology data of treated dogs, relative to sex-matched controls, that could be attributed to treatment. The few statistically significant differences found, fell within the physiologically normal range. Group mean total serum cholesterol was increased to a statistically significant extent, and showed an apparent dose-response relationship, in male dogs treated with ≥800 mg/kg bw/day, when compared to male controls. However the levels of total serum cholesterol found were not considered to be adverse by the authors, and FSANZ concurs with this assessment.
Gross necropsy findings that were interpreted as treatment-related were linear ‘erosion-like changes’ and hyperaemia of the cardia or fundus of the stomach, present in most or all dogs of both sexes in the 1600 mg/kg bw/day group, and females in the 800 mg/kg bw/day group. Histological findings that correlated to the gross lesions were oedema and, in some 1600 mg/kg bw/day dogs, localized mucosal necrosis in the stomach. Other histopathological lesions showed no clear dose-response relationship and were considered to be incidental.
On the basis of adverse effects on the gastrointestinal tract at ≥800 mg/kg bw/day, the NOAEL was identified as 200 mg/kg bw/day.
Reproductive and Developmental Toxicity Studies; L-carnitine
Reproductive study of L-carnitine in the diet of rats (Brandsch and Eder 2003)
Female Sprague Dawley rats, approximately 4 weeks of age, were assigned to two groups, a control group and a treatment group, comprising 15 rats each. Rats were individually housed under standard laboratory husbandry conditions. All the rats were fed a standard diet containing a base level of L-carnitine of 1.4 mg/kg diet throughout the study, but for the rats in the treatment group, this diet was supplemented with 1 g/kg diet of L-carnitine throughout the study. The total concentration of L-carnitine in the diet was confirmed by analysis. The amount of diet provided was controlled, and increased with growth of the rats from 4 to 12 weeks. At 12 weeks of age, the rats were paired for 6
63
days with adult male Sprague Dawley rats, and food was provided ad libitum. After the mating period, female rats were provided with 18 g of the diet/day through pregnancy, but ad libitum access to the diet during lactation. Pups were weaned at 21 days and dams placed on 20 g/day of their assigned diet for 3 weeks, after which they went through two more cycles of mating and pregnancy as before, with a 3-week interval between weaning and subsequent pregnancy. Feeding regimens were similar to those of the first mating, pregnancy and lactation, with the exception that diet was limited to 75 g/day during the second and third lactations rather than being ad libitum.
Twelve pups/group from the second pregnancy with an average bodyweight of 60±5 g, and 10 pups/group from the third pregnancy with an average bodyweight of 55±9 g, were selected at weaning so that there were no littermates, for a study of post-weaning growth rate of pups. The pups were maintained on commercial rat chow for a week and then fed measured amounts of the commercial rat chow for 6 weeks.
Endpoints determined in the study were bodyweight changes of dams, food intake of dams, number of pregnancies, number of liveborn pups, number of stillborn pups, weights of pups and litters at birth and days 4, 8, 12, 16 and 20 of lactation, and bodyweight changes of weaned pups from 4 to 10 weeks of age.
Mean diet intake of dams during growth and pregnancy was standardised by the limited amount of diet offered, but during the first lactation, group mean food intake by the control dams was significantly greater than that of the supplemented group, a finding attributed to a larger number of pups raised by the control females. It was for this reason that access to the diet was controlled in subsequent lactations. Group mean bodyweight changes of supplemented dams were comparable to those of control dams throughout the study. The pregnancy rates of the control dams were 87, 92 and 100% of mated rats in the three successive pregnancies, while those of the supplemented dams were 100, 80 and 75%. L-carnitine supplementation had no effect on the total number of rat pups born, or the liveborn/stillborn ratio. Weights of individual pups and of litters at birth, and the mortality rate between birth and weaning were unaffected by maternal L-carnitine supplementation. Under conditions of restricted feed access by lactating dams, L-carnitine supplementation did not affect bodyweight or litter weight of pups during lactation. Postweaning bodyweight gain was greater for pups from the second pregnancies of supplemented dams than for control pups from second pregnancies, but this difference was not apparent in pups from third pregnancies and the finding was therefore considered to be due to chance.
There was a statistically significant, massive loss of pups between birth and weaning during the third lactation, but this affected both control and supplemented groups, and was attributed to the restricted feeding of the dams during the second and third pregnancies and lactations.
It was concluded that the rats showed no changes in reproductive performance attributable to supplementation with L-carnitine throughout gestation and lactation.
Lactation study of oral L-carnitine supplementations in sows (Ramanau et al. 2005)
Crossbred gilts in their third reproductive cycle were assigned to two groups of 12 pigs each. They were artificially inseminated and 10 pigs in each group conceived. Those that failed to conceive were removed from the experiment. The pigs were fed one basal diet throughout pregnancy and lactation. The diet was restricted to 3.0 kg/day until day 30 of pregnancy and provided ad libitum from day 30 to 110 of pregnancy. From day 110 to farrowing, pigs were provided with 2.5 kg/day of the diet, decreased to 1.5 kg on the day of farrowing. After farrowing the amount of diet provided was progressively increased through 3 kg/day on days 1 and 2 of lactation, 4.5 kg on days 3 and 4 of lactation, and ad libitum from day 5 of lactation to weaning. Water was provided ad libitum by nipple drinker throughout. The pregnant pigs were individually housed until day 30 of pregnancy, and then group-housed in pens with electronic feeding stations that monitored the feed intake of individual sows. Pigs were transferred to individual farrowing pens on day 110 of pregnancy. Piglets
64

were weaned on day 30. Environmental conditions of housing during the experiment were controlled, and standard for indoor pig husbandry.
Pigs in the treatment group were supplemented by hand with tablets containing L-carnitine, to provide L-carnitine at a rate of 125 mg/day through pregnancy and 250 mg/day through lactation. Pigs in the control group were provided by hand with placebo tablets that did not contain L-carnitine but were otherwise of identical composition.
Endpoints measured in the study were bodyweights and bodyweight changes of dams, backfat thickness as measured by ultrasound, total number of piglets born, number of liveborn piglets, number of stillborn piglets, total litter weight at birth, individual birthweights of piglets, individual weaning weights of piglets, and plasma L-carnitine concentration of dams on day 95 of pregnancy and on day 21 of lactation. In addition, the litters of eight of the ten dams in each group were standardised to 10 piglets/litter within two days of farrowing, so that the mean piglet weight was similar across the litters, and milk output of those dams was measured on days 11 and 18 of lactation by weighing piglets before and after feeding following a period of enforced fasting. After milk output was determined by this method, dams were injected with oxytocin to stimulate milk let-down, and milk samples were collected by hand for analysis of lactose, protein, milkfat and calculation of total energy content. L-carnitine concentration in milk was also determined.
Supplementation with L-carnitine had no effect on feed intake during pregnancy or lactation, or on bodyweights of dams at mating, after farrowing or at weaning. Weight loss due to lactation was similar in both groups of dams, and backfat thickness of dams at mating and on the day after farrowing was likewise not affected by supplementation. However backfat thickness of supplemented dams was significantly less than that of control dams at weaning. Supplementation of dams with L-carnitine had no effect of number of piglets born or on the live:dead ratio of piglets at delivery. Birthweights of individual piglets and total litter weight at birth was likewise unaffected. In the litters with standardised numbers of piglets, piglets suckling supplemented dams gained significantly more weight than those on control dams. This finding is consistent with the finding that sows supplemented with L-carnitine produced 18% more milk than control sows. Analysis of milk collected on day 11 of lactation did not show any effects of supplementation on lactose, protein, milkfat or total energy content. Milk collected from supplemented sows on day 18 contained higher levels of lactose, protein, milkfat and total energy than milk collected on the same day from control sows, but the differences were not statistically significant. Supplementation led to significantly increased plasma L-carnitine on day 95 of pregnancy and day 21 of lactation, and in milk. Based on calculation of energy balance of the sows, it was determined that sows supplemented with L-carnitine had a higher energy requirement for lactation and a higher total energy requirement. It was concluded that dietary L-carnitine could help sows maintain a high milk yield, resulting in fast growth of their piglets.
This study was not intended to be a reproductive or developmental toxicity study, and measured only some of the endpoints usually included in such a study. However, results relevant to the assessment of reproductive and developmental toxicity showed that supplementation with L-carnitine at a rate of 125 mg/day through pregnancy and 250 mg/day through lactation had no adverse effects on conception rate, the number of piglets born, the live:dead ratio at birth, birthweights of piglets, or piglet growth and development to weaning.
65

Reproductive and Developmental Toxicity Studies; L-carnitine chloride
Reproductive study of L-carnitine chloride by oral gavage in rats (Itabashi et al. 1988a)
Crj:CD rats were purchased at 5 weeks of age and acclimated to standard laboratory environmental conditions for one week before being assigned to study. Rats were individually housed and provided with food and water ad libitum. Rats, 25/sex/group, were assigned to dose groups of 0, 100, 520 or 2700 mg/kg bw/day. The test material was dissolved in distilled water and administered by oral gavage at a dose volume of 10 mL/kg bw. Male rats were gavaged daily from the age of 42 days, for a total of 9 weeks prior to mating. Females were gavaged daily from 57 days of age for a total of 2 weeks prior to mating. Rats of both sexes were dosed daily during the 3-week cohabitation period for mating. After copulation was confirmed by vaginal smear or vaginal plug, dosing of the females continued through to gestation day (GD) 7.
Male rats were subject to daily clinical observations, twice-weekly body weight determination, and weekly measurement of food consumption and water intake. Female rats were also subject to daily clinical observations. Bodyweights of females were recorded weekly prior to the start of dosing, daily during the dosing period, and on GDs 11, 14, 17 and 20. Food and water intake of females were recorded weekly prior to conception, daily on GDs 1 through 7, and also on GDs 11, 14, 17 and 20. On GD 20, females were anaesthetised, exsanguinated and dissected for recording of numbers of corpora lutea, implantations, dead embryos and fetuses, and live fetuses. Females that were not pregnant 20 days after copulation were killed on that day and their reproductive tracts were examined microscopically for abnormalities. Fetuses that were alive on GD 20 were weighed with their placentas, examined and sexed. Fetuses were preserved as appropriate for internal examination or skeletal examination.
Abnormal clinical observations in the males were limited to the 2700 mg/kg bw/day group and included soft faeces, transient dyspnoea and some chromodacryorrhea. Group mean bodyweight of males in the 2700 mg/kg bw/day group was significantly lower than that of control males from day 3 of dosing, but group mean food consumption was only decreased on days 7, 14, 21 and 56 of treatment. Group mean food consumption was also decreased for 520 mg/kg bw/day males on days 14 and 21. Group mean water intake of the 2700 mg/kg bw/day males was significantly higher than that of the control group throughout the dosing period. Dosing with L-carnitine chloride had no effect on copulation index or fertility index of males. It is unclear from the translated paper when the males were killed and necropsied, but organ weight data show that testicular weight, relative to bodyweight was significantly increased in 2700 mg/kg bw/day males compared to control males, although absolute testicular weight was not increased.
Abnormal clinical observations in the female rats were also confined to the 2700 mg/kg bw/day group and were those of soft faeces during the dosing period. There were no significant differences in group mean bodyweight between treated female rats and control females, prior to mating or during pregnancy. The group mean food consumption of females dosed with ≥ 520 mg/kg bw/day was decreased, relative to that of female controls, on day 14 of dosing but a clear dose-response relationship was not evident. Group mean water intake of females in the 2700 mg/kg bw/day group was significantly increased, relative to that of controls, on day 7 and 14 of dosing. During pregnancy, group mean food consumption of all treated females was similar to that of female controls, but females in the 2700 mg/kg bw/day group had significantly higher group mean water intake on GDs 1 through 7 inclusive. Treatment with L-carnitine chloride had no effect on duration of oestrus or copulation index, and the group mean fertility index was slightly higher in treated females than controls, although there was no dose-response relationship. No significant treatment-related effects were evident in number of corpora lutea, number of implantations, number of dead embryos or fetuses, number or sex ratio of live fetuses, bodyweights of live fetuses, placental weights of fetuses, abnormalities on external examination of fetuses, abnormalities on internal examination of fetuses, or skeletal abnormalities of fetuses.
66

On the basis of adverse effects on clinical observations in both sexes in the parent generation, and adverse effects on bodyweights of males in the parent generation, in the 2700 mg/kg bw/day group, the NOAEL identified in this study for the parent generation was 520 mg/kg bw/day. The NOAEL for reproductive performance of the parent generation, and for fetal development, was 2700 mg/kg bw/day, the highest dose tested.
Perinatal and lactational study of L-carnitine chloride by oral gavage in rats (Itabashi et al. 1988b)
Crj:CD rats were purchased and acclimated to laboratory conditions for one week prior to the start of this study. At study start, males in the P generation were 11 weeks old and females were 9 weeks old. Rats were individually housed from mating. Food and water were provided ad libitum, and environmental conditions were standard for laboratory animal housing. Based on previous studies, the dose levels were 0,100, 548 and 3000 mg/kg bw/day. The solvent and negative control material was distilled water. There were 25 female rats assigned to each group, although one female in the control group turned out not to be pregnant. The dose formulations were administered to the P generation female rats by oral gavage, at a volume of 10 mL/kg bw, every day from GD 17 to PND 21. Four days after birth the pups were rearranged into litters of 8 pups each.
Endpoints measured in the P generation rats were survival, clinical observations with particular attention to nursing behaviour, body weights, food consumption, water intake, gross findings at necropsy on PND 22, and number of implantation sites. Endpoints measured in the pups (F1 generation) 24 hours after birth were live/dead ratio, bodyweight, sex, and external examination. Subsequent endpoints were development, bodyweights and bodyweight gain. One pup of each sex from each litter was subject to testing of reflexes. Pups from each sex and litter were assigned to open field test at 5 weeks of age, or Biel water-maze test at 6 weeks of age, or necropsy at 7 weeks of age, or necropsy at 10 weeks of age. When pups were 10 weeks of age, one male and one female were selected from each litter and paired with another rat, not a sibling, from the same dose group. Endpoints measured in the pregnant F1 females were bodyweights, food consumption and water intake. On GD20, the F1 females were exsanguinated under anaesthesia and necropsied to determine number of corpora lutea, number of implantations, number of dead embryos and fetuses, and number of live fetuses. Viable fetuses and placentas were weighted, foetuses were sexed and examined for external abnormalities, and they were then preserved for either internal examination or skeletal examination. All male rats used for breeding were killed at the end of the pairing period and weights of testes, epididymides, and prostate were recorded.
All P generation females survived their pregnancies and lactations, and no treatment-related clinical abnormalities were observed. There were no apparent treatment-related effects on food consumption during pregnancy. Compared to control females, females in the 3000 mg/kg bw/day group had significantly elevated group mean water intake from GD 18-21. Females in the 548 mg/kg bw/day group also showed a transient increase in water consumption on GDs 18 and 19, but not on subsequent days. There were no treatment-related effects on pregnancy duration, number of implantations on PND 22, or number of pups alive 24 hours after birth. P generation dams in the 3000 mg/kg bw/day group had a significantly higher group mean food consumption on PNDs 1 and 2 than control dams, but not on subsequent days during lactation. However, group mean water consumption of the 3000 mg/kg bw/day dams was significantly higher than that of control dams throughout lactation. Treatment had no effect on viability index ((litter size on PND 4/litter size at birth) x 100) or lactation index ((litter size on PND 21/litter size after culling on PND 4) x 100). Group mean bodyweight of male F1 pups in the 3000 mg/kg bw/day group was minimally, but statistically significantly, lower than that of control males on PNDs 14 and 21 (95% and 94% respectively). Group mean bodyweight of female F1 in the 3000 mg/kg bw/day group was minimally, but statistically significantly, lower than that of control females on PND 21 (94%). Group mean bodyweights of F1 males from treated dams were comparable to those of control F1 males after weaning, but group mean bodyweights of females from dams dosed with ≥548 mg/kg bw/day were consistently significantly lower than those of control females from PND 28 through to 70 inclusive. However, there was a lack of a dose-response relationship between group mean bodyweights of F1
67

females in the 548 mg/kg bw/day group and those of F1 females in the 3000 mg/kg bw/day group, because the group mean bodyweights of the 548 mg/kg bw/day group ranged from 91% to 94% those of female controls, whereas the group mean bodyweights of the 3000 mg/kg bw/day group ranged from 93% to 95%.
Treatment had no effects on developmental milestones in F1 pups including pinna detachment, hair growth, opening of the external ear canal, incisor eruption, eye opening, descent of testes, opening of the vagina, or completion of penile development. Treatment also had no effect on behavioural developmental milestones including righting reflex on PND 2, gait on paws on PND 13, auricle reflex on PND 18, visual test on PND 21, pain response on PND 21 or pupillary reflex on PND 21. In an assessment of open-field activity, no consistent statistically significant differences were found between pups from treated dams, and those from controls. Fertility index of F1 rats was not affected by treatment, and there were no significant treatment-related differences found at necropsy on GD 20 in numbers of corpora lutea, number of implantations, numbers of dead or viable fetuses, pup weights, placental weights or sex ratios. External, internal and skeletal examinations of fetuses collected on GD 20 showed no treatment-related effects.
In F1 male pups necropsied at 7 weeks of age, absolute group mean weights of liver, spleen, adrenal glands, pituitary gland, submaxillary gland, and testes were significantly lower in pups in the 3000 mg/kg bw/day group when compared to those of male controls, but the differences disappeared when expressed relative to bodyweight, and no corresponding differences in group mean weights of liver, spleen, adrenal gland, pituitary gland or submaxillary gland were found in females in the same group. In F1 male pups necropsied at 10 weeks of age, only group mean testis weight, absolute and relative to bodyweight, in the 3000 mg/kg bw/day group was significantly lower than that of male controls. At 10 weeks of age, absolute group mean liver weight was significantly lower than that of female controls in females from dams dosed with ≥ 548 mg/kg bw/day, but the difference was not observed in males and not evident in the 3000 mg/kg bw/day group when organ weight was expressed relative to bodyweight. Absolute group mean brain weight was also lower in females from dams dosed with ≥ 548 mg/kg bw/day but again, the difference was not present in males and not found in the 3000 mg/kg bw/day group when organ weight was expressed relative to bodyweight. Other absolute group mean organ weights that were significantly lower in 3000 mg/kg bw/day females than in control females were pituitary gland and submaxillary gland, but these differences were not evident when organ weights were expressed relative to bodyweight.
No treatment-related effects were found on necropsies of male rats of either the P of F1 generation that had been used for breeding. In P generation females killed on PND 22, the group mean absolute and relative liver weights of 3000 mg/kg bw/day females were significantly elevated compared to those of control females.
The authors of the study identified a NOAEL for dams of 100 mg/kg bw/day, based on increased water intake during pregnancy in P generation females dosed with ≥ 548 mg/kg bw/day. The NOAEL for growth and development of pups was identified as 100 mg/kg bw/day on the basis of decreased bodyweight gain in F1 females in the 548 and 3000 mg/kg bw/day groups. FSANZ disagrees with both these NOAELS. The increased water intake during pregnancy was not associated with any internal lesions or detrimental clinical signs, and is considered to be an adaptive, homeostatic response, probably reflecting the increased chloride intake. The decreased bodyweight gain in F1 females lacked a dose-response relationship, and furthermore there was considerable overlap in standard deviations between the control females and the treated females. In the absence of histological correlates, the increased absolute and relative liver weights of the 3000 mg/kg bw/day P generation females is also considered to be non-adverse, and FSANZ therefore considers the maternal NOAEL in this study to be 3000 mg/kg bw/day. FSANZ considers that the NOAEL for growth and development of pups is 548 mg/kg bw/day, based on lower group mean absolute and relative testis weights at 10 weeks of age, compared to those of male controls.
68

Multigeneration reproductive and teratogenicity study of L-carnitine chloride by oral gavage in rats (Nakamura et al. 1988)
Crj:CD rats were purchased at 9 weeks old and acclimated for a week prior to being paired one-to-one by sex for one night. Females that had vaginal plugs the next day were considered to be dams on GD 0, and were assigned to groups to be dosed with L-carnitine chloride at doses of 0, 100, 447.7 or 3000 mg/kg bw/day. The high dose was selected on the basis of earlier studies that indicated that slight maternal toxicity could be expected at this dose. Each group included 21-24 dams to be killed prior to parturition, and 12 dams that would be allowed to give birth. Dams were maintained under standard laboratory environmental conditions and provided with food and water ad libitum. They were group-housed to GD 20, after which they were individually housed. Test material was administered as a solution in water by oral gavage once daily from GD 7 to GD 17 inclusive. The dose volume was 10 mL/kg bw.
Dam bodyweights were recorded on GDs 0, 4, 7-20, and, in dams allowed to give birth, on postnatal days (PNDs) 0, 4, 7, 11, 14, 17 and 21. Food and water consumption were recorded on GDs 4, 8, 11, 14, 17 and 20, and PNDs 1, 4, 7, 11, 14, 17 and 21.
Dams killed prior to parturition were subject to Caesarean section and necropsy on GD 20. At Caesarean section, the numbers of corpora lutea, implantation sites, live fetuses, dead fetuses and partial resorptions were recorded. Placentas of live fetuses were weighed. Surviving pups were sexed, weighed and examined for external abnormalities. Half were preserved and processed for internal examination and half were preserved and processed for skeletal examination.
The remaining dams in each group were allowed to give birth spontaneously, and maintained to PND 21, the day of weaning. The length of gestation was recorded, as were the live birth index, and the numbers and live:dead ratio of pups. Pups were sexed, weighed and examined for external abnormalities. The number of surviving pups was recorded daily until PND 21 for each litter. Other endpoints measured in live pups were pinna detachment, appearance of abdominal hair, eruption of incisors, separation of eyelids, descent of testes, and vaginal opening. Pups were redistributed on PND 4, after weighing, to standardise litter sizes to approximately 4/sex/dam. Surplus pups were killed and necropsied, with recording of fresh weights of heart, lung, liver, kidneys, and spleen. On PND 21, three pups/sex/litter were weaned and maintained alive, while the rest of the pups were killed and necropsied, with fresh weights of brain, heart, lungs, liver, kidneys, adrenal glands, spleen and gonads recorded. Pups killed at PND 21 were also processed for examination of the skeleton. Surviving pups were weighed on PNDs 0, 4, 7, 11, 14, 17, 21, 28, 35, 42, 49, 56, 63 and 70.
Pups maintained beyond weaning were subject to functional and behavioural assessments including testing of reflexes, wheel cage performance at weaning, inclined screen test at weaning, rotarod performance at weaning, open field test at 8 weeks of age, water T-maze test at 9 weeks of age, conditioned avoidance response at 10 weeks age. After 10 weeks, surviving pups were paired with a pup of the opposite sex from the same maternal dose group. Days to copulation, copulation index and pregnancy index were calculated. Dams of the F1 generation were weighed on GDs 0, 4, 7, 11, 14, 17, and 20. All F1 dams were allowed to give birth naturally and their pups were subject to the same observations to GD 4, when the F1 dams and F2 pups were killed. Dams were subject to necropsy. Half the pups were processed for internal examination and half for skeletal examination.
Males used for assessment of reproductive capability were killed and necropsied at the end of the mating period. Females that did not conceive were killed and necropsied on Day 24 after the end of the mating period, and their uteri and ovaries were weighed and processed for histopathology.
69
There were no test material-related deaths in the P generation. Among dams in the 3000 mg/kg bw/day group, there were low incidences of clinical observations possibly attributable to treatment, including hypersalivation, loose stools and soiling of abdominal hair. Relative to the control P dams, the P dams in the 3000 mg/kg bw/day group had significantly lower bodyweight gain during pregnancy, with a compensatory increase in bodyweight gain during lactation. Group mean food consumption of the 3000 mg/kg bw/day dams was significantly decreased on GD 8, the day after dosing commenced, but this effect was not apparent on subsequent measurements of food consumption during pregnancy. Group mean water intake in the same group, on the other hand, was significantly elevated relative to that of controls on GDs 8, 1, 14, and 17, the four days when water intake was measured during the dosing period. The 3000 mg/kg bw/day dams had significantly higher food consumption than controls on two of the days during lactation when food consumption was measured. Water intake during lactation showed no significant differences between treated dams and controls.
Among dams killed on GD 20, there were no significant differences between treated P dams and controls in numbers of corpora lutea, number of implantations, prenatal deaths, numbers or sex ratios of live pups, pup weights, placental weights or incidence of external abnormalities of pups. The number of ossified metacarpal bones was increased in pups in the 3000 mg/kg bw/day group, but this was considered to be an incidental finding. The group mean lung weight of 3000 mg/kg bw/day dams killed on GD 20 was significantly higher than that of controls, and this was attributed by the authors of the study to treatment, but was not associated with any microscopic lesions. It was noted that if the change was treatment-related, it was reversible, in that it was not evident in dams killed at the time of weaning.
Among P generation dams allowed to give birth, there was no significant differences between treated rats and controls in delivery index, period of gestation, number of implantations, incidence of stillbirth, number of liveborn pups, sex ratio of pups, live birth index, bodyweights of pups by sex, viability index at PND 4, weaning index at PND 21, or survival index at PND 70. No pups had external abnormalities. Dosing of dams had no effect on developmental milestones of pinna detachment, appearance of abdominal hair, incisor eruption, eyelid separation, testis descent or vaginal opening. In functional and behavioural assessments of F1 rats, on the water T-maze test, there was a significant increase in the error rate and swimming time of 3000 mg/kg bw/day female pups on the 8th day of testing. These findings were attributed by the authors to the test material.
There were no treatment-related effects on copulation index or pregnancy index of F1 rats, or on number of implantations, number of stillborn pups, number of liveborn pups, sex ratio of offspring, incidence of external abnormalities, PND 4 viability, or bodyweights of F2 pups at birth or on PND 4. Group mean gestation length was marginally increased for the 3000 mg/kg bw/day group, relative to the control group, but remained within the normal range.
FSANZ concurs with the authors that the NOAEL for maternal toxicity was 547.7 mg/kg bw/day, on the basis of mild clinical signs and depressed bodyweight during pregnancy, and that the NOAEL for reproductive toxicity in the P and F1 generation was 3000 mg/kg bw/day, the highest dose tested. The authors concluded the NOAEL for development and behaviour of F1 pups was 100 mg/kg bw/day, on the basis of slightly poorer performance on water T-maze trial two of twelve trials, although on one of those two trials, the group mean performance 547.7 mg/kg bw/day group was worse than that of the 3000 mg/kg bw/day group. Furthermore, although individual data are not available, the standard deviations for group mean performance on this trial by 3000 mg/kg bw/day females are very large, suggesting poor performance by one or two individuals may have skewed the results. Therefore FSANZ does not agree with the authors, but considers the NOAEL for development and behaviour of the F1 pups to be a maternal dose of 3000 mg/kg bw/day.
70
Teratogenicity study of oral L-carnitine chloride in rabbits (Toteno et al. 1988)
Male Japanese white rabbits were approximately six months old at time of purchase, and females were approximately five months old. Rabbits were acclimated to laboratory conditions for approximately four weeks prior to study start. They were individually housed and environmental conditions were standard for husbandry of laboratory rabbits. Food and water and provided ad libitum. Based on previous studies, the dose levels selected were 0, 100, 316 and 1000 mg/kg bw/day. Fourteen female rabbits were assigned to each group, with the exception of the 100 mg/kg bw/day group in which there were 13 female rabbits. The test material was administered as a solution in distilled water, at a dose volume of 10 mL/kg, daily from GD 6 through to 18 inclusive. Dose formulations were based on daily bodyweights. Rabbits were observed daily, and food consumption and water intake were recorded. Rabbits were killed on GD 29 and necropsied. Numbers of corpora lutea, number of implantations, number of dead and resorbed fetuses, and the number of viable fetuses were recorded. Viable fetuses were weighed and examined for external or oral abnormalities, and their placentas were weighed. They were then necropsied for sex determination and examination for internal abnormalities. Hearts and major vessels were fixed and examined microscopically for abnormalities. Skeletons were processed for examination for deformities, variations and assessment of ossification.
All the dams survived to scheduled termination. Twelve of the 14 dams in the 1000 mg/kg bw/day group developed soft or diarrhetic faeces during the dosing period, and two also exhibited transient depression of pinna temperature. Two rabbits, one in the 100 mg/kg bw/day group and one in the 316 mg/kg bw/day group, lost their pregnancies after suffering dosing accidents that caused thoracic empyaema. One other dam in the 316 mg/kg bw/day group, aborted because all the fetuses had died in utero, an outcome that was not considered to be due to the test material because it affected only one individual. There were no statistically significant differences in group mean food consumption between the treated dams and the controls. All groups showed a decline in food consumption during the dosing period, with a compensatory increase in food consumption after the dosing period ended on GD 18. Group mean water intake was also decreased in all groups during the dosing period, and the difference in group mean water intake was significant between the 1000 mg/kg bw/day group and the control group on GDs 7 and 9. Group mean bodyweight gain was somewhat depressed in the 1000 mg/kg bw/day group, when compared to the control group, between GDs 7 and 10, but this difference was not statistically significant. The only significant finding in dams at scheduled necropsy was a decrease in the number of surviving female fetuses, and an increase in the number of surviving male fetuses in the 1000 mg/kg bw/day group, compared to the control group. There were no significant differences in group mean values for numbers of corpora lutea , number of implantations, plantation index, total number of viable fetuses, number of dead and resorbed fetuses, fetal viability index, fetal weight, placental weight, or fetuses of bodyweight less than 70% of the mean fetal weight for the control group. There were no treatment-related external abnormalities, internal abnormalities, skeletal abnormalities or differences in progress of ossification.
FSANZ concurs with the authors’ conclusion that, on the basis of clinical signs of diarrhoea, decreased food consumption and bodyweight gain, and decreased water intake, the NOAEL for the dams was 316 mg/kg bw/day, and that the NOAEL for fetuses was the maternal dose of 1000 mg/kg bw/day.
Carcinogenicity studies
No in vivo carcinogenicity studies were submitted with the application or identified in the literature. Carcinogenicity studies are not considered to be necessary for the hazard assessment of L-carnitine because results of genotoxicity assays are negative, and there is no evidence of proliferative or preneoplastic lesions in the subchronic or chronic studies summarized above.
71
Genotoxicity studies; L-carnitine
Reverse mutation assay (Ames test) of L-carnitine (SafePharm Laboratories 0102/0584, 2008)
This study was conducted in compliance with OECD Guideline No. 471, as well as USA, EPA (TSCA) OPPTS harmonised guidelines.
The test material was identified as LZ1000, with a stated purity of 99.6%. According to the applicant, LZ1000 is L-carnitine. The solvent for LZ1000 was sterile distilled water. The tester strains of bacteria were Salmonella typhimurium TA 1537, TA98, TA100, TA1535, and Escherichia coli WP2uvrA-pKM101. Vehicle (solvent) control assays and positive control assays were run in parallel with assays of the test material. The positive control material for assays using TA100, TA1535 or WP2uvrA-pKM101 in the absence of S9 fraction was N-ethyl-N’-nitro-N-nitrosoguanidine. The positive control material for the assay using TA1537 without addition of S9 fraction was 9-aminoacridine, while 4-nitroquinoline-1-oxide was the positive control material for the assay using TA98 in the absence of S9 fraction. For assays including S9 fraction, the positive control material was 2-aminoanthracene for assays using TA100, TA1535, TA1537 and WP2uvrA-pKM101, and benzo(a)pyrene for the assay using TA98.
In order to select appropriate dose levels for the main test, preliminary tests were carried out at test material concentrations of 0, 0.15, 0.5, 1.5, 5, 15, 50, 150, 500, 1500 and 5000 µg test material/plate. The test material caused no visible reduction in the growth of the background bacterial lawn at any concentration, and no test material precipitate was observed in any plate, and therefore the test material concentrations selected for the main test were 50, 150, 500, 1500 and 5000 µg/plate for all tester strains.
The plate incorporation method was used for both the preliminary tests and the main tests. All assays were performed in triplicate. The incubation conditions for all assays were approximately 48 hours at 37ºC. The main test was conducted twice, using fresh bacterial cultures, test material and control solutions for the second test.
Counts of revertant colonies in all vehicle control plates were within the normal historical control range, while all positive control chemicals induced marked increases in the frequency of revertant colonies. Thus, the sensitivity of the assay and the efficacy of the S9 mix were confirmed. The test material did not cause any significant increase in the frequency of revertant colonies of any bacterial strain, with or without metabolic activation with S9 mix. It was concluded that the test material was not mutagenic under the conditions of the study.
Chromosome aberration test of L-carnitine in human lymphocytes in vitro (Harlan Laboratories 1208500, 2008b)
This GLP-compliant study was conducted using LZ1000, with a purity of approximately 99%, as the test material. According to the applicant, LZ1000 is L-carnitine. The solvent for LZ1000 was deionised water. The study was conducted in vitro using human peripheral lymphocytes collected from healthy donors and stimulated to undergo mitosis by phytohaemagglutinin. The solvent (deionised water) was used for negative control assays. The positive control materials were ethyl methanesulfonate for assays in the absence of metabolic activation by S9 fraction, and cyclophosphamide in the presence of metabolic activation by S9 fraction.
A preliminary dose-range finding study was performed in duplicate using 10 concentrations of the test article at concentrations of between 10.5 and 1620 µg/mL, with and without S9 fraction. The exposure period was 4 hours, followed by 18 hour incubation for total preparation time of 22 hours. No cytogenic effects were noted up to and including the highest concentration used, and the doses selected for the main test were the three highest doses from the dose-rangefinder; 529.0, 925.7 and 1620.0 µg/mL LZ1000.
72

For the main study, two experiments were conducted without S9 fraction and two were conducted with S9 fraction. Of the two experiments conducted without S9 fraction, the exposure period for one was 4 hours, followed by removal of the test article and a further 18 hours incubation, while for the other experiment, exposure to the test article continued for the full 22 hours incubation. For the two experiments conducted with addition of S9 fraction, exposure to the test article was throughout the 22 hour incubation. All assays were conducted in duplicate, with concurrent negative and positive control assays. All cultures were incubated at 37º C in a humidified atmosphere with 5.5% CO2 , and mitosis was arrested with colcemid three hours before harvesting. Two slides were prepared from each assay and evaluated for mitotic index and structural chromosomal aberrations.
The numbers of chromosomal aberrations in negative control assays were within historical negative control ranges, while all the positive control assays showed significant increases in structural chromosomal aberrations, within the historical positive control ranges for the testing laboratory. Exposure to LZ1000 had no biologically relevant effects on either mitotic index or the number of cells with structural chromosomal aberrations in any of the experiments. It was concluded that under the conditions of the study, LZ1000 did not induce structural chromosomal aberrations in human lymphocytes.
Genotoxicity studies; L-carnitine chloride
Mutagenicity- assays of L-carnitine chloride (Hamai et al. 1988)
Mutagenicity of L-carnitine chloride was investigated using rec- assay, Ames test, and chromosomal aberration test in Chinese hamster V79 (lung fibroblast) cells. The purity of the L-carnitine used in these assays was not stated.
The rec- test was conducted using concentrations of 25, 50, 250, 500, 2500 and 5000 µg/disc of test material. The solvent was distilled water. The bacterial strains used were Bacillis subtilis H17 (Rec+) and Bacillus subtilis M45 (Rec-). H17 is a recombinant structure retaining strain whereas M45 is a deficient strain. Culture broths containing the strains were streaked on a culture plate so that they did not come in contact, and a filter paper disc impregnated with the test solution was placed at the point of closest approach of the two streaks. Each plate was maintained at 2ºC for 24 hours and then incubated at 37ºC for 24 hours. Negative and positive controls were run concurrently, and all plates were run duplicate. The negative control was sterilized distilled water and the positive control was mitomycin C. A Rec- assay is considered to be positive if the difference in inhibition zone between the two bacterial strains (M45-M17) is greater than 3 mm. The difference was <1 mm for all concentrations of test material and for the negative control, but was 15.5 mm for the positive control.
The test strains of bacteria for the Ames test were Escherichia coli WP2uvrA, and Salmonella typhimurium strains TA100, TA1535, TA98, TA1538 andTA1537. The positive control material for assays using TA100, TA1535 or WP2uvrA in the absence of S9 fraction was N-ethyl-N’-nitro-N-nitrosoguanidine. For the assay using TA98, 2-nitrofluorene was the positive control material for the assay using TA98 in the absence of S9 fraction. For assays including S9 fraction, the positive control material was 2-aminoanthracene. Test material concentrations were 0, 50, 100, 500, 1000, 5000 and 10,000 µg/plate. All assays were conducted in duplicate, in culture plates with incubation at 37ºC for 48 hours. The test material at a concentration of 10,000 µg/plate caused bacterial growth inhibition of TA1537 without metabolic activation, and also caused growth inhibition of TA100, TA1535, TA98, TA1538 and TA1537 with metabolic activation. However the number of revertant colonies were closely comparable to those in negative control plates for all bacterial strains at all concentrations of L-carnitine chloride. The positive controls had the expected mutagenic effects on all the bacterial strains, validating the assays.
L-carnitine chloride was added to V79 cells suspended in culture broth at concentrations of 2.5, 5.0 or 10 mg/mL. The concentration of 10 mg/mL caused 50% cell growth suppression. All assays were
73

conducted in duplicate. For the experiment without metabolic activation, negative control assays were an untreated control and a solvent (distilled water) control, and the positive control assay was also conducted using mitomycin C. Cultures were incubated with test material for 24 or 48 hours. Mitosis was arrested by addition of colchicine 2 hours before the end of incubation, and the cells were processed for examination. For the experiment with metabolic activation by S9 fraction, the negative controls were an untreated control and a solvent (distilled water) control, and the positive control dimethylnitrosamine. The cells were incubated with the test material and S9 fraction for 3 hours, after which the cells were washed and cultured for a further 24 hours. Mitosis was arrested, and cells prepared for examination, as for the experiment without metabolic activation. In the absence of metabolic activation, after 24 hours the frequency of abnormal cells was greater in the presence of the test article than in the untreated control cultures, but not significantly different to the frequency in the solvent control cultures. After 48 hours, there was no significant difference in frequency of abnormal cells between the assay with L-carnitine chloride and either the untreated control or the solvent control. In the experiment with metabolic activation, the presence of L-carnitine chloride did not increase the frequency of abnormal cells above that in either the untreated or the solvent control. The positive control substances, as expected, caused highly significant increases in the frequencies of abnormal cells, compared to both the untreated controls and the solvent controls.
It was concluded from the results of these assays that L-carnitine chloride is not mutagenic.
Immunotoxicity studies
No immunotoxicity studies were submitted with the application or located elsewhere. However the results from subchronic and chronic studies do not suggest that immunotoxic effects are likely.
Other studies
4-week study of L-carnitine supplementation via drinking water to hyperlipidaemic rabbits (Seccombe et al. 1987)
The purpose of this study was to determine the effect of carnitine on plasma lipids of New Zealand White (NZW) rabbits that had hyperlipidaemia induced by feeding a high-fat diet for four weeks prior to introduction of an L-carnitine supplement. Male NZW rabbits, ranging in weight from 2.5 to 3.0 kg, were assigned to three groups, 4 rabbits/group. Rabbits were individually housed, allowed ad libitum access to water and food, and maintained on a 12-hour light/dark cycle. The control group was fed a standard commercial rabbit chow throughout the eight weeks of the experiment. The second group was fed a high-fat diet throughout the experiment. The high-fat diet was created by adding a solution of cholesterol in corn oil to the standard commercial rabbit chow, so that the final diet contained 5% corn oil and 0.5% cholesterol by weight. The third group was fed the same high-fat diet for eight weeks, but for the last four weeks of the experiment, they also received an L-carnitine supplement in their drinking water, providing a mean daily L-carnitine intake of 170 ± 40 mg/kg bw/day. The purity of the L-carnitine used to supplement the water supply was not stated.
In-life parameters included survival, clinical signs, bodyweights, food consumption and water intake. Blood collection was performed at the start of the experiment, at 4 weeks and at 8 weeks. Rabbits were fasted for 16 to 18 hours prior to collection of blood from a marginal ear vein. Blood was analysed for glucose, carnitine, β-hydroxybutyrate, VLDL isolation and lipid analysis. At the end of the 8-week in-life phase, the rabbits were killed, and liver and muscle were collected. Tissue samples were either frozen in liquid nitrogen or preserved in neutral buffered formalin or Bouin’s solution for histopathology.
All rabbits survived the study. There were no treatment-related effects on clinical signs, food consumption, bodyweight or blood glucose. Eight weeks of consumption of the high-fat diet resulted in a significant increase in total plasma cholesterol, VLDL-cholesterol, VLDL-triglycerides, VLDL-apolipoprotein B, VLDL protein and free, total and acyl carnitine.
74

Compared to rabbits that consumed the high-fat diet but were not supplemented with L-carnitine, rabbits that were supplemented with L-carnitine for four weeks had significantly increased blood levels of free, acetyl-, acyl- and total carnitine, and also had significantly lower blood levels of VLDL-triglyceride, VLDL-cholesterol and VLDL-protein. Rabbits fed the high-fat diet, but not supplemented with L-carnitine, had significantly lower total carnitine in the liver than rabbits fed the standard rabbit chow. This decrease was attributable to decreases in the free and short-chain acylcarnitine pools, whereas the long-chain acylcarnitine pool increased. Liver carnitine stores of rabbits that consumed the high-fat diet but also received L-carnitine supplementation were comparable to those of controls. The high-fat diet had less effect on skeletal muscle carnitine than on liver carnitine, although it did cause a significant increase in long-chain acylcarnitine concentration. This increase was reversed by the L-carnitine supplementation.
On microscopic examination, rabbits fed the high-fat diet had marked steatosis, evident as enlargement and vacuolation of hepatocytes, in their livers. The vacuolation was confirmed by Oil Red O staining to be lipid accumulation. L-carnitine supplementation was associated with a reduction in the severity of steatosis. Compared to the control diet, the high-fat diet led to a significant decrease in hepatic β-hydroxy-β-methyl glutaryl-CoA reductase activity, and L-carnitine supplementation did not significantly ameliorate this change. Hepatic activity of 7α-hydroxylase (more commonly known as cytochrome P450 7A1, or CYP7A1) significantly increased in rabbits fed the high-fat diet, when compared to controls. L-carnitine supplementation had some ameliorating effect on this change, although activity remained significantly elevated relative to that of controls. The high-fat diet also increased hepatic activity of acyl-CoA cholesterol acyltransferase (ACAT), and L-carnitine supplementation resulted in an even greater increase.
This experiment was not intended to be a toxicology study, and did not investigate many of the endpoints usually assessed as part of a toxicology study. However it may be noted that L-carnitine supplementation through drinking water, at an average intake of 170 ± 40 mg/kg bw/day for four weeks, was not associated with adverse effects in male New Zealand White rabbits.
28-day intraperitoneal L-carnitine study in rabbits with induced hypercholesterolaemia (Sayed-Ahmed et al. 2001)
This study was not a toxicity study, but was designed to determine the effects of L-carnitine deficiency and supplementation on atherosclerosis in rabbits with induced hypercholesterolaemia. The test subjects were male NZW rabbits, aged 3 to 4 months and weighing between 2.0 and 2.5 kg. Rabbits were provided ad libitum access to a standard pelleted diet essentially free of L-carnitine or derivatives, and drinking water. Rabbits were assigned to four groups of 8 rabbits/group. The normal control group were maintained on the standard diet for 28 days and injected intraperitoneally (i.p.) daily, also for 28 days, with normal saline. Hypercholesterolaemia was induced in the other three groups by feeding the rabbits the pelleted diet spray-coated, to 2% w/w, with cholesterol for 28 days. The second group, was assigned to be the control hypercholesterolaemic group. Rabbits in this group were injected i.p., daily, with normal saline. Rabbits in the third group, the L-carnitine-treated hypercholesterolaemic group, were injected daily for 28 days with a single i.p. dose of 250 mg/kg bw L-carnitine. The fourth group was the carnitine-deficient hypercholesterolaemic group. Rabbits in this group were injected daily with a single i.p. dose of 250 mg/kg bw D-carnitine. Twenty-four hours after the last dose, animals were killed and blood was collected for measurement of serum triglycerides, total cholesterol and HDL-cholesterol. LDL-cholesterol was calculated by subtracting HDL-cholesterol from total cholesterol. Samples of thoracic aorta, coronary arteries and heart were collected, fixed in 10% neutral buffered formalin, and processed for histopathology. Slides were prepared with two stains; H&E and orcein stain. Orcein stain is used to visualize elastic fibres. In addition, reduced glutathione (GSH) and malondialdehyde were measured by spectrophotometric methods in fresh samples of heart and thoracic aorta.
Aortas of rabbits in the normal control group were microscopically normal, whereas in the
75

hypercholesterolaemic control group, all rabbits developed atherosclerotic lesions in the thoracic aorta. Microscopically, these lesions consisted of intimal plaques, which under high magnification featured endothelial gaps, subendothelial foam cells, and splitting of superficial elastic membranes. Rabbits fed the hypercholesterolaemic diet but also supplemented with 250 mg/kg bw/day L-carnitine had normal aortic walls with no foam cells, no endothelial gaps and no changes in muscle fibres. In contrast, rabbits fed the hypercholesterolaemic diet but treated with D-carnitine to induce a state of L-carnitine deficiency developed intimal plaques even larger than those of rabbits in the hypercholesterolaemic control group. Aortas of rabbits in this last group also showed diffuse thickening of aortic walls and fasciculated elastic membranes.
Compared to the normal coronary histology of the normal control group, coronary arteries of the hypercholesterolaemic control group exhibited focal interruption of internal elastic laminae and vacuolation in arterial walls. Concurrent supplementation with L-carnitine almost completely prevented these lesions. However the lesions in elastic laminae of coronary arteries of rabbits fed the hypercholesterolaemic diet and also treated with D-carnitine were even more severe than those of the hypercholesterolaemic control group.
Compared to normal controls, the hypercholesterolaemic control rabbits exhibited a 5.3-fold group mean increase in total cholesterol, which was principally attributable to increased LDL-cholesterol. The group mean LDL-cholesterol level of the hypercholesterolaemic controls was almost 18 times higher than that of normal control rabbits. Group mean serum triglyceride of the hypercholesterolaemic controls was 151% that of normal control rabbits. Supplementation with L-carnitine did not significantly change group mean total cholesterol, as compared to hypercholesterolaemic controls, and the effect of L-carnitine on serum triglyceride was also insignificant. The LDL-cholesterol/HDL-cholesterol ratio, or atherogenic index, was decreased by 14% by L-carnitine supplementation. In contrast, D-carnitine supplementation resulted in a 45% increase in group mean atherogenic index, compared to hypercholesterolaemic controls. Results are presented in bar graphs rather than in numerical form, but it appears that induction of an L-carnitine deficiency, by means of administering D-carnitine, had little effect on serum triglyceride or serum total cholesterol, when compared to hypercholesterolaemic controls.
The hypercholesterolaemic diet resulted in significant increases in group mean aortic and cardiac GSH levels, of 53% and 43% respectively, when compared to normal controls. Administration of L-carnitine resulted in complete reversal of the increase in GSH in both tissues. D-carnitine did not significantly alter the levels of GSH in either tissue, as compared to hypercholesterolaemic controls.
Group mean malondialdehyde was increased 1.87-fold in aorta and 14.1-fold in heart in hypercholesterolaemic controls, as compared to normal controls. Treatment with either L-carnitine or D-carnitine resulted in malondialdehyde levels in both tissues that were comparable to those of normal controls.
Under the conditions of this study, supplementation with L-carnitine completely prevented the development and progression of atherosclerotic lesions observed in hypercholesterolaemic controls, whereas D-carnitine resulted in an exacerbation of the lesions. The beneficial effect of L-carnitine did not appear to be attributable to effects on serum triglyceride or serum total cholesterol, although L-carnitine did cause a moderate decrease in atherogenic index. The authors suggested that the beneficial effect of both L-carnitine and D-carnitine on malondialdehyde may indicate that both compounds act as antioxidants.
It may be concluded from this study that L-carnitine can prevent the progression of atherosclerotic lesions, and depletion or deficiency of L-carnitine may be an additional risk factor in atherogenesis.
76

12-week oral gavage study of L-carnitine and/or methimazole in male ApoE KO mice transfected with the human CETP gene (Collins et al. 2016)
The test subjects of this study were male ApoE KO mice (ApoE -/-) transfected with an adeno-associated viral vector containing the human gene for cholesteryl ester transfer protein (hCETP). This protein is a key enzyme in reverse cholesterol transport, transferring cholesterol ester from high density lipoprotein (HDL) to low density lipoprotein (LDL) cholesterol. CETP expression was verified at 2 and 14 weeks after transfection, and found to be stable. Husbandry conditions of the mice are not described in detail. Two weeks after transfection, mice were placed on a diet containing 21% fat w/w and 0.15% cholesterol, and remained on that diet during the 12 weeks of the experiment. Mice were assigned to 5 groups of 15 mice/group. The control group was gavaged daily with the vehicle, sterile deionised water. The two L-carnitine groups were gavaged daily with 87 and 352 mg/kg bw/day L-carnitine. These doses were considered to be equivalent to low and high human doses of 500 and 2000 mg/day. Two further groups were gavaged daily with 15 mg/kg bw/day methimazole, alone or with 352 mg/kg bw/day L-carnitine. Methimazole blocks formation of trimethylamine N-oxide (TMAO). The dose volume for all groups was 1 mL/100 g bodyweight. Mice were weighed weekly. After 12 weeks of treatment, blood samples were collected for determination of plasma concentrations of L-carnitine and TMAO, and the mice were killed. The thoracic aorta of each mouse was fixed for morphometric analysis. In addition, a small segment of ascending aorta with heart attached was collected for histological examination of the aortic root.
There were no treatment-related effects on bodyweights or bodyweight changes. Treatment with L-carnitine resulted in a significant dose-dependent increase in group mean plasma L-carnitine, compared to that of controls. In the group gavaged with methimazole alone, there was a significant decrease in plasma L-carnitine. Plasma TMAO was significantly increased by treatment with 352 mg/kg bw/day L-carnitine, but not by the lower dose of 87 mg/kg bw/day L-carnitine. Concurrent treatment with methimazole led to decreased group mean plasma TMAO compared to treatment with L-carnitine alone, but the level of plasma TMAO was still higher than that of controls.
In both groups treated with L-carnitine (without methimazole), analysis of atherosclerotic lesion size at the aortic root showed a very small but significant decrease in group mean lesion size compared to the control group. Methimazole alone also resulted in a decrease in group mean lesion size, a finding attributed to the anti-oxidant and anti-inflammatory properties of methimazole.
When the 352 mg/kg bw/day group was compared to the control group, there was a significant inverse correlation between lesion size at the aortic root and plasma TMAO. Likewise, using morphometric analysis data, a significant inverse correlation was found between plasma TMAO and thoracic aorta lesion area. Overall, high plasma TMAO was significantly correlated with lower incidence of atherosclerotic lesions.
There were no treatment-related differences in lipid content of thoracic aortas in mice, and no significant changes were found in plasma cholesterol, triglycerides or phospholipids. The high-dose (352 mg/kg bw/day) L-carnitine treatment was associated with increased group mean plasma HDL-cholesterol, compared to controls, but the difference was not significant and there were no significant treatment-related differences in plasma VLDL-cholesterol or LDL cholesterol levels. Therefore, the association between plasma TMAO and prevention or amelioration of lesion development appears to be independent of plasma lipid levels.
It was concluded from this study that TMAO is likely to provide a protective rather than a causative effect on atherosclerosis development, and that this protective effect is independent of any effects on plasma lipids.
77

15-week study of L-carnitine in drinking water of C57BL/6J Apolipoprotein E-knockout (Apoe-/-) mice (Koeth et al. 2013).
This study was conducted in female (Apoe-/-) mice. Mice were 28 days old at the start of the study. Details of caging and environmental conditions are not stated. Mice were provided with a standard diet. There was one control group consisting of 9 mice. A second group, consisting of 11 mice, was provided with 1.3% L-carnitine in their drinking water. A third group, containing 9 mice, was provided with a mixture of antibiotics in the drinking water, comprising 0.1% ampicillin sodium salt, 0.1% metronidazole, 0.05% vancomycin and 0.1% neomycin sulphate. The fourth group, consisting of 10 mice, received both the 1.3% L-carnitine and the antibiotic mixture in their drinking water. Mice were treated continuously for 15 weeks. At the end of the study, cardiac blood was collected under anaesthesia and mice were killed by exsanguination. Plasma triglyceride, total cholesterol, glucose and insulin were determined. The hearts were collected for histopathological examination of sections stained with Oil Red O, a lipid stain, with haematoxylin as a counterstain. The areas of atherosclerotic lesions at the aortic root were quantified. The livers were also collected for determination of triglyceride and total cholesterol.
An approximate doubling of aortic root atherosclerotic plaque formation was reported in L-carnitine-supplemented mice compared to control mice. Numerical data are not provided in the publication. A small graph indicates that the group mean size of aortic root lesions in control mice was approximately1.8-fold that of controls, although the same graph shows that this increase in group mean was driven by three individuals and that lesion sizes in the other mice in the group were in the same general range as the controls. Mice in the two groups that were given the antibiotic mixture, with or without concurrent L-carnitine, had lesion sizes in the same range as the control group. The graph plots aortic lesion sizes in the range 0 to 5.0 x 105 µm2. All plotted points for control mice, and mice treated with antibiotics with or without L-carnitine, fall below 2.5 x 105 µm2; however, so do seven of the 11 plot points for the L-carnitine supplemented mice. That is, only a minority of L-carnitine supplemented mice had atherosclerotic lesions that were outside the range for other groups.
Group mean plasma carnitine was significantly higher in mice supplemented with L-carnitine than in controls. Plasma carnitine was even higher in mice treated with both L-carnitine and the antibiotic mixture. Group mean plasma TMA and TMAO concentrations were much higher in L-carnitine supplemented mice than in controls, but were comparable to those of controls in mice treated with L-carnitine and the antibiotic mixture, as well as in mice treated with the antibiotic mixture alone. No proatherogenic changes in plasma lipid, lipoprotein, glucose or insulin levels were found. There was no evidence of hepatic steatosis in any group and L-carnitine supplementation had no effect on liver triglyceride or total cholesterol.
78

Appendix 2: Dietary Intake Assessments at FSANZA dietary intake assessment is the process of estimating how much of a food chemical a population, or population sub group, consumes. Dietary intake of food chemicals is estimated by combining food consumption data with food chemical concentration data. The process of doing this is called ‘dietary modelling’.
Dietary intake = food chemical concentration x food consumption
FSANZ’s approach to dietary modelling is based on internationally accepted procedures for estimating dietary intake of food chemicals. Different dietary modelling approaches may be used depending on the assessment, the type of food chemical, the data available and the risk assessment questions to be answered. In the majority of assessments FSANZ uses the food consumption data from each person in the national nutrition surveys to estimate their individual dietary intake. Population summary statistics such as the mean intake or a high percentile intake are derived from the ranked individual person’s intakes from the nutrition survey.
An overview of how dietary intake assessments are conducted and their place in the FSANZ Risk Analysis Process is provided on the FSANZ website at:http://www.foodstandards.gov.au/science/riskanalysis/Pages/default.aspx
FSANZ has developed a custom-built computer program ‘Harvest’ to calculate dietary intakes. Harvest replaces the program ‘DIAMOND’ that has been used by FSANZ for many years. Harvest has been designed to replicate the calculations that occurred within DIAMOND using a different software package.
Further detailed information on conducting dietary intake assessments at FSANZ is provided in Principles and Practices of Dietary Exposure Assessment for Food Regulatory Purposes (FSANZ 2009), available at: http://www.foodstandards.gov.au/science/exposure/documents/Principles%20_%20practices%20exposure%20assessment%202009.pdf
A2.1 Food consumption data used
The most recent food consumption data available were used to estimate intakes of L-carnitine for the Australian and New Zealand populations. The national nutrition survey (NNS) data used for these assessments were: The 2011-12 Australian National Nutrition and Physical Activity Survey (2011-12 NNPAS) The 2002 New Zealand National Children’s Nutrition Survey (2002 NZNNS) The 2008/09 New Zealand Adult Nutrition Survey (2008 NZANS).
The design of each of these surveys varies somewhat and key attributes of each are set out below. Further information on the National Nutrition Surveys used to conduct dietary intake assessments is available on the FSANZ website at: http://www.foodstandards.gov.au/science/exposure/Pages/dietaryexposureandin4438.aspx
A2.1.1 2011-12 NNPAS
The 2011–12 Australian National Nutrition and Physical Activity Survey (2011-12 NNPAS), undertaken by the Australian Bureau of Statistics, is the most recent food consumption data for Australia. This survey includes dietary patterns of a sample of 12,153 Australians aged from 2 years and above. The survey used a 24-hour recall method for all respondents, with 64% of respondents also completing a second 24-hour recall on a second, non-consecutive day. The data were collected
79
from May 2011 to June 2012 (with no enumeration between August and September 2011 due to the Census). Only those respondents who had two days of food consumption data were used to estimate L-carnitine intakes for this assessment. To allow a comparison with New Zealand L-carnitine intakes, Day 1 L-carnitine intakes were also estimated for Australia. However, the Day 1 and 2 average dietary intakes provide the best estimate of L-carnitine intakes for Australia. Consumption and respondent data from the survey were incorporated into the Harvest program from the Confidentialised Unit Record Files (CURF) data set (ABS 2014). These data are used weighted in Harvest.
A2.1.2 2002 New Zealand National Children’s Nutrition Survey (2002 NZNNS)
The 2002 NZNNS was a cross-sectional and nationally representative survey of 3,275 New Zealand children aged 5-14 years. The data were collected during the school year from February to December 2002. The survey used a 24-hour food recall and provided information on food and nutrient intakes, eating patterns, frequently eaten foods, physical activity patterns, dental health, anthropometric measures and nutrition-related clinical measures. It was also the first children’s nutrition survey in New Zealand to include a second day diet recall data for about 15% of the respondents, and dietary intake from both foods (including beverages) and dietary supplements. Only the Day 1 24-hour recall data for all respondents (excluding supplements) were used for this assessment. These data are used weighted in Harvest.
A2.1.3 2008/09 New Zealand Adult Nutrition Survey (2008 NZANS)
The 2008 NZANS provides comprehensive information on the dietary patterns of a sample of 4,721 respondents aged 15 years and above. The survey was conducted on a stratified sample over a 12 month period from October 2008 – October 2009. The survey used a 24-hour recall methodology with 25% of respondents also completing a second 24-hour recall. The information collected in the 2008 NZANS included food and nutrient intakes, dietary supplement use, socio-demographics, nutrition related health, and anthropometric measures. Only the Day 1 24-hour recall data for all respondents were used for this assessment. These data are used weighted in Harvest.
A2.2 Limitations of dietary intake assessments
Dietary intake assessments based on food consumption data from national dietary surveys provide the best estimation of actual consumption of a food and the resulting estimated dietary intake assessment for the Australian population aged 2 years and above, as well as the New Zealand populations aged 5-14 years and 15 years and above. However, it should be noted that NNS data do have limitations. Further details of the limitations relating to dietary intake assessments undertaken by FSANZ are set out in the FSANZ document, Principles and Practices of Dietary Exposure Assessment for Food Regulatory Purposes (FSANZ 2009).
80
Appendix 3: Dietary Intake Assessment results
Table A3.1: Estimated mean and P90 L-carnitine dietary intakes for Australia and New Zealand
Country Population type Age Group
Number of Consumers
(all scenarios)
Estimated dietary intake of L-Carnitine (mg/day)
Mean P90
BaselineSports food
increase Consumer Behaviour
Baseline
Sports food
increaseConsumer Behaviour
Australia General 2-6 years 479 38 38 288 73 73 546
Consumption data from Day 1 and 2 respondents
7-17 years 1,127 57 66 445 111 116 874
18-70 years 5,477 71 87 449 138 153 952
2 years and above
7,735 66 79 426 131 140 897
Elderly71 years and above
652 61 66 304 115 120 603
People who consume sports foods/beverages
2 years and above
419 137 378 806 249 801 1,567
People who consume weight management or meal replacement products
2 years and above
240 104 249 597 217 761 1,227
People who don't eat meat2 years and above
163 28 42 381 50 52 828
81

Table A3.1: Estimated mean and P90 L-carnitine dietary intakes for Australia and New Zealand
Country Population type Age Group
Number of Consumers
(all scenarios)
Estimated dietary intake of L-Carnitine (mg/day)
Mean P90
BaselineSports food
increase Consumer Behaviour
Baseline
Sports food
increaseConsumer Behaviour
Australia General 2-6 years 779 38 39 295 80 82 601consumption data from on Day 1 respondents only
7-17 years 1,753 60 69 458 136 137 954
18-70 years 8,595 72 93 470 161 175 1,111
2 years and above
12,149 67 83 442 152 160 1,015
Elderly71 years and above
1,023 57 59 285 133 133 665
People who consume sports foods/beverages
2 years and above
463 187 609 1,054 386 1,253 2,048
People who consume weight management or meal replacement products
2 years and above
254 127 365 752 264 1,034 1,578
People who don't eat meat2 years and above
288 15 24 370 31 31 974
New Zealand General 5-14 years 3,275 60 60 456 131 131 917
18-70 years 3,990 76 78 515 162 167 1,154
15 years and above
4,719 75 76 501 160 163 1,096
Elderly71 years and above
463 57 57 299 125 125 655
82

Table A3.1: Estimated mean and P90 L-carnitine dietary intakes for Australia and New Zealand
Country Population type Age Group
Number of Consumers
(all scenarios)
Estimated dietary intake of L-Carnitine (mg/day)
Mean P90
BaselineSports food
increase Consumer Behaviour
Baseline
Sports food
increaseConsumer Behaviour
People who consume sports foods/beverages
15 years and above
61 109 217 714 238 522 1,384
People who consume weight management or meal replacement products
15 years and above
56 109 191 736 268 421 1,384
People who don't eat meat15 years and above
156 17 17 513 33 33 1,248
Based consumption data from Day 1 and 2 respondents Based consumption data from on Day 1 respondents only
83

Table A3.2: Food contributors to L-carnitine dietary intakes for Australia, based on Day 1 and 2 of the 2011-12 NNPAS, for general population groups
% ContributionFood Code Food Group 2-6 years 7-17 years 18-70 years 2 years and above
Bas
elin
e
Spor
ts fo
od in
crea
se
Con
sum
er B
ehav
iour
Bas
elin
e
Spor
ts fo
od in
crea
se
Con
sum
er B
ehav
iour
Bas
elin
e
Spor
ts fo
od in
crea
se
Con
sum
er B
ehav
iour
Bas
elin
e
Spor
ts fo
od in
crea
se
Con
sum
er B
ehav
iour
1 Dairy products (excluding butter & butter fats) 33 33 35 19 17 13 15 12 15 16 13 16
1 Plain milk 25 25 3 15 13 2 11 9 2 12 10 2
1.1.2 Liquid milk products & flavoured liquid milk <1 <1 3 1 1 5 <1 <1 4 <1 <1 4
1.2.1 Fermented & rennetted milk, unflavoured <1 <1 4 <1 <1 1 <1 <1 3 <1 <1 2
1.2.2 Fermented & rennetted milk prod, flavoured 4 4 24 <1 <1 6 <1 <1 7 1 <1 7
1.3 Condensed milk & evaporated milk <1 <1 <1 <1 <1 <1 <1 <1 <1 <1 <1 <1
1.4 Cream & cream products <1 <1 <1 <1 <1 <1 <1 <1 <1 <1 <1 <11.5.1 Dried milk, milk powder <1 <1 <1 <1 <1 <1 <1 <1 <1 <1 <1 <11.5.2 Dried cream powder <1 <1 <1 <1 <1 <1 <1 <1 <1 <1 <1 <11.5.3 Dried yoghurt powder 0 0 0 0 0 0 0 0 0 0 0 01.6 Cheese & cheese products 1 1 <1 1 1 <1 <1 <1 <1 <1 <1 <12 All Edible oils & oil emulsions <1 <1 <1 <1 <1 <1 <1 <1 <1 <1 <1 <1
2.2
Oil emulsions (water in oil) (excluding butter; butter products; and oil emulsions (<80% oil), dairy blends))
<1 <1 <1 <1 <1 <1 <1 <1 <1 <1 <1 <1
2.2.1.1 Butter <1 <1 <1 <1 <1 <1 <1 <1 <1 <1 <1 <12.2.1.2 Butter products <1 <1 <1 <1 <1 <1 <1 <1 <1 <1 <1 <1
2.2.2.2 Oil emulsions (<80% oil), dairy blends <1 <1 <1 <1 <1 <1 <1 <1 <1 <1 <1 <1
3 All Ice cream & edible ices 1 1 <1 2 1 <1 <1 <1 <1 <1 <1 <13.2 Ice cream 1 1 <1 2 1 <1 <1 <1 <1 <1 <1 <1
84
Table A3.2: Food contributors to L-carnitine dietary intakes for Australia, based on Day 1 and 2 of the 2011-12 NNPAS, for general population groups
% ContributionFood Code Food Group 2-6 years 7-17 years 18-70 years 2 years and above
Bas
elin
e
Spor
ts fo
od in
crea
se
Con
sum
er B
ehav
iour
Bas
elin
e
Spor
ts fo
od in
crea
se
Con
sum
er B
ehav
iour
Bas
elin
e
Spor
ts fo
od in
crea
se
Con
sum
er B
ehav
iour
Bas
elin
e
Spor
ts fo
od in
crea
se
Con
sum
er B
ehav
iour
4 All Fruit & vegetables (including fungi/ nuts/ seeds/ herbs/ spices) 3 3 <1 2 2 <1 2 2 <1 2 2 <1
4
Fruit & vegetables (including fungi/ nuts/ seeds/ herbs/ spices) (excluding category 4 foods listed below)
<1 <1 <1 <1 <1 <1 <1 <1 <1 <1 <1 <1
4.1.0.1 Grapes packed with permeable envelopes <1 <1 <1 <1 <1 <1 <1 <1 <1 <1 <1 <1
4.1.1.1 Untreated fruits & vegetables, fungi <1 <1 <1 <1 <1 <1 <1 <1 <1 <1 <1 <1
4.1.1.2 Untreated fruits & vegetables, nuts <1 <1 <1 <1 <1 <1 <1 <1 <1 <1 <1 <1
4.1.1.3 Untreated fruits & vegetables, seeds <1 <1 <1 <1 <1 <1 <1 <1 <1 <1 <1 <1
4.1.1.4 Untreated fruits & vegetables, herbs <1 <1 <1 <1 <1 <1 <1 <1 <1 <1 <1 <1
4.1.1.5.1 Untreated fruits, other <1 <1 <1 <1 <1 <1 <1 <1 <1 <1 <1 <14.1.1.5.2 Untreated vegetables, other 1 1 <1 1 1 <1 1 1 <1 1 1 <14.1.2.1 Surface treated citrus fruit <1 <1 <1 <1 <1 <1 <1 <1 <1 <1 <1 <1
4.1.2.2 Surface treated walnut & pecan nut kernels 0 0 0 0 0 0 0 0 0 0 0 0
4.1.3.2 Root & tuber vegetables 0 0 0 0 0 0 0 0 0 0 0 0
4.3.0.2Preserved cherries (maraschino/ cocktail/ glace cherries)
<1 <1 <1 <1 <1 <1 <1 <1 <1 <1 <1 <1
4.3.0.3 Tomato products pH <4.5 <1 <1 <1 <1 <1 <1 <1 <1 <1 <1 <1 <1
4.3.1
Dried fruits & vegetables (excluding dried & rehydrated legumes and dried herbs & spices)
<1 <1 <1 <1 <1 <1 <1 <1 <1 <1 <1 <1
4.3.1.3.1 Dried & rehydrated legumes <1 <1 <1 <1 <1 <1 <1 <1 <1 <1 <1 <14.3.1.4 Dried herbs & spices <1 <1 <1 <1 <1 <1 <1 <1 <1 <1 <1 <1
85
Table A3.2: Food contributors to L-carnitine dietary intakes for Australia, based on Day 1 and 2 of the 2011-12 NNPAS, for general population groups
% ContributionFood Code Food Group 2-6 years 7-17 years 18-70 years 2 years and above
Bas
elin
e
Spor
ts fo
od in
crea
se
Con
sum
er B
ehav
iour
Bas
elin
e
Spor
ts fo
od in
crea
se
Con
sum
er B
ehav
iour
Bas
elin
e
Spor
ts fo
od in
crea
se
Con
sum
er B
ehav
iour
Bas
elin
e
Spor
ts fo
od in
crea
se
Con
sum
er B
ehav
iour
4.3.3.1 Canned fruits <1 <1 <1 <1 <1 <1 <1 <1 <1 <1 <1 <14.3.3.2 Canned vegetables <1 <1 <1 <1 <1 <1 <1 <1 <1 <1 <1 <14.3.5 Candied fruits & vegetables 0 0 0 0 0 0 <1 <1 <1 <1 <1 <14.3.6.3 Nut butter <1 <1 <1 <1 <1 <1 <1 <1 <1 <1 <1 <14.3.6.5 Seed butter <1 <1 <1 <1 <1 <1 <1 <1 <1 <1 <1 <15 All Confectionery <1 <1 5 1 1 6 <1 <1 4 <1 <1 45.1 Chocolate & cocoa products <1 <1 3 1 1 3 <1 <1 2 <1 <1 2
5.2 Sugar confectionery (excluding bubble gum & chewing gum) 0 0 2 0 0 3 0 0 2 0 0 2
5.2.1 Bubble gum & chewing gum 0 0 0 0 0 <1 0 0 <1 0 0 <16 All Cereals & cereal products <1 <1 4 <1 <1 3 <1 <1 6 <1 <1 6
6Cereals & cereal products (excluding category 6 products listed below)
<1 <1 <1 <1 <1 <1 <1 <1 <1 <1 <1 <1
6.1.1 Plain oats, dry <1 <1 4 <1 <1 3 <1 <1 5 <1 <1 5
6.1.2 Cereals, whole & broken grains, rice <1 <1 <1 <1 <1 <1 <1 <1 <1 <1 <1 <1
6.2.1 Flours, meals & starches, wheat only <1 <1 <1 <1 <1 <1 <1 <1 <1 <1 <1 <1
6.4 Flour products (including noodles & pasta) <1 <1 <1 <1 <1 <1 <1 <1 <1 <1 <1 <1
7 All Breads & bakery products <1 <1 <1 <1 <1 <1 <1 <1 <1 <1 <1 <17 Breads & bakery products <1 <1 <1 <1 <1 <1 <1 <1 <1 <1 <1 <1
8 All Meat & meat products (including poultry & game) 57 56 8 68 59 9 72 59 11 71 60 11
8.1.1 Poultry (excluding duck) 6 6 <1 7 6 <1 7 6 1 7 6 18.1.1.2 Duck <1 <1 <1 <1 <1 <1 <1 <1 <1 <1 <1 <18.1.2 Game meat <1 <1 <1 <1 <1 <1 1 <1 <1 <1 <1 <18.1.3.2 Red meat, excluding game 40 40 5 48 42 6 54 44 8 53 44 8
8.1.3.3 White meat, excluding game and poultry <1 <1 <1 2 2 <1 3 2 <1 3 2 <1
8.1.4 Offal, all types <1 <1 <1 <1 <1 <1 <1 <1 <1 <1 <1 <1
86

Table A3.2: Food contributors to L-carnitine dietary intakes for Australia, based on Day 1 and 2 of the 2011-12 NNPAS, for general population groups
% ContributionFood Code Food Group 2-6 years 7-17 years 18-70 years 2 years and above
Bas
elin
e
Spor
ts fo
od in
crea
se
Con
sum
er B
ehav
iour
Bas
elin
e
Spor
ts fo
od in
crea
se
Con
sum
er B
ehav
iour
Bas
elin
e
Spor
ts fo
od in
crea
se
Con
sum
er B
ehav
iour
Bas
elin
e
Spor
ts fo
od in
crea
se
Con
sum
er B
ehav
iour
8.2
Processed meat/ poultry/ game products in whole/ cut pieces (e.g. ham, bacon, smoked chicken)
4 4 <1 5 4 <1 4 3 <1 4 3 <1
8.3Processed comminuted meat, poultry & game products (e.g. salami)
1 1 <1 2 1 <1 <1 <1 <1 <1 <1 <1
8.3.2 Sausage & sausage meat 4 4 <1 4 3 <1 3 2 <1 3 3 <19 All Fish & fish products <1 <1 <1 <1 <1 <1 1 <1 <1 1 <1 <1
9 Fish & fish products (excluding category 9 foods listed below) <1 <1 <1 <1 <1 <1 <1 <1 <1 <1 <1 <1
9.1.2 Unprocessed crustacea <1 <1 <1 <1 <1 <1 <1 <1 <1 <1 <1 <19.1.3 Molluscs <1 <1 <1 <1 <1 <1 <1 <1 <1 <1 <1 <1
9.2.1 Processed fish & fish products, crustacea <1 <1 <1 <1 <1 <1 <1 <1 <1 <1 <1 <1
9.3 Semi-preserved fish & fish products <1 <1 <1 <1 <1 <1 <1 <1 <1 <1 <1 <1
9.4 Fully preserved fish including canned fish products <1 <1 <1 <1 <1 <1 <1 <1 <1 <1 <1 <1
10 All Egg & egg products <1 <1 <1 <1 <1 <1 <1 <1 <1 <1 <1 <110 Egg & egg products <1 <1 <1 <1 <1 <1 <1 <1 <1 <1 <1 <112 All Salts & condiments <1 <1 <1 <1 <1 <1 <1 <1 <1 <1 <1 <112.5 Yeast & yeast products <1 <1 <1 <1 <1 <1 <1 <1 <1 <1 <1 <1
13 All Foods intended for particular dietary uses 2 3 5 5 17 7 6 24 7 6 21 7
13.1 Infant formula products <1 <1 <1 <1 <1 <1 0 0 0 <1 <1 <113.2.1 Infant cereal products <1 <1 <1 0 0 0 <1 <1 <1 <1 <1 <113.2.2 Infant fruit <1 <1 <1 0 0 0 <1 <1 <1 <1 <1 <113.2.3 Infant dairy desserts <1 <1 <1 <1 <1 <1 0 0 0 <1 <1 <113.2.4 Infant gels & juices <1 <1 <1 0 0 0 <1 <1 <1 <1 <1 <1
87
Table A3.2: Food contributors to L-carnitine dietary intakes for Australia, based on Day 1 and 2 of the 2011-12 NNPAS, for general population groups
% ContributionFood Code Food Group 2-6 years 7-17 years 18-70 years 2 years and above
Bas
elin
e
Spor
ts fo
od in
crea
se
Con
sum
er B
ehav
iour
Bas
elin
e
Spor
ts fo
od in
crea
se
Con
sum
er B
ehav
iour
Bas
elin
e
Spor
ts fo
od in
crea
se
Con
sum
er B
ehav
iour
Bas
elin
e
Spor
ts fo
od in
crea
se
Con
sum
er B
ehav
iour
13.3.1Solid formula meal replacement & formulated supplementary foods
<1 <1 <1 <1 <1 <1 <1 <1 <1 <1 <1 <1
13.3.2Liquid formula meal replacement & formulated supplementary foods
2 2 5 2 1 5 <1 <1 3 <1 <1 3
13.4.1 Solid formulated supplementary sports foods <1 <1 <1 <1 <1 <1 <1 3 <1 <1 3 <1
13.4.2 Liquid formulated supplementary sports foods <1 <1 <1 4 16 2 5 20 4 4 18 3
13.5 Toddler formula products (excluding soy based) <1 <1 <1 0 0 0 0 0 0 <1 <1 <1
14 All Non-alcoholic & alcoholic beverages <1 <1 27 <1 <1 44 <1 <1 37 <1 <1 37
14.1.2 Fruit & vegetable juices & fruit & vegetable juice products <1 <1 15 <1 <1 12 <1 <1 7 <1 <1 8
14.1.2.1.1 Coconut milk, coconut cream & coconut syrup <1 <1 <1 <1 <1 <1 <1 <1 <1 <1 <1 <1
14.1.3 Soft drinks (excluding intensely sweetened) 0 0 9 0 0 29 0 0 25 0 0 24
14.1.3.1.1.3 Energy drinks 0 0 0 0 0 2 0 0 3 0 0 3
14.1.5
Coffee (or substitute), tea, herbal infusion & similar (excluding caffeinated instant tea)
<1 <1 <1 <1 <1 <1 <1 <1 <1 <1 <1 <1
14.1.5.3.1.1 Tea, caffeinated, Instant 0 0 0 0 0 0 0 0 0 0 0 014.1.7 Soy beverage <1 <1 2 <1 <1 <1 <1 <1 2 <1 <1 214.1.8 Cereal beverages <1 <1 <1 <1 <1 <1 <1 <1 <1 <1 <1 <1
14.2
Alcoholic beverages (including no & low alcohol) (excluding beer & related products wine, sparkling wine & fortified wine)
<1 <1 <1 <1 <1 <1 <1 <1 <1 <1 <1 <1
14.2.1 Beer & related products 0 0 0 <1 <1 <1 <1 <1 <1 <1 <1 <1
88

Table A3.2: Food contributors to L-carnitine dietary intakes for Australia, based on Day 1 and 2 of the 2011-12 NNPAS, for general population groups
% ContributionFood Code Food Group 2-6 years 7-17 years 18-70 years 2 years and above
Bas
elin
e
Spor
ts fo
od in
crea
se
Con
sum
er B
ehav
iour
Bas
elin
e
Spor
ts fo
od in
crea
se
Con
sum
er B
ehav
iour
Bas
elin
e
Spor
ts fo
od in
crea
se
Con
sum
er B
ehav
iour
Bas
elin
e
Spor
ts fo
od in
crea
se
Con
sum
er B
ehav
iour
14.2.2 Wine, sparkling wine & fortified wine <1 <1 <1 <1 <1 <1 <1 <1 <1 <1 <1 <1
14.3 Alcoholic beverages not included in item 14.2 0 0 0 0 0 0 0 0 0 0 0 0
20 All Mixed Foods Commercial 16 17 19 19
20.1.1.5 Beverages, non-alcoholic, coffee, dry mix 0 <1 <1 <1
20.3.1 Ready-to-eat muesli 3 5 13 1120.3.2 Flavoured oat porridges, dry <1 <1 <1 <120.2.2.3 Cereal products, bars 12 12 5 6
Note: Gray shading indicates that the food category / group is a major contributor to L-carnitine dietary intakes
89

Table A3.3: Food contributors to L-carnitine dietary intakes for Australia, based on Day 1 and 2 of the 2011-12 NNPAS, for specific population groups
Food Code Food Group % Contribution
ElderlyPeople who consume
sports food/ beverages
People who consume Wt management/ meal
replacement productsPeople who don’t eat
meat
71 years and above 2 years and above 2 years and above 2 years and above
Bas
elin
e
Spor
ts fo
od in
crea
se
Con
sum
er B
ehav
iour
Bas
elin
e
Spor
ts fo
od in
crea
se
Con
sum
er B
ehav
iour
Bas
elin
e
Spor
ts fo
od in
crea
se
Con
sum
er B
ehav
iour
Bas
elin
e
Spor
ts fo
od in
crea
se
Con
sum
er B
ehav
iour
1 Dairy products (excluding butter & butter fats) 16 15 16 9 3 10 9 4 10 75 75 17
1 Plain milk 13 12 3 6 2 1 7 3 1 63 63 3
1.1.2 Liquid milk products & flavoured liquid milk <1 <1 2 <1 <1 3 <1 <1 3 2 2 2
1.2.1 Fermented & rennetted milk, unflavoured <1 <1 3 <1 <1 1 <1 <1 1 3 3 7
1.2.2 Fermented & rennetted milk prod, flavoured <1 <1 8 <1 <1 5 <1 <1 5 2 2 4
1.3 Condensed milk & evaporated milk <1 <1 <1 <1 <1 <1 <1 <1 <1 <1 <1 <11.4 Cream & cream products <1 <1 <1 <1 <1 <1 <1 <1 <1 <1 <1 <11.5.1 Dried milk, milk powder <1 <1 <1 <1 <1 <1 <1 <1 <1 2 2 <11.5.2 Dried cream powder <1 <1 <1 <1 <1 <1 <1 <1 <1 0 0 01.5.3 Dried yoghurt powder 0 0 0 0 0 0 0 0 0 0 0 01.6 Cheese & cheese products <1 <1 <1 <1 <1 <1 <1 <1 <1 4 4 <12 All Edible oils & oil emulsions <1 <1 <1 <1 <1 <1 <1 <1 <1 <1 <1 <1
2.2Oil emulsions (water in oil) (excluding butter; butter products; and oil emulsions (<80% oil), dairy blends))
<1 <1 <1 <1 <1 <1 <1 <1 <1 <1 <1 <1
2.2.1.1 Butter <1 <1 <1 <1 <1 <1 <1 <1 <1 <1 <1 <12.2.1.2 Butter products <1 <1 <1 <1 <1 <1 <1 <1 <1 0 0 02.2.2.2 Oil emulsions (<80% oil), dairy blends <1 <1 <1 <1 <1 <1 <1 <1 <1 <1 <1 <13 All Ice cream & edible ices <1 <1 <1 <1 <1 <1 <1 <1 <1 2 2 <13.2 Ice cream <1 <1 <1 <1 <1 <1 <1 <1 <1 2 2 <1
90

Table A3.3: Food contributors to L-carnitine dietary intakes for Australia, based on Day 1 and 2 of the 2011-12 NNPAS, for specific population groups
Food Code Food Group % Contribution
ElderlyPeople who consume
sports food/ beverages
People who consume Wt management/ meal
replacement productsPeople who don’t eat
meat
71 years and above 2 years and above 2 years and above 2 years and above
Bas
elin
e
Spor
ts fo
od in
crea
se
Con
sum
er B
ehav
iour
Bas
elin
e
Spor
ts fo
od in
crea
se
Con
sum
er B
ehav
iour
Bas
elin
e
Spor
ts fo
od in
crea
se
Con
sum
er B
ehav
iour
Bas
elin
e
Spor
ts fo
od in
crea
se
Con
sum
er B
ehav
iour
4 All Fruit & vegetables (including fungi/ nuts/ seeds/ herbs/ spices) 3 2 <1 1 <1 <1 1 <1 <1 11 11 <1
4Fruit & vegetables (including fungi/ nuts/ seeds/ herbs/ spices) (excluding category 4 foods listed below)
<1 <1 <1 <1 <1 <1 <1 <1 <1 1 1 <1
4.1.0.1 Grapes packed with permeable envelopes <1 <1 <1 <1 <1 <1 <1 <1 <1 <1 <1 <1
4.1.1.1 Untreated fruits & vegetables, fungi <1 <1 <1 <1 <1 <1 <1 <1 <1 <1 <1 <14.1.1.2 Untreated fruits & vegetables, nuts <1 <1 <1 <1 <1 <1 <1 <1 <1 <1 <1 <14.1.1.3 Untreated fruits & vegetables, seeds <1 <1 <1 <1 <1 <1 <1 <1 <1 <1 <1 <14.1.1.4 Untreated fruits & vegetables, herbs <1 <1 <1 <1 <1 <1 <1 <1 <1 <1 <1 <14.1.1.5.1 Untreated fruits, other <1 <1 <1 <1 <1 <1 <1 <1 <1 2 2 <14.1.1.5.2 Untreated vegetables, other 1 1 <1 <1 <1 <1 <1 <1 <1 4 4 <14.1.2.1 Surface treated citrus fruit <1 <1 <1 <1 <1 <1 <1 <1 <1 <1 <1 <1
4.1.2.2 Surface treated walnut & pecan nut kernels 0 0 0 0 0 0 0 0 0 0 0 0
4.1.3.2 Root & tuber vegetables 0 0 0 0 0 0 0 0 0 0 0 0
4.3.0.2 Preserved cherries (maraschino/ cocktail/ glace cherries) <1 <1 <1 <1 <1 <1 <1 <1 <1 <1 <1 <1
4.3.0.3 Tomato products pH <4.5 <1 <1 <1 <1 <1 <1 <1 <1 <1 <1 <1 <1
4.3.1Dried fruits & vegetables (excluding dried & rehydrated legumes and dried herbs & spices)
<1 <1 <1 <1 <1 <1 <1 <1 <1 <1 <1 <1
4.3.1.3.1 Dried & rehydrated legumes <1 <1 <1 <1 <1 <1 <1 <1 <1 <1 <1 <14.3.1.4 Dried herbs & spices <1 <1 <1 <1 <1 <1 <1 <1 <1 <1 <1 <14.3.3.1 Canned fruits <1 <1 <1 <1 <1 <1 <1 <1 <1 <1 <1 <14.3.3.2 Canned vegetables <1 <1 <1 <1 <1 <1 <1 <1 <1 <1 <1 <14.3.5 Candied fruits & vegetables <1 <1 <1 <1 <1 <1 <1 <1 <1 0 0 0
91

Table A3.3: Food contributors to L-carnitine dietary intakes for Australia, based on Day 1 and 2 of the 2011-12 NNPAS, for specific population groups
Food Code Food Group % Contribution
ElderlyPeople who consume
sports food/ beverages
People who consume Wt management/ meal
replacement productsPeople who don’t eat
meat
71 years and above 2 years and above 2 years and above 2 years and above
Bas
elin
e
Spor
ts fo
od in
crea
se
Con
sum
er B
ehav
iour
Bas
elin
e
Spor
ts fo
od in
crea
se
Con
sum
er B
ehav
iour
Bas
elin
e
Spor
ts fo
od in
crea
se
Con
sum
er B
ehav
iour
Bas
elin
e
Spor
ts fo
od in
crea
se
Con
sum
er B
ehav
iour
4.3.6.3 Nut butter <1 <1 <1 <1 <1 <1 <1 <1 <1 <1 <1 <14.3.6.5 Seed butter <1 <1 <1 <1 <1 <1 <1 <1 <1 <1 <1 <15 All Confectionery <1 <1 4 <1 <1 2 <1 <1 2 2 2 25.1 Chocolate & cocoa products <1 <1 2 <1 <1 1 <1 <1 2 2 2 2
5.2 Sugar confectionery (excluding bubble gum & chewing gum) 0 0 2 0 0 <1 0 0 <1 0 0 <1
5.2.1 Bubble gum & chewing gum 0 0 <1 0 0 <1 0 0 <1 0 0 06 All Cereals & cereal products <1 <1 12 <1 <1 4 <1 <1 4 2 2 14
6 Cereals & cereal products (excluding category 6 products listed below) <1 <1 <1 <1 <1 <1 <1 <1 <1 <1 <1 <1
6.1.1 Plain oats, dry <1 <1 12 <1 <1 3 <1 <1 4 <1 <1 146.1.2 Cereals, whole & broken grains, rice <1 <1 <1 <1 <1 <1 <1 <1 <1 <1 <1 <16.2.1 Flours, meals & starches, wheat only <1 <1 <1 <1 <1 <1 <1 <1 <1 <1 <1 <1
6.4 Flour products (including noodles & pasta) <1 <1 <1 <1 <1 <1 <1 <1 <1 <1 <1 <1
7 All Breads & bakery products <1 <1 <1 <1 <1 <1 <1 <1 <1 2 2 <17 Breads & bakery products <1 <1 <1 <1 <1 <1 <1 <1 <1 2 2 <1
8 All Meat & meat products (including poultry & game) 74 68 15 43 16 7 50 21 8 0 0 0
8.1.1 Poultry (excluding duck) 5 5 <1 4 2 <1 5 2 <1 0 0 08.1.1.2 Duck <1 <1 <1 <1 <1 <1 <1 <1 <1 0 0 08.1.2 Game meat 1 1 <1 2 <1 <1 2 <1 <1 0 0 08.1.3.2 Red meat, excluding game 57 52 11 31 11 5 37 16 6 0 0 08.1.3.3 White meat, excluding game and poultry 2 2 <1 1 <1 <1 1 <1 <1 0 0 08.1.4 Offal, all types <1 <1 <1 <1 <1 <1 <1 <1 <1 0 0 0
8.2Processed meat/ poultry/ game products in whole/ cut pieces (e.g. ham, bacon, smoked chicken)
5 4 <1 2 <1 <1 2 <1 <1 0 0 0
92

Table A3.3: Food contributors to L-carnitine dietary intakes for Australia, based on Day 1 and 2 of the 2011-12 NNPAS, for specific population groups
Food Code Food Group % Contribution
ElderlyPeople who consume
sports food/ beverages
People who consume Wt management/ meal
replacement productsPeople who don’t eat
meat
71 years and above 2 years and above 2 years and above 2 years and above
Bas
elin
e
Spor
ts fo
od in
crea
se
Con
sum
er B
ehav
iour
Bas
elin
e
Spor
ts fo
od in
crea
se
Con
sum
er B
ehav
iour
Bas
elin
e
Spor
ts fo
od in
crea
se
Con
sum
er B
ehav
iour
Bas
elin
e
Spor
ts fo
od in
crea
se
Con
sum
er B
ehav
iour
8.3 Processed comminuted meat, poultry & game products (e.g. salami) <1 <1 <1 <1 <1 <1 <1 <1 <1 0 0 0
8.3.2 Sausage & sausage meat 3 3 <1 2 <1 <1 2 <1 <1 0 0 09 All Fish & fish products 1 1 <1 <1 <1 <1 <1 <1 <1 0 0 0
9 Fish & fish products (excluding category 9 foods listed below) 1 <1 <1 <1 <1 <1 <1 <1 <1 0 0 0
9.1.2 Unprocessed crustacea <1 <1 <1 <1 <1 <1 <1 <1 <1 0 0 09.1.3 Molluscs <1 <1 <1 <1 <1 <1 <1 <1 <1 0 0 0
9.2.1 Processed fish & fish products, crustacea <1 <1 <1 <1 <1 <1 <1 <1 <1 0 0 0
9.3 Semi-preserved fish & fish products <1 <1 <1 <1 <1 <1 <1 <1 <1 0 0 0
9.4 Fully preserved fish including canned fish products <1 <1 <1 <1 <1 <1 <1 <1 <1 0 0 0
10 All Egg & egg products <1 <1 <1 <1 <1 <1 <1 <1 <1 <1 <1 <110 Egg & egg products <1 <1 <1 <1 <1 <1 <1 <1 <1 <1 <1 <112 All Salts & condiments <1 <1 <1 <1 <1 <1 <1 <1 <1 <1 <1 <112.5 Yeast & yeast products <1 <1 <1 <1 <1 <1 <1 <1 <1 <1 <1 <1
13 All Foods intended for particular dietary uses 3 10 4 44 80 40 37 73 42 4 4 4
13.1 Infant formula products 0 0 0 <1 <1 <1 <1 <1 <1 0 0 013.2.1 Infant cereal products 0 0 0 <1 <1 <1 0 0 0 0 0 013.2.2 Infant fruit 0 0 0 0 0 0 0 0 0 0 0 013.2.3 Infant dairy desserts 0 0 0 0 0 0 0 0 0 0 0 013.2.4 Infant gels & juices 0 0 0 0 0 0 0 0 0 0 0 0
13.3.1 Solid formula meal replacement & formulated supplementary foods <1 <1 <1 <1 <1 <1 <1 <1 2 0 0 0
13.3.2 Liquid formula meal replacement & formulated supplementary foods <1 <1 2 <1 <1 2 3 1 12 4 4 4
93

Table A3.3: Food contributors to L-carnitine dietary intakes for Australia, based on Day 1 and 2 of the 2011-12 NNPAS, for specific population groups
Food Code Food Group % Contribution
ElderlyPeople who consume
sports food/ beverages
People who consume Wt management/ meal
replacement productsPeople who don’t eat
meat
71 years and above 2 years and above 2 years and above 2 years and above
Bas
elin
e
Spor
ts fo
od in
crea
se
Con
sum
er B
ehav
iour
Bas
elin
e
Spor
ts fo
od in
crea
se
Con
sum
er B
ehav
iour
Bas
elin
e
Spor
ts fo
od in
crea
se
Con
sum
er B
ehav
iour
Bas
elin
e
Spor
ts fo
od in
crea
se
Con
sum
er B
ehav
iour
13.4.1 Solid formulated supplementary sports foods <1 5 <1 7 12 6 14 30 12 0 0 0
13.4.2 Liquid formulated supplementary sports foods 1 5 1 37 68 32 19 41 16 0 0 0
13.5 Toddler formula products (excluding soy based) 0 0 0 0 0 0 0 0 0 0 0 0
14 All Non-alcoholic & alcoholic beverages <1 <1 22 <1 <1 24 <1 <1 22 2 2 30
14.1.2 Fruit & vegetable juices & fruit & vegetable juice products <1 <1 8 <1 <1 4 <1 <1 4 <1 <1 2
14.1.2.1.1 Coconut milk, coconut cream & coconut syrup <1 <1 <1 <1 <1 <1 <1 <1 <1 0 0 0
14.1.3 Soft drinks (excluding intensely sweetened) 0 0 11 0 0 15 0 0 14 0 0 16
14.1.3.1.1.3 Energy drinks 0 0 <1 0 0 3 0 0 3 0 0 0
14.1.5Coffee (or substitute), tea, herbal infusion & similar (excluding caffeinated instant tea)
<1 <1 <1 <1 <1 <1 <1 <1 <1 <1 <1 <1
14.1.5.3.1.1 Tea, caffeinated, Instant 0 0 0 0 0 0 0 0 0 0 0 014.1.7 Soy beverage <1 <1 3 <1 <1 2 <1 <1 <1 <1 <1 1214.1.8 Cereal beverages <1 <1 <1 <1 <1 <1 <1 <1 <1 <1 <1 <1
14.2
Alcoholic beverages (including no & low alcohol) (excluding beer & related products wine, sparkling wine & fortified wine)
<1 <1 <1 <1 <1 <1 <1 <1 <1 <1 <1 <1
14.2.1 Beer & related products <1 <1 <1 <1 <1 <1 <1 <1 <1 1 1 <114.2.2 Wine, sparkling wine & fortified wine <1 <1 <1 <1 <1 <1 <1 <1 <1 <1 <1 <1
14.3 Alcoholic beverages not included in item 14.2 0 0 0 0 0 0 0 0 0 0 0 0
94

Table A3.3: Food contributors to L-carnitine dietary intakes for Australia, based on Day 1 and 2 of the 2011-12 NNPAS, for specific population groups
Food Code Food Group % Contribution
ElderlyPeople who consume
sports food/ beverages
People who consume Wt management/ meal
replacement productsPeople who don’t eat
meat
71 years and above 2 years and above 2 years and above 2 years and above
Bas
elin
e
Spor
ts fo
od in
crea
se
Con
sum
er B
ehav
iour
Bas
elin
e
Spor
ts fo
od in
crea
se
Con
sum
er B
ehav
iour
Bas
elin
e
Spor
ts fo
od in
crea
se
Con
sum
er B
ehav
iour
Bas
elin
e
Spor
ts fo
od in
crea
se
Con
sum
er B
ehav
iour
20 All Mixed Foods Commercial 26 12 10 32
20.1.1.5 Beverages, non-alcoholic, coffee, dry mix 3 <1 <1 3
20.3.1 Ready-to-eat mueslis 21 8 7 1920.3.2 Flavoured oat porridges, dry <1 <1 <1 020.2.2.3 Cereal products, bars 1 4 2 11
Note: Gray shading indicates that the food category / group is a major contributor to L-carnitine dietary intakes
95

Table A3.4: Food contributors to L-carnitine dietary intakes for Australia, based on Day 1 of the 2011-12 NNPAS for general population groups
Food Code Food Group 2-6 years 7-17 years 18-70 years 2 years and above
Bas
elin
e
Spor
ts fo
od
incr
ease
Con
sum
er
Beh
avio
ur
Bas
elin
e
Spor
ts fo
od
incr
ease
Con
sum
er
Beh
avio
ur
Bas
elin
e
Spor
ts fo
od
incr
ease
Con
sum
er
Beh
avio
ur
Bas
elin
e
Spor
ts fo
od
incr
ease
Con
sum
er
Beh
avio
ur
1 Dairy products (excluding butter & butter fats) 32 31 31 19 17 14 15 11 14 16 13 15
1 Plain milk 24 23 3 14 13 2 11 8 2 12 10 2
1.1.2 Liquid milk products & flavoured liquid milk 1 <1 4 1 1 5 <1 <1 4 <1 <1 4
1.2.1 Fermented & rennetted milk, unflavoured <1 <1 3 <1 <1 1 <1 <1 2 <1 <1 2
1.2.2 Fermented & rennetted milk products, flavoured 4 4 21 1 <1 6 <1 <1 6 1 <1 7
1.3 Condensed milk & evaporated milk <1 <1 <1 <1 <1 <1 <1 <1 <1 <1 <1 <11.4 Cream & cream products <1 <1 <1 <1 <1 <1 <1 <1 <1 <1 <1 <11.5.1 Dried milk, milk powder <1 <1 <1 <1 <1 <1 <1 <1 <1 <1 <1 <11.5.2 Dried cream powder <1 <1 <1 <1 <1 <1 <1 <1 <1 <1 <1 <11.5.3 Dried yoghurt powder 0 0 0 0 0 0 0 0 0 0 0 01.6 Cheese & cheese products 2 2 <1 1 1 <1 <1 <1 <1 1 <1 <12 All Edible oils & oil emulsions <1 <1 <1 <1 <1 <1 <1 <1 <1 <1 <1 <1
2.2Oil emulsions (water in oil) (excluding butter; butter products; and oil emulsions (<80% oil), dairy blends))
<1 <1 <1 <1 <1 <1 <1 <1 <1 <1 <1 <1
2.2.1.1 Butter <1 <1 <1 <1 <1 <1 <1 <1 <1 <1 <1 <12.2.1.2 Butter products <1 <1 <1 <1 <1 <1 <1 <1 <1 <1 <1 <12.2.2.2 Oil emulsions (<80% oil), dairy blends <1 <1 <1 <1 <1 <1 <1 <1 <1 <1 <1 <13 All Ice cream & edible ices 1 1 <1 2 1 <1 <1 <1 <1 <1 <1 <13.2 Ice cream 1 1 <1 2 1 <1 <1 <1 <1 <1 <1 <1
4 All Fruit & vegetables (including fungi/ nuts/ seeds/ herbs/ spices) 3 3 <1 2 2 <1 2 2 <1 2 2 <1
4Fruit & vegetables (including fungi/ nuts/ seeds/ herbs/ spices) (excluding category 4 foods listed below)
<1 <1 <1 <1 <1 <1 <1 <1 <1 <1 <1 <1
4.1.0.1 Grapes packed with permeable envelopes <1 <1 <1 <1 <1 <1 <1 <1 <1 <1 <1 <1
4.1.1.1 Untreated fruits & vegetables, fungi <1 <1 <1 <1 <1 <1 <1 <1 <1 <1 <1 <14.1.1.2 Untreated fruits & vegetables, nuts <1 <1 <1 <1 <1 <1 <1 <1 <1 <1 <1 <14.1.1.3 Untreated fruits & vegetables, seeds <1 <1 <1 <1 <1 <1 <1 <1 <1 <1 <1 <1
96

Table A3.4: Food contributors to L-carnitine dietary intakes for Australia, based on Day 1 of the 2011-12 NNPAS for general population groups
Food Code Food Group 2-6 years 7-17 years 18-70 years 2 years and above
Bas
elin
e
Spor
ts fo
od
incr
ease
Con
sum
er
Beh
avio
ur
Bas
elin
e
Spor
ts fo
od
incr
ease
Con
sum
er
Beh
avio
ur
Bas
elin
e
Spor
ts fo
od
incr
ease
Con
sum
er
Beh
avio
ur
Bas
elin
e
Spor
ts fo
od
incr
ease
Con
sum
er
Beh
avio
ur
4.1.1.4 Untreated fruits & vegetables, herbs <1 <1 <1 <1 <1 <1 <1 <1 <1 <1 <1 <14.1.1.5.1 Untreated fruits, other <1 <1 <1 <1 <1 <1 <1 <1 <1 <1 <1 <14.1.1.5.2 Untreated vegetables, other 1 1 <1 1 1 <1 1 1 <1 1 1 <14.1.2.1 Surface treated citrus fruit <1 <1 <1 <1 <1 <1 <1 <1 <1 <1 <1 <1
4.1.2.2 Surface treated walnut & pecan nut kernels 0 0 0 0 0 0 0 0 0 0 0 0
4.1.3.2 Root & tuber vegetables 0 0 0 0 0 0 0 0 0 0 0 0
4.3.0.2 Preserved cherries (maraschino/ cocktail/ glace cherries) <1 <1 <1 <1 <1 <1 <1 <1 <1 <1 <1 <1
4.3.0.3 Tomato products pH <4.5 <1 <1 <1 <1 <1 <1 <1 <1 <1 <1 <1 <1
4.3.1Dried fruits & vegetables (excluding dried & rehydrated legumes and dried herbs & spices)
<1 <1 <1 <1 <1 <1 <1 <1 <1 <1 <1 <1
4.3.1.3.1 Dried & rehydrated legumes <1 <1 <1 <1 <1 <1 <1 <1 <1 <1 <1 <14.3.1.4 Dried herbs & spices <1 <1 <1 <1 <1 <1 <1 <1 <1 <1 <1 <14.3.3.1 Canned fruits <1 <1 <1 <1 <1 <1 <1 <1 <1 <1 <1 <14.3.3.2 Canned vegetables <1 <1 <1 <1 <1 <1 <1 <1 <1 <1 <1 <14.3.5 Candied fruits & vegetables 0 0 0 0 0 0 <1 <1 <1 <1 <1 <14.3.6.3 Nut butter <1 <1 <1 <1 <1 <1 <1 <1 <1 <1 <1 <14.3.6.5 Seed butter <1 <1 <1 <1 <1 <1 <1 <1 <1 <1 <1 <15 All Confectionery 1 1 7 1 1 7 <1 <1 4 <1 <1 55.1 Chocolate & cocoa products 1 1 3 1 1 4 <1 <1 2 <1 <1 3
5.2 Sugar confectionery (excluding bubble gum & chewing gum) 0 0 3 0 0 3 0 0 2 0 0 2
5.2.1 Bubble gum & chewing gum 0 0 <1 0 0 <1 0 0 <1 0 0 <16 All Cereals & cereal products <1 <1 5 <1 <1 3 <1 <1 5 <1 <1 5
6 Cereals & cereal products (excluding category 6 products listed below) <1 <1 <1 <1 <1 <1 <1 <1 <1 <1 <1 <1
6.1.1 Plain oats, dry <1 <1 5 <1 <1 3 <1 <1 5 <1 <1 56.1.2 Cereals, whole & broken grains, rice <1 <1 <1 <1 <1 <1 <1 <1 <1 <1 <1 <16.2.1 Flours, meals & starches, wheat only <1 <1 <1 <1 <1 <1 <1 <1 <1 <1 <1 <1
6.4 Flour products (including noodles & pasta) <1 <1 <1 <1 <1 <1 <1 <1 <1 <1 <1 <1
7 All Breads & bakery products <1 <1 <1 <1 <1 <1 <1 <1 <1 <1 <1 <1
97

Table A3.4: Food contributors to L-carnitine dietary intakes for Australia, based on Day 1 of the 2011-12 NNPAS for general population groups
Food Code Food Group 2-6 years 7-17 years 18-70 years 2 years and above
Bas
elin
e
Spor
ts fo
od
incr
ease
Con
sum
er
Beh
avio
ur
Bas
elin
e
Spor
ts fo
od
incr
ease
Con
sum
er
Beh
avio
ur
Bas
elin
e
Spor
ts fo
od
incr
ease
Con
sum
er
Beh
avio
ur
Bas
elin
e
Spor
ts fo
od
incr
ease
Con
sum
er
Beh
avio
ur
7 Breads & bakery products <1 <1 <1 <1 <1 <1 <1 <1 <1 <1 <1 <1
8 All Meat & meat products (including poultry & game) 57 56 7 68 59 9 71 55 11 70 57 11
8.1.1 Poultry (excluding duck) 6 6 <1 6 5 <1 7 5 1 7 5 18.1.1.2 Duck <1 <1 <1 <1 <1 <1 <1 <1 <1 <1 <1 <18.1.2 Game meat <1 <1 <1 <1 <1 <1 <1 <1 <1 <1 <1 <18.1.3.2 Red meat, excluding game 39 38 5 50 43 7 53 41 8 52 42 8
8.1.3.3 White meat, excluding game and poultry <1 <1 <1 2 2 <1 2 2 <1 2 2 <1
8.1.4 Offal, all types <1 <1 <1 <1 <1 <1 <1 <1 <1 <1 <1 <1
8.2Processed meat/ poultry/ game products in whole/ cut pieces (e.g. ham, bacon, smoked chicken)
4 4 <1 4 4 <1 4 3 <1 4 3 <1
8.3 Processed comminuted meat, poultry & game products (e.g. salami) 2 2 <1 2 1 <1 <1 <1 <1 <1 <1 <1
8.3.2 Sausage & sausage meat 5 5 <1 4 3 <1 3 2 <1 3 2 <19 All Fish & fish products <1 <1 <1 <1 <1 <1 1 1 <1 1 <1 <1
9 Fish & fish products (excluding category 9 foods listed below) <1 <1 <1 <1 <1 <1 <1 <1 <1 <1 <1 <1
9.1.2 Unprocessed crustacea <1 <1 <1 <1 <1 <1 <1 <1 <1 <1 <1 <19.1.3 Molluscs <1 <1 <1 <1 <1 <1 <1 <1 <1 <1 <1 <1
9.2.1 Processed fish & fish products, crustacea <1 <1 <1 <1 <1 <1 <1 <1 <1 <1 <1 <1
9.3 Semi-preserved fish & fish products <1 <1 <1 <1 <1 <1 <1 <1 <1 <1 <1 <1
9.4 Fully preserved fish including canned fish products <1 <1 <1 <1 <1 <1 <1 <1 <1 <1 <1 <1
10 All Egg & egg products <1 <1 <1 <1 <1 <1 <1 <1 <1 <1 <1 <110 Egg & egg products <1 <1 <1 <1 <1 <1 <1 <1 <1 <1 <1 <112 All Salts & condiments <1 <1 <1 <1 <1 <1 <1 <1 <1 <1 <1 <112.5 Yeast & yeast products <1 <1 <1 <1 <1 <1 <1 <1 <1 <1 <1 <1
13 All Foods intended for particular dietary uses 3 5 5 5 18 7 8 28 8 7 25 7
13.1 Infant formula products <1 <1 <1 <1 <1 <1 0 0 0 <1 <1 <113.2.1 Infant cereal products <1 <1 <1 0 0 0 <1 <1 <1 <1 <1 <1
98

Table A3.4: Food contributors to L-carnitine dietary intakes for Australia, based on Day 1 of the 2011-12 NNPAS for general population groups
Food Code Food Group 2-6 years 7-17 years 18-70 years 2 years and above
Bas
elin
e
Spor
ts fo
od
incr
ease
Con
sum
er
Beh
avio
ur
Bas
elin
e
Spor
ts fo
od
incr
ease
Con
sum
er
Beh
avio
ur
Bas
elin
e
Spor
ts fo
od
incr
ease
Con
sum
er
Beh
avio
ur
Bas
elin
e
Spor
ts fo
od
incr
ease
Con
sum
er
Beh
avio
ur
13.2.2 Infant fruit <1 <1 <1 0 0 0 <1 <1 <1 <1 <1 <113.2.3 Infant dairy desserts <1 <1 <1 0 0 0 0 0 0 <1 <1 <113.2.4 Infant gels & juices <1 <1 <1 0 0 0 <1 <1 <1 <1 <1 <1
13.3.1 Solid formula meal replacement & formulated supplementary foods <1 <1 <1 <1 <1 <1 <1 <1 <1 <1 <1 <1
13.3.2 Liquid formula meal replacement & formulated supplementary foods 2 2 5 1 1 4 <1 <1 2 <1 <1 3
13.4.1 Solid formulated supplementary sports foods <1 <1 <1 <1 <1 <1 <1 3 <1 <1 3 <1
13.4.2 Liquid formulated supplementary sports foods <1 3 <1 4 16 2 6 25 5 5 22 4
13.5 Toddler formula products (excluding soy based) <1 <1 <1 0 0 0 0 0 0 <1 <1 <1
14 All Non-alcoholic & alcoholic beverages <1 <1 27 <1 <1 43 <1 <1 38 <1 <1 38
14.1.2 Fruit & vegetable juices & fruit & vegetable juice products <1 <1 15 <1 <1 11 <1 <1 7 <1 <1 8
14.1.2.1.1 Coconut milk, coconut cream & coconut syrup <1 <1 <1 <1 <1 <1 <1 <1 <1 <1 <1 <1
14.1.3 Soft drinks (excluding intensely sweetened) 0 0 9 0 0 30 0 0 26 0 0 25
14.1.3.1.1.3 Energy drinks 0 0 0 0 0 1 0 0 3 0 0 3
14.1.5Coffee (or substitute), tea, herbal infusion & similar (excluding caffeinated instant tea)
<1 <1 <1 <1 <1 <1 <1 <1 <1 <1 <1 <1
14.1.5.3.1.1 Tea, caffeinated, Instant 0 0 0 0 0 0 0 0 0 0 0 014.1.7 Soy beverage <1 <1 2 <1 <1 <1 <1 <1 2 <1 <1 214.1.8 Cereal beverages <1 <1 <1 <1 <1 <1 <1 <1 <1 <1 <1 <1
14.2
Alcoholic beverages (including no & low alcohol) (excluding beer & related products wine, sparkling wine & fortified wine)
<1 <1 <1 <1 <1 <1 <1 <1 <1 <1 <1 <1
14.2.1 Beer & related products 0 0 0 <1 <1 <1 <1 <1 <1 <1 <1 <114.2.2 Wine, sparkling wine & fortified wine <1 <1 <1 <1 <1 <1 <1 <1 <1 <1 <1 <1
99
Table A3.4: Food contributors to L-carnitine dietary intakes for Australia, based on Day 1 of the 2011-12 NNPAS for general population groups
Food Code Food Group 2-6 years 7-17 years 18-70 years 2 years and above
Bas
elin
e
Spor
ts fo
od
incr
ease
Con
sum
er
Beh
avio
ur
Bas
elin
e
Spor
ts fo
od
incr
ease
Con
sum
er
Beh
avio
ur
Bas
elin
e
Spor
ts fo
od
incr
ease
Con
sum
er
Beh
avio
ur
Bas
elin
e
Spor
ts fo
od
incr
ease
Con
sum
er
Beh
avio
ur
14.3 Alcoholic beverages not included in item 14.2 0 0 0 0 0 0 0 0 0 0 0 0
20 All Mixed Foods Commercial 17 17 18 18
20.1.1.5 Beverages, non-alcoholic, coffee, dry mix 0 <1 1 1
20.3.1 Ready-to-eat mueslis 3 4 12 1120.3.2 Flavoured oat porridges, dry <1 <1 <1 <120.2.2.3 Cereal products, bars 13 12 5 6
Note: Gray shading indicates that the food category / group is a major contributor to L-carnitine dietary intakes
100

Table A3.5: Food contributors to L-carnitine dietary intakes for Australia, based on Day 1 of the 2011-12 NNPAS for special population groups
Food Code Food Group Elderly People who consume sports food/ beverages
People who consume Wt management/ meal replacement products
People who don’t eat meat
71 years and above 2 years and above 2 years and above 2 years and above
Bas
elin
e
Spor
ts fo
od
incr
ease
Con
sum
er
Beh
avio
ur
Bas
elin
e
Spor
ts fo
od
incr
ease
Con
sum
er
Beh
avio
ur
Bas
elin
e
Spor
ts fo
od
incr
ease
Con
sum
er
Beh
avio
ur
Bas
elin
e
Spor
ts fo
od
incr
ease
Con
sum
er
Beh
avio
ur
1 Dairy products (excluding butter & butter fats) 17 17 15 7 2 7 8 3 8 59 38 15
1 Plain milk 14 13 3 5 2 <1 6 2 1 46 30 21.1.2 Liquid milk products & flavoured liquid milk <1 <1 2 <1 <1 2 <1 <1 1 2 1 21.2.1 Fermented & rennetted milk, unflavoured <1 <1 2 <1 <1 <1 <1 <1 1 1 <1 3
1.2.2 Fermented & rennetted milk products, flavoured <1 <1 8 <1 <1 4 <1 <1 5 4 3 8
1.3 Condensed milk & evaporated milk <1 <1 <1 <1 <1 <1 <1 <1 <1 <1 <1 <11.4 Cream & cream products <1 <1 <1 <1 <1 <1 <1 <1 <1 <1 <1 <11.5.1 Dried milk, milk powder <1 <1 <1 <1 <1 <1 <1 <1 <1 1 <1 <11.5.2 Dried cream powder <1 <1 <1 <1 <1 <1 <1 <1 <1 <1 <1 <11.5.3 Dried yoghurt powder 0 0 0 0 0 0 0 0 0 0 0 01.6 Cheese & cheese products <1 <1 <1 <1 <1 <1 <1 <1 <1 4 3 <12 All Edible oils & oil emulsions <1 <1 <1 <1 <1 <1 <1 <1 <1 <1 <1 <1
2.2Oil emulsions (water in oil) (excluding butter; butter products; and oil emulsions (<80% oil), dairy blends))
<1 <1 <1 <1 <1 <1 <1 <1 <1 <1 <1 <1
2.2.1.1 Butter <1 <1 <1 <1 <1 <1 <1 <1 <1 <1 <1 <12.2.1.2 Butter products <1 <1 <1 <1 <1 <1 <1 <1 <1 0 0 02.2.2.2 Oil emulsions (<80% oil), dairy blends <1 <1 <1 <1 <1 <1 <1 <1 <1 <1 <1 <13 All Ice cream & edible ices 1 1 <1 <1 <1 <1 <1 <1 <1 2 2 <13.2 Ice cream 1 1 <1 <1 <1 <1 <1 <1 <1 2 2 <1
4 All Fruit & vegetables (including fungi/ nuts/ seeds/ herbs/ spices) 3 3 <1 <1 <1 <1 1 <1 <1 9 6 <1
4Fruit & vegetables (including fungi/ nuts/ seeds/ herbs/ spices) (excluding category 4 foods listed below)
<1 <1 <1 <1 <1 <1 <1 <1 <1 <1 <1 <1
4.1.0.1 Grapes packed with permeable envelopes <1 <1 <1 <1 <1 <1 <1 <1 <1 <1 <1 <14.1.1.1 Untreated fruits & vegetables, fungi <1 <1 <1 <1 <1 <1 <1 <1 <1 <1 <1 <14.1.1.2 Untreated fruits & vegetables, nuts <1 <1 <1 <1 <1 <1 <1 <1 <1 <1 <1 <14.1.1.3 Untreated fruits & vegetables, seeds <1 <1 <1 <1 <1 <1 <1 <1 <1 <1 <1 <1
101

Table A3.5: Food contributors to L-carnitine dietary intakes for Australia, based on Day 1 of the 2011-12 NNPAS for special population groups
Food Code Food Group Elderly People who consume sports food/ beverages
People who consume Wt management/ meal replacement products
People who don’t eat meat
71 years and above 2 years and above 2 years and above 2 years and above
Bas
elin
e
Spor
ts fo
od
incr
ease
Con
sum
er
Beh
avio
ur
Bas
elin
e
Spor
ts fo
od
incr
ease
Con
sum
er
Beh
avio
ur
Bas
elin
e
Spor
ts fo
od
incr
ease
Con
sum
er
Beh
avio
ur
Bas
elin
e
Spor
ts fo
od
incr
ease
Con
sum
er
Beh
avio
ur
4.1.1.4 Untreated fruits & vegetables, herbs <1 <1 <1 <1 <1 <1 <1 <1 <1 <1 <1 <14.1.1.5.1 Untreated fruits, other <1 <1 <1 <1 <1 <1 <1 <1 <1 1 <1 <14.1.1.5.2 Untreated vegetables, other 1 1 <1 <1 <1 <1 <1 <1 <1 4 2 <14.1.2.1 Surface treated citrus fruit <1 <1 <1 <1 <1 <1 <1 <1 <1 <1 <1 <14.1.2.2 Surface treated walnut & pecan nut kernels 0 0 0 0 0 0 0 0 0 0 0 04.1.3.2 Root & tuber vegetables 0 0 0 0 0 0 0 0 0 0 0 0
4.3.0.2 Preserved cherries (maraschino/ cocktail/ glace cherries) <1 <1 <1 <1 <1 <1 0 0 0 <1 <1 <1
4.3.0.3 Tomato products pH <4.5 <1 <1 <1 <1 <1 <1 <1 <1 <1 <1 <1 <1
4.3.1Dried fruits & vegetables (excluding dried & rehydrated legumes and dried herbs & spices)
<1 <1 <1 <1 <1 <1 <1 <1 <1 <1 <1 <1
4.3.1.3.1 Dried & rehydrated legumes <1 <1 <1 <1 <1 <1 <1 <1 <1 <1 <1 <14.3.1.4 Dried herbs & spices <1 <1 <1 <1 <1 <1 <1 <1 <1 <1 <1 <14.3.3.1 Canned fruits <1 <1 <1 <1 <1 <1 <1 <1 <1 <1 <1 <14.3.3.2 Canned vegetables <1 <1 <1 <1 <1 <1 <1 <1 <1 <1 <1 <14.3.5 Candied fruits & vegetables <1 <1 <1 0 0 0 0 0 0 0 0 04.3.6.3 Nut butter <1 <1 <1 <1 <1 <1 <1 <1 <1 <1 <1 <14.3.6.5 Seed butter <1 <1 <1 <1 <1 <1 <1 <1 <1 <1 <1 <15 All Confectionery <1 <1 5 <1 <1 2 <1 <1 2 3 2 35.1 Chocolate & cocoa products <1 <1 2 <1 <1 1 <1 <1 1 3 2 3
5.2 Sugar confectionery (excluding bubble gum & chewing gum) 0 0 3 0 0 1 0 0 1 0 0 <1
5.2.1 Bubble gum & chewing gum 0 0 <1 0 0 <1 0 0 <1 0 0 06 All Cereals & cereal products <1 <1 13 <1 <1 3 <1 <1 4 2 2 7
6 Cereals & cereal products (excluding category 6 products listed below) <1 <1 <1 <1 <1 <1 <1 <1 <1 <1 <1 <1
6.1.1 Plain oats, dry <1 <1 13 <1 <1 3 <1 <1 4 <1 <1 76.1.2 Cereals, whole & broken grains, rice <1 <1 <1 <1 <1 <1 <1 <1 <1 <1 <1 <16.2.1 Flours, meals & starches, wheat only <1 <1 <1 <1 <1 <1 <1 <1 <1 <1 <1 <16.4 Flour products (including noodles & pasta) <1 <1 <1 <1 <1 <1 <1 <1 <1 <1 <1 <1
102
Table A3.5: Food contributors to L-carnitine dietary intakes for Australia, based on Day 1 of the 2011-12 NNPAS for special population groups
Food Code Food Group Elderly People who consume sports food/ beverages
People who consume Wt management/ meal replacement products
People who don’t eat meat
71 years and above 2 years and above 2 years and above 2 years and above
Bas
elin
e
Spor
ts fo
od
incr
ease
Con
sum
er
Beh
avio
ur
Bas
elin
e
Spor
ts fo
od
incr
ease
Con
sum
er
Beh
avio
ur
Bas
elin
e
Spor
ts fo
od
incr
ease
Con
sum
er
Beh
avio
ur
Bas
elin
e
Spor
ts fo
od
incr
ease
Con
sum
er
Beh
avio
ur
7 All Breads & bakery products <1 <1 <1 <1 <1 <1 <1 <1 <1 2 <1 <17 Breads & bakery products <1 <1 <1 <1 <1 <1 <1 <1 <1 2 <1 <1
8 All Meat & meat products (including poultry & game) 74 71 15 33 10 6 40 14 7 0 0 0
8.1.1 Poultry (excluding duck) 6 5 1 3 <1 <1 5 2 <1 0 0 08.1.1.2 Duck <1 <1 <1 0 0 0 0 0 0 0 0 08.1.2 Game meat <1 <1 <1 <1 <1 <1 0 0 0 0 0 08.1.3.2 Red meat, excluding game 57 55 11 25 8 5 32 11 5 0 0 08.1.3.3 White meat, excluding game and poultry 2 2 <1 <1 <1 <1 <1 <1 <1 0 0 08.1.4 Offal, all types <1 <1 <1 <1 <1 <1 <1 <1 <1 0 0 0
8.2Processed meat/ poultry/ game products in whole/ cut pieces (e.g. ham, bacon, smoked chicken)
5 5 <1 2 <1 <1 1 <1 <1 0 0 0
8.3 Processed comminuted meat, poultry & game products (e.g. salami) <1 <1 <1 <1 <1 <1 <1 <1 <1 0 0 0
8.3.2 Sausage & sausage meat 3 3 <1 2 <1 <1 <1 <1 <1 0 0 09 All Fish & fish products 2 1 <1 <1 <1 <1 <1 <1 <1 0 0 0
9 Fish & fish products (excluding category 9 foods listed below) 1 <1 <1 <1 <1 <1 <1 <1 <1 0 0 0
9.1.2 Unprocessed crustacea <1 <1 <1 <1 <1 <1 <1 <1 <1 0 0 09.1.3 Molluscs <1 <1 <1 <1 <1 <1 <1 <1 <1 0 0 09.2.1 Processed fish & fish products, crustacea <1 <1 <1 <1 <1 <1 <1 <1 <1 0 0 09.3 Semi-preserved fish & fish products <1 <1 <1 <1 <1 <1 <1 <1 <1 0 0 0
9.4 Fully preserved fish including canned fish products <1 <1 <1 <1 <1 <1 <1 <1 <1 0 0 0
10 All Egg & egg products <1 <1 <1 <1 <1 <1 <1 <1 <1 <1 <1 <110 Egg & egg products <1 <1 <1 <1 <1 <1 <1 <1 <1 <1 <1 <112 All Salts & condiments <1 <1 <1 <1 <1 <1 <1 <1 <1 <1 <1 <112.5 Yeast & yeast products <1 <1 <1 <1 <1 <1 <1 <1 <1 <1 <1 <1
13 All Foods intended for particular dietary uses 2 5 4 57 87 53 49 81 53 21 49 10
103

Table A3.5: Food contributors to L-carnitine dietary intakes for Australia, based on Day 1 of the 2011-12 NNPAS for special population groups
Food Code Food Group Elderly People who consume sports food/ beverages
People who consume Wt management/ meal replacement products
People who don’t eat meat
71 years and above 2 years and above 2 years and above 2 years and above
Bas
elin
e
Spor
ts fo
od
incr
ease
Con
sum
er
Beh
avio
ur
Bas
elin
e
Spor
ts fo
od
incr
ease
Con
sum
er
Beh
avio
ur
Bas
elin
e
Spor
ts fo
od
incr
ease
Con
sum
er
Beh
avio
ur
Bas
elin
e
Spor
ts fo
od
incr
ease
Con
sum
er
Beh
avio
ur
13.1 Infant formula products 0 0 0 0 0 0 0 0 0 <1 <1 <113.2.1 Infant cereal products 0 0 0 <1 <1 <1 0 0 0 0 0 013.2.2 Infant fruit 0 0 0 0 0 0 0 0 0 0 0 013.2.3 Infant dairy desserts 0 0 0 0 0 0 0 0 0 0 0 013.2.4 Infant gels & juices 0 0 0 0 0 0 0 0 0 0 0 0
13.3.1 Solid formula meal replacement & formulated supplementary foods <1 <1 <1 <1 <1 <1 <1 <1 4 3 2 3
13.3.2 Liquid formula meal replacement & formulated supplementary foods <1 <1 3 <1 <1 1 3 1 13 4 2 4
13.4.1 Solid formulated supplementary sports foods <1 3 <1 7 10 6 18 32 15 <1 <1 <1
13.4.2 Liquid formulated supplementary sports foods <1 1 <1 50 76 45 27 48 22 14 44 3
13.5 Toddler formula products (excluding soy based) 0 0 0 0 0 0 0 0 0 0 0 0
14 All Non-alcoholic & alcoholic beverages <1 <1 23 <1 <1 18 <1 <1 18 <1 <1 34
14.1.2 Fruit & vegetable juices & fruit & vegetable juice products <1 <1 9 <1 <1 3 <1 <1 3 <1 <1 8
14.1.2.1.1 Coconut milk, coconut cream & coconut syrup <1 <1 <1 <1 <1 <1 <1 <1 <1 <1 <1 <1
14.1.3 Soft drinks (excluding intensely sweetened) 0 0 12 0 0 12 0 0 11 0 0 1714.1.3.1.1.3 Energy drinks 0 0 <1 0 0 2 0 0 2 0 0 3
14.1.5 Coffee (or substitute), tea, herbal infusion & similar (excluding caffeinated instant tea) <1 <1 <1 <1 <1 <1 <1 <1 <1 <1 <1 <1
14.1.5.3.1.1 Tea, caffeinated, Instant 0 0 0 0 0 0 0 0 0 0 0 0
14.1.7 Soy beverage <1 <1 3 <1 <1 1 <1 <1 1 <1 <1 614.1.8 Cereal beverages <1 <1 <1 <1 <1 <1 <1 <1 <1 <1 <1 <1
104

Table A3.5: Food contributors to L-carnitine dietary intakes for Australia, based on Day 1 of the 2011-12 NNPAS for special population groups
Food Code Food Group Elderly People who consume sports food/ beverages
People who consume Wt management/ meal replacement products
People who don’t eat meat
71 years and above 2 years and above 2 years and above 2 years and above
Bas
elin
e
Spor
ts fo
od
incr
ease
Con
sum
er
Beh
avio
ur
Bas
elin
e
Spor
ts fo
od
incr
ease
Con
sum
er
Beh
avio
ur
Bas
elin
e
Spor
ts fo
od
incr
ease
Con
sum
er
Beh
avio
ur
Bas
elin
e
Spor
ts fo
od
incr
ease
Con
sum
er
Beh
avio
ur
14.2Alcoholic beverages (including no & low alcohol) (excluding beer & related products wine, sparkling wine & fortified wine)
<1 <1 <1 <1 <1 <1 <1 <1 <1 <1 <1 <1
14.2.1 Beer & related products <1 <1 <1 <1 <1 <1 <1 <1 <1 <1 <1 <114.2.2 Wine, sparkling wine & fortified wine <1 <1 <1 <1 <1 <1 <1 <1 <1 <1 <1 <1
14.3 Alcoholic beverages not included in item 14.2 0 0 0 0 0 0 0 0 0 0 0 0
20 All Mixed Foods Commercial 24 10 7 3120.1.1.5 Beverages, non-alcoholic, coffee, dry mix 3 <1 <1 220.3.1 Ready-to-eat muesli 18 5 4 2020.3.2 Flavoured oat porridges, dry <1 <1 <1 020.2.2.3 Cereal products, bars 1 4 3 9
Note: Gray shading indicates that the food category / group is a major contributor to L-carnitine dietary intakes
105

Table A3.6: Food contributors to L-carnitine dietary intakes for New Zealand, based on Day 1 of the NNSs for general population groups*
Food Code Food Group 5-14 years 18-70 years 15 years and above
Bas
elin
e
Spor
ts fo
od
incr
ease
Con
sum
er
Beh
avio
ur
Bas
elin
e
Spor
ts fo
od
incr
ease
Con
sum
er
Beh
avio
ur
Bas
elin
e
Spor
ts fo
od
incr
ease
Con
sum
er
Beh
avio
ur
1 Dairy products (excluding butter & butter fats) 17 17 18 14 14 17 14 14 171 Plain milk 14 14 2 10 10 1 10 10 11.1.2 Liquid milk products & flavoured liquid milk 1 1 10 1 1 8 1 1 81.2.1 Fermented & rennetted milk, unflavoured <1 <1 <1 <1 <1 2 <1 <1 21.2.2 Fermented & rennetted milk products, flavoured <1 <1 5 <1 <1 6 <1 <1 61.3 Condensed milk & evaporated milk <1 <1 <1 <1 <1 <1 <1 <1 <11.4 Cream & cream products <1 <1 <1 <1 <1 <1 <1 <1 <11.5.1 Dried milk, milk powder <1 <1 <1 <1 <1 <1 <1 <1 <11.5.2 Dried cream powder <1 <1 <1 <1 <1 <1 <1 <1 <11.5.3 Dried yoghurt powder <1 <1 0 <1 <1 <1 <1 <1 <11.6 Cheese & cheese products <1 <1 <1 <1 <1 <1 <1 <1 <12 All Edible oils & oil emulsions <1 <1 <1 <1 <1 <1 <1 <1 <1
2.2Oil emulsions (water in oil) (excluding butter; butter products; and oil emulsions (<80% oil), dairy blends))
<1 <1 <1 <1 <1 <1 <1 <1 <1
2.2.1.1 Butter <1 <1 <1 <1 <1 <1 <1 <1 <12.2.1.2 Butter products <1 <1 <1 0 0 0 0 0 02.2.2.2 Oil emulsions (<80% oil), dairy blends <1 <1 <1 <1 <1 <1 <1 <1 <13 All Ice cream & edible ices 1 1 <1 <1 <1 <1 <1 <1 <13.2 Ice cream 1 1 <1 <1 <1 <1 <1 <1 <1
4 All Fruit & vegetables (including fungi/ nuts/ seeds/ herbs/ spices) 2 2 <1 2 2 <1 2 2 <1
4Fruit & vegetables (including fungi/ nuts/ seeds/ herbs/ spices) (excluding category 4 foods listed below)
<1 <1 <1 <1 <1 <1 <1 <1 <1
4.1.0.1 Grapes packed with permeable envelopes <1 <1 <1 <1 <1 <1 <1 <1 <14.1.1.1 Untreated fruits & vegetables, fungi <1 <1 <1 <1 <1 <1 <1 <1 <14.1.1.2 Untreated fruits & vegetables, nuts <1 <1 <1 <1 <1 <1 <1 <1 <14.1.1.3 Untreated fruits & vegetables, seeds <1 <1 <1 <1 <1 <1 <1 <1 <14.1.1.4 Untreated fruits & vegetables, herbs <1 <1 <1 <1 <1 <1 <1 <1 <14.1.1.5.1 Untreated fruits, other <1 <1 <1 <1 <1 <1 <1 <1 <14.1.1.5.2 Untreated vegetables, other <1 <1 <1 1 1 <1 1 1 <14.1.2.1 Surface treated citrus fruit 0 0 0 0 0 0 0 0 04.1.2.2 Surface treated walnut & pecan nut kernels 0 0 0 0 0 0 0 0 0
106

Table A3.6: Food contributors to L-carnitine dietary intakes for New Zealand, based on Day 1 of the NNSs for general population groups*
Food Code Food Group 5-14 years 18-70 years 15 years and above
Bas
elin
e
Spor
ts fo
od
incr
ease
Con
sum
er
Beh
avio
ur
Bas
elin
e
Spor
ts fo
od
incr
ease
Con
sum
er
Beh
avio
ur
Bas
elin
e
Spor
ts fo
od
incr
ease
Con
sum
er
Beh
avio
ur
4.1.3.2 Root & tuber vegetables <1 <1 <1 <1 <1 <1 <1 <1 <1
4.3.0.2 Preserved cherries (maraschino/ cocktail/ glace cherries) <1 <1 <1 <1 <1 <1 <1 <1 <1
4.3.0.3 Tomato products pH <4.5 0 0 0 0 0 0 0 0 0
4.3.1 Dried fruits & vegetables (excluding dried & rehydrated legumes and dried herbs & spices) <1 <1 <1 <1 <1 <1 <1 <1 <1
4.3.1.3.1 Dried & rehydrated legumes <1 <1 <1 <1 <1 <1 <1 <1 <14.3.1.4 Dried herbs & spices <1 <1 <1 <1 <1 <1 <1 <1 <14.3.3.1 Canned fruits <1 <1 <1 <1 <1 <1 <1 <1 <14.3.3.2 Canned vegetables <1 <1 <1 <1 <1 <1 <1 <1 <14.3.5 Candied fruits & vegetables <1 <1 <1 <1 <1 <1 <1 <1 <14.3.6.3 Nut butter <1 <1 <1 <1 <1 <1 <1 <1 <14.3.6.5 Seed butter <1 <1 <1 <1 <1 <1 <1 <1 <15 All Confectionery 2 2 14 <1 <1 6 <1 <1 65.1 Chocolate & cocoa products 2 2 5 <1 <1 3 <1 <1 2
5.2 Sugar confectionery (excluding bubble gum & chewing gum) 0 0 8 0 0 3 0 0 3
5.2.1 Bubble gum & chewing gum 0 0 1 0 0 <1 0 0 <16 All Cereals & cereal products <1 <1 3 <1 <1 5 <1 <1 5
6 Cereals & cereal products (excluding category 6 products listed below) <1 <1 <1 <1 <1 <1 <1 <1 <1
6.1.1 Plain oats, dry <1 <1 2 <1 <1 5 <1 <1 56.1.2 Cereals, whole & broken grains, rice <1 <1 <1 <1 <1 <1 <1 <1 <16.2.1 Flours, meals & starches, wheat only <1 <1 <1 <1 <1 <1 <1 <1 <16.4 Flour products (including noodles & pasta) <1 <1 <1 <1 <1 <1 <1 <1 <17 All Breads & bakery products <1 <1 <1 <1 <1 <1 <1 <1 <17 Breads & bakery products <1 <1 <1 <1 <1 <1 <1 <1 <18 All Meat & meat products (including poultry & game) 73 73 10 78 77 12 78 77 128.1.1 Poultry (excluding duck) 5 5 <1 5 5 <1 5 5 <18.1.1.2 Duck 0 0 0 <1 <1 <1 <1 <1 <18.1.2 Game meat 5 5 <1 8 7 1 7 7 18.1.3.2 Red meat, excluding game 50 50 7 52 51 8 52 51 88.1.3.3 White meat, excluding game and poultry 1 1 <1 3 3 <1 3 3 <18.1.4 Offal, all types <1 <1 <1 <1 <1 <1 <1 <1 <1
107

Table A3.6: Food contributors to L-carnitine dietary intakes for New Zealand, based on Day 1 of the NNSs for general population groups*
Food Code Food Group 5-14 years 18-70 years 15 years and above
Bas
elin
e
Spor
ts fo
od
incr
ease
Con
sum
er
Beh
avio
ur
Bas
elin
e
Spor
ts fo
od
incr
ease
Con
sum
er
Beh
avio
ur
Bas
elin
e
Spor
ts fo
od
incr
ease
Con
sum
er
Beh
avio
ur
8.2Processed meat/ poultry/ game products in whole/ cut pieces (e.g. ham, bacon, smoked chicken)
4 4 <1 5 5 <1 5 5 <1
8.3 Processed comminuted meat, poultry & game products (e.g. salami) 3 3 <1 2 2 <1 2 1 <1
8.3.2 Sausage & sausage meat 5 5 <1 4 4 <1 4 4 <19 All Fish & fish products <1 <1 <1 1 1 <1 1 1 <1
9 Fish & fish products (excluding category 9 foods listed below) <1 <1 <1 <1 <1 <1 <1 <1 <1
9.1.2 Unprocessed crustacea <1 <1 <1 <1 <1 <1 <1 <1 <19.1.3 Molluscs <1 <1 <1 <1 <1 <1 <1 <1 <19.2.1 Processed fish & fish products, crustacea <1 <1 <1 0 0 0 0 0 09.3 Semi-preserved fish & fish products <1 <1 <1 <1 <1 <1 <1 <1 <1
9.4 Fully preserved fish including canned fish products <1 <1 <1 <1 <1 <1 <1 <1 <1
10 All Egg & egg products <1 <1 <1 <1 <1 <1 <1 <1 <110 Egg & egg products <1 <1 <1 <1 <1 <1 <1 <1 <112 All Salts & condiments <1 <1 <1 <1 <1 <1 <1 <1 <112.5 Yeast & yeast products <1 <1 <1 <1 <1 <1 <1 <1 <113 All Foods intended for particular dietary uses 1 1 4 1 3 2 1 3 213.1 Infant formula products 0 0 0 0 0 0 0 0 013.2.1 Infant cereal products 0 0 0 0 0 0 0 0 013.2.2 Infant fruit 0 0 0 0 0 0 <1 <1 <113.2.3 Infant dairy desserts 0 0 0 0 0 0 0 0 013.2.4 Infant gels & juices 0 0 0 0 0 0 0 0 0
13.3.1 Solid formula meal replacement & formulated supplementary foods 0 0 0 <1 <1 <1 <1 <1 <1
13.3.2 Liquid formula meal replacement & formulated supplementary foods 1 1 4 <1 <1 2 <1 <1 2
13.4.1 Solid formulated supplementary sports foods 0 0 0 <1 <1 <1 <1 <1 <113.4.2 Liquid formulated supplementary sports foods 0 0 0 <1 2 <1 <1 2 <113.5 Toddler formula products (excluding soy based) 0 0 0 0 0 0 0 0 014 All Non-alcoholic & alcoholic beverages <1 <1 33 <1 <1 39 <1 <1 39
108

Table A3.6: Food contributors to L-carnitine dietary intakes for New Zealand, based on Day 1 of the NNSs for general population groups*
Food Code Food Group 5-14 years 18-70 years 15 years and above
Bas
elin
e
Spor
ts fo
od
incr
ease
Con
sum
er
Beh
avio
ur
Bas
elin
e
Spor
ts fo
od
incr
ease
Con
sum
er
Beh
avio
ur
Bas
elin
e
Spor
ts fo
od
incr
ease
Con
sum
er
Beh
avio
ur
14.1.2 Fruit & vegetable juices & fruit & vegetable juice products <1 <1 6 <1 <1 5 <1 <1 5
14.1.2.1.1 Coconut milk, coconut cream & coconut syrup <1 <1 <1 <1 <1 <1 <1 <1 <114.1.3 Soft drinks (intensely sweetened soft drinks) 0 0 25 0 0 26 0 0 2614.1.3.1.1.3 Energy drinks 0 0 1 0 0 7 0 0 6
14.1.5 Coffee (or substitute), tea, herbal infusion & similar (excluding caffeinated instant tea) <1 <1 <1 <1 <1 <1 <1 <1 <1
14.1.5.3.1.1 Tea, caffeinated, Instant 0 0 0 0 0 0 0 0 014.1.7 Soy beverage <1 <1 <1 <1 <1 1 <1 <1 114.1.8 Cereal beverages <1 <1 <1 <1 <1 <1 <1 <1 <1
14.2Alcoholic beverages (including no & low alcohol) (excluding beer & related products wine, sparkling wine & fortified wine)
<1 <1 <1 <1 <1 <1 <1 <1 <1
14.2.1 Beer & related products 0 0 0 <1 <1 <1 <1 <1 <114.2.2 Wine, sparkling wine & fortified wine <1 <1 <1 <1 <1 <1 <1 <1 <114.3 Alcoholic beverages not included in item 14.2 0 0 0 0 0 0 0 0 020 All Mixed Foods Commercial 18 19 1820.1.1.5 Beverages, non-alcoholic, coffee, dry mix <1 1 <120.3.1 Ready-to-eat muesli 3 10 1020.3.2 Flavoured oat porridges, dry 0 <1 <120.2.2.3 Cereal products, bars 15 7 7
* 2002 New Zealand National Children’s Nutrition Survey (2002 NZNNS) 5-14 years; 2008/09 New Zealand Adult Nutrition Survey (2008 NZANS) 15 years and above.
109

Table A3.7: Food contributors to L-carnitine dietary intakes for New Zealand, based on Day 1 of the NNSs for specific population groups₼
Food Code Food Group Elderly People who consume sports food/ beverages
People who consume Wt management/ meal
replacement productsPeople who don’t eat
meat
71 years and above 15 years and above 15 years and above 15 years and above
Bas
elin
e
Spor
ts fo
od
incr
ease
Con
sum
er
Beh
avio
ur
Bas
elin
e
Spor
ts fo
od
incr
ease
Con
sum
er
Beh
avio
ur
Bas
elin
e
Spor
ts fo
od
incr
ease
Con
sum
er
Beh
avio
ur
Bas
elin
e
Spor
ts fo
od
incr
ease
Con
sum
er
Beh
avio
ur
1 Dairy products (excluding butter & butter fats) 17 17 29 17 8 15 17 10 14 75 75 26
1 Plain milk 13 13 2 14 7 2 15 8 2 43 43 1
1.1.2 Liquid milk products & flavoured liquid milk 1 1 14 <1 <1 8 <1 <1 8 8 8 11
1.2.1 Fermented & rennetted milk, unflavoured <1 <1 4 <1 <1 1 <1 <1 1 2 2 3
1.2.2 Fermented & rennetted milk products, flavoured 1 1 9 <1 <1 3 <1 <1 3 7 7 10
1.3 Condensed milk & evaporated milk <1 <1 <1 <1 <1 <1 <1 <1 <1 <1 <1 <1
1.4 Cream & cream products <1 <1 <1 <1 <1 <1 <1 <1 <1 2 2 <11.5.1 Dried milk, milk powder <1 <1 <1 <1 <1 <1 <1 <1 <1 10 10 <11.5.2 Dried cream powder <1 <1 <1 <1 <1 <1 <1 <1 <1 <1 <1 <11.5.3 Dried yoghurt powder 0 0 0 0 0 0 0 0 0 0 0 0
1.6 Cheese & cheese products <1 <1 <1 <1 <1 <1 <1 <1 <1 3 3 <1
2 All Edible oils & oil emulsions <1 <1 <1 <1 <1 <1 <1 <1 <1 <1 <1 <1
2.2
Oil emulsions (water in oil) (excluding butter; butter products; and oil emulsions (<80% oil), dairy blends))
<1 <1 <1 <1 <1 <1 <1 <1 <1 <1 <1 <1
2.2.1.1 Butter <1 <1 <1 <1 <1 <1 <1 <1 <1 <1 <1 <12.2.1.2 Butter products 0 0 0 0 0 0 0 0 0 0 0 0
2.2.2.2 Oil emulsions (<80% oil), dairy blends <1 <1 <1 0 0 0 0 0 0 <1 <1 <1
110

Table A3.7: Food contributors to L-carnitine dietary intakes for New Zealand, based on Day 1 of the NNSs for specific population groups₼
Food Code Food Group Elderly People who consume sports food/ beverages
People who consume Wt management/ meal
replacement productsPeople who don’t eat
meat
71 years and above 15 years and above 15 years and above 15 years and above
Bas
elin
e
Spor
ts fo
od
incr
ease
Con
sum
er
Beh
avio
ur
Bas
elin
e
Spor
ts fo
od
incr
ease
Con
sum
er
Beh
avio
ur
Bas
elin
e
Spor
ts fo
od
incr
ease
Con
sum
er
Beh
avio
ur
Bas
elin
e
Spor
ts fo
od
incr
ease
Con
sum
er
Beh
avio
ur
3 All Ice cream & edible ices <1 <1 <1 <1 <1 <1 <1 <1 <1 1 1 <13.2 Ice cream <1 <1 <1 <1 <1 <1 <1 <1 <1 1 1 <1
4All Fruit & vegetables (including fungi/ nuts/ seeds/ herbs/ spices)
3 3 <1 2 <1 <1 2 1 <1 11 11 <1
4
Fruit & vegetables (including fungi/ nuts/ seeds/ herbs/ spices) (excluding category 4 foods listed below)
<1 <1 <1 <1 <1 <1 <1 <1 <1 1 1 <1
4.1.0.1 Grapes packed with permeable envelopes <1 <1 <1 <1 <1 <1 <1 <1 <1 <1 <1 <1
4.1.1.1 Untreated fruits & vegetables, fungi <1 <1 <1 <1 <1 <1 <1 <1 <1 <1 <1 <1
4.1.1.2 Untreated fruits & vegetables, nuts <1 <1 <1 <1 <1 <1 <1 <1 <1 <1 <1 <1
4.1.1.3 Untreated fruits & vegetables, seeds <1 <1 <1 <1 <1 0 <1 <1 0 <1 <1 <1
4.1.1.4 Untreated fruits & vegetables, herbs <1 <1 <1 <1 <1 <1 <1 <1 <1 <1 <1 <1
4.1.1.5.1 Untreated fruits, other <1 <1 <1 <1 <1 <1 <1 <1 <1 1 1 <1
4.1.1.5.2 Untreated vegetables, other 2 2 <1 <1 <1 <1 <1 <1 <1 4 4 <1
4.1.2.1 Surface treated citrus fruit 0 0 0 0 0 0 0 0 0 0 0 0
4.1.2.2 Surface treated walnut & pecan nut kernels 0 0 0 0 0 0 0 0 0 0 0 0
4.1.3.2 Root & tuber vegetables <1 <1 <1 <1 <1 <1 <1 <1 <1 <1 <1 <1
4.3.0.2Preserved cherries (maraschino/ cocktail/ glace cherries)
<1 <1 <1 0 0 0 0 0 0 <1 <1 <1
4.3.0.3 Tomato products pH <4.5 0 0 0 0 0 0 0 0 0 0 0 0
111

Table A3.7: Food contributors to L-carnitine dietary intakes for New Zealand, based on Day 1 of the NNSs for specific population groups₼
Food Code Food Group Elderly People who consume sports food/ beverages
People who consume Wt management/ meal
replacement productsPeople who don’t eat
meat
71 years and above 15 years and above 15 years and above 15 years and above
Bas
elin
e
Spor
ts fo
od
incr
ease
Con
sum
er
Beh
avio
ur
Bas
elin
e
Spor
ts fo
od
incr
ease
Con
sum
er
Beh
avio
ur
Bas
elin
e
Spor
ts fo
od
incr
ease
Con
sum
er
Beh
avio
ur
Bas
elin
e
Spor
ts fo
od
incr
ease
Con
sum
er
Beh
avio
ur
4.3.1
Dried fruits & vegetables (excluding dried & rehydrated legumes and dried herbs & spices)
<1 <1 <1 <1 <1 <1 <1 <1 <1 <1 <1 <1
4.3.1.3.1 Dried & rehydrated legumes <1 <1 <1 <1 <1 <1 <1 <1 <1 2 2 <1
4.3.1.4 Dried herbs & spices <1 <1 <1 <1 <1 <1 <1 <1 <1 <1 <1 <14.3.3.1 Canned fruits <1 <1 <1 <1 <1 <1 <1 <1 <1 <1 <1 <14.3.3.2 Canned vegetables <1 <1 <1 <1 <1 <1 <1 <1 <1 <1 <1 <1
4.3.5 Candied fruits & vegetables <1 <1 <1 <1 <1 <1 <1 <1 <1 <1 <1 <1
4.3.6.3 Nut butter <1 <1 <1 <1 <1 <1 <1 <1 <1 <1 <1 <14.3.6.5 Seed butter <1 <1 <1 <1 <1 <1 <1 <1 <1 <1 <1 <15 All Confectionery <1 <1 3 1 <1 6 1 <1 7 2 2 2
5.1 Chocolate & cocoa products <1 <1 2 1 <1 3 1 <1 4 2 2 <1
5.2Sugar confectionery (excluding bubble gum & chewing gum)
0 0 1 0 0 3 0 0 3 0 0 2
5.2.1 Bubble gum & chewing gum 0 0 <1 0 0 0 0 0 0 0 0 0
6 All Cereals & cereal products <1 <1 17 <1 <1 10 <1 <1 11 2 2 8
6Cereals & cereal products (excluding category 6 products listed below)
<1 <1 <1 <1 <1 <1 <1 <1 <1 <1 <1 <1
6.1.1 Plain oats, dry <1 <1 17 <1 <1 10 <1 <1 11 <1 <1 8
6.1.2 Cereals, whole & broken grains, rice <1 <1 <1 <1 <1 <1 <1 <1 <1 <1 <1 <1
6.2.1 Flours, meals & starches, wheat only <1 <1 <1 <1 <1 <1 <1 <1 <1 <1 <1 <1
112

Table A3.7: Food contributors to L-carnitine dietary intakes for New Zealand, based on Day 1 of the NNSs for specific population groups₼
Food Code Food Group Elderly People who consume sports food/ beverages
People who consume Wt management/ meal
replacement productsPeople who don’t eat
meat
71 years and above 15 years and above 15 years and above 15 years and above
Bas
elin
e
Spor
ts fo
od
incr
ease
Con
sum
er
Beh
avio
ur
Bas
elin
e
Spor
ts fo
od
incr
ease
Con
sum
er
Beh
avio
ur
Bas
elin
e
Spor
ts fo
od
incr
ease
Con
sum
er
Beh
avio
ur
Bas
elin
e
Spor
ts fo
od
incr
ease
Con
sum
er
Beh
avio
ur
6.4 Flour products (including noodles & pasta) <1 <1 <1 <1 <1 <1 <1 <1 <1 <1 <1 <1
7 All Breads & bakery products <1 <1 <1 <1 <1 <1 <1 <1 <1 2 2 <1
7 Breads & bakery products <1 <1 <1 <1 <1 <1 <1 <1 <1 2 2 <1
8 All Meat & meat products (including poultry & game) 74 73 14 51 26 8 56 32 8 0 0 0
8.1.1 Poultry (excluding duck) 3 3 <1 3 2 <1 3 2 <1 0 0 08.1.1.2 Duck <1 <1 <1 <1 <1 <1 <1 <1 <1 0 0 08.1.2 Game meat 6 6 1 1 <1 <1 2 <1 <1 0 0 0
8.1.3.2 Red meat, excluding game 51 51 10 34 17 5 41 23 6 0 0 0
8.1.3.3 White meat, excluding game and poultry 3 3 <1 4 2 <1 4 2 <1 0 0 0
8.1.4 Offal, all types <1 <1 <1 <1 <1 <1 0 0 0 0 0 0
8.2
Processed meat/ poultry/ game products in whole/ cut pieces (e.g. ham, bacon, smoked chicken)
5 5 <1 5 3 <1 5 3 <1 0 0 0
8.3Processed comminuted meat, poultry & game products (e.g. salami)
<1 <1 <1 2 <1 <1 <1 <1 <1 0 0 0
8.3.2 Sausage & sausage meat 3 3 <1 2 <1 <1 2 <1 <1 0 0 09 All Fish & fish products 2 2 <1 2 <1 <1 1 <1 <1 0 0 0
9Fish & fish products (excluding category 9 foods listed below)
1 1 <1 1 <1 <1 <1 <1 <1 0 0 0
9.1.2 Unprocessed crustacea <1 <1 <1 <1 <1 <1 <1 <1 <1 0 0 09.1.3 Molluscs <1 <1 <1 <1 <1 <1 <1 <1 <1 0 0 0
9.2.1 Processed fish & fish products, crustacea 0 0 0 0 0 0 0 0 0 0 0 0
113

Table A3.7: Food contributors to L-carnitine dietary intakes for New Zealand, based on Day 1 of the NNSs for specific population groups₼
Food Code Food Group Elderly People who consume sports food/ beverages
People who consume Wt management/ meal
replacement productsPeople who don’t eat
meat
71 years and above 15 years and above 15 years and above 15 years and above
Bas
elin
e
Spor
ts fo
od
incr
ease
Con
sum
er
Beh
avio
ur
Bas
elin
e
Spor
ts fo
od
incr
ease
Con
sum
er
Beh
avio
ur
Bas
elin
e
Spor
ts fo
od
incr
ease
Con
sum
er
Beh
avio
ur
Bas
elin
e
Spor
ts fo
od
incr
ease
Con
sum
er
Beh
avio
ur
9.3 Semi-preserved fish & fish products <1 <1 <1 <1 <1 <1 <1 <1 <1 0 0 0
9.4Fully preserved fish including canned fish products
<1 <1 <1 <1 <1 <1 <1 <1 <1 0 0 0
10 All Egg & egg products <1 <1 <1 <1 <1 <1 <1 <1 <1 1 1 <110 Egg & egg products <1 <1 <1 <1 <1 <1 <1 <1 <1 1 1 <112 All Salts & condiments <1 <1 <1 <1 <1 <1 <1 <1 <1 <1 <1 <112.5 Yeast & yeast products <1 <1 <1 <1 <1 <1 <1 <1 <1 <1 <1 <1
13 All Foods intended for particular dietary uses <1 2 3 25 62 20 20 55 19 4 4 3
13.1 Infant formula products 0 0 0 0 0 0 0 0 0 0 0 013.2.1 Infant cereal products 0 0 0 0 0 0 0 0 0 0 0 013.2.2 Infant fruit 0 0 0 0 0 0 0 0 0 0 0 013.2.3 Infant dairy desserts 0 0 0 0 0 0 0 0 0 0 0 013.2.4 Infant gels & juices 0 0 0 0 0 0 0 0 0 0 0 0
13.3.1Solid formula meal replacement & formulated supplementary foods
0 0 0 0 0 0 1 <1 4 0 0 0
13.3.2Liquid formula meal replacement & formulated supplementary foods
<1 <1 3 <1 <1 1 <1 <1 1 4 4 3
13.4.1Solid formulated supplementary sports foods
<1 1 <1 4 9 3 4 11 3 0 0 0
13.4.2Liquid formulated supplementary sports foods
0 0 0 21 53 16 15 43 11 0 0 0
13.5 Toddler formula products (excluding soy based) 0 0 0 0 0 0 0 0 0 0 0 0
114
Table A3.7: Food contributors to L-carnitine dietary intakes for New Zealand, based on Day 1 of the NNSs for specific population groups₼
Food Code Food Group Elderly People who consume sports food/ beverages
People who consume Wt management/ meal
replacement productsPeople who don’t eat
meat
71 years and above 15 years and above 15 years and above 15 years and above
Bas
elin
e
Spor
ts fo
od
incr
ease
Con
sum
er
Beh
avio
ur
Bas
elin
e
Spor
ts fo
od
incr
ease
Con
sum
er
Beh
avio
ur
Bas
elin
e
Spor
ts fo
od
incr
ease
Con
sum
er
Beh
avio
ur
Bas
elin
e
Spor
ts fo
od
incr
ease
Con
sum
er
Beh
avio
ur
14 All Non-alcoholic & alcoholic beverages <1 <1 14 <1 <1 22 <1 <1 21 <1 <1 43
14.1.2Fruit & vegetable juices & fruit & vegetable juice products
<1 <1 5 <1 <1 4 <1 <1 4 <1 <1 7
14.1.2.1.1 Coconut milk, coconut cream & coconut syrup <1 <1 <1 0 0 0 0 0 0 <1 <1 <1
14.1.3 Soft drinks (intensely sweetened soft drinks) 0 0 8 0 0 11 0 0 10 0 0 28
14.1.3.1.1.3 Energy drinks 0 0 0 0 0 6 0 0 6 0 0 2
14.1.5
Coffee (or substitute), tea, herbal infusion & similar (excluding caffeinated instant tea)
<1 <1 <1 <1 <1 <1 <1 <1 <1 <1 <1 <1
14.1.5.3.1.1 Tea, caffeinated, Instant 0 0 0 0 0 0 0 0 0 0 0 014.1.7 Soy beverage <1 <1 <1 <1 <1 <1 <1 <1 <1 <1 <1 614.1.8 Cereal beverages <1 <1 <1 0 0 0 <1 <1 <1 <1 <1 <1
14.2
Alcoholic beverages (including no & low alcohol) (excluding beer & related products wine, sparkling wine & fortified wine)
<1 <1 <1 <1 <1 <1 0 0 0 <1 <1 <1
14.2.1 Beer & related products <1 <1 <1 <1 <1 <1 <1 <1 <1 <1 <1 <1
14.2.2 Wine, sparkling wine & fortified wine <1 <1 <1 <1 <1 <1 <1 <1 <1 <1 <1 <1
14.3 Alcoholic beverages not included in item 14.2 0 0 0 0 0 0 0 0 0 0 0 0
115
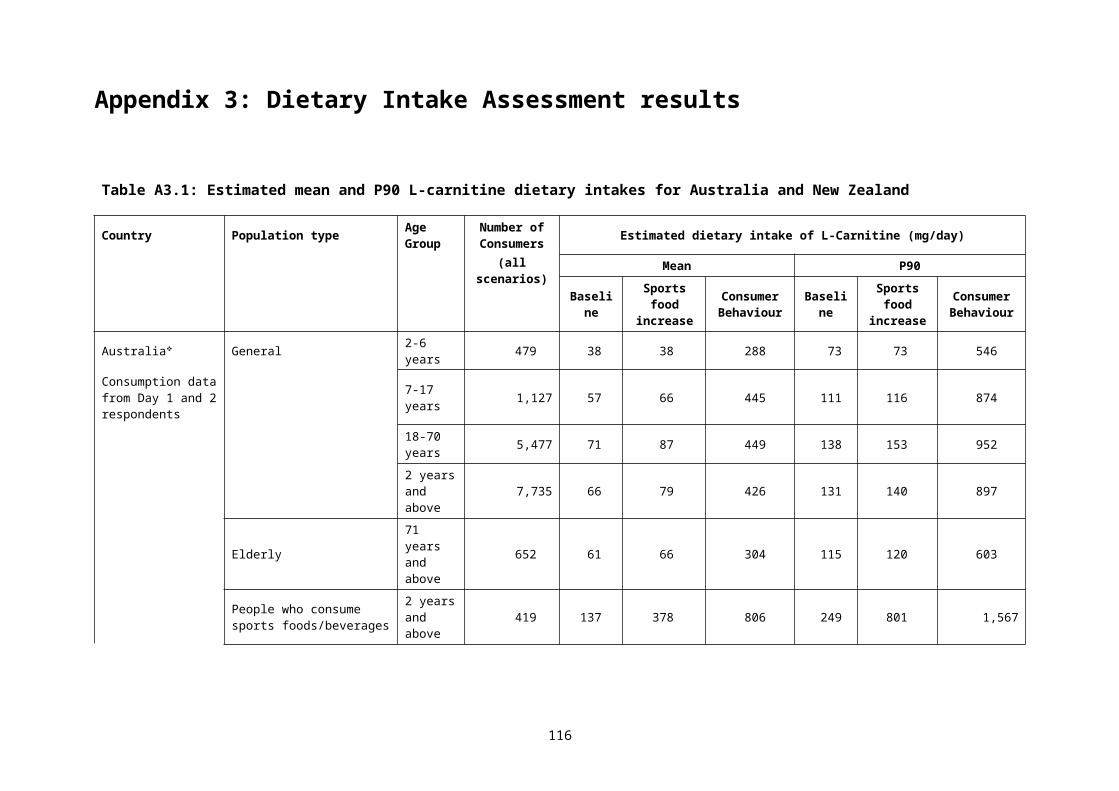
Table A3.7: Food contributors to L-carnitine dietary intakes for New Zealand, based on Day 1 of the NNSs for specific population groups₼
Food Code Food Group Elderly People who consume sports food/ beverages
People who consume Wt management/ meal
replacement productsPeople who don’t eat
meat
71 years and above 15 years and above 15 years and above 15 years and above
Bas
elin
e
Spor
ts fo
od
incr
ease
Con
sum
er
Beh
avio
ur
Bas
elin
e
Spor
ts fo
od
incr
ease
Con
sum
er
Beh
avio
ur
Bas
elin
e
Spor
ts fo
od
incr
ease
Con
sum
er
Beh
avio
ur
Bas
elin
e
Spor
ts fo
od
incr
ease
Con
sum
er
Beh
avio
ur
20 All Mixed Foods Commercial 18 18 19 17
20.1.1.5 Beverages, non-alcoholic, coffee, dry mix 1 <1 <1 3
20.3.1 Ready-to-eat mueslis 13 9 8 9
20.3.2 Flavoured oat porridges, dry <1 0 0 0
20.2.2.3 Cereal products, bars 3 9 11 6₼ 2008/09 New Zealand Adult Nutrition Survey (2008 NZANS) 15 years and above.
116

Appendix 4: TMAO and mortality and cardiovascular disease
Introduction
A hypothesis has recently been put forward by a group of researchers from Cleveland in the US that trimethylamine-N-oxide (TMAO) increases the risk of all-cause mortality and cardiovascular disease (Koeth et al. 2013). TMAO is a metabolite of L-carnitine, choline and phosphatidyl choline (lecithin) formed by microbial action in the gut followed by conversion in the liver. TMAO is also found in large amounts, pre-formed, in certain fish. The research group initially supported their hypothesis with a series of analyses from a cohort study of 4007 people who were referred to a tertiary clinic in Cleveland for coronary angiography. Subsequently, they and other groups of researchers have conducted similar studies in other groups of participants.
This appendix summarises research by the Cleveland and other research groups who have examined the possible link between serum TMAO and various outcomes. It does not consider research examining the response of serum TMAO concentrations following changes to the intake of L-carnitine, choline, eggs, macronutrient ratio etc. In addition, the link between fish consumption and heart disease in not reviewed even though certain fish contain large amounts of TMAO. In 2014, Koeth et al. used a mouse model and proposed that only the microbial pathway which produced TMAO via gamma-butyrobetaine was atherogenic.
Cohort studies in patients
The Cleveland 4007 Clinical Outcomes Cohort:
This cohort of 4007 people was recruited between 2001-2007 from the larger GeneBank study (Hartiala et al. 2016). The cohort formation is described to varying extents across the papers reporting prevalence of characteristics or incidence of outcomes. Certain details, such as the qualifying cardiac troponin concentration, are described differently in the various papers outlining the formation of the cohort.
In the paper (Tang et al. 2013) describing the 3-year follow-up and incidence of MACE (all-cause mortality, non-fatal myocardial infarction and non-fatal stroke) the recruitment was described as:
We enrolled 4007 adults who were undergoing elective diagnostic cardiac catheterization; the participants had no evidence of an acute coronary syndrome (cardiac troponin T level, < 0.1 μg per liter, if available). A history of cardiovascular disease was defined as a documented history of coronary artery disease, peripheral artery disease, coronary or peripheral revascularization, stenosis of 50% or more in one or more vessels observed during coronary angiography, or a remote history of either myocardial infarction or stroke. Fasting blood samples were obtained from all participants at the time of cardiac catheterization… Major adverse cardiovascular events (defined as death from any cause, nonfatal myocardial infarction, and nonfatal stroke) were ascertained and adjudicated for all participants during 3 years of follow-up.
A subsequent paper describing 5-year all-cause mortality (Senthong et al. 2016b) gives further elaboration of the study methods:
This single-center prospective cohort study was approved by the Cleveland Clinic institutional review board. All participants provided written informed consent. We included adult participants (aged ≥ 18 years) with symptoms or signs of CAD who underwent elective nonurgent coronary angiography at the Cleveland Clinic between 2001 and 2007 without
117

evidence of acute coronary syndrome (cardiac troponin I < 0.03 ng/mL). Patients who had experienced acute coronary syndrome or revascularization procedures within 30 days before enrolment were excluded. All-cause mortality at 5 years was tracked by electronic chart review and Social Security Death Index up to 2011 and confirmed by telephone interviews, official hospital records, or death certificates.
At baseline, the average age of the 4007 participants was 63 years and 64% were men. They had a median body mass index (BMI) of 28.7 kg/m2 (interquartile range (IQR): 25.7–32.5), median LDL-cholesterol concentration of 96 mg/dL, median estimated glomerular filtration rate (eGFR) of 82 mL/min/1.73 m2 (IQR: 69–95).2 There was a substantial prevalence of risk conditions and medication use among the participants: 32% had diabetes, 72% had hypertension, 42% had a history of myocardial infarction, 65% were current or former smokers, 74% taking aspirin, 50% taking ACE inhibitors or ARB, 60% taking statins and 63% taking beta-blockers. The proportion of African Americans in the cohort is not given. This is relevant owing to the differential disease rates, for example hypertension, in Whites and African Americans, and the low proportion of people of African origin in Australia. Median TMAO concentration was 3.7 µM (IQR: 2.4–6.2 µM) (Tang et al. 2013).
The participants in this cohort were referred to the clinic for angiography and so do not reflect the general population. For comparison, in the 2011-2012 Australian Health Survey, the prevalence of self-reported history of heart, stroke and vascular diseases was 8.8% and 17% in persons aged 55–64 years and 65–74 years respectively. The prevalence of self-reported diabetes in these age groups (both types of diabetes combined) was 9.5% and 16.6% respectively and total kidney disease had a prevalence of 1.0% and 2% respectively.3
The primary paper reporting the 3-year follow-up and incidence of the composite outcome, MACE, (all-cause mortality, non-fatal myocardial infarct or stroke) is Tang et al. (2013). The hazard ratio was 1.43 (95% CI: 1.05–1.94) for those in the highest versus lowest quartile of plasma TMAO at baseline after adjustment for a range of traditional and other risk factors (see Table A4.1). This was also adjusted for eGFR calculated with the MDRD formula. This paper also reported that the unadjusted effect was similar when the cohort was divided into groups according to baseline characteristics such as high or low cholesterol concentrations, age group etc. As 42% had a history of MI at baseline, the MACE outcome is presumably contains a mixture of primary and secondary infarctions.
Two earlier papers had reported 3-year incidence of MACE in what appear to be subsets of this population (Table A4.1). Wang et al. (2011) state that their cohort comprised 1020 subjects from the GeneBank study and 856 from the Biobank study whereas Koeth et al. (2013) state that all 2595 subjects in their ‘independent cohort’ came from the GeneBank Study (in addition to the subjects in their learning and validation cohorts). FSANZ notes that the definition of MACE was different in Koeth et al. (2013) from the other papers because it also included revascularisations and for clarity FSANZ will refer to this composite outcome as MACER even though Koeth et al. (2013) refer to it as MACE. A fourth paper describing 3-year MACE in 3903 subjects was published in 2014 (Tang et al. 2014). The PhD thesis (Koeth 2013) contains manuscripts of or refers to Wang et al. (2011), Koeth et al. (2013) and Tang et al. (2013) but does not explain the relationship between the subjects of the three papers or why one paper uses MACER, rather than MACE, as the composite outcome. Therefore FSANZ assumes that the results of Wang et al. (2011) and Koeth et al. (2013) and Wang
2 Glomerular filtration rate is estimated (eGFR) from a formula involving serum creatinine, age and sex and race (white or African black) and has units of mL/min/1.73 m2. (The equation does not involve height or weight). The equation provides an estimate of GRF for an individual; it is not an actual measure of the individual’s GRF. Using the equation result, kidney function is classified into five stages. Stage 1 is eGFR greater than or equal to 90 mL/min/1.73 m2. Normal eGFR in young adults is 90–100 mL/min/1.73 m2. The definition of chronic kidney disease also depends on other test results, such as the presence of albumin in the urine. The equations are not recommended for various population subgroups, including vegetarians or those on low meat diets. https://www.niddk.nih.gov/health-information/health-communication-programs/nkdep/lab-evaluation/gfr/estimating/Pages/estimating.aspx3 (Table 8, http://www.abs.gov.au/ausstats/[email protected]/Lookup/1A8F3DE217DE1057CA257B82001792F4?opendocument).
118

et al. (2014) are overlapping subsets of the results reported by Tang et al. (2013).
FSANZ was unable to find a paper reporting the 5-year all-cause mortality for the whole cohort of 4007 subjects. However there are several papers which describe 5-year mortality for sub-sets of the cohort (Table A4.1) such as the 821 with peripheral arterial disease at baseline (Senthong et al. 2016a) or the 3687 who were classified by the presence or absence of chronic kidney disease at baseline (Tang et al. 2015). Table A4.1 shows that the 25th centile of the TMAO distribution in those with kidney disease was the same as the 75th centile in those who did not have the condition (Tang et al. 2015) whereas there was relatively little variation in TMAO distribution for subgroups defined by other diseases. In none of the papers describing 5-year mortality does the total number of subjects at baseline sum to 4007 and no explanation is given for this. Comparing numbers across the papers, it seems that some subjects had more than one baseline disease. Consequently this set of papers is a series of sub-group analyses of the same data, with no correction for multiple statistical testing.
In some papers, analyses were done to compare the hazard ratio by quartiles of baseline TMAO. The quartiles were redefined for each paper using only the sub-set of subjects included in each paper. Adjusted hazard ratios (HR) were calculated, and adjustment for cardiovascular risk factors invariably moved the HR towards the null (for example, the unadjusted HR for 3-year MACE was 2.54 (95% CI: 1.96–3.28) whereas the adjusted HR was somewhat lower (HR=1.43 (95% CI: 1.05–1.94) (Tang et al. 2013). In some papers the effects of TMAO was examined as a sub-group analysis in conjunction with a second factor, such as plasma betaine, choline, trimethyllysine (TML) or cystatin C. TMAO and the second factor were divided at their median concentrations to form four groups consisting of high and low concentrations of the two factors. Typically the authors conclude that the effect of TMAO on mortality varied by the second factor but it is not clear whether a formal test for interaction has been done to support this statement.
Multiple papers describing overlapping sub-groups and outcomes from a single study; the results cannot be treated as independent tests of hypothesis (Higgins and Green 2011). The ongoing publication of papers describing results from sub-groups in this cohort does not indicate an increasing degree of certainty in the underlying data. There is one 3-year MACE result (HR=1.43 (95% CI: 1.05–1.94) (Tang et al. 2013) and one (unpublished) 5-year all-cause mortality result. However, even these two results are not independent because the 5-year MACE includes deaths (but not the other endpoints) in the 3-year MACE result. All other papers describe sub-group analyses. In the absence of the 5-year mortality results for the total cohort, FSANZ views the result for those without chronic kidney disease at baseline (Tang et al. 2015) as the best estimator of the 5-year mortality for the cohort, in that it is based on the largest number of subjects (HR=1.47; 95% CI: 1.02–2.12; p < 0.05 for the highest versus lowest quartile of TMAO at baseline). Only one of these results can be used when comparing the results of this cohort to results from other studies or in a meta-analysis.
The Cleveland group propose that TMAO must be an independent risk factor because their analysis have controlled for eGFR and so could not be due to TMAO acting as a surrogate for kidney function. However, this is open to challenge. In their cohort, renal function was estimated using a formula; it was not measured. Consequently, the eGFR value assigned to each cohort participant contains error and so there will be some amount of residual confounding related to kidney function that has not been adjusted for in the adjusted HR. However, Kuhn et al. (2017) report that the correlation between two measurements of TMAO taken a year apart is 0.29 in healthy people, i.e. there is notable within-person variability. This means that the adjusted HR for TMAO would have been underestimated in the models (Clarke et al. 1999). Better measures of kidney function, and trials which examine the effect of changing TMAO would be needed to conclude that TMAO is a modifiable risk factor.
Cohort studies of non-diseased populations
119

As noted above, the participants in the Cleveland 4007 Cohort were referred for investigation and have a higher prevalence of many conditions related to cardiovascular disease than the general population. Two groups of researchers have stored blood samples from prior randomised controlled trials of nutrients and have unfrozen their samples to examine TMAO concentrations at baseline and incident cancer using a nested case-control design (Table A4.2). TMAO concentrations were similar in the Finnish study of men and the American study of post-menopausal women. The 25th and 50th centiles of TMAO concentration were similar to those in the Cleveland 4007 Cohort whereas the 75th
centile was slightly lower. Both studies examined the incidence of colorectal cancer and had somewhat different results (Table A4.2). The Finnish Study examined the relationship between incident prostate cancer and over 600 different metabolites and only reported the statistically significant results. Given the number of statistical tests performed, this is a hypothesis generating study and needs to be investigated by other research groups. (Although Obeid et al. 2016 initially appeared to be comprised of two longitudinal studies, the analyses presented were cross-sectional in examining the associations of TMAO with other metabolites measured concurrently in the same blood samples and so this study was not included).
Other patient cohort studies – heart disease
Results from a number of other cohorts of patients have been reported. Table A4.3 shows data for cohorts of patients with various types of heart disease and that the TMAO concentrations are somewhat varied. For example, 75% of the subjects in Mueller et al. (2015) had TMAO concentrations in the same range as the lowest quartile of subjects in Tang et al. (2015).
It is also noted that plasma concentrations of trimethylamine-N-oxide are confounded by impaired kidney function and poor metabolic control (Mueller et al. 2015). In this study of patients undergoing coronary angiography for the evaluation of suspected coronary artery disease, plasma concentrations of TMAO were higher in patients with diabetes compared to euglycemic patients (2.39 vs. 0.98 µM; p < 0.001) as well as in patients with metabolic syndrome as compared to patients without metabolic syndrome (2.37 vs. 1.43 µM; p < 0.002). Plasma concentrations of TMAO increased significantly with decreasing renal function (p < 0.001), however, plasma levels of TMAO were associated with neither a history of myocardial infarction nor the presence of coronary heart disease (assessed by angiography), nor incident cardiovascular events during 8 years of follow-up.
Skagen et al. (2016) measured serum TMAO, L-carnitine, gamma-butyrobetaine, and trimethyllysine (TML) in patients with carotid artery atherosclerosis (n = 264; age 67.6 ± 8.4 y) and in healthy controls (n = 62; age 68.0 ± 5.9 y). Serum levels of L-carnitine (median and range; µM) in the patient and healthy control groups were 42.8 (12.9–69.0) and 40.4 (26.2–51.8). Corresponding values for TMAO were 9.77 (0.4–161.7) and 5.8 (1.3–36.8). Statistically significant increases in serum gamma-butyrobetaine (p = 0.024) and L-carnitine (p = 0.001), but not TMAO (p = 0.77) or TML (p = 0.21), were observed in the patient group. Higher levels of gamma-butyrobetaine and TML, but not TMAO or L-carnitine, were independently associated with cardiovascular death, with and without adjustment for age and renal function.
Most studies in Table A4.3 report an increase in their outcome of less than 2-fold for the highest versus lowest TMAO group, although some authors report no association. While most studies calculate the HR for the highest versus lowest quartile, there is no obvious increase in HR as the difference in TMAO concentration increases between these two groups which might be expected if a dose-response relationship existed. However it is possible that there are too many other differences between the cohorts to allow a dose-response to be seen via an inter-cohort comparison, even if a dose-response truly exists.
120

Other patient cohort studies – chronic renal failure
There have been several cohorts of patients with chronic kidney disease (Kaysen et al. 2015; Robinson-Cohen et al. 2016; Kim et al. 2016; Missaialdis et al. 2016; Poesen et al. 2016) and one uncontrolled trial using L-carnitine (Fukami et al. 2015). Patients with Stage 3-5 renal disease are typically on protein-restricted diets but have higher (e.g. 10-fold) concentrations of TMAO than healthy people. Following transplantation, TMAO concentrations decline despite liberalisation of the protein content of the diet. As people with renal failure do not excrete TMAO efficiently (Robinson-Cohen et al. 2016), any associations between mortality and TMAO found in these studies do not resolve the question of whether TMAO is acting as a marker for declining renal function or has an independent action. In addition, Fukami et al. (2015) found a decrease in blood pressure and some relevant markers following supplementation with 900 mg/day L-carnitine and a large increase in TMAO concentration which further raises questions about the exact role of TMAO.
In an observational study, TMAO was measured in the serum of 235 patients receiving haemodialysis and in pooled serum from healthy controls. Serum TMAO concentrations (median 43 μM, interquartile range 28–67 μM) were markedly higher compared to subjects with normal or near normal kidney function (1.41 ± 0.49 μM). TMAO serum concentrations were not significantly associated with time to death (hazard ratio 0.84, 95% CI 0.65–1.09, p = 0.19) or time to cardiovascular hospitalization or cardiovascular death (HR=0.88, 95% CI 0.57–1.35, p = 0.55) (Kaysen et al. 2015).
In a study of 339 patients with moderate-to-severe chronic kidney disease, it was shown that a specific FMO3 genotype was associated with increased plasma TMAO concentrations, kidney function decline, and all cause-mortality. Median plasma concentrations of TMAO for the nine FMO3 variants studied ranged from 0.97 to 2.05 µg/mL (13–27 µM). However, plasma TMAO itself was not associated with adverse outcomes after adjustment for potential confounders (age, sex, race, renal function, and plasma choline concentration) (Robinson-Cohen et al. 2016).
In an intervention study, 31 patients on haemodialysis with evident carnitine deficiency were treated with oral L-carnitine (900 mg/day) for 6 months. At baseline and after treatment, clinical variables including plasma L-carnitine, TMAO, and several biochemical markers of vascular injury and oxidative stress [malondialdehyde (MDA), and soluble forms of intracellular adhesion molecule-1 (sICAM-1), and vascular cell adhesion molecule-1 (sVCAM-1)] were measured. Serum L-carnitine and TMAO concentrations at baseline (mean ± SD) were 25.2 ± 4.7 µM and 223 ± 112 µM, respectively. Corresponding values after 6 months of oral L-carnitine were 164 ± 47 and 548 ± 206 µM (i.e. increases of 6.5x and 2.5x, respectively; p < 0.001). (This mean concentration of TMAO greatly exceeds that reported in any other study reviewed here) Oral L-carnitine decreased markers of vascular injury and oxidative stress: sICAM-1 (p = 0.016), sVCAM-1 (p = 0.015), and MDA (p < 0.001). Systolic blood pressure decreased after 6 months supplementation from 151.0 ± 17.3 to 141.5 ± 16.1 mmHg (p = 0.006). Mean body mass index was unchanged (Fukami et al. 2015).
Systematic reviews
Two systematic reviews were found which examined the association between TMAO and MACE (Heianza et al. 2017; Schiattarella et al. 2017) and all-cause mortality (Schiattarella et al. 2017) in the cohort studies described above. Both reviews failed to recognise the non-independent nature of the multiple reports from the Cleveland 4007 Cohort and entered several results from this study as independent data points. Both found statistically significant associations. However these findings do not address the fundamental question of whether or not TMAO is an independent modifiable risk factor which can be intervened on or is a surrogate marker for some other factor such as renal function and might therefore be useful in clinical triaging.
121
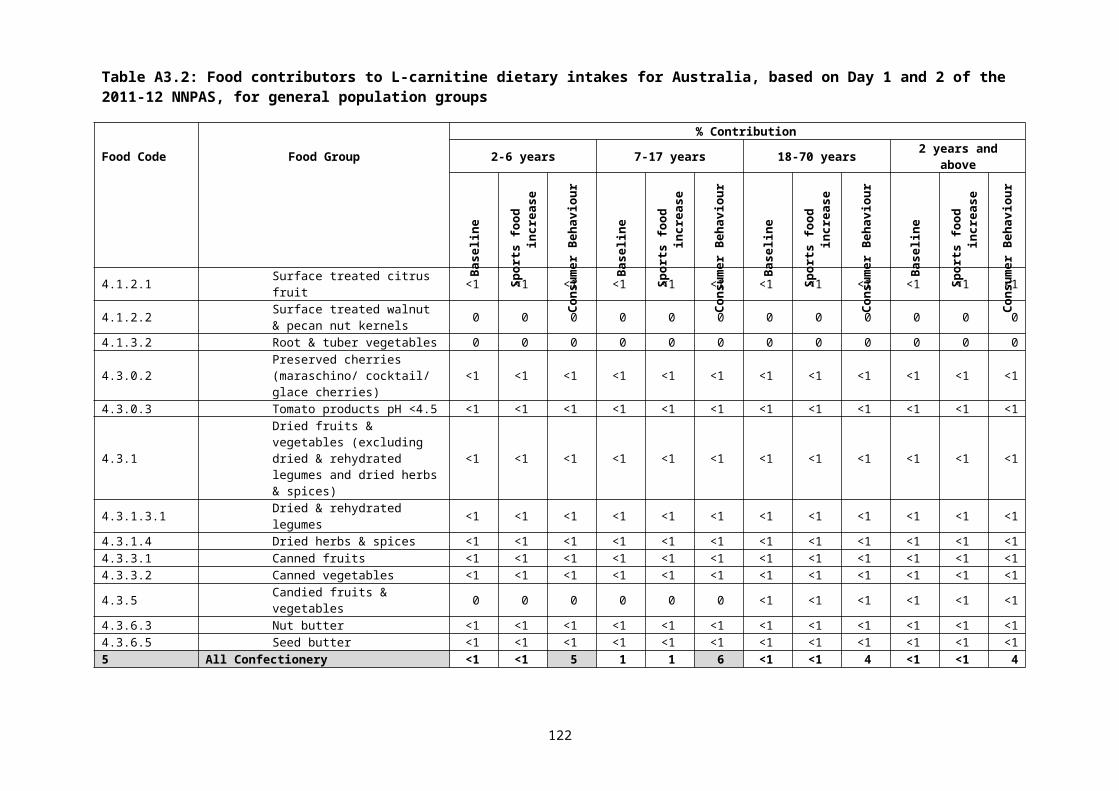
Table A4.1: Papers describing mortality and cardiovascular events at 3 and 5 years of follow-up in the Cleveland Clinical Outcomes Cohort (n=4007)
First author, year
Group or sub-group analysed Baseline N Follow-up duration
Outcome (N events)
Plasma TMAO concentration (percentile: µM)
Results(The most adjusted hazard ratio (95% CI) for the highest vs lowest quartile of TMAO unless otherwise noted)
Tang 2013 Total group 4007 3 years MACE*(513)
25th 2.4350th 3.6675th 6.18
HR=1.43 (95% CI: 1.05–1.94)
Koeth 2013 2595 archival specimens from Genebank
2595 3 years MACER* Not given Carnitine and TMAO greater than the median for both compared to less than the median for both: HR=2.1 (95% CI:1.5–2.8)
Wang 2104 Sequential stable subjects (cardiac troponin I ≤0.03 ng/mL)
3903 3 years MACE (495)
25th 2.450th 3.775th 6.2
HR: 2.5-fold increase, p < 0.01
Choline and TMAO greater than the median for both compared to less than the median for both: HR=1.6 (95% CI: 1.2–2.0)
Betaine and TMAO greater than the median for both compared to less than the median for both:HR=1.6 (95% CI: 1.2–2.0)
Tang 2014 Patients with a history of heart failure fulfilling inclusion and exclusion criteria”
720 5 years All-cause mortality (207)
25th 3.050th 5.075th 8.5
HR=1.85 (95% CI: 1.14–3.00)
122

First author, year
Group or sub-group analysed Baseline N Follow-up duration
Outcome (N events)
Plasma TMAO concentration (percentile: µM)
Results(The most adjusted hazard ratio (95% CI) for the highest vs lowest quartile of TMAO unless otherwise noted)
Tang 2015 Subjects with and without chronic kidney disease (CKD): total included in analysis=3687
521 stable with CKD Stage 3+
3166 without CKD
5 year All-cause mortality (466)
With CKD25th 5.250th 7.975th 12.4
Without CKD25th 2.350th 3.475th 5.3
With CKD: HR=1.93 (95% CI: 1.13–3.29)
Without CKDHR=1.47 (95% CI: 1.02–2.12)
Senthong 2016b
Patients with coronary artery stenosis managed with optimal treatment (COURAGE*-like)
2235 5 years All-cause mortality (338)
25th 2.550th 3.875th 6.5
HR=1.71 (95% CI: 1.11–2.61)
Senthong 2015 and Senthong 2016a
Patients with history of peripheral arterial disease (935) without aortic aneurysm (minus 100) minus no data (14)
821 3 years
5 years
MACE
All-cause mortality (222)
25th 2.950th 4.875th 8.0
HR=1.74 (95% CI: 1.2–2.51)
HR=1.88 (95% CI:1.21–2.92)
123

First author, year
Group or sub-group analysed Baseline N Follow-up duration
Outcome (N events)
Plasma TMAO concentration (percentile: µM)
Results(The most adjusted hazard ratio (95% CI) for the highest vs lowest quartile of TMAO unless otherwise noted)
Li 2018 At least some, if not all, of the subjects may be part of the 4007 cohort.
2140 3 years
5 years
MACE (326)
All-cause mortality (304)
33rd 2.566th 6.0
3-year MACE (unadjusted) HR=2.5, 95% CI: 1.8–3.5)
3-year MACE (adjusted): TML and TMAO greater than the median for both compared to less than the median for both: HR=1.6 (95% CI:1.1–2.2)
5-year mortality (unadjusted) HR=4.0 (95% CI: 2.7–5.8)
5-year mortality (adjusted): TML and TMAO greater than the median for both compared to less than the median for both: HR=2.1 (95% CI:1.4–3.0)
* MACE Major adverse cardiovascular events (defined as death from any cause, nonfatal myocardial infarction, and nonfatal stroke)
MACER as for MACE plus revascularisations
# TML trimethyllysine is the intermediate formed from carnitine and the precursor to TMAO
* COURAGE inclusion and exclusion criteria (Boden et al. 2007) as follows: (1) patients who had an elective diagnostic coronary angiography procedure, as described earlier; (2) patients with evidence of significant CAD defined by ≥70% diameter stenosis in at least one epicardial coronary artery; and (3) patients assigned to receive OMT alone, without a revascularization procedure within 30 days after enrolment in the present study. All angiogram interpretations and the decision of whether to undergo revascularization plus OMT or OMT alone were determined at the discretion of the board certified cardiology staff at the Cleveland Clinic. A total of 2235 consecutive patients who fulfilled criteria for the COURAGE-like patient cohort were included in this study and represent a subset of the previously reported study cohort of medically managed patients that fulfilled COURAGE trial criteria for having significant coronary artery disease.
124

Table A4.2: Cohort studies in subjects not selected based on disease status
First author, year
Group Baseline N Follow-up duration
Outcome (N events)
TMAO concentrations(percentile: µM)
Results
Mondul 2015
Nested case control studies within the Alpha-Tocopherol Beta-Carotene trial in Finland; all participants are male smokers
200 incident cases (100 aggressive cancer)
200 controls
Up to 20 years
Prostate adenocarcinoma
Not given but presumably similar to those reported by Guertin et al. (2017) below
Non-aggressive cancer: not significant
Aggressive cancer: OR=1.36 (95% CI: 1.02–1.81) per 1 SD increment on log scale
Associations with 625 other metabolites also examined
Guertin 2017*
644 incident CRC644 control
<26 years Colorectal cancer 25th 2.650th 3.775th 5.5
OR=1.20 (95% CI: 0.86–1.68) for highest vs lowest quartile Associations with choline, carnitine, betaine also examined
Bae 2014
Nested case control study within the Women’s Health Initiative Observational Study of 93,676 post-menopausal women aged 50-79
5.2 Colorectal cancer (835)
25th <2.650th 3.875th 5.7
Rectal cancer: OR=3.38 (95% CI: 1.25–9.16)
Overall CRC varied by vitamin B12 status and only significant with B12 was low (OR=2.44; 95% CI: 1.59–3.75) but not if high (OR=0.92; 95% CI 0.58–1.47)
Associations with choline and betaine also examined
125

Table A4.3: Other cohorts of patients with various types of heart disease
First author, year,Location
Group Baseline N Follow-up duration (years)
Outcome (N events) TMAO concentration(percentile: µM)
Results
Tang 2015*#
Stable but asymptomatic chronic systolic heart failure (left ventricular ejection fraction <=35%) who underwent echocardiography; excluding significant primary valvular abnormality
112 5 All-cause mortality +cardiac transplantation (40)
25th: 3.650th: 5.875th 12.1
HR=1.46 (95% CI: 1.03–2.14) per 1 standard deviation increment in the natural logarithm of TMAO
Li 2017* Acute coronary syndrome US : 530 presenting with chest pain
0.5 MACER at 6 months MI (117), stroke (6), revascularisation (163), death (29), total MACER (220)
25th: 2.650th 4.375th 7.9
MACER: OR=5.65 (95% CI not reported)
7-year mortality: HR=1.81 (95% CI not reported)
Switzerland: 1683 undergoing angiography
1 MI (52), stroke (21), revascularisation (99), death (71), total MACER (190)
25th 1.950th 2.975th 4.8
MACER: OR=1.57 (95% CI not reported)
Mortality: HR=1.6 (95% CI not reported)
Suzuki 2017
Survivors of acute myocardial infarction; samples taken in the days following hospital admission
1079 2 All-cause mortality (119) or myocardial infarction (232) - total events (292)
33rd 2.967th 5.1
HR=1.21 (95% CI: 1.03–1.43) for the highest tertile vs the other two groups
126
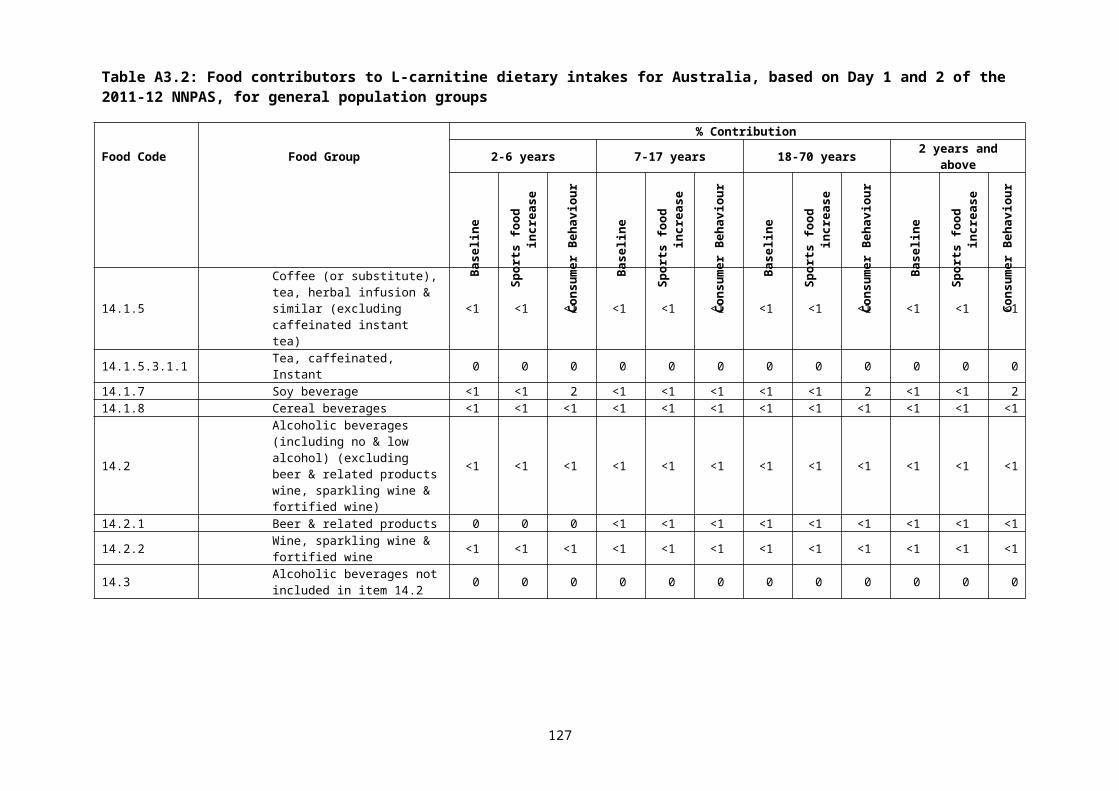
First author, year,Location
Group Baseline N Follow-up duration (years)
Outcome (N events) TMAO concentration(percentile: µM)
Results
Lever 2014
Survivors of myocardial infarction: samples collected 4 months after discharge for acute MI from hospital
Without diabetes 396
With diabetes 79
4.9 Death (81)Second MI (87)Admission for heart failure (85) unstable angina (72)All cardiovascular events (283)
25th 3.050th 4.875th 9.1
25th 4.450th 7.575th 12.1
TMAO > 12 vs 2.8 µM
Predicted all outcomes in people with diabetes (dose response unclear), only death in people without diabetes with no dose response
Mueller 2015
Consecutive patients undergoing coronary angiography for the evaluation of suspected or established stable CAD. The metabolic syndrome (MetS) was defined according to ATP-III criteria; significant CAD was diagnosed in the presence of coronary stenoses with lumen narrowing ≥ 50%.
339 8 Cardiac death, MI, stroke (all-cause mortality not collected)
Men:
25th 0.750th 1.8475th 3.5
HR =1.01 (95% CI: 0.98–1.04)
Ottiger 2016
Patients with definite diagnosis of community-acquired pneumonia in a randomised controlled trial of antibiotics in Switzerland; mean age 72 years
317 6.1 All-cause mortality (143)
Survivors25th 1.550th 2.575th 4.1
Non-survivors25th 2.250th 4.175th 7.2
No association in those with prior coronary heart disease
In those with no prior heart disease: HR:1.6 (1.01–2.4) for the highest quartile of TMAO versus the other three quartiles combined
Appears to be highest quartile vs others combined
127
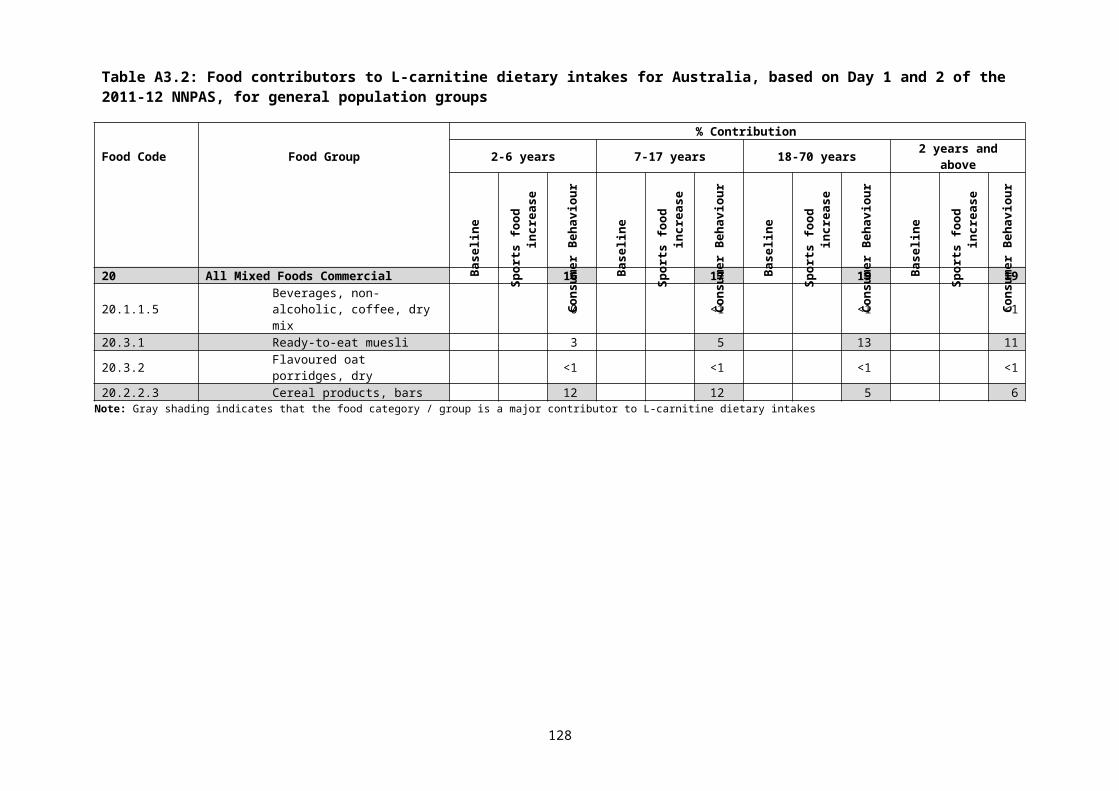
* One or more authors associated with Hazen group# The paper states that this is a different group of patients from those reported in Tang et al. 2014
128


![carnitine deficiency[1]](https://img.pdfslide.us/doc/110x75/577d20c11a28ab4e1e93ae46/carnitine-deficiency1.jpg)