Embed Size (px)
Citation preview
Topic A04: Financial Analysis Topic Overview P.1
BAFS Learning and Teaching Example As at April 2009
Learning Objectives: 1. To understand the major types of accounting ratios; 2. To calculate different accounting ratios; 3. To evaluate financial performance through accounting ratios; 4. To improve the financial performance; and 5. To describe the limitations on using accounting ratios. Overview of Contents: Lesson 1 Major Types of Accounting Ratios and Their Calculations Lesson 2 Evaluation of Financial Performance through Accounting Ratios Prior Knowledge: Students should have basic understanding on the Income Statement and the Balance Sheet. Resources:
Topic Overview and Teaching Plan PowerPoint Presentation Student Worksheet
Suggested Activities:
Case Study Matching Game Problem Solving
Topic Overview Topic BAFS Elective Part - Accounting Module – Financial Accounting
A04: Financial Analysis Level S5 / S6 Duration 2 lessons (40 minutes per lesson)
Topic A04: Financial Analysis Topic Overview P.2
BAFS Learning and Teaching Example As at April 2009
Lesson 1
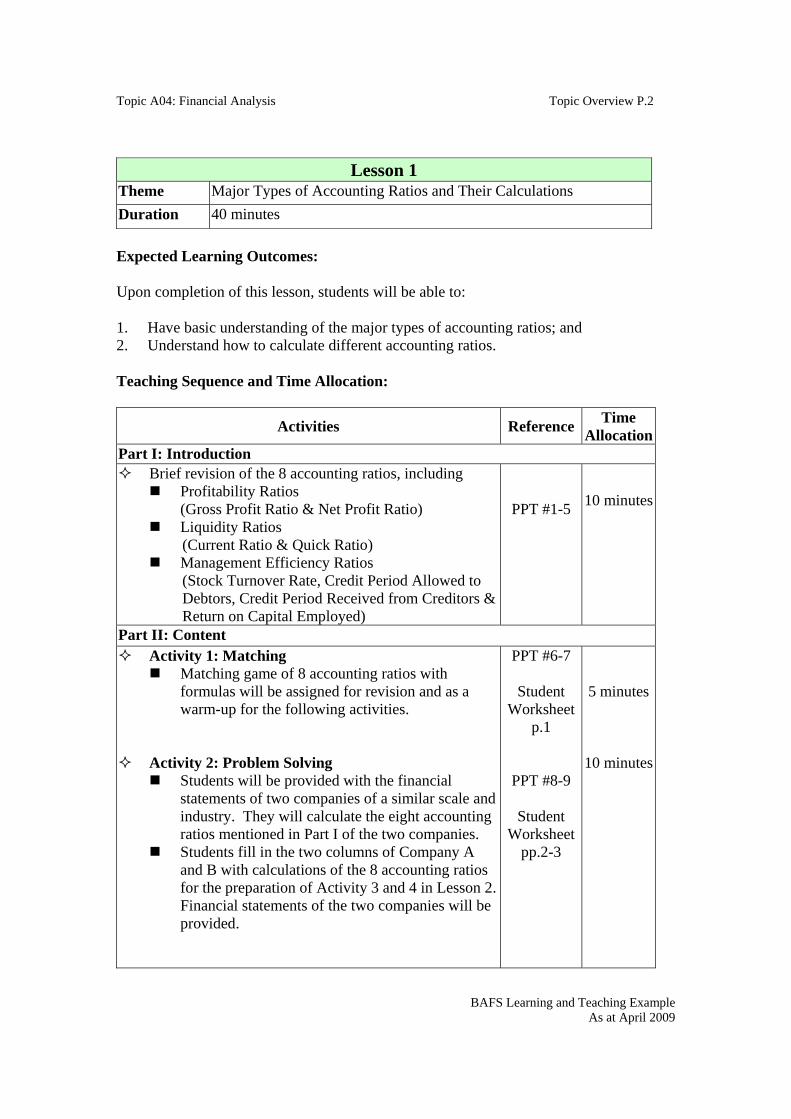
Theme Major Types of Accounting Ratios and Their Calculations Duration 40 minutes Expected Learning Outcomes: Upon completion of this lesson, students will be able to: 1. Have basic understanding of the major types of accounting ratios; and 2. Understand how to calculate different accounting ratios. Teaching Sequence and Time Allocation:
Activities Reference Time Allocation
Part I: Introduction Brief revision of the 8 accounting ratios, including
Profitability Ratios (Gross Profit Ratio & Net Profit Ratio)
Liquidity Ratios (Current Ratio & Quick Ratio)
Management Efficiency Ratios (Stock Turnover Rate, Credit Period Allowed to Debtors, Credit Period Received from Creditors & Return on Capital Employed)
PPT #1-5
10 minutes
Part II: Content Activity 1: Matching
Matching game of 8 accounting ratios with formulas will be assigned for revision and as a warm-up for the following activities.
Activity 2: Problem Solving Students will be provided with the financial
statements of two companies of a similar scale and industry. They will calculate the eight accounting ratios mentioned in Part I of the two companies.
Students fill in the two columns of Company A and B with calculations of the 8 accounting ratios for the preparation of Activity 3 and 4 in Lesson 2. Financial statements of the two companies will be provided.
PPT #6-7
Student Worksheet
p.1
PPT #8-9
Student Worksheet
pp.2-3
5 minutes
10 minutes
Topic A04: Financial Analysis Topic Overview P.3
BAFS Learning and Teaching Example As at April 2009
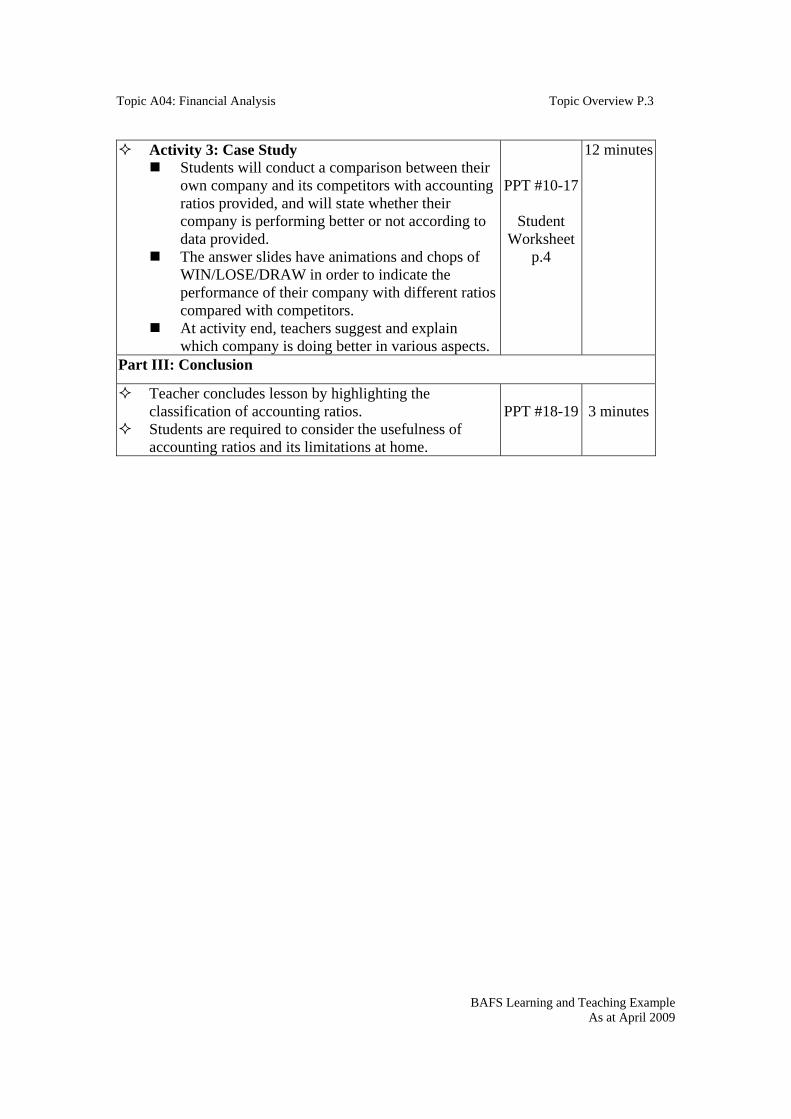
Activity 3: Case Study Students will conduct a comparison between their
own company and its competitors with accounting ratios provided, and will state whether their company is performing better or not according to data provided.
The answer slides have animations and chops of WIN/LOSE/DRAW in order to indicate the performance of their company with different ratios compared with competitors.
At activity end, teachers suggest and explain which company is doing better in various aspects.
PPT #10-17
Student Worksheet
p.4
12 minutes
Part III: Conclusion
Teacher concludes lesson by highlighting the classification of accounting ratios.
Students are required to consider the usefulness of accounting ratios and its limitations at home.
PPT #18-19
3 minutes
Topic A04: Financial Analysis Topic Overview P.4
BAFS Learning and Teaching Example As at April 2009
Lesson 2
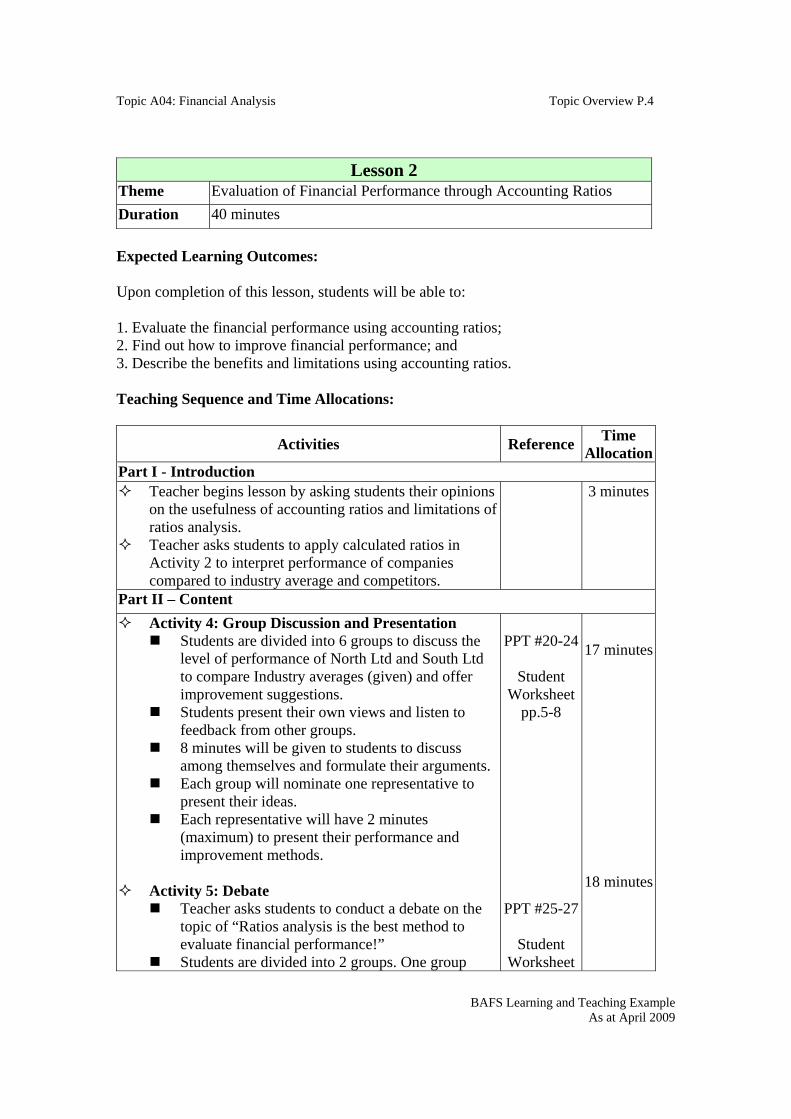
Theme Evaluation of Financial Performance through Accounting Ratios Duration 40 minutes Expected Learning Outcomes: Upon completion of this lesson, students will be able to: 1. Evaluate the financial performance using accounting ratios; 2. Find out how to improve financial performance; and 3. Describe the benefits and limitations using accounting ratios. Teaching Sequence and Time Allocations:
Activities Reference Time Allocation
Part I - Introduction Teacher begins lesson by asking students their opinions
on the usefulness of accounting ratios and limitations of ratios analysis.
Teacher asks students to apply calculated ratios in Activity 2 to interpret performance of companies compared to industry average and competitors.
3 minutes
Part II – Content Activity 4: Group Discussion and Presentation
Students are divided into 6 groups to discuss the level of performance of North Ltd and South Ltd to compare Industry averages (given) and offer improvement suggestions.
Students present their own views and listen to feedback from other groups.
8 minutes will be given to students to discuss among themselves and formulate their arguments.
Each group will nominate one representative to present their ideas.
Each representative will have 2 minutes (maximum) to present their performance and improvement methods.
Activity 5: Debate
Teacher asks students to conduct a debate on the topic of “Ratios analysis is the best method to evaluate financial performance!”
Students are divided into 2 groups. One group
PPT #20-24
Student
Worksheet pp.5-8
PPT #25-27
Student Worksheet
17 minutes
18 minutes
Topic A04: Financial Analysis Topic Overview P.5
BAFS Learning and Teaching Example As at April 2009
assumes the affirmative (benefits of ratios analysis) side and the other as the negative (limitations of ratios analysis) side.
8 minutes will be given to students to discuss among themselves and formulate their arguments.
Each group will nominate two representatives to debate. Each representative has 1 minute to present their views and arguments.
After all 4 representatives have presented, each group will have a representative to give a 1.5-minute concluding remark.
pp.9-10
Part III - Conclusion Teacher concludes lesson by highlighting key points to
students. PPT #28-29
2 minutes
1
BAFS Elective Part Accounting Module -Financial Accounting
Topic A04: Financial Analysis
Technology Education SectionCurriculum Development Institute
Education Bureau, HKSARGApril 2009
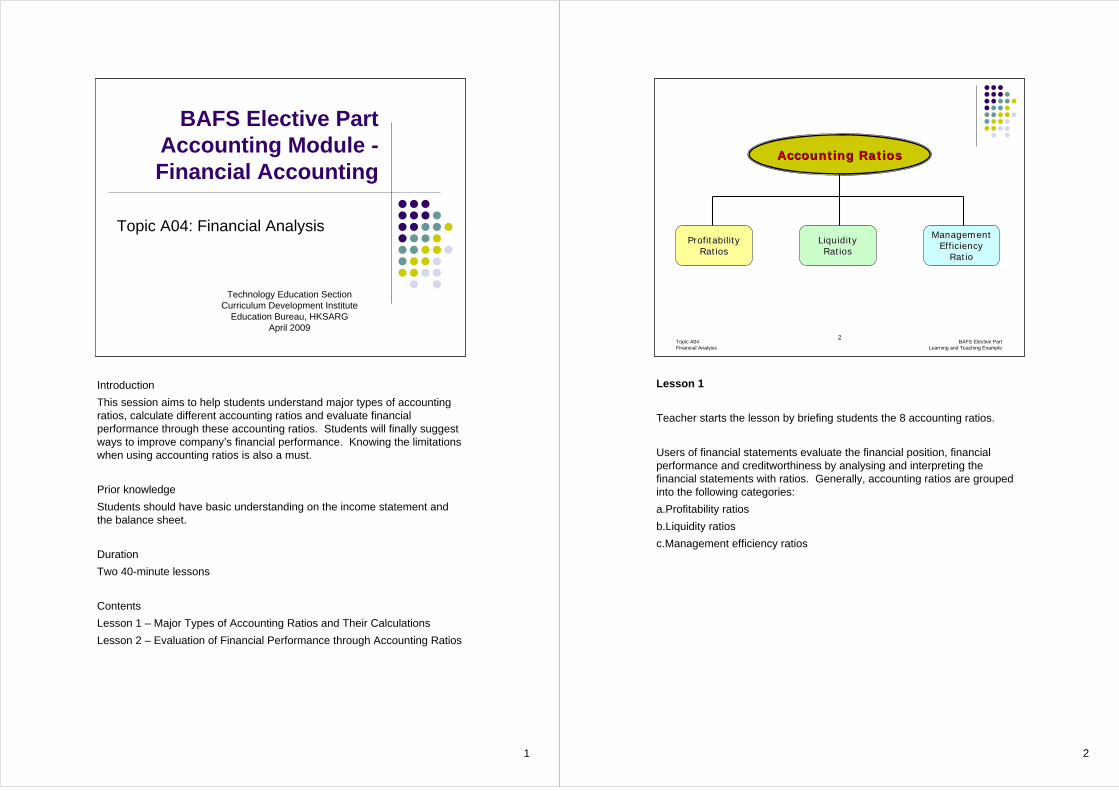
IntroductionThis session aims to help students understand major types of accounting ratios, calculate different accounting ratios and evaluate financial performance through these accounting ratios. Students will finally suggest ways to improve company’s financial performance. Knowing the limitations when using accounting ratios is also a must.
Prior knowledgeStudents should have basic understanding on the income statement and the balance sheet.
DurationTwo 40-minute lessons
ContentsLesson 1 – Major Types of Accounting Ratios and Their CalculationsLesson 2 – Evaluation of Financial Performance through Accounting Ratios
2
2Topic A04Financial Analysis
BAFS Elective PartLearning and Teaching Example
Accounting RatiosAccounting Ratios
Profitability Profitability RatiosRatios
Liquidity Liquidity RatiosRatios
Management Management Efficiency Efficiency
RatioRatio
Lesson 1
Teacher starts the lesson by briefing students the 8 accounting ratios.
Users of financial statements evaluate the financial position, financial performance and creditworthiness by analysing and interpreting the financial statements with ratios. Generally, accounting ratios are grouped into the following categories:a.Profitability ratiosb.Liquidity ratiosc.Management efficiency ratios
3
3Topic A04Financial Analysis
BAFS Elective PartLearning and Teaching Example
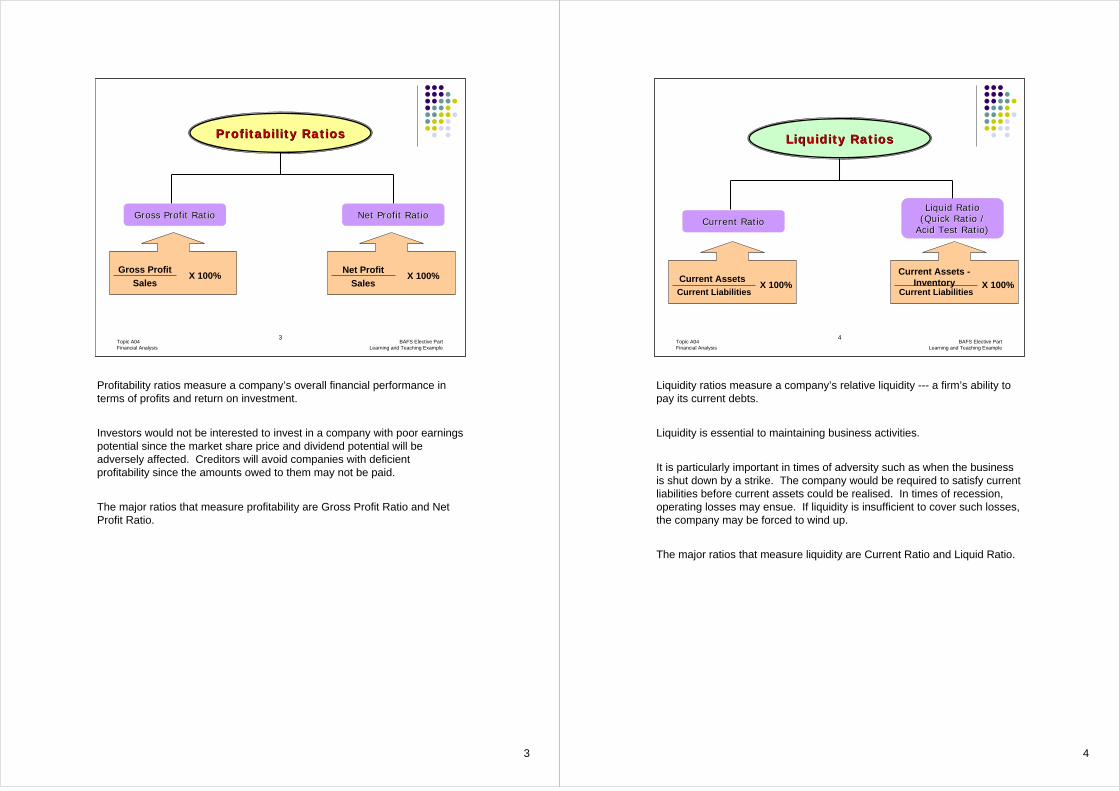
SalesX 100%
Gross Profit
Profitability RatiosProfitability Ratios
Gross Profit RatioGross Profit Ratio Net Profit RatioNet Profit Ratio
SalesX 100%
Net Profit
Profitability ratios measure a company’s overall financial performance in terms of profits and return on investment.
Investors would not be interested to invest in a company with poor earnings potential since the market share price and dividend potential will be adversely affected. Creditors will avoid companies with deficient profitability since the amounts owed to them may not be paid.
The major ratios that measure profitability are Gross Profit Ratio and Net Profit Ratio.
4
4Topic A04Financial Analysis
BAFS Elective PartLearning and Teaching Example
Liquidity RatiosLiquidity Ratios
Current RatioCurrent RatioLiquid Ratio Liquid Ratio
(Quick Ratio / (Quick Ratio / Acid Test Ratio)Acid Test Ratio)
Current LiabilitiesX 100%
Current Assets
Current LiabilitiesX 100%
Current Assets -Inventory
Liquidity ratios measure a company’s relative liquidity --- a firm’s ability to pay its current debts.
Liquidity is essential to maintaining business activities.
It is particularly important in times of adversity such as when the business is shut down by a strike. The company would be required to satisfy current liabilities before current assets could be realised. In times of recession, operating losses may ensue. If liquidity is insufficient to cover such losses, the company may be forced to wind up.
The major ratios that measure liquidity are Current Ratio and Liquid Ratio.
5
5Topic A04Financial Analysis
BAFS Elective PartLearning and Teaching Example
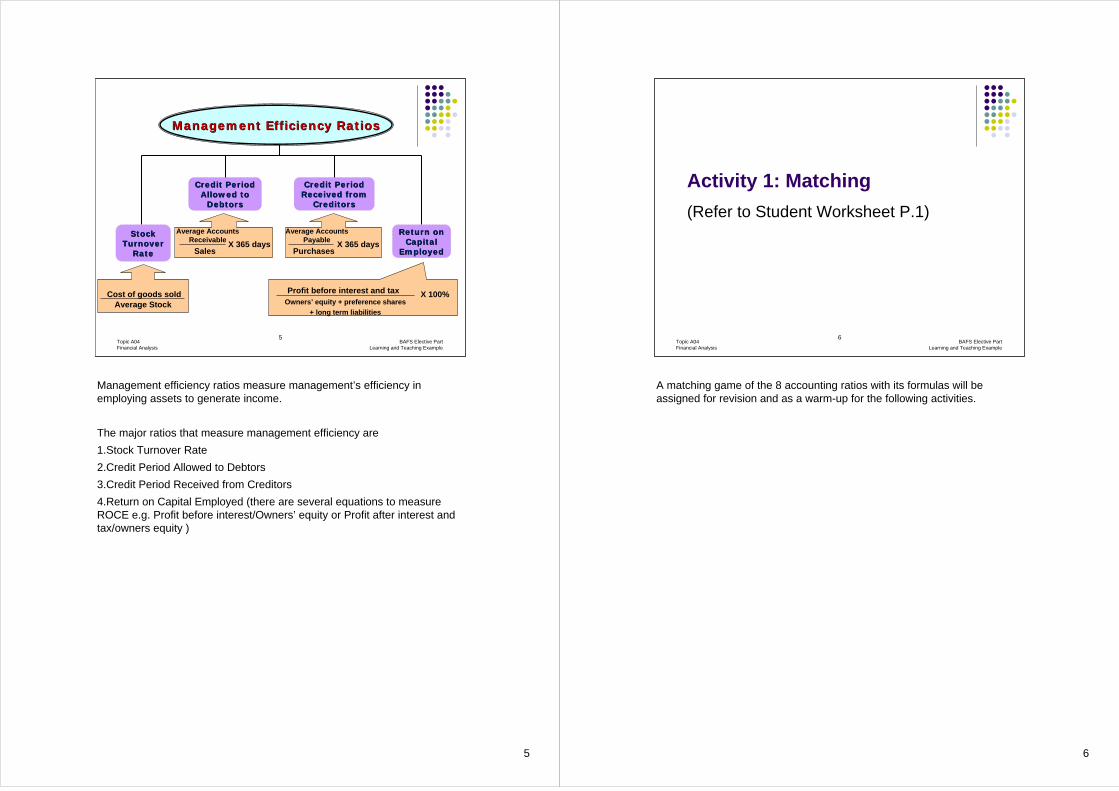
Management Efficiency RatiosManagement Efficiency Ratios
Average StockCost of goods sold
Stock Stock Turnover Turnover
RateRate SalesX 365 days
Average Accounts Receivable
Credit Period Credit Period Allowed to Allowed to
DebtorsDebtors
Credit Period Credit Period Received from Received from
CreditorsCreditors
Return on Return on Capital Capital
EmployedEmployedPurchasesX 365 days
Owners’ equity + preference shares
+ long term liabilities
X 100%Profit before interest and tax
Average Accounts Payable
Management efficiency ratios measure management’s efficiency in employing assets to generate income.
The major ratios that measure management efficiency are 1.Stock Turnover Rate2.Credit Period Allowed to Debtors3.Credit Period Received from Creditors4.Return on Capital Employed (there are several equations to measure ROCE e.g. Profit before interest/Owners’ equity or Profit after interest and tax/owners equity )
6
6Topic A04Financial Analysis
BAFS Elective PartLearning and Teaching Example
Activity 1: Matching
(Refer to Student Worksheet P.1)
A matching game of the 8 accounting ratios with its formulas will be assigned for revision and as a warm-up for the following activities.
7
7Topic A04Financial Analysis
BAFS Elective PartLearning and Teaching Example
BAFS Elective PartLearning and Teaching Example
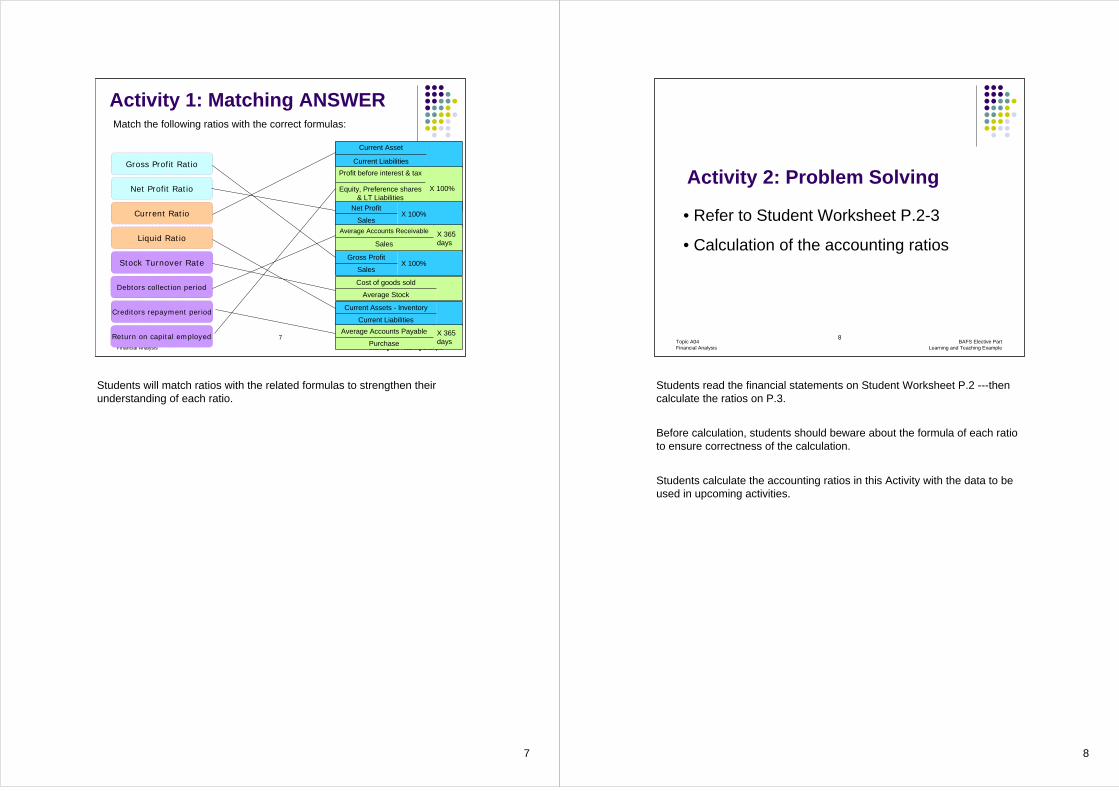
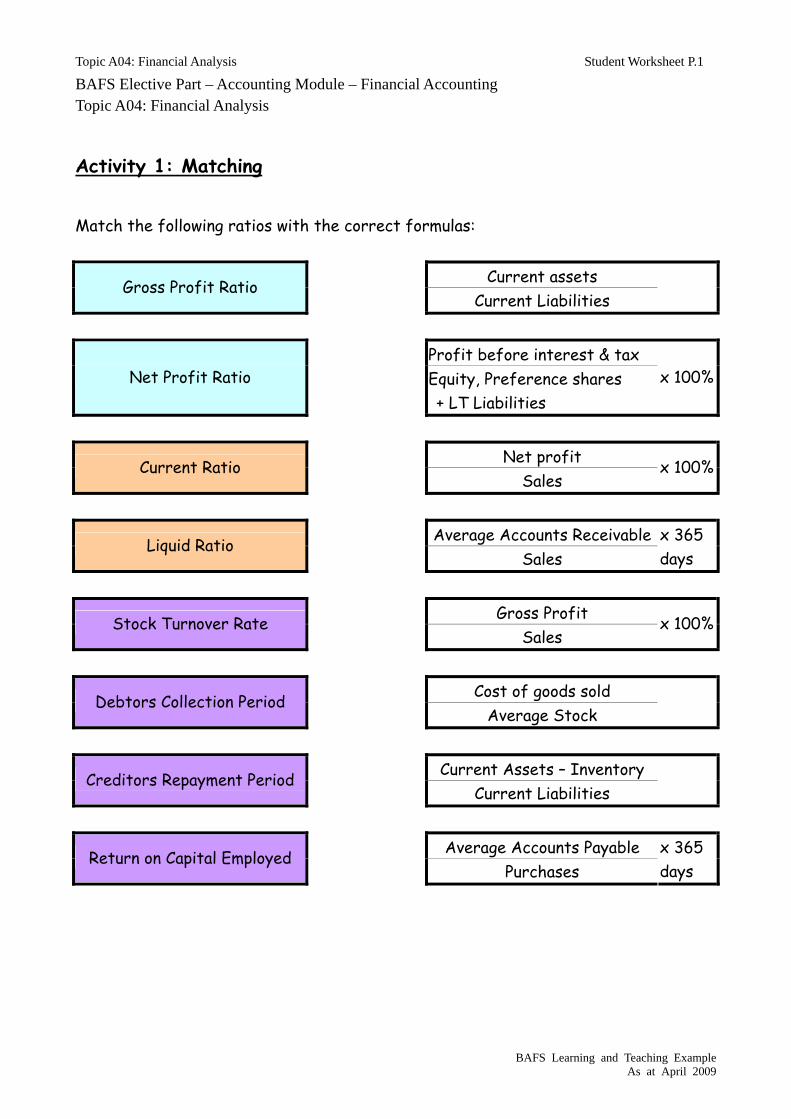
Match the following ratios with the correct formulas:
Gross Profit Ratio
Net Profit Ratio
Current Ratio
Liquid Ratio
Stock Turnover Rate
Debtors collection period
Creditors repayment period
Return on capital employed
Current Asset
Current LiabilitiesProfit before interest & tax
X 100%Equity, Preference shares & LT Liabilities
Net ProfitX 100%
SalesAverage Accounts Receivable X 365
daysSales
Gross ProfitX 100%
Sales
Cost of goods sold
Average Stock
Current Assets - Inventory
Current LiabilitiesAverage Accounts Payable X 365
daysPurchase
Activity 1: Matching ANSWER
Students will match ratios with the related formulas to strengthen their understanding of each ratio.
8
8Topic A04Financial Analysis
BAFS Elective PartLearning and Teaching Example
• Refer to Student Worksheet P.2-3
• Calculation of the accounting ratios
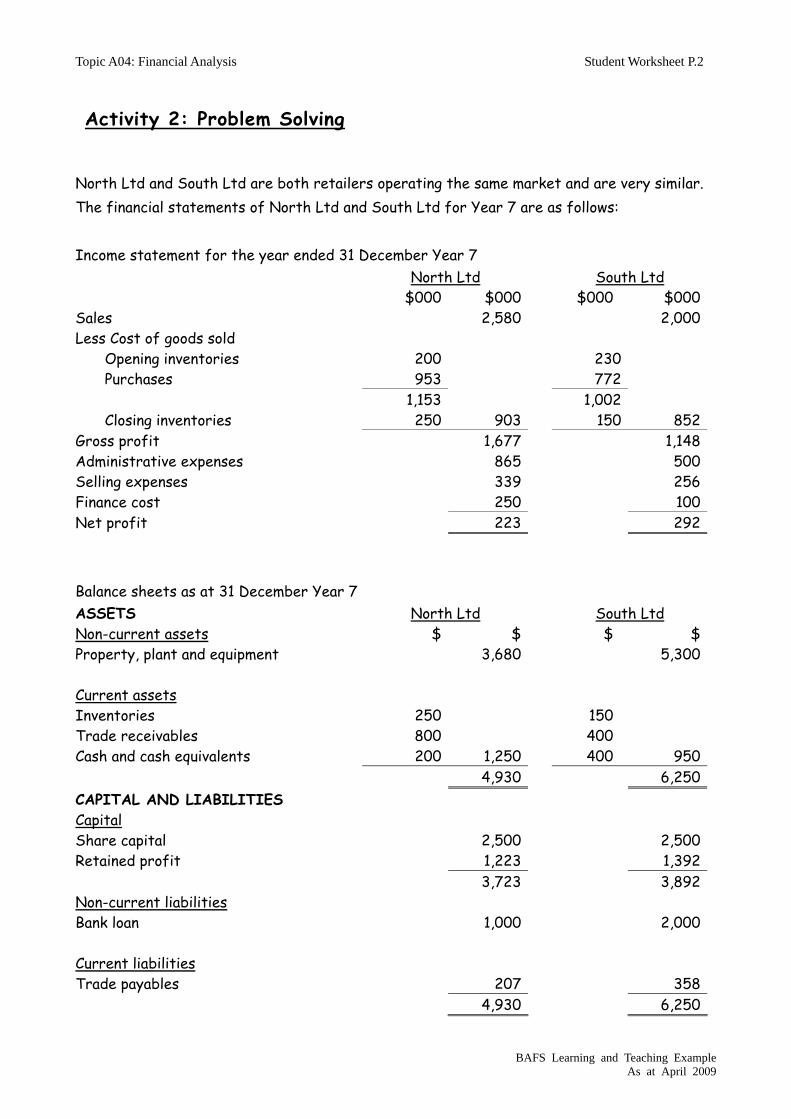
Activity 2: Problem Solving
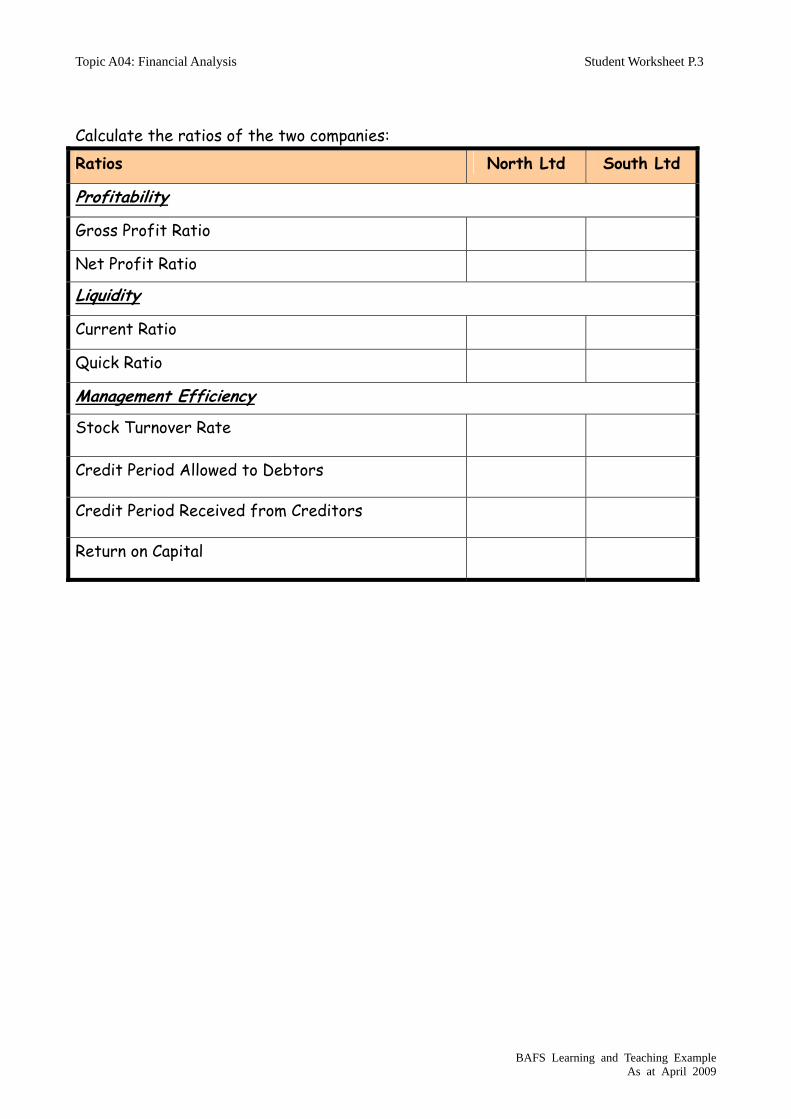
Students read the financial statements on Student Worksheet P.2 ---then calculate the ratios on P.3.
Before calculation, students should beware about the formula of each ratio to ensure correctness of the calculation.
Students calculate the accounting ratios in this Activity with the data to be used in upcoming activities.

9
9Topic A04Financial Analysis
BAFS Elective PartLearning and Teaching Example
Calculate the following ratios of two companies:
Ratios North Ltd South Ltd
ProfitabilityProfitability
Gross Profit Ratio 65% 57.4%Net Profit Ratio 8.6% 14.6%LiquidityLiquidity
Current Ratio 6.0:1 2.7:1Quick Ratio 4.8:1 2.2:1Management EfficiencyManagement Efficiency
Stock Turnover Rate 4.0 times 4.5 timesCredit Period Allowed to Debtors 113 days 73 daysCredit Period Received from Creditors 79 days 169 daysReturn on Capital Employed 10% 6.7%
Activity 2: Suggested ANSWER
Students will calculate the accounting ratios and present their answers.
Formulas:
Gross profit ratio: 1677/2580 (North) / 1148/2000 (South)Net profit ratio: 223/2580 (North) / 292/2000 (South)Current ratio: 1250/207 (North) / 950/358 (South)Quick ratio: (1250-250)/207 (North) / (950-150)/358 (South)Stock turnover ratio: 903/[(200+250)/2] (North) / 852/[(230+150)/2] (South)Credit period allowed to debtors: 800/2580*365days (North) /
400/2000*365days (South)Credit period received from creditors: 207/953*365days (North) /
358/772*365days (South)Return on capital employed: (223+250)/(3723+1000) (North) /
(292+100)/(3892+2000) (South)
10
10Topic A04Financial Analysis
BAFS Elective PartLearning and Teaching Example
Activity 3: Case Study
You are the financial manager of ME Video Game Company Limited. Your staff has calculated accounting ratios of the company and its competitor, PlayGame Company Limited. Based on her workings, please advise your boss which one is better by putting a chop (WIN/LOSE/DRAW) next to that ratio.
Teacher introduces the case to students and ask them to complete the answers to discuss.
11
11Topic A04Financial Analysis
BAFS Elective PartLearning and Teaching Example
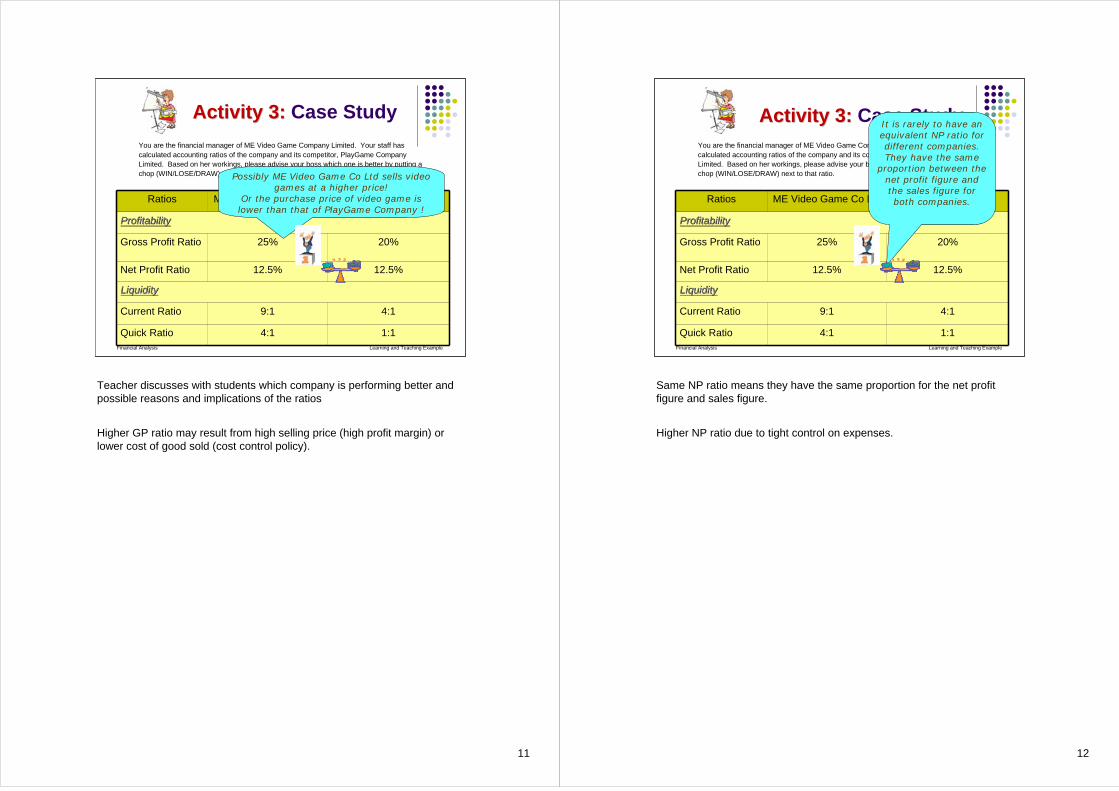
You are the financial manager of ME Video Game Company Limited. Your staff has calculated accounting ratios of the company and its competitor, PlayGame Company Limited. Based on her workings, please advise your boss which one is better by putting a chop (WIN/LOSE/DRAW) next to that ratio.
Activity 3:Activity 3: Case Study
Ratios ME Video Game Co Ltd PlayGame Co Ltd
ProfitabilityProfitability
Gross Profit Ratio 25% 20%
Net Profit Ratio 12.5% 12.5%
LiquidityLiquidity
Current Ratio 9:1 4:1
Quick Ratio 4:1 1:1
Possibly ME Video Game Co Ltd sells video games at a higher price!
Or the purchase price of video game is lower than that of PlayGame Company !
Teacher discusses with students which company is performing better and possible reasons and implications of the ratios
Higher GP ratio may result from high selling price (high profit margin) or lower cost of good sold (cost control policy).
12
12Topic A04Financial Analysis
BAFS Elective PartLearning and Teaching Example
Activity 3:Activity 3: Case StudyYou are the financial manager of ME Video Game Company Limited. Your staff has calculated accounting ratios of the company and its competitor, PlayGame Company Limited. Based on her workings, please advise your boss which one is better by putting a chop (WIN/LOSE/DRAW) next to that ratio.
Ratios ME Video Game Co Ltd PlayGame Co Ltd
ProfitabilityProfitability
Gross Profit Ratio 25% 20%
Net Profit Ratio 12.5% 12.5%
LiquidityLiquidity
Current Ratio 9:1 4:1
Quick Ratio 4:1 1:1
It is rarely to have an equivalent NP ratio for different companies. They have the same
proportion between the net profit figure and the sales figure for both companies.
Same NP ratio means they have the same proportion for the net profit figure and sales figure.
Higher NP ratio due to tight control on expenses.
13
13Topic A04Financial Analysis
BAFS Elective PartLearning and Teaching Example
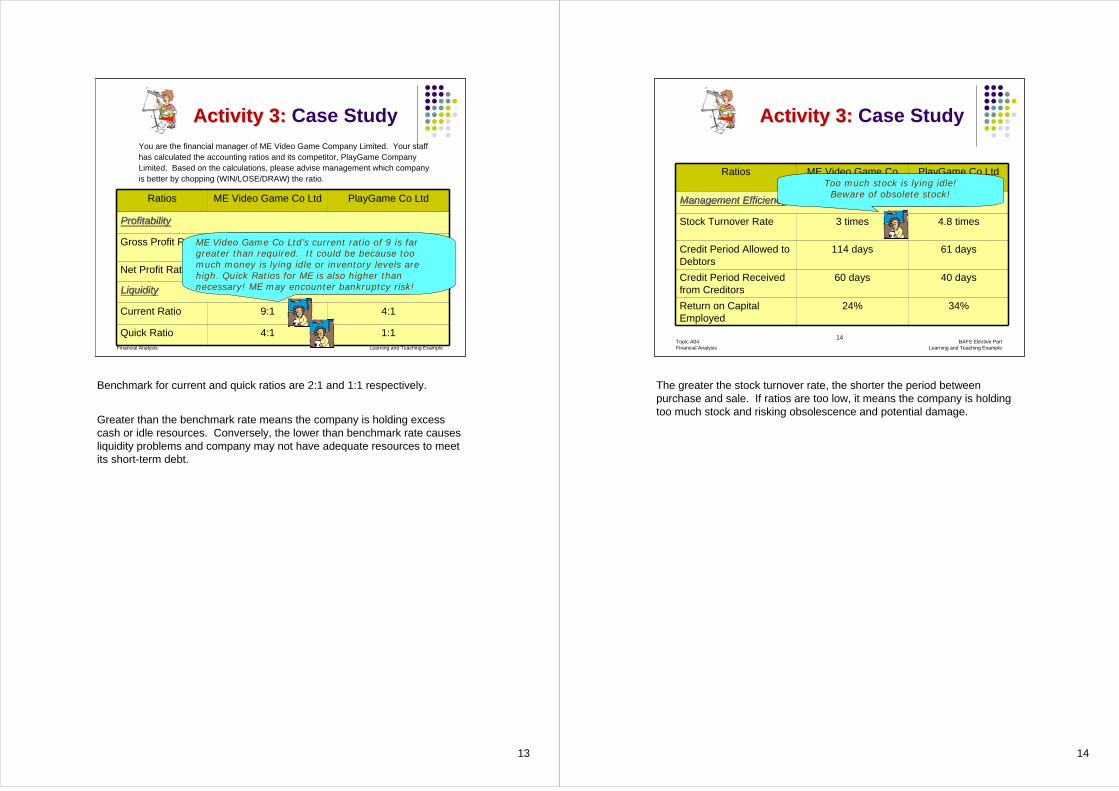
Activity 3:Activity 3: Case StudyYou are the financial manager of ME Video Game Company Limited. Your staff has calculated the accounting ratios and its competitor, PlayGame Company Limited. Based on the calculations, please advise management which company is better by chopping (WIN/LOSE/DRAW) the ratio.
Ratios ME Video Game Co Ltd PlayGame Co Ltd
ProfitabilityProfitability
Gross Profit Ratio 25% 20%
Net Profit Ratio 12.5% 12.5%
LiquidityLiquidity
Current Ratio 9:1 4:1
Quick Ratio 4:1 1:1
ME Video Game Co Ltd’s current ratio of 9 is far greater than required. It could be because too much money is lying idle or inventory levels are high. Quick Ratios for ME is also higher than necessary! ME may encounter bankruptcy risk!
Benchmark for current and quick ratios are 2:1 and 1:1 respectively.
Greater than the benchmark rate means the company is holding excess cash or idle resources. Conversely, the lower than benchmark rate causes liquidity problems and company may not have adequate resources to meet its short-term debt.
14
14Topic A04Financial Analysis
BAFS Elective PartLearning and Teaching Example
Activity 3:Activity 3: Case Study
Ratios ME Video Game Co Ltd
PlayGame Co Ltd
Management EfficiencyManagement Efficiency
Stock Turnover Rate 3 times 4.8 times
Credit Period Allowed to Debtors
114 days 61 days
Credit Period Received from Creditors
60 days 40 days
Return on Capital Employed
24% 34%
Too much stock is lying idle! Beware of obsolete stock!
The greater the stock turnover rate, the shorter the period between purchase and sale. If ratios are too low, it means the company is holding too much stock and risking obsolescence and potential damage.

15
15Topic A04Financial Analysis
BAFS Elective PartLearning and Teaching Example
Activity 3:Activity 3: Case Study
Ratios ME Video Game Co Ltd
PlayGame Co Ltd
Management EfficiencyManagement Efficiency
Stock Turnover Rate 3 times 4.8 times
Credit Period Allowed to Debtors
114 days 61 days
Credit Period Received from Creditors
60 days 40 days
Return on Capital Employed
24% 34%
Not efficient in debt collection!Poor credit controls may result in bad debts!
The shorter the credit period allowed to debtors, the greater the company’s efficiency. Lower ratios mean the company is capable of collecting debts quicker and reduces the chance of bad debts and increases company cash flow.
16
16Topic A04Financial Analysis
BAFS Elective PartLearning and Teaching Example
Activity 3: Activity 3: Case Study
Ratios ME Video Game Co Ltd
PlayGame Co Ltd
Management EfficiencyManagement Efficiency
Stock Turnover Rate 3 times 4.8 times
Credit Period Allowed to Debtors
114 days 61 days
Credit Period Received from Creditors
60 days 40 days
Return on Capital Employed
24% 34%
ME settles accounts payable slowly and can have more $$$ (working capital) for daily
operations!
Contrary to the credit period allowed to debtors, longer credit periods offered from creditors is suggested. It means that the company is capable of maintaining good supplier relationships and a longer period is being allowed. However, credit periods should not be too long as it indicates the company may be risking liquidity problems and thus unable to repay debts.
Moreover, delaying payments may have a negative effect on the company’s image and reputation.
17
17Topic A04Financial Analysis
BAFS Elective PartLearning and Teaching Example
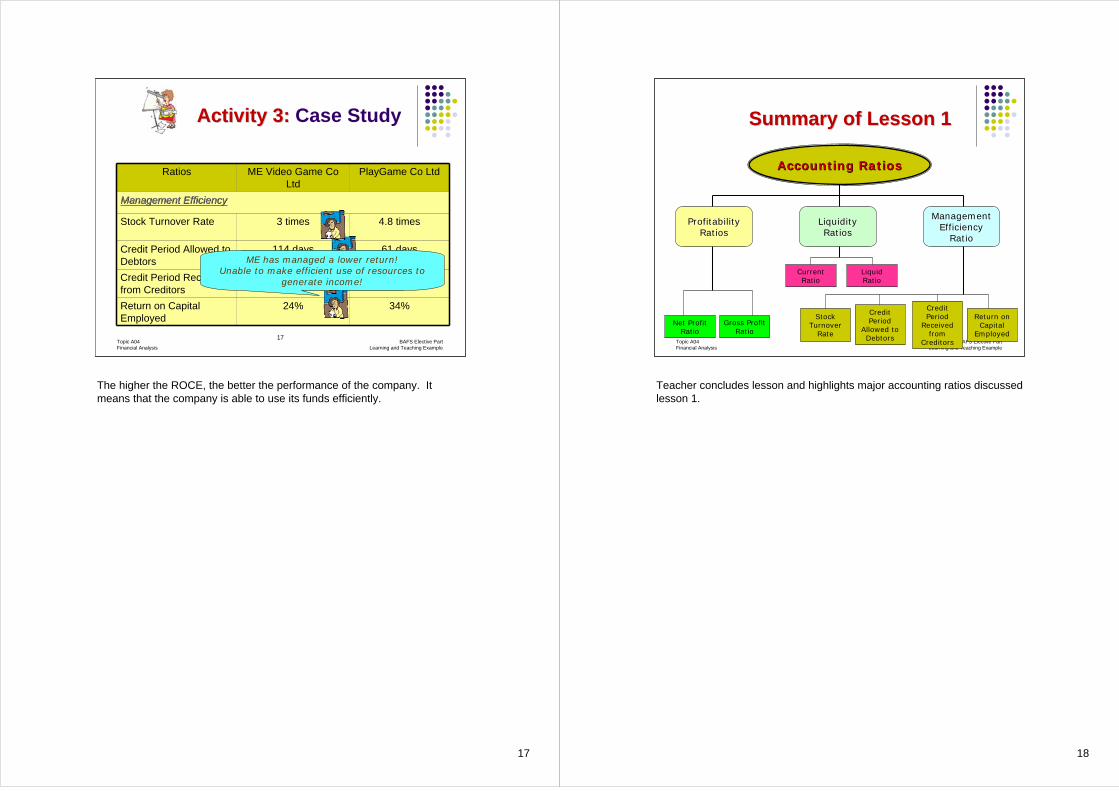
Ratios ME Video Game Co Ltd
PlayGame Co Ltd
Management EfficiencyManagement Efficiency
Stock Turnover Rate 3 times 4.8 times
Credit Period Allowed to Debtors
114 days 61 days
Credit Period Received from Creditors
60 days 40 days
Return on Capital Employed
24% 34%
ME has managed a lower return!Unable to make efficient use of resources to
generate income!
Activity 3:Activity 3: Case Study
The higher the ROCE, the better the performance of the company. It means that the company is able to use its funds efficiently.
18
18Topic A04Financial Analysis
BAFS Elective PartLearning and Teaching Example
Summary of Lesson 1Summary of Lesson 1
Accounting RatiosAccounting Ratios
Profitability Profitability RatiosRatios
Liquidity Liquidity RatiosRatios
Management Management Efficiency Efficiency
RatioRatio
Gross Profit Ratio
Net Profit Ratio
Current Ratio
Liquid Ratio
Stock Turnover
Rate
Credit Period
Received from
Creditors
Return on Capital
Employed
Credit Period
Allowed to Debtors
Teacher concludes lesson and highlights major accounting ratios discussed lesson 1.

19
19Topic A04Financial Analysis
BAFS Elective PartLearning and Teaching Example
Preparation for next lesson
Preparation for next lessonTeacher asks students to consider the usefulness of accounting ratios and the limitation of the ratio analysis.
End of Lesson 1
20
20Topic A04Financial Analysis
BAFS Elective PartLearning and Teaching Example
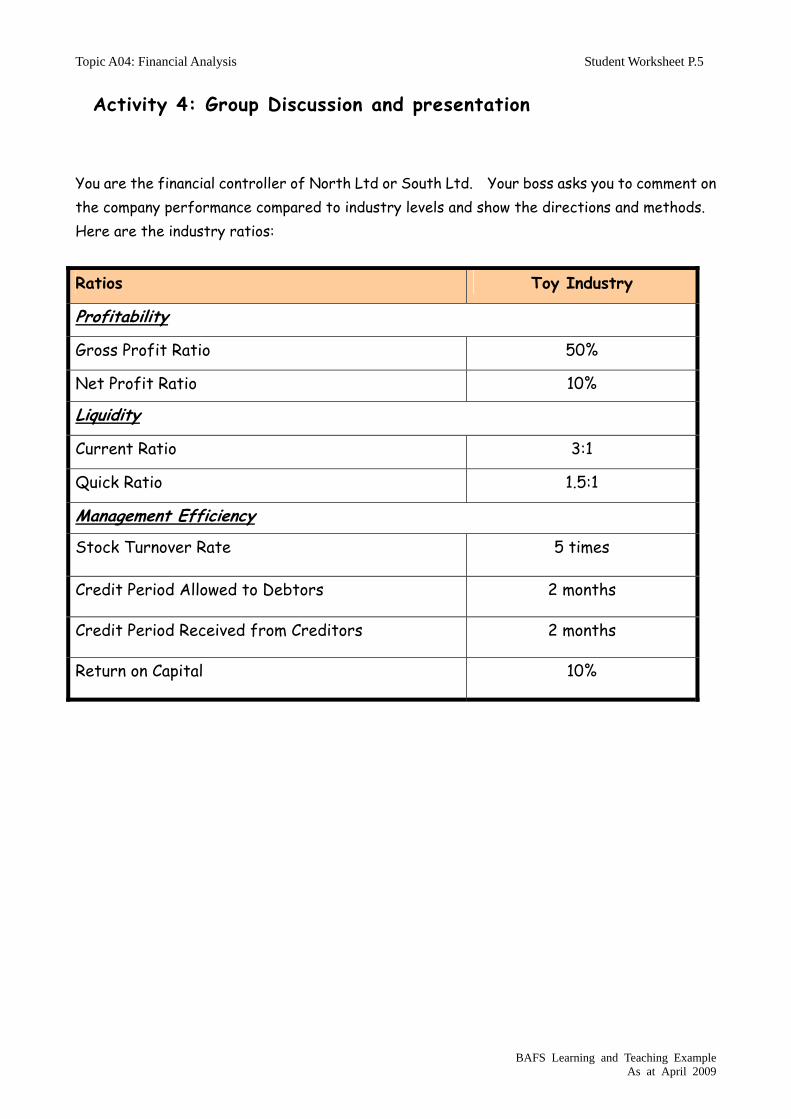
Activity 4: Group Discussion and PresentationYou are the financial controller of North Ltd or South Ltd. Your boss would like you to comment on the performance of the company with industry level and bring out the improvement directions and methods. Here are the industry ratios:
Ratios Toy Industry
ProfitabilityProfitability
Gross Profit Ratio 50%Net Profit Ratio 10%LiquidityLiquidity
Current Ratio 3:1Quick Ratio 1.5:1Management EfficiencyManagement Efficiency
Stock Turnover Rate 5 timesCredit Period Allowed to Debtors 2 monthsCredit Period Received from Creditors 2 monthsReturn on Capital Employed 10%
Lesson 2
Teacher starts the lesson by asking students to use the ratios calculated in Activity 2, to interpret the performance of companies compared with the industry average level and his competitor.
Students are required to divide into 6 groups and their role were assigned as follows:
• Gp1: You are North Ltd financial controller and is responsible for calculating and evaluating the profitability ratio
• Gp2: You are North Ltd financial controller and is responsible for calculating and evaluating the liquidity ratio
• Gp3: You are North Ltd financial controller and is responsible for calculating and evaluating the management efficiency ratio
• Gp4: You are South Ltd financial controller and is responsible for calculating and evaluating the profitability ratio
• Gp5: You are South Ltd financial controller and is responsible for calculating and evaluating the liquidity ratio
• Gp6 You are South Ltd financial controller and is responsible for calculating and evaluating the management efficiency ratio
Students are given 8 minutes to discuss among themselves and formulate their arguments. Representative from each group will present their ideas. 2 minutes will be given to present their performance and improvement methods.
21
21Topic A04Financial Analysis
BAFS Elective PartLearning and Teaching Example
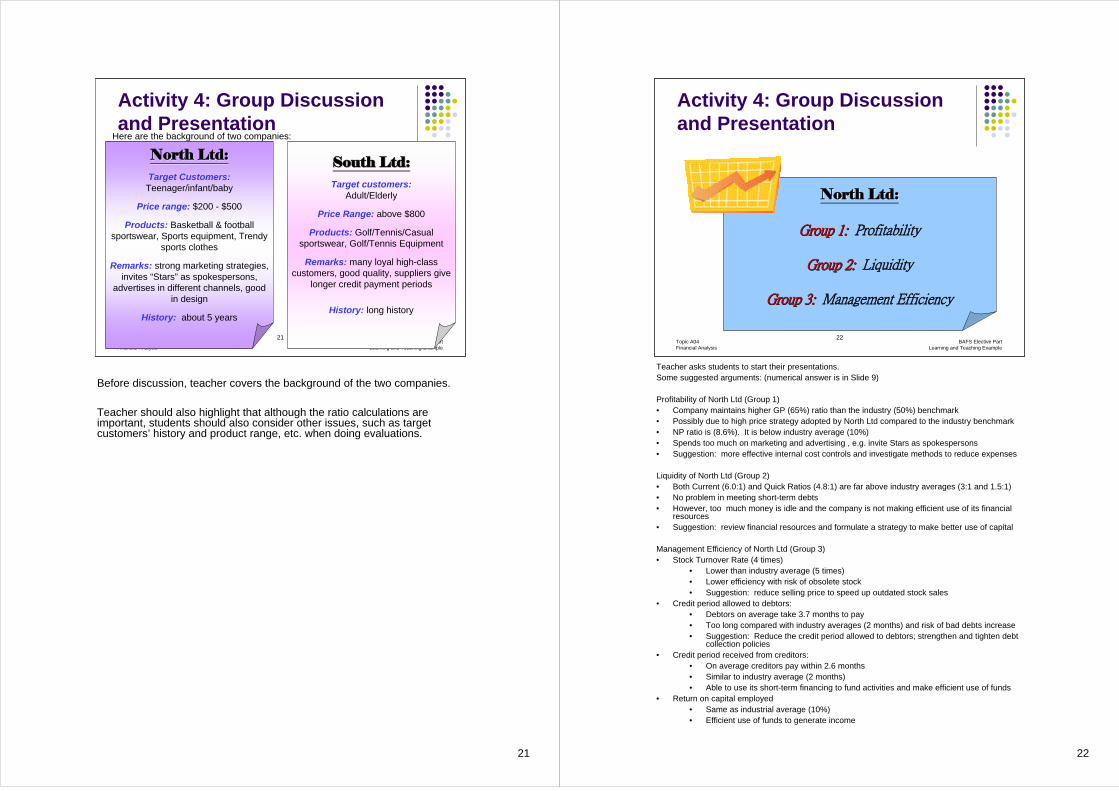
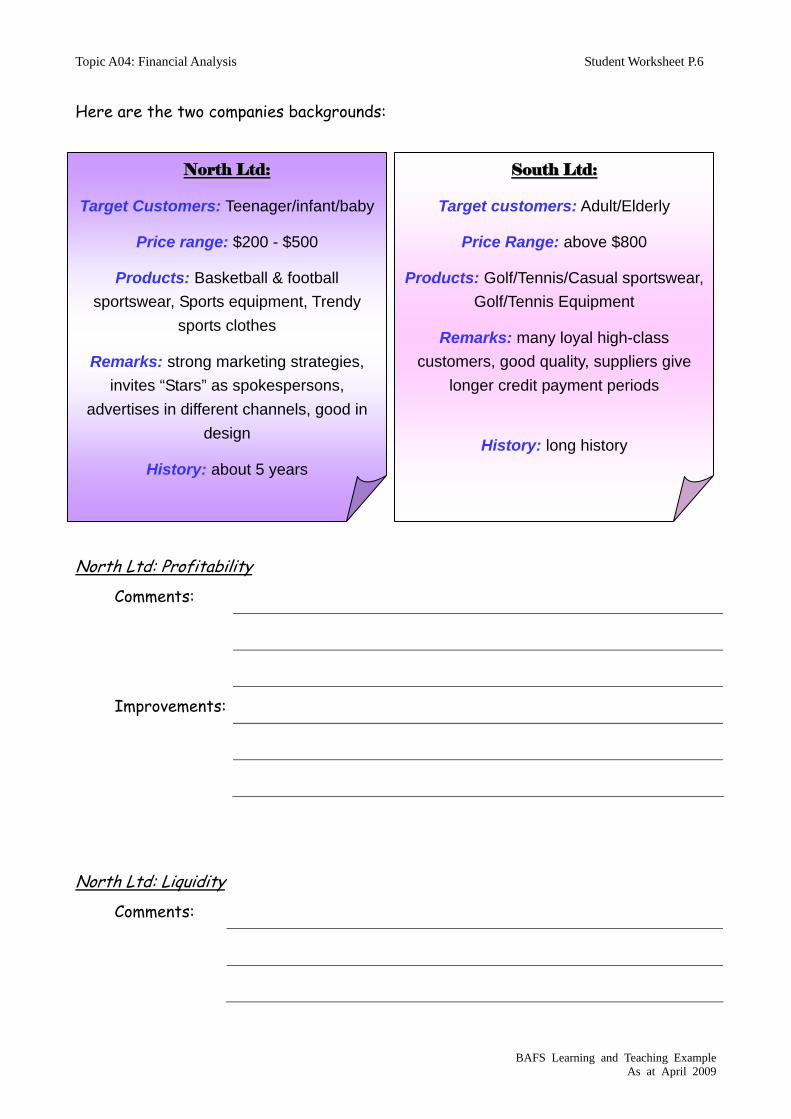
Activity 4: Group Discussion and Presentation
North Ltd:North Ltd:Target Customers:
Teenager/infant/baby
Price range: $200 - $500
Products: Basketball & football sportswear, Sports equipment, Trendy
sports clothes
Remarks: strong marketing strategies, invites “Stars” as spokespersons,
advertises in different channels, good in design
History: about 5 years
Here are the background of two companies:
South Ltd:South Ltd:Target customers:
Adult/Elderly
Price Range: above $800
Products: Golf/Tennis/Casual sportswear, Golf/Tennis Equipment
Remarks: many loyal high-class customers, good quality, suppliers give
longer credit payment periods
History: long history
Before discussion, teacher covers the background of the two companies.
Teacher should also highlight that although the ratio calculations are important, students should also consider other issues, such as target customers’ history and product range, etc. when doing evaluations.
22
22Topic A04Financial Analysis
BAFS Elective PartLearning and Teaching Example
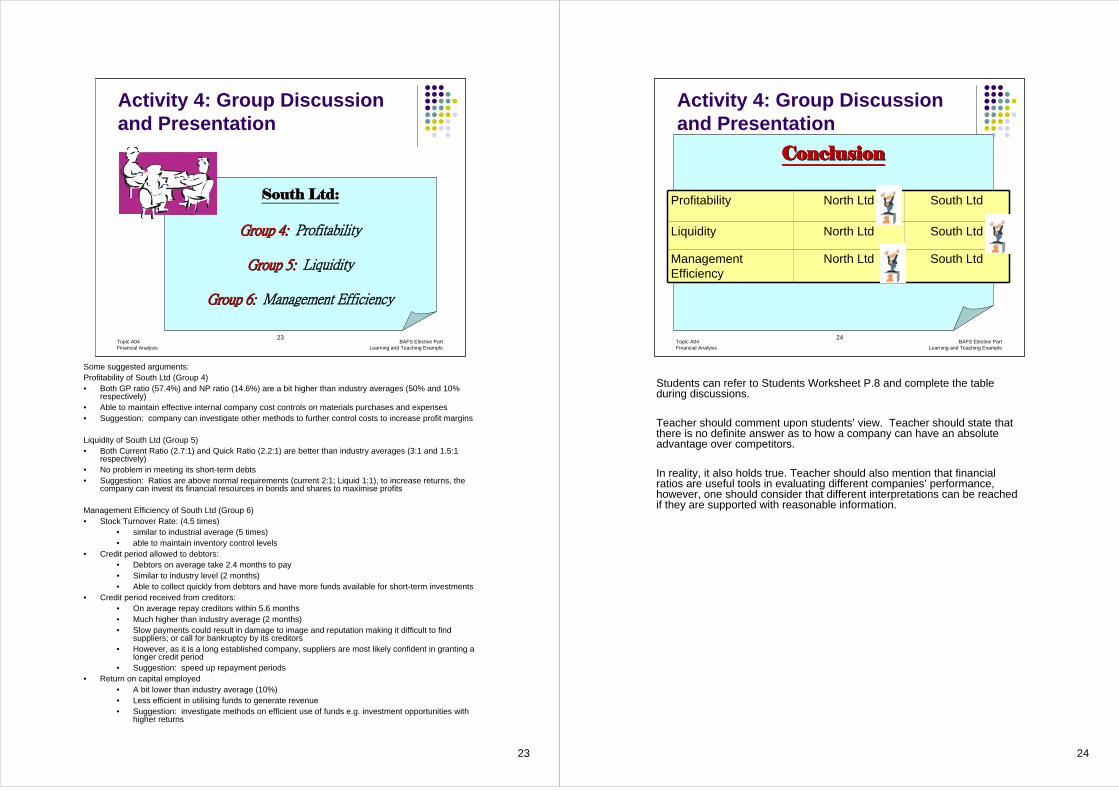
Activity 4: Group Discussion and Presentation
North Ltd:North Ltd:
Group 1: Group 1: Profitability
Group 2: Group 2: Liquidity
Group 3: Group 3: Management Efficiency
Teacher asks students to start their presentations.Some suggested arguments: (numerical answer is in Slide 9)
Profitability of North Ltd (Group 1)• Company maintains higher GP (65%) ratio than the industry (50%) benchmark• Possibly due to high price strategy adopted by North Ltd compared to the industry benchmark• NP ratio is (8.6%). It is below industry average (10%)• Spends too much on marketing and advertising , e.g. invite Stars as spokespersons• Suggestion: more effective internal cost controls and investigate methods to reduce expenses
Liquidity of North Ltd (Group 2)• Both Current (6.0:1) and Quick Ratios (4.8:1) are far above industry averages (3:1 and 1.5:1)• No problem in meeting short-term debts• However, too much money is idle and the company is not making efficient use of its financial
resources• Suggestion: review financial resources and formulate a strategy to make better use of capital
Management Efficiency of North Ltd (Group 3)• Stock Turnover Rate (4 times)
• Lower than industry average (5 times)• Lower efficiency with risk of obsolete stock• Suggestion: reduce selling price to speed up outdated stock sales
• Credit period allowed to debtors:• Debtors on average take 3.7 months to pay• Too long compared with industry averages (2 months) and risk of bad debts increase• Suggestion: Reduce the credit period allowed to debtors; strengthen and tighten debt
collection policies• Credit period received from creditors:
• On average creditors pay within 2.6 months• Similar to industry average (2 months)• Able to use its short-term financing to fund activities and make efficient use of funds
• Return on capital employed• Same as industrial average (10%)• Efficient use of funds to generate income
23
23Topic A04Financial Analysis
BAFS Elective PartLearning and Teaching Example
Activity 4: Group Discussion and Presentation
South Ltd:South Ltd:
Group 4: Group 4: Profitability
Group 5: Group 5: Liquidity
Group 6: Group 6: Management Efficiency
Some suggested arguments:Profitability of South Ltd (Group 4)• Both GP ratio (57.4%) and NP ratio (14.6%) are a bit higher than industry averages (50% and 10%
respectively)• Able to maintain effective internal company cost controls on materials purchases and expenses• Suggestion: company can investigate other methods to further control costs to increase profit margins
Liquidity of South Ltd (Group 5)• Both Current Ratio (2.7:1) and Quick Ratio (2.2:1) are better than industry averages (3:1 and 1.5:1
respectively)• No problem in meeting its short-term debts• Suggestion: Ratios are above normal requirements (current 2:1; Liquid 1:1), to increase returns, the
company can invest its financial resources in bonds and shares to maximise profits
Management Efficiency of South Ltd (Group 6)• Stock Turnover Rate: (4.5 times)
• similar to industrial average (5 times)• able to maintain inventory control levels
• Credit period allowed to debtors:• Debtors on average take 2.4 months to pay• Similar to industry level (2 months)• Able to collect quickly from debtors and have more funds available for short-term investments
• Credit period received from creditors:• On average repay creditors within 5.6 months• Much higher than industry average (2 months)• Slow payments could result in damage to image and reputation making it difficult to find
suppliers; or call for bankruptcy by its creditors• However, as it is a long established company, suppliers are most likely confident in granting a
longer credit period• Suggestion: speed up repayment periods
• Return on capital employed• A bit lower than industry average (10%)• Less efficient in utilising funds to generate revenue• Suggestion: investigate methods on efficient use of funds e.g. investment opportunities with
higher returns
24
24Topic A04Financial Analysis
BAFS Elective PartLearning and Teaching Example
Activity 4: Group Discussion and Presentation
ConclusionConclusion
Profitability North Ltd South Ltd
Liquidity North Ltd South Ltd
Management Efficiency
North Ltd South Ltd
Students can refer to Students Worksheet P.8 and complete the table during discussions.
Teacher should comment upon students’ view. Teacher should state that there is no definite answer as to how a company can have an absolute advantage over competitors.
In reality, it also holds true. Teacher should also mention that financial ratios are useful tools in evaluating different companies’ performance, however, one should consider that different interpretations can be reached if they are supported with reasonable information.
25
25Topic A04Financial Analysis
BAFS Elective PartLearning and Teaching Example
‘‘Ratios analysis is the best Ratios analysis is the best method to evaluate financial method to evaluate financial
performance!performance!’’
Activity 5: Debate
Teacher asks students to conduct a debate on the statement: ‘Ratios analysis is the best method to evaluate company performance!’
Divide students into 5 groups. Each group will divide into half, as the affirmative (benefits of ratios analysis) side and the negative (limitations of ratios analysis) side. 8 minutes is granted to discuss the statement. Both sides need to formulate arguments and present their views within the group. Teacher should use the last 5 minutes to make conclusions regarding the debate topics
26
26Topic A04Financial Analysis
BAFS Elective PartLearning and Teaching Example
Activity 5: Debate
‘‘Ratios analysis is the best Ratios analysis is the best method to evaluate financial method to evaluate financial
performance!performance!’’
Some suggested arguments for the proposition (Benefits of ratios analysis):
•Helpful to review trends between periods for the same company•Useful to compare a company with industry competitors, especially with companies in different countries because figures are stated in terms of standard units e.g. %, times etc.•Provides a complete picture of an entity compared to financial statements•Provides pointers towards interest areas of a company •Overtrading can be financially disastrous and ratios can be used to identify it.
27
27Topic A04Financial Analysis
BAFS Elective PartLearning and Teaching Example
‘‘Ratios analysis is the best Ratios analysis is the best method to evaluate financial method to evaluate financial
performance!performance!’’
Activity 5: Debate
Some suggested arguments against the proposition (Limitations of ratios analysis):
•Companies may adopt different accounting policies/standards and resulting figures are difficult to compare•Different definitions of accounting ratios for different analysts e.g. Earnings before interest and tax, Earnings before tax, Earnings after interest and tax etc•Ratios are calculated using averages or ending values and difficult to identify seasonal business fluctuations•Not applicable for different industries and different size comparisons•Use of misleading ratios may result in poor quality decision making
28
28Topic A04Financial Analysis
BAFS Elective PartLearning and Teaching Example
Summary of Lesson 2
Ratio analysis has benefits and limitations. However, without ratios, comparisons are difficult to make between different financial statements and stakeholders do not have enough information for decision-making.With ratios, financial statements can be interpreted and applied to satisfy user requirements.So, ratio analysis is still the common method to effectively evaluate companies.
Teacher concludes the lesson by highlighting the key points.
29Topic A04Financial Analysis
BAFS Elective PartLearning and Teaching Example
The End
End of Lesson 2
Topic A04: Financial Analysis Student Worksheet P.1
BAFS Learning and Teaching Example As at April 2009
BAFS Elective Part – Accounting Module – Financial Accounting Topic A04: Financial Analysis
Activity 1: Matching
Match the following ratios with the correct formulas:
Current assets Gross Profit Ratio Current Liabilities
Profit before interest & tax
Net Profit Ratio Equity, Preference shares + LT Liabilities
x 100%
Net profit Current Ratio Sales
x 100%
Average Accounts Receivable Liquid Ratio Sales
x 365 days
Gross Profit Stock Turnover Rate Sales
x 100%
Cost of goods sold Debtors Collection Period Average Stock
Current Assets – Inventory Creditors Repayment Period Current Liabilities
Average Accounts Payable Return on Capital Employed Purchases
x 365 days
Topic A04: Financial Analysis Student Worksheet P.2
BAFS Learning and Teaching Example As at April 2009
North Ltd and South Ltd are both retailers operating the same market and are very similar. The financial statements of North Ltd and South Ltd for Year 7 are as follows: Income statement for the year ended 31 December Year 7 North Ltd South Ltd $000 $000 $000 $000 Sales 2,580 2,000 Less Cost of goods sold Opening inventories 200 230 Purchases 953 772 1,153 1,002 Closing inventories 250 903 150 852 Gross profit 1,677 1,148 Administrative expenses 865 500 Selling expenses 339 256 Finance cost 250 100 Net profit 223 292 Balance sheets as at 31 December Year 7 ASSETS North Ltd South Ltd Non-current assets $ $ $ $ Property, plant and equipment 3,680 5,300
Current assets Inventories 250 150 Trade receivables 800 400 Cash and cash equivalents 200 1,250 400 950 4,930 6,250 CAPITAL AND LIABILITIES Capital Share capital 2,500 2,500 Retained profit 1,223 1,392 3,723 3,892 Non-current liabilities Bank loan 1,000 2,000 Current liabilities Trade payables 207 358 4,930 6,250
Activity 2: Problem Solving
Topic A04: Financial Analysis Student Worksheet P.3
BAFS Learning and Teaching Example As at April 2009
Calculate the ratios of the two companies: Ratios North Ltd South Ltd
Profitability
Gross Profit Ratio
Net Profit Ratio
Liquidity
Current Ratio
Quick Ratio
Management Efficiency
Stock Turnover Rate
Credit Period Allowed to Debtors
Credit Period Received from Creditors
Return on Capital
Topic A04: Financial Analysis Student Worksheet P.4
BAFS Learning and Teaching Example As at April 2009
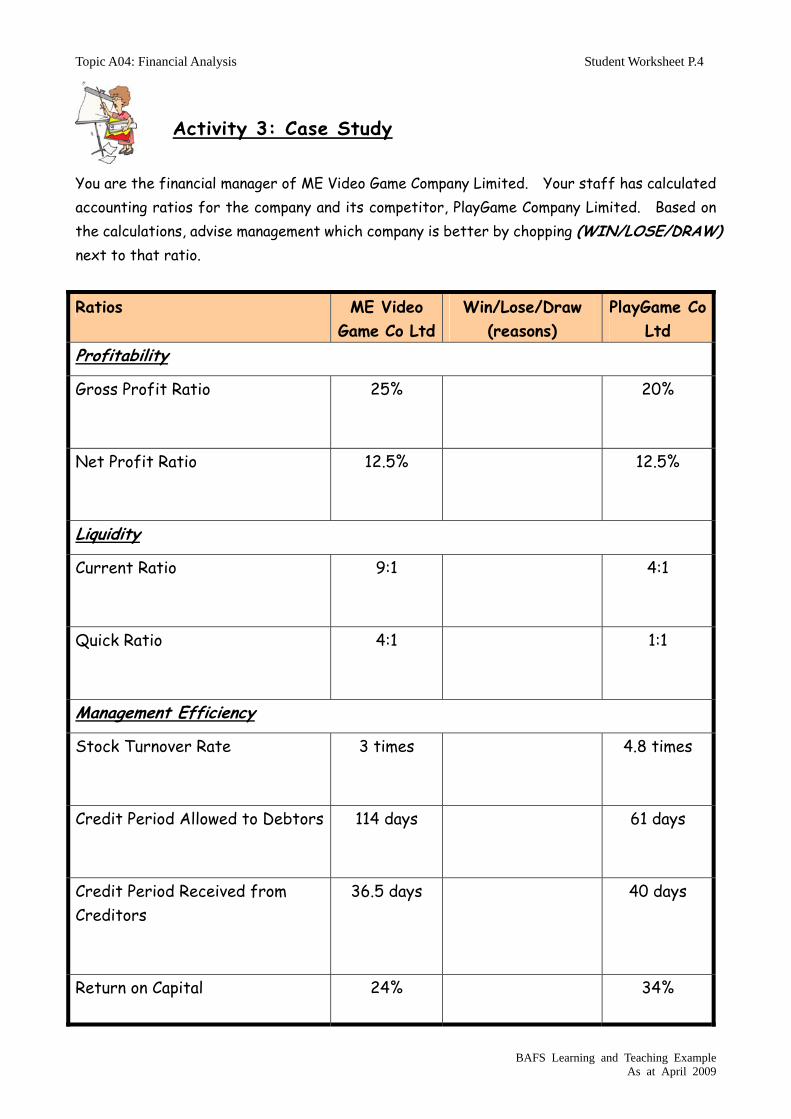
You are the financial manager of ME Video Game Company Limited. Your staff has calculated accounting ratios for the company and its competitor, PlayGame Company Limited. Based on the calculations, advise management which company is better by chopping (WIN/LOSE/DRAW) next to that ratio. Ratios ME Video
Game Co Ltd Win/Lose/Draw
(reasons) PlayGame Co
Ltd Profitability
Gross Profit Ratio
25% 20%
Net Profit Ratio
12.5% 12.5%
Liquidity
Current Ratio
9:1 4:1
Quick Ratio
4:1 1:1
Management Efficiency
Stock Turnover Rate
3 times 4.8 times
Credit Period Allowed to Debtors
114 days 61 days
Credit Period Received from Creditors
36.5 days 40 days
Return on Capital
24% 34%
Activity 3: Case Study
Topic A04: Financial Analysis Student Worksheet P.5
BAFS Learning and Teaching Example As at April 2009
You are the financial controller of North Ltd or South Ltd. Your boss asks you to comment on the company performance compared to industry levels and show the directions and methods. Here are the industry ratios:
Ratios Toy Industry
Profitability
Gross Profit Ratio 50%
Net Profit Ratio 10%
Liquidity
Current Ratio 3:1
Quick Ratio 1.5:1
Management Efficiency
Stock Turnover Rate 5 times
Credit Period Allowed to Debtors 2 months
Credit Period Received from Creditors 2 months
Return on Capital 10%
Activity 4: Group Discussion and presentation
Topic A04: Financial Analysis Student Worksheet P.6
BAFS Learning and Teaching Example As at April 2009
Here are the two companies backgrounds: North Ltd: Profitability
Comments:
Improvements:
North Ltd: Liquidity
Comments:
NNoorrtthh LLttdd::
Target Customers: Teenager/infant/baby
Price range: $200 - $500
Products: Basketball & football sportswear, Sports equipment, Trendy
sports clothes
Remarks: strong marketing strategies, invites “Stars” as spokespersons,
advertises in different channels, good in design
History: about 5 years
SSoouutthh LLttdd::
Target customers: Adult/Elderly
Price Range: above $800
Products: Golf/Tennis/Casual sportswear, Golf/Tennis Equipment
Remarks: many loyal high-class customers, good quality, suppliers give
longer credit payment periods
History: long history
Topic A04: Financial Analysis Student Worksheet P.7
BAFS Learning and Teaching Example As at April 2009
Improvements:
North Ltd: Management Efficiency
Comments:
Improvements:
South Ltd: Profitability
Comments:
Improvements:
South Ltd: Liquidity
Comments:
Topic A04: Financial Analysis Student Worksheet P.8
BAFS Learning and Teaching Example As at April 2009
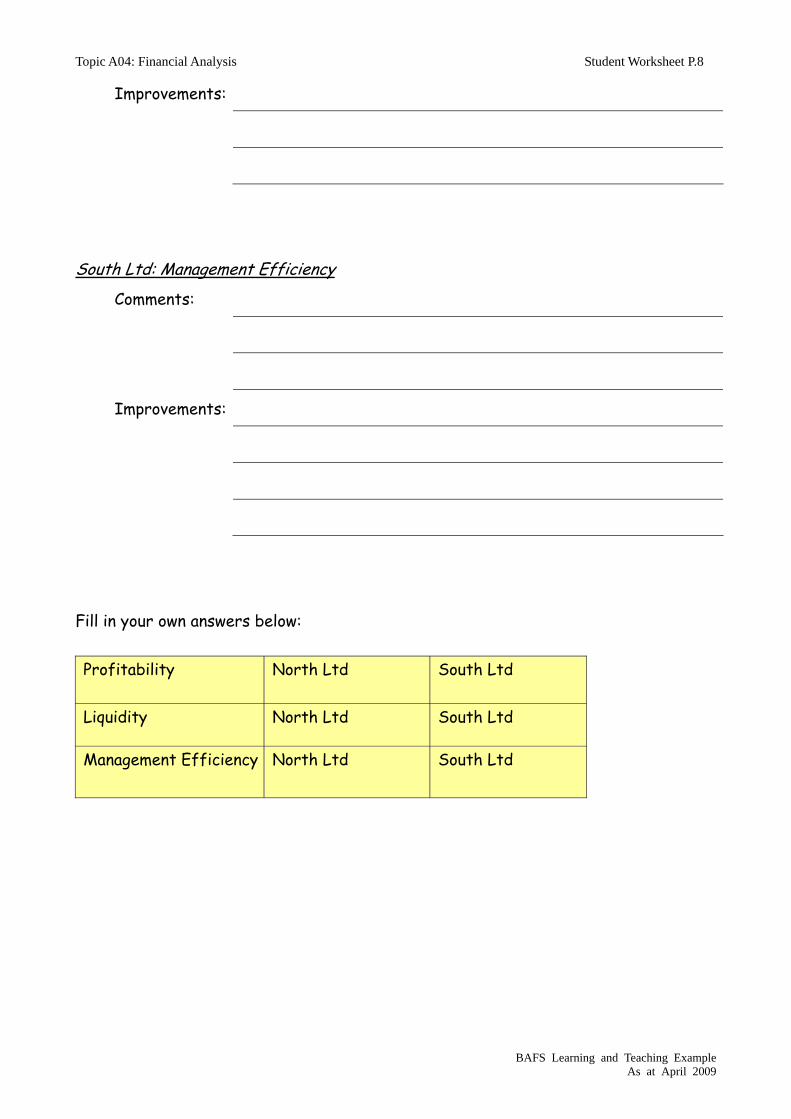
Improvements:
South Ltd: Management Efficiency
Comments:
Improvements:
Fill in your own answers below: Profitability North Ltd South Ltd
Liquidity North Ltd South Ltd
Management Efficiency North Ltd South Ltd
Topic A04: Financial Analysis Student Worksheet P.9
BAFS Learning and Teaching Example As at April 2009
‘‘RRaattiiooss aannaallyyssiiss iiss tthhee bbeesstt mmeetthhoodd ttoo eevvaalluuaattee ffiinnaanncciiaall
ppeerrffoorrmmaannccee!!’’ Write your arguments For and Against this statement. Arguments FOR the statement:
1.
2.
3.
4.
5.
6.
7.
8.
9.
10.
Activity 5: Debate
Topic A04: Financial Analysis Student Worksheet P.10
BAFS Learning and Teaching Example As at April 2009
Arguments AGAINST the statement:
1.
2.
3.
4.
5.
6.
7.
8.
9.
10.


![Supplementary Notes for BAFS Curriculum - …edblog.hkedcity.net/te_bafs_e/wp-content/blogs/1683/uploads/BAFS...[Updated as at August 2013] Page 1 of 26 Supplementary Notes for BAFS](https://img.pdfslide.us/doc/110x75/5ab503cb7f8b9a6e1c8c63ff/supplementary-notes-for-bafs-curriculum-updated-as-at-august-2013-page-1.jpg)