Embed Size (px)
Citation preview

sensors
Article
A WoT-Based Method for Creating Digital Sentinel Twins ofIoT Devices
Ivan Lopez-Arevalo 1,† , Jose Luis Gonzalez-Compean 1,*,† , Mariana Hinojosa-Tijerina 1,† ,Cristhian Martinez-Rendon 2,† , Raffaele Montella 3,† and Jose L. Martinez-Rodriguez 4,†
�����������������
Citation: Lopez-Arevalo, I.;
Gonzalez-Compean, J.L.;
Hinojosa-Tijerina, M.;
Martinez-Rendon, C.; Montella, R.;
Martinez-Rodriguez, J.L. A
WoT-Based Method for Creating
Digital Sentinel Twins of IoT Devices.
Sensors 2021, 21, 5531. https://
doi.org/10.3390/s21165531
Academic Editor: Antonio Puliafito
Received: 13 July 2021
Accepted: 10 August 2021
Published: 17 August 2021
Publisher’s Note: MDPI stays neutral
with regard to jurisdictional claims in
published maps and institutional affil-
iations.
Copyright: © 2021 by the authors.
Licensee MDPI, Basel, Switzerland.
This article is an open access article
distributed under the terms and
conditions of the Creative Commons
Attribution (CC BY) license (https://
creativecommons.org/licenses/by/
4.0/).
1 Cinvestav Tamaulipas, Victoria 87130, Mexico; [email protected] (I.L.-A.);[email protected] (M.H.-T.)
2 ARCOS Research Group, University Carlos III of Madrid, 28911 Leganes, Spain;[email protected]
3 Department of Science and Technologies, University of Napoli Parthenope, 80133 Napoli, Italy;[email protected]
4 Reynosa Rodhe Multidisciplinary Academic Unit, Autonomous University of Tamaulipas,Reynosa 88779, Mexico; [email protected]
* Correspondence: [email protected]† These authors contributed equally to this work.
Abstract: The data produced by sensors of IoT devices are becoming keystones for organizations toconduct critical decision-making processes. However, delivering information to these processes inreal-time represents two challenges for the organizations: the first one is achieving a constant dataflowfrom IoT to the cloud and the second one is enabling decision-making processes to retrieve data fromdataflows in real-time. This paper presents a cloud-based Web of Things method for creating digitaltwins of IoT devices (named sentinels).The novelty of the proposed approach is that sentinels createan abstract window for decision-making processes to: (a) find data (e.g., properties, events, and datafrom sensors of IoT devices) or (b) invoke functions (e.g., actions and tasks) from physical devices (PD),as well as from virtual devices (VD). In this approach, the applications and services of decision-makingprocesses deal with sentinels instead of managing complex details associated with the PDs, VDs,and cloud computing infrastructures. A prototype based on the proposed method was implementedto conduct a case study based on a blockchain system for verifying contract violation in sensors usedin product transportation logistics. The evaluation showed the effectiveness of sentinels enablingorganizations to attain data from IoT sensors and the dataflows used by decision-making processesto convert these data into useful information.
Keywords: digital twins; IoT data; microservices; cloud computing; Web of Things; virtual containers
1. Introduction
IoT devices are becoming a key element in decision-making processes [1–3]. Thesedevices are quite common in multiple infrastructures, such as Industry 4.0 [4], healthcaredomain [5], and supply chains [6], to name a few. The data produced by these devicesfollow a lifecycle from the sensors to the edge [7], to the fog [4], and to the cloud [8]. In thislifecycle, data are acquired (mainly at the edge [9]), prepared and analyzed (typically at thefog or the cloud [10]), and finally converted into information for human consumption to useit in decision-making processes (mainly at the cloud [8] through end-user devices). In thesetypes of infrastructures (any combination of edge, fog, or cloud), the virtual containers (VC)are key to deploy services on each infrastructure [11–13]. These services provide dataflowsfrom the IoT to the cloud that produce different types of data and information, whichproves to be key for organizations to conduct critical decision-making processes [14–16].
However, extracting data and information from these dataflows to deliver it todecision-making processes in real-time represents a huge challenge in two directions:the first one is verifying the accomplishment of a constant dataflow from IoT to the cloud;
Sensors 2021, 21, 5531. https://doi.org/10.3390/s21165531 https://www.mdpi.com/journal/sensors

Sensors 2021, 21, 5531 2 of 20
and the second one is enabling decision-making processes to retrieve, in real-time, dataand information from different points of dataflows. These data acquisition tasks throughdataflows are not straightforward because of the heterogeneity of the components par-ticipating in a dataflow (applications, types of sensors, data formats, infrastructures [17],to name a few). It is desirable a manner not just to acquire data and information fromdataflows, but also to invoke actions and tasks on the dataflow components. That couldfacilitate tasks on decision-making analysis.
We propose to create digital twins of the IoT data acquirers (hardware, physical ma-chine, or virtual container, application, or microservice) by using Web of Things cards (WoT)(www.w3.org/WoT accessed on 5 August 2021) for decision-making process to retrieve,in real time, data and information or invoke actions or tasks. A digital twin is an abstractrepresentation commonly used in Industry 4.0 for IoT device monitoring [18]; that is, avirtual replica of objects or processes that simulate the behavior of their real counterparts.WoT is an initiative for representing and managing definitions of IoT artifacts (devices,components, applications, etc.), which suggests using a set of well-accepted protocols fromthe Semantic Web for any IoT artifact from the physical world to be available into the WorldWide Web by creating a net of WoT definitions [19].
In this paper, we present the design, implementation, and evaluation of a cloud-basedWoT method for creating digital sentinel twins (DST) of IoT devices. A DST creates anabstract window for decision-making processes to attain information and data, such asproperties, events, and data produced by sensors, and to invoke actions or tasks fromIoT devices. An IoT device is a physical device (PD) with sensors and tasks that can beaccessed directly or through a virtual device (VD). A VD is an application or microserviceencapsulated into a virtual container for acquiring, extracting, processing, monitoring, andanalyzing data from PDs. Figure 1 shows an example of the process used by a DST to createa window for decision-making processes consumption (by either a human, application,or VD). As it can be seen, in this approach, the applications or services used in decision-making processes deal with DSTs instead of managing the complex details associated withthe PDs, VDs, or cloud computing infrastructures.
vc1
DSTvc2
vci
S1
S2
Sn
User
Devices
App
WoT
car
d
Sn: Sensorvci: Virtual ContainerPD: Physical DevicesVD: Virtual DevicesDST: Digital Sentinel Twin
PD VD
Figure 1. Conceptual view of a DST.
We implemented a prototype based on this method to perform case studies supportedby GPS, temperature, and speed sensors. Additionally, using a blockchain system, thecompliance of contracts to which these sensors are subject in the transportation logisticsof products is continuously verified. The evaluation revealed the effectiveness of theDSTs for organizations to attain data and information about both IoT devices and thewhole processes converting IoT data into useful information required in decision-makingprocesses.

Sensors 2021, 21, 5531 3 of 20
The contributions of this work are:
• The design, implementation, and evaluation of a cloud-based WoT method for creatingdigital sentinel twins of IoT devices.
• The definition of the digital sentinel twin concept as a mean for accessing data andinformation, and for invoking tasks from IoT devices.
The rest of the paper is organized as follows: Section 2 describes the state of the artof works related to the topics of the proposed method; Section 3 describes the design andconstruction of a method to create DSTs for interacting with IoT devices; Section 4 describesthe implementation of a prototype for the creation of DSTs; Section 5 presents the resultsof the prototype in two phases of experiments; The discussion of the obtained results isdescribed in Section 6. Finally, Section 7 is presented with conclusions and future work.
2. Related Work
In the literature, there are some works about digital twins that are relevant to ourapproach, and these are next described.
In the context of digital twins, there are different works focused on its use for simula-tion, monitoring, risk prevention, etc., for IoT devices. Some are [20–22]. In [20], Assad etal. proposed a web-based digital twin (WDT) architecture, with the purpose of improvingthe sustainability of industrial cyber-physical systems. In [21] Bevilacqua et al. proposed adigital twin reference model for risk prediction and prevention. The difference betweenour work and these two proposals is that we establish the use of virtual containers in amiddle layer to access, acquire, extract, transform, etc., the information of the IoT devices;in this way, through a DST, we are able to represent both the physical (the IoT artifact)and virtual (software applications accessing the IoT artifact) device. In [22] Gao et al.proposed a method of simulation and modeling in real time for the production line ofdigital twins. The effectiveness of the proposed method is verified by taking an assemblyline as an example.
In the context of digital twins using virtual containers for the acquisition of informa-tion from IoT devices, the proposals [23–25] are interesting. In [23] Alaasam et al. proposeda study on live stateful stream processing migration of digital twins. The authors em-phasized the importance of two factors that influence the construction of stateful streamprocessing in systems as complex as digital twin: Stateful virtualization infrastructure andthe stateful data. In [24], Tingyu et al. proposed a methodology of container virtualiza-tion based on simulation as a service (CVSimaaS), the authors use virtual containers toimplement a digital twins system, obtaining a lower consumption of resources with highefficiency. Like our proposal, these two works include the concept of virtual containerstogether with digital twins for IoT devices. However, these two proposals do not adda standardized representation to the digital twin. Moreover, in our proposal, we followthe WoT guidelines for the creation of the DST as universal accessible entities. In [25]Borodulin et al. proposed a model for simulation and prediction of industrial processesusing digital twins in digital twin-as-a-service (DTaaS), which is a way to implement anorchestration of a set of independent services and provide scalability for simulation.
In the context of virtual container modeling, two proposals stand out [26,27]. In [26],Paraiso et al. presented an approach to model-driven management of Docker containers,which enables verification of the virtual container system architecture at design time. In [27],Piraghaj et al. proposed a simulation architecture called ContainerCloudSim, which was usedto evaluate resource management techniques in virtual containers from cloud environments.Unlike these proposals, whose focus is only on virtual containers modeling, our proposaladditionally models the environment of the IoT devices, adding WoT recommendationsfor representing them, which produces a DST flexible for consumption of the virtualcontainers and IoT devices data. In [28], Medel et al. proposed a performance model forKubernetes-based deployment using Docker containers. Such a model can be used as abasis to support resource management and application design.

Sensors 2021, 21, 5531 4 of 20
In the context of the use of virtual containers for the monitoring, simulation, andorchestration of IoT devices, there are two proposals [29,30]. In [29], Alam et al. proposeda modular and scalable architecture for IoT based on lightweight virtualization. Thus, themodularity provided, combined with the orchestration provided by Docker, simplifiesmanagement and enables distributed deployments, creating a highly dynamic system.In [30], Muralidharan et al. proposed a distributed monitoring system based on virtualcontainers for IoT applications for the management of a smart city environment. Theyachieved low latency, reliable and secure communication between large-scale deploymentof IoT devices, with a focus on horizontal interoperability between various IoT applications.Both works do not use the digital twin concept, unlike our work (DST), which allows us tocreate a reflection with the properties and characteristics of the IoT device.
Muralidharan et al., in [31], proposed a semantic digital twin model for interactingwith IoT devices. The authors used virtual containers to mimic IoT devices. This is themost similar approach to our proposal. However, they only focus on modeling the physicaldevices (PD) and not virtual devices (VD). Instead, through the DST, we can representboth the physical and virtual devices.
3. On the Building of Digital Sentinel Twins for IoT Devices
A digital sentinel twin (DST) is a software object produced from a data structurenamed WoTcard, which is created from data of physical devices (PD) or virtual devices (VD)interacting with surrounding elements for accomplishing some task involving sensors.
The conceptualization of a DST is illustrated in Figure 2, which is composed of theconcepts next described.
DSTDigital Sentinel Twin
DfEDataflow Entity
PDPhysical Devices
VDVirtual Devices
IoTInternet of Things
VCVirtual Container
VCSVirtual Container System
SSensor
CAppContainerized App
WoT cardWeb of Things
card
Figure 2. Conceptualization of a DST.
A PD represents an IoT device interacting with sensors. A VD represents the softwarecomponents required for creating a dataflow from an IoT device to a decision-makingprocess. This means that a VD comprises components such as Virtual Containers (vc)or a Virtual Container System (VCS). A vc is a mechanism for logical encapsulation ofsoftware applications that creates environment independent applications required to createa dataflow. A VCS represents a set of vci built as a single solution (service) to perform atask into the dataflow. A containerized application (CApp) is in charge of interacting withIoT devices, and it is encapsulated into either vc or VCS.
Thus, a DST is a versatile object for interacting in an easy manner with the complexand detailed structure of PD or VD. This is due to the flexibility of the WoTcard, whichfulfills the recommendations of the W3C (www.w3.org accessed on 5 August 2021).Thisinformation comes from a dataflow entity (D f E), which captures information of each internalcomponent (any of CApp ∈ vc, vci ∈ VCS, or PD), as well as relationships of thesecomponents with the PD. The D f E is basically a data structure including informationabout the structure, behavior, and function of VD or PD. The structure, behavior, andfunction are used to model the dataflow from the IoT device to the decision-makingprocesses (as it captures these features of all entities participating in such a dataflow). Thecontext of generation and usage of a DST is illustrated in Figure 3.

Sensors 2021, 21, 5531 5 of 20
vc1
Host1
Host2
vc2
vci
VCS1
DfE
Modeling
get data
VCS1
vc1 vc2 vci
WoTcards
Standarization
WoT Cards
get info
get info
Consumption
storeinfo
Database Gateway Web app
User
S1
S2
Sn
Devices
App
Sn: Sensorvci: Virtual ContainerVCS: Virtual Container SystemPD: Physical DevicesVD: Virtual DevicesDST: Digital Sentinel TwinDfE: Dataflow Entity
PDVD
DST
PropertyEventAction
BehaviorStructureFunction
DfE
Figure 3. Context of a DST.
We considered an additional layer for standardizing the representation of a D f Eby using WoT guidelines; this produces a WoTcard. That means, a WoTcard representsthe information of D f E through standardized concepts about virtual containers. Theseconcepts come from an ontology based on the ISO norm ISO/IEC JTC 1/SC 38 (www.iso.org/committee/601355.html accessed on 5 August 2021). By following these WoTstandards, a WoTcard can represent, in a well-defined manner and unique identity, a VDor PD, without any further adaption on D f E.
We propose a three-phase method to create a DST for a dataflow from IoT devices todecision-making processes. Figure 3 also shows the conceptual view of the stages of themethodology: modeling (phase 1), where the data of the VD is acquired and its elementsmodeled; then, in the standardization (phase 2), these elements are depicted into WoT cards,which are ready to be used in the consumption (phase 3). Next, each stage is described morein detail.
3.1. Phase 1: On the Usage of Functional Modeling for Building DfE
A VD or PD can be modeled as a process to achieve a goal. The functional modeling [32,33]is quite suitable for creating a representation of its structure, behavior, and function. Thismodeling has been used, over the past years, for successfully representing processes inmultiple scenarios [34–36].
In the proposed method, all the dataflow participants are modeled as objects com-posed of low-level parts; the object has an objective, and its components contribute toachieve, together, such an objective by performing tasks, such as acquiring, manufacturing,preparing, or analyzing data produced by IoT sensors. The functional modeling is quitesuitable for the IoT context where it is important not only to model the IoT devices butalso the dataflow participants to describe the properties, events, and actions performedfrom the IoT devices to the decision-making processes (either at the fog or cloud). Thisapproach also allowed us to model all the participants in the production of these dataflows(any of vci, VCS, or CApps), which, in fact, are having a behavior of chained processes.

Sensors 2021, 21, 5531 6 of 20
This model is captured into D f E, which describes the behavior (properties and events),function (tasks), and structure (interconnections) of all participants in the dataflow.
As a preparation step of this method, we assume the existence of a vci (see VD inFigure 3) executing a transformation of data (task); independently of the number of internalvci in a dataflow, these are modeled as one DST. Let us consider the simpler case, whereone vci is decomposed into its function, structure, and behavior, and stored in a D f E. Thisdecomposition is represented by means of WoTcards, making the D f E as a DST readyfor consumption. For the case of a VCS, occurs the same process by each individual vci,integrating individual functions as the overall function of the DST.
The objective of this phase is to obtain the three main modeling elements of a vc:
• structure, where the components of the vc and its relationships are specified;• behavior, where the values of the attributes of components are specified, according to
the function of the vc;• function, where the main goal of the vc and the tasks required to achieve it are specified.
This phase starts by receiving the configuration file of a vc, in YML or YAML format.From this file all the data required to represent the vc are acquired.
Next, the main elements are described following a decomposition approach.
3.1.1. Function
The function is the goal description of the vc. If the input file is of a VCS, the functionis modeled as a composition of functions of the internal vci. The function makes referenceto the task executed (transformation) on the dataflow. There are six base function for a vc:
• source, the capability to act as an infinite reservoir of data;• transport, the capability to transfer data from one point to another, including from one
medium to another;• barrier, the capability to prevent the transfer data from one point to another, including
from one medium to another;• storage, the capability to accumulate data;• balance, the capability to provide a balance between the total rates of incoming and
outgoing dataflows;• sink, the capability to act as an infinite drain of data.
Specialized functions can be derived from these base functions, such as produce-data,acquire-data, integrate-data, consume, to mention a few. All the functions may be connectedto each other into flow paths or flow structures forming software structures.
Thus, each vci has at least one application (Appj) performing some transformation (trk);defined as follows.
VC = {vc1, vc2, . . . , vci} (1)
App = {App1, App2, . . . , Appj} (2)
Tr = {tr1, tr2, . . . , trk} (3)
∀vci ∈ VC : vci ⊃ Appj (4)
∀Appj ∈ App : Appj ⊃ trk (5)
The trk is the key element for representing the function of a vci.A containerized application (CApp) represents one or a set of applications Appl , l < j,
encapsulated into a vci.
CApp = {App1, App2, . . . , Appl} (6)
3.1.2. Structure
The internal structure of a vc is commonly organized as software structures (e.g.,patterns, pipelines, parallel schema, dataflow, etc.). The model of the vc must reflect thiskind of organization. Thus, the structure of the vc is defined as a logical directed acyclic

Sensors 2021, 21, 5531 7 of 20
graph DAG, where nodes (N) represent the components (compi) that compose the vc, whilethe interconnections between nodes (compq → compr) are established by edges (E), whichare defined as follows.
N = {comp1, comp2, comp3, compi} (7)
E = {comp1 → comp2, comp2 → comp3, compi−1 → compi} (8)
DAG = {N, E} (9)
The DAG is the key element for representing the structure of a vci.
3.1.3. Behavior
The behavior of the vc is established by assigning values to its properties, that is, byassociating the function of the vc with the infrastructure (H) defined in the configurationfile. The vci are deployed on H ∈ I, being I the whole infrastructure (e.g., a cloud). Theconsumption of a set of resources (R) of the specified infrastructure (processor—CPU,memory—MEM, file system—FS, and network—NET) is denoted as R ∈ H per each vci,which are observed by a set of metrics (M).
R = {CPU, MEM, FS, NET} (10)
M = {total–usage, per–core–usage, ..., mn−1, mn} (11)
H, R, and M follow a hierarchy of elements defined as:
∀h ∈ H : h = {r, r ⊆ R} (12)
∀r ∈ R : r ⊃ value, value ∈ R, m(value) (13)
Equation (12) specifies that each physical computer h (where a vci runs) has a subsetof physical resources r. Likewise, Equation (13) specifies that each physical resource rhas a value denoting the performance of r for vci, and a metric m observes that value forperformance analysis.
Each resource r produces several values in the continuous numerical space. Thus,a huge set of values is generated per resource r. These values are used for comput-ing utilization factors (UF), which inform about the status performance of a resourcer. Although the resources produce a lot of values and data, we are interested in suchvalues of UF that could initiate a risk situation. Then, according to the ISO 31000 stan-dard (www.iso.org/iso-31000-risk-management.html) accessed on 5 August 2021 for riskmanagement [37], the values of UF are discretized in scales: low ∈ [0, 0.33), medium ∈[0.33, 0.66) and high ∈ [0.66, 1]. These thresholds indicate the level of performance (_lvl) ofeach resource ri, as indicates Equation (14).
UF = {CPU_lvl, MEM_lvl, FS_lvl, NET_lvl} (14)
The UF of CPU in an instant of time t is defined by (15).
UCPU = 1−[
TCPU − CCPUTCPU
](15)
where, TCPU is the total processing capacity of the physical computer, given by the sum ofthe capacity of each of the cores and CCPU is the CPU usage at the current time.
The UF of the file system in an instant of time t is calculated by (16).
UFS = 1−[
f
∑i=1
(TFSi − CFSi
TFSi
)](16)
Sensors 2021, 21, 5531 8 of 20
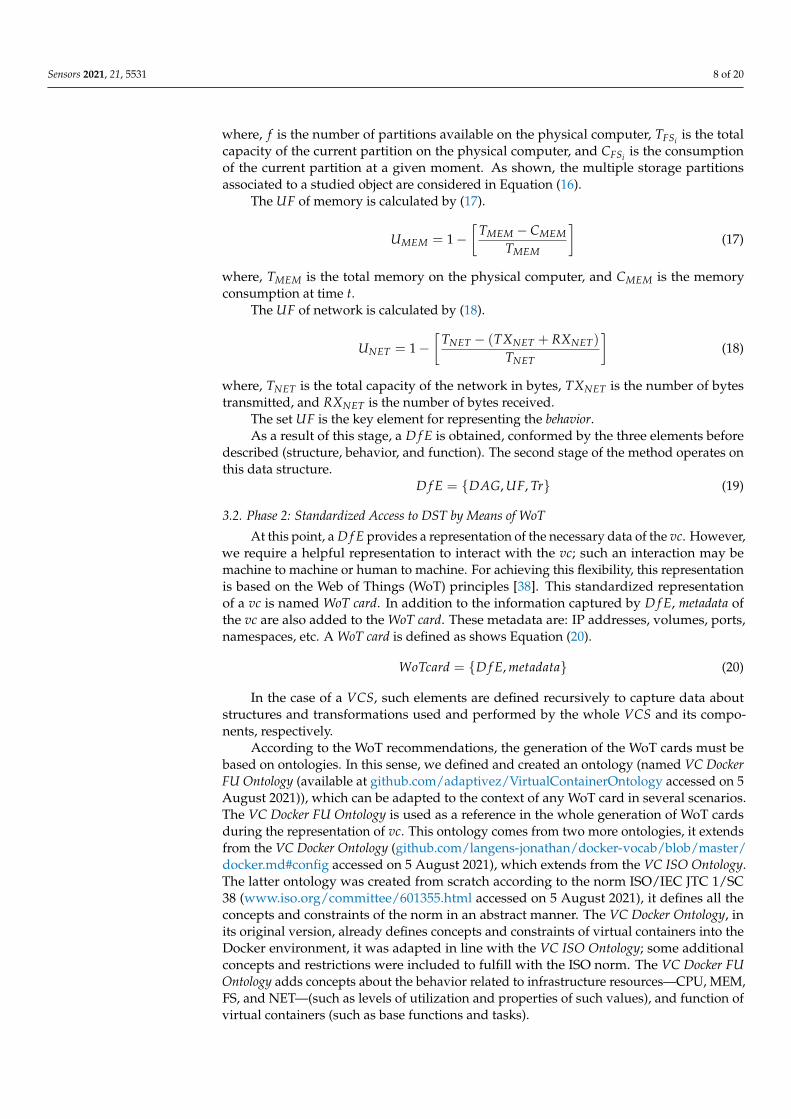
where, f is the number of partitions available on the physical computer, TFSi is the totalcapacity of the current partition on the physical computer, and CFSi is the consumptionof the current partition at a given moment. As shown, the multiple storage partitionsassociated to a studied object are considered in Equation (16).
The UF of memory is calculated by (17).
UMEM = 1−[
TMEM − CMEMTMEM
](17)
where, TMEM is the total memory on the physical computer, and CMEM is the memoryconsumption at time t.
The UF of network is calculated by (18).
UNET = 1−[
TNET − (TXNET + RXNET)
TNET
](18)
where, TNET is the total capacity of the network in bytes, TXNET is the number of bytestransmitted, and RXNET is the number of bytes received.
The set UF is the key element for representing the behavior.As a result of this stage, a D f E is obtained, conformed by the three elements before
described (structure, behavior, and function). The second stage of the method operates onthis data structure.
D f E = {DAG, UF, Tr} (19)
3.2. Phase 2: Standardized Access to DST by Means of WoT
At this point, a D f E provides a representation of the necessary data of the vc. However,we require a helpful representation to interact with the vc; such an interaction may bemachine to machine or human to machine. For achieving this flexibility, this representationis based on the Web of Things (WoT) principles [38]. This standardized representationof a vc is named WoT card. In addition to the information captured by D f E, metadata ofthe vc are also added to the WoT card. These metadata are: IP addresses, volumes, ports,namespaces, etc. A WoT card is defined as shows Equation (20).
WoTcard = {D f E, metadata} (20)
In the case of a VCS, such elements are defined recursively to capture data aboutstructures and transformations used and performed by the whole VCS and its compo-nents, respectively.
According to the WoT recommendations, the generation of the WoT cards must bebased on ontologies. In this sense, we defined and created an ontology (named VC DockerFU Ontology (available at github.com/adaptivez/VirtualContainerOntology accessed on 5August 2021)), which can be adapted to the context of any WoT card in several scenarios.The VC Docker FU Ontology is used as a reference in the whole generation of WoT cardsduring the representation of vc. This ontology comes from two more ontologies, it extendsfrom the VC Docker Ontology (github.com/langens-jonathan/docker-vocab/blob/master/docker.md#config accessed on 5 August 2021), which extends from the VC ISO Ontology.The latter ontology was created from scratch according to the norm ISO/IEC JTC 1/SC38 (www.iso.org/committee/601355.html accessed on 5 August 2021), it defines all theconcepts and constraints of the norm in an abstract manner. The VC Docker Ontology, inits original version, already defines concepts and constraints of virtual containers into theDocker environment, it was adapted in line with the VC ISO Ontology; some additionalconcepts and restrictions were included to fulfill with the ISO norm. The VC Docker FUOntology adds concepts about the behavior related to infrastructure resources—CPU, MEM,FS, and NET—(such as levels of utilization and properties of such values), and function ofvirtual containers (such as base functions and tasks).
Sensors 2021, 21, 5531 9 of 20
Technically a WoT card is based on an abstract class named Thing, which is the baseobject for modeling in the WoT approach. It is based on the representation structure ofThing Description (TD). Thing Description is the base model for describing any IoT Thingin the W3C Web of Things approach, it describes the metadata and interfaces of Things(www.w3.org/TR/wot-thing-description accessed on 5 August 2021). Thus, a WoT cardis composed of three elements: (i) metadata (of Thing), which contains interactions (howThing can be used); (ii) vocabulary, which contains concept definitions used into the ThingDescription structure, useful for interactions; and (iii) URIs, which are useful to identifyresources into Thing Description, these are Internet links denoting relationships betweenThing and other resources on the WoT.
The WoT card was designed so that an external user can interact with it by askingabout: properties, actions, and events. Properties contain information about the Thing, suchas behavior (UF), structure (nodes, and edges of the DAG), and metadata of the VC. Actionsrefer to the functions of the Thing, including tasks (Trs) executed by its components.Events refer to alerts on behavior changes, such as defined by the utilization levels (CPU_lvl,MEM_lvl, FS_lvl, NET_lvl).
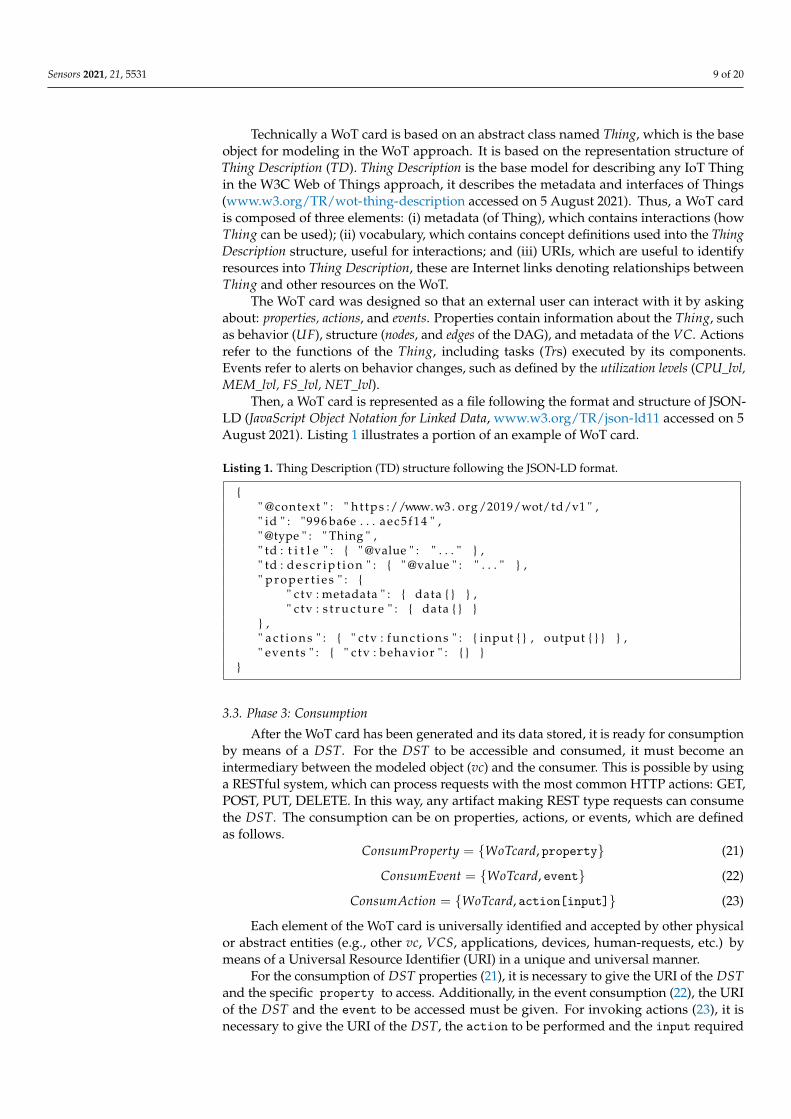
Then, a WoT card is represented as a file following the format and structure of JSON-LD (JavaScript Object Notation for Linked Data, www.w3.org/TR/json-ld11 accessed on 5August 2021). Listing 1 illustrates a portion of an example of WoT card.
Listing 1. Thing Description (TD) structure following the JSON-LD format.
{" @context " : " h t tps ://www. w3 . org /2019/wot/td/v1 " ," id " : "996 ba6e . . . aec5f14 " ," @type " : " Thing " ," td : t i t l e " : { " @value " : " . . . " } ," td : d e s c r i p t i o n " : { " @value " : " . . . " } ," p r o p e r t i e s " : {
" c tv : metadata " : { data { } } ," c tv : s t r u c t u r e " : { data { } }
} ," a c t i o n s " : { " c tv : f u n c t i o n s " : { input { } , output { } } } ," events " : { " c tv : behavior " : { } }
}
3.3. Phase 3: Consumption
After the WoT card has been generated and its data stored, it is ready for consumptionby means of a DST. For the DST to be accessible and consumed, it must become anintermediary between the modeled object (vc) and the consumer. This is possible by usinga RESTful system, which can process requests with the most common HTTP actions: GET,POST, PUT, DELETE. In this way, any artifact making REST type requests can consumethe DST. The consumption can be on properties, actions, or events, which are definedas follows.
ConsumProperty = {WoTcard, property} (21)
ConsumEvent = {WoTcard, event} (22)
ConsumAction = {WoTcard, action[input]} (23)
Each element of the WoT card is universally identified and accepted by other physicalor abstract entities (e.g., other vc, VCS, applications, devices, human-requests, etc.) bymeans of a Universal Resource Identifier (URI) in a unique and universal manner.
For the consumption of DST properties (21), it is necessary to give the URI of the DSTand the specific property to access. Additionally, in the event consumption (22), the URIof the DST and the event to be accessed must be given. For invoking actions (23), it isnecessary to give the URI of the DST, the action to be performed and the input required

Sensors 2021, 21, 5531 10 of 20
for that action as parameter. In the three types of consumption, a JSON object is obtained asa response indicating a value if a property or event were requested, or a value or resultantflag if an action was invoked. Next, an example of consumption of the property “platform”and the function “sum” are given.
Request (property):
https://www.example.com/wotmodel/containers/123456789/platform
Response:
{ "platform" = "Docker" }
Request (function):
https://www.example.com/wotmodel/containers/123456789/sum/2/3
Response:
{ "result" = "5" }
4. DST Prototype
This section describes the implementation of a prototype for building DSTs based onthe proposed method. The components of this prototype and its interactions are depictedin Figure 4. The components were implemented as microservices (encapsulated into virtualcontainers), coded by using Python 3.0, except for the observation component, which wasimplemented by using JavaScript and PHP because of the nature of observation tasks. Next,each component is described.
VCS1.json
vc1.json
vc2.json
vci.json
Docker daemon
vc1
VCS1
vc2
vc3
vc4
get detail container
info
Representation
getinfo
get infoMySQL
Database
store info
get realtime
containers status
store info
Devices
App
Observation
ContainersName State Util
vc1 running low
vc2 running low User
Supervisionget resource
usage per container
cAdvisor
communication to carry outexternal consumption
CPUMEMNET FS
configfile
VCS1.cfg
Consumption
Login
Listener
get utilizationvalues and levels from containers
CPUMemoryNetwork
File System
Figure 4. Components of DST prototype.
The prototype was deployed on the Docker platform, but DSTs may be created fromanother platform, such as LXC (linuxcontainers.org/lxc accessed on 5 August 2021), Hyper-V (docs.microsoft.com/en-us/virtualization/hyper-v-on-windows accessed on 5 August2021), or rkt (https://www.openshift.com/learn/topics/rkt accessed on 5 August 2021),where a vc can be represented by a YML or YAML file.

Sensors 2021, 21, 5531 11 of 20
4.1. Representation
In this service, the configuration file (YML) of the VD is parsed to build the D f E,capturing structure, behavior, function, and metadata of the participants in a dataflow froman IoT device to the decision-making process. After the creation of D f E, the WoT cards aregenerated and its corresponding URIs defined. In this way, a decision-making process canconsume the WoT card information (properties, events, and actions). The URIs must followa defined namespace, as shows the Expression (24):
http : //www.example.com/wotmodel/containers/
container_id/{property, event, action} (24)
The WoT cards along with the D f E are stored in a MySQL database.
4.2. Listener
This service monitors the state (behavior) of a given VD (any of vc, VCS, or CApp). Itis in charge of storing and keeping updated, in real-time, all the captured information byrequesting status information from the Docker daemon and registering, in the database,each event producing a change on the VD. It also keeps a communication with thesupervision service to reflect any change on VD utilization levels, which are also stored inthe database.
4.3. Supervision
This service supervises the VD and performs the acquisition of metrics through anexternal agent, called cAdvisor. This is an API that provides information about the metricsof the vc and the physical computers on which it runs. When acquiring the values of themetrics, it calculates the behavior values of VD (utilization levels of resources used by VD).It also responds to requests from the Listener, which is monitoring the VD and returnsvalues of utilization levels of resources (high, medium, low) about CPU, MEM, FS, or NET,as well as the timestamp when values were captured.
4.4. Observation
This service offers options for observing the VD (structure, behavior, and function).It is a web application with intuitive interface designed for human consumption. Threetasks can be performed: (1) Discovering of VDs, for searching the vcs or a specific CApp byusing its properties (name, description, type, creator, owner, etc.); (2) Monitoring VDs, toknow easily the behavior of the resources used by a VD by means of warning color signs(red for critical, yellow for intermediate, and green for normal) and its utilization levelvalues; (3) Observing risk levels, to know the risk of failure of the applications by means ofa graph denoting virtual containers in nodes and its relationships in edges.
4.5. Consumption
This service acts as a gateway, and is in charge of attending and processing requestsfrom external users (human users, software applications, virtual containers, etc.) trying toconsume or interact with the given VD. This is performed by using an API REST for GET,POST, PUT, and DELETE requests. Three types of consumption are considered: properties,events, and actions depending on the desired consumption/invocation. For properties andevents, this service queries the WoTcard of the VD, then gets the corresponding data fromthe database to send it to the requester. For actions, the service queries the WoTcard of theVD, then establishes a connection to the corresponding VD, which executes the action andreturns the result to the requester. All responses are into a JSON file. This is illustrated byinvoking the clustering task kmeans with the parameters k and a dataset named data.

Sensors 2021, 21, 5531 12 of 20
Preparation:
URI = https://www.example.com/wotmodel/containers/123456789/kmeansinput = {"k"=2,"data":[{"col1":1,"col2":0,"col3":2},{"col1":2,"col2":1,"col3":1},{"col1":0,"col2":0,"col3":2}]}
Request:
request.post(URI,input)
Response:
{"result":{"cluster1":[{"col1":1,"col2":0,"col3":2},{"col1":0,"col2":0,"col3":2}],"cluster2":[{"col1":2,"col2":1,"col3":1}]}}
5. Results
The evaluation of the prototype for DST creation was conducted in two phases ofexperiments. In the first phase, the prototype was evaluated in a controlled mannerto measure the response and service times in the construction of the DST and in itsconsumption. In the second phase, a case study is presented based on the creation of DSTfor a platform for continuous verification of contracts using a blockchain network.
Table 1 shows the infrastructure used by the VCS created for both cases of study.
Table 1. IT Infrastructure used in the experiments.
ID Cores Processor MEM HDD OS
Server1 4 Intel(R) Core i5 16 GB 256 GB macOS BigSurServer2 12 Intel(R) Xeon(R) E7-4830 128 GB 1 TB CentOS 7
5.1. Metrics
The performance of the prototype was evaluated by capturing the following metrics.
• Service time (ST): The time required by a microservice (VD) to complete a given task.• Response time (RT): The time observed by an end-user or a decision-making process
to complete a given task. This time considers the initial time to attain data, createthe representation, and store it in the database when an end-user builds a DST. Thismetric also measures the initial time when an end-user sends a request to the prototypeand the time spent by DST to process it plus the time spent by it to deliver the resultsto the end-user.
5.2. Controlled Evaluation
To conduct the evaluation of the prototype, a containerized application (CApp) wasdeployed on the previously described infrastructure, one instance of the CApp running onone virtual container vc. This CApp extracts data from real traces produced by ECG medi-cal devices (IoT devices for acquiring electrocardiogram (ECG) signals) [11], and buildsworkloads at a given rate time, following a synthetic distribution. An input parameterdefines the amount of data to be included in the workload.
By using the CApp, several experiments were carried out by varying the number ofvc and IoT data sources (ECG sensors), as well as the timing when the DST captures thebehavior of the CApp; this latter is called slot.
We captured the ST and RT metrics for each experiment, each one was performed31 times (according to the Central Limit Theorem [39]) to capture the median value of bothST and RT.
Different combinations of virtual containers (vc) and DSTs (dst) were tested, thesecombinations were defined in the form vcW − dstZ, where W is the desired number ofvirtual containers (vc) in the combination, and Z is the desired number of DSTs. That

Sensors 2021, 21, 5531 13 of 20
means 1 (of Z) DST watches W virtual containers. For example, Expression (25) means1 DST watching 5 virtual containers, this results in a total vc = 5. Expression (26) means5 DST watching 5 virtual containers, this results in a total vc = 25.
vc5− dst1 (25)
vc5− dst5 (26)
These combinations also was executed by varying the slot parameter from 1, 10, to100 s. Each combination of these parameters produces a median value of ST and RT, whichare evaluated to show the behavior of the DST costs. The total time of ECGs extractionwas 10 min.
Analysis of Results
Figure 5 shows, in vertical axis, the ST and RT by two key operations related to thebuilding of a DST (GetData and StoreData tasks) produced by the different number ofvirtual containers, evaluated in these experiments. This experiment only shows the STand RT observed by either end-users or a decision-making application. As it can be seen,the prototype can build in just seconds DSTs for multiple VCS (17.5 s for creating DSTsfor 100 applications, each connected to an IoT data source). This time is only spent by theprototype once, which means that this is affordable for many environments. Moreover, theGetData task (parsing YML files and creating the D f E), as it was expected, was the moresignificant task in the building of a DST, whereas StoreData task (indexing the D f E in adatabase) results were not significant for the DST building RT.
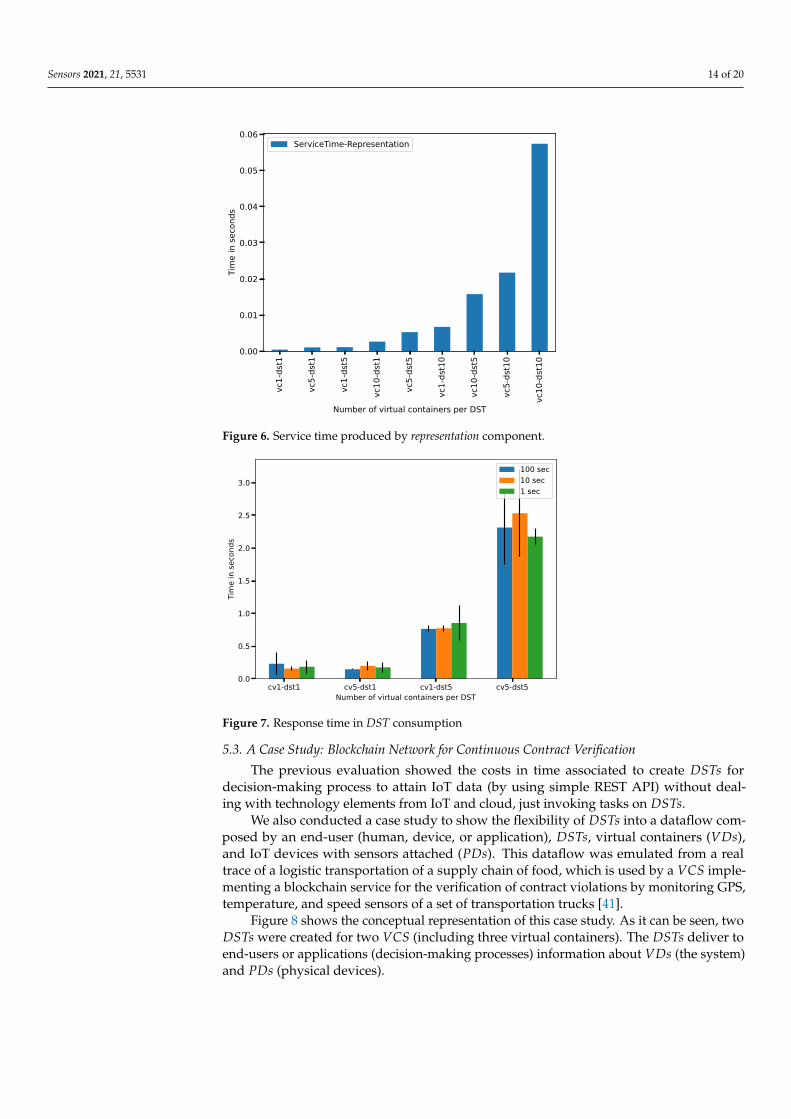
Figure 6 shows, in vertical axis, the ST (for the Representation task) spent by thebuilding of the DSTs according to the sequences of DSTs and virtual containers evaluatedin these experiments (horizontal axis). As expected, the more the number of DSTs, themore the ST spent by the prototype to create the representation of these DSTs.
Figure 7 shows, in vertical axis, the RT spent by the DSTs to retrieve informationabout VDs and PDs to the end-user (in this case a DST client application) per differentsequences of DST and virtual containers (horizontal axis) for different time slot. It can beobserved that increasing the number of vcs per DST also increases the number of requestsperformed by the DSTs per slot, increasing RT. The RT obtained is acceptable as soft realtime [40].
1 5 10 20 50 100
Number of virtual containers
0.0
2.5
5.0
7.5
10.0
12.5
15.0
17.5
Tim
e in
seco
nds
ServiceTime-GetDataServiceTime-StoreDataResponseTime
Figure 5. Service and response times produced by the tasks GetData and StoreData.
Sensors 2021, 21, 5531 14 of 20
vc1-
dst1
vc5-
dst1
vc1-
dst5
vc10
-dst
1
vc5-
dst5
vc1-
dst1
0
vc10
-dst
5
vc5-
dst1
0
vc10
-dst
10
Number of virtual containers per DST
0.00
0.01
0.02
0.03
0.04
0.05
0.06
Tim
e in
seco
nds
ServiceTime-Representation
Figure 6. Service time produced by representation component.
cv1-dst1 cv5-dst1 cv1-dst5 cv5-dst5Number of virtual containers per DST
0.0
0.5
1.0
1.5
2.0
2.5
3.0
Tim
e in
seco
nds
100 sec10 sec1 sec
Figure 7. Response time in DST consumption
5.3. A Case Study: Blockchain Network for Continuous Contract Verification
The previous evaluation showed the costs in time associated to create DSTs fordecision-making process to attain IoT data (by using simple REST API) without deal-ing with technology elements from IoT and cloud, just invoking tasks on DSTs.
We also conducted a case study to show the flexibility of DSTs into a dataflow com-posed by an end-user (human, device, or application), DSTs, virtual containers (VDs),and IoT devices with sensors attached (PDs). This dataflow was emulated from a realtrace of a logistic transportation of a supply chain of food, which is used by a VCS imple-menting a blockchain service for the verification of contract violations by monitoring GPS,temperature, and speed sensors of a set of transportation trucks [41].
Figure 8 shows the conceptual representation of this case study. As it can be seen, twoDSTs were created for two VCS (including three virtual containers). The DSTs deliver toend-users or applications (decision-making processes) information about VDs (the system)and PDs (physical devices).

Sensors 2021, 21, 5531 15 of 20
Monitor Decision Making
DST 1
DST 2
vc1
vc2
vc3
vc1
vc2
vc3
System Physical
System Physical
System Physical
User
Devices
App
Digital Sentinel Twin
Virtualcontainer
Temperaturesensor
Speed sensor
GPS sensor
Figure 8. Conceptual representation of the scenario for the case study.
Figure 9 shows, in the horizontal axis, a timeline of the tasks performed by participantson the dataflow (vertical axis) of verifying contract violations: Build (tsk1), data acquisitionof temperature (tsk2), data acquisition of speed (tsk3), data acquisiton of GPS (tsk4), send request(tsk5), get data (tsk6), and deliver request (tsk7). The timeline for this case study was 10 min.In tsk1 the prototype builds two DSTs. Then, the data acquisition was carried out from IoTsensors (tsk2, tsk3, and tsk4) by the virtual containers, which were stored on the blockchainnetwork. Additionally during the timeline, every 10 s, the virtual containers verified,registered, and reported contract violations on the blockchain network: first the consumerrequests to DST (tsk5), then the blockchain is queried by the corresponding virtual container(tsk6), and finally the DST responses to the consumer (tsk7). As it can be seen, the impact ofthe DST creation (tsk1) and communications (tsk5 and tsk7) is not significant in comparisonwith the time spent by get data from the blockchain network (tsk6) and the data transferfrom sensors to the blockchain network (tsk2, tsk3, and tsk4). Figure 9 also shows that DSTcan capture the data produced by both, VDs (tsk6), and PDs (tsk2, tsk3, and tsk4).
00:00 01:00 02:00 03:00 07:0006:0004:00 05:00 08:00 10:0009:0000:00 01:00 02:00 03:00 07:0006:0004:00 05:00 08:00 10:0009:0000:00 01:00 02:00 03:00 07:0006:0004:00 05:00 08:00 10:0009:00
Figure 9. Time of tasks in the case study.

Sensors 2021, 21, 5531 16 of 20
We observed that DSTs were able to inform to end-users, on demand and in realtime, about contract violations. From the total number of requests (47) to the DSTs, just in3 requests the DSTs informed contract violations.
The DSTs can also deliver, on demand and in real time, the data rate produced andreceived by PDs to the end-user. Therefore, the behavior of the PDs can be known byend-users in decision-making time by analyzing these data. In this case study, the prototypeshowed a regular data production from sensors, with a reduction and increment of thedata rate. This could imply to a potential bottleneck in the reception of data or a possibleinconsistent data production from sensors at IoT devices. Figure 10 shows the receiveddata amount of 47 user requests to the DSTs.
Requests to DST
Kilo
bits
rece
ived
Requests to DSTRequests to DST
Figure 10. Kilobits received in the requests.
The averages of consumed resources r (processor—CPU, memory—MEM, file system—FS, and network—NET) by the prototype in the case study are shown in Table 2. To obtainthem, first the consumption of such resources were measured before and during the casestudy, this was carried out 32 times (w = 32). Then the differences between initial (rkini
)and final (rk f in
) values were computed and added. Finally the average of the differenceswere obtained, as shows Equation (27).
rkavg =∑w
i=1
(rk f ini
− rkinii
)w
(27)
Table 2. Average values of resource consumption.
CPU (%) MEM (Megabytes) FS (Megabytes) NET (Megabits/s)
2.306 33.884 (0.02%) 20.109 9.556
It is important to note that the blockchain network is not of exclusive use of thisprototype, it can be consumed by external applications. This VCS (blockchain network)can be replaced by other VCS (e.g., a data analytics system), in such a case that the DSTmust deliver the data produced by this new VCS without performing deep changes, butrebuilding the D f E of the DST.
6. Discussion
In this paper, we demonstrated the viability of the proposed method by applyingthe implemented prototype in two scenarios. The first one is regarding a controlledevaluation for extracting data from traces produced by ECG medical devices. This scenarioshowed the response and service time performance during the building and consumptionof DSTs. The second scenario demonstrated the flexibility of DSTs to attain information

Sensors 2021, 21, 5531 17 of 20
(verification of contract violations on a blockchain network) in real-time from a dataflow oftransportation logistics.
The obtained prototype was tested on distinct scenarios for intermediate and partialexperiments before obtaining the results reported in this paper. In all these experiments, theprototype showed good performance in several tasks, such as discovering vcs, monitoringVCS, supervising CApps through created DSTs. Several interactions were performed onthese DSTs, accessed by other CApps, human requests, and software applications.
According to the results of the controlled evaluation (Section 5.2), we can see thataugmenting the number of vcs per DST increases exponentially the response time for boththe building and consumption of DSTs. The building of 1 DST with 5 vc (vc5-dst1) takesan average response time of 0.90 s (see Figure 5). The consumption of the DST with thesame configuration (vc5-dst1) takes an average response time of 0.52 s (see Figure 7).
The case study (Section 5.3) supports the results achieved in the controlled evaluation.In this case, the average response time during the building of the DSTs (sequence vc3-s2)was 1.2 s (see Figure 9). For the consumption of the DSTs the average response time was13 s (see Figure 9). However, it is important to note that from these 13 s, 10 s correspond tothe communication to and from the blockchain networks for obtaining data. Thus, we canconclude that 3 s is the real response time for the consumption.
In all the experiments of the prototype, the interaction with the created DSTs was easybecause complex requests were not necessary. The benefits of using the created DSTs areas follows:
• Standardized interaction. Since a WoT card is based on W3C guidelines, a DST can beconsumed by distinct users (humans, devices, or applications);
• Easy consumption. Through a DST, users can: (a) access to data, properties, andevents; and (b) invoke tasks and functions, both directly on target devices (VDsor PDs);
• Flexible access. A DST can be exploited by external users by means of RESTfulrequests from distinct locations to the one of the DST environment;
• Decision-making aid. DSTs can be used as a mean in decision-making tasks (discover-ing, classification, monitoring, supervising, migration, to mention a few);
• Generation of DST. The building of DSTs is quite simple and transparent if a well-structured file configuration (YML or YAML) is given;
• Minimal required resources. The execution of DSTs requires minimal infrastructureresources (CPU, MEM, FS, and NET).
7. Conclusions
This paper presented a cloud-based WoT method for creating digital twins of IoTdevices, named (digital sentinel twins—DST). A DST is an object that abstracts physical orvirtual devices to operate over them by consuming its properties, events, or invoking itsfunctions. This object has the advantage that by investing minimal time and resources,an external user (human, software application, or virtual devices) can access to all thedata and functions of those devices. That is useful for interacting with IoT devices inseveral scenarios.
The method comprises three phases: (a) Modeling, where the data of the VD or PDare acquired, with these elements that device is modeled, generating a dataflow entity (DfE);(b) Standardization, where the elements of the model are represented into a standardizedrepresentation named WoT card; this representation follows the guidelines of the Web ofThings to make its elements universally accessible by means of URIs; and (c) Consumption,the advance of the WoT card generated is that it can be consumed in external scenarios bydistinct users (human, software applications, or virtual devices) in different ways.
Based on the proposed method, a functional prototype was implemented. This pro-totype was tested by creating DSTs in several experiments considering distinct scenariosof use (discovering and monitoring of VCs and applications, supervising CApps, etc.). Bymeans of the created DSTs, it was possible to consume data and invoke functions of virtual

Sensors 2021, 21, 5531 18 of 20
and physical devices. In this paper, two experiments were reported to demonstrate theviability of the proposed method, creating flexible and useful DSTs. The first experimentwas to show the spent time for creating and consuming DSTs. The second one was todemonstrate the use of DSTs into a scenario of a blockchain network for verifying contractviolation on sensors used in product transportation logistics.
A DST creates an abstract window for decision-making processes to attain informationand data from virtual and physical devices. It acts as a useful mechanism to interactwith those devices in several scenarios. Its creation is not expensive in terms of time andcomputational resources, and it produces a access to data and functions of the target devices.These characteristics may be obtained without managing complex details associated tovirtual and physical devices and cloud computing infrastructures.
Nevertheless the benefits obtained by the proposed method, it is important to mentionsome limitations of the proposed work:
• The creation of DSTs only can be achieved if a well-structured configuration file isgiven, in YML or YAML format;
• A DST has no other way to consume it that RESTful requests;• When target devices (VDs or PDs) and DSTs reside in the same infrastructure, the
response time of performed tasks increases exponentially.
As further work, the inclusion of security aspects into the DSTs is considered; thiswill enable its manageability and control while maintaining its flexibility of use.
Author Contributions: Conceptualization, I.L.-A., J.L.G.-C., M.H.-T., C.M.-R., J.L.M.-R. and R.M.;methodology, I.L.-A., J.L.G.-C., M.H.-T., C.M.-R., J.L.M.-R. and R.M.; software, I.L.-A., J.L.G.-C., M.H.-T., C.M.-R., J.L.M.-R. and R.M.; validation, I.L.-A., J.L.G.-C., M.H.-T., C.M.-R., J.L.M.-R. and R.M.;formal analysis, I.L.-A., J.L.G.-C., M.H.-T., C.M.-R., J.L.M.-R. and R.M.; investigation, I.L.-A., J.L.G.-C.,M.H.-T., C.M.-R., J.L.M.-R. and R.M.; resources, I.L.-A., J.L.G.-C., M.H.-T., C.M.-R., J.L.M.-R. andR.M.; data curation, I.L.-A., J.L.G.-C., M.H.-T., C.M.-R., J.L.M.-R. and R.M.; writing—original draftpreparation, I.L.-A., J.L.G.-C., M.H.-T., C.M.-R., J.L.M.-R. and R.M.; writing—review and editing, I.L.-A., J.L.G.-C., M.H.-T., C.M.-R., J.L.M.-R. and R.M.; visualization, I.L.-A., J.L.G.-C., M.H.-T., C.M.-R.,J.L.M.-R. and R.M.; funding acquisition, J.L.G.-C. All authors have read and agreed to the publishedversion of the manuscript.
Funding: This research was partially funded by the project Num. 41756 “Plataforma tecnológicapara la gestión, aseguramiento, intercambio y preservación de grandes volúmenes de datos ensalud y construcción de un repositorio nacional de servicios de análisis de datos de salud” byFORDECYT-PRONACES, Conacyt (México).
Institutional Review Board Statement: Not applicable.
Informed Consent Statement: Not applicable.
Data Availability Statement: Not applicable.
Conflicts of Interest: The authors declare no conflict of interest.
References1. Piccialli, F.; Casolla, G.; Cuomo, S.; Giampaolo, F.; Di Cola, V.S. Decision making in IoT environment through unsupervised
learning. IEEE Intell. Syst. 2019, 35, 27–35. [CrossRef]2. Troussas, C.; Krouska, A.; Sgouropoulou, C. Improving Learner-Computer Interaction through Intelligent Learning Material
Delivery Using Instructional Design Modeling. Entropy 2021, 23, 668. [CrossRef]3. Wang, Y.; Li, P.F.; Tian, Y.; Ren, J.J.; Li, J.S. A Shared Decision-Making System for Diabetes Medication Choice Utilizing Electronic
Health Record Data. IEEE J. Biomed. Health Inform. 2017, 21, 1280–1287. [CrossRef]4. Peralta, G.; Iglesias-Urkia, M.; Barcelo, M.; Gomez, R.; Moran, A.; Bilbao, J. Fog computing based efficient IoT scheme for the
Industry 4.0. In Proceedings of the 2017 IEEE International Workshop of Electronics, Control, Measurement, Signals and TheirApplication to Mechatronics (ECMSM), Donostia, Spain, 24–26 May 2017; pp. 1–6. [CrossRef]
5. Al-Hamadi, H.; Chen, I.R. Trust-Based Decision Making for Health IoT Systems. IEEE Internet Things J. 2017, 4, 1408–1419.[CrossRef]
6. Manavalan, E.; Jayakrishna, K. A review of Internet of Things (IoT) embedded sustainable supply chain for industry 4.0requirements. Comput. Ind. Eng. 2019, 127, 925–953. [CrossRef]

Sensors 2021, 21, 5531 19 of 20
7. Morabito, R.; Cozzolino, V.; Ding, A.Y.; Beijar, N.; Ott, J. Consolidate IoT Edge Computing with Lightweight Virtualization. IEEENetw. 2018, 32, 102–111. [CrossRef]
8. Truong, H.L.; Dustdar, S. Principles for Engineering IoT Cloud Systems. IEEE Cloud Comput. 2015, 2, 68–76. [CrossRef]9. Du, Y.; Huang, K. Fast Analog Transmission for High-Mobility Wireless Data Acquisition in Edge Learning. IEEE Wirel. Commun.
Lett. 2019, 8, 468–471. [CrossRef]10. Tadakamalla, U.; Menascé, D. FogQN: An Analytic Model for Fog/Cloud Computing. In Proceedings of the 2018 IEEE/ACM
International Conference on Utility and Cloud Computing Companion (UCC Companion), Zurich, Switzerland, 17–20 December2018; pp. 307–313. [CrossRef]
11. Sánchez-Gallegos, D.D.; Galaviz-Mosqueda, A.; Gonzalez-Compean, J.L.; Villarreal-Reyes, S.; Perez-Ramos, A.E.; Carrizales-Espinoza, D.; Carretero, J. On the Continuous Processing of Health Data in Edge-Fog-Cloud Computing by Using Micro/-Nanoservice Composition. IEEE Access 2020, 8, 120255–120281. [CrossRef]
12. Carrizales-Espinoza, D.; Sánchez-Gallegos, D.D.; Gonzalez-Compean, J.L.; Carretero, J. A Federated Content Distribution Systemto Build Health Data Synchronization Services. In Proceedings of the 2021 29th Euromicro International Conference on Parallel,Distributed and Network-Based Processing (PDP), Valladolid, Spain, 10–12 March 2021; pp. 1–8. [CrossRef]
13. Yang, H.; Kim, Y. Design and Implementation of Fast Fault Detection in Cloud Infrastructure for Containerized IoT Services.Sensors 2020, 20, 4592. [CrossRef]
14. Sánchez-Gallegos, D.D.; Carrizales-Espinoza, D.; Reyes-Anastacio, H.G.; Gonzalez-Compean, J.; Carretero, J.; Morales-Sandoval,M.; Galaviz-Mosqueda, A. From the edge to the cloud: A continuous delivery and preparation model for processing big IoT data.Simul. Model. Pract. Theory 2020, 105, 102136. [CrossRef]
15. Carrizales, D.; Sánchez-Gallegos, D.D.; Reyes, H.; González-Compeán, J.; Morales-Sandoval, M.; Carretero, J.; Galaviz-Mosqueda,A. A data preparation approach for cloud storage based on containerized parallel patterns. In International Conference on Internetand Distributed Computing Systems; Springer: Berlin/Heidelberg, Germany, 2019; pp. 478–490.
16. Saiáns-Vázquez, J.V.; Ordóñez-Morales, E.F.; López-Nores, M.; Blanco-Fernández, Y.; Bravo-Torres, J.F.; Pazos-Arias, J.J.; Gil-Solla,A.; Ramos-Cabrer, M. Intersection Intelligence: Supporting Urban Platooning with Virtual Traffic Lights over VirtualizedIntersection-Based Routing. Sensors 2018, 18, 4054. [CrossRef] [PubMed]
17. Al-Tarawneh, M.A. Mobility-Aware Container Migration in Cloudlet-Enabled IoT Systems using Integrated Muticriteria DecisionMaking. Environments 2020, 11, 694–701. [CrossRef]
18. Martínez-Gutiérrez, A.; Díez-González, J.; Ferrero-Guillén, R.; Verde, P.; Álvarez, R.; Perez, H. Digital Twin for AutomaticTransportation in Industry 4.0. Sensors 2021, 21, 3344. [CrossRef] [PubMed]
19. Ostermaier, B.; Schlup, F.; Römer, K. WebPlug: A framework for the Web of Things. In Proceedings of the 2010 8th IEEE Interna-tional Conference on Pervasive Computing and Communications Workshops (PERCOM Workshops), Mannheim, Germany, 29March–2 April 2010; pp. 690–695. [CrossRef]
20. Assad, F.; Konstantinov, S.; Ahmad, M.; Rushforth, E.; Harrison, R. Utilising Web-based Digital Twin to Promote AssemblyLine Sustainability. In Proceedings of the 2021 4th IEEE International Conference on Industrial Cyber-Physical Systems (ICPS),Victoria, BC, Canada, 10–12 May 2021.
21. Bevilacqua, M.; Bottani, E.; Ciarapica, F.E.; Costantino, F.; Di Donato, L.; Ferraro, A.; Mazzuto, G.; Monteriù, A.; Nardini, G.;Ortenzi, M.; et al. Digital Twin Reference Model Development to Prevent Operators’ Risk in Process Plants. Sustainability 2020,12, 1088. [CrossRef]
22. Gao, Y.; Lv, H.; Hou, Y.; Liu, J.; Xu, W. Real-time Modeling and Simulation Method of Digital Twin Production Line. InProceedings of the 2019 IEEE 8th Joint International Information Technology and Artificial Intelligence Conference (ITAIC),Chongqing, China, 24–26 May 2019; pp. 1639–1642. [CrossRef]
23. Alaasam, A.B.; Radchenko, G.; Tchernykh, A.; Compeán, J.G. Analytic Study of Containerizing Stateful Stream Processing asMicroservice to Support Digital Twins in Fog Computing. Program. Comput. Softw. 2020, 46, 511–525. [CrossRef]
24. Lin, T.Y.; Shi, G.; Yang, C.; Zhang, Y.; Wang, J.; Jia, Z.; Guo, L.; Xiao, Y.; Wei, Z.; Lan, S. Efficient container virtualization-baseddigital twin simulation of smart industrial systems. J. Clean. Prod. 2021, 281, 124443. [CrossRef]
25. Borodulin, K.; Radchenko, G.; Shestakov, A.; Sokolinsky, L.; Tchernykh, A.; Prodan, R. Towards Digital Twins Cloud Platform:Microservices and Computational Workflows to Rule a Smart Factory. In Proceedings of the 10th International Conference onUtility and Cloud Computing, Austin, TX, USA, 5–8 December 2017; Association for Computing Machinery: New York, NY, USA,2017; pp. 209–210. [CrossRef]
26. Paraiso, F.; Challita, S.; Al-Dhuraibi, Y.; Merle, P. Model-Driven Management of Docker Containers. In Proceedings of the 2016IEEE 9th International Conference on Cloud Computing (CLOUD), San Francisco, CA, USA, 27 June–2 July 2016; pp. 718–725.[CrossRef]
27. Piraghaj, S.F.; Dastjerdi, A.V.; Calheiros, R.N.; Buyya, R. ContainerCloudSim: An environment for modeling and simulation ofcontainers in cloud data centers. Softw. Pract. Exp. 2017, 47, 505–521. [CrossRef]
28. Medel, V.; Rana, O.; Bañares, J.A.; Arronategui, U. Modelling Performance & Resource Management in Kubernetes. In Proceedingsof the 9th International Conference on Utility and Cloud Computing; Association for Computing Machinery: New York, NY, USA,2016; pp. 257–262. [CrossRef]
29. Alam, M.; Rufino, J.; Ferreira, J.; Ahmed, S.H.; Shah, N.; Chen, Y. Orchestration of Microservices for IoT Using Docker and EdgeComputing. IEEE Commun. Mag. 2018, 56, 118–123. [CrossRef]

Sensors 2021, 21, 5531 20 of 20
30. Muralidharan, S.; Song, G.; Ko, H. Monitoring and managing iot applications in smart cities using kubernetes. Cloud Comput.2019, 11, 1–6.
31. Muralidharan, S.; Yoo, B.; Ko, H. Designing a Semantic Digital Twin model for IoT. In Proceedings of the 2020 IEEE InternationalConference on Consumer Electronics (ICCE), Las Vegas, NV, USA, 4–6 January 2020; pp. 1–2. [CrossRef]
32. Chittaro, L.; Guida, G.; Tasso, C.; Toppano, E. Functional and teleological knowledge in the multimodeling approach for reasoningabout physical systems: A case study in diagnosis. IEEE Trans. Syst. Man Cybern. 1993, 23, 1718–1751. [CrossRef]
33. Lind, M.; Zhang, X. Functional modelling for fault diagnosis and its application for NPP. Nucl. Eng. Technol. 2014, 46, 753–772.[CrossRef]
34. Chandrasekaran, B.; Josephson, J.R. Function in device representation. Eng. Comput. 2000, 16, 162–177. [CrossRef]35. Yildirim, U.; Campean, F.; Williams, H. Function modeling using the system state flow diagram. AI EDAM 2017, 31, 413–435.
[CrossRef]36. Umeda, Y.; Takeda, H.; Tomiyama, T.; Yoshikawa, H. Function, behaviour, and structure. Appl. Artif. Intell. Eng. V 1990,
1, 177–193.37. Luko, S. Risk Management Principles and Guidelines. Qual. Eng. 2013, 25, 451–454. [CrossRef]38. Guinard, D.D.; Trifa, V.M. Building the Web of Things: With Examples in Node. js and Raspberry pi; Simon and Schuster: New York,
NY, USA, 2016.39. Rosenblatt, M. A central limit theorem and a strong mixing condition. Proc. Natl. Acad. Sci. USA 1956, 42, 43. [CrossRef]40. Buttazzo, G.; Lipari, G.; Abeni, L.; Caccamo, M. Soft Real-Time Systems; Springer: Berlin/Heidelberg, Germany, 2005.41. Martinez-Rendon, C.; Camarmas-Alonso, D.; Carretero, J.; Gonzalez-Compean, J.L. On the continuous contract verification using
blockchain and real-time data. In Cluster Computing; Springer: Berlin/Heidelberg, Germany, 2021; pp. 1–23.