Embed Size (px)
Citation preview

A world class convention and exhibition centre for Sydney: Pre-feasibility StudyFinal Report September 2010

Comments and queries can be directed to:
Scott Lennon Partner – PricewaterhouseCoopers T 02 8266 2765 E [email protected]
Brendan Lyon Executive Director – Infrastructure Partnerships Australia T 02 9240 2050 E [email protected]
Kylie Gillett Manager, Industry Affairs – Infrastructure Partnerships Australia T 02 9240 2059 E [email protected]
Disclaimer
This report has been prepared by PricewaterhouseCoopers (PwC) for Infrastructure Partnerships Australia (IPA).
The information, statements, statistics and commentary (together the ‘Information’) contained in this report have been prepared by PwC from material provided by the IPA, and from other industry data from sources external to IPA. PwC may at its absolute discretion, but without being under any obligation to do so, update, amend or supplement this document.
PwC does not express an opinion as to the accuracy or completeness of the information provided, the assumptions made by the parties that provided the information or any conclusions reached by those parties. PwC disclaims any and all liability arising from actions taken in response to this report. PwC disclaims any and all liability for any investment or strategic decisions made as a consequence of information contained in this report. PwC, its employees and any persons associated with the preparation of the enclosed documents are in no way responsible for any errors or omissions in the enclosed document resulting from any inaccuracy, misdescription or incompleteness of the information provided or from assumptions made or opinions reached by the parties that provided Information.
The Information contained in this report has not been subject to an Audit. The information must not be copied, reproduced, distributed, or used, in whole or in part, for any purpose other than detailed in our Engagement Letter without the written permission of IPA and PwC.

1

Contents
1 Executive summary 6
2 Introduction 31
Background 31
Scope of this study 32
3 Rationale for providing convention and exhibition facilities in NSW
33
Role of convention and exhibition facilities 33
Value of business events to the community 34
Rationale for government investment in expanding Sydney’s convention and exhibition facilities
36
4 Current facilities in Sydney 38
Current facilities in Sydney 38
Conventions and exhibitions in Australia 45
Conventions and exhibitions internationally 50
Constraints of current facilities in Sydney 56
Economic implications of these constraints 58
5 Options for new or expanded facilities in Sydney 64
Introduction to options for expansion 64
1. Expand the Sydney Convention and Exhibition Centre 67
2. Expansion of Sydney Showground 79
3. Develop airspace over Central Station 80
4. Glebe Island and White Bay 82
5. Barangaroo precinct 83
Assessment of site options 85
Economic benefits of creating an expanded, world class facility in Darling Harbour
86

6 Delivery and funding models for a new or expanded facility 88
Existing facilities in Australia 88
Private and public sector delivery options 95
Benefits of private sector participation 98
Funding options 99
Contributions from government and resulting benefits to the NSW economy
102
7 Risk allocation 103
Risk allocation matrix 103
8 Proposed way forward 108
Proposed way forward 108
Appendices 111
Appendix A – Acronyms 111
Appendix B – Artist impression of an expanded SCEC 112
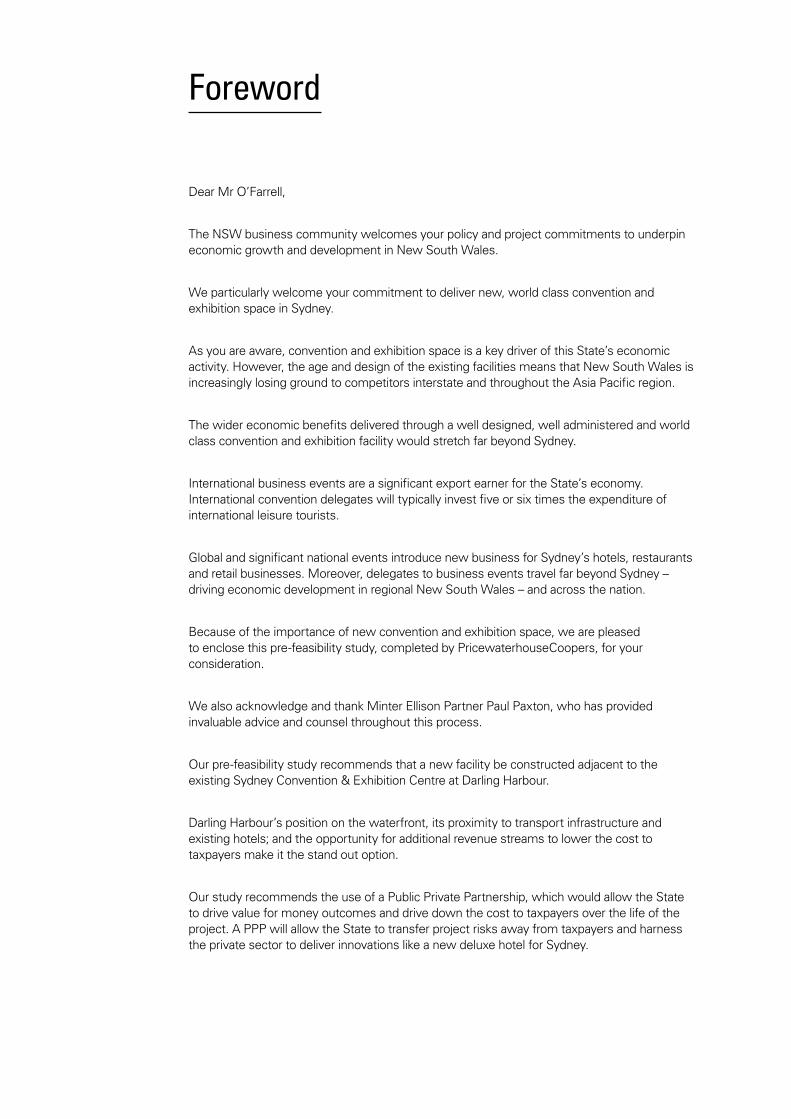
Dear Mr O’Farrell,
The NSW business community welcomes your policy and project commitments to underpin economic growth and development in New South Wales.
We particularly welcome your commitment to deliver new, world class convention and exhibition space in Sydney.
As you are aware, convention and exhibition space is a key driver of this State’s economic activity. However, the age and design of the existing facilities means that New South Wales is increasingly losing ground to competitors interstate and throughout the Asia Pacific region.
The wider economic benefits delivered through a well designed, well administered and world class convention and exhibition facility would stretch far beyond Sydney.
International business events are a significant export earner for the State’s economy. International convention delegates will typically invest five or six times the expenditure of international leisure tourists.
Global and significant national events introduce new business for Sydney’s hotels, restaurants and retail businesses. Moreover, delegates to business events travel far beyond Sydney – driving economic development in regional New South Wales – and across the nation.
Because of the importance of new convention and exhibition space, we are pleased to enclose this pre-feasibility study, completed by PricewaterhouseCoopers, for your consideration.
We also acknowledge and thank Minter Ellison Partner Paul Paxton, who has provided invaluable advice and counsel throughout this process.
Our pre-feasibility study recommends that a new facility be constructed adjacent to the existing Sydney Convention & Exhibition Centre at Darling Harbour.
Darling Harbour’s position on the waterfront, its proximity to transport infrastructure and existing hotels; and the opportunity for additional revenue streams to lower the cost to taxpayers make it the stand out option.
Our study recommends the use of a Public Private Partnership, which would allow the State to drive value for money outcomes and drive down the cost to taxpayers over the life of the project. A PPP will allow the State to transfer project risks away from taxpayers and harness the private sector to deliver innovations like a new deluxe hotel for Sydney.
Foreword

A PPP will allow New South Wales to capture the sort of benefits delivered by the award winning Melbourne Convention and Exhibition Centre PPP.
Your commitment to a new convention and exhibition facility in Sydney will also be an important way to restore integrity to the State’s infrastructure programme.
During this study we have seen very significant interest from a range of respected industry participants from across the tourism and infrastructure sectors.
We note that the next phase of this process involves a consultation with interested parties, including potential financiers, constructors and operators to be overseen by an independent panel.
We believe this interactive process will be important to further refine the options in terms of site, scale and funding model. This consultation phase will allow the project to be advanced quickly from concept to commission, if you are elected to govern next March.
In summary, we have been pleased to oversee the enclosed pre-feasibility study and commend it to you.
Yours sincerely,
Matthew Hingerty Australian Tourism Export Council
Glenn Byres Property Council of Australia
Christopher Brown Tourism & Transport Forum
Brendan Lyon Infrastructure Partnerships Australia
The Hon Patricia Forsythe Sydney Business Chamber

6
The Sydney Convention and Exhibition Centre is ageing, has limited capacity and is experiencing increased competition related to the size and flexibility of its offering
This is losing economic benefit for NSW
Introduction
The Sydney Convention and Exhibition Centre (SCEC) was opened in 1988. The facility cost $287 million (or $630 million in today’s dollars), with a $57 million extension opened in 1999 ($85 million in today’s dollars).
These facilities have served Sydney well; but it is clear that the existing centre is ageing and will not be fit for purpose in the years ahead. The SCEC now requires significant investment and already the facility is often trading at full capacity because of high demand from domestic exhibitions. Additionally, the shortage of available space and the lack of flexibility in its design is increasingly impeding Sydney’s ability to meet demand.
Sydney is facing mounting domestic and regional competition for the right to host major events; without action, these circumstances will increasingly see Sydney losing market share for high value national and international business events.
The lack of investment in new convention and exhibition space means New South Wales is missing out on economic opportunities. Without investment to renew and upgrade the required infrastructure, this trend will accelerate as expanded facilities in Melbourne, Hong Kong and Singapore erode Sydney’s competitiveness.
This report provides a high level pre-feasibility study of the options that are available to deliver new or expanded convention centre capacity in Sydney.
This paper provides analysis and recommendations about the options that are available to policy makers in New South Wales to deliver world-class convention facilities for Sydney.
This study was prepared by PricewaterhouseCoopers on behalf of Infrastructure Partnerships Australia –with input from a steering committee comprised of:
• The Australian Tourism Export Council (ATEC);
• Infrastructure Partnerships Australia (IPA);
• The Property Council of Australia (PCA);
• The Sydney Business Chamber (SBC); and
• The Tourism & Transport Forum (TTF).
1. Executive summary

7
Scope of the study
This paper provides a high level pre-feasibility study of the options for new or expanded convention space in Sydney. This report considers options including the location, capacity, economic benefit and procurement model for a new facility. The terms of reference for the study are to:
• Identify the best location for a new or expanded Sydney conference and exhibition centre;
• Specify the size and key facilities required to make a convention and exhibition centre world class and internationally competitive;
• Identify vacant or underutilised state government owned land that could be used as a site to build or expand the existing convention and exhibition centre;
• Develop a funding model for the convention centre, including consideration of private investment, public private partnerships, in kind contributions from The State Government and minimising the impact on NSW taxpayers;
• Identify benefits to the NSW economy from the new facility including models to ensure that regional NSW benefits from the infrastructure; and
• Develop a target list of international conferences and events that could be attracted to the new convention centre.
The assessment draws on:
• Contributions from the steering group;
• Available literature and published data and studies;
• Other convention/exhibition developments in Australia;
• Interviews with key stakeholders including Business Events Sydney (BESydney), Tourism NSW, and the Sydney Harbour Foreshore Authority; and
• A range of private sector parties, including possible operators, financiers, construction companies and architects.

8
Rationale for providing convention and exhibition facilities in NSW
Business events generally provide significant wider economic benefits beyond what can be captured by either event organisers or the owners of the facilities required for such events. This means that there is a substantial benefit derived from cities hosting business events. However, the cost of providing quality convention and exhibition infrastructure is often too high for the facility to be self-sufficient, meaning that government investment for their construction (and sometimes operation) is generally required.
Business events allow local businesses to make overseas or interstate sales. They allow local firms to build national and global networks that later have valuable payoffs for both those companies and the State economy. Moreover, business events attract high yield visitors to Sydney who stay in hotels, eat at restaurants and shop at local retailers. Often, these visitors will extend their visits as tourists in regional New South Wales and interstate.
Every year, Australia hosts more than 300,000 business events involving more than 20 million participants. These events drive expenditure of more than $17 billion each year.
Currently, New South Wales enjoys the lion’s share of these events. A study of Australia’s business events found that while NSW hosted around 27 per cent of all meetings in Australia, it accounts for around 40 per cent of delegates and resulted in $7 billion in expenditure.
These events drive value to the economy by:
• Contributing to the economy from a tourism perspective - The business events industry is one of the highest yielding tourism segments. For example, international convention delegates will spend five or six times the expenditure of an international leisure tourist. A six day international conference for approximately 2,000 delegates contributes an average of $9 million to the NSW economy. Interstate visitors also contribute expenditure to the NSW economy that may not otherwise occur, and often comprise 20% of major trade show visitors.
• Contributing to regional areas – The economic benefits from world class convention facilities extend well beyond Sydney. For example, 46% of all international convention delegates participate in pre or post-touring to other parts of Australia, and 58% of international convention delegates indicate that they will come back to Australia for a holiday within five years. This provides tourism opportunities for regional areas in NSW and across Australia. Furthermore, the ability to portray and market Sydney as a hub for business activity supports the scope for regional areas to host side or supporting events

9
• Contributing to innovation, education, networking, trade, research and practice – The real benefits of international and national events extend significantly beyond tourism expenditure. Business events connect Australia’s businesses, professions and academics to global best practice. This ability to ensure skills and knowledge transfer in fields like medicine, law, sport and the environment in turn contributes to capacity building across the NSW economy. More broadly, business events showcase Sydney’s capacities, extending Australia’s reputation as a place of highly skilled, capable, world leading researchers.
However, these wider benefits are not easily or efficiently captured, and such a facility is unlikely to be financially self sufficient. This means that there is a case for government support. As considered further in John O’Neill’s 2007 Review into Sydney Convention and Exhibition Space, it follows that government investment in convention and exhibition facilities should maximise Sydney’s capacities to host the business events that will make the greatest contribution to NSW: that is, international conventions and major national conventions.
Current situation
Presently, Sydney’s major convention and exhibition facilities are located at the Sydney Convention & Exhibition Centre (SCEC) at Darling Harbour and the Sydney Show Ground (SSG) which is located at Sydney Olympic Park Homebush. The proximity of the Sydney Convention & Exhibition Centre to the Sydney Entertainment Centre allows SCEC to offer expanded facilities.
There are a variety of other facilities which also serve different segments of the business events market. The majority of venues available for larger scale business events are owned by the NSW Government. These facilities are outlined in Figure ES1, below.
The primary convention and exhibition space facilities in Sydney are at Darling Harbour and Sydney Olympic Park
Figure ES. 1 The five major venues in Sydney
Australian Technology Park
SCEC, Darling Harbour
Sydney Entertainment Centre, Darling Harbour
Moore Park
Sydney Showground, Homebush

10
In addition to these larger facilities, some alternative venues are also owned and operated by the private sector, including Rosehill Gardens, Star City casino, and facilities such as hotels with convention capacity which generally caters for events of up to 800 participants.
A range of recent studies have pointed to the economic benefit and importance of Sydney’s ability to successfully compete for major business events. These studies particularly point to the importance of high yield international events because of flow on benefits. Examples include John O’Neill’s 2007 study, and Revitalising the Convention & Exhibition Industry in Sydney, which was prepared for the Tourism & Transport Forum and Property Council of Australia, also in 2007.
Sydney’s market share of events in Australia is declining
Historically, Sydney has dominated the market for major conventions and exhibitions in Australia. But now, Sydney is facing mounting competition from interstate and regional competitors. A 2007 report found that Sydney is already losing 220 business events every year, equating to lost rental revenues of around $300,000 per event – or $65 million each and every year.
While roughly comparable in size and capacity, the competition from other Australian cities has been spearheaded by almost $1 billion in new infrastructure to support better quality business events in those cities. An example would be the $413 million development at the Melbourne Convention and Exhibition Centre (MCEC) – developed along with a $750 million ‘mixed-use’ surrounding commercial precinct – which introduced an additional 30,000 m2 of convention centre space with seating for 5,000 co-located with the existing Melbourne Exhibition Centre facility.
Figure ES.2 Comparison of the SCEC and other major domestic venues
The SCEC is one of the largest facilities in Australia and historically hosts the largest share of major events in Australia. It is difficult to compare facilities in this way as many modern facilities such as the MCEC and BCEC are designed with high flexibility and multi use options.
5,000
0
10,000
15,000
20,000
25,000
30,000
35,000
40,000
Sydney Convention
and Exhibition Centre
Sydney Entertainment
Centre
Sydney Showground(Homebush)
Acer Arena
Max. convention capacity (seats)
Melbourne Convention
and Exhibition Centre
Brisbane Convention
and Exhibition Centre
Darwin Convention
Centre
Adelaide Convention
Centre
Perth Convention
Centre
Exhibition space (m2)
Due to increased competition, Sydney is losing events to the economic equivalent of hosting a Rugby World Cup every year
11
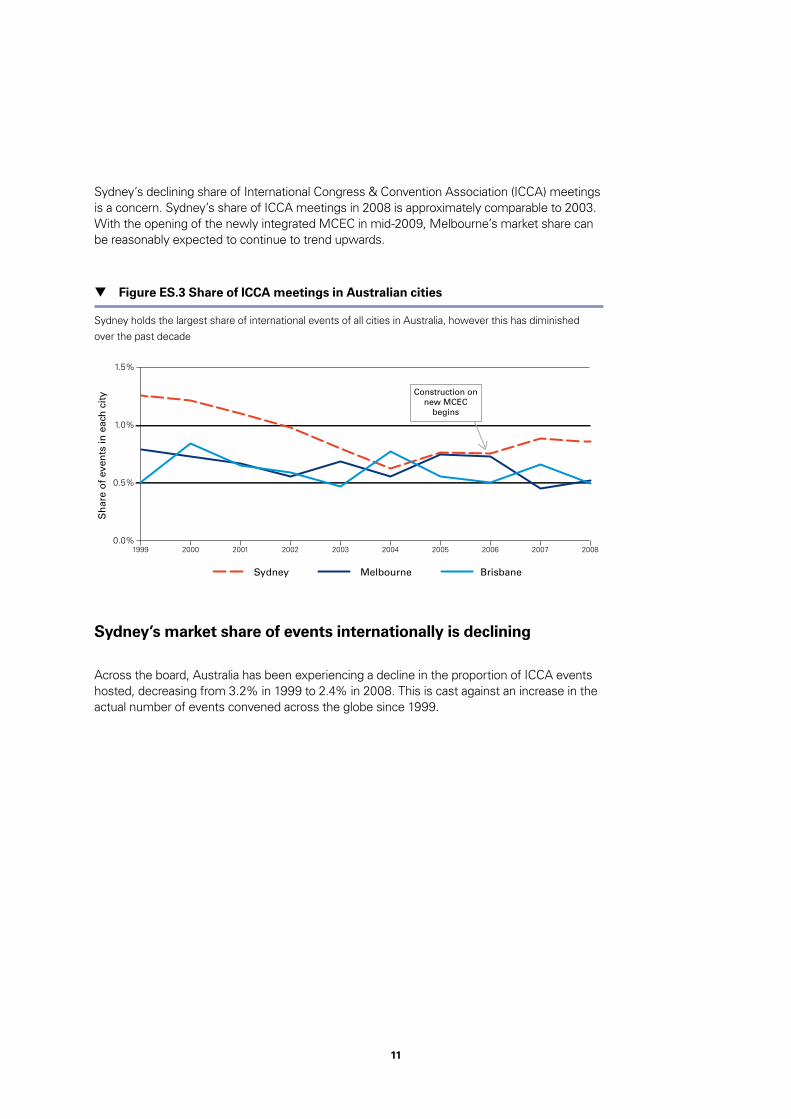
Sydney’s declining share of International Congress & Convention Association (ICCA) meetings is a concern. Sydney’s share of ICCA meetings in 2008 is approximately comparable to 2003. With the opening of the newly integrated MCEC in mid-2009, Melbourne’s market share can be reasonably expected to continue to trend upwards.
Sydney’s market share of events internationally is declining
Across the board, Australia has been experiencing a decline in the proportion of ICCA events hosted, decreasing from 3.2% in 1999 to 2.4% in 2008. This is cast against an increase in the actual number of events convened across the globe since 1999.
Figure ES.3 Share of ICCA meetings in Australian cities
Sydney holds the largest share of international events of all cities in Australia, however this has diminished over the past decade
0.0%
Sydney BrisbaneMelbourne
0.5%
1.0%
1.5%
20001999 2001 2002 2003 2004 2005 20072006 2008
Construction onnew MCEC
begins
Sh
are
of
even
ts in
eac
h c
ity
12
The ICCA ranking for future scheduled meetings suggests Sydney’s ranking has declined over the past decade. Sydney’s ranking has shown a marked decline from 1st in 1999/2000; to 4th in 2002 and 11th in 2005. Over this period, major competitors in the Asia Pacific region have brought major new convention and exhibition facilities on-line. Examples include Suntec Singapore and the Hong Kong Convention and Exhibition Centre.
Figure ES.5 shows that SCEC is 30-40 per cent smaller in terms of total available space when compared to Suntec and HKCEC; and it has 70% less total space than the Kuala Lumpur Convention Centre. These new, state of the art regional facilities now provide versatile, multi functional spaces that can be used to convene a versatile range of business events.
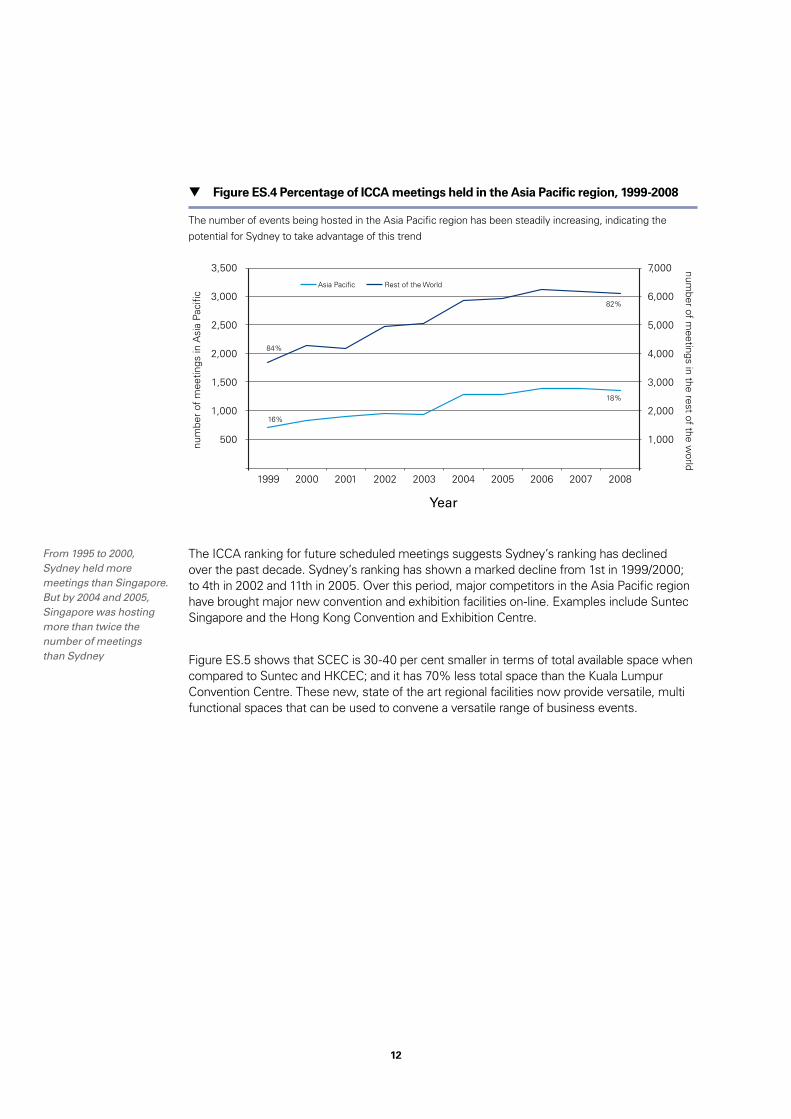
From 1995 to 2000, Sydney held more meetings than Singapore. But by 2004 and 2005, Singapore was hosting more than twice the number of meetings than Sydney
Figure ES.4 Percentage of ICCA meetings held in the Asia Pacific region, 1999-2008
The number of events being hosted in the Asia Pacific region has been steadily increasing, indicating the potential for Sydney to take advantage of this trend
3,500
3,000
2,500
2,000
1,500
1,000
500
7,000
6,000
5,000
number of m
eetings in the rest of the world
num
ber
of m
eetin
gs in
Asi
a Pa
cific
4,000
3,000
2,000
1,000
20001999 2001 2002 2003 2004 2005 2006 2007 2008
Asia Pacific
84%
16%
82%
18%
Rest of the World
Year

13
Broader economic implications if the trend of losing market share of domestic and international events continues
The Sydney Convention and Exhibition Centre makes a significant economic contribution to the State economy. That in turn means that a decline in market share for major events will reduce economic activity and opportunities for New South Wales.
SHFA indicates the economic contribution of the SCEC has declined from $478 million in 2006-07, to $474 million in 2007-08, then $466 million in 2008-09. This trend suggests an average year-on-year decline of 1% per annum – representing a 4% real decrease per annum, once inflation is taken into account.
Furthermore, the number of international events hosted at the SCEC has decreased 8% year-on-year between 2006-07 and 2008-09.
Figure ES.5 Comparison of the SCEC and world class facilities: total leasable space
The SCEC and SEC combined are approximately 30-40% smaller in terms of total space compared to Suntec and HKCEC, and 70% smaller than space at the Kuala Lumpur Convention Centre
20,000
0
40,000
60,000
80,000
100,000
120,000
SCEC(including SEC)
Approx 70,000 m2
91,500 m2
120,000 m2
100,000 m2
HKEC
Convention
Kuala Lumpur Convention Centre
SuntecSingapore
Exhibition Multi purpose & other
Do nothing scenario - if current trends continue, the economic contribution of the SCEC could decrease from the current $466 million pa to around $310 million over the next 30 years

14
The figure above shows the decreasing economic impact of the SCEC under a do nothing scenario. Simply put, a failure to invest in new and renewed capacity will see overall economic benefits decline from around $466 million per annum currently, to around $310 million per annum in 2040.
The decline in international return is the most significant, as NSW is able to fully capture this expenditure as incremental economic benefit, whereas expenditure of local intrastate domestic delegates is lower, being diluted by a substitution effect (e.g. if a Sydney resident does not attend the Motor Show they may have instead attended the movies and generated expenditure anyway).
The SCEC is also losing out on a range of valuable domestic events, because other domestic facilities offer new, larger and more modern facilities, often integrated with accommodation.
Figure ES.6 ‘Do nothing scenario’ - economic impact of the SCEC if current trends continue
If current trends continue, the SCEC’s direct economic impact could decrease from the $466 million currently to around $310 million in 2040
0
50
100
150
200
250
300
350
400
450
500
2008
2010
2012
2014
2016
2018
2020
2022
2024
2026
2028
2030
2032
2034
2036
2038
2040
International Domestic Total

15
Factors contributing to Sydney’s declining market share of events
The decline in market share of major international and domestic events being hosted in Sydney is attributed to factors including:
1 Ageing facilities;
2 Capacity constraints at SCEC, linked to factors such as:
• Inadequate exhibition space for some major domestic consumer and trade exhibitions;
• Occasions when facilities are unsuitable for an international convention, either because it has insufficient space for an accompanying exhibition or the size of convention space is inadequate;
• Lack of flexibility in the size of rooms as event organisers increasingly demand flexible and functional exhibition space and a mix of plenary, breakout and exhibition space;
• Inadequate IT quality, especially AV, relative to competing venues in Australia; and
• Limited kitchen capacity.
Events that could be facilitated by a world class venue in Sydney
Some examples of major events that are either constrained at the SCEC, or that have been recently relocated to other venues are:
• Swift International Banking Operations Society can no longer be hosted in Sydney due to space constraints - During 2006 the major international exhibition, Swift International Banking Operations Society (Sibos), was held in Sydney at the SCEC. This event was a major success for Sydney. However we are unable to hold this event again, despite its potential to generate $54 million in economic benefits, due to space constraints at SCEC. Sydney will not be considered for 2015 (or future years) unless an expansion of SCEC is undertaken. It is being hosted in Amsterdam this year.
16
• Some current events are forced to operate at smaller than desired levels to utilise the SCEC – events such as the Motor Show, Fine Food Show, and Boat Show would use more exhibition/flexible space at the SCEC if it was available, as they currently utilise the entire centre for these events at the SCEC.
Furthermore, a world class venue would have the potential to host an increased range of international events currently hosted in other cities, including Hong Kong, Singapore and Melbourne. Examples could include:
• International Conference on Materials for Advanced Technologies, more than 3,000 delegates
• Clean Energy Expo, in 2009 over 3,500 professionals, more than 70 international exhibitors and 80 speakers from over 40 countries worldwide
• Options for the Control of Influenza, 1,200 delegates
• Corporate Social Responsibility (CSR) Asia Summit, over 300 international thought leaders
• MIPIM Asia, over 2,000 participants, 400 investors and 200 journalists from over 40 countries
• Aussiecon4 World Science Fiction Convention
• SMART Investment & International Property Expo
• World Congress on Conducive Education
• APCO Australasia Conference & Exhibition
• Sustainable Risk Rationalisation Conference
• International Conference on Solid Waste.

17
World class facilities provide flexible space that could be leased for conventions, exhibitions, entertainment acts, or a range of other events
Size and key facilities to make a convention and exhibition centre world class and internationally competitive
After considering the venues Sydney most competes with in the Asia Pacific, the following traits have been identified as making a convention and exhibition centre internationally competitive:
• Size – compared to other world class venues, for example the Suntec in Singapore. the HKCEC in Hong Kong, and the Kuala Lumpur Convention Centre, the SCEC and SEC combined are currently 30-70% smaller in terms of total space. These three venues claim total sizes between 90,000-120,000m2. Given the lower proportion of international exhibitions hosted in Australia, relative to these three cities, there may not be a need to expand space to this extent – although it does point to available space as a limiting factor on Sydney’s capacity.
• Location – an aspect that the SCEC already shares with the Suntec, HKCEC and other locations such as Brisbane, Darwin and Perth is a convention and exhibition facility that is not only close to the central business district (CBD) and major 5 star hotels, but it is also located on the waterfront.
• Mix of convention, exhibition and other flexible space – as indicated in Figure ES.5, there does not appear to be a particular mix of types of space that comprises a world class facility. Rather best practice appears to be provision of flexible, multi-function space that can be divided or combined to suit a range of events. For example, at Suntec approximately 12% of the total 100,000 m2 is marketed as convention space and a further 12% as exhibition space, with the remainder a mix of flexible space and other facilities. This suggests that expansion of space in Sydney should maximise provision of flexible and multi-use areas.
• Other key facilities – key facilities at world class facilities include ballrooms, theatres, meeting rooms, restaurants and hotels.
Options for expansion in Sydney
There are various options available to expand Sydney’s convention and exhibition capabilities; however not all site options are suitable. For example, while the Australian Technology Park (ATP) at Eveleigh and Moore Park both cater for boutique events, the age, heritage constraints, physical layout and the limited supporting tourism infrastructure mean that they are generally unsuitable for major international conventions.

18
The table below lists a number of site options that are considered in the context of this pre-feasibility study.
The existing Darling Harbour site has been identified as the best location for an expanded, world class conference and exhibition centre in Sydney
This report finds that the current SCEC location is the best option for a new, world class convention centre for Sydney. This recommendation takes into account the advantages and disadvantages of each site, together with the input from the tourism industry and potential project investors.
The key advantage is the ability to leverage existing facilities surrounding Darling Harbour, including integration with the existing convention and exhibition facilities. The site’s location next to Sydney’s CBD, major hotels and transport networks has obvious advantages.
Table ES.1 Potential options for expanding convention and exhibition capacity in Sydney
Facility/location Available capacity
1. Expansion of SCEC Up to 10,000-20,000 m2 of additional space if the Sydney Entertainment
centre (SEC) site and car park are incorporated, with other alternatives for
refurbishment to increase flexibility
2. Expansion of Sydney
Showground (Homebush)
Potential for additional 14,700 m2 expansion bringing total exhibition
space to 36,300 m2
3. Development at Central
Station
Up to 500,000 m2 of commercial space in airspace above railway lines,
of which 50,000-100,000 m2 could be used as convention/exhibition
space. This was proposed in Sustainable Sydney 2030
4. Development at Glebe Island 40 hectares
Potential for 40,000 m2 space (i.e. smaller than existing SCEC venue)
5. Development at Barangaroo
and Millers Point precinct
22 hectares
A previous report believed the site had potential for 40,000 m2 in
exhibition space and up to 5,000 seat capacity in a plenary hall; (TTF/
PCA 2007) but capacity is not certain, given that the commercial space is
fully allocated and retaining high levels of green space is important
The existing Darling Harbour site has been identified as the best location for an expanded Sydney conference and exhibition centre, given its iconic location and scope to expand into the SEC site

19
Other sites such as White Bay, Central Station and Barangaroo do not allow for synergies from operational integration with the existing facility. In addition, White Bay and Sydney Olympic Park do not enjoy the CBD location provided by the existing site. These sites, in particular White Bay, also have lower bases of foot traffic than Darling Harbour, resulting in lower potential to generate ancillary revenues, which will lower the eventual cost to the taxpayer.
The existing SCEC and Sydney Entertainment Centre (SEC) site also offers significant advantages because of its proximity to other major precincts and redevelopments. These include the University of Technology Sydney’s new $150 million Business School, designed by Frank Gehry and being undertaken as part of a broader master plan and proximity to Sydney University. The site will also enable greater connectivity of the city given its proximity to Darling Park, Darling Walk (currently being transformed into a $560 million dollar redevelopment combining commercial office and leisure space), Chinatown (which is planned for a major upgrade), Broadway and the $860 million redevelopment and expansion of the Star City casino. The SEC site is a 5 minute walk from the major new $6 billion Barangaroo site which will generate activity and business events for the convention and exhibition centre precinct.
In considering potential options, it was considered that any upgrade of the SCEC site to enable high yield international events and conferences to be held at the site would require relocation of some domestic and National exhibitions – this would require an expansion and upgrade of the Sydney Showground which has not been considered in the context of this study.
The NSW Government’s south Darling Harbour master plan currently being prepared will consider the best ways to integrate the Darling Harbour convention and exhibition centre precinct with popular tourist precincts including Chinatown, the Powerhouse Museum and the education precinct at the University of Technology. The developments planned in the precinct will increase pedestrian and thoroughfare activity and general ambience in the precinct, contributing to retail and hotel demand if developed at the site – an advantage not shared by the other sites identified in this study. Even before these developments, Darling Harbour attracts more than 27 million visitors each year, which supports greater ancillary revenue potential and a reduction in the extent of Government support required.
Figure ES.7 Location of the SCEC and SEC in Darling Harbour
Star City Barangaroo SCEC SEC SEC Car Park
20
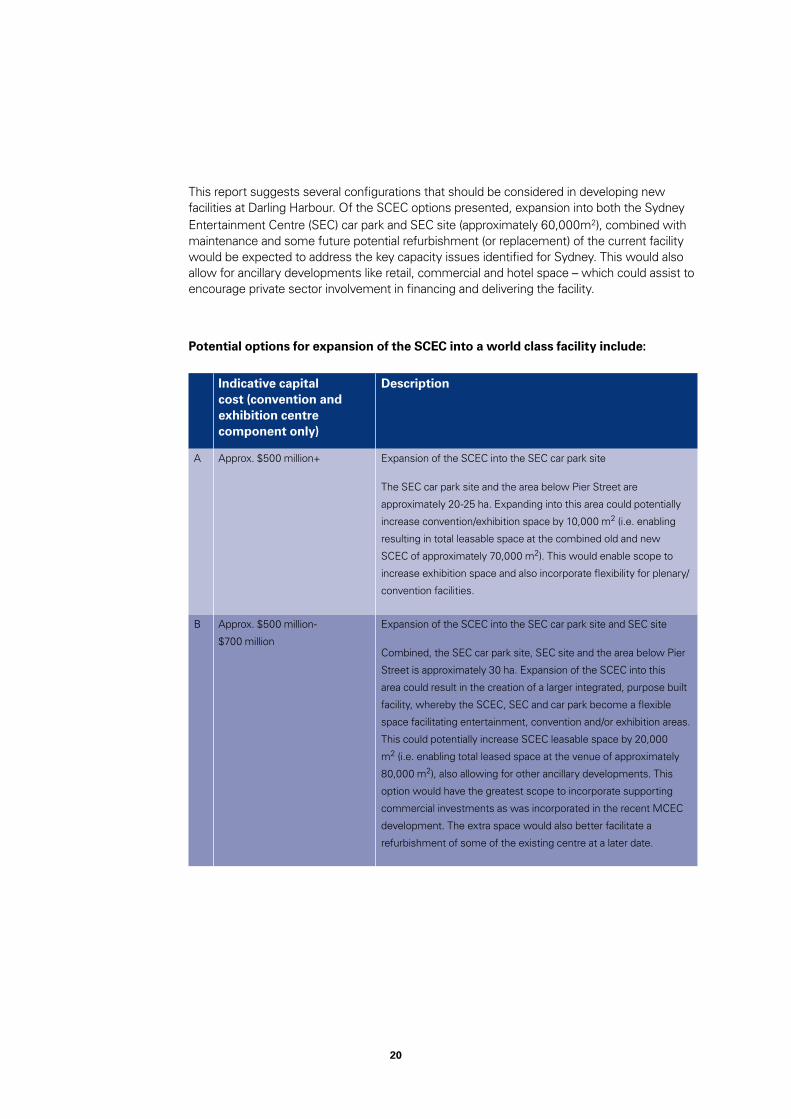
This report suggests several configurations that should be considered in developing new facilities at Darling Harbour. Of the SCEC options presented, expansion into both the Sydney Entertainment Centre (SEC) car park and SEC site (approximately 60,000m2), combined with maintenance and some future potential refurbishment (or replacement) of the current facility would be expected to address the key capacity issues identified for Sydney. This would also allow for ancillary developments like retail, commercial and hotel space – which could assist to encourage private sector involvement in financing and delivering the facility.
Potential options for expansion of the SCEC into a world class facility include:
Indicative capital cost (convention and exhibition centre component only)
Description
A Approx. $500 million+ Expansion of the SCEC into the SEC car park site
The SEC car park site and the area below Pier Street are
approximately 20-25 ha. Expanding into this area could potentially
increase convention/exhibition space by 10,000 m2 (i.e. enabling
resulting in total leasable space at the combined old and new
SCEC of approximately 70,000 m2). This would enable scope to
increase exhibition space and also incorporate flexibility for plenary/
convention facilities.
B Approx. $500 million-
$700 million
Expansion of the SCEC into the SEC car park site and SEC site
Combined, the SEC car park site, SEC site and the area below Pier
Street is approximately 30 ha. Expansion of the SCEC into this
area could result in the creation of a larger integrated, purpose built
facility, whereby the SCEC, SEC and car park become a flexible
space facilitating entertainment, convention and/or exhibition areas.
This could potentially increase SCEC leasable space by 20,000
m2 (i.e. enabling total leased space at the venue of approximately
80,000 m2), also allowing for other ancillary developments. This
option would have the greatest scope to incorporate supporting
commercial investments as was incorporated in the recent MCEC
development. The extra space would also better facilitate a
refurbishment of some of the existing centre at a later date.

21
As part of Option B, the live concert capacity of the Entertainment Centre could be replaced with the new convention and exhibition centre having a large scale flexible plenary/entertainment hall with world class stage and acoustics capable of hosting major concerts for crowds of potentially 6,000-10,000 people, depending on stage layouts. In recent years the age and quality of the Entertainment Centre has seen it experience increasing competition from venues such as Acer Arena. The inclusion of state of the art concert space within a new convention and exhibition centre would mean the CBD again has a modern, competitive and flexible live concert venue.
Both Option A and Option B will involve expansion into the Wilson Entertainment Carpark. This carpark currently has a 1,900 car capacity, and while some of these car parks may be reduced due to the expansion, there will be scope to retain some of this capacity or construct additional capacity underground. Importantly, any impact on the availability of car park spaces will be largely offset by those being constructed as part of the new Darling Walk development. This development includes an 800 space car park, with 600 spaces available to the public. Of course, there are other car park options available in the Darling Harbour district, for example the SCEC is served by its own Exhibition Centre Carpark that can accommodate 750 cars, and the SEC reports that there are around 10,000 spaces within a 10 minute walk.
Considering Options A and B above as ‘Phase 1’ of development of a world class facility in Sydney, ‘Phase 2’ following the expansion could include upgrades and refurbishment to the existing facility. However, it is expected that Phase 1 would need to be completed first to accommodate pre-booked events during construction of the new facility.
Phase 2 options for the existing facility include:
• Limited upgrades and maintenance - To address some issues related to ageing facilities relating to upgrading and maintenance of the roof, air conditioning, kitchen and loading docks. This would not expand capacity. (Cost estimate: approx. $320 million)
• Structural enhancement and refurbishment of SCEC Exhibition Halls - Converting the halls into a streamlined, flexible space. While this would not directly increase capacity, it would allow the existing venue to cater for a wider range of events, potentially simultaneously. As an extension to this option, the potential to convert the existing exhibition halls into 2-storey halls to increase capacity could be explored offset by challenges to continue operation of current facilities during construction. (Cost estimate: approx. $400 million)
• Redevelop or demolish existing SCEC site – Given the underlying costs of renovating, especially the roof, air conditioning, IT systems, loading bays and kitchens, a further Phase 2 option could be to build a new wing for the centre on the existing SCEC site to better integrate into the new Phase 1 centre.

22
Economic benefits of creating an expanded, world class facility in Darling Harbour
An expansion of the SCEC into the SEC car park and potentially also the SEC site has the potential to increase leasable entertainment, convention and exhibition space by 10,000-20,000 square metres. Importantly, it offers the opportunity to introduce more flexible space, enabling multiple events to be hosted at one time. As a result of an expanded SCEC’s ability to attract large scale events, the number and scale events hosted in Sydney would be expected to increase. Attracting additional interstate and international delegates and other visitors will generate new expenditure in NSW resulting in an increase in the economic benefit contributed by the SCEC to the NSW economy.
As indicated in the figure below, this report finds that a new, world class convention and exhibition centre will deliver additional economic benefit of between $160 million and $270 million each year, depending on which site configuration is adopted.
Figure ES.8 Possible increase in economic benefit relative to a do nothing scenario (Phase 1 SCEC expansion only)
Compared to a ‘do nothing’ scenario, expansion of the SCEC has the potential to increase economic impacts by $160-270 million pa, or $2.0-3.4 billion over 30 years in today’s dollars
0
100
200
300
400
500
600
700
800
900
2008
2010
2012
2014
2016
2018
2020
2022
2024
2026
2028
2030
2032
2034
2036
2038
2040
Base Case (no expansion/do nothing)
SCEC expanded into the SEC carpark and SEC site
SCEC expanded into the SEC carpark
$ m
illio
ns

23
Economic benefits experienced from the expansion of convention and exhibition facilities in other Australian jurisdictions are described below:
• The economic benefits to development of the Perth Convention Centre are derived through the extra visitors to the State, have been calculated as $2.2 billion over the life of the Centre, or approximately $63 million per year for 35 years.
• The Melbourne Convention Centre development alone is anticipated to inject around $200 million a year into Victoria’s economy for the next 25 years - a $5 billion boost to the Victorian economy. The investment will create another 2,500 new jobs on top of the almost 1,800 created during construction of the centre and commercial precinct in South Wharf.
Cost benefit analysis of a world class facility
Ideally, the economic contribution of an expanded, world class facility in Sydney would be assessed as part of a cost benefit analysis (CBA). A CBA aims to understand how efficiently funds are being allocated in order to generate benefits for NSW residents and businesses. Such an analysis requires a sizeable amount of data and which was not available to this study.
However, a CBA was undertaken for the Melbourne Convention Centre project, which suggested that the project had a strong benefit cost ratio (BCR) of over 2.5. The net benefits were driven by the expanded centre attracting more overseas visitors, a large proportion of which undertake pre or post-touring to other parts of Australia.
Delivery and funding models for a new or expanded facility
In spite of the significant wider economic benefits delivered by a highly functional convention and exhibition centre, the revenue generated from events, conferences and exhibitions will not be sufficient to cover upfront capital, operational and maintenance costs.
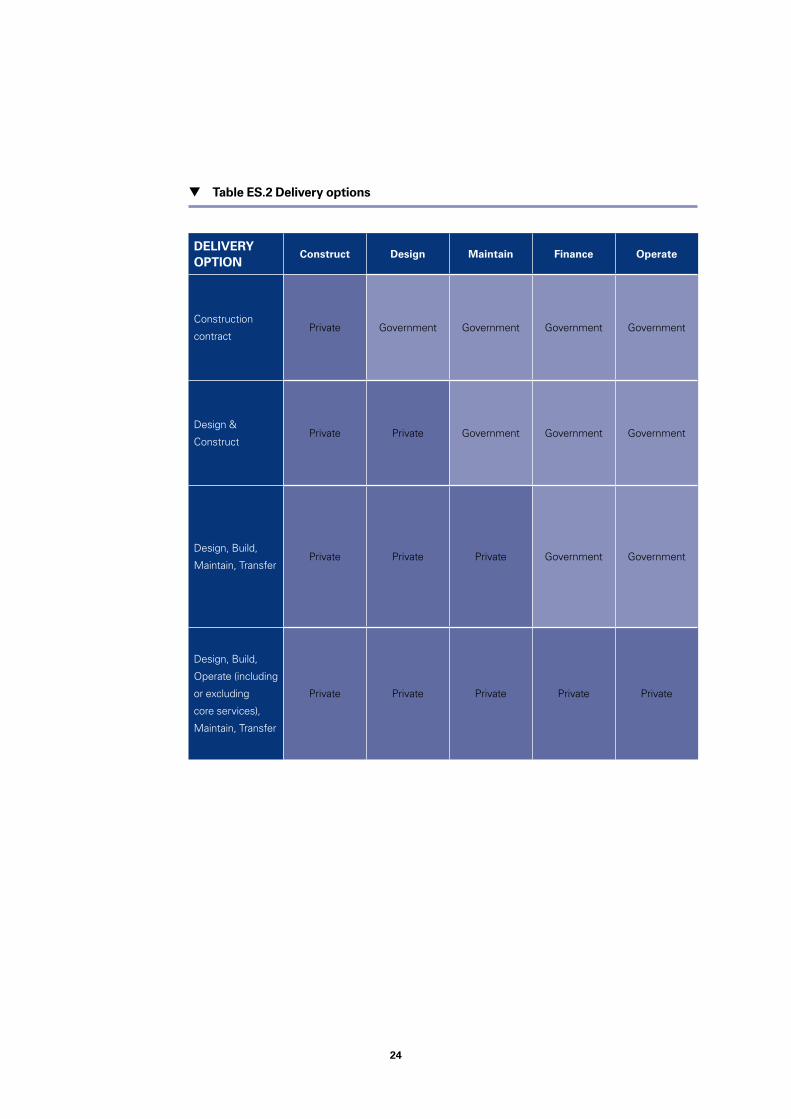
A majority of other states utilised alternative sources to fund the upfront and ongoing costs of facilities by leveraging private sector investment. There are a range of possible roles for private sector involvement in the development and operation of an expanded convention centre in Sydney. The following table presents the spectrum of possible private sector involvement in the delivery of facilities.
24
Table ES.2 Delivery options
DELIvERY OPTION
Construct Design Maintain Finance Operate
Construction
contractPrivate Government Government Government Government
Design &
ConstructPrivate Private Government Government Government
Design, Build,
Maintain, TransferPrivate Private Private Government Government
Design, Build,
Operate (including
or excluding
core services),
Maintain, Transfer
Private Private Private Private Private

25
Benefits of private sector participation
The benefits of private sector participation for the expanded Sydney Conference and Exhibition facility are likely to include:
• Risk transfer: An opportunity to transfer various risks to the private sector such as integrated design, construction and refurbishment, programming and facilitating existing conference bookings, operational, ongoing maintenance and refurbishment as well as risks inherent in various commercial opportunities (e.g. retail, parking, hotel).
• One point of contact: The State will deal with one party to build, operate and maintain the facilities reducing the risk of managing and interfacing with multiple parties. This will reduce interface risk and ongoing administrative costs.
• Innovation: An innovative, integrated design that takes into consideration the urban design and aesthetics of the environment and expanded SCEC, facilitated by a project plan that considers the complexity of a staged development, refurbishment and potential relocation of utilities and infrastructure, within the requirements of continued service delivery.
• Flexibility: A facility that can be easily and cost effectively adapted to cater for a broad range of conferences, exhibitions and activities with a particular focus on international events using leading edge technology and approaches.
• Efficiency and integration: Reducing ongoing operations and maintenance costs by introducing efficiencies through sharing and management of resources, e.g. sharing of kitchen facilities for conferences and a hotel.
• Core services: Enhancing the State’s ability to focus on the core activities of attracting and scheduling key international events for the duration of the project term.
• Whole of life costing: Securing value for money through requiring the private sector to design, operate and maintain facilities that result in designs that minimise ongoing costs and extends the life of assets.
• Technology: Obtaining higher levels of private sector innovation and technology in flexibility and conferencing by building it into the State’s requirements.
26
• Commercial Opportunities: Reducing the cost of the SCEC to the State through leveraging core private sector skills in commercial development opportunities such as hotels, residential, retail, restaurants, advertising and car parks by granting 99 year leases or granting freehold access over parcels of land.
• Increased utilisation: By providing improved service outcomes, flexible facilities with the latest technologies, the Project is likely to attract the target local and international client base resulting in increased events and resultant revenue.
Funding options
There are a range of options available through a PPP that will lower the cost to government of a new facility. Some of the commercial development opportunities previously identified for an expanded Sydney Convention and Exhibition Centre that can be used to offset the capital cost of the project are likely to include:
• Granting of airspace and development rights for a 5 star 200 bed hotel above the new centre as a percentage of delegates will require high-quality accommodation close to the event. The need for a 4 /5 star hotel is emphasised by the lack of 4/5 star hotel supply post the Olympics compared to Melbourne. The Hotel and the expanded Sydney Convention and Exhibition Centre can gain economies of scale through sharing core facilities such as the kitchen and ballroom, security, maintenance and cleaning.
• Providing 99 year lease over the property earmarked for commercial developments to reduce the funding requirement for the project. Commercial developments are likely to include car parking spaces, student apartments due to proximity to UTS, commercial office space and retail developments.
• By involving the private sector the project is likely to increase utilisation of exhibition space, provide increased quality of design in the Darling Harbour area generating increased uplift in property values and ancillary rental streams compared to conventional procurement by SHFA
• The project provides a direct link with the commercial office development in Darling Walk providing increased potential for business events and ‘on foot traffic’ is likely to boost retail
Contributions from government and resulting benefits to the NSW economy
As discussed, the expansion of the SCEC has the potential to increase economic benefits received by NSW (currently $466 million per annum) by $160 million each year for expansion into the SEC car park, and up to $270 million each year for expansion into the SEC car park and SEC site, as described above.

27
The annual net cost to government for an expanded SCEC procured through a service payment PPP is estimated at $40 to $60 million.
The estimated cost assumes a 30 year PPP project term with an initial capital cost of $500 million, which is offset by the realisation of commercial revenue opportunities. The quantum of commercial revenue offset reflects indicative proposals received from the private sector for an expanded SCEC. The cash flows making up the net cost is illustrated in the diagram below.
The gross annual Availability Payment reflects the total annual payment to be made by Government for the expanded SCEC. The private sector will determine and deliver the commercial opportunities that reduce the gross annual Availability Payment to $115-135 million per annum. In addition, the NSW Government would receive income from events hosted at the expanded SCEC that further reduces the net cost of the expanded SCEC to $40-60 million per annum.
Proposed way forward
A proposed way forward is described below, though this could be expanded and altered following private sector submissions and outcomes of work such as the SHFA master plan to redevelop and expand NSW’s convention and exhibition facilities (due for completion at the end of 2010):
Figure ES.9 Estimated net annual cost of an expanded SCEC procured through a PPP
PPP Grossannual
AvailabilityPayment
Service Payment$130 - 150 m
CommercialRevenue
Net Annual AvailabilityPayment
GovernmentAvailability
Payment$115 - 135m
Sydney EventsCentreIncomereceived
Net Annual Costto Government
Net Cost to NSWGovernment
$40 - 60m p.a.
Retail $5 - 6m
Car Parks $11 - 13m
Revenue from events - New facilities $65m
Revenue from events - Existing facilities $10m
28
Site options
1 Utilise Darling Harbour as the preferred central location for Sydney’s flagship convention and exhibition facility, with a focus on international events
2 Undertake an economic cost benefit analysis on expanding facilities at the SCEC including using land containing the SEC car park and also potentially the SEC, with integration with the existing facilities to create a large scale, world class venue
Leveraging private sector involvement
3 Utilise a PPP for the development, construction and finance and operation of the expanded facility as well as potentially maintaining and operating the existing facility, to take advantage of innovation and to reduce the funding requirement for the project through additional commercial investments in the precinct. Prior to proceeding with a PPP, the PPP would need to demonstrate value for money relative to a public sector comparator
4 Combine the existing and expanded facility in the PPP arrangement, so as not to create two competing facilities and optimise private sector involvement and to extract operational synergies that are available through integrated operation
5 Consider the following inclusions in the PPP arrangement, with flexibility for the private sector to propose ideas and incorporate innovation relating to:
• Phase 1 expansion options into the SEC car park or both the SEC car park and SEC site, as well as the private concessionaire potentially maintaining and operating the existing facility
• Undertaking a future Phase 2 SCEC refurbishment or replacement options, either bundled with the Phase 1 PPP, or as a separate PPP subsequent to the Phase 1 expansion
• The PPP should involve either an availability payment, upfront contribution or combination of both from the NSW Government; with this being a bid criteria to encourage greater ancillary revenue development to lower the cost to Government

29
• Consider approaches for the availability payment and the role of SCEC operation undertaken (i.e. whether it includes all or only some of the following: maintenance, security, food and beverage, some event marketing, event booking, etc., noting that most of the operating roles at the existing facility are already outsourced)
• NSW Government retains control over use of the facility and the types of events hosted. To facilitate this, and to aid attraction of private sector interest, the NSW Government should retain demand risk for the number and types of events, with the private sector financially incentivised to attract extra events to increase utilisation
• Ensure new exhibition, convention and entertainment facilities developed in the expansion are flexible, multi-use space and at a minimum comprise:
- 10,000-20,000 m2 dedicated to exhibitions and conventions if the site is developed into the SEC car park site
- 20,000-30,000 m2 dedicated to exhibitions, conventions and entertainment space if the site is developed into the SEC car park site and SEC, with facilities incorporating flexibility to host live concerts for 6,000-10,000 attendees
- Innovation and connectivity, including conjoining the expanded site with the existing SCEC
- Opportunity to include underground car park
• The concession would include development rights of the precinct, which may include retail, commercial, residential, hotel – with the height, room number and rating of the hotel reflecting preferences of the private sector operator and NSW Government planning and zoning restrictions. The merit of a new 5 star 200-plus bed hotel sited above the new venue should be further considered, as few delegates choose budget accommodation when attending conferences. Post the Sydney Olympics the extent of new 4-5 star hotel supply in Sydney has been low, especially compared to Melbourne. There would be potential for the hotel and the new convention and exhibition centre to share facilities such as a kitchen and ballroom, as well as security, maintenance, cleaning and other ongoing costs, creating a range of capital and operating cost synergies.
30
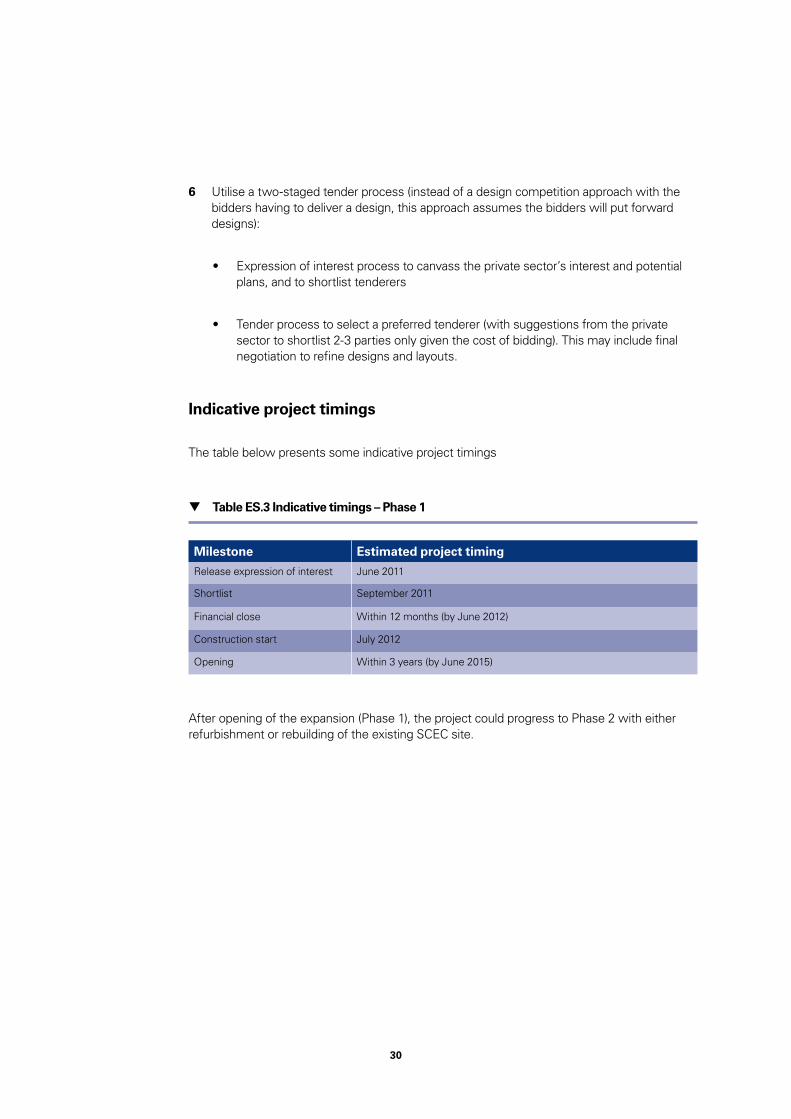
6 Utilise a two-staged tender process (instead of a design competition approach with the bidders having to deliver a design, this approach assumes the bidders will put forward designs):
• Expression of interest process to canvass the private sector’s interest and potential plans, and to shortlist tenderers
• Tender process to select a preferred tenderer (with suggestions from the private sector to shortlist 2-3 parties only given the cost of bidding). This may include final negotiation to refine designs and layouts.
Indicative project timings
The table below presents some indicative project timings
After opening of the expansion (Phase 1), the project could progress to Phase 2 with either refurbishment or rebuilding of the existing SCEC site.
Table ES.3 Indicative timings – Phase 1
Milestone Estimated project timing
Release expression of interest June 2011
Shortlist September 2011
Financial close Within 12 months (by June 2012)
Construction start July 2012
Opening Within 3 years (by June 2015)

31
1 SCEC (2009), Fact File, February 2009, available at: http://www.scec.com.au/content/fact_files/Centre_Fact_File_2009.pdf; and Australian Bureau of Statistics (ABS) (2010), 6427.0 Producer Price Indexes, Building construction, NSW, June 2010 (10 year historical average)
2 International Congress and Convention Association (ICCA) (2008) The International Association Meetings Market 1999-2008, ICCA Statistics Report
Increased competition from other venues is challenging Sydney’s traditional role as a leader in hosting conventions and exhibitions
2. Introduction
This chapter provides background to the convention and exhibition industry in Sydney and outlines the scope of this review.
Background
The current Sydney Convention and Exhibition Centre (SCEC) was opened in 1988 for a construction cost of $287 million (or $630 million in today’s dollars), with a $57 million extension opened in 1999 ($85 million in today’s dollars).1 These facilities are ageing and its capacity is limited due to competing demand from domestic and international exhibitions and other factors related to size and flexibility of its offering.
This is contributing to Sydney’s drop from number seven in 1999 to number twenty-four in 2008 on the International Congress and Convention Association (ICCA) rankings for the number of association meetings.2
In addition to increased international competition, there has been a recent increase in competition between cities within Australia for conventions and events, following the opening of the new Melbourne Convention Centre (integrated with the Exhibition Centre to create the Melbourne Convention and Exhibition Centre (MCEC)) in 2009, and the opening of the Darwin Convention Centre in 2008. Other cities in Australia, such as Brisbane and Perth, have recently or are currently upgrading or expanding their facilities.
Although the SCEC offers a size and location comparable, or even superior, to other venues, the ageing facilities do not adequately provide for the needs of all potential conventions and exhibitions. Stakeholders have indicated that event bookings can be constrained by available space, and the facilities do not offer the flexibility increasingly demanded by event planners.
A number of recent reviews, such as that prepared by John O’Neill in 2007 and the Property Council of Australia (PCA) and Tourism & Transport Forum (TTF) also in 2007 have highlighted the importance of Sydney maintaining its competitive position with regard to conventions and exhibitions, in particular international events, given their flow on economic benefits.

32
This high level study examines the options for new or expanded convention capacity in Sydney
Scope of this study
This study is a high level pre-feasibility study of options of new or expanded convention centre capacity in Sydney. It aims to analyse options on how to best improve the ability to host conventions and exhibitions, which could be either at a new location or further extending the existing Darling Harbour site.
The study was prepared by PricewaterhouseCoopers (PwC) on behalf of Infrastructure Partnerships Australia (IPA) and in conjunction with a steering committee comprising the Australian Tourism Export Council, Property Council of Australia (PCA), Sydney Business Chamber (SBC) and Tourism and Transport Forum (TTF).
The terms of reference for the study are to:
• Identify the best location for a new or expanded Sydney conference and exhibition centre
• Specify the size and key facilities required to make a convention and exhibition centre world class and internationally competitive
• Identify vacant or underutilised state government owned land that could be used as a site to build or expand the existing convention and exhibition centre
• Develop a funding model for the convention centre, including consideration of private investment, public private partnerships, in kind contributions from the State Government and minimising the impact on NSW taxpayers
• Identify benefits to the NSW economy from the new facility including models to ensure that regional NSW benefits from the infrastructure
• Develop a target list of international conferences and events that could be attracted to the new convention centre.
Given the timings and available resources, the assessment draws heavily on available literature and published data/studies as well as other convention/exhibition developments in Australia. Data and suggestions contributed by the steering group, and other key stakeholders including Business Events Sydney (BESydney), NSW Business Chamber, Tourism NSW, Sydney Harbour Foreshore Authority (SHFA), and a range of private sector parties (including possible operators, financiers, construction companies and architects) were considered.
33
3 Deery, Margaret, Jago, Leo, Fredline Liz and Dwyerhe, Larry (2005), The National Business Events Study: An Evaluation of the Australian Business Events Sector
4 Deery et al. (2005), The National Business Events Study: An Evaluation of the Australian Business Events Sector, p19
5 Business Events Sydney (2010), Sydney and NSW Business Events Calendar, ’Examples of 2010 Sydney and NSW business events’, available at: http://www.businesseventssydney.com.au/why-sydney/business-events-calendar/; and SCEC website (2010), available at: http://www.scec.com.au/
Each year NSW hosts more than 81,000 business events involving more than 8 million participants. Nationally expenditure at business events totals $17 billion per annum
and exhibition facilities in NSW
This chapter describes the role of convention and exhibition venues facilitating business events, and the value of business events to New South Wales.
Role of convention and exhibition facilities
Convention and exhibition space exists to service business, government and industry events. Conventions are held to discuss matters of common interest among delegates. Exhibitions bring together suppliers of products, services and information within an environment to promote and display their products to prospective customers.
Each year, Australia hosts more than 300,000 business events, involving more than 20 million participants with total expenditure of $17 billion. Meeting and conference delegates contribute more than half of this expenditure.3 Of these events, NSW holds the largest share of events amongst all the states and territories. In 2003, a study into national business events found that NSW hosted 27% of all meetings in Australia, which accounted for approximately 40% of delegates and resulted in $7 billion of expenditure. In that study, Sydney hosted the largest events.4
Some of the major events hosted in Sydney in 2010 included:
• 7th International Orthodontic Congress
• International Federation of Surveyors Congress
• Lions Clubs International Convention
• Annual World Congress of the Human Proteome Organisation
• Sydney International Boat Show
• Australian International Motor Show.5
3. Rationale for providing convention

34
6 Deery et al. (2005), The National Business Events Study: An Evaluation of the Australian Business Events Sector, p19
7 Foley et al. (2010), A Scoping Study of Business Events: Beyond Tourism Benefits, Executive Summary.
8 Melbourne Convention and Visitors Bureau (2010), Business Events Facts & Figures, available at: http://www.mcvb.com.au/about-mcvb/research/business-events-facts-and-figures.aspx
9 SCEC (2009), Fact File, February 2009, available at: http://www.scec.com.au/content/fact_files/Centre_Fact_File_2009.pdf
10 SCEC (2009), Fact File, February 2009, available at: http://www.scec.com.au/content/fact_files/Centre_Fact_File_2009.pdf
Value of business events to the community
Business events contribute value to the community as a whole – not just the participants.
Although there has been substantial focus on events over the last decade, most of this has related to major events that tend to capture the imagination of the general public. The business event sector, which is an ongoing and high yield component of the event sector, is the ‘quiet achiever’ and has not received adequate recognition for its contribution.6
Business events play a vital role in the broader economic strategy of the State. Business events:
• Contribute to the economy from a tourism perspective
• Contribute in areas such as innovation, education, networking, trade, research and practice – which are likely to far outweigh the financial returns of the tourism spend.7
Tourism impact
The business events industry is one of the highest yielding tourism segments. International and interstate delegates attending business events in Sydney generate significant tourism expenditure for NSW. This contribution is driven by expenditure of these visitors across a wide range of areas from transport and entertainment through to shopping, dining and accommodation.
International delegates make a significant and disproportionately high contribution to the economy. International convention delegates spend (on average) five to six times that of international leisure tourists; and 28% of international delegates also bring their partner.8 As an example, a six day international conference for approximately 2,000 delegates contributes an average of $9 million to the NSW economy.9
At the Sydney Convention and Exhibition Centre (SCEC) in 2008-09, international delegates comprised 3% of all delegates attending events at the venue, but contributed 23% of the total delegate/visitor expenditure generated at the SCEC, with $109 million in expenditure from delegates at international conferences and congresses that year.10

35
11 Stakeholder interviews as part of this study
12 Melbourne Convention and Visitors Bureau (2010), Business Events Facts & Figures, available at: http://www.mcvb.com.au/about-mcvb/research/business-events-facts-and-figures.aspx
Interstate visitors also contribute expenditure to the NSW economy that may not otherwise occur. Interstate visitors can comprise 15-20% of major trade show visitors, further boosting visitor expenditure in NSW. This could result in $70-95 million expenditure for delegates to the SCEC alone each year.11
Regional impact
The tourism impact generated from providing world class convention and exhibition facilities in Sydney that can attract international delegates extend well beyond Sydney:
• 46% of all international convention delegates participate in pre or post-touring to other parts of Australia
• 58% of international convention delegates indicate that they will return to Australia for a holiday within the next five years, after the convention has been held.12
As this suggests, attractions such as the Western Plains Zoo in Dubbo may provide for possible pre or post-touring destinations. Furthermore, the ability to portray and market Sydney as a hub for business activity supports the scope for regional areas to host side or supporting events. In addition, business events could generate innovation and knowledge transfer for regional universities. For example, Newcastle University is known for its medical research; and hosting medical industry events in Sydney may help to promote medical activity and research more broadly in NSW.
Innovation and knowledge impact
It is well established that business events make a significant contribution to the economy from a tourism perspective. However, Foley et al. in A Scoping Study of Business Events: Beyond Tourism Benefits show that beneficial outcomes are also realised in areas including:
• Knowledge expansion
• Networking, relationships and collaboration
• Educational outcomes

36
13 Foley et al. (2010), A Scoping Study of Business Events: Beyond Tourism Benefits, p. 26
14 Foley et al. (2010), A Scoping Study of Business Events: Beyond Tourism Benefits, Executive Summary.
15 Foley et al. (2010), A Scoping Study of Business Events: Beyond Tourism Benefits, Executive Summary.
• Fundraising and future research capacity
• Raising awareness and profiling
• Showcasing and destination reputation.13
Foley et al. suggest that these benefits are realised because business events connect the world’s best practice and international knowledge with local researchers and practitioners - in fields including medicine, law, sport and the environment. In turn, growth in local NSW knowledge contributes to capacity building within each sector. Such events allow for dissemination of new knowledge, techniques, materials, and technologies in each of the sectors, providing Sydney/NSW based educators, practitioners and researchers with access to a network of international colleagues. This networking provides local delegates with new business and research collaborations, and will generate innovation, ideas and research agendas for many years to come.14
More broadly than this, business events showcase Sydney’s capacities, fostering a reputation as a place of highly skilled, capable, world leading researchers.15
Rationale for government investment in expanding Sydney’s convention and exhibition facilities
Large scale convention and exhibition centres tend to require government subsidies for their construction and, in some cases, their operation. The rationale is that some types of business events provide benefits to NSW beyond what can be captured and paid for directly by the facility.
As described in the earlier parts of this chapter, business events attract visitors to Sydney who stay at hotels, eat at restaurants, and shop at local retailers. Some of those people extend their visits as tourists and travel elsewhere in the State. Some events lead to overseas or interstate sales by local businesses or build international networks for local firms that later have valuable payoffs for those firms and the broader State economy. It is not possible for the convention and exhibition centre as a standalone entity to capture a share of these benefits adequate for the facility to be financially self-sufficient, which creates a need for Government support.

37
16 O’Neill, John (2007), Review into Sydney Convention and Exhibition Space, pp 11-12
As considered further in O’Neill’s 2007 Review into Sydney Convention and Exhibition Space, some large hotels in Sydney provide internal convention facilities. However, there is a limit on the size of convention space they can economically provide, requiring facilities to be proportionate to the number of rooms in the hotel. As such O’Neill suggests the need for government funded convention and exhibition facilities is for business events beyond the size that the private sector alone can economically provide - and particularly where those events have substantial external benefits for NSW.
Business events, particularly those with a strong international component, lead to more extensive purchase of tourism services and, in the case of major international conventions, strong interaction that enhances Sydney’s position as a global city and the international ties of its businesses and other knowledge workers.
It follows that government investment in convention and exhibition facilities should be done to serve business events of a size beyond what the private sector alone is able to cater for. Additionally, it should be offered in a way that maximises Sydney’s ability to attract business events likely to make the greatest contribution to NSW: international conventions and major national conventions.16

38
17 O’Neill, John (2007), Review into Sydney Convention and Exhibition Space, p12
18 O’Neill, John (2007), Review into Sydney Convention and Exhibition Space, p2
Sydney typically hosts international conventions and exhibitions, but not large international consumer trade shows
This chapter provides an overview of the current convention and exhibition facilities in Sydney, and how Sydney’s facilities compete both nationally and internationally for events.
Current facilities in Sydney
Convention and exhibition space exists to service business, government and industry events. Broadly, the market for such events comprises conventions and exhibition events. Although the categorisation of these events is fluid, they are generally defined as:
• Conventions are held to discuss matters of common interest among delegates. Professional conventions can encompass various commercial, academic and social groups. (Conventions, of a medium to large scale, sometimes host exhibitions simultaneously)
• Exhibitions bring together suppliers of products, services and information within an environment to promote and display their products to prospective customers. These events primarily lead with show floor activity.17
Sydney currently hosts:
• International, national and local conventions (including corporate meetings)
• National and local consumer trade shows
• Industry related exhibitions.18
Due to the typical large scale of events and relatively small market (compared to Asian centres), Australia in general is not suitable for most international consumer or trade exhibitions and does not host them. Australia is, however, competitive for international conventions due to regional location.
4. Current facilities in Sydney

39
19 Tabcorp (2010), Tabcorp increases investment at Star City, 5 August 2010, available at: http://afr.com/rw/2009-2014/AFR/2010/08/04/Photos/c257fc76-a019-11df-8dca-9e56e9d3303d_tabcorp%20increases%20invest.pdf
20 Private stakeholder interview, 9 June 2010
There are a variety of convention and exhibition facilities in Sydney, each offering different capabilities and targeting slightly different markets
There are a variety of convention and exhibition facilities in Sydney, each offering different capabilities and targeting a range of markets. A majority of the facilities in Sydney are publicly owned by the New South Wales Government. These venues are generally for larger-scale conventions and/or exhibitions, including the:
1 Sydney Convention and Exhibition Centre (SCEC), Darling Harbour
2 Sydney Entertainment Centre (SEC), Darling Harbour
3 Sydney Showground (SSG), at Sydney Olympic Park (Homebush)
4 Moore Park; and
5 The Australian Technology Park (ATP), Eveleigh.
Alternative venues are also owned and operated by the private sector, which provides:
6 Facilities for some exhibitions and plenary events – e.g. Rosehill Gardens hosts the Sydney Stitches and Craft Show and the Rosehill Gardens Boat Show; and Star City casino also provides facilities for events (with Star City’s capacity set to expand with its development of a 3,000-seat event centre comprising 2,400 m2 of column-free space and views over Sydney Harbour and the city skyline)19.
7 Facilities with convention capacity of up to 800 participants – e.g. at some hotels, with the Hilton Hotel in Sydney one option for exhibitions, with capacity of approximately 800 participants.20 Star City’s new 2,400 m2 Events Centre will be the largest event space of any hotel in Sydney.
Table 1 Sydney’s target in the international market
Sydney is a suitable venue for international and domestic conventions
Sydney • • • • •
Hong Kong • • • • • •
Singapore • • • • • •
Kuala Lumpur • • • • • •
Inte
rnat
iona
l
conv
entio
ns
Nat
iona
l
conv
entio
ns
Loca
l
conv
entio
ns
Inte
rnat
iona
l con
sum
er
and
trad
e sh
ows
Nat
iona
l con
sum
er
and
trad
e sh
ows
Loca
l con
sum
er
and
trad
e sh
ows

40
21 Private interview with industry stakeholder, June 2010
22 O’Neill, John (2007), Review into Sydney Convention and Exhibition Space, p14
The locations of the five major facilities are presented in figure 1
The major venues suitable for hosting conventions and exhibitions are geographically spread throughout the greater Sydney metropolitan area and target different markets. In addition to these larger facilities, there are a wide range of Sydney spaces for conventions; especially those catering for less than 800 delegates. These include various hotels, theatres, town halls and other purpose-built convention facilities. While stakeholders suggest that the ability of Sydney hotels to host smaller scale conventions and exhibitions may be limited when compared to Melbourne,21 the range and scope of small to medium sized facilities has not been considered as part of this study – indeed the O’Neill review suggests that there are sufficient facilities to service the needs of this segment of the market.22
Each of the current facilities is described in the table overleaf. The primary convention and exhibition space facilities in Sydney are the Sydney Convention and Exhibition Centre located at Darling Harbour and the Sydney Showground located at Sydney Olympic Park, Homebush.
Figure 1 Map of current facilities in Sydney
Australian Technology Park
SCEC, Darling Harbour
Sydney Entertainment Centre, Darling Harbour
Moore Park
Sydney Showground, Homebush

41
Sources: Sydney Convention and Exhibition Centre Website (2010), http://www.scec.com.au/media_centre/index.cfm; O’Neill, John (2007), Review into Sydney Convention and Exhibition Space, pp 13, 14, 15; Sydney Showground Website (2010): http://www.sydneyshowground.com.au/documents/SS_Brochure2009.pdf; HVS International (2007) Revitalising the Convention & Exhibition Industry in Sydney, p4-19, Redfern Waterloo Authority (2005) Australian Technology Park, Eveleigh - 2005 Master Plan; Wentworth Courier (2010), Rally to save Moore Park this Saturday, 4 June 2010, available at: http://wentworth-courier.whereilive.com.au/news/story/rally-to-save-moore-park-this-saturday/; City of Sydney (2010), Light Rail Solution to Moore Park Mess, 25 June 2010, available at: http://www.sydneymedia.com.au/html/4304-light-rail-solution-to-moore-park-mess.asp
Sydney Convention and Exhibition Centre (SCEC) Darling Harbour
Located in Darling Harbour, the facility was built in 1988 and expanded in 1999. It consists of two main convention facilities with associated meeting rooms and has the ability to offer SEC facilities for plenary sessions.
The high profile location is favourable to attract business-related events, including those with an international focus.
The SCEC is owned by the NSW Government, with the Sydney Harbour Foreshore Authority (SHFA) managing the leasing and contractual arrangements for the centre.
Sydney Showgrounds (SSG) Sydney Olympic Park, Homebush
Located in Homebush, 15km from the CBD, the SSG operates as the site of the Royal Easter Show, and also hosts a number of public and trade exhibitions.
The Show Grounds are owned by the NSW Government and leased to the Royal Agricultural Society (RAS), with the Sydney Olympic Park Authority (SOPA) managing the leasing and contractual arrangements.
Sydney Entertainment Centre (SEC) Darling Harbour
The SEC is located in the southern area of Darling Harbour, near Chinatown opened in 1986.
A majority of events are for entertainment shows or those that require large seating capacities.
Ability to cater for plenary session of up to 11,500 delegates.
The SEC is operated by SHFA for the NSW Government. The centre was privately managed but the operator exited when it lost market share to a newly opened Acer arena.
Moore Park Entertainment Quarter
Located south of the Sydney CBD, the Entertainment Quarter offers a range of facilities including the Showring, Byron Kennedy Hall and Hordern Pavilion. It caters to a boutique market, and the age, heritage listing, physical layout and limited hotel accommodation in close proximity. This means it is generally unsuitable for major international conventions.
The site is managed by Colonial Fist State with Playbill Venues operating the three event facilities: Hordern Pavilion, Royal Hall of Industries and Byron Kennedy Hall.
Earlier in 2010 there was reportedly a State Government plan to transfer the management of Moore Park from the Centennial Park Trust to the Sydney Cricket Ground (SCG) Trust. Following public response it is understood the Premier committed instead that the two trusts develop solutions to traffic, transport and parking problems at Moore Park.

42
Australian Technology Park Eveleigh
Located in Eveleigh close to railway lines. Established in 1996 and home to numerous technology and media companies.
Offers 6,850 m2 of exhibition space, a 524 seat theatre and ten meeting rooms. As with Moore Park, caters to small local boutique exhibitions and conferences, but the small exhibition hall does not meet requirements of major exhibitions. Heritage issues and multiple pillars in exhibition spaces limit useability of the facility.
Owned and managed by Redfern Waterloo Authority (RWA), a government organisation, since 2005.
Rosehill Gardens Event Centre Canterbury Park
Located near Parramatta on the grounds of the Sydney Turf Club (STC), the facility offers a divisible exhibit hall and a high ratio of meeting to exhibit hall space.
Serves small, local exhibitions and social events. It is appealing for small and mid-sized conferences that have light exhibits.
Owned and operated by the STC.

43
Each facility is compared in table two in terms of capacity and other key indicators.
23 Sources: TTF & PCA (2007); The Entertainment Quarter, http://www.eqmoorepark.com.au/home/; Playbill Venues, http://www.playbillvenues.com/; O’Neill (2007)
24 Private interview with industry stakeholder, June 2010
25 TTF & PCA, Revitalising the Convention & Exhibition Industry in Sydney, 2007
As table two suggests, the SCEC and SSG are the two major facilities for exhibitions and conferences in Sydney. Not only is the SCEC larger than SSG, its CBD and waterside location make it the preferred location not only for many domestic events, but also for international conventions. 24 Furthermore, the SCEC and SSG attributes make them more suited to different types of events. For example, SSG’s western Sydney location and large amount of parking makes it suited for consumer-targeted events. Meanwhile, the SCEC may be better located for business-related events, especially those that have an international focus.25
Table 2 Major Sydney facilities hosting conventions and exhibitions (as at July 2010) 23
Facility
Maximum
convention
capacity
Continuous
exhibition
space
Distance
from Sydney
CBD Types of events
Facility issues
and potential
for expansion
Sydney Convention and Exhibition Centre (SCEC)
12,000 m2
(max 3,500 seats per event)
30,000 m2 1km All types including fairs, conventions, exhibitions (fashion and motor), parties and galas
Lack of floor layout flexibility
Booking conflicts
Sydney Entertainment Centre (SEC)
1,564 m2
(max 12,500 seats per event)
N/A 1km Auditorium-style events, seminars, banquets
No exhibition space
Sydney Showground (SSG)
7,200 m2
(max 4,000 seats per event)
21,600 m2 15km Corporate functions, convention dinners, conferences, large consumer shows
Not integrated in a single venue. Second exhibition hall co-located with existing
Moore Park, Playbill Venues
3,100 m2
(max 3,500 seats per event)
5,400 m2 5km Markets, entertainment events, corporate parties, boutique markets
Not close to train network
Australian Technology Park (ATP)
2,277 m2
(max 2,500 seats per event)
6,850 m2 4km Technology, fashion, industry, and boutique markets
Constrained by Heritage status of surrounding site
Rosehill Gardens 840m2
(max 2,000 seats per event)
4,000 m2 18km Convention dinners, outdoor events, conferences with small exhibits
Non-uniform dimensions of hall

44
26 Source: TTF and PwC analysis; For the SCEC, the ‘conventions only’ comprises those events that do not use exhibition space. The number of exhibitions comprises events with both conventions and tradeshows, as well as consumer shows (those that use exhibition space)
27 O’Neill, John (2007), Review into Sydney Convention and Exhibition Space, p15
28 TTF & PCA, Revitalising the Convention & Exhibition Industry in Sydney, 2007, p5-6
29 O’Neill, John (2007), Review into Sydney Convention and Exhibition Space, p15
30 O’Neill, John (2007), Review into a possible events corporation for New South Wales, available at: http://www.dpc.nsw.gov.au/__data/assets/pdf_file/0005/15809/Events_Report.pdf
Although comprehensive and complete data sets are not available, the number of domestic and international events held at the SCEC and SSG in 2005, are listed in Table 3. While the SSG hosts primarily domestic exhibitions, the SCEC attracts a significant number of domestic and international conventions and exhibitions; more domestic than international events were held by the SCEC in 2005.
In 2005, the SCEC was operating at 60% exhibition capacity and 42% convention capacity, while the SSG was under a comparably low 31% capacity; the exhibition facilities at the SSG are currently underutilised.27 Over the four years between 2003 and 2007, the annual exhibit hall occupancy ranged from approximately 60 to 70 percent occupancy, whereas a lower target of 50% may strike a better balance between the need for revenue making activity while providing enough available dates and space to accommodate most demand.28
Since the O’Neill review, the Sydney Convention and Visitors Bureau (initially established in 1969) was renamed ‘Business Events Sydney’ in September 2008. This was to better reflect its core operations as a business events marketing organisation, in part arising from a separate John O’Neill study.30
Table 3 Number of Events by venue, 200526
SCEC SSG
Domestic Exhibition (some with conventions) 40 31
Convention only 206 0
International Exhibition (some with conventions) 38 1
Convention only 10 0
Table 4 Occupancy of the SCEC and SSG, 2005 (%)29
SCEC SSG
Exhibition space 60 31
Convention rooms 42 0
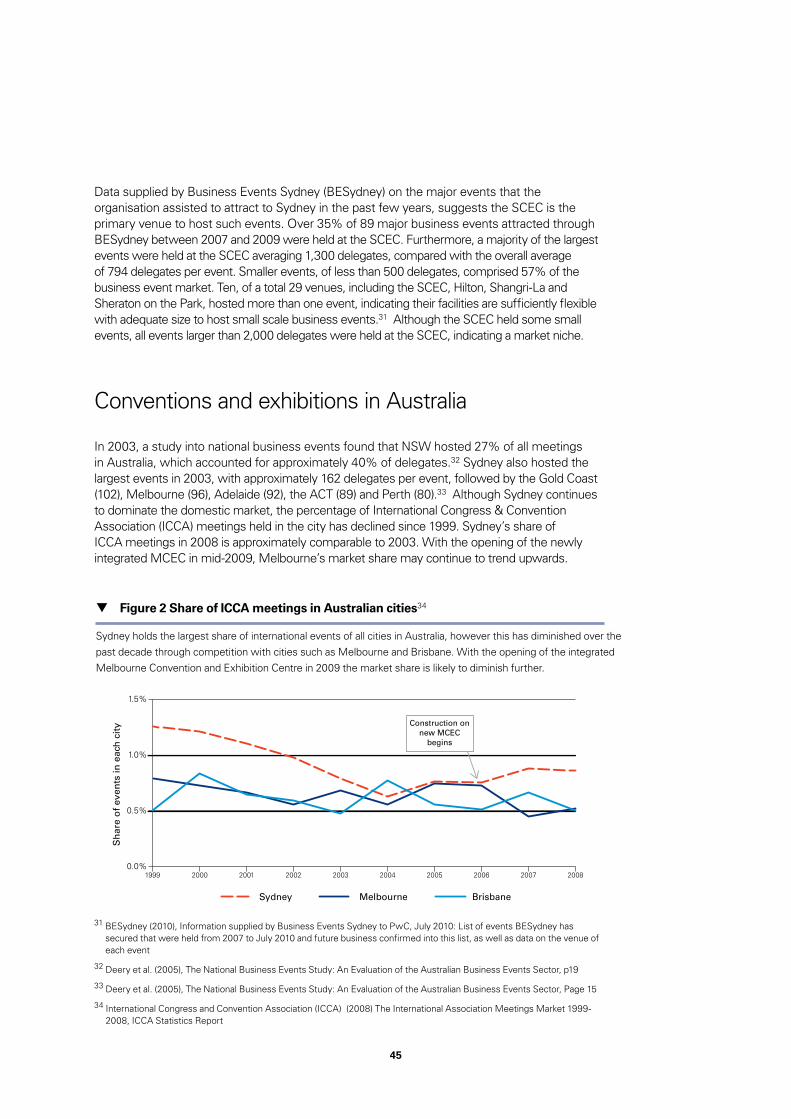
45
Data supplied by Business Events Sydney (BESydney) on the major events that the organisation assisted to attract to Sydney in the past few years, suggests the SCEC is the primary venue to host such events. Over 35% of 89 major business events attracted through BESydney between 2007 and 2009 were held at the SCEC. Furthermore, a majority of the largest events were held at the SCEC averaging 1,300 delegates, compared with the overall average of 794 delegates per event. Smaller events, of less than 500 delegates, comprised 57% of the business event market. Ten, of a total 29 venues, including the SCEC, Hilton, Shangri-La and Sheraton on the Park, hosted more than one event, indicating their facilities are sufficiently flexible with adequate size to host small scale business events.31 Although the SCEC held some small events, all events larger than 2,000 delegates were held at the SCEC, indicating a market niche.
Conventions and exhibitions in Australia
In 2003, a study into national business events found that NSW hosted 27% of all meetings in Australia, which accounted for approximately 40% of delegates.32 Sydney also hosted the largest events in 2003, with approximately 162 delegates per event, followed by the Gold Coast (102), Melbourne (96), Adelaide (92), the ACT (89) and Perth (80).33 Although Sydney continues to dominate the domestic market, the percentage of International Congress & Convention Association (ICCA) meetings held in the city has declined since 1999. Sydney’s share of ICCA meetings in 2008 is approximately comparable to 2003. With the opening of the newly integrated MCEC in mid-2009, Melbourne’s market share may continue to trend upwards.
31 BESydney (2010), Information supplied by Business Events Sydney to PwC, July 2010: List of events BESydney has secured that were held from 2007 to July 2010 and future business confirmed into this list, as well as data on the venue of each event
32 Deery et al. (2005), The National Business Events Study: An Evaluation of the Australian Business Events Sector, p19
33 Deery et al. (2005), The National Business Events Study: An Evaluation of the Australian Business Events Sector, Page 15
34 International Congress and Convention Association (ICCA) (2008) The International Association Meetings Market 1999-2008, ICCA Statistics Report
Figure 2 Share of ICCA meetings in Australian cities34
Sydney holds the largest share of international events of all cities in Australia, however this has diminished over the past decade through competition with cities such as Melbourne and Brisbane. With the opening of the integrated Melbourne Convention and Exhibition Centre in 2009 the market share is likely to diminish further.
0.0%
Sydney BrisbaneMelbourne
0.5%
1.0%
1.5%
20001999 2001 2002 2003 2004 2005 20072006 2008
Construction onnew MCEC
begins
Sh
are
of
even
ts in
eac
h c
ity

46
35 O’Neill, John (2007), Review into Sydney Convention and Exhibition Space, p19
As can be seen from Figure 2, Sydney holds the largest share of international events of all cities in Australia; however this has diminished over the past decade through competition with cities such as Melbourne and Brisbane. In terms of ICCA ranking for future scheduled meetings, Sydney has slipped over the last decade as other cities in the region develop their convention and exhibition facilities. The most recent data shows Sydney ranking 11th in 2005 in terms of future scheduled meetings; this shows a progressive decline from 1st in 1999 and 2000 to 4th in 2002.35
Table 5 presents a comparison of the key Sydney facilities with other major venues in Australian cities.

47
Faci
lity
Max
. con
vent
ion
capa
city
Exh
ibiti
on
spac
eN
o. o
f Eve
nts
Type
s of
con
vent
ions
Type
s of
con
sum
er
& tr
ade
show
sEv
ent f
ocus
Dis
tanc
e fr
om C
BD
Priv
ate
sect
or
invo
lve-
men
t1In
tern
atio
nal
conv
entio
nsN
atio
nal
conv
entio
nsLo
cal
conv
entio
nsN
atio
nal
exhi
bitio
nsLo
cal
exhi
bitio
ns
Syd
ney
Con
vent
ion
and
Exh
ibiti
on
Cen
tre
3,50
0 se
ats
33 ro
oms
30,0
00 m
2 (6
hal
ls)
Ave
rage
of 6
00 e
vent
s pe
r ye
ar
••
••
•Lo
cal a
nd in
tern
atio
nal c
onve
ntio
ns
and
exhi
bitio
ns1
kmB
Syd
ney
Ente
rtai
nmen
t C
entr
e
11,5
00 s
eat (
limite
d de
dica
ted
room
s)N
one
Ave
rage
of o
ver 3
00 e
vent
s pe
r yea
r•
••
Aud
itoriu
m s
tyle
, ent
erta
inm
ent
even
ts,
banq
uets
1 km
B
Syd
ney
Sho
wgr
ound
4,00
0 se
ats
Up
to 1
0 ro
oms
21,6
00 m
2A
vera
ge 4
00 e
vent
s pe
r ye
ar, w
ith a
ppro
xim
atel
y 32
ex
hibi
tions
••
••
Roy
al E
aste
r Sho
w, g
ala
dinn
ers,
co
ckta
il pa
rtie
s, c
onfe
renc
es15
km
C
Moo
re P
ark
(Pla
ybill
Ve
nues
)3,
500
seat
s
Up
to 1
0 ro
oms
5,40
0 m
2S
mal
ler
even
ts•
••
Bou
tique
eve
nts,
sm
all m
eetin
gs
to m
ediu
m s
cale
exh
ibiti
ons
and
corp
orat
e fu
nctio
ns
5 km
C
Aus
tral
ian
Tech
nolo
gy P
ark
2,50
0 se
ats
11 ro
oms
6,85
0 m
2A
vera
ge o
f 400
eve
nts
pe
r yea
r
••
••
Bou
tique
eve
nts,
sm
all m
eetin
gs
to m
ediu
m s
cale
exh
ibiti
ons
and
corp
orat
e fu
nctio
ns
4 km
B
Priv
ate
faci
litie
s (h
otel
s, R
oseh
ill
Gar
dens
, etc
)
Up
to 8
00 s
eats
Up
to 1
5 ro
oms
Up
to
8,00
0 m
2
Sm
alle
r ev
ents
••
Bou
tique
eve
nts,
sm
all m
eetin
gs
to m
ediu
m s
cale
exh
ibiti
ons
and
corp
orat
e fu
nctio
ns
D
Mel
bour
ne
Con
vent
ion
and
Exh
ibiti
on C
entr
e
5,00
0 se
at p
lena
ry h
all
32 m
eetin
g ro
oms
30,0
00 m
2 (3
flex
ible
sp
aces
)
Ave
rage
of 7
00-8
00 e
vent
s pe
r yea
r (35
con
vent
ions
, 56
exhi
bitio
ns in
200
8-0
9)
••
••
•Lo
cal a
nd in
tern
atio
nal c
onve
ntio
ns
and
exhi
bitio
ns1
kmB
Bris
bane
Con
vent
ion
and
Exh
ibiti
on
Cen
tre
8,00
0 se
ats
20+
room
s
40,0
00 m
2 (d
ivis
ible
into
fo
ur h
alls
)
Ave
rage
of 8
00-9
00 e
vent
s pe
r yea
r•
••
••
Loca
l and
inte
rnat
iona
l con
vent
ions
an
d ex
hibi
tions
, ent
erta
inm
ent
even
ts
2 km
B
Dar
win
Con
vent
ion
Cen
tre
1,50
0 se
at p
lena
ry
hall,
12
mee
ting
and
func
tion
room
s
4,00
0 m
2 (up
to 3
flex
ible
sp
aces
)
New
ly o
pene
d 65
boo
king
s fo
r eve
nts
(as
at J
une
2009
••
••
•na
tiona
l and
inte
rnat
iona
l co
nfer
ence
and
exh
ibiti
on e
vent
s an
d sp
ortin
g ga
las
1 km
B
Ade
laid
e C
onve
ntio
n C
entr
e3,
500
capa
city
ple
nary
ha
ll, w
ith c
apab
ilitie
s to
ext
end
for
6,00
0 pe
ople
14 ro
oms
10,5
00 m
2A
vera
ge 1
80 e
vent
s pe
r yea
r•
••
••
Loca
l and
inte
rnat
iona
l con
vent
ions
an
d ex
hibi
tions
0.5
kmC
Pert
h C
onve
ntio
n C
entr
e2,
500
seat
ple
nary
ha
ll, 1
9 m
eetin
g ro
oms
16,5
00m
2 (in 6
pa
vilio
ns)
••
••
•Lo
cal a
nd in
tern
atio
nal c
onve
ntio
ns
and
exhi
bitio
ns0,
.5 k
mA
Tab
le 5
Cur
ren
t fa
cilit
ies
in S
ydn
ey
How
Syd
ney’
s fa
cilit
ies
com
pare
with
maj
or fa
cilit
ies
natio
nally
Not
e1: ‘
A’ =
Gov
ernm
ent o
wne
d an
d op
erat
ed; ‘
B’ =
Gov
ernm
ent o
wne
d an
d op
erat
ed, p
rivat
e se
ctor
pro
vidi
ng fa
cilit
ies
man
agem
ent;
‘C’ =
Gov
ernm
ent o
wne
d an
d op
erat
ed
Sou
rces
: BC
EC
Fas
t Fac
ts, S
CE
C F
acts
heet
; MC
EC
ann
ual r
epor
t 200
8-2
009,
p 6
; IM
EX
May
201
0, M
CE
C e
xpan
sion
to b
oost
tour
ism
and
Vic
toria
n Ec
onom
y; A
dela
ide
Con
vent
ion
Cen
tre
Ann
ual R
epor
t, 20
08-0
9;D
arw
in W
ater
fron
t Cor
pora
tion
Ann
ual R
epor
t, 20
08-0
9; R
edfe
rn W
ater
loo
Aut
horit
y A
nnua
l Rep
ort 2
008
-09;
NS
W T
reas
ury
Bud
get E
stim
ates
Pap
er 3
, 200
7-08
; PC
EC
FA
Qs;
AE
G O
gden
web
site
(201
0), h
ttp:
//ww
w.a
egog
den.
com
/aeg
ogde
n/B
risC
onE
xhib
Cen
tre.
asp
Other Asustralian cities Sydney
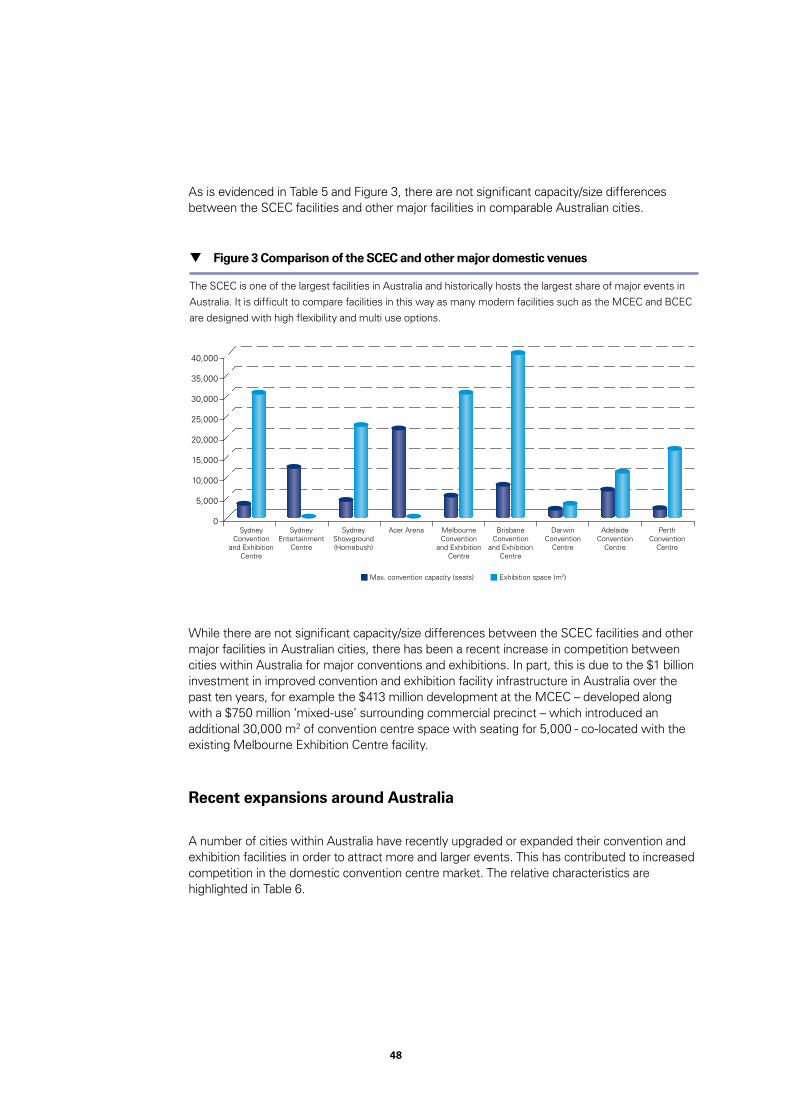
48
As is evidenced in Table 5 and Figure 3, there are not significant capacity/size differences between the SCEC facilities and other major facilities in comparable Australian cities.
While there are not significant capacity/size differences between the SCEC facilities and other major facilities in Australian cities, there has been a recent increase in competition between cities within Australia for major conventions and exhibitions. In part, this is due to the $1 billion investment in improved convention and exhibition facility infrastructure in Australia over the past ten years, for example the $413 million development at the MCEC – developed along with a $750 million ‘mixed-use’ surrounding commercial precinct – which introduced an additional 30,000 m2 of convention centre space with seating for 5,000 - co-located with the existing Melbourne Exhibition Centre facility.
Recent expansions around Australia
A number of cities within Australia have recently upgraded or expanded their convention and exhibition facilities in order to attract more and larger events. This has contributed to increased competition in the domestic convention centre market. The relative characteristics are highlighted in Table 6.
Figure 3 Comparison of the SCEC and other major domestic venues
The SCEC is one of the largest facilities in Australia and historically hosts the largest share of major events in Australia. It is difficult to compare facilities in this way as many modern facilities such as the MCEC and BCEC are designed with high flexibility and multi use options.
5,000
0
10,000
15,000
20,000
25,000
30,000
35,000
40,000
Sydney Convention
and Exhibition Centre
Sydney Entertainment
Centre
Sydney Showground(Homebush)
Acer Arena
Max. convention capacity (seats)
Melbourne Convention
and Exhibition Centre
Brisbane Convention
and Exhibition Centre
Darwin Convention
Centre
Adelaide Convention
Centre
Perth Convention
Centre
Exhibition space (m2)

49
36 Business Events Australia, http://www.businessevents.australia.com/rsc/Assoc_website_2010/ACC_expansion_May2010.pdf
37 Odyssey Media, January 2, 2002, Work Started On $260 million Perth Convention & Exhibition Centre http://www.odysseymediagroup.com/apn/Editorial-MICE-Venues.asp?ReportID=31783
38 Perth Convention and Exhibition Centre, PCEC Facts, http://www.pcec.com.au
Sources: Skidmore, Owings & Merrill LLP, http://www.som.com/content.cfm/adelaide_convention_ centre_expansion; SA Auditor General Report 1999-2000, http://www.audit.sa.gov.au/99-00/partb-vol2.pdf; Queensland Government, State Budget announcements, 2009-10 and 2010-2011, http://www.budget.qld.gov.au/; ABS Stateline, Darwin Waterfront, 29 February 2008, http://www.abc.net.au/stateline/nt/content/2006/s2176880.htm; Northern Territory Government Budget Papers, http://www.budget.nt.gov.au/; AdelaideNow (2010), ‘Mike Rann and Labor vow River Torrens, Adelaide Convention Centre revamp’, 14 March 2010, http://www.adelaidenow.com.au/news/in-depth/mike-rann-and-labor-vow-river-torrens-adelaide-convention-centre-revamp/story-fn2sdwup-1225840537731; Business Events Australia (2010), http://www.businessevents.australia.com/rsc/Assoc_website_2010/ACC_expansion_May2010.pdf; Odyssey Media, January 2, 2002, Work Started On $260 million Perth Convention & Exhibition Centre http://www.odysseymediagroup.com/apn/Editorial-MICE-Venues.asp?ReportID=31783; Perth Convention and Exhibition Centre, PCEC Facts, http://www.pcec.com.au
Table 6 Recent domestic convention and exhibition facility expansions
venue
Recent develop-
ments
Cost of
develop-
ment Cost m2 Private sector involvement
Melbourne Convention and Exhibition Centre (MCEC)
Additional 30,000 m2
convention centre with seating for
5,000 co-located with the existing
Melbourne Exhibition Centre
facility
$413 million (2009)
$12,200 (2009) Victorian Government contributed $367 million, and City of Melbourne contributed $43 million towards municipal works
Expansion was a PPP developed by a Plenary Group Consortium. State Govt received $93.2 million from Plenary Group for development rights of the precinct and facilities management role
The $750 million ‘mixed-use’ surrounding commercial precinct is financed by Austexx and a syndicate of four banks, who will receive a 99-year leasehold for the commercial centres and 25-year leasehold for MCEC land
Adelaide Convention Centre (ACC)
Two-stage expansion to
replace plenary building with a
3,500-seat venue and expanding
the existing main building toward
Morphett St bridge
$394 million (2010)
N/A Following initial $85 million expansion in 2001, another expansion is currently being planned
In 2010, SA Government announced plans to upgrade newly refurbished facilities This will likely be completed by 2014 in two stages: expansion and then building a new multi-purpose facility with plenary auditorium of 3,500 seats with capabilities to accommodate 6,000 for concerts36
The planned expansion will also include upgrading the Riverbank to increase pedestrian numbers, and water and light features in the Torrens
Brisbane Convention and Exhibition Centre (BCEC)
Additional 24,000 m2 with
18 additional meeting rooms
$146 million (2010)
$5,500 (2011) Corporate functions, convention dinners, conferences, large consumer shows
Queensland government contributed $69.5 million in 2009-10 and $74.5 million in 2010-11 to complete the $146 million expansion. Lang O’Rourke is the contracted builder of the project. Managed by AEG Ogden
Darwin Convention Centre (DCC)
Opened mid-2008
Entire facility (22,600 m2)
with 1,500 seat convention centre
$263 million total (2008), with government
receiving $113 million
commissions
$5,100 (2008) Markets, entertainment events,
corporate parties, boutique markets
Developed by Darwin Cove Consortium, a PPP arrangement between the Northern Territory Government, Laing O’Rourke, ABN Amro, Toga and Sitzler Bros. Managed by AEG Ogden
Part of $1.1 billion Darwin Cove redevelopment with wave park and convention centre majorly financed by PPP, with government costs offset by property sales
Perth Convention and Exhibition Centre (PCEC)
Opened 2004
2,500 seat plenary hall, 19 meeting rooms and 16,500m2
exhibition space37
$260 million (2002)
$15,000 (2002) Technology, fashion,
industry, and boutique markets Convention
dinners, outdoor events, conferences with small exhibits
A 138-apartment hotel built over six levels was opened in conjunction with Perth Convention and Exhibition Centre. The hotel is operated by the Medina Group
A PPP built by Multiplex, with the support of the Western Australian Government
Managed by Spotless Services Australia and owned (through a lease arrangement) by the Wyllie Group.38 Ownership will return to the Government after 35 years
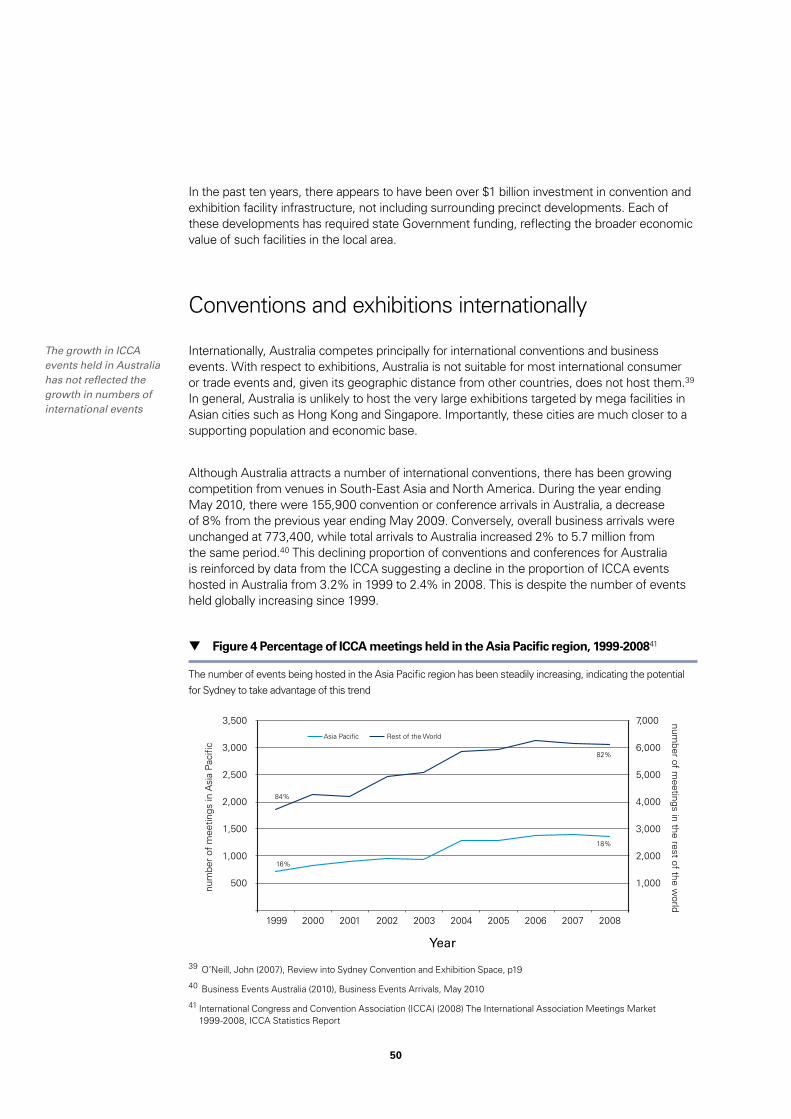
50
39 O’Neill, John (2007), Review into Sydney Convention and Exhibition Space, p19
40 Business Events Australia (2010), Business Events Arrivals, May 2010
41 International Congress and Convention Association (ICCA) (2008) The International Association Meetings Market 1999-2008, ICCA Statistics Report
The growth in ICCA events held in Australia has not reflected the growth in numbers of international events
In the past ten years, there appears to have been over $1 billion investment in convention and exhibition facility infrastructure, not including surrounding precinct developments. Each of these developments has required state Government funding, reflecting the broader economic value of such facilities in the local area.
Conventions and exhibitions internationally
Internationally, Australia competes principally for international conventions and business events. With respect to exhibitions, Australia is not suitable for most international consumer or trade events and, given its geographic distance from other countries, does not host them.39 In general, Australia is unlikely to host the very large exhibitions targeted by mega facilities in Asian cities such as Hong Kong and Singapore. Importantly, these cities are much closer to a supporting population and economic base.
Although Australia attracts a number of international conventions, there has been growing competition from venues in South-East Asia and North America. During the year ending May 2010, there were 155,900 convention or conference arrivals in Australia, a decrease of 8% from the previous year ending May 2009. Conversely, overall business arrivals were unchanged at 773,400, while total arrivals to Australia increased 2% to 5.7 million from the same period.40 This declining proportion of conventions and conferences for Australia is reinforced by data from the ICCA suggesting a decline in the proportion of ICCA events hosted in Australia from 3.2% in 1999 to 2.4% in 2008. This is despite the number of events held globally increasing since 1999.
Figure 4 Percentage of ICCA meetings held in the Asia Pacific region, 1999-200841
The number of events being hosted in the Asia Pacific region has been steadily increasing, indicating the potential for Sydney to take advantage of this trend
3,500
3,000
2,500
2,000
1,500
1,000
500
7,000
6,000
5,000
number of m
eetings in the rest of the world
num
ber
of m
eetin
gs in
Asi
a Pa
cific
4,000
3,000
2,000
1,000
20001999 2001 2002 2003 2004 2005 2006 2007 2008
Asia Pacific
84%
16%
82%
18%
Rest of the World
Year
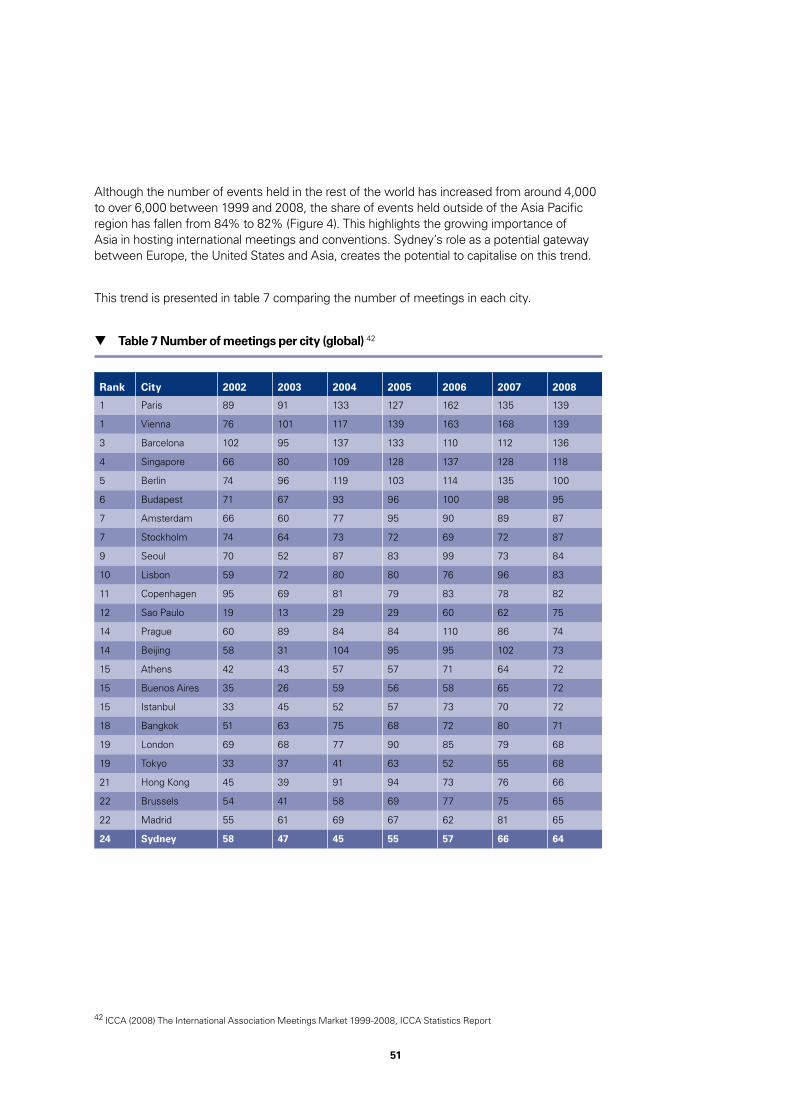
51
42 ICCA (2008) The International Association Meetings Market 1999-2008, ICCA Statistics Report
Although the number of events held in the rest of the world has increased from around 4,000 to over 6,000 between 1999 and 2008, the share of events held outside of the Asia Pacific region has fallen from 84% to 82% (Figure 4). This highlights the growing importance of Asia in hosting international meetings and conventions. Sydney’s role as a potential gateway between Europe, the United States and Asia, creates the potential to capitalise on this trend.
This trend is presented in table 7 comparing the number of meetings in each city.
Table 7 Number of meetings per city (global) 42
Rank City 2002 2003 2004 2005 2006 2007 2008
1 Paris 89 91 133 127 162 135 139
1 Vienna 76 101 117 139 163 168 139
3 Barcelona 102 95 137 133 110 112 136
4 Singapore 66 80 109 128 137 128 118
5 Berlin 74 96 119 103 114 135 100
6 Budapest 71 67 93 96 100 98 95
7 Amsterdam 66 60 77 95 90 89 87
7 Stockholm 74 64 73 72 69 72 87
9 Seoul 70 52 87 83 99 73 84
10 Lisbon 59 72 80 80 76 96 83
11 Copenhagen 95 69 81 79 83 78 82
12 Sao Paulo 19 13 29 29 60 62 75
14 Prague 60 89 84 84 110 86 74
14 Beijing 58 31 104 95 95 102 73
15 Athens 42 43 57 57 71 64 72
15 Buenos Aires 35 26 59 56 58 65 72
15 Istanbul 33 45 52 57 73 70 72
18 Bangkok 51 63 75 68 72 80 71
19 London 69 68 77 90 85 79 68
19 Tokyo 33 37 41 63 52 55 68
21 Hong Kong 45 39 91 94 73 76 66
22 Brussels 54 41 58 69 77 75 65
22 Madrid 55 61 69 67 62 81 65
24 Sydney 58 47 45 55 57 66 64

52
43 O’Neill (2007), Review into Sydney Convention and Exhibition Space, pp 17 & 31
44 Suntec Singapore website (2010), International Convention and Exhibition Centre, available at: www.suntecsingapore.com; Hong Kong Convention and Exhibition Centre website (2010), available at: http://www.hkcec.com/about-hkcec/image-gallery/exterior-hkcec
Cities like Singapore and Bangkok have shown strong growth in the number of meetings held, with an annual trend rate of growth 13.8 percent and 11.8 percent respectively over the ten years to 2005. Sydney held more meetings than Singapore in four of the five years to 2000. By 2004 and 2005, Singapore was hosting more than double the number of meetings in Sydney. Australia lacks a large base of producers or customers for most trade goods so cannot compete with some venues for such events – for example locations such as Singapore, Hong Kong, Frankfurt, London, Los Angeles or Shanghai for international trade exhibitions. However, Australia/New Zealand has a large population of well educated professionals who typically are well connected into relevant international professional associations. O’Neill suggests this is a clear competitive advantage that Australia/New Zealand currently has over most of Asia, including Singapore and Hong Kong, for hosting international professional conferences. Sydney also has a very attractive, safe environment, with good convention services. So internationally, Sydney has a major competitive advantage in gaining international conventions while having a competitive disadvantage in gaining genuine international trade or consumer exhibitions.43
Comparison of SCEC with international, world class facilities
The Suntec Singapore and Hong Kong Convention and Exhibition Centre (HKCEC) are international, world class facilities that compete with Sydney for major international conventions in the Asia Pacific region. With 100,000 m2 of available floor space, Suntec Singapore caters to events from 10 to 10,000 people. It is located next to the CBD, and only 20 minutes from Changi International Airport, and enjoys a waterfront location. Following its second expansion, which opened in April 2009, the HKCEC’s total rentable space for events and activities has reached 91,500 m2. The majority of this space is versatile and accommodates a variety of mega-exhibitions, global meetings and major entertainment events. The HKCEC, like the Suntec, is situated near the CBD and on the waterfront.
Figure 5 World class facilities44
Singapore
Hong Kong

53
45 SCEC (2009), Fact File, available at: http://www.scec.com.au/content/fact_files/Centre_Fact_File_2009.pdf; Suntec Singapore (2010), International Convention and Exhibition Centre, available at: http://www.suntecsingapore.com/facilities/convention.htm; Hong Kong Convention and Exhibition Centre website (2010), available at: http://www.hkcec.com/about-hkcec/image-gallery/exterior-hkcec and http://www.hkcec.com/sites/default/files/usefulmaterial/HKCEC_Brochure_240310.pdf; Kuala Lumpur Convention Centre, Background Information, available at http://www.klccconventioncentre.com/index_flash.html
Table 8 compares the SCEC’s facilities with those in Hong Kong, Singapore & Kuala Lumpur.
Table 8 How Sydney’s facilities compare with major facilities internationally45
Facility
Total space
available
Convention
capacity
Exhibition
space Multipurpose and other
Sydney Convention and Exhibition Centre (excluding SEC)
Approx. 60,000 m2
3,500 seats
33 rooms
30,000 m2: halls can interconnect to form 25,000 m2 column-free
space
30 flexible meeting rooms, ranging from smaller spaces suitable for events for up to 50 people to an auditorium accommodating 3,500
Ballroom
Suntec Singapore
100,000 m2 12,000 m2 column-free convention
halls, flexible with 10,000 theatre-style
seating or 10,600 m2 exhibition
space
Exhibition Halls: 12,000 m2 of
space that can be subdivided into 4 sections, ceiling height
of 8.5 m
Theatre: 596-seat
Concourse: multi-purpose 930 m2 open area - flexible space, can seat up to 600 banquet-style
Ballroom: 2,150m2, versatile, sub-dividable function hall, up to 1,800 theatre-style / up to 1,300 banquet-style seating.
Other: 31 meeting rooms, groups from 10 to 400 people, all fully equipped with state-of-the-art audio-visual
Other: 3,700 m2 of versatile space, 1,000 banquet-style or 3,000 theatre-style
Hong Kong Convention and Exhibition Centre (HKCEC)
91,500 m2 2 Multi-Purpose Halls (conventions or banquets):
5,700 m2
6 Exhibition Halls: 66,000 m2
2 Theatres (with seating for 336 and 637): 800 m2
52 Meeting Rooms: 6,000 m2
Other multi-functional rental space: 13,000 m2
7 restaurants
Adjacent and linked to two world-class hotels
Kuala Lumpur Convention Centre
120,000 m2 Conference Hall with total capacity for
1,800
Four exhibition halls totalling
9,710 m2
Plenary hall and theatre with total capacity of 3,500
Grand Ballroom of 2,389 m2 with capacity of 2,380 theatre-style or 2,000 in banquet style seating
Banquet hall of 738 m2 with capacity of 800
20 meeting rooms with a total of 1,922 m2
2 hotels on-site, 1 adjacent
Aquarium
Co-located restaurants

54
Figure 6 compares the composition of space offered for lease at the SCEC, Suntec Singapore, HKCEC and Kuala Lumpur Convention Centre:
The mix of exhibition, convention and other space is more challenging to compare given the scale of ‘flexible’ space at world class facilities that could accommodate either type of event.
Size and key facilities to make a convention and exhibition centre world class and internationally competitive
Considering world class venues Sydney most competes with in the Asia Pacific, the following size and key facilities have been identified as making a convention and exhibition centre internationally competitive:
• Size - compared to other world class venues, for example the Suntec in Singapore, the HKCEC in Hong Kong, and the Kuala Lumpur Convention Centre, the SCEC and SEC combined are currently 30-70% smaller in terms of total space. These three venues claim total sizes between 90,000-120,000m2. Given the lower proportion of international exhibitions hosted in Australia, relative to these three cities, there may not be a need to expand space to this extent – though it does suggest that Sydney’s offering trails its competitors in this respect.
• Location – an aspect that the SCEC already shares with the Suntec, HKCEC and other locations such as Brisbane, Darwin and Perth is a convention and exhibition facility that is not only close to the central business district (CBD) but is also waterfront.
Figure 6 Comparison of the SCEC and world class facilities: total leasable space
The SCEC and SEC combined are approximately 30-40% smaller in terms of total space compared to Suntec and HKCEC, and 70% smaller than space at the Kuala Lumpur Convention Centre
20,000
0
40,000
60,000
80,000
100,000
120,000
SCEC(including SEC)
Approx 70,000 m2
91,500 m2
120,000 m2
100,000 m2
HKEC
Convention
Kuala Lumpur Convention Centre
SuntecSingapore
Exhibition Multi purpose & other
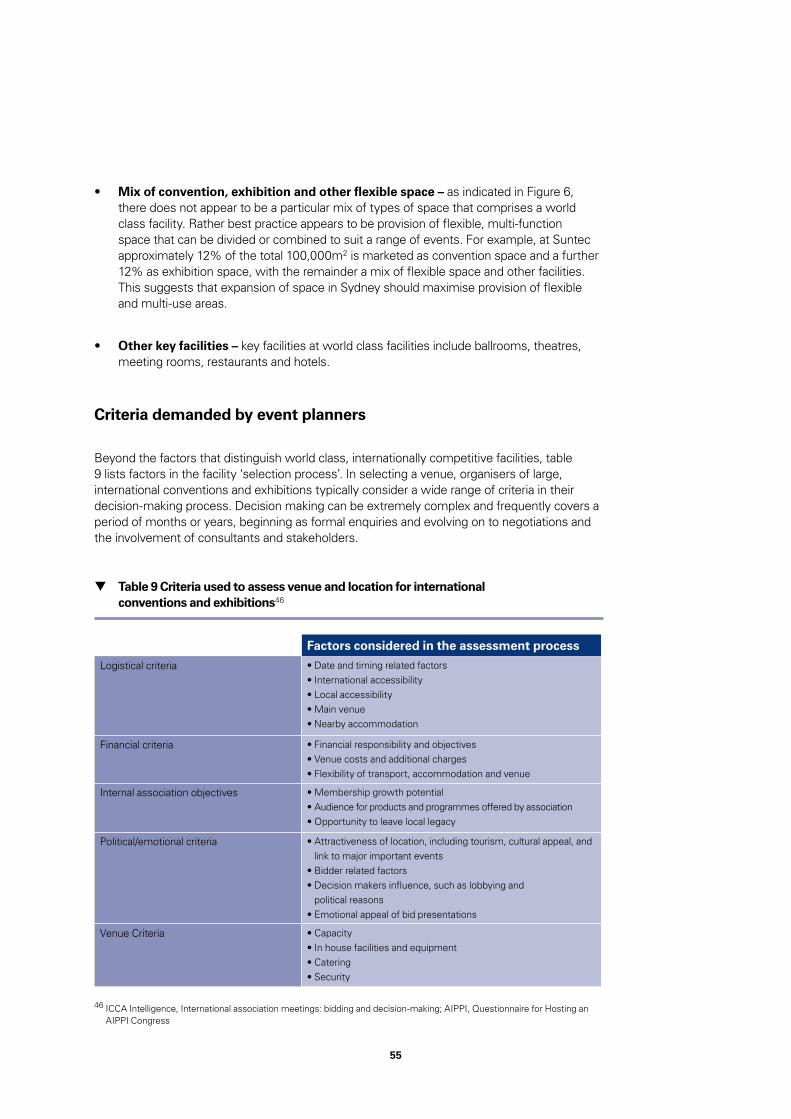
55
46 ICCA Intelligence, International association meetings: bidding and decision-making; AIPPI, Questionnaire for Hosting an AIPPI Congress
• Mix of convention, exhibition and other flexible space – as indicated in Figure 6, there does not appear to be a particular mix of types of space that comprises a world class facility. Rather best practice appears to be provision of flexible, multi-function space that can be divided or combined to suit a range of events. For example, at Suntec approximately 12% of the total 100,000m2 is marketed as convention space and a further 12% as exhibition space, with the remainder a mix of flexible space and other facilities. This suggests that expansion of space in Sydney should maximise provision of flexible and multi-use areas.
• Other key facilities – key facilities at world class facilities include ballrooms, theatres, meeting rooms, restaurants and hotels.
Criteria demanded by event planners
Beyond the factors that distinguish world class, internationally competitive facilities, table 9 lists factors in the facility ‘selection process’. In selecting a venue, organisers of large, international conventions and exhibitions typically consider a wide range of criteria in their decision-making process. Decision making can be extremely complex and frequently covers a period of months or years, beginning as formal enquiries and evolving on to negotiations and the involvement of consultants and stakeholders.
Table 9 Criteria used to assess venue and location for international conventions and exhibitions46
Factors considered in the assessment process
Logistical criteria •Dateandtimingrelatedfactors •Internationalaccessibility •Localaccessibility •Mainvenue •Nearbyaccommodation
Financial criteria •Financialresponsibilityandobjectives •Venuecostsandadditionalcharges •Flexibilityoftransport,accommodationandvenue
Internal association objectives •Membershipgrowthpotential •Audienceforproductsandprogrammesofferedbyassociation •Opportunitytoleavelocallegacy
Political/emotional criteria •Attractivenessoflocation,includingtourism,culturalappeal,andlink to major important events
•Bidderrelatedfactors •Decisionmakersinfluence,suchaslobbyingand
political reasons•Emotionalappealofbidpresentations
Venue Criteria •Capacity •Inhousefacilitiesandequipment •Catering •Security

56
47 TTF & PCA, Revitalising the Convention & Exhibition Industry in Sydney, 2007, p5-8
48 Sydney Harbour Foreshore Authority, Annual Report 2008-09
49 Information supplied by Darling Harbour Convention and Exhibition (DHCE) Pty Ltd / SHFA, June 2010
50 TTF & PCA, Revitalising the Convention & Exhibition Industry in Sydney, 2007, p5-8
51 Melbourne Convention and Exhibition Centre (MCEC), Floor Plans and Space Capacities
Constraints of current facilities in Sydney
As described above, Sydney is facing increased competition for hosting large scale, international convention and exhibition events, as well as capacity issues related to the constraints at the SCEC. The PCA and TTF 2007 report, prepared by HVS International, found that Sydney has been losing around 220 business events per annum, which equates to lost rental revenue of approximately $300,000 per event or $65 million per annum.47 These numbers are further supported by key figures produced by SHFA that indicate the economic contribution of the SCEC has declined from $478 million in 2006-07 to $466 million in 2008-09, which are levels that fail to meet key performance indicators.48
Contributing factors include:
• Ageing facilities at Sydney Convention and Exhibition Centre given it was built in 1988 and expanded in 1999:
– Investment required for maintenance: The SCEC facilities managers suggest the SCEC requires the following upgrades as minimum to maintain current event levels, estimated to require around $320 million over the next ten years:
•Airconditioning
•Roof
•Kitchen
•Loadingdocks.49
– Lack of flexibility in the size of rooms: The age of the building means its facilities do not align with trends for flexible seating and walls needed to accommodate various sized events. The suitability of a venue varies with the type of event, but generally, exhibition organisers need flexible and functional exhibition space. Meeting and convention organisers, on the other hand, require a mix of plenary, breakout and exhibition space. The ability to manipulate floor plans allows a venue to cater to a wider range of events, potentially simultaneously. Although comparable in size, other domestic venues, in Melbourne, Perth and Brisbane offer greater divisibility and functionality relative to Sydney’s venues.50 The recent development of the Melbourne Convention Centre provides 30,000 m2 of pillar-less exhibition space, which is divisible by 4 operable walls at 13 location points, providing up to 5 separate bays or 20 additional meeting rooms.51 In contrast, the current exhibition space in the SCEC (approximately 30,000 m2) is comprised of 5 fixed areas.

57
52 O’Neill, John (2007), Review into Sydney Convention and Exhibition Space, p15
53 TTF & PCA, Revitalising the Convention & Exhibition Industry in Sydney, 2007, p5-9
54 O’Neill, John (2007), Review into Sydney Convention and Exhibition Space, p3
– Structural alignment of exhibition halls: the current structural layout of the SCEC exhibition hall has a stepped or staged configuration. This restricts exhibition aisle layout in events that utilise all five halls.
• Some capacity constraints at Sydney Convention and Exhibition Centre, linked to:
– High Occupancy: In 2005 the SCEC was operating at 60% exhibition space occupancy and 42% convention room occupancy. O’Neill (2007) suggests a rate of 50% provides a more reasonable balance to enable management to have the flexibility to offer available exhibition space dates to conventions that require exhibition hall capacity. This high occupancy has reportedly left limited opportunities for SCEC to accommodate international and national conventions with associated exhibition space.52
– Domestic events demand more space: Exhibition space at the SCEC is not large enough for some major domestic consumer and trade exhibitions. Noting the international events hosted here do not generally require equivalent space. Australia hosts international conventions – which may have exhibitions attached – but does not generally host international consumer and trade exhibitions. Reports such as the TTF/PCA study in 2007 raised the concern that the insufficient exhibition capacity at the SCEC is resulting in SCEC/NSW losing important business events.53
– International events demand more space: There are occasions when it is unsuitable for an international convention. This tends to be either because it has insufficient space for an accompanying exhibition or demands convention space greater than can be accommodated.54
This can be compared to other facilities where a single rectangular space is provided
58
55 O’Neill, John (2007), Review into Sydney Convention and Exhibition Space, p 6
– Conflict between domestic and international demand: High value national and international conventions tend to have little flexibility in dates. This means that from a purely financial sense, there is preference to prioritise domestic events at the SCEC. O’Neill (2007) suggests that despite the current SHFA management contract for the SCEC facilities making some mention of the importance to prioritise international conventions, in practice the agreement provides very strong incentives to maximise operational profit (i.e. by maximising use of exhibition space rather than prioritising higher value, larger, international conventions).55
• Other constraints, linked to:
– Inadequate IT quality, especially audio-video-visual, relative to competing venues in Australia and overseas.
– Limited kitchen capacity.
Economic implications of these constraints
Broader economic implications if the trend of losing market share of domestic and international events continues
In 2008-09, SHFA estimated that the economic contribution of the SCEC was $466 million in terms of direct economic impact, based on estimated spend per type of delegate.
However, SHFA indicates the economic contribution of the SCEC has declined from $478 million in 2006-07, to $474 million in 2007-08, then $466 million in 2008-09, suggesting an average year-on-year decline of 1% per annum (or a 4% real decrease per annum taking into account impacts of inflation). Furthermore, the number of international events hosted at the SCEC has decreased 8% year-on-year between 2006-07 and 2008-09, suggesting that if this continues, given the high economic impact generated from international visitors, the economic impact of the facility will continue to decrease.

59
The inability of Sydney to offer a new/state of the art world class convention and exhibition centre may result in the SCEC losing out on a range of international events and becoming more domestic-event focused, as indicated in figure 7 by the decreasing trend of international economic impact if current trends continue. This is a major adverse trend as international delegates and visitors have a larger spend per day. Furthermore, NSW is able to fully capture this expenditure as incremental economic benefit, whereas expenditure of local intrastate domestic delegate/visitor spend is diluted by a substitution effect (e.g. if a local Sydney resident does not attend the Motor Show they may have attended the movies and generated expenditure anyway).
Figure 7 ‘Do nothing scenario’ - economic impact of the SCEC if current trends continue
If current trends continue, the SCEC’s direct economic impact could decrease from the $466 million currently to around $310 million in 2040
500
450
400
350
300
250
200
150
100
2008
2010
2012
2014
2016
2018
2020
2022
2024
2026
2028
2030
2032
2034
2036
2038
2040
50
International Domestic Total
0
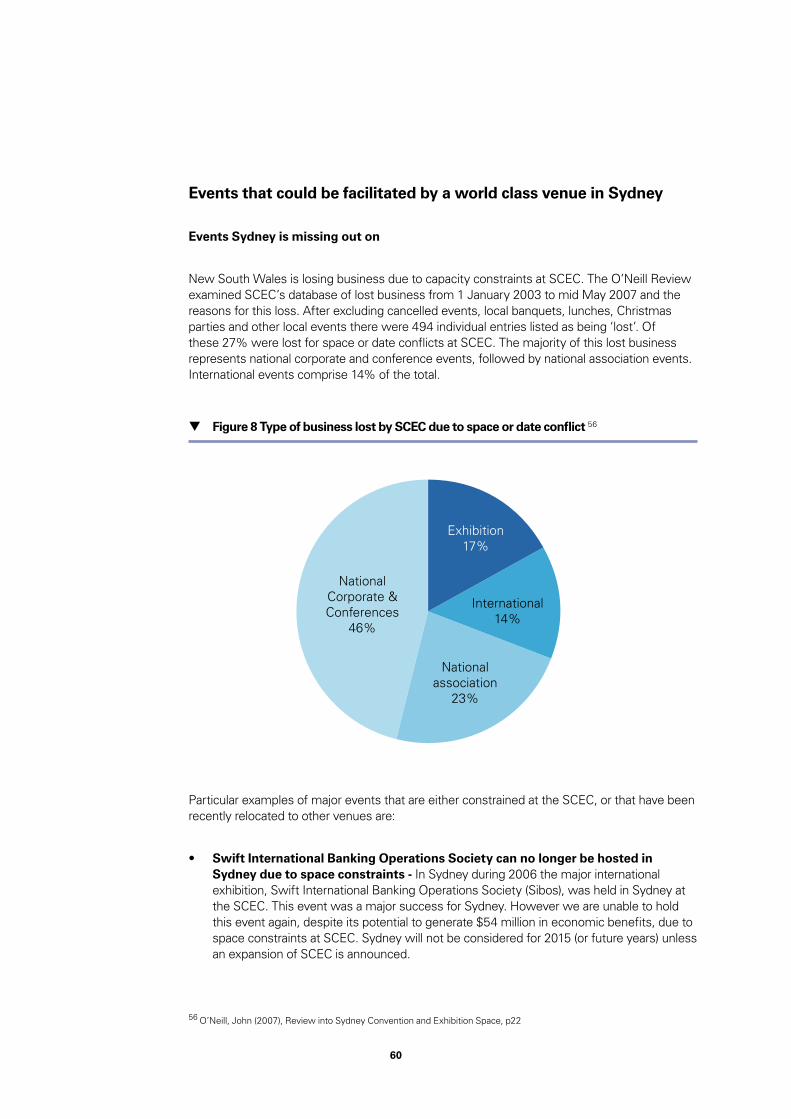
60
56 O’Neill, John (2007), Review into Sydney Convention and Exhibition Space, p22
Events that could be facilitated by a world class venue in Sydney
Events Sydney is missing out on
New South Wales is losing business due to capacity constraints at SCEC. The O’Neill Review examined SCEC’s database of lost business from 1 January 2003 to mid May 2007 and the reasons for this loss. After excluding cancelled events, local banquets, lunches, Christmas parties and other local events there were 494 individual entries listed as being ‘lost’. Of these 27% were lost for space or date conflicts at SCEC. The majority of this lost business represents national corporate and conference events, followed by national association events. International events comprise 14% of the total.
Particular examples of major events that are either constrained at the SCEC, or that have been recently relocated to other venues are:
• Swift International Banking Operations Society can no longer be hosted in Sydney due to space constraints - In Sydney during 2006 the major international exhibition, Swift International Banking Operations Society (Sibos), was held in Sydney at the SCEC. This event was a major success for Sydney. However we are unable to hold this event again, despite its potential to generate $54 million in economic benefits, due to space constraints at SCEC. Sydney will not be considered for 2015 (or future years) unless an expansion of SCEC is announced.
Figure 8 Type of business lost by SCEC due to space or date conflict 56
National Corporate &Conferences
46%
Exhibition17%
International14%
Nationalassociation
23%
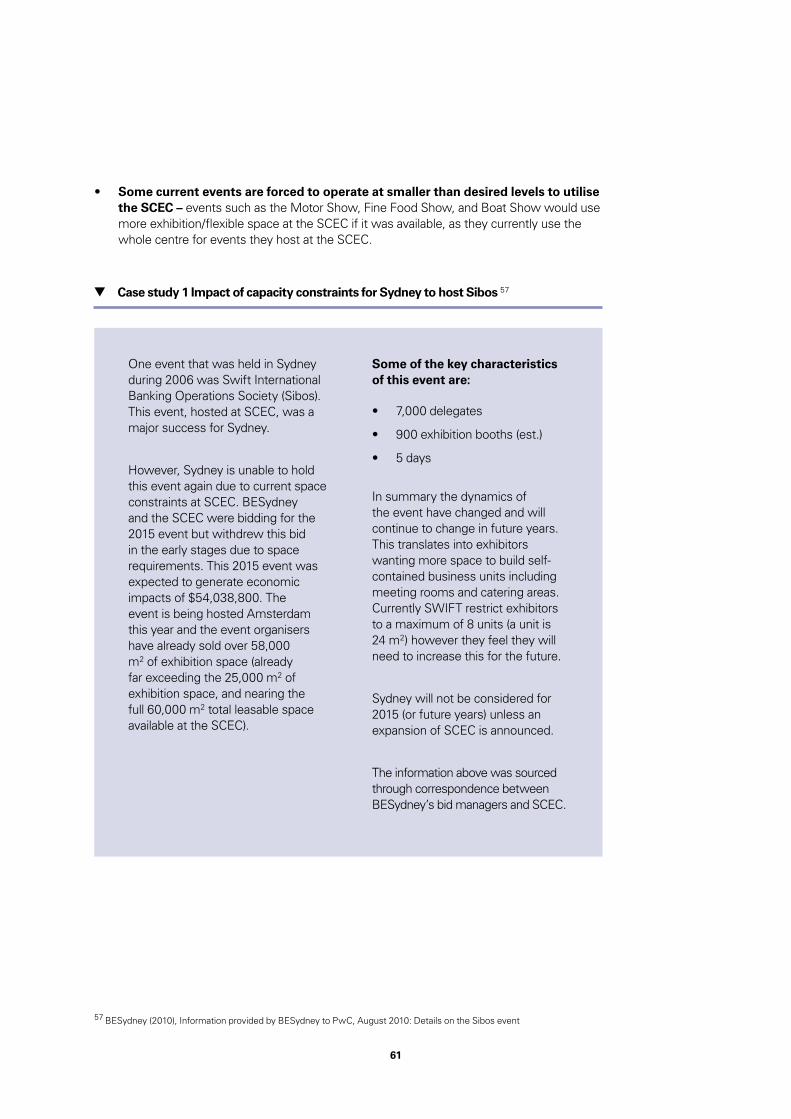
61
57 BESydney (2010), Information provided by BESydney to PwC, August 2010: Details on the Sibos event
• Some current events are forced to operate at smaller than desired levels to utilise the SCEC – events such as the Motor Show, Fine Food Show, and Boat Show would use more exhibition/flexible space at the SCEC if it was available, as they currently use the whole centre for events they host at the SCEC.
Case study 1 Impact of capacity constraints for Sydney to host Sibos 57
One event that was held in Sydney during 2006 was Swift International Banking Operations Society (Sibos). This event, hosted at SCEC, was a major success for Sydney.
However, Sydney is unable to hold this event again due to current space constraints at SCEC. BESydney and the SCEC were bidding for the 2015 event but withdrew this bid in the early stages due to space requirements. This 2015 event was expected to generate economic impacts of $54,038,800. The event is being hosted Amsterdam this year and the event organisers have already sold over 58,000 m2 of exhibition space (already far exceeding the 25,000 m2 of exhibition space, and nearing the full 60,000 m2 total leasable space available at the SCEC).
Some of the key characteristics of this event are:
• 7,000 delegates
• 900 exhibition booths (est.)
• 5 days
In summary the dynamics of the event have changed and will continue to change in future years. This translates into exhibitors wanting more space to build self-contained business units including meeting rooms and catering areas. Currently SWIFT restrict exhibitors to a maximum of 8 units (a unit is 24 m2) however they feel they will need to increase this for the future.
Sydney will not be considered for 2015 (or future years) unless an expansion of SCEC is announced.
The information above was sourced through correspondence between BESydney’s bid managers and SCEC.
62
Events held at International venues
A new or refurbished convention and exhibition centre in Sydney would provide the opportunity to compete with other cities, including Hong Kong, Singapore and Melbourne, for international events. Some potential types of events that could be hosted in Sydney, if a suitable venue were present include:
• Medical Industry
– Options for the Control of Influenza, September 2010, HKCEC. Expected attendance of 1,200 delegates
– International Conference on Materials for Advanced Technologies, July 2011, Suntec Singapore, There will be 37 technical symposia with 9 plenary lectures, 3 Theme lectures, panel discussion on entrepreneurship in materials science and engineering, exhibition, and banquet. More than 3,000 delegates coming from all over the world are expected to attend.
• Business Events
– Corporate Social Responsibility (CSR) Asia Summit, September 2010, HKEC, The CSR Asia Summit is an annual event which aims to be the most innovative and challenging conference on CSR in the Asia-Pacific region. Each year, the event gathers over 300 international thought leaders to explore key CSR issues and strategies, bringing new insights for businesses, governments, NGOs and other CSR practitioners.
– Aussiecon4 68th World Science Fiction Convention, 2010, MCEC, The World Science Fiction Society (WSFS), promotes interest in science fiction. The annual Worldcon conventions are run by non-profit, volunteer fan organisations have been held since 1939 and are most often held in the United States, occasionally being held in other countries, most recently in Glasgow, Scotland (2006), Yokohama, Japan (2007), and Montreal, Canada (2009)
• Property
– MIPIM Asia – The World’s property market in Asia, November 2010, HKCEC, MIPIM Asia focuses exclusively on facilitating real estate transactions and investment in the Asia Pacific markets and will attract over 2,000 participants, 400 investors and 200 journalists from over 40 countries.
– SMART Investment & International Property Expo, October 2010, Suntec Singapore,

63
• Education and Networking
– World Congress on Conducive Education, December 2010, HKCEC This congress seeks to encompass the rapid advancement and expansion of Conductive Education and to gather the experts, conductors and practitioners of CE all over the world to discuss and to share the theory and practice of CE The Congress is held every 3 years at various international locations
– APCO Australasia Conference & Exhibition, 2011, MCEC, APCO Australasia’s 8th Annual Conference & Exhibition is the premier learning and networking event for the Asia-Pacific public safety sector. The exhibition will showcase emerging technologies and the latest information on products and services affecting the emergency services and public safety sector. The program will deliver the industry’s best speakers, professional development workshops, interactive forums and tour.
• Environment and Agriculture
– Sustainable Risk Rationalisation Conference 2010 – An international learning experience, MCEC, SRR 2010 is the most important and unique Australian based conference providing Australian, American and Chinese professional insights into the mitigation of risk within the Brownfield’s environmental arena
– International Conference on Solid Waste 2011, HKCEC, The ICSWHK2011 will bring together various stakeholders at international level to deliberate on issues pertaining to solid waste management, so as to share experience and have a better understanding of needs, required for sustainable resource management in the contemporary world.
– Clean Energy Expo 2010, November 2010, Suntec Singapore, Clean Energy Expo Asia is a unique trading and knowledge-sharing platform bringing together the leading players in the Technology, Services, Finance and Government sector to address key issues in the areas of renewable energy, energy efficiency and sustainable development in the Asia Pacific region. In 2009, the conference attracted over 3,500 professionals, more than 70 international exhibitors and 80 speakers from over 40 countries worldwide.

64
58 Sydney Business Chamber (2007) Submission to the review of NSW tourism, events and conventions
59 O’Neill, John (2007), Review into Sydney Convention and Exhibition Space
60 Deery et al. (2005), The National Business Events Study: An Evaluation of the Australian Business Events Sector, p27
There is a need for an evaluation of the present and future potential of Sydney to host international conventions
5. Options for new or expanded facilities in Sydney
This chapter presents possible options for a new and/or expanded facility in Sydney
Introduction to options for expansion
With increasing domestic and international competition and indication there is some unmet demand due to capacity constraints, there is a need for an evaluation of the facilities in Sydney, and their present and future potential to host international and large national conventions. John O’Neill’s 2007 review suggests the most valuable business events for Sydney are genuinely international ones. According to the Sydney Business Chamber, there are two potential solutions to this challenge: make better use of existing facilities and add to the facilities currently in operation.58 But to effectively compete for international conventions, this will require a venue with:
• Capacity or flexibility to accommodate larger conventions beyond the size the SCEC can currently accommodate
• Space for accompanying exhibitions
• High quality facilities
• Vicinity to transport links and accommodation (see table 10)
• Ease of access from the CBD.59
As identified in the 2005 The National Business Events Study, very few international delegates choose budget accommodation when attending conferences, with most of the internationals staying in deluxe 4-4.5 star accommodation (41.0%). And, the majority of the interstate and intrastate delegates stay in deluxe accommodation (58.2% and 57.3% respectively).60
Table 10 Hotel and motel accommodation for national business events attendees (2005)
International (%) Interstate (%) Intrastate (%) Total (%)
Luxury 21.6 14.8 11.1 14.1
Deluxe 41.0 58.2 57.3 55.3
Standard 30.3 23.6 27.5 26.2
Budget 7.1 3.4 4.1 4.3

65
There are numerous options available to address facility issues in Sydney, ranging from the redevelopment and expansion of current SCEC facilities to a relocation and development of a completely new facility.
O’Neill suggested the following solutions, focused on achieving two large convention and exhibition precincts in Sydney:
• Expand exhibition space – this could be undertaken at the Sydney Showground, so that most of the national and domestic consumer and trade shows currently held at the SCEC could be moved there. Alternatively, expansion of exhibition space at SCEC could overcome this while also enhancing exhibition offering to international event organisers
• Increase capacity for international conventions in the CBD through expansion of the Sydney Convention and Exhibition Centre, or creation of an entirely new facility. This would allow more aggressive pursuit of international conventions.
• Change the booking policies at the Sydney Exhibition and Convention Centre so that high value international and national conventions requiring exhibition space are not impeded by domestic exhibitions. Current practice by SHFA is to maximise operational profit by maximising use of exhibition space, rather than prioritising higher value, larger, international conventions. The involvement of the private sector in provision of facilities could provide a forum to revisit and revise this approach.
The redevelopment of the SCEC involves a spectrum of potential actions. Other alternative options relate to development of a new convention and exhibition facility on a different site. Due to space constraints in the CBD, new facilities are likely to be restricted to the new Barangaroo redevelopment, development of Glebe Island and White Bay or utilisation of latent air space over Central Station, as proposed in the Sustainable Sydney 2030 strategy. Alternatively, existing facilities at the SSG could be expanded, with the sale or redevelopment of the current SCEC site.
Organisers of international conventions not only consider the facilities when deciding on a venue. The location of convention facilities and activity in the surrounding precinct are secondary, yet important in the decision process – delegates generally desire a well rounded experience.
There are numerous options to expand the convention and exhibition capabilities of Sydney, however some options are not suitable for various reasons. For example, ATP at Eveleigh and Moore Park both cater to a boutique market; with the age, heritage issues, physical layout and the limited hotel accommodation in close proximity to these facilities meaning they are generally unsuitable for major international conventions.

66
Table 11 lists potential sites to build or expand the existing convention and exhibition facilities in Sydney on land that is vacant or underutilised.
Table 11 Potential options for expanding convention and exhibition capacity in Sydney
Facility/location Available capacity
Location and
Transport links
Activity in
surrounding
precinct
Factors to
consider
1.
Expansion of SCEC
Up to 10,000-20,000 m2 of additional space if the SEC site and car park are incorporated
Monorail to Central and Pitt Street
Darling Harbour ferry
Darling Harbour
Chinatown, Haymarket
University precinct
Continued facility use during construction
2.
Expansion of Sydney Showground (Sydney Olympic Park)
Potential for additional 14,700 m2 expansion bringing total exhibition space to 36,300 m2
Further distance from CBD
Transport connections (train and motorway)
Limited activity
Sporting events
Homebush Bay parklands
Potentially lower cost than expanding in CBD
Likely to be attractive if there is more development in precinct
3.
Central Station (as part of the Sydney 2030 Vision, proposed by Clover Moore
Up to 500,000 m2 in airspace above railway lines, as proposed in Sustainable Sydney 2030
Transport connections (rail and George Street)
Office developments
George Street
Surrounding precinct amenities
Impact on transport links during construction
Cost of building in air space
4.
Glebe Island and White Bay
40 hectares
Potential for 40,000 m2 space (i.e. smaller than existing SCEC venue)
Moderate distance from CBD
ANZAC Bridge only existing transport corridor to the CBD
Potential ferry link
Balmain, Glebe
Fish Market
Mostly residential
Impact on cruise ship industry
Redevelopment and/or sale of SCEC
Lack of business tourism infrastructure
5.
Barangaroo and Millers Point precinct
22 hectares
A previous report suggested potential for 40,000 m2 exhibition space and up to 5,000 seat capacity plenary hall, but this capacity is now uncertain
Close to northern CBD
No current infrastructure or transport links
CBD
King St Wharf
The Rocks
No mention of facility in current Lend Lease development plan
Each of these options is described further in the following pages.
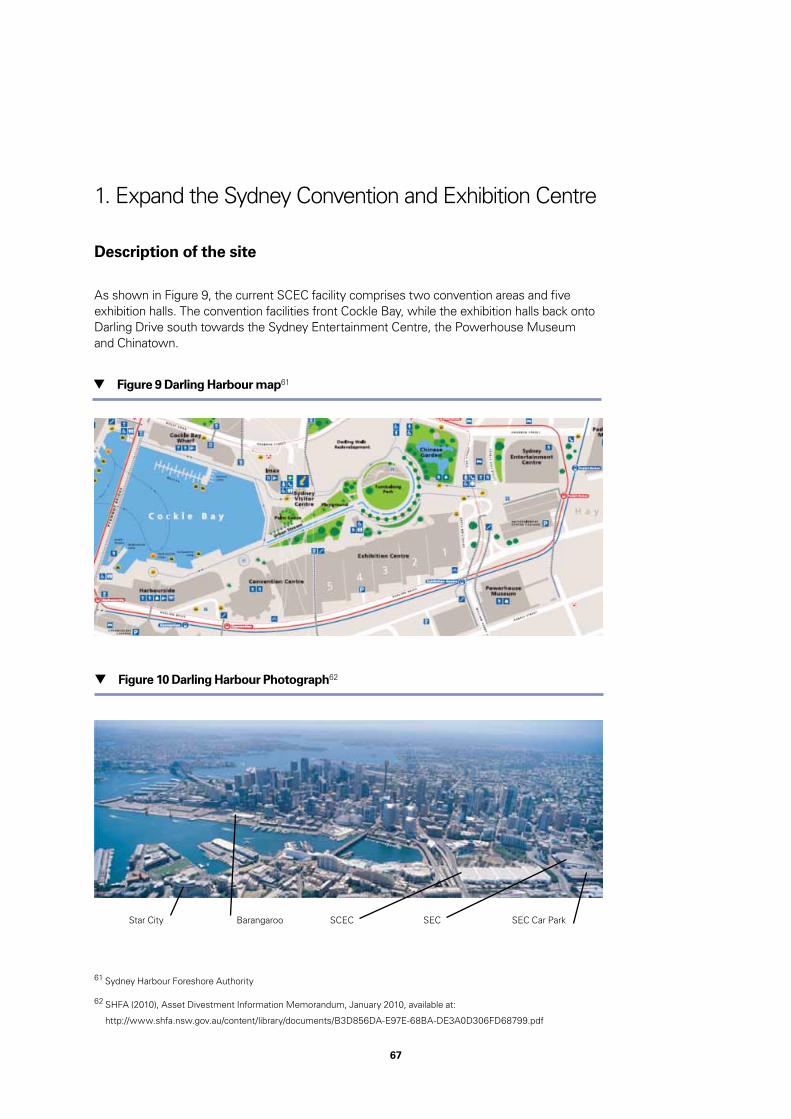
67
61 Sydney Harbour Foreshore Authority
62 SHFA (2010), Asset Divestment Information Memorandum, January 2010, available at:
http://www.shfa.nsw.gov.au/content/library/documents/B3D856DA-E97E-68BA-DE3A0D306FD68799.pdf
1. Expand the Sydney Convention and Exhibition Centre
Description of the site
As shown in Figure 9, the current SCEC facility comprises two convention areas and five exhibition halls. The convention facilities front Cockle Bay, while the exhibition halls back onto Darling Drive south towards the Sydney Entertainment Centre, the Powerhouse Museum and Chinatown.
Figure 9 Darling Harbour map61
Figure 10 Darling Harbour Photograph62
Star City Barangaroo SCEC SEC SEC Car Park

68
Stakeholders have suggested that a lack of flexibility of the exhibition halls and breakout space limits the SCEC facility. Furthermore, there is some maintenance spend required due to the ageing of the facility. Options for redevelopment are listed in Table 12.
As part of Option B, the live concert capacity of the Entertainment Centre could be replaced with the new convention and exhibition centre having a large scale flexible plenary/entertainment hall with world class stage and acoustics capable of hosting major concerts for crowds of potentially 6,000-10,000 people depending on stage layouts. In recent years the age of the Entertainment Centre and lesser quality features has seen it experience increasing competition from venues such as Acer Arena and inclusion of state of the art concert space within the new convention and exhibition centre will mean the CBD will once again have an exceptional live concert venue.
Table 12 Expansion options for the SCEC
Indicative capital
cost (convention and
exhibition centre
component only)
Description
A Approx. $500 million+ Expansion of the SCEC into the SEC car park site
The SEC car park site and the area below Pier Street are approximately 20-25 ha. Expanding into this area could potentially increase convention/exhibition space by 10,000 m2 (i.e. enabling resulting in total leasable space at the combined old and new SCEC of approximately 70,000 m2). This would enable scope to increase exhibition space and also incorporate flexibility for plenary/convention facilities.
Factors to consider: Continued facility use during construction, potential need to elevate freeway to allow for continuous facility, potential need to relocate car parking facilities
B Approx. $500 million-$700 million
Expansion of the SCEC into the SEC car park site and SEC site
Combined, the SEC car park site, SEC site and the area below Pier Street is approximately 30 ha. Expansion of the SCEC into this area could result in the creation of a larger integrated, purpose built facility, whereby the SCEC, SEC and car park become a flexible space facilitating plenary events and/or exhibition areas. This could potentially increase SCEC leasable space by 20,000 m2 (i.e. enabling total leased space at the venue of approximately 80,000 m2), also allowing for other ancillary developments. This option would have the greatest scope to incorporate supporting commercial investments as was incorporated in the recent MCEC development. The extra space would also better facilitate a refurbishment of some of the existing centre at a later date.
Factors to consider: Continued facility use during construction, potential need to elevate freeway to allow for continuous facility, potential need to relocate car parking facilities

69
63 SHFA (2010), Asset Divestment: Information Memorandum, January 2010, available at:
http://www.shfa.nsw.gov.au/content/library/documents/B3D856DA-E97E-68BA-DE3A0D306FD68799.pdf
64 Pacific (2010), http://www.pacific2010.com.au/images/DarlingHarbourTransMap-big.gif
Other potential options for the SCEC that have been discussed relate to expansion of the existing site into the current retail precinct at Darling Harbour, Harbourside Shopping Centre, which is also owned by the NSW Government and operated by SHFA. While this remains a possibility, there were some stakeholder views that the retail site is constrained with the footprint lacking depth. This option will also be impacted by the outcomes of the current asset divestment process being undertaken by SHFA of some of its key assets as part of the NSW Government’s Mini-Budget announced in 2008, which includes the Harbourside Shopping Centre. Furthermore, Harbourside Shopping Centre is currently leased from SHFA by Bevillesta Pty Limited and is not set to expire until March 2087.63 Beyond this, there are benefits of retaining the Shopping Centre for its current use relating to the attraction of pedestrian footfall to the precinct.
The high level options for redevelopment or expansion of the SCEC described above are displayed diagrammatically in Figure 11. Each option utilises existing infrastructure in the southern Darling Harbour precinct, but the area impacted varies among options.
Figure 11 Darling Harbour map extending to UTS and Chinatown64
SCEC Option A SCEC Option B

70
65 Australia China Connections (2010), UTS receives A$25 M donation for new business faculty, 10 July 2010, available at:
http://www.chinaconnections.com.au/News/UTS-receives-A$25-M-donation-for-new-business-faculty.html
66 UTS Business (2010), Frank Gehry concept design is approved, 16 June 2010, available at: http://www.business21c.com.
au/2010/06/frank-gehry-concept-design-is-approved
67 UTS (2010), Master Plan Projects, ‘City Campus Master Plan’, available at:
http://www.fmu.uts.edu.au/masterplan/projects.html
There are currently redevelopment activities being undertaken in the Darling Harbour precinct, nearby to the SCEC, including:
• A new University of Technology Sydney (UTS) Business School building. The new UTS Faculty of Business building, to be designed by renowned architect Frank Gehry, will be named the Dr Chau Chak Wing Building. The building is scheduled to be completed by the end of 2013 at a total cost of $150 million.65 In late 2009, UTS commissioned Gehry to develop a design concept for UTS Business School’s new building, as part of the UTS Campus Master Plan. The ideas were based on Vice-Chancellor Ross Milbourne’s vision to create a world-leading university of technology. Gehry’s flowing forms and unique constructions reflect UTS ambitions to lead the development of business ideas in the creative, connected, fluid and fast changing twenty-first century.66 The City Campus Master Plan comprises a number of distinct projects, which will be delivered on a staged basis from December 2009, as presented in figure 12:
Figure 12 UTS Master Plan Projects – City Campus Master Plan67

71
68 Ben.ism (2010), Sydney’s Chinatown to get a facelift, available at: http://benism.wordpress.com/2010/05/24/sydneys-
chinatown-to-get-a-facelift/
69 Valley Chamber (2008), Draft Master Plan: Key Concepts, ‘Chinatown Mall Redevelopment’, 10 December 2008, available
at: http://www.valleychamber.com.au/fileadmin/html/valleychamber/pdf/Other_Misc /MasterPlanA1_IssueD_12_dec_1.pdf
70 Lend Lease (2010), Lend Lease selected for landmark redevelopment in Sydney CBD, available at:
http://www.bovislendlease.com/llweb/llc/main.nsf/all/news_20080910; SHFA (2010), Darling Walk, available at:
http://www.shfa.nsw.gov.au/sydney-Our_places_and_projects-Our_projects-Darling_Walk.htm
71 SHFA (2010), Darling Walk, available at:
http://www.shfa.nsw.gov.au/sydney-Our_places_and_projects-Our_projects-Darling_Walk.htm
• Chinatown upgrades, including a revitalisation of Dixon Street, with improved pedestrian facilities and improved streetscape. Hay Street will be reconfigured to see the complete removal of cars, and Little Hay Street to have reduced traffic access and a tree lined corridor. The planned redevelopment is expected to be completed in November 2010.68
• Darling Walk site will be transformed in a $560 million dollar redevelopment combining commercial office and leisure space, with the 1.5 ha site being developed by Lend Lease. The 65,000 m2 development will comprise 58,000 square metres of low rise, campus style office space, a Youth Theatre, a rejuvenated retail precinct, a water play park and associated car parking.70
Figure 13 Chinatown Mall Redevelopment – draft master plan69
Figure 14 Darling Walk project71

72
72 Tabcorp (2010), Tabcorp increases investment at Star City, 5 August 2010, available at: http://afr.com/rw/2009-2014/
AFR/2010/08/04/Photos/c257fc76-a019-11df-8dca-9e56e9d3303d_tabcorp%20increases%20invest.pdf
73 Gibson, Jano (2008), Sydney Morning Herald, ‘Plans unveiled for casino’s star turn’, 24 September 2008 available at: http://
www.smh.com.au/news/national/ugly-duckling-casino-set-for-major-makeover/2008/09/23/1221935641177.html
74 NSW Government (2010), News Release, Premier of NSW, ‘Sydney’s Barangaroo Precint – Asia’s Newest Financial
Centre, 14 July 2010, available at: http://www.business.nsw.gov.au/NR/rdonlyres/91ED0DD2-A77C-4F75-9AD5-
FFAD6924B3B3/0/rel_20100714_barangaroo.pdf
• Redevelopment and expansion of Star City casino commenced last year, and has recently been expanded to include a 3,000-seat multi-purpose entertainment venue. The current $575 million redevelopment project that commenced last year includes developments such as reorientation of the property towards Sydney Harbour, a new 5-star hotel, several new restaurants and bars, 4,000 m2 of retail space and refurbishment and expansion of the casino. In August 2010 Tabcorp announced plans to invest an additional $285 million including the multi-purpose Events Centre and VIP customer facilities. The Events Centre will comprise 2,400 m2 of column-free space have views over Sydney Harbour and the city skyline and designed to host performers as well as domestic and international conferences, exhibitions and functions.72
• Barangaroo development – the major new $6 billion Barangaroo site (including a 6 star hotel), will generate activity and business events for the Darling Harbour and the convention and exhibition centre precinct. This development has the potential to generate up to $1 billion for the NSW economy each year for the next 10 years. It will comprise commercial office towers mixed with residential apartments in a public waterfront precinct, public open space and a new Headland Park in the centre of the Sydney CBD.74
Figure 15 Artist’s impression of the Star City redevelopment 73

73
75 SHFA (2010), Asset Divestment Information Memorandum, January 2010, available at: http://www.shfa.nsw.gov.au/
content/library/documents/B3D856DA-E97E-68BA-DE3A0D306FD68799.pdf
76 TTF & PCA, Revitalising the Convention & Exhibition Industry in Sydney, 2007
77 SEC (2010), Major Transportation Links, available at: http://www.sydentcent.com.au/index.cfm?s=content&p=map; and
Transport and Traffic Planning Associates (2007), Concept Plan for the ‘Darling Walk’ Site, Darling Harbour, ‘Assessment
of Traffic and Parking Implications’, 29 November 2007, available at: http://majorprojects.planning.nsw.gov.au/files/19412/
Part%201.pdf
78 PwC communications with SHFA, July 2010
Each of these developments will contribute to increased pedestrian and thoroughfare activity, number of visits and general ambience in the precinct. Furthermore, this may contribute to an increased value associated with potential retail and hotel developments. Even before these developments, the range of attractions in Darling Harbour attracts more than 27 million visitors each year.75
Options for expanding the SCEC are discussed further below. In considering potential options, it has been assumed that Tumbalong Park and the Chinese Garden of Friendship would not be affected by any SCEC development. While these sites may present additional space for expansion, it has been considered that the cultural and political relevance of each site may preclude development and would only require relocation of open space elsewhere.
Furthermore, it was considered that any upgrade of the SCEC site to enable high yield international events and conferences to be held at the site would require relocation of some domestic and National exhibitions – this would require an expansion and upgrade of the Sydney Showground which has not been considered in the context of this study.
A – Expansion of the SCEC into the SEC car park site
This option involves extending the exhibition facilities into the site currently occupied by the SEC car park. The SEC car park site and the area below Pier Street combine as approximately 20-25 ha. Expanding into this area could potentially increase leasable floor space by 10,000 m2 76 (i.e. enabling resulting in total leasable space at the combined old and new SCEC of approximately 70,000 m2). This would enable scope to increase exhibition space and also incorporate flexibility for plenary/convention facilities.
The Wilson Entertainment Carpark currently has a 1,900 car capacity. While some of these car parks may be reduced due to the expansion proposed in Option A (and Option B), there may be scope to retain some of this capacity or construct additional capacity underground. Furthermore, any impact on availability of car park spaces will be offset by those being constructed as part of the new Darling Walk development – this will involve a 800 car park, with 600 spaces available to the public increasing the number of spaces in the precinct. Furthermore, there are other car park options available in the Darling Harbour district, for example the SCEC is served by its own Exhibition Centre Carpark that can accommodate 750 cars, and the SEC reports that there are around 10,000 spaces within a 10 minute walk.77
Consultations have suggested cost estimates for such a plan expanding the SCEC into the SEC car park site to be $500 million+.78

74
79 TTF & PCA, Revitalising the Convention & Exhibition Industry in Sydney, 2007 p9-13
80 Stakeholder consultation, June 9, 2010, highlighted the lack of connectivity of convention with exhibition space in the
SCEC currently. It is possible that further extension of the exhibition hall will exacerbate this issue. Thus, architectural plans
may need to consider alternative layouts.
81 TTF & PCA, Revitalising the Convention & Exhibition Industry in Sydney, 2007, p9 - 13
82 O’Neill, John (2007), Review into Sydney Convention and Exhibition Space, p28
83 Confidential discussions with private sector stakeholders
Issues in this expansion plan that may need to be considered and could impact on the capital expenditure required are:
• Roadway relocation may be necessary to seamlessly connect the current exhibit halls with the new building79
• The issue of proximity of exhibition space to convention space during this development80
• Displacement of parking facilities in Darling Harbour may occur as a result, and the demand for such facilities may require an alternative option
• A site survey has revealed the presence of significant utilities underground that may have to be relocated81
• Current road access is from Darling Drive, behind the main exhibition hall, and this road may need to be extended to service the newly expanded section.
B – Expansion of the SCEC into the SEC car park and site
This option is the most comprehensive undertaking for Darling Harbour convention and exhibition facilities discussed with stakeholders as part of this study, as it could result in the creation of a larger integrated, purpose built facility incorporating the simultaneous redevelopment of SCEC and SEC to create synergies between the two.82
Consultations indicate that the cost of this option could be more than $500 million depending on the extent of the expansion, including size, quantity of finishes and incorporation of flexible space options (e.g. stackable seating).
Combined, the SEC car park site, SEC site and the area below Pier Street is approximately 30 ha. Expansion of the SCEC into this area could result in the creation of a larger integrated, purpose built facility, whereby the SCEC, SEC and car park become a flexible space facilitating entertainment events, convention and/or exhibition areas. This could potentially increase SCEC leasable space by 20,000 m2 (i.e. enabling total leased space at the venue of approximately 80,000 m2) to allow inclusion of flexible space incorporating convention and exhibition areas.83

75
84 Sydney Entertainment Centre, Building information, accessed at http://www.sydentcent.com.au
85 Sydney Showground, Main Arena Fact Sheet, http://www.sydneyshowground.com.au
86 Acer Arena, History, accessed at http://www.acerarena.com.au
87 Searle, G. (2002) Uncertain legacy: Sydney’s Olympic stadiums, European Planning Studies, vol 10, no. 7
88 Carson, Vanda (2009), Sydney Morning Herald, ‘Rocked – veteran venue operator gets eviction notice’, 6 August 2009,
available at: http://www.smh.com.au/business/rocked--veteran-venue-operator-gets-eviction-notice-20090805-ea4h.html
89 Acer Arena (2010), Venue information: history, available at: http://www.acerarena.com.au/Venue_Information/History.aspx
90 Sydney Morning Herald, 1 September 2010, Acer Arena boss headed to Perth, available at:
http://news.smh.com.au/breaking-news-national/acer-arena-boss-headed-to-perth-20100901-14n0w.html
91 Carson, Vanda (2009), Sydney Morning Herald, ‘Impresario handed eviction notice’, 6 August 2010, available at:
http://pandora.nla.gov.au/pan/101523/20090806-1000/business.smh.com.au/business/impresario-handed-eviction-notice-
20090805-ea4l.html
The option provides the potential to incorporate supporting and co-located commercial development, making this option more comparable with the recent MCEC expansion, which involved $367 million of capital expenditure for the convention centre and $750 million private sector investment in the surrounding ‘mixed-use’ commercial development. Additional revenue streams and funding from co-located commercial investments may be able to offset construction costs and provide convention and exhibition attendees with nearby attractions and retail opportunities. These aspects could include hotel development, residential and office space as well as a retail precinct in the SEC site.
The issues relating to this development option are akin to those of Option A, but also involve the displacement of events and space currently occupied by the SEC. The SEC has capacity for up to 12,49084, and hence some events may be relocated to the SSG Main Arena (capacity 15,000 seated85) or the Acer Arena (capacity 21,000 seated86). However, almost no indoor events require a capacity of more than 10,000 seats.87
The SEC and Acer Arena are both owned by the NSW Government, and operated by private operators who rent the venue from the State. The SEC was previously managed by Arena Management since it opened in 1983, however their lease agreement was cancelled in August 2009 after the company went into receivership. Arena Management suggested its financial issues were in due to increasing competition from Acer Arena, as well as higher rental fees for its CBD location.88 Acer Arena is ranked in the top 10 arenas in the world and is the largest indoor entertainment and sporting arena in Australia.89 It was also recently reported as number 3 in terms of the world’s most profitable venues, behind London’s 02 Arena and Madison Square Garden, New York.90 In comparison with the SEC, Acer Arena has corporate boxes available and more modern IT facilities.
The SEC is now operated by the same private operator as the SCEC (Darling Harbour Convention and Exhibition Pty Ltd). The previous operator, Arena Management had spent $4.1 million renovating the SEC before their lease agreement was cancelled.91

76
92 Qatar National Convention Centre, www.qatarconvention.com
93 TTF & PCA, Revitalising the Convention & Exhibition Industry in Sydney, 2007, p9-13
94 NSW Government, News Release, 5 May 2010, $1 million to expand Sydney’s Convention and Exhibition facilities’
accessed at http://www.shfa.nsw.gov.au
Integration of the SCEC car park and SEC into an expanded SCEC further has the potential to develop a ‘research and education corridor’, linking the University of Sydney, in Camperdown, to UTS and Darling Harbour. Similar activities have been undertaken in Qatar, with the Qatar National Convention Centre, a 40,000 m2 exhibition hall with capacity for 4,000 delegates, located in Education City, a cluster of over 30 elite educational and research institutions.92
Where expansion/improvement of the SCEC has been previously recommended
Expansion and improvement of the SCEC has been discussed for several years, and was considered in previous studies. Although detailed plans were not laid out in either report, both O’Neill (2007) and TTF/PCA (2007) discuss high level redevelopments and expansion of the current SCEC facilities. The potential increase in convention and exhibition space ranges in these previous studies from 10,000 m2 (O’Neill) up to 25,000 m2 (TTF/PCA).
According to the TTF/PCA 2007 study prepared by HVS International, management of the SCEC had proposed a redevelopment plan at around the time of that study. This plan was reported by HVS International to involve redevelopment of the SEC car park and the SEC into an integrated facility with the SCEC. The plan proposed by SCEC management, and reported in that 2007 report, could add an additional 20,000 m2 of exhibition floor area, growing the total available space to approximately 50,000 m2.93
SHFA is also currently preparing a master plan for south Darling Harbour at the request of the NSW Government. This master plan will be overseen by a committee of stakeholders including the Land and Property Management Authority, Industry and Investment NSW, Tourism NSW, NSW Treasury, SOPA, Department of Premier and Cabinet and SHFA. It is also understood that this plan is likely to consider options for an expanded convention and exhibition facility in Darling Harbour, the refurbishment of the SEC, and integration of new facilities with the adjacent UTS and Barangaroo project. Also being considered are ways to integrate the convention and exhibition centre precinct with other tourist precincts including Chinatown, the Powerhouse Museum and the education precinct at the University of Technology.94 The report is due for release in November 2010.
In addition to the previous plans put forward by SHFA, as part of this study PwC has held discussions with some private sector parties to discuss their preliminary interest in the development of facilities in Sydney. Through this, there have been indications there is some private sector interest in development of the SCEC. This interest included options to incorporate commercial opportunities such as hotels, retail and commercial options that do not appear to have been previously considered by SHFA.
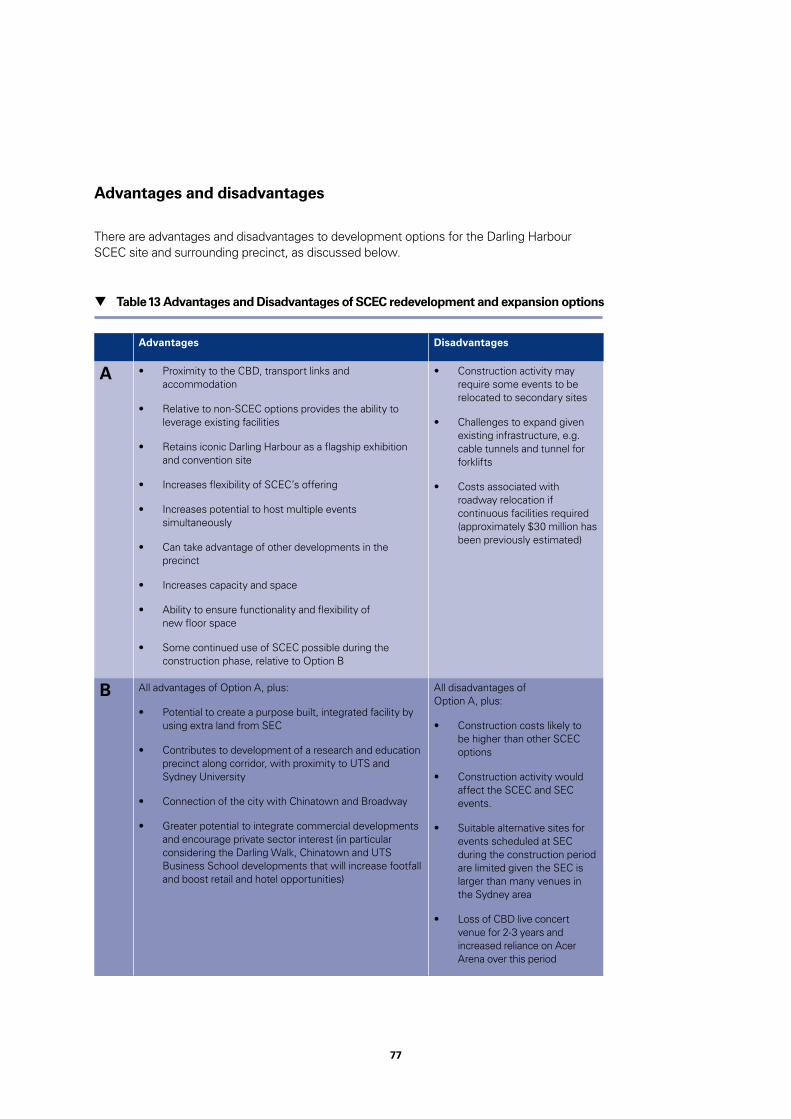
77
Advantages and disadvantages
There are advantages and disadvantages to development options for the Darling Harbour SCEC site and surrounding precinct, as discussed below.
Table 13 Advantages and Disadvantages of SCEC redevelopment and expansion options
Advantages Disadvantages
A • Proximity to the CBD, transport links and accommodation
• Relative to non-SCEC options provides the ability to leverage existing facilities
• Retains iconic Darling Harbour as a flagship exhibition and convention site
• Increases flexibility of SCEC’s offering
• Increases potential to host multiple events simultaneously
• Can take advantage of other developments in the precinct
• Increases capacity and space
• Ability to ensure functionality and flexibility of new floor space
• Some continued use of SCEC possible during the construction phase, relative to Option B
• Construction activity may require some events to be relocated to secondary sites
• Challenges to expand given existing infrastructure, e.g. cable tunnels and tunnel for forklifts
• Costs associated with roadway relocation if continuous facilities required (approximately $30 million has been previously estimated)
B All advantages of Option A, plus:
• Potential to create a purpose built, integrated facility by using extra land from SEC
• Contributes to development of a research and education precinct along corridor, with proximity to UTS and Sydney University
• Connection of the city with Chinatown and Broadway
• Greater potential to integrate commercial developments and encourage private sector interest (in particular considering the Darling Walk, Chinatown and UTS Business School developments that will increase footfall and boost retail and hotel opportunities)
All disadvantages of Option A, plus:
• Construction costs likely to be higher than other SCEC options
• Construction activity would affect the SCEC and SEC events.
• Suitable alternative sites for events scheduled at SEC during the construction period are limited given the SEC is larger than many venues in the Sydney area
• Loss of CBD live concert venue for 2-3 years and increased reliance on Acer Arena over this period
78
95 Information supplied by Darling Harbour Convention and Exhibition (DHCE) Pty Ltd / SHFA, June 2010
96 Melbourne Convention and Exhibition Centre (MCEC), Floor Plans and Space Capacities
97 Personal communication with SCEC management, June 2010
Phase 2 development/refurbishment of the SCEC site
Considering Options A and B above as ‘Phase 1’ of development of a world class facility in Sydney, ‘Phase 2’ could include upgrades and refurbishment to the existing facility. However, it is expected that phase 1 would need to be completed first to enable these further developments to accommodate pre-booked events during construction:
• Limited upgrades and maintenance – To address more immediate issues related to ageing facilities. As discussed in the previous chapter, issues raised by the SCEC facilities managers indicate the following upgrades are required, which will need around $320 million over the next ten years for air conditioning, roof, kitchen and loading dock maintenance/refurbishment.95 This would involve core maintenance upgrades to the existing SCEC facility, with no additional capacity provided. This would need to be undertaken considering the impact on ongoing operation of the facility, hence the advantages of undertaking this following the initial Phase 1 expansion.
• Structural enhancement and refurbishment of SCEC Exhibition Halls – In order to address the issue of lack of flexibility and general layout of the exhibition hall, this would involve redeveloping the existing SCEC Exhibition Hall into a streamlined, flexible space. While this would not directly increase capacity, it would allow the existing venue to cater for a wide range of events, potentially simultaneously. Undertaking this development would address the ability of the facilities to meet current trends to incorporate flexible floor plans and integrated meeting rooms, such as in the MCEC.96 For a full refurbishment of the SCEC including flexible spaces, storage, AV, etc, a high level capital cost estimate of above $400 million was suggested during this study. The ultimate cost of such a development would depend on the level of flexibility and continuity introduced.97 As an extension, there may be potential to convert the existing exhibition halls into 2-storey halls to increase capacity.
• Redevelop or demolish existing SCEC site – Given the underlying costs of renovating, especially the roof, air conditioning, IT systems, loading bays and kitchens, a further Phase 2 option could be to build a new wing for the centre on the existing SCEC site to better integrate into the new Phase 1 centre.

79
98 TTF & PCA, Revitalising the Convention & Exhibition Industry in Sydney, 2007, p9-160
99 ibid
100 O’Neill, John (2007), Review into Sydney Convention and Exhibition Space, p25
101 ibid
102 O’Neill, John (2007), Review into Sydney Convention and Exhibition Space, p36
2. Expansion of Sydney Showground
Description of the site
The SSG is currently the secondary exhibition site in Sydney, hosting over 400 events per year, of which approximately 7-10 percent are exhibitions.98 A majority of these events are large scale exhibitions and trade shows with a national and domestic focus. The primary advantages of the SSG are its location in the Sydney metro area (proximity to both Parramatta and Sydney CBD), transport access by rail and motorway, as well as availability of parking.99
The next largest exhibition space after SCEC, the SSG, may not have the capacity to host large events in their exhibition halls.100 Hence, in order to provide adequate facilities at the SSG for the typical conventions and exhibitions held at the SCEC, expansion of the current SSG facilities would likely be needed.
Where this option has been previously recommended
The Royal Agricultural Society (RAS) has previously developed a plan to redevelop the Showground, increasing the total exhibition space from 21,600 m2 to 29,000 m2 by adding on to existing exhibition halls. Further to this plan, TTF/PCA (2007) discussed an expansion of the SSG to serve the local consumer and tradeshow market.101 The plan proposed by TTF/PCA would increase the exhibition space up to 40,000 m2.
Following the government’s announcement to establish a Western Sydney AFL team, the Royal Agricultural Society of NSW will receive $20 million in the NSW 2010-2011 Budget for the redevelopment of the Sydney Showground Arena, with $12.6 million also allocated for facility improvements at Sydney Olympic Park. This includes $5.8 million for precinct improvements at ANZ stadium and facilities at Homebush Bay.
In order to justify such a development and also to justify government funding into expansion or upgrading of privately operated SSG facilities, changes to the existing management agreement may be needed. According to O’Neill (2007) this will involve changes to the revenue sharing as well as the management approach.102

80
103 TTF & PCA, Revitalising the Convention & Exhibition Industry in Sydney, 2007, p9-12
104 City of Sydney, Sustainable Sydney 2030,
http://www.cityofsydney.nsw.gov.au/2030/documents/2030Vision/2030VisionBook.pdf
105 Ken Maher, Chairman of Hassell, Sydney Media, 26 March 2008, Grand vision to develop Central Station as Sydney’s
green gateway, http://www.sydneymedia.com.au/html/3557-grand-vision-to-develop-central-station-as-sydneys-green-
gateway.asp,
If the SSG were expanded as a consumer show venue, then the need to expand the SCEC would be reduced and more resources could be dedicated to improving the functionality of existing convention spaces in the SCEC.103 A smaller expansion of the SCEC could focus on the ability to host conventions and small trade shows simultaneously by addressing the flexibility and divisibility of halls.
3. Develop airspace over Central Station
Description of the site
Central Station is a major CBD railway station on the City Rail network, which also serves as a transport hub located nearby to the Sydney CBD. The airspace above the station is not currently being utilised to its potential. It has previously been suggested that future redevelopment could include major public facilities, including a convention centre, as suggested in the City of Sydney’s vision for the CBD.104 Up to 500,000 m2 of retail and business space could be created above the railway lines. According to Ken Maher, ‘a major new public venue using the air space over the rail lines could have a front door to a more pedestrian friendly Railway Square, giving greater vitality and meaning to this southern gateway to the city centre’.105
Table 14 Advantages and Disadvantages of expanding the SSG
Advantages Disadvantages
• May be lower capital cost than expansions in the Sydney CBD
• Location in the Sydney metro area and proximity to transport
• Redevelopment could align with the Olympic Park precinct master plan.
• Would not address desires of delegates to be located nearby the CBD and at more iconic SCEC site
• Future use and utilisation of SCEC site
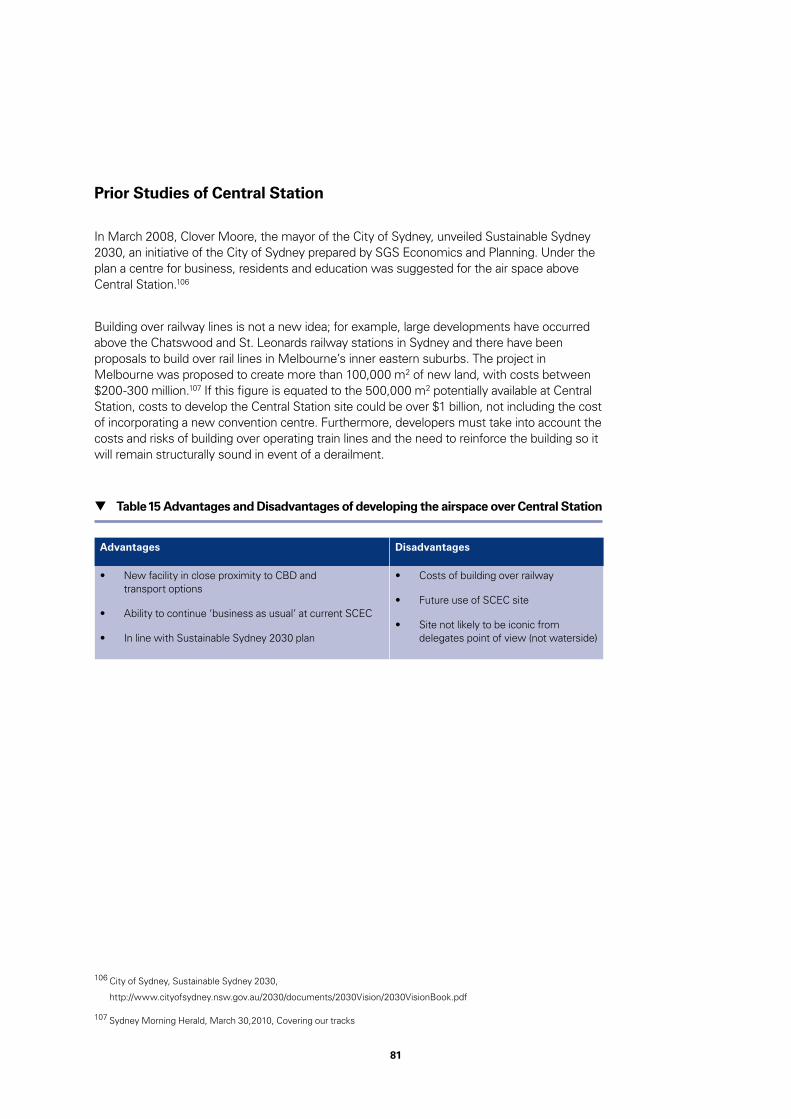
81
106 City of Sydney, Sustainable Sydney 2030,
http://www.cityofsydney.nsw.gov.au/2030/documents/2030Vision/2030VisionBook.pdf
107 Sydney Morning Herald, March 30,2010, Covering our tracks
Prior Studies of Central Station
In March 2008, Clover Moore, the mayor of the City of Sydney, unveiled Sustainable Sydney 2030, an initiative of the City of Sydney prepared by SGS Economics and Planning. Under the plan a centre for business, residents and education was suggested for the air space above Central Station.106
Building over railway lines is not a new idea; for example, large developments have occurred above the Chatswood and St. Leonards railway stations in Sydney and there have been proposals to build over rail lines in Melbourne’s inner eastern suburbs. The project in Melbourne was proposed to create more than 100,000 m2 of new land, with costs between $200-300 million.107 If this figure is equated to the 500,000 m2 potentially available at Central Station, costs to develop the Central Station site could be over $1 billion, not including the cost of incorporating a new convention centre. Furthermore, developers must take into account the costs and risks of building over operating train lines and the need to reinforce the building so it will remain structurally sound in event of a derailment.
Table 15 Advantages and Disadvantages of developing the airspace over Central Station
Advantages Disadvantages
• New facility in close proximity to CBD and transport options
• Ability to continue ‘business as usual’ at current SCEC
• In line with Sustainable Sydney 2030 plan
• Costs of building over railway
• Future use of SCEC site
• Site not likely to be iconic from delegates point of view (not waterside)

82
108 HVS International (2007) Revitalising the Convention & Exhibition Industry in Sydney, prepared for PCA and TTF, p9-14
109 Sydney Ports, November 2000, Glebe Island and White Bay Master Plan
110 Alternative Media Group, 18 Jun 2009, Pyrmont people power mounts against Metro plans, available at: http://www.
altmedia.net.au/pyrmont-people-power-mounts-against-metro-plans/7721
111 HVS International (2007) Revitalising the Convention & Exhibition Industry in Sydney, prepared for PCA and TTF, p9-14
4. Glebe Island and White Bay
Description of the site
Glebe Island, a relatively large site with 2.1 km of waterfront, is located just west of the CBD. The peninsula is bounded by White Bay and the residential areas of Balmain, Rozelle and Pyrmont are located nearby. The primary asset of the site is its size and ability to accommodate a large venue; the site is largely vacant and would not displace any existing development.108
The area of Glebe Island is owned by the Sydney Ports Corporation (Sydney Ports) on Ministerial Order of the NSW Government. At this time, the current plan for the area incorporates provisions for general cargo and container shipping use. Also certain aspects of the Glebe Island area, including grain silos and a coal loader, may constrain development as they are recognised as historical items.109
Although the Anzac Bridge provides road transport routes to the site, there are limited (if any) viable pedestrian connections to tourism amenities. Recent proposals to site a metro train line have been put on hold for the long-term, thereby decreasing likelihood of improved public transport access. Furthermore, the metro has been opposed by a coalition of community groups.110 Thus, the site may be more suited for a consumer or trade show than convention centre, and may therefore necessitate the continued use of the SCEC.111
Where this option has been previously recommended
TTF/PCA (2007) highlighted the development of a 40,000 m2 exhibition hall at White Bay that would be able to accommodate the largest consumer shows in the market. In the case that only an exhibition hall was built in White Bay, there would be a continued need to operate the SCEC. But, there would be less need for additional exhibition space at the SCEC. However, separating the SCEC from additional exhibition capacity may be less than ideal, especially since dedicated transport between the two sites is not yet operational.

83
112 TTF & PCA, Revitalising the Convention & Exhibition Industry in Sydney, 2007
113 Lend Lease, 21 December 2009, Lend Lease selected developer for Barangaroo, http://www.bovislendlease.com/llweb/
llc/main.nsf/all/news_20091221
114 Barangaroo Sydney Australia, http://www.barangaroo.com/index.cfm?menu_id=1
5. Barangaroo precinct
Description of the site
Barangaroo, formerly known as East Darling Harbour, is the only remaining large site in the CBD with capacity for new development.112 The site comprises 22 ha with 1.4 km of shoreline. To the east of the site lie Millers Point and the Rocks, with the CBD close-by, and King Street Wharf at the southern end.
With the movement of vehicle container and cruise ship terminals to other locations, the use of the site has been the subject of major redevelopment planning. Subsequently, Lend Lease has been selected as the developer of the site,113 and a range of project applications have been submitted by the Barangaroo Development Authority and Lend Lease over the proposed development of the site.114 Currently, the development plan makes no consideration for the development of a convention and exhibition facility.
Table 16 Advantages and Disadvantages of developing at White Bay
Advantages Disadvantages
• Ability to continue ‘business as usual’ at current SCEC
• Waterfront site with a large amount of available space
• Lack of business tourism infrastructure in the surrounding neighbourhood
• Need to create a precinct master plan to underpin development, also inability to leverage off existing infrastructure
• Other than vehicular access via Anzac Bridge, there is limited public transport options to move delegates e.g. ferry, light rail or existing bus routes are absent
• Distance from the CBD
• Not as ideal to provide convention and exhibition facilities or target international events
• Lack of nearby accommodation

84
115 NSW Government, Barangaroo, Key Facts, available at: http://www.barangaroo.com/keyfacts.cfm?menu_id=2
116 Refer to NSW Government, Barangaroo Development Authority, Barangaroo Consolidated Concept Plan 2007, Part B:
Concept Plan, available at http://www.barangaroo.com/concept_plans.cfm
117 HVS International (2007) Revitalising the Convention & Exhibition Industry in Sydney, prepared for PCA and TTF, p9-7
118 NSW Government,Barangaroo Development Authority, Headland Park,
http://www.barangaroo.com/headlandPark.cfm?menu_id=3
The current Lend Lease plan is being undertaken in three redevelopment areas – the Headland Park, Barangaroo Central and Northern Cove and Barangaroo South, with construction expected to commence in late 2011 for completion in late 2014. Approximately half the Barangaroo site will be dedicated to open space and public domain, with a new Headland Park at the northern end of the site. Barangaroo will include transport infrastructure such as a new ferry terminal and pedestrian links to existing public transport networks and complete the 14km Sydney Foreshore Walk from Anzac Bridge to Woolloomooloo. Overall, the current plan sees a maximum of 508,300m2 of commercial, residential, tourism, retail and community space in the development zone, and 11,500 m2 in the public domain.115
A previous report believed the site had potential for 40,000 m2 exhibition space and up to 5,000 seat capacity plenary hall (TTF/PCA 2007 report Revitalising the Convention and Exhibition Industry in Sydney) but capacity is now uncertain as the commercial space is fully allocated and retaining high levels of green space is important for the precinct.116
Where this option has been previously recommended
According to TTF/PCA (2007), if the focus is to attract national and international conventions, tradeshows and conferences, a facility would need approximately 40,000 m2 continuous exhibition space. Furthermore, with potential constraints on future development, there may be a need to overbuild to ensure sufficient space for future demand growth.
A concept plan provided to TTF/PCA (2007) demonstrated that a convention centre with the desired amount of exhibition space can be built alongside sufficient commercial and business development at Barangaroo. Under this plan, a potential convention centre would be located in the northern area, referred to as ‘Headland Park’. The potential conference centre building would be placed over a public plaza and reach into Darling Harbour, with the exhibition hall supporting commercial buildings and parkland. Hickson Road, to the immediate East, would serve transport and access needs to the facility.117
However, under the current site plan developed by Lend Lease or more broadly within The Barangaroo Development Authority Master Plan, there are no plans to build a convention centre at Headland Park, or elsewhere in Barangaroo. Proposals are for an open space featuring waterfront commercial, residential and leisure precinct, including the creation of the harbour-side park and restoration of the entire harbour headland to a more natural shape.118 Inclusion of a convention and exhibition centre would require modification of the current plan, which may require community consultation as well as approval from stakeholders.

85
Assessment of site options
A comparison of the advantages and disadvantages of each of the options described above for a new and/or expanded facility, and discussions with stakeholder groups including tourism industry representatives and potential private sector operators and developers, has supported that the current SCEC site is retained as the location for high value conventions and exhibitions.
Advantages of this include the ability to leverage existing facilities, in particular the iconic Darling Harbour site. Furthermore, its location relative to the CBD and to transport networks will require minimal upgrades to access arrangements. In addition, there is the more long term potential to contribute to development of a research and education precinct along the corridor, with proximity to UTS and Sydney University, and also to take advantage of connecting the city with Chinatown and Broadway.
Of the SCEC options presented, expansion into both the SEC car park and SEC site, combined with maintenance and some refurbishment of the current site would be expected to address the key capacity issues identified for Sydney, as well as allowing for scope for ancillary development such as retail, commercial, office and a hotel – which could assist to encourage private sector involvement in financing and development. Such a development would involve incorporation of convention, exhibition and entertainment facilities in order to accommodate current SEC demand. If the entertainment facilities are retained at the SEC with expansion occurring principally into the SEC car park site, this would enable retention of the current SEC with some linking of it into the ‘multi-use’ facility available to host international entertainment acts, business conferences and trade exhibitions – though this option may require some expansion of the existing SCEC site into two storeys in order to expand convention and exhibition space while still allowing for commercial development.
Table 17 Advantages and Disadvantages of convention and exhibition centre development at Barangaroo
Advantages Disadvantages
• Use of an iconic harbour front site
• Proximity to CBD
• No displacement of current developments or infrastructure
• May no longer require operation of SCEC as a convention and exhibition facility, allowing sale or other development of the site
• Inability to leverage off existing infrastructure
• Loss of green space and increased building density
• No integration with existing Darling Harbour convention and exhibition centre or nearby complementary infrastructure

86
Economic benefits of creating an expanded, world class facility in Darling Harbour
Economic impacts of a world class facility
An expansion of the SCEC into the SEC car park and potentially also the SEC site has the potential to expand leasable entertainment, convention and exhibition space by 10,000-20,000 m2. This also has the potential to increase flexibility for events. As a result of the increased space and flexibility, there is potential to increase the number and scale of events hosted in Sydney by enhancing the international profile of the SCEC and its ability to attract large scale events. As a result of attracting additional interstate and international delegates and other visitors, new expenditure would be undertaken in NSW resulting in an increase in the economic benefit contributed by the SCEC to the NSW economy.
As indicated in the figure below, the economic benefit may initially reduce relative to the ‘do nothing’ scenario described earlier due to construction impacts. However, over a 30-year period, there is a significant increase in the economic benefit.
Figure 16 Possible increase in economic benefit relative to a do nothing scenario (Phase 1 SCEC expansion only)
Compared to a ‘do nothing’ scenario, expansion of the SCEC has the potential to increase economic impacts by $160-270 million per annum, or $2.0-3.4 billion over 30 years in NPV terms (today’s dollars)
0
100
200
300
400
500
600
700
800
900
2008
2010
2012
2014
2016
2018
2020
2022
2024
2026
2028
2030
2032
2034
2036
2038
2040
Base Case (no expansion/do nothing)
SCEC expanded into the SEC carpark and SEC site
SCEC expanded into the SEC carpark
$ m
illio
ns
87
119 Assumptions to estimate economic impact net change: expansion enables a capacity increase of 10,000-20,000 m2; events, delegates and economic impact decrease by 20% during construction years as activity is displaced during 2011 and 2012; over the first 5 years of operation events, delegates and economic impact ramp up to achieve an increase proportional to the increase in exhibition space increases by 30-70%; it is possible to attract events by a similar portion as exhibition space is increased; after events per square metre reaches current levels, growth in delegates, events and therefore economic impact would increase at only 1% pa; discount rate of 7% real used to consider the annual economic impact.
120 Infrastructure Partnerships Australia, Case Studies, Perth Convention and Exhibition Centre, http://www.infrastructure.org.au/DisplayFile.aspx?FileID=16
121 Melbourne Convention and Exhibition Centre, Student Information Kit, Economic Benefits of the Melbourne Convention Centre, http://www.mcec.com.au/Utility/MCEC-Information/Student-Information-Kit.html
This suggests there is potential to increase the economic benefit (currently $466 million per annum) by $160 million each year for expansion into the SEC car park, and up to $270 million each year for expansion into the SEC car park and SEC site.119
Economic benefits experienced from expansion of convention and exhibition facilities in other Australian jurisdictions are described in case study 2.
Economic benefits of a world class facility
Ideally, the economic contribution of an expanded, world class facility in Sydney would be assessed as part of a cost benefit analysis (CBA). A CBA was undertaken for the Melbourne Convention Centre project, which suggested that the project had a strong benefit cost ratio (BCR) exceeding 2.5. The net benefits were driven by the expanded centre attracting more overseas visitors, a large proportion of which undertake pre or post-touring to other parts of Australia.
A CBA aims to understand how efficiently funds are being allocated in order to generate benefits for NSW residents and businesses. Such an analysis requires a significant amount of data (ranging from a range of detailed SCEC specific data, base case capital expenditure, visitor mix over a 30+ year timeframe, etc.) and hence was not undertaken for as part of this study.
Case study 2 Economic benefits from convention and exhibition facility development and expansion in Australia
The economic benefits to development of the Perth Convention Centre are derived through the extra visitors to the State, have been calculated as $2.2 billion over the life of the Centre, or approximately $63 million per year for 35 years.120
The Melbourne Convention Centre development is anticipated to inject around $200 million a year into Victoria’s economy for the next 25 years - a $5 billion boost to the Victorian economy. The investment will create another 2,500 new jobs on top of the almost 1,800 created during construction of the centre and commercial precinct in South Wharf.121

88
Funding options for the redevelopment or refurbishment of convention facilities generally include a spectrum of private sector involvement approaches. Developments in other domestic convention centres utilise a range of public and private funding arrangements. This chapter considers how existing facilities in Australia were delivered and funded. It considers alternative delivery models, the benefits of private sector involvement and the funding options available for the expanded SCEC.
Existing facilities in Australia
Funding and delivery options for convention and exhibition facilities generally include a spectrum of models for private sector involvement. Delivery and funding experiences from existing facilities in Australia can be leveraged for the expanded SCEC. This section of the report specifically focuses on whether existing facilities are:
• Delivered through conventional government procurement or through private sector involvement - and the extent of private sector involvement.
• Self sufficient and generate sufficient cash flow to fund ongoing operational and maintenance costs, and where relevant, repay debt facilities and equity investments utilised to fund the capital cost of the projects.
• How and by whom the upfront capital costs of projects were funded.
The models at the SCEC, SEC, Sydney Showground, MCEC and Perth Convention Centre are described further below.
6. Delivery and funding models for a new or expanded facility

89
Government ownership with private operation
Sydney Convention and Exhibition Centre model
The private sector was involved in the design and construction of the SCEC,122 with initial funding support from the NSW Government,123 and is owned by SHFA, a NSW Government responsible entity. Under current agreements, Darling Harbour Convention and Exhibition (DHCE) Pty Ltd manage the facility. DHCE is the operating company under Convention Centre Management (CCM) Pty Ltd, a private sector consortium jointly owned by the hotel group Accor Asia Pacific (60%)124 and food services organisation Compass Group (40%).125
It is our understanding that DHCE’s role involves facilities management, catering, cleaning, maintenance, event marketing and other venue operations. SHFA retain demand risk in relation to events, conferences and exhibitions and DHCE receives a management fee. DHCE receives a variable payment which is linked to volumes for some of its other operations (e.g. catering).127
122 The SCEC architecture was designed by Philip Cox Richardson Taylor and Partners (Source: http://www.sydneyarchitecture.com/PYR/PYR17.htm ) and constructed by Baulderstone and Leighton Contractors (Source: http://www.baulderstone.com.au/index.php?page=projects&id=400)
123 Sydney Convention and Exhibition Centre, February 2009. Fact File
124 Sydney Convention and Exhibition Centre, February 2009. Fact File
125 Sydney Convention and Exhibition Centre, Media Centre, 19 May 2009, Art Reflects Sydney’s Essence, http://www.scec.com.au/media_centre/details.cfm?objectID=44
126 Information supplied by Darling Harbour Convention and Exhibition (DHCE) Pty Ltd / SHFA, June 2010
127 Information supplied by Darling Harbour Convention and Exhibition (DHCE) Pty Ltd / SHFA, June 2010
NSWStateGovernment
Land and PropertyManagementAuthority(LPMA)
Sydney Harbour Foreshore Authority(SHFA)
SydneyConvention and Exhibition Centre(SCEC)
Darling HarbourConvention and Exhibition (DHCE) Pty Ltd
Figure 17 Parties involved in management of the SCEC 126

90
128 O’Neill, John (2007), Review into Sydney Convention and Exhibition Space, p33
129 O’Neill, John (2007), Review into Sydney Convention and Exhibition Space, p33
130 Sydney Harbour Foreshore Authority, Annual Report 2008-09
131 Sydney Entertainment Centre, About the SEC, http://www.sydentcent.com.au/index.cfm?s=content&p=dynamicpage&menu_id=100001
Currently the management structure has four objectives for the SCEC:
1 To generate economic benefit for the State, with a particular focus on international conventions
2 To maximise utilisation of the SCEC
3 Generate cash returns to the State
4 To offer a world class convention facility.128
The private sector is incentivised through meeting or exceeding certain Key Performance Indicators (KPIs) related to the attraction of international and national delegates and attaining the required occupancy levels.
O’Neill recommended that management contracts for such facilities should motivate the managers to give greatest priority to large international conventions. O’Neill highlights the current SHFA/SCEC management agreement makes some mention of this but actually provides strong incentives for the manager to maximise both the operational profit of the facility and use of the exhibition space. Maximum use of exhibition space is achieved through primarily serving domestic exhibitions. Thus, if priority should be given to international and large national conventions, a key SCEC issue in addition to capacity, is with booking conflicts between international and domestic events.129
Sydney Entertainment Centre
Similar to the SCEC, the SEC is owned by the SHFA (NSW State Government). Arena Management, a private company which had a lease agreement to operate the SEC, was placed into voluntary administration and terminated the prior lease agreement in August 2009.130 The facility is now operated by DHCE Pty Ltd.131
Government ownership with private operation

91
132 Royal Agricultural Society (RAS) Annual Report 2008-09
133 TTF International (2007) Revitalising the Convention & Exhibition Industry in Sydney
134 Victorian Auditor – General’ Office, Audit of Melbourne Convention Centre Development, http://www.audit.vic.gov.au/reports__publications/reports_by_year/2007/20071031_ppp.aspx
135 The Fifth Estate, Case Study – Melbourne Convention Centre, last updated 24 September, 2009, http://www.thefifthestate.com.au/archives/5986
136 MCEC and Hilton, Meet by the river in Melbourne, South Wharf Meetings and Events
Government owned, privately operated through long term lease and private management
Public Private Partnership (PPP) project
Sydney Showground
In 1996 the RAS entered into a 99 year lease over management and operation of the SSG (with a further 99 year option) with the NSW Government. Commencing from September 2000, SOPA makes annual payments to a Major Repair Fund (MRF) that is sourced from the payment made by the RAS. The RAS payment to the MRF is calculated based on a percentage of the Royal Easter Show revenue and a percentage of the profit from other activities. Dependent upon certain terms and conditions, the RAS is obligated to contribute approximately $2.1 million per annum.132
The TTF/PCA study prepared by HVS International suggests this ownership structure does not currently provide adequate incentive to undertake significant maintenance and facility upgrades. Similarly run facilities may face shortfalls in necessary maintenance and expansion funding if the specified lease term does not accurately reflect the asset life.133
Melbourne Convention and Exhibition Centre
The MCEC development was delivered under the Partnerships Victoria (PV) policy by three main public entities:
• Major Projects Victoria (MPV), then a division of the Department of Infrastructure (DOI)
• Department of Innovation, Industry and Regional Development (DIIRD)
• Melbourne Convention and Exhibition Trust (MCET).134
These groups partnered with a PPP consortium led by Plenary Group, which delivered a $1.4 billion revitalised riverside precinct incorporating the expanded convention and exhibition centre, a new Hilton Hotel, an office tower, 60,000 m2 of retail and a rejuvenated river promenade.135 A Hilton Hotel is located next to the convention centre, with 396 rooms, including 26 suites and 32 apartments.136
92
137 Victorian Auditor – General’ Office, Audit of Melbourne Convention Centre Development, http://www.audit.vic.gov.au/reports__publications/reports_by_year/2007/20071031_ppp.aspx
138 Victorian Auditor – General’ Office, Audit of Melbourne Convention Centre Development, http://www.audit.vic.gov.au/reports__publications/reports_by_year/2007/20071031_ppp.aspx
139 Victorian Auditor – General’ Office, Audit of Melbourne Convention Centre Development, http://www.audit.vic.gov.au/reports__publications/reports_by_year/2007/20071031_ppp.aspx
140 Melbourne Convention and Exhibition Trust, Annual Report 2008-2009, p19
Public ownership and some management
The Victorian Government contributed $367 million toward construction of the centre, with the City of Melbourne contributing a further $43 million spent on municipal works around the precinct, including roads and street lighting, a new footbridge to the north bank of the Yarra River, and marketing of the new centre. The $750 million commercial precinct was fully financed by Plenary and its syndicate of four banks comprising of the Bank of Scotland, NAB, St. George, and Suncorp Metway.137
As part of the PPP arrangements, Victoria received $93.2 million from the Plenary Group for development rights of the precinct. A subsidiary of the group, Austexx Plenary Melbourne, received a 99-year leasehold for the commercial areas and a 25-year leasehold for the land relating to the convention and exhibition centre. Plenary Group is responsible for the facilities management including maintenance for 25 years.138 The private sector receives a quarterly service payment from the State of Victoria to repay debt and to operate and maintain the MCEC.
The newly operating MCEC is owned by the Victorian State Government. The Melbourne Exhibition Centre (MEC), the old Melbourne Convention Centre (MCC) and the new Melbourne Convention Centre (MCCD) are referred to as the Melbourne Convention and Exhibition Centre (MCEC). They are fully integrated operationally and trade as the MCEC under the direction of the Melbourne Convention and Exhibition Trust (MCET). Since completion of the expansion in 2009, MCET is responsible for marketing and operation of the centre.139
Currently, in order to achieve the MCET’s vision of optimum utilisation of space and enhance the profile of the MCEC and Victoria as a ‘place to do business’, there are five objectives.
1 To ensure high quality operations
2 To optimise profitability levels from the MCET’s operations while maximising economic benefits to Melbourne and Victoria
3 To maintain and further develop international standard convention and exhibition facilities
4 Enhance Melbourne’s position as an international city and the events capital of Australia through ongoing attraction of international events
5 Maintain the MCET’s venues and work environment.140
93
Private operation with transfer of ownership to Government
141 Melbourne Convention and Exhibition Trust, Annual Report 2008-2009, p19
142 Perth Convention and Exhibition Centre, PCEC facts, http://www.pcec.com.au/faqs.cfm)
143 Carlsen, J., 2004, Issues in Dedicated Convention Center Development with a Case Study of the Perth Convention and Exhibition Center, Western Australia, Journal of Convention & Event Tourism, 6:1,45-61
144 Perth Convention and Exhibition Centre, Frequently Asked Questions, http://www.pcec.com.au/faqs.cfm
145 Mianich, R., 2005, Encouraging and Establishing Partnerships, IPAA Seminar, WA Department of Treasury and Finance
146 Spotless, 2008 Annual Report, p14
In conducting a performance review of the second objective, the MCET asserts:
‘The prime objective of the Centre is to attract international and national conventions to the Centre and Melbourne to maximise economic impact for the City and State’ 141
The industries targeted to host events at the MCEC are the priority industry areas of the Victorian Government, including the medical and industry research portfolios.
As discussed above, Plenary Group is responsible for facilities management of the MCEC under a 25-year arrangement.
Perth Convention Centre Model
The Perth Convention Centre, opened in 2004, was developed with significant private involvement; the facility was built by Multiplex, financed by ANZ and the Commonwealth Bank, with support of the Western Australian Government (landowner and partial funder). Although on a smaller scale compared to the MCEC, the construction of the PCEC was complemented with the redevelopment of the surrounding precinct, including a 138-apartment hotel now privately operated by the Medina Group.142
In order to address the funding needed to finance the project, the Government announced an incentive package and the provision of Crown Land for the development of the PCEC. The Perth CEC Pty Ltd. was established as the development vehicle with Multiplex constructing the facility, under a project agreement whereby the Government loaned the $100 million towards construction costs. This lease-own arrangement is to be repaid in 35 years, with the transfer of ownership of the PCEC to the state government over this period.143
The facility is now owned by Wyllie Group,144 and managed by Spotless. Overall, the private sector played key roles in the design, construction, finance, maintenance and operation of the convention centre.145
Spotless Group has managed the facility since 2005, and in their 2008 Annual Report, the group highlighted that “the centre is now trading profitably and has a strong forward events pipeline”.146

94
These types of facilities are important to the broader economy and Government’s desire to maintain strategic, planning and scheduling control of the convention and exhibition facility offering
This is the only convention and exhibition facility, which was compared and discussed in the paragraphs above, with full demand risk held by the private sector. Benefits of this approach are that it aligns all aspects of facility operation with an objective of attracting events and maximising profits. It was fully funded by the private sector through private finance and commercial opportunities and no contribution was required from government. The State Government elected to allocate responsibility for planning and strategic control of the facility to the private sector.
Summary
Revenue generated from events, conferences and exhibitions are generally not sufficient to cover upfront capital, operational and maintenance costs. The majority of major capital city convention and exhibition facilities in Australia are government owned; reflecting the strategic importance of these facilities to the broader economy.
The majority of the large convention and exhibition facilities utilised alternative sources to fund the upfront and ongoing costs of facilities by involving the private sector through including commercial opportunities such as retail, offices, parking, hotel, and so forth.
The balance of this Chapter considers private and public sector delivery and funding models.

95
Delivery arrangements for convention centre developments can include roles for both the public and private sectors
Private and public sector delivery options
Generally in Australia, large-scale convention and exhibition facilities are owned by government statutory corporations and are delivered through either conventional procurement methods or PPP procurement.
Beyond ownership of the facilities, however there are a range of possible roles for private sector involvement. Private sector participation in the development and operation of an expanded convention centre in Sydney could comprise some or all of the following roles:
• Design (including furniture, fittings and equipment)
• Construction
• Financing
• Maintenance and periodic refurbishment (a key aspect of PPPs is the requirement for the private sector to maintain the facility to a high quality)
• Commercial opportunities such as revenue received from conferences, exhibitions and events, office, hotel and retail facilities, restaurants, car parks and advertising
• Operation, with a spectrum of possibilities for involvement in operation including: − Set-up/dismantle − Cleaning − Food and beverage − Security − Management of bookings − Marketing of events − Marketing of the facilities and services.

96
Table 18 presents the spectrum of possible private sector involvement in the delivery of facilities.
An overview of current Australian approaches to involve the private sector is presented in table 19.
Table 18 Delivery options
Delivery option Construct Design Maintain Finance Operate
Construction contract Private Government Government Government Government
Design & Construct Private Private Government Government Government
Design, Build, Maintain,
TransferPrivate Private Private Government Government
Design, Build, Operate
(including or excluding
core services),
Maintain, Transfer
Private Private Private Private Private
•indicatesprivatesectordeliveredthiscomponent * There is joint government and private sector involvement
Source: PwC understanding of facilities based on available public data
Table 19 Comparison of models for private sector involvement
Syd
ney
Con
vent
ion
and
Exh
ibiti
on
Syd
ney
Ente
rtai
nmen
t Cen
tre
Syd
ney
Sho
wgr
ound
Mel
bour
ne C
onve
ntio
n an
d E
xhib
ition
(prio
r to
expa
nsio
n)
Exp
ansi
on o
f Mel
bour
ne
Con
vent
ion
and
Exh
ibiti
on
Mel
bour
ne C
onve
ntio
n an
d E
xhib
ition
(pos
t exp
ansi
on)
Ade
laid
e C
onve
ntio
n an
d
Exh
ibiti
on C
entr
e
Bris
bane
Con
vent
ion
and
E
xhib
ition
Cen
tre
Dar
win
Con
vent
ion
and
E
xhib
ition
Cen
tre
Pert
h C
onve
ntio
n an
d
Exh
ibiti
on C
entr
e
Construction • • • • • • • • • •
Design • • • • • • • • • •
Maintenance • • • • • • • • •
Finance • • •
Commercial revenue • • • •
Operate •* • •

97
Considering this range of activities of private sector involvement, four alternative delivery options for a new or expanded convention and exhibition centre in Sydney are listed below.
• Government ownership and operation involving public sector financing through a government-owned corporation, e.g. Adelaide Convention Centre
• Government ownership with private sector operation involving public sector financing through a government-owned corporation, similar to the current SCEC contract
• Government ownership with private sector operation involving a combination of public and private sector financing through a PPP arrangement, similar to the MCEC contract. Options under this approach may include:
- Private sector providing facilities management (and potentially events management) with no demand risk, receiving monthly or quarterly service payments that are designed to cover cleaning, maintenance, financing and other facilities management costs e.g. MCEC, which also involved an upfront private contribution for leasehold of surrounding commercial land for further development
- Private sector undertaking full operation of facilities and taking a demand risk, e.g. Perth Convention and Exhibition Centre under a lease-owned arrangement, whereby the government is not involved in ongoing operation or selection of event types to be hosted, but assisted to fund construction of the centre.
It is unlikely that the private sector and more specifically lenders, will have appetite for demand risk, given current market conditions especially following the impact of the GFC. This is demonstrated by the private sector’s reluctance to assume demand risk on toll roads and recent rail projects, which may require governments to modify the PPP model for economic infrastructure projects. Moreover, lenders are more conservative with credit approvals and selective with projects that they choose to fund.
A key motivator of maintaining public involvement relates to retaining strategic and planning control with government so that government can achieve the broader social outcome objectives.
There are still advantages of involving the private sector in the procurement of the expanded Sydney Convention and Exhibition Centre project and these potential benefits are explored below.

98
Benefits of private sector participation
In Australia, over the last ten years, there was marked increase in co-operation between governments and private sector to develop, finance and operate an array of economic and social infrastructure ranging from toll roads, water and sewerage treatment plants, sewerage outfall tunnels, power stations, hospitals, schools and prisons; through to defence-related equipment.
These Public Private Partnership (PPP) projects are primarily driven by governments wanting to secure value for money outcomes through risk transfer or sharing; improving quality and efficiency of delivering infrastructure facilities and on-going services to the public; obtaining whole of life cost benefits by considering ongoing maintenance requirements as part of the facility design; and seeking innovation in reducing overall costs of these types of facilities through efficient pricing and commercial opportunities.
These benefits can be accessed through involving the private sector in delivering and financing an expanded convention and exhibition venue through a PPP. Furthermore, the integration of expanded convention and exhibition facilities with retail, commercial and/or residential development will provide opportunities for government to offset some of the expansion and refurbishment costs, as well as contributing to a vibrant and active precinct.
The benefits of private sector participation for the expanded Sydney Conference and Exhibition facility are likely to include:
• Risk transfer: An opportunity to transfer various risks to the private sector such as integrated design, construction and refurbishment, programming and facilitating existing conference bookings, operational, ongoing maintenance and refurbishment as well as risks inherent in various commercial opportunities (e.g. retail, parking, hotel).
• One point of contact: The State will deal with one party to build, operate and maintain the facilities reducing the risk of managing and interfacing with multiple parties. This will reduce interface risk and ongoing administrative costs.
• Innovation: An innovative, integrated design that takes into consideration the urban design and aesthetics of the environment and expanded SCEC, facilitated by a project plan that considers the complexity of a staged development, refurbishment and potential relocation of utilities and infrastructure, within the requirements of continued service delivery.
99
• Flexibility: A facility that can be easily and cost effectively adapted to cater for a broad range of conferences, exhibitions and activities with a particular focus on international events using leading edge technology and approaches.
• Efficiency and integration: Reducing ongoing operations and maintenance costs by introducing efficiencies through sharing and management of resources, e.g. sharing of kitchen facilities for conferences and a hotel.
• Core services: Enhancing the State’s ability to focus on the core activities of attracting and scheduling key international events for the duration of the project term.
• Whole of life costing: Securing value for money through requiring the private sector to design, operate and maintain facilities that result in designs that minimise ongoing costs and extends the life of assets.
• Technology: Obtaining higher levels of private sector innovation and technology in flexibility and conferencing by building it in to the State’s requirements.
• Commercial Opportunities: Reducing the cost of the expanded SCEC to the State through leveraging core private sector skills in commercial development opportunities such as hotels, residential, retail, restaurants, advertising and car parks by granting 99 year leases or granting freehold access over parcels of land.
• Increased utilisation: By providing improved service outcomes, flexible facilities with the latest technologies, the Project is likely to attract the target local and international client base resulting in increased events and resultant revenue.
It is clear that there is benefit in involving the private sector in the delivery of the Sydney Convention and Exhibition Centre. The intention of this report is to consider the qualitative benefits rather than the quantitative benefits and further consideration needs to be given to the quantitative benefits.
Funding options
There is a spectrum of funding options already tested in convention centre development in Australia, from limited private involvement to greater private ownership of the facility. Each offers slightly different allocation of risk and utilise various funding arrangements and are dependent on the particular State government objectives.
There are a broad range of options available to fund the expansion and development of an improved SCEC, ranging from purely public financing to a PPP arrangement. Funding options for the public and private sectors are discussed in table 20.

100
Public sector Private sector
Public sector funding may come from a number
of options:
•Government budget allocation: government
funding may be acquired through federal
and/or state budget allocations where the
government contributes to the cost of the
project through either paying through the
upfront and ongoing costs as its occurred or an
ongoing service payment or through an upfront
capital contribution or a combination of a service
payment or upfront capital contribution
• Incremental tax funding / value uplift:
increase in land value in close proximity
to the convention centre and commercial
developments resulting in increased rates
and taxes
• GST and payroll tax increases: increase in
GST and payroll taxes collected as a result of
increased employment and services provided
by the private sector and increased spent by
international delegates
•Asset divestments: selling of assets or leases
to the private sector
• Infrastructure bonds: allowing companies to
issue tax efficient infrastructure bonds
Where the project is delivered partially or in whole
by the private sector, possible sources of funding
may include:
•Debt: domestic and international debt sources
•Equity sources: project sponsors,
superannuation funds, and institutional
investors.
•Property rights: upfront payment for 99 year
lease or freehold over properties earmarked for
commercial development
Table 20 Public/private sector funding options

101
147 SHFA (2010), Asset Divestment: Information Memorandum, January 2010, available at: http://www.shfa.nsw.gov.au/content/library/documents/B3D856DA-E97E-68BA-DE3A0D306FD68799.pdf
Some of the commercial development opportunities previously identified for an expanded Sydney Convention and Exhibition Centre that can be used to offset the capital cost of the project are likely to include:
• Granting of airspace and development rights for a 5 star 200 bed hotel above the new centre as a percentage of delegates will require high-quality accommodation close to the event. The need for a 4 /5 star hotel is emphasised by the lack of 4/5 star hotel supply post the Olympics compared to Melbourne. The Hotel and the expanded Sydney Convention and Exhibition Centre can gain economies of scale through sharing core facilities such as the kitchen and ballroom, security, maintenance and cleaning.
• Providing 99 year lease over the property which is earmarked for commercial developments to reduce the funding requirement for the project. Commercial developments are likely to include car parking spaces, student apartments due to proximity to UTS, commercial office space and retail developments.
• Through involving the private sector the project is likely to increase utilisation of exhibition space, provide increased quality of design in the Darling Harbour area generating increased uplift in property values and ancillary rental streams compared to conventional procurement by SHFA.
• The project provides a direct link with the commercial office development in Darling Walk providing increased potential for business events and ‘on foot traffic’ is likely to boost retail.
In addition to these opportunities the SHFA is currently undertaking an asset divestment process of some of its key assets as part of the NSW Government’s Mini-Budget announced in 2008, which will provide revenue to the State government which can be used to offset the cost of the expanded SCEC. This process involves the sale of the future lease income from a portfolio of assets including Darling Walk, IMAX Theatre, Sydney Aquarium and Wildlife World, the Harbourside Shopping Centre, Harbourside Car Park, Promontory Car Park (Pyrmont) and six hotels in Darling Harbour and the Rocks.147
These opportunities should be explored with the private sector to reduce the funding requirement of the expanded Sydney Convention and Exhibition Centre. It is unlikely that the State or SHFA will consider these opportunities without private sector involvement.

102
Contributions from government and resulting benefits to the NSW economy
Experience in procuring convention and exhibition facilities indicate that the new or expanded Sydney Convention and Exhibition facility is not likely to be financially feasible on a standalone commercial basis and is likely to require some form of contribution by government. The government contribution can be either in the form of a periodic availability payment for the duration of the project term or an upfront contribution, if private sector delivery is pursued. An availability payment is likely to result in the recognition of a liability on the State’s balance sheet.
The government’s contribution (upfront or ongoing) can be reduced by involving the private sector in the delivery of the project and identifying specific commercial opportunities for the expanded SCEC.
The expansion of the SCEC has the potential to increase economic benefits received by NSW (currently $466 million per annum) by $160 million each year for expansion into the SEC car park, and up to $270 million each year for expansion into the SEC car park and SEC site, as described in the previous chapters.
The annual net cost to government for an expanded SCEC procured through a service payment PPP is estimated at $40 to $60 million. The estimated cost assumes a 30 year PPP project term with an initial capital cost of $500mil which is offset by the realisation of commercial revenue opportunities. The quantum of commercial revenue offset reflects indicative proposals received from the private sector for an expanded SCEC. The cash flows making up the net cost is illustrated in figure 18.
The gross annual Availability Payment reflects the total annual payment to be made by Government for the expanded SCEC. The private sector determine and deliver the commercial opportunities which reduces the gross annual Availability Payment to $115 – 135million. Government receives the income from events which reduces the net cost of the expanded SCEC to $40 – 60 million per annum.
PPP Grossannual
AvailabilityPayment
Service Payment$130 - 150 m
CommercialRevenue
Net Annual AvailabilityPayment
GovernmentAvailability
Payment$115 - 135m
Sydney EventsCentreIncomereceived
Net Annual Costto Government
Net Cost to NSWGovernment
$40 - 60m p.a.
Retail $5 - 6m
Car Parks $11 - 13m
Revenue from events - New facilities $65m
Revenue from events - Existing facilities $10m
Figure 18 Estimated net annual cost of an expanded SCEC procured through a PPP
103
This chapter presents possible risks for delivery of the expanded Sydney convention and exhibition facilities, along with potential allocation under a PPP model.
Risk allocation matrix
As discussed briefly in the previous chapter, delivering expanded convention and exhibition facilities in Sydney through a PPP will allow transfer of investment and other risks from the government to the private sector.
Risk allocation structures for PPPs are based on the principle of allocating risks to the party best able to manage those risks. Key considerations for risk allocation for the expanded SCEC include:
• Identification and allocation design and construction risks – the ability of the State government to transfer the risk of cost and time overruns, both resulting in an increase in the cost of the project. The private sector is best placed to manage the construction programme and cost risk.
• Identification and allocation of key operational and maintenance risks including the facilities management and maintenance risks. The private sector will need to gain comfort, to the extent that it can, with the condition of the existing facilities.
• Identification and allocation of commercial and economic risk which is likely to depend on the risk appetite of the private sector.
• The risk allocation structure needs to be bankable so that it can sustain a combination of worse-case scenarios for the project.
7. Risk allocation

104
Generally, the private sector concession company manages risks through:
• Identification and implementation of processes to mitigate the risks
• Transferring risks, where appropriate, to another party in the consortium (such as the contractor or operator)
• Using external risk management measures such as insurance.
The risk allocation for each project is dependent on the scope of the project, the project specific risks and the risk appetite of the private sector and how it impacts upon the bankability of the project.
Table 21 presents an initial summary of potential risks and possible allocation between government and the private sector for development of an expanded and world class convention and exhibition facility in Sydney. The risk matrix has been derived from guidance provided by the NSW Government relating to privately financed projects and PV guidelines for PPP risk allocation and contractual issues.

105
Tab
le 2
1 P
relim
inar
y ri
sk m
atri
x
Ris
k ca
teg
ory
Des
crip
tio
nP
refe
rred
Site risks
Exi
stin
g st
ruct
ure
(refu
rbis
hmen
t/
exte
nsio
ns)
Ris
k th
at e
xist
ing
stru
ctur
es a
re in
adeq
uate
to s
uppo
rt n
ew im
prov
emen
ts, e
.g. i
t is
not p
ossi
ble
to c
reat
e a
cont
inuo
us fa
cilit
y w
ith th
e ex
istin
g S
CE
CG
over
nmen
t
Site
con
ditio
ns ri
sk
Gro
und
cond
ition
s ar
e di
scov
ered
whi
ch c
ause
con
stru
ctio
n co
sts
to in
crea
se a
nd/o
r cau
se c
onst
ruct
ion
dela
ys, e
.g. a
site
sur
vey
has
reve
aled
the
pres
ence
of s
igni
fican
t util
ities
und
ergr
ound
the
SE
C c
ar p
ark
that
may
hav
e to
be
relo
cate
dG
over
nmen
t / s
hare
d
App
rova
ls
Ris
k th
at n
eces
sary
app
rova
ls m
ay n
ot b
e ob
tain
ed o
r may
be
obta
ined
onl
y su
bjec
t to
unan
ticip
ated
co
nditi
ons
whi
ch h
ave
adve
rse
cost
con
sequ
ence
s or
cau
se p
rolo
nged
del
ay, e
.g. p
lann
ing,
en
viro
nmen
tal a
ppro
vals
Gov
ernm
ent
Envi
ronm
enta
lR
isk
that
the
proj
ect s
ite (e
.g. t
he c
ar p
ark
or e
xist
ing
SE
C s
ite) i
s co
ntam
inat
ed re
quiri
ng s
igni
fican
t ex
pens
e to
rem
edia
teG
over
nmen
t
Ava
ilabi
lity
of s
ite
Ris
k th
at te
nure
/acc
ess
to p
arts
of t
he s
ite c
anno
t be
nego
tiate
d (e
.g. i
f the
site
invo
lves
are
as n
ot
cont
rolle
d by
SH
FA)
Gov
ernm
ent
Design, construction and commissioning risk
Des
ign
Ris
k th
at th
e de
sign
of t
he fa
cilit
y is
inca
pabl
e of
del
iver
ing
the
serv
ices
at a
ntic
ipat
ed c
ost
Priv
ate
part
y w
ill b
e re
spon
sibl
e ex
cept
whe
re a
n ex
pres
s go
vern
men
t m
anda
ted
chan
ge h
as c
ause
d th
e de
sign
def
ect
Con
stru
ctio
n R
isk
that
eve
nts
occu
r dur
ing
cons
truc
tion
whi
ch p
reve
nt th
e fa
cilit
y be
ing
deliv
ered
on
time
and
on c
ost
Priv
ate
part
y w
ill b
e lia
ble
unle
ss th
e ev
ent i
s on
e fo
r whi
ch re
lief a
s to
tim
e or
cos
t or b
oth
is s
peci
fical
ly g
rant
ed u
nder
the
cont
ract
, suc
h as
fo
rce
maj
eure
or g
over
nmen
t int
erve
ntio
n
Com
mis
sion
ing
Ris
k th
at e
ither
the
phys
ical
or t
he o
pera
tiona
l com
mis
sion
ing
test
s w
hich
are
requ
ired
to b
e co
mpl
eted
fo
r the
pro
visi
on o
f ser
vice
s to
com
men
ce, c
anno
t be
succ
essf
ully
com
plet
ed
Priv
ate
part
y, a
lthou
gh g
over
nmen
t will
ass
ume
an o
blig
atio
n to
coo
pera
te a
nd fa
cilit
ate
prom
pt p
ublic
sec
tor a
tten
danc
e on
co
mm
issi
onin
g te
sts
Sponsor and financial
Inte
rest
rate
s pr
e-fin
anci
al c
lose
Ris
k th
at p
rior t
o fin
anci
al c
lose
inte
rest
rate
s m
ay m
ove
adve
rsel
y th
ereb
y un
derm
inin
g bi
d pr
icin
gG
over
nmen
t may
ass
ume
or s
hare
Spo
nsor
risk
Ris
k th
at th
e pr
ivat
e pa
rty
is u
nabl
e to
pro
vide
the
requ
ired
serv
ices
or b
ecom
es in
solv
ent o
r is
late
r fou
nd
to b
e an
impr
oper
per
son
for i
nvol
vem
ent i
n th
e pr
ovis
ion
of th
ese
serv
ices
or fi
nanc
ial d
eman
ds o
n th
e
priv
ate
part
y or
its
spon
sors
exc
eed
its o
r the
ir fin
anci
al c
apac
ity c
ausi
ng c
orpo
rate
failu
re
Gov
ernm
ent
Fina
ncin
g un
avai
labl
eR
isk
that
whe
n de
bt a
nd/o
r equ
ity is
requ
ired
by th
e pr
ivat
e pa
rty
for t
he p
roje
ct it
is n
ot a
vaila
ble
then
and
in th
e am
ount
s an
d on
the
cond
ition
s an
ticip
ated
Priv
ate
part
y
Furt
her fi
nanc
eR
isk
that
by
reas
on o
f a c
hang
e in
law
, pol
icy
or o
ther
eve
nt a
dditi
onal
fund
ing
is n
eede
d to
rebu
ild, a
lter,
reeq
uip
etc
the
faci
lity
whi
ch c
anno
t be
obta
ined
by
the
priv
ate
part
y
Gov
ernm
ent t
akes
the
risk
of s
peci
fic c
hang
es in
law
that
aff
ect t
he
proj
ect d
irect
ly w
here
as g
ener
al c
hang
es in
law
is th
e pr
ivat
e se
ctor
s ris
k
Cha
nge
in o
wne
rshi
pR
isk
that
a c
hang
e in
ow
ners
hip
or c
ontr
ol o
f the
priv
ate
part
y re
sults
in a
wea
keni
ng in
its
finan
cial
stan
ding
or s
uppo
rt o
r oth
er d
etrim
ent t
o th
e pr
ojec
t
Gov
ernm
ent r
isk
as to
the
adve
rse
cons
eque
nce
of a
cha
nge
if it
occu
rs; p
rivat
e pa
rty
risk
that
its
com
mer
cial
obj
ectiv
es m
ay b
e in
hibi
ted
by a
rest
rictiv
e re
quire
men
t for
gov
ernm
ent c
onse
nt to
a c
hang
e
Refi
nanc
ing
bene
fitR
isk
(ups
ide)
that
at c
ompl
etio
n or
oth
er s
tage
in p
roje
ct d
evel
opm
ent t
he p
roje
ct fi
nanc
es c
an b
e
rest
ruct
ured
to m
ater
ially
redu
ce th
e pr
ojec
t's fi
nanc
e co
sts
Sha
red
50:5
0 w
ith G
over
nmen
t
Tax
chan
ges
Ris
k th
at b
efor
e or
aft
er c
ompl
etio
n th
e ta
x im
post
on
the
priv
ate
part
y, it
s as
sets
or o
n th
e pr
ojec
t, w
ill
chan
geP
rivat
e pa
rty

106
Ris
k ca
teg
ory
Des
crip
tio
nP
refe
rred
Operating
Inpu
ts
Ris
k th
at re
quire
d in
puts
cos
t mor
e th
an a
ntic
ipat
ed, a
re o
f ina
dequ
ate
qual
ity o
r are
una
vaila
ble
in
requ
ired
quan
titie
s, e
.g. c
ost o
f IT/
AV
or c
ost o
f mar
ketin
g fo
r eve
nts
to b
e ho
sted
at t
he S
CE
CP
rivat
e pa
rty
unle
ss g
over
nmen
t con
trol
s in
puts
e.g
. cos
t of m
arke
ting
even
ts
Mai
nten
ance
and
refu
rbis
hmen
tR
isk
that
des
ign
and/
or c
onst
ruct
ion
qual
ity is
inad
equa
te re
sulti
ng in
hig
her t
han
antic
ipat
ed m
aint
enan
ce
and
refu
rbis
hmen
t cos
tsP
rivat
e pa
rty
Cha
nges
in o
utpu
t spe
cific
atio
n ou
tsid
e ag
reed
spe
cific
atio
n ra
nge
Ris
k th
at g
over
nmen
t's o
utpu
t req
uire
men
ts a
re c
hang
ed a
fter
con
trac
t sig
ning
whe
ther
pre
or p
ost
com
mis
sion
ing,
e.g
. spe
cific
atio
ns to
add
ress
road
bet
wee
n ne
w a
nd e
xist
ing
site
sG
over
nmen
t
Ope
rato
r fai
lure
R
isk
that
a s
ubco
ntra
ct o
pera
tor m
ay fa
il fin
anci
ally
or m
ay fa
il to
pro
vide
con
trac
ted
serv
ices
to
spec
ifica
tion
Priv
ate
part
y is
fully
and
prim
arily
liab
le fo
r all
oblig
atio
ns to
gov
ernm
ent
irres
pect
ive
of w
heth
er it
has
pas
sed
the
risk
to a
sub
cont
ract
or
Obs
oles
cenc
e or
inno
vatio
n
Ris
k of
the
cont
ract
ed s
ervi
ce a
nd it
s m
etho
d of
del
iver
y no
t kee
ping
pac
e w
ith c
ompe
titio
n an
d/or
pub
lic
requ
irem
ents
, e.g
. if a
faci
lity
is u
pgra
ded
or c
onst
ruct
ed in
the
regi
on th
at is
mor
e in
nova
tive
and
crea
tes
incr
ease
d co
mpe
titio
n fo
r the
exp
ande
d S
CE
C, o
r if t
echn
olog
ical
cha
nges
incr
ease
the
use
of v
irtua
l ev
ents
Priv
ate
part
y ex
cept
whe
re c
ontin
genc
y is
ant
icip
ated
and
gov
ernm
ent
agre
es to
sha
re ri
sk p
ossi
bly
by fu
ndin
g a
rese
rve
Market
Gen
eral
eco
nom
ic d
ownt
urn
Ris
k of
a re
duct
ion
in e
cono
mic
act
ivity
aff
ectin
g de
man
d fo
r the
con
trac
ted
serv
ice
Priv
ate
part
y ex
cept
to th
e ex
tent
that
gov
ernm
ent h
as c
omm
itted
to a
n av
aila
bilit
y pa
ymen
t ele
men
t or a
gree
d to
pro
vide
redr
ess
for i
mpa
ct o
f go
vern
men
t sub
sidi
sed
com
petit
ion
Com
petit
ion
Ris
k of
alte
rnat
e su
pplie
rs o
f the
con
trac
ted
serv
ice
com
petin
g fo
r cus
tom
ers
Priv
ate
part
y ex
cept
to th
e ex
tent
that
gov
ernm
ent h
as c
omm
itted
to
an a
vaila
bilit
y pa
ymen
t ele
men
t or a
gree
d to
pro
vide
ben
chm
arki
ng o
r m
arke
t tes
ting
durin
g th
e pr
ojec
t ter
m
Dem
ogra
phic
cha
nge
Ris
k of
a d
emog
raph
ic/s
ocio
-eco
nom
ic c
hang
e af
fect
ing
dem
and
for c
ontr
acte
d se
rvic
eP
rivat
e pa
rty
exce
pt w
here
gov
ernm
ent a
ccep
ts th
e de
man
d ris
k fo
r th
e pr
ojec
t
Infla
tion
Ris
k th
at v
alue
of p
aym
ents
rece
ived
dur
ing
the
term
is e
rode
d by
infla
tion
Priv
ate
part
y ta
kes
risk
on th
e m
etho
dolo
gy a
dopt
ed to
mai
ntai
n va
lue;
go
vern
men
t sha
res
to th
e ex
tent
of a
gree
d in
dexa
tion
Network and interface
With
draw
al o
f sup
port
net
wor
k
Ris
k th
at, w
here
the
faci
lity
relie
s on
a c
ompl
emen
tary
gov
ernm
ent n
etw
ork,
that
sup
port
is w
ithdr
awn
or
varie
d ad
vers
ely
affe
ctin
g th
e pr
ojec
t, e.
g. C
ityR
ail,
light
rail
or m
onor
ail c
hang
es, o
r cha
nges
to B
ES
ydne
y
role
Gov
ernm
ent w
here
the
chan
ge d
iscr
imin
ates
aga
inst
the
proj
ect
Cha
nges
in c
ompe
titiv
e ne
twor
kR
isk
that
an
exis
ting
netw
ork
is e
xten
ded/
chan
ged/
re-p
riced
so
as to
incr
ease
com
petit
ion
for t
he fa
cilit
y,
e.g.
oth
er N
SW
eve
nt fa
cilit
ies
are
expa
nded
or i
f oth
er v
enue
s in
the
regi
on a
re e
xpan
ded
Priv
ate
part
y ex
cept
to th
e ex
tent
that
gov
ernm
ent r
etai
ns d
eman
d ris
k
Inte
rfac
e w
ith c
ore
serv
ices
Ris
k th
at th
e de
liver
y of
cor
e se
rvic
es in
a w
ay w
hich
is n
ot s
peci
fied/
antic
ipat
ed in
the
cont
ract
adv
erse
ly
affe
cts
the
deliv
ery
of c
ontr
acte
d se
rvic
es, e
.g. i
nter
natio
nal c
onve
ntio
ns a
re n
ot a
ttra
cted
to th
e le
vel
antic
ipat
ed
Priv
ate
part
y ex
cept
to th
e ex
tent
that
gov
ernm
ent p
rovi
des
redr
ess
for
appr
opria
te, d
iscr
imin
ator
y ch
ange
s
Inte
rfac
e w
ith c
ontr
acte
d se
rvic
esR
isk
that
the
deliv
ery
of c
ontr
acte
d se
rvic
es a
dver
sely
aff
ects
the
deliv
ery
of c
ore
serv
ices
in a
man
ner
not s
peci
fied/
antic
ipat
ed in
the
cont
ract
Priv
ate
part
y

107
Ris
k ca
teg
ory
Des
crip
tio
nP
refe
rred
Legislative and government
policy
App
rova
ls
Ris
k th
at a
dditi
onal
app
rova
ls re
quire
d du
ring
the
cour
se o
f the
pro
ject
can
not b
e ob
tain
ed, e
.g. h
eigh
t ap
prov
als
or s
ubse
quen
t ref
urbi
shm
ent o
f the
exi
stin
g S
CE
CP
rivat
e pa
rty
Cha
nges
in la
w/p
olic
y di
rect
ed a
t the
pr
ojec
t
Ris
k of
a c
hang
e in
law
/pol
icy
of th
e St
ate
Gov
ernm
ent o
nly,
whi
ch c
ould
not
be
antic
ipat
ed a
t con
trac
t si
gnin
g an
d w
hich
is d
irect
ed s
peci
fical
ly a
nd e
xclu
sive
ly a
t the
pro
ject
or t
he s
ervi
ces
and
whi
ch h
as
adve
rse
capi
tal e
xpen
ditu
re o
r ope
ratin
g co
st c
onse
quen
ces
for t
he p
rivat
e pa
rty
Gov
ernm
ent:
alth
ough
the
part
ies
may
sha
re th
e fin
anci
al
cons
eque
nces
of c
apita
l cos
t inc
reas
es in
an
agre
ed w
ay, f
or e
xam
ple
by th
e pr
ivat
e pa
rty
mee
ting
a pe
rcen
tage
of t
he c
ost u
p to
a s
peci
fic
limit
and
gove
rnm
ent m
eetin
g an
y ex
cess
Cha
nges
in la
w/p
olic
y no
t dire
cted
at t
he
proj
ect
I som
e ca
ses,
the
risk
of a
cha
nge
in la
w/p
olic
y (a
t wha
teve
r lev
el o
f gov
ernm
ent i
t occ
urs)
whi
ch c
ould
no
t be
antic
ipat
ed a
t con
trac
t sig
ning
spe
cific
) in
its a
pplic
atio
n an
d w
hich
cau
ses
a m
arke
d in
crea
se in
ca
pita
l cos
ts a
nd/o
r whi
ch is
gen
eral
(i.e
. not
pro
ject
has
sub
stan
tial o
pera
ting
cost
con
sequ
ence
s fo
r the
pr
ivat
e pa
rty
Gov
ernm
ent:
alth
ough
the
part
ies
may
sha
re th
e fin
anci
al
cons
eque
nces
of c
apita
l cos
t inc
reas
es in
an
agre
ed w
ay fo
r exa
mpl
e by
the
priv
ate
part
y m
eetin
g a
perc
enta
ge o
f the
cos
t up
to a
spe
cific
lim
it an
d go
vern
men
t mee
ting
any
exce
ss
Reg
ulat
ion
Whe
re th
ere
is a
sta
tuto
ry re
gula
tor i
nvol
ved
ther
e ar
e pr
icin
g or
oth
er c
hang
es im
pose
d on
the
priv
ate
part
y w
hich
do
not r
eflec
t its
inve
stm
ent e
xpec
tatio
nsP
rivat
e pa
rty
Industrial relations
Indu
stria
l rel
atio
ns a
nd c
ivil
com
mot
ion
Ris
k of
str
ikes
, ind
ustr
ial a
ctio
n or
civ
il co
mm
otio
n ca
usin
g de
lay
and
cost
to th
e pr
ojec
t, e.
g. d
urin
g co
nstr
uctio
n or
mai
nten
ance
of t
he e
xpan
ded
SC
EC
faci
lity
Priv
ate
part
y w
ill b
e re
spon
sibl
e ex
cept
whe
re a
n ex
pres
s go
vern
men
t m
anda
ted
chan
ge h
as c
ause
d th
e de
sign
def
ect
Force majeure
Forc
e m
ajeu
re
Ris
k th
at in
abili
ty to
mee
t con
trac
ted
serv
ice
deliv
ery
(pre
or p
ost c
ompl
etio
n) is
cau
sed
by re
ason
of
forc
e m
ajeu
re e
vent
s
Priv
ate
part
y ta
kes
the
risk
of lo
ss o
r dam
age
to th
e as
set a
nd lo
ss o
f re
venu
e, g
over
nmen
t tak
es s
ome
risk
of s
ervi
ce d
isco
ntin
uity
bot
h as
to
cont
ract
ed s
ervi
ce a
nd c
ore
serv
ice
subj
ect t
o in
sura
nce
avai
labi
lity
and
will
nee
d to
arr
ange
alte
rnat
ive
serv
ice
prov
isio
n th
e co
st o
f whi
ch w
ill
be m
et fr
om re
dire
cted
ser
vice
pay
men
ts a
nd (i
f ins
urab
le) a
ny s
hort
fall
mad
e up
from
insu
ranc
e pr
ocee
ds
Asset ownership
Tech
nica
l obs
oles
cenc
eR
isk
that
des
ign
life
of th
e fa
cilit
y pr
oves
to b
e sh
orte
r tha
n an
ticip
ated
acc
eler
atin
g re
furb
ishm
ent
expe
nse
Priv
ate
part
y, b
ut in
cer
tain
hig
h te
chno
logy
pro
ject
s co
sts
may
be
antic
ipat
ed a
nd s
hare
d
Def
ault
and
term
inat
ion
Ris
k of
'los
s' o
f the
faci
lity
or o
ther
ass
ets
upon
the
prem
atur
e te
rmin
atio
n of
leas
e or
oth
er p
roje
ct
cont
ract
s up
on b
reac
h by
the
priv
ate
part
y an
d w
ithou
t ade
quat
e pa
ymen
tP
rivat
e pa
rty
will
take
the
risk
of lo
ss o
f val
ue o
n te
rmin
atio
n
Res
idua
l val
ue o
n tr
ansf
er to
gov
ernm
ent
Ris
k th
at o
n ex
piry
or e
arlie
r ter
min
atio
n of
the
serv
ices
con
trac
t the
ass
et d
oes
not h
ave
the
valu
e or
igin
ally
est
imat
ed b
y go
vern
men
t at w
hich
the
priv
ate
part
y ag
reed
to tr
ansf
er it
to g
over
nmen
tG
over
nmen
t
Sou
rces
: Ada
pted
from
: New
Sou
th W
ales
Gov
ernm
ent (
2006
), W
orki
ng w
ith G
over
nmen
t: G
uide
lines
for P
rivat
ely
Fina
nced
Pro
ject
s, A
ppen
dix
3: R
isk
Tabl
e, D
ecem
ber 2
004,
ava
ilabl
e at
: htt
p://w
ww
.trea
sury
.nsw
.gov
.au/
__da
ta/a
sset
s/pd
f_fil
e/00
09/3
141/
ww
ggui
_1.p
df; a
nd P
artn
ersh
ips
Vic
toria
, ‘R
isk
Allo
catio
n an
d C
ontr
actu
al Is
sues
’, A
ppen
dix
A: R
isk
mat
rix, a
vaila
ble
at: h
ttp:
//ww
w.p
artn
ersh
ips.
vic.
gov.
au/C
A25
7085
0003
5EB
6/W
ebO
bj/R
iskA
lloca
tiona
ndC
ontr
actu
alIs
sues
5-A
ppen
dix/
$File
/Ris
k%20
Allo
catio
n%20
and%
20C
ontr
actu
al%
20Is
sues
5%20
-%20
App
endi
x.pd
f

108
148 NSW Government (2010), News Release, Premier of NSW, ‘$1 million to expand Sydney’s Convention and Exhibition Facilities’, 5 May 2010, available at: http://www.shfa.nsw.gov.au/content/library/documents/66DA43D3-CBFE-F7AC-EA1323936A639D2E.pdf
This chapter presents a proposed way forward for the NSW Government to develop the expanded, world class facility in Sydney.
Proposed way forward
A proposed way forward is described below, though this could be expanded and altered following private sector submissions and outcomes of work such as the SHFA master plan to redevelop and expand NSW’s convention and exhibition facilities (due for completion at the end of 2010)148:
Site options
1 Utilise Darling Harbour as the preferred central location for Sydney’s flagship convention and exhibition facility, with a focus on international events
2 Undertake an economic cost benefit analysis on expanding facilities at the SCEC including using land containing the SEC car park and also potentially the SEC, with integration with the existing facilities to create a large scale, world class venue
Leveraging private sector involvement
3 Utilise a PPP for the development, construction and financing of the expansion, as well as ongoing operation of the expanded facility (as well as potentially maintaining and operating the existing facility) to take advantage of innovation and to reduce the funding requirement for the project through additional commercial investments in the precinct. Prior to proceeding with a PPP, the PPP would need to demonstrate value for money relative to a public sector comparator
4 Combine the existing and expanded facility in the PPP arrangement, so as not to create two competing facilities and optimise private sector involvement and to extract operational synergies that are available through integrated operation
8. Proposed way forward

109
5 Consider the following inclusions in the PPP arrangement, with flexibility for the private sector to propose ideas and incorporate innovation relating to:
– Phase 1 expansion options into the SEC car park or both the SEC car park and SEC site, as well as the private concessionaire potentially maintaining and operating the existing facility
– Undertaking a future Phase 2 SCEC refurbishment or replacement options, either bundled with the Phase 1 PPP, or as a separate project subsequent to the Phase 1 expansion
– The PPP involve either an availability payment, upfront contribution or combination of the aforementioned from the NSW Government to the sector with this being a bid criteria to encourage greater ancillary revenue development to lower the cost to Government
– Consider approaches for the availability payment and the role of SCEC operation undertaken (i.e. whether it includes all or only some of the following: maintenance, security, food and beverage, some event marketing, event booking, etc., noting that most of the operating roles at the existing facility are already outsourced)
– NSW Government retains control over use of the facility, and also strategic planning control of the site and types of events hosted. To facilitate this, and to aid attraction of private sector interest, the NSW Government retain demand risk for number and types of events but the private sector is able to, and is financially incentivised, to attract extra events to increase utilisation
– Ensure new exhibition, convention and entertainment facilities developed in the expansion are flexible, multi-use space and at a minimum comprise:
• 10,000-20,000 m2 dedicated to exhibitions and conventions if the site is developed into the SEC car park site
• 20,000-30,000 m2 dedicated to exhibitions, conventions and entertainment space if the site is developed into the SEC car park site and SEC, with facilities incorporating flexibility to host live concerts for 6,000-10,000 attendees
• Innovation and connectivity, including conjoining the expanded site with the existing SCEC
• Opportunity to include underground car park

110
– The concession would include development rights of the precinct, which may include retail, commercial, residential, hotel – with the height, room number and rating of the hotel reflecting preferences of the private sector operator and NSW Government planning and zoning restrictions. (The merit of a new 5 star 200+ bed hotel sited above the new venue should be further considered, as few delegates choose budget accommodation when attending conferences. Also, post the Sydney 2000 Olympics the extent of new 4-5 star hotel supply in Sydney has been low especially compared to Melbourne. There would be potential for the hotel and the new convention and exhibition centre to share facilities such as a kitchen and ballroom, as well as security, maintenance, cleaning and other ongoing costs, creating a range of capital and operating cost synergies.)
6 Utilise a two-staged tender process (instead of a design competition approach with the bidders having to deliver a design, this approach assumes the bidders will put forward designs):
– Expression of interest process to canvass the private sector’s interest and potential plans, and to shortlist tenderers
– Tender process to select a preferred tenderer (with suggestions from the private sector to shortlist 2-3 parties only given the cost of bidding). This may include final negotiation to refine designs and layouts.
Indicative project timings
Table 22 presents some indicative project timings
After opening of the expansion (Phase 1), the project could progress to Phase 2 with either refurbishment or rebuilding of the existing SCEC site.
Table 22 Indicative timings – Phase 1
MILESTONE ESTIMATED PROJECT TIMING
Release expression of interest June 2011
Shortlist September 2011
Financial close Within 12 months (by June 2012)
Construction start July 2012
Opening Within 3 years (by June 2015)

111
Appendices
Appendix A Acronyms
List of acronyms used in this report
ACC Adelaide Convention Centre
ATEC Australian Tourism Export Council
ATP Australian Technology Park
CBD Central Business District
CCM Convention Centre Management
DCC Darwin Convention Centre
DHCE Darling Harbour Convention and Exhibition Pty Ltd
DIIRD Department of Innovation, Industry and Regional Development
DFO Direct Factory Outlet
DOI Department of Infrastructure
GFC Global Financial Crisis
HKCEC Hong Kong Convention and Exhibition Centre
ICCA International Congress and Convention Association
IPA Infrastructure Partnerships Australia
MCC Melbourne Convention Centre
MCEC Melbourne Convention and Exhibition Centre
MCET Melbourne Convention and Exhibition Trust
MEC Melbourne Exhibition Centre
MPv Major Projects Victoria
MRF Major Repair Fund
NSW New South Wales
PCA Property Council of Australia
PCEC Perth Convention and Exhibition Centre
PPP Public Private Partnerships
Pv Partnerships Victoria
PwC PricewaterhouseCoopers
RAS Royal Agricultural Society
RWA Redfern Waterloo Authority
SBC Sydney Business Chamber
SCEC Sydney Convention and Exhibition Centre
SCG Sydney Cricket Ground
SEC Sydney Entertainment Centre
SGG Sydney Show Ground
SHFA Sydney Harbour Foreshore Authority
Sibos Swift International Banking Operations Society
SOPA Sydney Olympic Park Authority
STC Sydney Turf Club
TTF Tourism Transport Forum
UTS University of Technology, Sydney

112
Appendix B Artist impression of an expanded SCEC
Figure B.1 Illustrations of possible expansion
Source: Confidential stakeholder


8th Floor 8-10 Loftus Street Sydney NSW 2000 T +612 9240 2050 F +612 9240 2055 E [email protected] www.infrastructure.org.au
Infrastructure Partnerships Australia