Embed Size (px)
Citation preview
1 | P a g e
A Work Project, presented as part of the requirements for the Award of a Masters
Degree in Management from the Nova School of Business and Economics.
Booklet 1
Written and Edited by Tiago Miguel Sobreira Rodrigues, #595
A project carried out on the Entrepreneurial Innovative Ventures, with the supervision
of:
Professor Filipe Castro Soeiro.
Date
Monday, June 6, 2011

2 | P a g e
1. EXECUTIVE SUMMARY
2. THE COMPANY
a. Brief History
b. Idea & Technology
i. Technical Specifications and Conception Processes
c. Organization Design – Brand Architecture
d. Executive Team
3. BUSINESS DESCRIPTION – emOve Nano
a. Power Gap
b. Value Proposition
i. nanoCharenvi
c. Mission
d. Mantra
e. Vision
4. BUSINESS ENVIRONMENT
a. Business Scope
b. Market Analysis – PEST
c. Industry Map
5. MARKET SPECIFICS
a. Key Drivers
b. Total Available Market (TAM) Forecast
c. Competitive Analysis
6. STRATEGIC MAPPING
a. Business Model
b. STP Strategy
c. Porter’s 5 Forces – Competition Framework Analysis
d. Marketing Mix
i. Pricing Startegy
7. IMPLEMENTATION PLAN
a. TOWS Analysis
b. Value Chain
8. FINANCIALS & INVESTORS
a. Start-up Funding
b. Financial Analysis
9. RISK ANALYSIS & CONTIGENCY PLAN – Charenvi
10. BOTTOM LINE & RECOMMENDATIONS
11. BIOGRAPHIC REFERENCES
12. APPENDIXES
INDEX

3 | P a g e
EMOVE – Innovative Technologies, Ltd. is a young Portuguese Technological
start-up competing in the alternative energy generation sector through its innovative
concept of electrical production: the ESG (Electric Spherical Generator - International
Patent pending) - a unique generator that absorbs all movements and oscillations,
converting them into electrical energy. Due to the versatility of this disruptive device,
EMOVE nowadays in its organization hub contain several sub-brands in progress, being
aim of this report the development and implementation of EMOVE Nano and its
product innovation – nanoCharenvi – within the emerging portable power market.
By reducing the ESG into such a nano-sized scale and incorporating this nano-
electrical mechanical system(NEMS) with portable regular batteries, EMOVE Nano
proposes itself to introduce the electronics market into a new power era, where future
portable handsets no longer will require the old fashion wall power outlet. In fact
EMOVE Nano’s ambition is to empower people using their own daily body motion and
consequently have their mobile devices generating power anytime anywhere.
Portable Power Market as an emerging arena presents itself as a very business
attractive segment, giving a special attention within this report to the Mobile Phones
and Portable Music Players Markets, where nanoCharenvi solution offers higher
adoption rates and profitability. Being cumulative evaluated in more than US $200
billion and still without any existing competitor leader, portable applications power gap
rapidly entered in EMOVE’s market entering race. Forecasted to penetrate the market in
2014, EMOVE Nano aims to develop a strong joint venture with a major handset
manufacturer as Nokia, reaching the break-even of the initial investment of € 1.25M in
2.5 years.
Key Word – Total Available Market: TAM
EXECUTIVE SUMMARY

4 | P a g e
Brief History
Everything started back in the summer 2008 while Pedro Balas, current CEO,
was crossing Europe by train in the famous European Interail Journey. In one of these
trips between countries he encountered himself with the phone battery dead and without
any possibility to charge it prohibiting him to contact his worried parents back in
Portugal anxious to have any news about their traveler son. Faced with this challenge
his engineer mind started to pump ideas about how to solve the battery dependency and
limitation always linked with his favorite geek devices. At that time he was not
conscious that he was being enlightened by the idea that later in October 2008 would be
behind the creation of this startup when António Matos (former member), Miguel
Caetano and Tiago Rodrigues decided to participate in a business contest – Eday –
where the most creative idea was rewarded with a prize of €2000. At that time the team
known as Charenvi using Pedro Balas idea, won the 3rd
place in the competition
receiving a non-cash award but being right away recognized by the extended audience
& jury on the great potential untapped by this young multidisciplinary team of 20 years
old average. Resilient to prove the value of their idea the team grew to a six members
executive team (new: Carlos Pacheco, Diogo Cruz and João Fernandes) together with a
senior and experienced advisory board, who participated between 2008 and 2010 in the
6 biggest national entrepreneurship awards, launching the today’s emOve – Innovative
Technologies, Ltd. in 26th
November 2009 after winning the EDP Innovation Richard
Branson €50k award (Appendix 1).
Due to the high commitment and persistency shared by EMOVE team, from July
2011 on, the most innovative Portuguese startup 2010 (Ignite Portugal Award) will
integrate the Plug&Play Tech Center in Silicon Valley, California in order to stress not
THE COMPANY

5 | P a g e
only the technology development but as well improve the whole business model
proposition for different sectors and finally raise the required investment next to the best
Business Angels & VCs worldwide.
Idea & Technology
During Pedro Balas frustration moment linked to the dead cell phone battery, he
had an epiphany of creating a portable generator made for using only people’s motion in
order to recharge all sort of mobile devices and handsets. The idea since then evolved
and nowadays EMOVE is proudly the only entity worldwide developing this new
technological concept: The Electric Spherical Generator (ESG). Briefly the ESG is a
self-sustainable machine that produces electricity “consuming” only mechanical energy.
In other words, this generator transforms motion (input) into electricity (output),
exclusively by absorbing movements and oscillations from the external environment
(Appendix 2). Transforming kinetic energy into electricity is an already existing
technology. However it only exists in a 2D format, meaning that the capacity of energy
production is not as efficient as this one proposed by EMOVE. Classic examples of this
energy are the wrist watches which work through the energy captured when people
move during a walk for instance.
This mechanism is constantly being study by our Engineering Department to
ensure that it has the proper behavior, characteristics and settings for each application,
bringing innovation to our company in a daily basis.
EMOVE brings innovation into this field basically due to its spherical structure (3D
format), allowing our generator to capture every tiny motion, harvesting even the lowest
frequencies and converting them into quality electricity, making this a powerful and
clean energy source. Since we are a start-up company, and to avoid replication of our
THE COMPANY

6 | P a g e
products, both technology and its several applications were already secured and
nationally/internationally patented together with EMOVE’s Legal department.
Being a really versatile technology, we can adapt the generator to different sizes
and shapes allowing our venture to explore several different markets. The rule is
everything that moves is able to generate electricity. In addition to ESG versatility,
EMOVE nowadays adopt an umbrella organization design as you can see bellow, in
order to enhance the focus and commitment of the different teams involved.
Organization Design
EMOVE since 2009 mainly due to the ESG technological specifications
motivated the company to redesign its brand architecture into a corporate or umbrella
brand in order to reinforce EMOVE’s brand equity within the different set of activities
and markets for the main stakeholders involved. Therefore and inspired by companies
such as the Virgin Group, EMOVE aspire to expand its range of activity through the
following sectors:
Executive Team
Behind this start-up, is a young multidisciplinary team covering different
managerial and engineering backgrounds, truly dedicated to this venture since 2008.
Mainly due to a lack of professional experiences and on the other hand lack of
technological know-how within some topics, the team integrated a top Strategic
Advisory Board covering both engineering and managerial matters (Appendix 3).
THE COMPANY

7 | P a g e
Power Gap
The demand for energy storage systems that are compact, lightweight, and
powerful is skyrocketing with the worldwide proliferation of all sort portable electronic
devices. For instance just in 2010 according with IDC (International Data Corporation)
more than 1.3 billion mobile devices were sold representing more 18,5% handsets
shipped than in the past year of 20091. Although a great slice of this number is
influenced exclusively by the mobile phone’s industry there is a general growth among
the introduction of all sort of new mobile devices including Camcorders, digital
cameras, Audio-Players, PDAs, notebooks and tablet computers, etc. Moreover on the
other hand mobile devices are also demanding more power and longer runtime due to
the incorporation of more features and more frequent use with wireless networks with
over 85% of these handsets being able to access mobile web in 20112. However
counterbalancing this huge development among the mobile electronics, batteries still
provide a limited amount of energy and have shown slow improvement (10%
improvement/year3).
As a result, a “Power Gap” exists between energy demand and the energy
available in today’s rechargeable batteries. The Power Gap is driven mainly by four
main trends:
Continuous Integration of Power-hungry features;
Increased use of electronics in Mobile Environments (Wi-Fi)
where AC power is not readily available;
1 IDC Worldwide Mobile Phone Tracker, January 27, 2011
2 Gartner, Future Wireless Trends to be Discussed at Gartner Wireless, Networking, & Communication
Summit, April 19-21, in San Diego
3“Neah Power Extending Life in Portable Electronics Devices”: 2
BUSINESS DESCRIPTION – EMOVE Nano

8 | P a g e
Limited improvements in batteries technologies;
Importance of Runtime to End Users;
In addition to this uncontrolled obsession with mobile devices especially felted
among developed countries there is an open window for exploring new technologies
dedicated to portable power which eventually in the future will enable to transform our
devices into entirely self-sustainable objects outlining a close end to the wall chargers
necessity. Furthermore, if an average phone uses the energy equivalent to 32 gallons of
gas a year, and the energy consumed by the mobile phone chargers when they are
plugged but not eventually charging, that could be easily be spared (up to 4380
Wh/year, enough to give you 5200 electric shavers or heat 90 dishes in a microwave)4.
Finally this Power Gap will only continue to widen over the next years unless better
solutions appear, due to the world’s population growth from almost 7 billion now to
over 9 billion in 2050 consuming more than the double daily current energy
consumption5.
Value Proposition
From the previous identified Power Gap, how to store large amount of energy in
batteries for increasingly complex mobile and portable applications is a major
technological challenge, and of particular importance in the area of information and
communication technologies (ICT). EMOVE Nano instead of trying to reinvent the
wheel by incrementing batteries’ storage, adds value inverting the energy question
through its innovative and versatile technology which enables people to empower
themselves from their own energy wasted so far. In other words people’s motion will
4 Suarez, Nicolaz, 2011. “Self-Energy Generating Phone”. 3
5 Discovery Channel , 2011.“Powering the Future”
BUSINESS DESCRIPTION – EMOVE Nano

9 | P a g e
reinvent the dynamics of the industry contributing not only for a more self-sustainable
world but also to a cleaner planet by reducing the toxic waste and energy inefficiency
associated with the traditional wall chargers. Basically instead of looking in how to
harvest more energy and how it will last longer, EMOVE’s value proposition offers the
end user the possibility to be constantly charging the battery by simply walking for
instance, justifying consequently EMOVE Nano’s slogan – “Power Anytime
Anywhere”. Applying the ESG technology to this scenario, EMOVE Nano in its
optimum will add value to the industry through the following product solution:
nanoCharenvi (*Focus of this study) –Through nanotechnology, the ESG can be
reduced into such a small scale that will be able to incorporate any battery (Fig.2)
revolutionizing the whole mobile device’s industry whereas our handsets will no longer
need to be charged. In fact through ESG technology the user’s motion will power the
different range of handsets where this technology is installed transforming them
automatically into self-sustainable gadgets.
Complementary to this value proposition, EMOVE Nano as explained later in
this report, will pursue a B2B2C approach aiming in the first instance of its revenue
model to a major handset manufacturer, which ideally will cover the missing busine ss
units of EMOVE Nano’s Value Chain for a potential joint venture (e.g.: Nokia). In
order to generate a “possible” second stream of revenues (it can be free depending on
Fig2 NanoCharenvi Net (several ESG Microspheres linked) is adapted to the current
batteries, and incorporated normally in its specific handset spot. Ideally the user won’t
notice any difference in his/her self-sustainable portable powered device usage.
BUSINESS DESCRIPTION – EMOVE Nano

10 | P a g e
the profit margin) and simultaneously enhance EMOVE Nano’s brand equity next to the
end consumer, the startup will be ensured by the whole maintenance process.
Mission
The mission shared by the whole EMOVE SGPS is to “Idealize and provide
highly innovative products contributing to a cleaner and self-sustainable world.”
Mantra
“Self-sustainable power.”
Vision
Portable power market leader worldwide by 2020, partnering with the major
handset manufacturers in order to “empower” people with their main future portable
electronics.
Business Scope
Since the ultimate goal of this report is to pinpoint the best entry markets for
EMOVE’s Gadgets products, after narrowing our approach into the business
environment in which this EMOVE’s sub-brand is surrounded, from the many
applications being considered the following industries are the ones deserving further
analyze:
OEM (Original Equipment Manufacturer) Markets for batteries in electronic
devices, being prioritized devices using “premium” rechargeable batteries –
Li-ion and Li-Polymer types;
BUSINESS DESCRIPTION – EMOVE Nano
BUSINESS ENVIRONMENT

11 | P a g e
Portable Power Markets under 500W - These include Mobile Phones,
notebook computers, PDAs, smart cards, Digital cameras, Camcorders,
handheld game devices, portable DVD players, Audio players, etc.;
Battery Charger Market;
Taking this into account from now on in this report, these are the main industries
being evaluated inside out starting by a PEST analysis in order to identify the main
macro factors involved worldwide in today’s markets.
Market Analysis – PEST
Political/Legal
Current Safety Standards which eliminate the option of making batteries larger.
International Air Transport Association regulations prohibit batteries containing more
than 8g of lithium aboard passenger aircraft, and also limit each passenger to only one
spare battery that has to be carried in person, i.e. it cannot be part of checked-in
baggage6.
Common External Power Supply. The European Union in 2009 defined the Common
External Power Supply for use with data-enabled mobile phones sold in the EU, in an
attempt to reduce waste from the number of mobile phone battery chargers. The
introduction of the new universal power standard is estimated to lead to a 50 per cent
reduction in standby energy consumption, an elimination of up to 82,000 tons of
redundant chargers, and a subsequent reduction of 13.6 million tons in greenhouse gas
emissions each year7. Moreover, the use of the power adapter and charging solution is
6 Neah Power Extending Life in Portable Electronics Devices”: 4
7 Florez, Esmeralda & Adolph, Martin, 2010. “ITU-T TechWatch Alert”:5
BUSINESS ENVIRONMENT

12 | P a g e
not limited to mobile phones and addresses a great number of ICT devices. By January
2012, all U.S. cell phones will have a common micro-USB interface that will allow
universal external power chargers to use the port. (Appendix 4)
Economical
According to the Natural Resources Defense Council, most of our daily handsets
are likely to consume the majority of their annual energy in low power modes when the
battery is not being charged, representing on U.S.A. national scale a 4.5 billion
kWh/year of electricity waste associated with a bill of 380 million dollars/year and 3
million tons of CO28. Given the current financial crisis and the different economic
recessions felted, even the smallest contributions for the taxpayer pocket matter
nowadays. Therefore by improving the energy bill health, EMOVE Nano will have a
positive impact once consumers will no longer need to recharge their favorite portable
devices and consequently they can finally put an end to the continuum energy
consumption of their wall chargers.
On the other hand by analyzing the time path of prices of different portable
electronics we can notice that pricing is critical with a general fall in price experienced
amongst the main wattage categories, which obviously must be taken into account
within EMOVE’s pricing strategy. How much the consumer is willing to pay for his/her
power “freedom”?
8 Natural Resources Defense Council, 2003. “Battery Chargers and Energy Efficiency”:2
BUSINESS ENVIRONMENT

13 | P a g e
Social
Due to the great proliferation of different electronic devices with an estimation
of nearly one mobile device per capita by 20159 together with a growing importance
allocated to the runtime for end users, portable power solutions have in fact a huge
opportunity gap to explore. Moreover adding to the equation the “green” & interactive
factor allied with EMOVE’s technology, might end resulting in a positive leverage for
this startup. To illustrate the importance of handsets in people’s life, according to
research consultants Frank N. Magid Associates today’s teens are a generation of cell-
phone users – 90 percent penetration – and mobile phones are consistently ranked at the
top of the “things I can’t live without” pyramid10
.
Technology
Portable technology is replacing many products that were once solely powered
by an AC wall outlet and despite the advances in battery technologies, mobile devices
still suffer from severe energy limitations. Currently, there are only two realistic options
available to continue operation of the portable devices: spend a few hours to recharge
the battery, or carry a replacement battery. Moreover in what concerns to technological
factors affecting EMOVE’s performance, the previously “Power Gap” explanation
illustrates the major issues in the industry where the limited improvements in batteries
technologies mixed with the continuous Integration of Power-hungry features into
electronic products is taking the energy storage capacity to its limit. Therefore poised to
become the next generation power source in order to extend run time, technologies such
as fuel cells, advanced lithium designs, ultracapacitors and nickel zinc are being
9 Cisco Visual Networking Index: Global Mobile Data. Traffic Forecast Update, 2010-2015.
10 MoniThinking, 2010.
BUSINESS ENVIRONMENT

14 | P a g e
developed. On the other hand in what concerns to EMOVE Nano technological
requisites, for the majority of electrical goods nanotechnology has come from a natural
evolution of microtechnology. Nano-electrical mechanical systems are a reality today,
where nanotechnology only represents an arbitrary milestone, as a micro-sized system
works in the same way as a nano-sized system. Virtually all forms of nanotechnology
used in electronics are embedded and are believed to pose a low human health risk and
no additional risk to the environment over micro-technology11
.
Industry Map
To better visualize and conclude with the
business environment section, the picture aside enlighten
us about the main influent and intervenient groups
that EMOVE Nano must take into account before
entering this market and defining its joint venture strategy.
Key Drivers/Requirements
11
Lloyd’s, 2007. “Nanotechnology recente developments, risks and opportunities”. 22 12
Battery Power, 2010. “Resource Guide”
Generic Requirements for the power sources of Portable electronic devices12
Physical Size Environmental Stability Cost Safety Runtime
Suitable with
current handsets
design and
format.
Meets temperature,
humidity, orientation, shock
and vibration requirements.
Proportionally
scales with the
power
demands.
Aligned with the
current safety
standards for
batteries.
Improvement
of the runtime
table
(Appendix 5).
BUSINESS ENVIRONMENT
Fig3
MARKET SPECIFICS
BUSINESS ENVIRONMENT
Table1 In order to guarantee a successful market entry, EMOVE Nano must at least
ensure that its technology is feasible with this range of key aspect.

15 | P a g e
Total Available Market (TAM) Forecast
Since the Portable power is still seen as an “Emerging Technology”, in order to
identify areas of greatest market potential and evaluate the eventual impact of successful
market penetration of EMOVE’s product, the forecasts focus specifically on market
sizes, timing and growth potential, cost sensitivity and a “path to commercialization”.
The forecasts are built from existing portable applications that use premium (i.e.
lithium) batteries, previously highlighted in EMOVE Nano’ business environment,
which can be defined according to the following wattage categories:
<10W – Typical applications include Digital Cameras, PDAs, Portable
Audio, Mobile Phones, Camcorders and Handheld Computers;
11 – 50W – Typical applications include Camcorders, Digital Cameras,
Handheld Computers, Mobile Phones and Notebook Computers;
51 – 500W – Typical applications include Notebook Computers;
These lower-wattage portable power units using already premium batteries can
be seen as the potential markets with a small, but promising, introductory market for
EMOVE Nano. On the other hand closely connected with battery powered devices are
adapters and battery chargers, which are another segment facing cost pressures,
depending on the wattage range, but is only taken into account in the Contingency Plan.
Size, Value & Growth
The devices chosen for this forecast refer to portable devices under 500W, most
under 50W, that use already premium batteries (i.e. Li-ion and Li-polymer) and
therefore are likely to best absorb the price increase linked with the nanoCharenvi
installation. Therefore the nanoCharenvi’s total available market (TAM) is only the
portion of the market that uses premium batteries, not the total market for devices that
use portable, rechargeable batteries.
MARKET SPECIFICS

16 | P a g e
Although the data available13
is not that recent, it definitely outlines the great
growth rates linked with these specific portable ICT devices. In fact currently, according
to the International Data Corporation (IDC) even with the recent global recession, since
2007 the CAGRs increased dramatically amongst the different handset categories
(Appendix 6), estimated in having by 2015 nearly one mobile device per capita14
.
Nevertheless, within the main devices identified above, the largest potential
market for nanoCharenvi remains in the Mobile Phones representing the technology
with highest penetration in developed countries ever (ITU data - 68%15
), being worth in
US$179 billion in 2011 and projected to grow by 13% between 2011 and 2013, in
constant value terms16
. Right after the Portable Media Players segment including
MP3, Mp4 and iPods, appear as the second-largest potential market healthy and vibrant
in spite of a lagging global economy, evaluated by 2011 in US$21,5 billion with the
largest CAGR experienced between 2002-2007 according to iSuppli Corp. A major
driving factor behind this growth is the fact that PMP players take advantage of the
13
Darnel Group Inc., 2003. “ Fuel Cells for Portable Power” 14
Cisco Visual Networking Index: Global Mobile Data. Traffic Forecast Update, 2010-2015 15
Florez, Esmeralda & Adolph, Martin, 2010. “ITU-T TechWatch Alert” 16
Euromonitor International, 2011. “Mobile World Congress 2011”.
2002 2003 2004 2005 2006 2007 CAGR
2.PMP Players 12.6 15.8 38.4 134.2 228.4 249.7 81.7%
6.Camcorders 10 11.5 13.3 15.5 17.8 20.3 15.2%
5.Digital Cameras 7.1 9.5 11.7 15 19.3 25.3 28.9%
1.Mobile Phones 304.6 322.5 343.6 371 408.4 447.2 8.0%
3.Notebooks Computers 33.8 37.1 41.2 47 54 62.5 13.1%
4.PDAs 13.4 16.7 19.7 23.7 29.2 36 21.9%
TOTAL 381.5 413.1 467.9 606.4 757.1 841 17.1%
MARKET SPECIFICS
Table2 Worldwide Premium Battery Market
Total Available Market
(millions of Units)

17 | P a g e
Internet more than other consumer electronic devices, giving users the ability to quickly
and easily sample, acquire and share media. On the other hand similarly with the mobile
phones, these devices are in constant usage generating higher motion periods beneficial
for EMOVE’s tech.
In third place despite the turbulent economic conditions, Mobile Computing
continues to see surging demand resulting from sleeker designs, new form factors, and
pent-up business demand. Notebook PCs will grow at a 19.1% CAGR through 2014,
account for over 291 million units (52% of the computing market), according to In-
stat17
driven largely by improvements in broadband mobile networks, decline in handset
prices, as well as proliferation of Wi-Fi. However from EMOVE Nano perspective this
market is a futuristic and secondary approach due mainly to technological constraints
and lack of existing motion during the usage of these devices.
The remaining segments (Camcorders, Digital Cameras and PDAs) are relatively
small but fast growing, with PDAs and Digital Cameras presenting the best
opportunities with higher market shares and higher suitability with EMOVE’s
technology performance.
Competitive Analysis
The constant need to recharge batteries compromises the mobility and autonomy
of the devices they power. Aware of this, many manufacturers are already involved in
the research for advanced or alternative energy sources that should also be safe, clean
and cheap. Promising technologies exist, although a leader has not yet emerged.
Research on mobile power supplies can be generally grouped in three categories:
17
3Q10 Computing Forecasts: Desktops, Notebook, Netbooks, and MIDs/Tablets.
MARKET SPECIFICS

18 | P a g e
- Incremental advances to current solutions, mainly in the field of Li-ion/Li-
polymer batteries;
- Application of known alternative power supplies (such as photovoltaic, fuel
cells, thermoelectricity, piezoelectricity, (human) movement) to mobile devices;
- Breakthrough developments by applying nanotechnology: cell-sized batteries,
nanoscale fuel cells, nanoscale capacitors, electroactive polymers, dielectric
elastomers, new semiconductor compounds and the use of organic materials;
Since it is such an embryonic arena, with the current data available is hard to
assess competition feasibility and to distinguish real products from only “paper” ideas.
Nevertheless consulting the Appendix 7, we understand why this is such an attractive
opportunity gap with companies such as Nokia and Samsung already trying to address
the “power need” somehow (Appendix 7). Having this players approaching already the
Power Gap could be seen as a major threat, however EMOVE Nano mold this situation
by seeing this players as potential partners, as it can be consulted later in the Value
Chain section, since there is no technological or business conflicts between both sides.
In fact in an initial stage in order to enhance nanoCharenvi’s position within the market,
technologies may even be complementary leveraging and gaining consumers’
confidence over the future handsets.
On the other hand among the existing technologies, the one presenting greater
threats to EMOVE are the Fuel Cell Players due to its proximity to the market.
However the competition between Fuel Cell players is already fierce with more than 25
major developers (Appendix 8) and since in technological terms fuel cells are far from
EMOVE Nano’s Forever Power Free value proposition (unique POD), this leave
EMOVE still with space to develop and prove its solution.
MARKET SPECIFICS

19 | P a g e
Business Model
EMOVE Nano proposes to offer to the modern society an opportunity to
empower people in their daily basis activities by harvesting their precious motion so far
being wasted and consequently allow the end user to become power independent,
bringing the future mobile handsets into a new power era where people have power
anywhere any time.
In order to do so and to turn this value proposition into reality, EMOVE Nano
will pursue a B2B2C approach where the creation of strategic joint ventures with key
intermediaries will be crucial to enhance maximum profitability, since the sale margin
will be fractionated among the different players intervening in EMOVE’s value chain.
Although the process is spread between different entities, EMOVE will strive to hold
intact the ownership of the customer relationship by providing distinguished services
(Product of the Marketing Mix section) to the end user instead of just playing as an
industrial firm. Regarding EMOVE’s B2B section, the start-up will basically provide
the nanoCharenvi units to strategic major mobile device companies which after
installing the product will ensure that the power free device will reach the final
costumer in the store.
STP Strategy
In order to complete this strategic mapping, EMOVE Nano must identify the
geographical target in which this venture has greatest potential for giving the first steps
with a positive output. So that the previous forecasts for worldwide Total Available
Market (TAM) could be broken out into regions, the data presented is derived from a
comprehensive study of the Asia, North America and Europe markets where portable
STRATEGIC MAPPING
20 | P a g e
applications are most used and the end users likely to initially adopt EMOVE’s
technology18
.
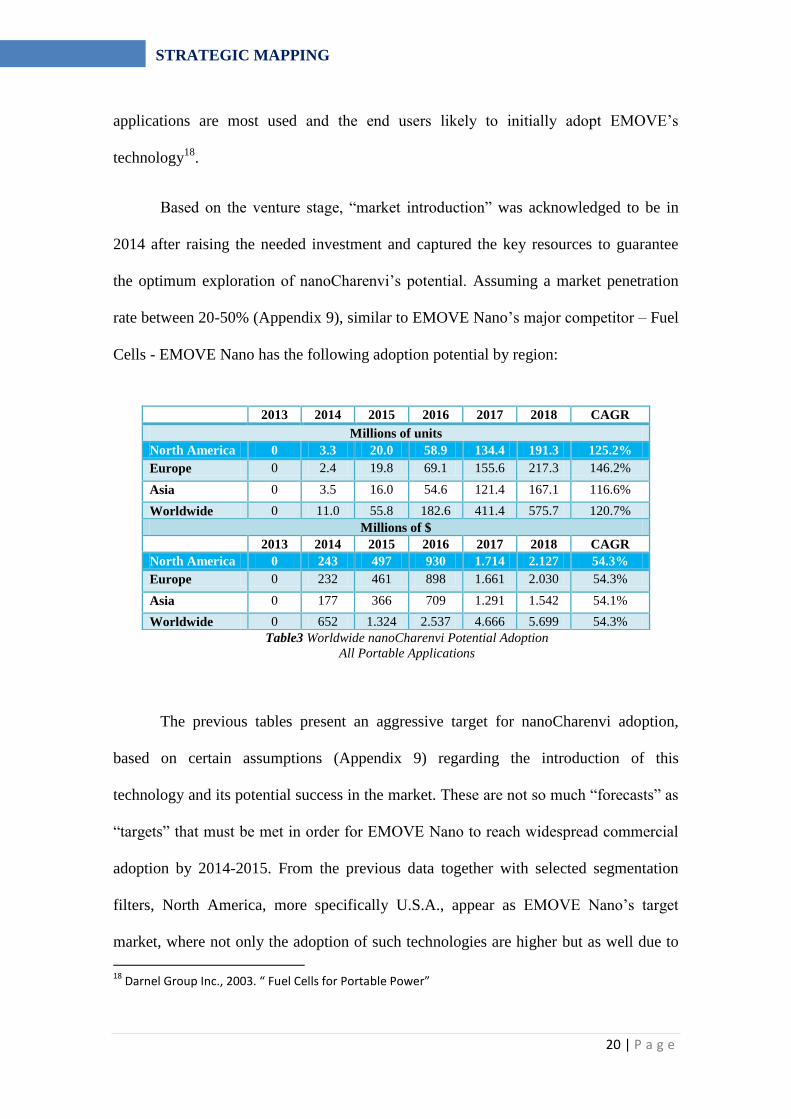
Based on the venture stage, “market introduction” was acknowledged to be in
2014 after raising the needed investment and captured the key resources to guarantee
the optimum exploration of nanoCharenvi’s potential. Assuming a market penetration
rate between 20-50% (Appendix 9), similar to EMOVE Nano’s major competitor – Fuel
Cells - EMOVE Nano has the following adoption potential by region:
The previous tables present an aggressive target for nanoCharenvi adoption,
based on certain assumptions (Appendix 9) regarding the introduction of this
technology and its potential success in the market. These are not so much “forecasts” as
“targets” that must be met in order for EMOVE Nano to reach widespread commercial
adoption by 2014-2015. From the previous data together with selected segmentation
filters, North America, more specifically U.S.A., appear as EMOVE Nano’s target
market, where not only the adoption of such technologies are higher but as well due to
18
Darnel Group Inc., 2003. “ Fuel Cells for Portable Power”
2013 2014 2015 2016 2017 2018 CAGR
Millions of units
North America 0 3.3 20.0 58.9 134.4 191.3 125.2%
Europe 0 2.4 19.8 69.1 155.6 217.3 146.2%
Asia 0 3.5 16.0 54.6 121.4 167.1 116.6%
Worldwide 0 11.0 55.8 182.6 411.4 575.7 120.7%
Millions of $
2013 2014 2015 2016 2017 2018 CAGR
North America 0 243 497 930 1.714 2.127 54.3%
Europe 0 232 461 898 1.661 2.030 54.3%
Asia 0 177 366 709 1.291 1.542 54.1%
Worldwide 0 652 1.324 2.537 4.666 5.699 54.3%
STRATEGIC MAPPING
Table3 Worldwide nanoCharenvi Potential Adoption
All Portable Applications

21 | P a g e
the recent startup integration within the Plug & Play Tech Center in Silicon Valley
where much likely the investment will be made.
5 Forces of Porter Analysis
In order to understand the dynamics of the emergent portable power market and
develop a consistent strategy to augment the captured value by EMOVE Nano nothing
better than decoding the different 5 forces of Porter involved, which can be found in
detail in Appendix 10. From this industry framework examination two major forces
stand out as critical one: Internal Rivalry and Threat of New Entrants & Threat of
Substitutes. Taking into account the embryonic stage of the portable market and its
business attractive, a differentiation strategy appears here reinforced never forgetting of
course the price sensitivity of this arena. Therefore in order to defend its unique position
among eventual competitors and new entrants the following section will outline how
EMOVE Nano aims to circumvent these forces.
Marketing Mix
Product - nanoCharenvi
As previously described, nanoCharenvi consists on scaling the ESG technology
into such a minimal size, which allows the product to become physically suitable to the
interior of the most used handsets’ referred. Through this innovation, portable
applications such as mobile phones and portable music players will be able to absorb
the user’s motion and transform it into storable energy becoming consequently power
independent from the AC grid (Core & Actual Product). In what concerns to the
Augment product, EMOVE Nano will provide two to five years warranty depending on
the handset in question. Moreover in case of damage or malfunction, processes of
STRATEGIC MAPPING

22 | P a g e
maintenance and repair are integrally ensured by EMOVE’s technical team in order to
hold the customer relationships’ ownership.
Place
Since EMOVE Nano will pursue a B2B2C model, the channel of distribution is
strategically allocated to the key chosen intermediaries (B2B) mainly due to a cost
reduction opportunity and a broader spectrum of attack guaranteed by EMOVE partners.
Therefore in order to have nanoCharenvi installed in a wide range of handsets available
for the final costumer, EMOVE must negotiate a set of strategic joint ventures in order
to ensure the fulfillment of the missing business units as discussed within EMOVE’s
Value Chain section. Thus since the Placement is partially dependent on the future
EMOVE Nano’s partner, nanoCharenvi will be ideally available worldwide through the
many place tools of the partner in question. Regarding the commercialization and
installation of nanoCharenvi itself, it will only be pursued next with EMOVE’s
employees.
Promotion
Once again regarding the promotion of nanoCharenvi features and advantages, it
will reside within the partnership of EMOVE with a major handset maker with given
proofs in the Portable devices world. Acquiring this partner’s trust will leverage
drastically EMOVE’s action and adoption rate, by automatically becoming a contagious
product for the Handsets Supply side through mainly word of mouth and PR Marketing.
Furthermore EMOVE Nano will thrive to maintain its integrity as a well-known brand
instead of just an industrial player, through mainly Brand Image, Advertising, Events &
sponsorships and online marketing.
STRATEGIC MAPPING

23 | P a g e
Price
Because EMOVE Nano cannot count on the obsolescence of batteries to create a
demand for nanoCharenvis, competition will come from the value nanoCharenvi vs.
Batteries. In addition to this when considering the potential commercial success of this
emerging technology, a useful scenario is to look at previous technology introductions
and what made them successful. Industries tend to operate like the industry that came
before, and in this case for portable application as it was already referred, the li-ion
battery industry is the best model. NanoCharenvi before competing with Fuel Cells and
other competing emerging technologies, is expected to be competitive with Li-ion, both
in terms of price and performance, although it cannot be simply seen as a substitute for
Li-ion. Since nanoCharenvi do not require a battery charger, the total cost of a battery
and its respective charger needs to be considered when defining the pricing strategy.
The nanoCharenvi will be competing against the combined price of the battery and the
charger, giving it an edge. This is particularly true with applications where the charger
is a significant portion of the price of the total battery pack (such as Digital Cameras
and PDAs); or where the charger is a higher-priced component of the system (such as
Notebook Computers).
2002 2003 2004 2005 2006 2007 CAGR
Camcorders 11.78 10.96 10.15 9.42 8.71 8.08 -12.7%
Battery Charger 5.67 5.55 5.42 5.31 5.23 5.13 -2.2%
TOTAL 17.45 16.51 15.57 14.73 13.94 13.21 -5.4%
Digital Camera 7.07 6.49 6.11 5.61 5.27 4.87 -14.7%
Battery Charger 6.02 5.68 5.36 5.05 4.78 4.51 -5.6%
TOTAL 13.09 12.17 11.47 10.66 10.05 9.38 -6.5%
Mobile Phones 7.22 6.54 5.92 5.36 4.85 4.40 -13.1%
Battery Charger 2.52 2.37 2.22 2.06 1.96 1.84 -6.1%
TOTAL 9.74 8.91 8.14 7.42 6.81 6.24 -8.5%
Notebook
Computers
32.91 31.26 29.50 27.79 26.08 24.42 -10.7%
STRATEGIC MAPPING

24 | P a g e
Looking at the previously elected segment with highest market-entry potential –
Mobile Phones - we can notice that it is as well the segment with the fastest price
decline, with an overall ASPs expected to decrease at 8,5% per year according to
Darnell Group Inc.Nevertheless EMOVE cannot focus exclusively on the current price
of Li-ion or Li-polymer batteries, as pricing is a moving target and the actual added
value allocated to the nanoCharenvi technology, allows the company to explore more
profitable options than by just opting for a reasonable price. In other words, EMOVE
Nano by breaking the power dependency of portable devices has the opportunity to
enter the market with a price-skimming strategy where certainly there will be innovators
and early adopters willing to pay for the premium price (Appendix 9). A prove of that is
exactly the Li-ion battery in its first days where it was twice as expensive as the NiMH,
but it was still successfully introduced because it met the increasing power demands of
a new generation of mobile computing devices.
nanoCharenvi Price decision Scenario for Mobile Phones assuming data of 2007:
Battery Charger 19.35 18.35 17.84 17.10 16.43 15.78 -4.0%
TOTAL 52.26 49.61 47.34 44.89 42.51 40.20 -5.1%
PDAs 9.82 8.91 8.05 6.90 6.63 5.99 -12.5%
Battery Charger 7.26 7.07 6.88 6.70 6.53 6.36 -2.6%
TOTAL 17.08 15.98 14.93 13.60 13.16 12.35 -6.3%
Description Price
Mobile Phone Battery Pack Price 2007 $6.24/Unit
nanoCharenvi Pack for Batteries Price
(Isolated)
$3.75/Unit
nanoCharenvi Battery Price $9.99/Unit
Profit Margin 37.5%
Table4 Worldwide Battery Pack Market by Application,
Li-ion
($/unit)
STRATEGIC MAPPING
Table5

25 | P a g e
Assuming now the CAGR of - 8,5% per year we will have the Battery Pack for
Mobile Phones priced at $4,78/Unit in 2010, allowing EMOVE Nano to explore even
more its pricing strategy and consequent profit margin.
TOWS Analysis
Portable devices under 500W, most
under 50W using premium
Batteries
Opportunities
Power Gap extension;
Exponential growth in the whole
gadgets market;
Portable power as an emerging
market;
Creating autonomous and self-
sustainable gadgets – First Mover;
Joint venture with a major handsets’
top vendor;
Cost of future mobile devices
(3G,4G, etc.) could absorb the
increased cost – cost reduction
opportunity;
Acceleration within the Plug&Play
Tech Center Journey;
Licensing the technology;
Threats
Investment & HRM entrance
timing;
Final technology incremental cost;
Very competitive market arena;
Peak power issues;
Size;
Power Compatibility with all
devices;
Profit margin major dilution through
the joint venture process;
Technology performance in the long
term;
Losing the ownership over the End-
Consumer Relationship;
Strengths
Young entrepreneurial and
multidisciplinary team covering both
several engineering and management
sectors;
SAB and EMOVE partnerships;
International Patented Technology
Pending;
Outstanding Power/Value
Proposition;
Contribution for a better individual
carbon footprint;
Superior Technology according to
the different key drivers;
Brand Awareness (Portugal);
First approach with the elected major
handset producers and start
discussing an eventual joint venture;
Contract a major IP strategist/layer
through Plug & Play in order to seal
the PCT agreement;
Consider the possibility to license
the technology to a major
nanotechnology institute/entity
within Californian hub;
Contact some of the biggest VC
Investors within this market;
Continue to invest in EMOVE’s
brand equity and spread a buzz
strategy to the potential end
consumers;
Outsource cost increasing business
units;
Letter of intention of a major elected
handset manufacturer;
Weaknesses
High initial investment;
Lack of Bargaining power with
suppliers and consumers;
Technical know-how in some
disciplines – outsourcing
dependency;
Uncovered value chain units
(Manufacturing and Distribution);
Joint Venture barriers;
No real prototyping tests in such a
small scale yet;
Access key human capital and
machinery within the Plug&Play
Tech Center reinforcing the
technology performance proofs;
Contact some of the biggest VC
Investors within this market;
Hire key employees through P&P
and EMOVE partners Network;
Explore all major and minor handset
manufacturers in order to set a
contingency plan;
Bootstrap EMOVE Nano’s activity
with other EMOVE’s businesses;
Efficient Cash Management;
IMPLEMENTATION PLAN
3-6 Months Milestones starting from 1st July at Plug & Play
Tech Center.
3-6
Mo
nth
s Milesto
nes startin
g fro
m 1
st July
at Plu
g &
Pla
y
Tech
Cen
ter.
STRATEGIC MAPPING

26 | P a g e
Value Chain
Analyzing EMOVE’s Value Chain is perhaps one of the most important tools of
this report, by identifying the ways how this young startup today, can create value for
the different stakeholders involved, and then by thinking through how this value can be
maximized: whether through superb products, great services, or strategic decisions.
In addition to this the first step to take is to brainstorm the activities that
EMOVE team currently undertakes and its respective cost contribution. In other words
this can be defined as a Current Activity Analysis where the following activities are of
maximum priority at this stage:
Among the main on-going EMOVE’s activities, as illustrated above, practically
100% of EMOVE resources are being invested and allocated in order to generate value
for the targeted stakeholder at this point – Investor. Only after securing the first round
investment, EMOVE will be able to complete its value chain accurately and aim to the
end user.
Nevertheless meanwhile advancements can be made regarding EMOVE’s
following stages where ideally as it was referred already, the venture will seek for a
strategic handset manufacturer partner in order to bring into action its implementation
IMPLEMENTATION PLAN
~12%
~10% ~15%
~15%
Margin~20%
~18%
~10%

27 | P a g e
plan. Seeking for a win-win joint venture with a major player of this industry, appears to
EMOVE as the most feasible, rapid and profitable approach to penetrate the market and
outstand its main competitors. However in order to reach such an agreement with a
dominant handset player, the previous “technology” value chain must be certified and
quality proven by the different entities involved in this industry, justifying the
aggressive allocation of resources to this stage of the startup and respective desired 20%
margin.
Assuming that EMOVE reunites all the key elements to start reaching the big
players of this fierce evolving market, who should integrate EMOVE’s value chain and
leverage its business into a global scale? By deconstructing the value chain of the
potential EMOVE partners, some very well-known brands rapidly are detached from the
rest:
Apart from Nokia and Samsung, which are still largely integrated manufacturers,
handling activities from chip design to branding in-house, companies like Apple offer as
well a great leverage to EMOVE’s business not only because they can still command
IMPLEMENTATION PLAN
Fig3

28 | P a g e
premium prices by specializing in design and branding while outsourcing
manufacturing but as well due to the varied portfolio mobile devices they offer.
(Appendix 11 & 12).
Allocating manufacturing, distribution, design and branding to one of these three
companies will immediately boost EMOVE’s business, allowing the venture to
strengthen the business units where it can actually add value: first to the partner by
providing the best portable power offer and finally to the end user through maintenance
and support.
Start-up Funding
Since its first appearance in 2008, EMOVE SGPS have been bootstrapping all its
resources in order to ensure progress and improvement demonstrating EMOVE’s team
commitment and motivation to thrive with this venture worldwide among the different
business units (EMOVE Waves & EMOVE Nano, 2011). Fortunately, this effort has
been rewarded not only through business contests cash/non-cash awards but as well as a
recently sponsorship of RESUL for the following journey taking place in Silicon
Valley.
Summing up, EMOVE managed to gather so far €139.050 (excluding Non-Cash
Awards) for this initial stage which was always wisely managed, allowing the team to
self-finance its stay in Silicon Valley and develop the first pre-industrial ESG
prototypes together with all the operational costs linked to this activity. Nevertheless for
the following stages, is inevitable to incur in equity financing since at this point debt
financing doesn’t presents a good alternative. It is appropriate to mention as well that
IMPLEMENTATION PLAN
FINANCIALS & INVESTORS

29 | P a g e
EMOVE partners still have 100% ownership of the company, a fact well-seen by
Silicon Valley VCs.
Financial Analysis
Considering now EMOVE Nano Financials alone, assuming its “Market
introduction” in 2014 with an adoption rate between 20-50%, this sub-brand will require
a capital increase of €1.250.000 which will be ideally raised through a Venture Capital
in order to fulfill not only the financial resources but as well human resource though its
business Network. EMOVE Nano within this turbulent and growing arena, presents
itself with a highly profitable business proposal for future investors, ensuring the
payback of the initial investment in 2.5 years.
Table 6
Capital opportunity cost (rate) 10%
Net present value 18.873.119
Internal Profitability (Rate) 906%
Payback Period Nº Years: 2 Nº Months: 6
All the main business ratios appear as solid, benefiting all the eventual
stakeholders that will embark with EMOVE in this Journey towards Power
Independency:
Table 7 Year 1 Year 2 Year 3 Year 4 Year 5
Return on equity -1,5% -183,4% 76,5% 79,8% 59,9%
Return on sales - - 66,5% 67,7% 66,6%
Return on assets -0,2% -7,2% 49,4% 56,8% 46,4%
Financial
autonomy
10,4% 3,9% 64,6% 71,2% 77,5%
The respective assumptions and the detailed financial analysis can be found over
the Appendix 14.
FINANCIALS & INVESTORS

30 | P a g e
According to this report, within the emerging Portable Power market, EMOVE
Nano proposes to enter with a very promising value proposition without margin for
further competition if the technology proves it value when scaled into such a Nano
metrical size. However such value proposition appears as well linked with some
reasonable risks that the startup must take into account in order to delineate a
contingency plan. Just like sir Richard Branson once said: “One thing is certain in
business: things will go wrong. So when you first start a business, one of your priorities
should be emergency planning.”
In addition to this EMOVE Nano, identified the following main risks that can
slow down the business or ultimately require a different implementation plan:
Risk Risk Assessment Contingency Solution
Technology not ready
yet for a Nano scale;
Moderate
Both these two situations force
EMOVE to opt its secondary
approach to the portable
market – Charenvi. Not only it
is easier in technological terms
but as well less initial
investment is required.
Appendix 13
Lack of investment;
Moderate
Joint Venture fail with
mentioned companies;
Moderate
Negotiate a minor position
with mentioned companies. If
it’s not the situation deal the
contract with a minor handset
manufacturer. Worst scenario -
license the technology to the
other company.
RISK ANALYSIS & CONTIGENCY PLAN
Table8

31 | P a g e
Wrapping up taking into account this report and the sooner Silicon Valley
opportunity, EMOVE Nano should be definitely object of study during that trip, not
only because great Nano technological progresses are being done in that specific region,
but as well the chances of reaching either investment and/or partner increase
dramatically. On the other hand, assuming a negative scenario of lack of support, a
contingency solution of a license agreement is also more feasible representing a faster
source of revenues to bootstrap other EMOVE business units. Appendixes reading are
truly recommended.
Articles Published in Journals, Magazines and Websites
IDC Worldwide Mobile Phone Tracker, January 27, 2011
Gartner, Future Wireless Trends to be Discussed at Gartner Wireless,
Networking, & Communication Summit, April 19-21, in San Diego
Neah Power Extending Life in Portable Electronics Devices”
Suarez, Nicolaz, 2011. “Self-Energy Generating Phone”
Florez, Esmeralda & Adolph, Martin, 2010. “ITU-T TechWatch Alert”
Natural Resources Defense Council, 2003. “Battery Chargers and Energy
Efficiency”
Cisco Visual Networking Index: Global Mobile Data. Traffic Forecast Update,
2010-2015.
Lloyd’s, 2007. “Nanotechnology recente developments, risks and opportunities”.
Battery Power, 2010. “Resource Guide”
Darnel Group Inc., 2003. “ Fuel Cells for Portable Power”
Euromonitor International, 2011. “Mobile World Congress 2011”.
The Boston Consulting Group Inc., 2005.”The Future of Mobile Handset”.
Rodriguez, Narseo; Hui, Pan. “Exhausting Battery Statistics”
Electronics Takeback Coalition. “Facts and figures on e-Waste and Recycling”
ICT, 2010. The world in 2010: “The rise of 3G”.
Dimitrov, Krassen, 2007. “Charging of Batteries through Human Motion: First
Principle Analysis”
Books and Book Chapters
3rd edition of "Batteries in a Portable World - A Handbook on Rechargeable
Batteries for Non-Engineers"
5th
Edition of “Start your own business – the only startup book you’ll ever need
”
BOTTOM LINE & RECOMMENDATIONS
BIOGRAPHICA REFERENCES

32 | P a g e
Appendix 1 – Entrepreneurship & Innovation Awards
Contest Year Result Award
2008
3rd
Place
Internship at Xerox Portugal
2009
2nd
Place
€5.000
2009
Semifinalist
Executive Training in
Entrepreneurship and Startups
Management (32 hours),
sponsored by IAPMEI,
Inovcapital and UNL in €2.750
2009
Winner
€50.000 & Partnership with
EDP Inovação
2010
Most Innovative
Portuguese Start-
up 2010
Business Network and Silicon
Valley Proposal through
Leadership Business
Consulting
2010
Track finalist
within the
“Sustainable
Energy &
Transportation
Systems sector”
Networking and Brand
Awareness/Equity
2011
Bank Sponsorship Executive Training on Start-up
Management
2011
LBC Selected
Portuguese Start-
up
EDP P&P Spot Sponsorship -
€6.500
RESUL Exclusive Sponsorship
- €77.550
Young Channel + BBVA +
Ericeira Surf Shop Non-cash
sponsorships
APPENDIXES

33 | P a g e
Appendix 2 – ESG Brochure and Prototypes
This generator can be dismembered in three parts:
1. The sphere with incrusted magnets
2. The roll system
3. The conductive wire.
Prototype nº Tests Size ø
Prototype1
2Wh
30 cm
Prototype2
50Wh
15 cm
Pre-Industrial Prototype 3
*Under Construction
131Wh
20cm
APPENDIXES

34 | P a g e
Appendix 3 – EMOVE Managing Partners & SAB of Management and
Engineering
Managing Partners
APPENDIXES

35 | P a g e
Appendix 4 - Common External Power Supply
The European Union in 2009 defined the Common External Power Supply for
use with data-enabled mobile phones sold in the EU, in an attempt to reduce waste from
the number of mobile phone battery chargers. Closely connected with battery powered
devices are adapters and chargers. When replacing a mobile phone, the user is usually
obliged also to replace its charger, which is often not compatible even within the
product line of the same manufacturer. The growing pile of unused chargers causes a
great amount of unnecessary electronic waste and inconvenience to users. As part of its
work on ICT and climate change, the International Telecommunication Union’s
telecommunication standardization sector (ITU-T) is progressing in the approval
process for a technical standard describing an energy-efficient one-charger-fits-all new
mobile phone solution. “Universal power adapter and charger solution for mobile
terminals and other ICT devices” provides high-level requirements for a universal
power adapter and charger solution that will reduce the number of power adapters and
chargers to be produced and recycled by widening their application to more devices and
increasing their lifetime. This solution also aims to reduce the energy consumption and
to increase energy efficiency. The introduction of the new standard is estimated to lead
to a 50 per cent reduction in standby energy consumption, an elimination of up to
82,000 tons of redundant chargers, and a subsequent reduction of 13.6 million tons in
greenhouse gas emissions each year. Moreover, the use of the power adapter and
charging solution is not limited to mobile phones and addresses a great number of ICT
devices. By January 2012, all U.S. cell phones will have a common micro-USB
interface that will allow universal external power chargers to use the port, CTIA
Chairman Dan Hesse announced at a keynote at CTIA here today.
APPENDIXES

36 | P a g e
Appendix 5 – Portable Applications/ Power Requirements Assumptions
Runtime
(Hours)
Wh Requirements
(Batteries)
Mobile Phones 4.0 5.5Wh
PDAs/Handhelds 3.0 7.5 Wh
Notebook Computers 3.0 38 Wh
Digital Cameras 2.0 9 Wh
Camcorders 2.0 15 Wh
Portable Audio Devices 4.0 9 Wh
Source: Fuel Cells Final, Darnell Group Inc.
Appendix 6 - Global mobile statistics 2011
5.3 billion mobile phone subscriptions by the end of 2010 ( 77% of current
population);
Vendors shipped a total of 1.39 billion handsets on a cumulative worldwide basis
in 2010, up 18.5% from the 1.17 billion units shipped in 2009.
The mobile network will break the electricity barrier in more than 4 major regions
by 2015.
There will be nearly one mobile device per capita by 2015.
The worldwide mobile phone market grew 17.9% in the fourth quarter of 2010
(4Q10), a new quarterly high driven by smartphones.
IDC believes the worldwide mobile phone market will be driven largely by
smartphone growth through the end of 2014. Feature phone users looking to do
more with their devices will flock to smartphones in the years ahead. This trend
will help to drive the smartphone sub-market to grow 43.7% year over year in 2011.
Half a billion people accessed mobile Internet worldwide in 2009.
The number of Internet users has doubled between 2005 and 2010 (2 billion users)
APPENDIXES

37 | P a g e
Appendix 7 – Competitive Analysis
Self-Powered Cell Phones
Company/Product Source of Power Self-Powered
Level
Price
Samsung Blue Earth
Solar
AC Grid
dependent
€239
Nokia’s Solar Eco Concept
Solar
AC Grid
dependent
n/a
ModeLabs YoYo Concept
Solar & Kinetic
AC Grid
dependent
n/a
Celsius X VI II Papillon
Kinetic
AC Grid
dependent
$275,000
Phone powered by sound
Sound Vibration -
piezoelectric
AC Grid
dependent
n/a
Umeox Solar-Powered
Apollo Cell Phone
Solar
AC Grid
dependent
n/a
Ulysse Nardin Chairman
Luxury Hybrid Smart Phone
Kinetic
AC Grid
dependent
$12,800 to
$49,500
Puma, LG, Motorola, ZTE,
etc
Prototyping
APPENDIXES

38 | P a g e
Appendix 8 – List of major Fuel Cell Players
Portable Fuel Cell Companies
Name Origin Country
AVISTA LABS U.S.A.
BALL AEROSPACE &
TECHNOLOGIES
U.S.A.
BALLARD POWER SYSTEMS INC. Canada
CASIO Japan
DCH TECHNOLOGY U.S.A.
ENABLE FUEL CELL U.S.A.
DIRECT METHANOL FUEL CELL
CORP.
U.S.A.
ELECTRIC FUEL U.S.A.
GINER ELECTROCHEMICAL
SYSTEMS, LLC
U.S.A.
H POWER/PLUG POWER U.S.A.
HYDROGENICS CORP. Canada
IDATECH CORP. U.S.A
LYNNTECH INDUSTRIES LTD. U.S.A.
MANHATTAN SCIENTIFICS INC. U.S.A
MECHANICAL TECHNOLOGY
INC./MTI MICRO FUEL CELLS
U.S.A
MEDIS TECHNOLOGIES U.S.A.
MOTOROLA LABS U.S.A.
NEC Japan
NUVERA FUEL CELLS U.S.A.
PANASONIC TECHNOLOGIES U.S.A.
POLYFUEL U.S.A.
SAMSUNG ADVANCED INSTITUTE
OF TECHNOLOGY
Korea
SANYO ELECTRIC CO. LTD. Japan
SMART FUEL CELL GmbH Germany
SONY Japan
TOSHIBA Japan
TRIMOL GROUP INC. U.S.A.
YUASA CORP. Japan
* This section profiles the major developers of fuel cells for portable products. Because
there are many companies doing research and development, and so few actual
“commercial” suppliers, most of the companies listed here are not true fuel cell
“manufacturers”, in the sense of developing, manufacturing and selling commercial
products. Some companies have prototypes only, or limited manufacturing, or a
partnership with the government or a company to develop a fuel cell for their product.
Other companies manufacture portable devices and/or batteries, and have a department
that is developing fuel cell products for an anticipated future market.
APPENDIXES

39 | P a g e
Appendix 9 - Worldwide nanoCharenvi Potential Adoption Assumptions
Several factors have gone into producing these “Potential Served Available Markets”.
Among the economic assumptions:
1. The TAM can be parsed into the following Moore’s Product Life Cycle stages:
Innovators, Early Adopters, Late Majority, and Laggards. The adoption rate will
evolve gradually per stage as seen bellow:
2. Economic Assumptions based on nanoCharenvi best alternative - Fuel Cells
Assumptions ( Source: Fuel Cells Archive)
3. If the rate of improvement is 20% between doubled quantities, then the learning
percent would be 80% (100-20=80);
4. The first (maximum) premium pricing is 120% over Li-ion pricing;
5. The price premium the Early Majority is willing to pay is 20% over Li-ion
pricing;
6. Setting an appropriate “target” price is necessary to ensure successful
commerciallization, and this price is different from the initial “introduction”
price that gets the technology accepted by the Innovators and Early adopters as
explained during the Pricing Strategy Section;
APPENDIXES
40 | P a g e
Appendix 10 – 5 Forces of Porter
Internal Rivalry
As an emergent industry besides its huge potential and market size, guaranteeing
that the future mobile handsets will be 100% self-sustainable is still seen more as an
idea than as a real tangible product. Anyway as previously referred several times,
battery technology is lagging far behind the power requirements of the modern power-
hungry portable devices. In addition to this, several players have already started to
exploit and define their position within the Power gap opportunity, through different
technologies as it was explained during the Competitive Analysis. However nowadays,
if we had to elect one leading technology despite all the weaknesses when compared
with the nanoCharenvi approach, the most promising technology to bridge this power
gap is fuel cells, which generate power by the electromechanical conversion of fuel.
Even though no player holds such as disruptive offer as EMOVE does by developing a
device which breaks entirely the power dependency rule. Therefore the key formula to
thrive in this tough industry is through a differentiation strategy rather than an approach
focused on prices, where the key drivers/requirements such as quality, reliability and
self-sustainability are prioritized suggesting a competition for market share on a non-
price dimension. On the other hand, since there is still no leading players, EMOVE
previews a fierce race among the current firms to see who actually develops a capable
product in order to join forces with a major handsets maker, assuming that none of these
entities possess the whole business units in their value chains.
In addition to this, EMOVE in order to outstand the other players must dedicate
to its R&D process so that a truly differentiated product with the expected optimal
APPENDIXES
41 | P a g e
results becomes reality, enhancing the startup’s market share exponentially at a global
scale within the TAM previously studied.
Bargaining Power of Suppliers
Admitting already a commercial stage for EMOVE Nano, the suppliers are quite
limited in terms of bargaining power due to increased commoditization of the raw
materials needed for nanoCharenvi’s development. Since this product will ideally
integrate the next billions generation of handsets, EMOVE will outsource the
production unit in order to leverage its access to greater economies of scale reducing at
the same time the bargaining power of the main suppliers. Optimally in the future, such
business units might be vertically integrated by this venture which will reinforce even
more EMOVE’s bargaining power.
However, today the bargaining power still resides on the supplier side, as
EMOVE requires resources and raw materials that are not concentrated in only one
supplier, allowing the manufacturer of this stage to exert greater market power
intensified by the inexistence of economies of scale.
Bargaining Power of Customers
EMOVE Nano’s business model will pursue a B2B2C approach which will force
the venture to deal in a first instance with other businesses, ideally a major handset
maker which covers the main business units lacking in EMOVE’s value chain.
Therefore customers have large bargaining power over manufacturers, since a major
part of the total nanoCharenvi sales is made up of large volume buying from businesses.
In addition, consumers also have bargaining power in terms of dictating demand and
buying preferences.
APPENDIXES

42 | P a g e
Consumers preference for mobility and wireless connectivity at low cost resulted
in the great proliferation of the portable applications already described. In addition,
continued demand for cheaper costs lead to aggressive pricing which will only be
possible by bargaining EMOVE’s position with the elected handsets’ partner. Once
again, the buyer bargaining power will evolve over the different EMOVE’s stages, from
a lower market power in an introductory stage into a more competitive scenario where
EMOVE’s technology will conquer its appropriate value forcing the costumer to accept
the pricing strategy as a trade-off of a win-win situation.
Threat of New Entrants & Threat of Substitutes
As we visualize from the Total available market forecasts, the portable power
market is emerging opening a great opportunity for profitable and sustainable firms.
However besides its attractiveness, transforming a portable device such as a mobile
phone into a power self-sustainable device, lead potential entrants into very complex
technological challenges where reliability, durability and quality will constitute key
decision maker drivers. Moreover apart from the main technological constraints, this
sector presents as well great barriers regarding the initial investment needed and/or the
association with strategic handsets makers in order to cover the different missing
business units within their value chain. Therefore in order to avoid market share erosion
and the revenue destruction effect, EMOVE must ensure not only a competitive proof of
technological results but also an initial partnership with a key mobile devices player.
In fact there are already a great range of interesting products thriving to wreak within
the portable power market, however among them only a few will end entering the
market due to the presented high initial barriers for such small players as startups.
APPENDIXES

43 | P a g e
EMOVE Nano counter attacks this question by offering to the market a unique solution
truly differentiated from its competitors where no-one else so far was able to detain the
handsets power free proposition.
Appendix 11 – Top five mobile Phone manufacturers, by 2010 global sales
according to Strategy Analytics
Rank Vendor Unit shipments Market share
1 Nokia 453.0 million 33.3%
2 Samsung 280.2 million 20.6%
3 LG 116.7 million 8.6%
4 RIM 48.8 million 3.6%
5 Apple 47.5 million 3.5%
Others 413.8 million 30.4%
Total 1360 million 100%
APPENDIXES

44 | P a g e
Appendix 12 - Top five mobile smartphone manufacturers, by 2010 global
sales according to IDC
Rank Vendor Unit shipments Market share Annual sales growth
1 Nokia 100.3 million 33.1% 48.2%
2 RIM 48.8 million 16.1% 41.4%
3 Apple 47.5 million 15.7% 89.2%
4 Samsung 23 million 7.6% 318.2%
5 HTC 21.5 million 7.1% 165.4%
Other 61.5 20.3% 88.7%
Total 302.6 million 100.0% 74.4%
APPENDIXES

45 | P a g e
Appendix 13 – Contingency Plan: Charenvi
Charenvi – External Portable Charger conceived and designed to absorbed
people’s wasted kinetic energy during a simple walk or run, and transformed into usable
energy that later will power all sort of handsets. In this scenario, the TAM would be
considering only the battery chargers, which still have an attractive business
opportunity, however with a fiercer competition.
Portable power units (25-200W) segment include:
– Back-up Power;
– Recreational, outdoor products for camping, etc.;
– Battery Chargers;
– Adaptors;
2004 2005 2006 2007 2008 2009 CAGR
North America 0,08 0,1 0,2 0,2 0,3 0,4 38,0%
Europe 0,07 0,1 0,1 0,2 0,2 0,3 33,8%
Asia 0,05 0,07 0,09 0,1 0,2 0,2 32,1%
Worldwide 0,2 0,3 0,4 0,5 0,7 0,9 35,1%
APPENDIXES

46 | P a g e
Appendix 14 – EMOVE Nano’s Financials
Labour Costs
Year 1 Year 2 Year 3 Year 4 Year 5
Total Total Total Total Total
Management 0 6.036 6.036 9.054 271.620
Technical 0 7.545 7.545 11.318 418.748
Commercial 0 0 0 0 264.075
Site supervision 0 0 2.515 2.515 55.330
Others 0 0 0 0 35.210
Total 0 13.581 16.096 22.887 1.044.983
Income Statement
Year 1 Year 2 Year 3 Year 4 Year 5
Costs 1.900 81.316 2.122.745 10.387.221 20.420.766
Cost of Goods Sold And Raw Materials 0 70 210 1.427 17.128
Outsourced Supplies and Services 1.800 13.840 13.900 13.900 13.900
Labour costs 0 13.581 16.096 22.887 1.044.983
Other Costs 100 53.825 2.092.539 10.349.008 19.344.756
Revenues 0 0 6.343.400 32.115.350 61.196.238
Sales of Products and Goods 0 0 6.593.400 34.615.350 66.196.238
Sales of Services 0 0 -250.000 -2.500.000 -5.000.000
Other Sales 0 0 0 0 0
EBIT -1.900 -81.316 5.821.593 29.969.833 56.242.030
NET PROFIT -1.900 -81.316 4.220.655 21.728.129 40.775.472
Financing Plan
Year 1 Year 2 Year 3 Year 4 Year 5
Own Capital 127.550 0 1.250.000 0 0
Medium/Long term Payables 0 0 0 0 0
Short term payables 0 0 0 0 0
TOTAL FINANCING 127.550 0 1.250.000 0 0
APPENDIXES

47 | P a g e
Treasury Budget
Year 1 Year 2 Year 3 Year 4 Year 5
Total income 127.739 2.191 2.529.252 12.872.857 44.724.219
Total disboursements 1.926 81.558 1.095.964 7.136.887 20.751.799
Cashflow 125.813 -79.367 1.433.288 5.735.970 23.972.420
Cash at beginning of period 0 125.813 46.446 1.479.734 7.215.704
CASH AT END OF PERIOD 125.813 46.446 1.479.734 7.215.704 31.188.125
Project Profitability Analysis
Capital opportunity cost (rate) 10%
Net present value 18.873.119
Internal Profitability (Rate) 906%
Payback Period Nº Years: 2 Nº
Months: 6
APPENDIXES