Embed Size (px)
Citation preview
A joint newsletter of the Statistical Computing & Statistical Graphics Sections of the American Statistical Association
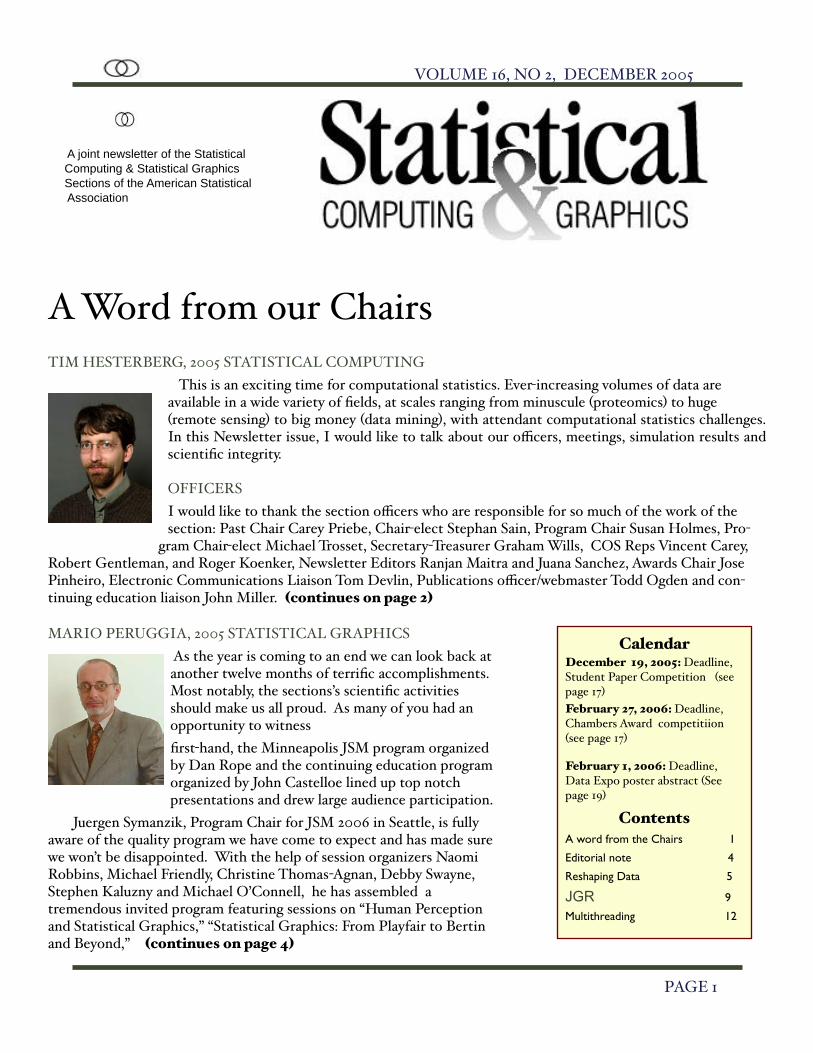
A Word from our Chairs TIM HESTERBERG, 2005 STATISTICAL COMPUTING
This is an exciting time for computational statistics. Ever-increasing volumes of data are available in a wide variety of fields, at scales ranging from minuscule (proteomics) to huge (remote sensing) to big money (data mining), with attendant computational statistics challenges. In this Newsletter issue, I would like to talk about our officers, meetings, simulation results and scientific integrity.
OFFICERSI would like to thank the section officers who are responsible for so much of the work of the section: Past Chair Carey Priebe, Chair-elect Stephan Sain, Program Chair Susan Holmes, Pro-
gram Chair-elect Michael Trosset, Secretary-Treasurer Graham Wills, COS Reps Vincent Carey, Robert Gentleman, and Roger Koenker, Newsletter Editors Ranjan Maitra and Juana Sanchez, Awards Chair Jose Pinheiro, Electronic Communications Liaison Tom Devlin, Publications officer/webmaster Todd Ogden and con-tinuing education liaison John Miller. (continues on page 2)
MARIO PERUGGIA, 2005 STATISTICAL GRAPHICS As the year is coming to an end we can look back at another twelve months of terrific accomplishments. Most notably, the sections’s scientific activities should make us all proud. As many of you had an opportunity to witness first-hand, the Minneapolis JSM program organized by Dan Rope and the continuing education program organized by John Castelloe lined up top notch presentations and drew large audience participation.
Juergen Symanzik, Program Chair for JSM 2006 in Seattle, is fully aware of the quality program we have come to expect and has made sure we won’t be disappointed. With the help of session organizers Naomi Robbins, Michael Friendly, Christine Thomas-Agnan, Debby Swayne, Stephen Kaluzny and Michael O’Connell, he has assembled a tremendous invited program featuring sessions on “Human Perception and Statistical Graphics,” “Statistical Graphics: From Playfair to Bertin and Beyond,” (continues on page 4)
CalendarDecember 19, 2005: Deadline, Student Paper Competition (see page 17)February 27, 2006: Deadline, Chambers Award competitiion (see page 17)
February 1, 2006: Deadline, Data Expo poster abstract (See page 19)
ContentsA word from the Chairs 1
Editorial note 4
Reshaping Data 5
JGR 9Multithreading 12
VOLUME 16, NO 2, DECEMBER 2005
� PAGE 1
(Tim Hesterberg, continues from page 1)I also welcome future officers chair John Monahan, program chair Ed Wegman, secretary/treasurer David Poole, and COS rep Juana Sanchez. If you would like to contribute to work of the section, as an officer or otherwise, please contact the 2006 chair Stephan Sain ([email protected]) or me. Perusing past news-letters, I see it has sometimes been hard to find offi-cers; so please step up, don’t be shy!
MEETINGS One important thing the section does is to support computational statistics meetings (with your dues, publicity, and volunteer time). I’ll highlight two recent meetings and four upcoming meetings.
• Interface 2005 was in St. Louis in June, on “Cluster-ing and Classification”. I couldn’t attend1 , though I understand it went well.
• JSM 2005 was in Minneapolis, with a terrific Stat Computing program put together by Susan Holmes.
• The section is co-sponsoring a workshop on “Fast Manifold Learning”, April 14-15 in Williamsburg VA, organized by Michael Trosset and Carey Priebe;
• details are elsewhere in this newsletter. Note that th! section is interested in supporting other sma" meetings lik! this.
• Inter face 2006, May 24-27 in Pasadena, CA, (http://www.galaxy.gmu.edu/Interface2006/i2006webpage.html May) is on “Massive Data Sets and Streams”. Co-chairs Amy Braverman and Yasmin Said invite people to organize “Special Focus” sessions.
• COMPSTAT2006 in Rome, 28 Aug-1 Sept 2006, (http://w3.uniroma1.it/compstat2006is), with satellite meeting in Berlin and Capri.
Fina l l y JSM 2006 i s in Seat t l e in August2 (http://www.amstat.org/meetings/jsm/2006/). Michael Trosset is putting together a great program for the section, with seven! invited sessions:• Density-Based Clustering (organized by David Scott),• Statistical and Computational Issues in Climate
• Research (Don Percival),• Genome-wide Association Studies (Charles
Kooperberg),• Personal Networks: Applications Using Data on • Social Relationships (Chris Volinsky),• Computational Challenges of Massive Data Sets and
Sources (Karen Kafadar),• New Directions in Statistical Machine Learning (Yufeng Liu),
• Monte Carlo Methods for Computational ly Intensive Problems (Yuguo Chen).
• Machine Learning and Beyond: a session in memory of Leo Breiman
and three short courses:
• Computational Statistics (Geof Givens and Jennifer Hoeting),
• Functional Data Analysis (James Ramsay), and • Text Mining (David Madigan and Dave Lewis).There is an opportunity to organize a Topic Contributed session; contact Michael Trosset ([email protected]).This meeting marks the revival of the Data Expo (Paul Murrell), with prizes for the best analysis of a common dataset. See you there, and don’t forget the great Stat Computing/Graphics mixer.
SIMULATION RESULTSNow we turn to two substantive issues. The first is the use of simulation results in statistics journals. All too often I see averages or other summary measures from simulations presented, without any indication of the accuracy of those measures. And all too often the simulations are in fact inadequate to justify the conclusions made -- e.g. means reported to thefourth decimal place and conclusions made based on the third, when the standard error for the simulation is in the second decimal place.
As statisticians we preach to scientists in other disciplines the importance of standard errors or confidence intervals to accompany summary measures.
VOLUME 16, NO 2, DECEMBER 2005
� PAGE 2
1 I broke my toe at a math contest -- dangerous things, those math contests -- and wasn’t up to beginning a month of travel. The restwas in Zurich, a hardship post, so you should feel really sorry for me.
2 during the brief non-rainy season. You really wouldn’t want to live here.
We should do the same in our own discipline, whether the summary measures are obtained by physical experiment or a computer experiment. And as computat iona l s ta t i s t i c i ans we ha ve spec ia l responsibility for ensuring the computational accuracy of our own work, and any work we referee.
SCIENTIFIC INTEGRITYThe second issue is the use of science in public policy. Statistics has a long and proud role in quantifying scientific certainty arising from measurements that do not provide absolute proof, such as demonstrating the health effects of smoking, in the face of attempts by cigarette companies to raise doubt.
It is therefore incumbent on statisticians to fight current trends in Washington, where scientific evidence is being disregarded in an unprecedented number of areas, including climate change, endangered salmon and other species, endangered species, mercury emissions, air pollution, emergency contraception, abstinence-only education, condoms, airborne bacteria, breast cancer, and evolution.
Furthermore, the whole process by which scientific input inform policy has changed, with the non-partisan and highly regarded U.S. Office of Technology Assessment shut down in favor of courtroom-style hearings with adversarial witnesses chosen by the majority party to give the impression they choose (such as doubt on global warming), and outright harassment of scientists with view opposing the majority party.
The current administration increasingly uses political criteria in place of scientific merit in creating scientific bodies: panel members asked if they voted for President Bush, or rejected for contributing to McCain, qualified scientists (including a Nobel Laureate) rejected after political litmus tests, leading scientists dismissed from a panel for dissenting opinions on biomedical research ethics, scientific committees on arms control and national nuclear security dismissed, staff-recommended scientists rejected for a lead-poisoning panel and replaced by appointees with finan-cial ties to the lead industry, workplace safety panel scientists rejected due to their support for a workplace ergonomics standard, and an underqualified and highly partisan nominee was suggested as chair for a reproductive health committee.
It is important for all scientists, and statisticians in particular, to speak out for the use of objective scien-tific information and statistical weighting of evidence in public policy, to fight distortion, and to speak against those who attempt to give the impression“considerable controversy” on issues such as global warming despite statistical significance and scientific consensus.
For further information see Tim Hesterberg ’s Scientific Integrity Site (http://home.comcast.net/~timhesterberg/ScientificIntegrity.html) and the Union of Concerned Scientists’ web site (http://www.ucsusa.org/scientific_integrity)
_________________________________________________
(Mario Peruggia, continues from page 1)
“Graphical Tools for Spatial Econometrics,”“Network Visualization,” and “Statistical Graphics: Ap-plications in Drug Discovery and Clinical Develop-ment.”
The invited sessions are, however, only one part of the JSM program. Topic contributed sessions provide a wonderful opportunity to assemble a coherent set of presentations revolving around a specific theme while affording the speakers longer stretches of time to present their material than would be the case at a regular contributed session. I strongly encourage anybody interested in presenting their work in Seattle and willing to take charge of organizing one of these sessions to contact Juergen ( [email protected]) to discuss what the (simple) logistical details are.
Also, subject to final ASA approval, the continuing education program that John Castelloe has helped to put together will include some great offerings and Si-mon Urbanek is working on the organization of exciting roundtable luncheons and, possibly, early-morning coffee roundtables (for the insomniac among us and those traveling from the east coast who will have a hard time adjusting to the Pacific time zone!). As a section we will also continue co-sponsoring the Interface conference, which in 2006 will be in
VOLUME 16, NO 2, DECEMBER 2005
� PAGE 3
Pasadena, and the student paper competition for which applications will be accepted by Jose Pinheiro until December 9 (see the announcement inside the newslet-ter). The presentation of the student awards is always one of the centerpieces at the JSM mixer and, as you can read elsewhere in the newsletter, this year was no exception. As usual, the mixer was well attended and rendered most enjoyable by the fun, the company, the refreshments, and the raffle of door prizes generously donated by so many of the exhibitors.
I would also like to take this opportunity to thank all of our officers and the newsletter editors for their great service to the section. Let me encourage anybody who is interested inplaying a more direct role in the section’s activities or who wishes to nominate possible future officers to contact either Jim Gentle or me. There are several available opportunities to run for office and to otherwise serve the section and we always need help. If you are young and just starting out in the profession don’t be shy about volunteering. Enthusiasm and fresh new ideas are most welcome! Also, please be aware of the new student rate for joint membership in the Computing and Graphics sections and encourage all of your students to join.
Speaking of enthusiasm and fresh new ideas our Chair-Elect Paul Murrell is second to none. As my term comes to a close, I could not have hoped to leave the direction of the section in more capable hands. Paul has already been working tirelessly as the sections’s web master and has put in a tremendous effort to make sure that another of the activities historically co-sponsored by the section will again take place after a hiatus of several years. From the looks of it eve-rything is in place for the data expo competition to be run successfully. This year’s theme is to construct graphical summaries of the salient features of a set of geographic and atmospheric data from NASA. Entries will be presented and judged at a poster session at JSM 2006. Thank you Paul for a job well done and good luck on your tenure as Chair.
Editorial Note With this new issue of the newsletter we start a tradition of sending you a postcard in the mail heralding the forthcoming publication. We plan for this December’s postcard to be the first of many, so that your walls might be filled with interesting statistical graphics cards after several years. If you did not receive a postcard and you are a member of either the Graphics and/or Computing Section, write to the ASA and make sure to update your address with them. You don’t want to miss future mailings.
New with this issue is also the Editor representing Statistical Computing, Juana Sanchez from UCLA.
There are several computing tools articles in this issue. JGR, a new Java graphical user interface for R is explained by Markus Helbig, Martin Theus and Simon Urbanek. JGR provides a portable GUI that works across platforms. It has tooltips for help with command syntax as one types, an object explorer which allows the user to see into the data frame, and an editor for designing and revising analyses. Hadley Wickham describes his reshaping data package for R. How often do you rearrange your data during an analysis? Hadley’s package makes this easier. James Abbey in an under-graduate research project compares the performance of SAS, Matlab, S-Plus and Excel on dual processorhardware. This is part of a large interest in how statistical software might make use of multithreading in multiple processor environments.
In the news section there are photos of the winners of our student prizes, and reports from the activities at this year’s joint statistical meeting. At next year’s meeting the Data Expo competition is being revised, with serious prizes. It will be worthwhile to pull a team together and submit an entry! Plans for next year’s meetings are also noted.
We hope that you enjoy this issue, and please continue to submit articles.
Dianne Cook and Juana Sanchez
VOLUME 16, NO 2, DECEMBER 2005
� PAGE 4
Special ArticleRESHAPING DATA IN R
Hadley Wickham.
http://had.co.nz/cast
1. IntroductionThis article discusses a way to think about data reshaping and describes an implementation of these principles
in a R package, reshape. By reshaping I mean both aggregation and restructuring. Aggregation is a common task where data is reduced into a smaller, more convenient form. One commonly used aggregation procedure is Exceľs Pivot tables. Restructuring involves a similar rearrangement, but preserves all original information. Where aggregation reduces many cells in the original data set to one cell in the new dataset, reshaping preserves a one-to-one connection.
There are a number of existing R functions that can aggregate data, for example tapply, by and aggregate, and a function specifically for reshaping data, reshape. Each of these functions deals well with one or two specific scenarios, but each requires slightly different input arguments and in practice, careful thought is required to create the sequence of operations that arrange the data the way that you want. The reshape package overcomes these problems by using the framework described below to solve a general set of problems using just two functions, cast and melt. As you might guess from these names, the metaphor the reshape package uses is to melt your data into a flexible form, and then cast it into the exact form that you want.
2. FrameworkTo help us think about all the ways we might rearrange a data set it is useful to think about data in a somewhat
unusual fashion. Usually, we think about data in terms of a matrix or data frame, where we have observations in the rows and variables in the columns. In this form it is difficult to investigate relationships between other facets of the data: between subjects, or treatments, or replicates. Reshaping the data allows to explore these other relationships while still being able to use the familiar tools that operate on columns. Reshaping is an important (but often unrecognised) part of practical data analysis and is often necessary when exploring, displaying and analysing data.
For the purposes of reshaping, we can divide the variables into two groups: identifier and measured variables.• Identifier, or id, variables identify the unit that measurements take place on. Id variables are usually discrete,
and are typically fixed by design. In ANOVA notation (Yijk), id variables are the indices on the variables (i, j, k).• Measured variables represent what is measured on that unit (Y).
It is possible to take this abstraction a step further and say there are only id variables and a value, where the id variables now also identify what measured variable the value represents. For example, we could represent this table:
________________________________________ Subject Time Age Weight Height ________________________________________ John Smith 1 50 90 1.80 Mary Smith 1 NA NA 1.70 ________________________________________
VOLUME 16, NO 2, DECEMBER 2005
� PAGE 5
as:_________________________________ Subject Time Variable Value __________________________________ John Smith 1 Age 50 John Smith 1 Height 90 John Smith 1 Weight 1.80 Mary Smith 1 Height 1.70__________________________________
Now each row represents one observation of one variable. This is what I will refer to as “molten” data. Compared to the original data set, it has a new id variable “variable”, and a new column “value”, which represents the value of that observation. We now have the data in a form in which there is no distinction between our original observed variables and other id variables.
3. UseWe first “melt” our data into the form described above (this step can be skipped, see ?recast for details), and
then “cast” it into the form we want. A natural way to specify how we want the result to look is to specify which variables should form the columns and which should form the rows. In the usual data frame, the “variable” id variable forms the columns, while all other id variables form the rows. When the selected variables do not uniquely identify a row, aggregation occurs, we need an aggregation function to reduce a vector to a single value. Examples later will make this concrete.
The order that the row and column variables are specified in is very important. As with a contingency table there are many possible ways of displaying the same variables, and the way they are organised reveals different patterns in the data. Variables specified first vary slowest, and those specified last vary fastest. Because comparisons between adjacent cells are made most easily, the variable you are most interested in making comparisons between should be specified last, and the early variables should be thought of as conditioning variables. An additional constraint is that displays have limited width but essentially infinite length, so variables with many levels must be specified as row variables. It is also desirable to adhere to common conventions, so where possible, “variable” should appear in the column specification.
4. ExampleThe reshape packa ge i s a va i l ab le on CRAN and can be ins ta l l ed us ing the R command
install.packages("reshape"). This section will work through some techniques using the reshape package with an example data set (french_fries). The data is from a sensory experiment investigating the effect of different frying oils on the taste of french fries over time. There are three different types of frying oils (treatment), each in two different fryers (rep), tested by 12 people (subject) on 10 different days (time). The sensory attributes recorded, in order of desirability, are potato, buttery, grassy, rancid, painty flavours. The first few rows of the data look like:
______________________________________________________________________________ time treatment subject rep potato buttery grassy rancid painty______________________________________________________________________________61 1 1 3 1.00 2.90 0.00 0.00 0.00 5.50 25 1 1 3 2.00 14.00 0.00 0.00 1.10 0.00 62 1 1 10 1.00 11.00 6.40 0.00 0.00 0.00 26 1 1 10 2.00 9.90 5.90 2.90 2.20 0.00
VOLUME 16, NO 2, DECEMBER 2005
� PAGE 6
63 1 1 15 1.00 1.20 0.10 0.00 1.10 5.10 27 1 1 15 2.00 8.80 3.00 3.60 1.50 2.30_______________________________________________________________________________
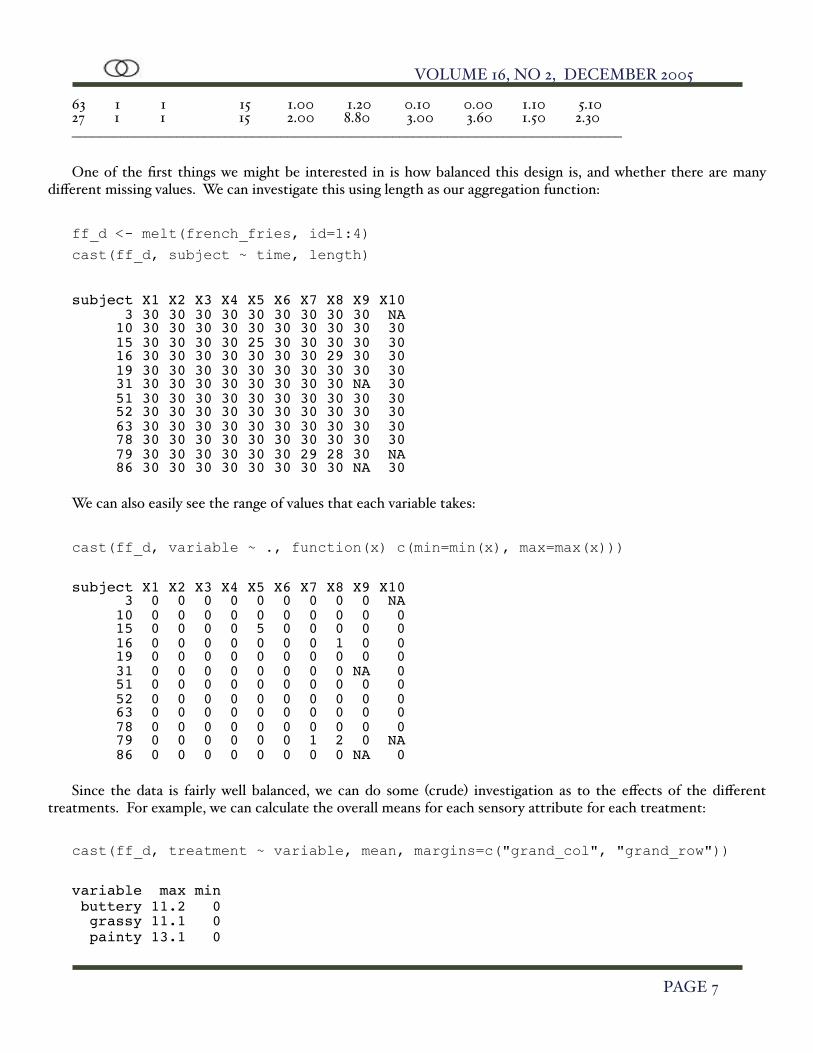
One of the first things we might be interested in is how balanced this design is, and whether there are many different missing values. We can investigate this using length as our aggregation function:
ff_d <- melt(french_fries, id=1:4)
cast(ff_d, subject ~ time, length)
subject X1 X2 X3 X4 X5 X6 X7 X8 X9 X10 3 30 30 30 30 30 30 30 30 30 NA 10 30 30 30 30 30 30 30 30 30 30 15 30 30 30 30 25 30 30 30 30 30 16 30 30 30 30 30 30 30 29 30 30 19 30 30 30 30 30 30 30 30 30 30 31 30 30 30 30 30 30 30 30 NA 30 51 30 30 30 30 30 30 30 30 30 30 52 30 30 30 30 30 30 30 30 30 30 63 30 30 30 30 30 30 30 30 30 30 78 30 30 30 30 30 30 30 30 30 30 79 30 30 30 30 30 30 29 28 30 NA 86 30 30 30 30 30 30 30 30 NA 30
We can also easily see the range of values that each variable takes:
cast(ff_d, variable ~ ., function(x) c(min=min(x), max=max(x)))
subject X1 X2 X3 X4 X5 X6 X7 X8 X9 X10 3 0 0 0 0 0 0 0 0 0 NA 10 0 0 0 0 0 0 0 0 0 0 15 0 0 0 0 5 0 0 0 0 0 16 0 0 0 0 0 0 0 1 0 0 19 0 0 0 0 0 0 0 0 0 0 31 0 0 0 0 0 0 0 0 NA 0 51 0 0 0 0 0 0 0 0 0 0 52 0 0 0 0 0 0 0 0 0 0 63 0 0 0 0 0 0 0 0 0 0 78 0 0 0 0 0 0 0 0 0 0 79 0 0 0 0 0 0 1 2 0 NA 86 0 0 0 0 0 0 0 0 NA 0 Since the data is fairly well balanced, we can do some (crude) investigation as to the effects of the different
treatments. For example, we can calculate the overall means for each sensory attribute for each treatment:
cast(ff_d, treatment ~ variable, mean, margins=c("grand_col", "grand_row"))
variable max min buttery 11.2 0 grassy 11.1 0 painty 13.1 0
VOLUME 16, NO 2, DECEMBER 2005
� PAGE 7
potato 14.9 0 rancid 14.9 0
Note the row and column margins. We can also produce margins at different levels. The following example shows the results broken down for subjects 3 and 11, with both overall means and means for each subject:
cast(ff_d, treatment + subject ~ variable, mean, margins="treatment", subset=subject %in% c(3,10))
treatment potato buttery grassy rancid painty NA. 1 6.89 1.78 0.649 4.07 2.58 3.19 2 7.00 1.97 0.663 3.62 2.46 3.15 3 6.97 1.72 0.681 3.87 2.53 3.15 . 6.95 1.82 0.664 3.85 2.52 3.16
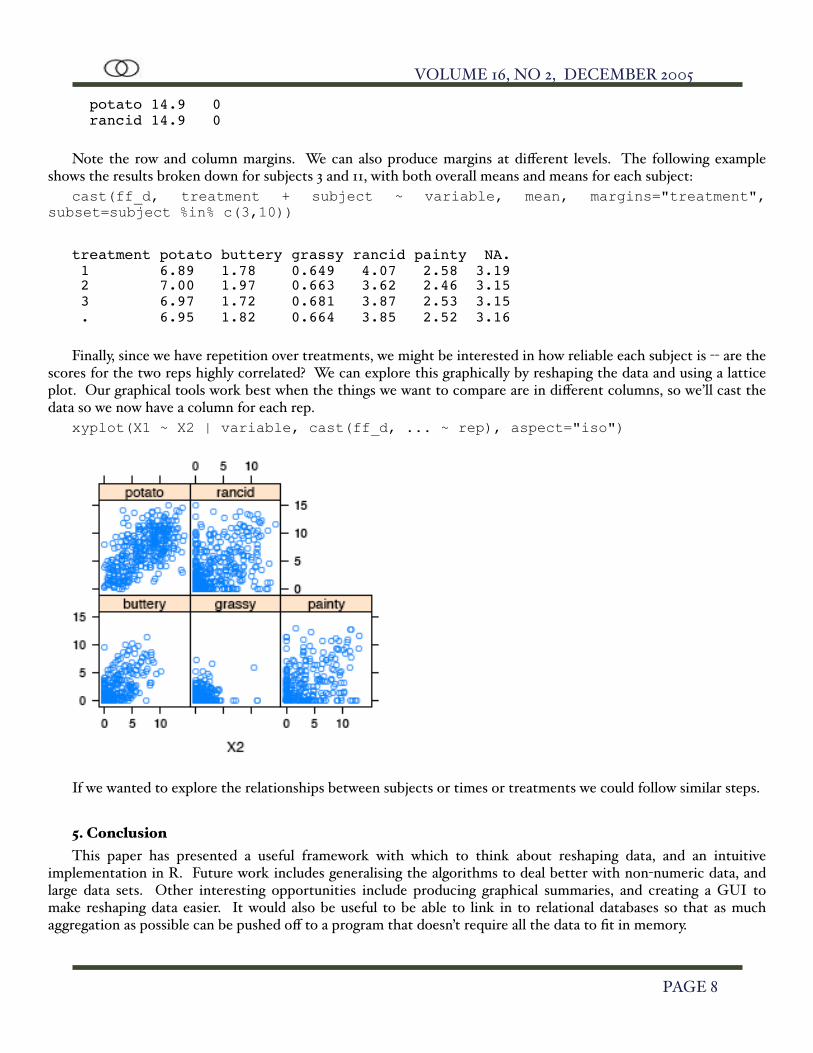
Finally, since we have repetition over treatments, we might be interested in how reliable each subject is -- are the scores for the two reps highly correlated? We can explore this graphically by reshaping the data and using a lattice plot. Our graphical tools work best when the things we want to compare are in different columns, so we’ll cast the data so we now have a column for each rep.
xyplot(X1 ~ X2 | variable, cast(ff_d, ... ~ rep), aspect="iso")
If we wanted to explore the relationships between subjects or times or treatments we could follow similar steps.
5. ConclusionThis paper has presented a useful framework with which to think about reshaping data, and an intuitive
implementation in R. Future work includes generalising the algorithms to deal better with non-numeric data, and large data sets. Other interesting opportunities include producing graphical summaries, and creating a GUI to make reshaping data easier. It would also be useful to be able to link in to relational databases so that as much aggregation as possible can be pushed off to a program that doesn’t require all the data to fit in memory.
VOLUME 16, NO 2, DECEMBER 2005
� PAGE 8
JGR: JAVA GUI FOR R
Markus Helbig [email protected] Martin Theus [email protected]
University of Augsburg, Dep.of Computational Statistics and Data Analysis
Simon Urbanek [email protected] AT&T Labs-Research1. IntroductionMany different user interfaces for R exist on
various platforms for years. The Windows GUI, the MacOSX GUI as well as GUIs for LINUX e.g., for Gnome. Furthermore there is SciViews and other front-ends, e.g. web interfaces.
All of these GUIs share a common problem: each for itself might be excellent for its targeted purpose, but what if the user changes the platform or working style? Once you are accustomed to a GUI, switching this preferred GUI is not easy. Special features might be missing, new actions must be learned. One solution for this limitation is a platform independent GUI, running on (almost) every common platform. JGR the “Java GUI for R” is such a GUI1, assembling the most important GUI features independent of the underlying system.
2. Working with JGR
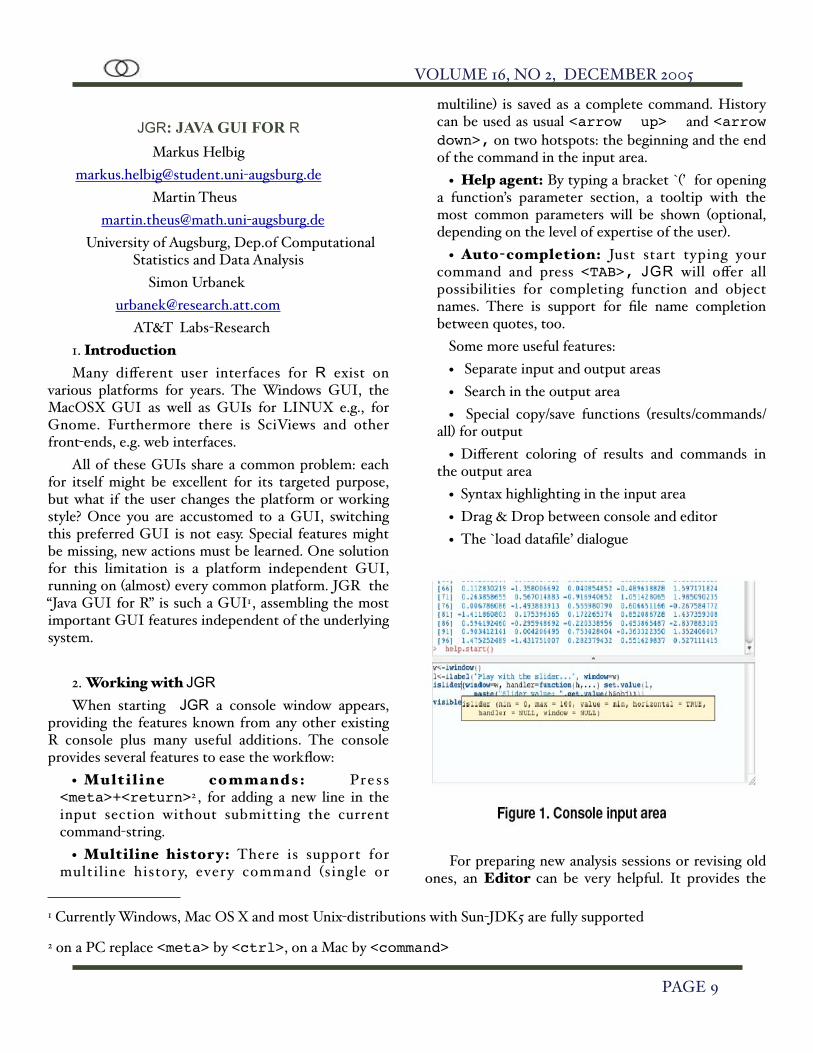
When starting JGR a console window appears, providing the features known from any other existing R console plus many useful additions. The console provides several features to ease the workflow:
• Mu l t i l i n e c o m m a n d s : Pres s <meta>+<return>2 , for adding a new line in the input section without submitting the current command-string.
• Multiline histor y: There is support for multiline history, every command (single or
multiline) is saved as a complete command. History can be used as usual <arrow up> and <arrow down>, on two hotspots: the beginning and the end of the command in the input area.
• Help agent: By typing a bracket `(’ for opening a function’s parameter section, a tooltip with the most common parameters will be shown (optional, depending on the level of expertise of the user).
• Auto-completion: Just start typing your command and press <TAB>, JGR will offer all possibilities for completing function and object names. There is support for file name completion between quotes, too.
Some more useful features:• Separate input and output areas• Search in the output area• Special copy/save functions (results/commands/
all) for output• Different coloring of results and commands in
the output area• Syntax highlighting in the input area• Drag & Drop between console and editor• The `load datafile’ dialogue
For preparing new analysis sessions or revising old ones, an Editor can be very helpful. It provides the
VOLUME 16, NO 2, DECEMBER 2005
� PAGE 9
1 Currently Windows, Mac OS X and most Unix-distributions with Sun-JDK5 are fully supported
2 on a PC replace <meta> by <ctrl>, on a Mac by <command>
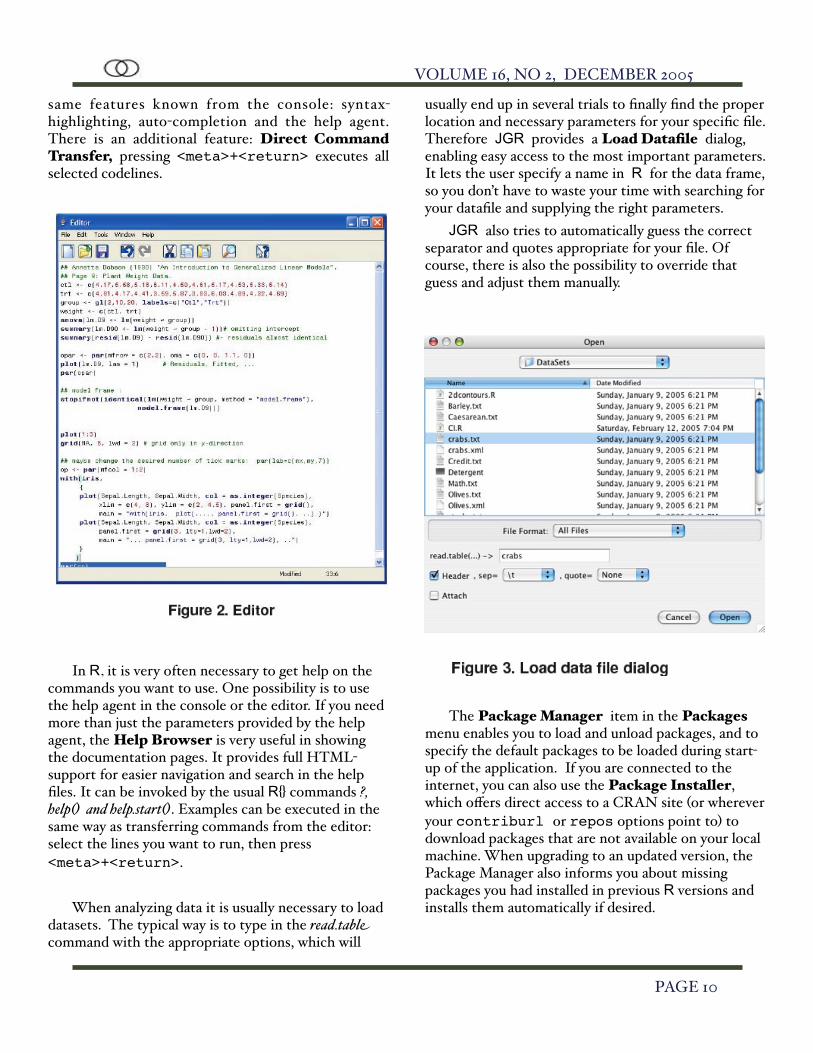
same features known from the console: syntax-highlighting, auto-completion and the help agent. There is an additional feature: Direct Command Transfer, pressing <meta>+<return> executes all selected codelines.
In R, it is very often necessary to get help on the commands you want to use. One possibility is to use the help agent in the console or the editor. If you need more than just the parameters provided by the help agent, the Help Browser is very useful in showing the documentation pages. It provides full HTML-support for easier navigation and search in the help files. It can be invoked by the usual R{} commands ?, help() and help.start(). Examples can be executed in the same way as transferring commands from the editor: select the lines you want to run, then press <meta>+<return>.
When analyzing data it is usually necessary to load datasets. The typical way is to type in the read.tabl! command with the appropriate options, which will
usually end up in several trials to finally find the proper location and necessary parameters for your specific file. Therefore JGR provides a Load Datafile dialog, enabling easy access to the most important parameters. It lets the user specify a name in R for the data frame, so you don’t have to waste your time with searching for your datafile and supplying the right parameters.
JGR also tries to automatically guess the correct separator and quotes appropriate for your file. Of course, there is also the possibility to override that guess and adjust them manually.
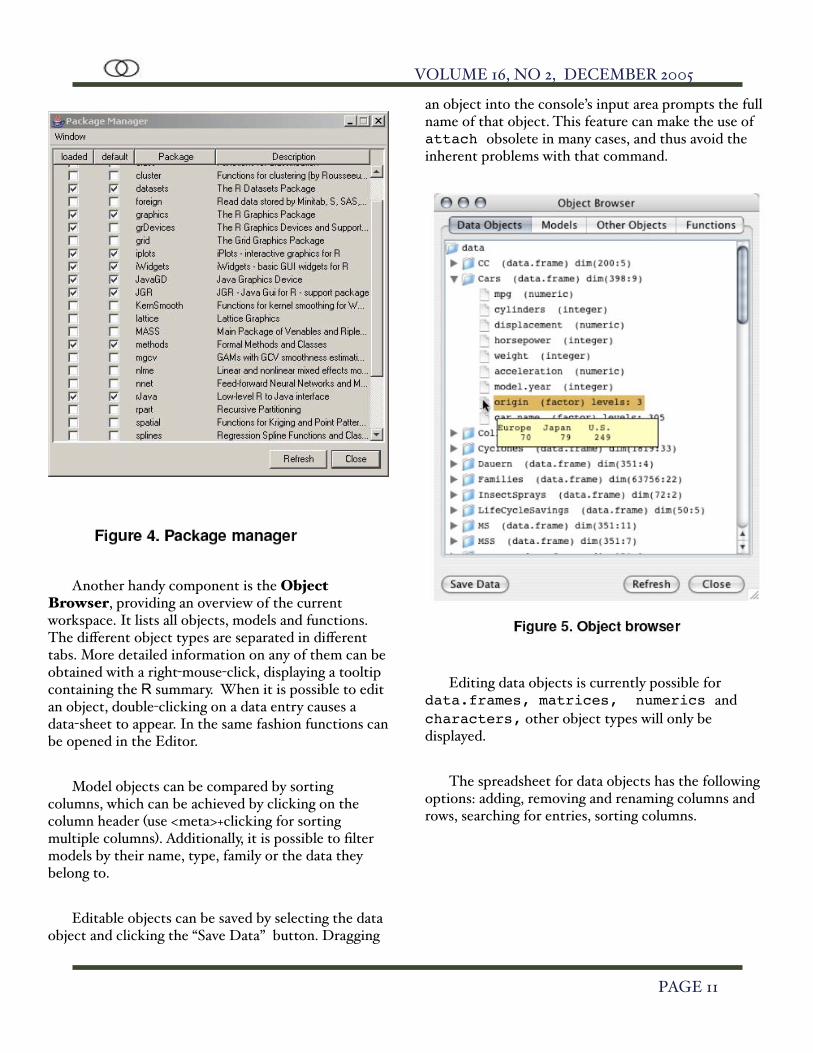
The Package Manager item in the Packages menu enables you to load and unload packages, and to specify the default packages to be loaded during start-up of the application. If you are connected to the internet, you can also use the Package Installer, which offers direct access to a CRAN site (or wherever your contriburl or repos options point to) to download packages that are not available on your local machine. When upgrading to an updated version, the Package Manager also informs you about missing packages you had installed in previous R versions and installs them automatically if desired.
VOLUME 16, NO 2, DECEMBER 2005
� PAGE 10
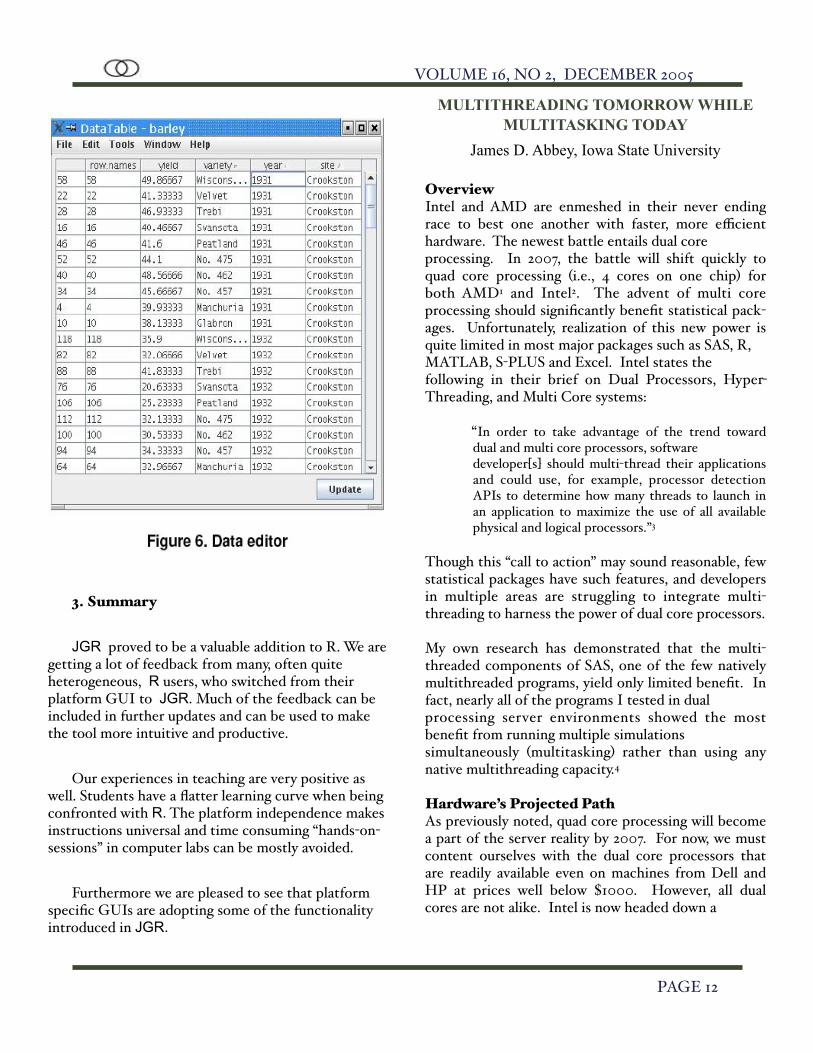
Another handy component is the Object Browser, providing an overview of the current workspace. It lists all objects, models and functions. The different object types are separated in different tabs. More detailed information on any of them can be obtained with a right-mouse-click, displaying a tooltip containing the R summary. When it is possible to edit an object, double-clicking on a data entry causes a data-sheet to appear. In the same fashion functions can be opened in the Editor.
Model objects can be compared by sorting columns, which can be achieved by clicking on the column header (use <meta>+clicking for sorting multiple columns). Additionally, it is possible to filter models by their name, type, family or the data they belong to.
Editable objects can be saved by selecting the data object and clicking the “Save Data” button. Dragging
an object into the console’s input area prompts the full name of that object. This feature can make the use of attach obsolete in many cases, and thus avoid the inherent problems with that command.
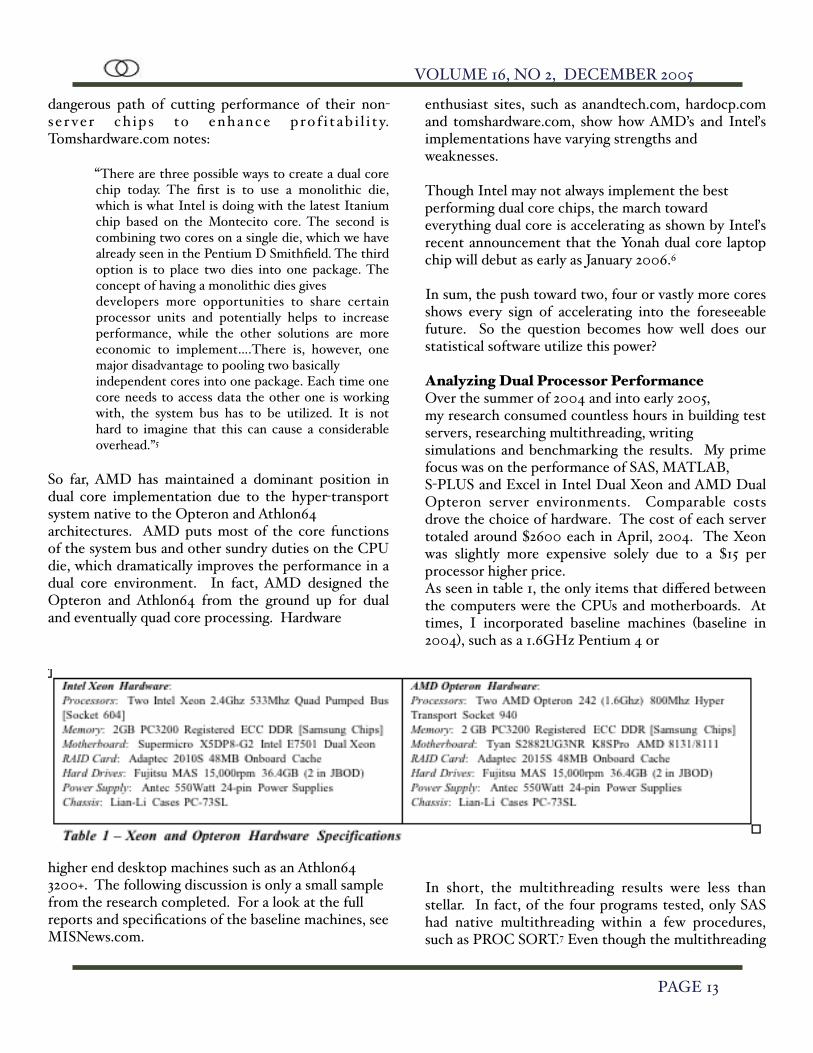
Editing data objects is currently possible for data.frames, matrices, numerics and characters, other object types will only be displayed.
The spreadsheet for data objects has the following options: adding, removing and renaming columns and rows, searching for entries, sorting columns.
VOLUME 16, NO 2, DECEMBER 2005
� PAGE 11
3. Summary
JGR proved to be a valuable addition to R. We are getting a lot of feedback from many, often quite heterogeneous, R users, who switched from their platform GUI to JGR. Much of the feedback can be included in further updates and can be used to make the tool more intuitive and productive.
Our experiences in teaching are very positive as well. Students have a flatter learning curve when being confronted with R. The platform independence makes instructions universal and time consuming “hands-on-sessions” in computer labs can be mostly avoided.
Furthermore we are pleased to see that platform specific GUIs are adopting some of the functionality introduced in JGR.
MULTITHREADING TOMORROW WHILE MULTITASKING TODAY
James D. Abbey, Iowa State University
OverviewIntel and AMD are enmeshed in their never ending race to best one another with faster, more efficient hardware. The newest battle entails dual core processing. In 2007, the battle will shift quickly to quad core processing (i.e., 4 cores on one chip) for both AMD1 and Intel2. The advent of multi core processing should significantly benefit statistical pack-ages. Unfortunately, realization of this new power is quite limited in most major packages such as SAS, R, MATLAB, S-PLUS and Excel. Intel states the following in their brief on Dual Processors, Hyper-Threading, and Multi Core systems:
“In order to take advantage of the trend toward dual and multi core processors, software developer[s] should multi-thread their applications and could use, for example, processor detection APIs to determine how many threads to launch in an application to maximize the use of all available physical and logical processors.”3
Though this “call to action” may sound reasonable, few statistical packages have such features, and developers in multiple areas are struggling to integrate multi-threading to harness the power of dual core processors.
My own research has demonstrated that the multi-threaded components of SAS, one of the few natively multithreaded programs, yield only limited benefit. In fact, nearly all of the programs I tested in dual processing server environments showed the most benefit from running multiple simulations simultaneously (multitasking) rather than using any native multithreading capacity.4
Hardware’s Projected PathAs previously noted, quad core processing will become a part of the server reality by 2007. For now, we must content ourselves with the dual core processors that are readily available even on machines from Dell and HP at prices well below $1000. However, all dual cores are not alike. Intel is now headed down a
VOLUME 16, NO 2, DECEMBER 2005
� PAGE 12
dangerous path of cutting performance of their non-se r ver ch ips to enhance prof i tab i l i t y. Tomshardware.com notes:
“There are three possible ways to create a dual core chip today. The first is to use a monolithic die, which is what Intel is doing with the latest Itanium chip based on the Montecito core. The second is combining two cores on a single die, which we have already seen in the Pentium D Smithfield. The third option is to place two dies into one package. The concept of having a monolithic dies gives developers more opportunities to share certain processor units and potentially helps to increase performance, while the other solutions are more economic to implement….There is, however, one major disadvantage to pooling two basically independent cores into one package. Each time one core needs to access data the other one is working with, the system bus has to be utilized. It is not hard to imagine that this can cause a considerable overhead.”5
So far, AMD has maintained a dominant position in dual core implementation due to the hyper-transport system native to the Opteron and Athlon64 architectures. AMD puts most of the core functions of the system bus and other sundry duties on the CPU die, which dramatically improves the performance in a dual core environment. In fact, AMD designed the Opteron and Athlon64 from the ground up for dual and eventually quad core processing. Hardware
enthusiast sites, such as anandtech.com, hardocp.com and tomshardware.com, show how AMD’s and Inteľs implementations have varying strengths and weaknesses.
Though Intel may not always implement the best performing dual core chips, the march toward everything dual core is accelerating as shown by Inteľs recent announcement that the Yonah dual core laptop chip will debut as early as January 2006.6
In sum, the push toward two, four or vastly more cores shows every sign of accelerating into the foreseeable future. So the question becomes how well does our statistical software utilize this power?
Analyzing Dual Processor PerformanceOver the summer of 2004 and into early 2005, my research consumed countless hours in building test servers, researching multithreading, writing simulations and benchmarking the results. My prime focus was on the performance of SAS, MATLAB, S-PLUS and Excel in Intel Dual Xeon and AMD Dual Opteron server environments. Comparable costs drove the choice of hardware. The cost of each server totaled around $2600 each in April, 2004. The Xeon was slightly more expensive solely due to a $15 per processor higher price.As seen in table 1, the only items that differed between the computers were the CPUs and motherboards. At times, I incorporated baseline machines (baseline in 2004), such as a 1.6GHz Pentium 4 or
higher end desktop machines such as an Athlon64 3200+. The following discussion is only a small sample from the research completed. For a look at the full reports and specifications of the baseline machines, see MISNews.com.
In short, the multithreading results were less than stellar. In fact, of the four programs tested, only SAS had native multithreading within a few procedures, such as PROC SORT.7 Even though the multithreading
VOLUME 16, NO 2, DECEMBER 2005
� PAGE 13
performance was lack-luster, the performance when running multiple simulations in parallel (multitasking) showed the current benefits of dual processor ma-chines.
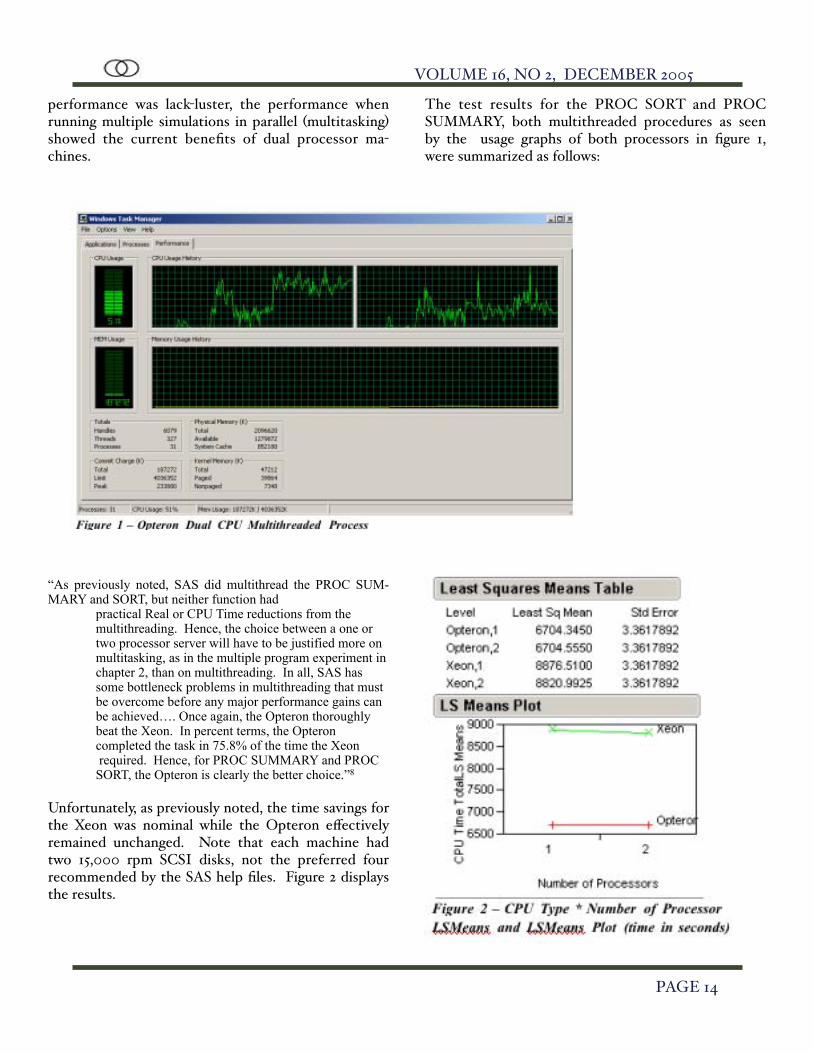
The test results for the PROC SORT and PROC SUMMARY, both multithreaded procedures as seen by the usage graphs of both processors in figure 1, were summarized as follows:
“As previously noted, SAS did multithread the PROC SUM-MARY and SORT, but neither function had
practical Real or CPU Time reductions from the multithreading. Hence, the choice between a one or two processor server will have to be justified more on multitasking, as in the multiple program experiment in chapter 2, than on multithreading. In all, SAS has some bottleneck problems in multithreading that must be overcome before any major performance gains can be achieved…. Once again, the Opteron thoroughly beat the Xeon. In percent terms, the Opteron completed the task in 75.8% of the time the Xeon required. Hence, for PROC SUMMARY and PROC SORT, the Opteron is clearly the better choice.”8
Unfortunately, as previously noted, the time savings for the Xeon was nominal while the Opteron effectively remained unchanged. Note that each machine had two 15,000 rpm SCSI disks, not the preferred four recommended by the SAS help files. Figure 2 displays the results.
VOLUME 16, NO 2, DECEMBER 2005
� PAGE 14
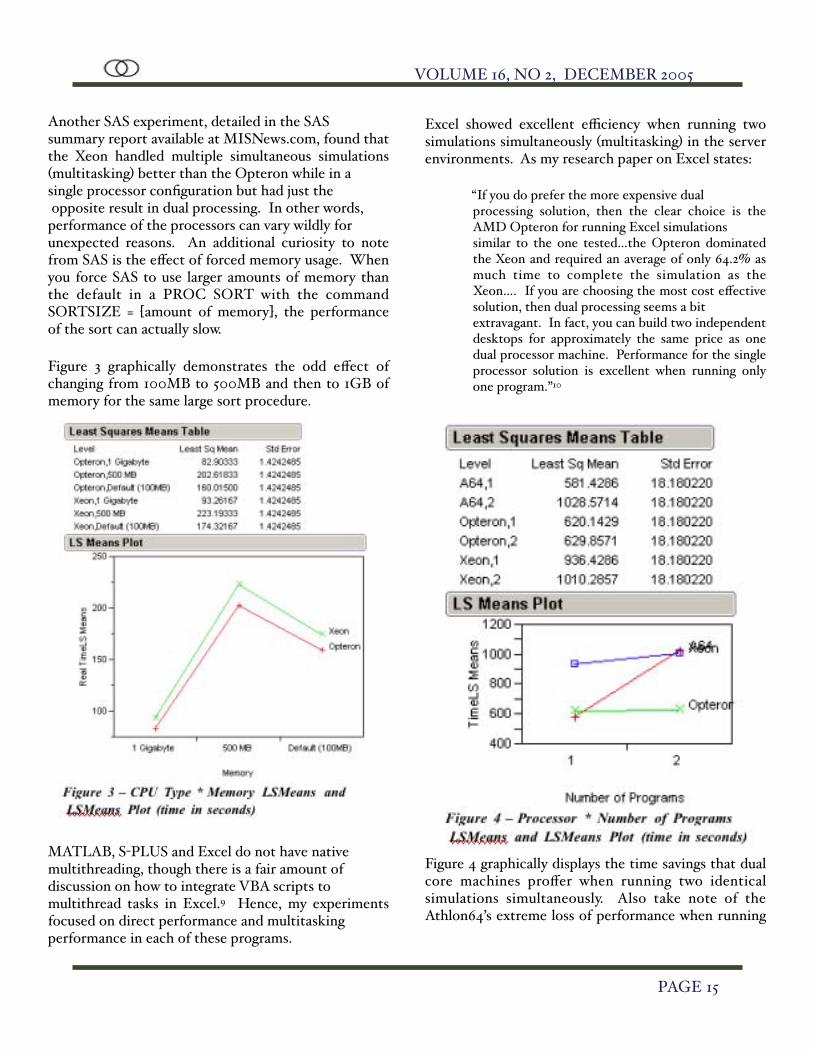
Another SAS experiment, detailed in the SAS summary report available at MISNews.com, found that the Xeon handled multiple simultaneous simulations (multitasking) better than the Opteron while in a single processor configuration but had just the opposite result in dual processing. In other words, performance of the processors can vary wildly for unexpected reasons. An additional curiosity to note from SAS is the effect of forced memory usage. When you force SAS to use larger amounts of memory than the default in a PROC SORT with the command SORTSIZE = [amount of memory], the performance of the sort can actually slow.
Figure 3 graphically demonstrates the odd effect of changing from 100MB to 500MB and then to 1GB of memory for the same large sort procedure.
MATLAB, S-PLUS and Excel do not have native multithreading, though there is a fair amount of discussion on how to integrate VBA scripts to multithread tasks in Excel.9 Hence, my experiments focused on direct performance and multitasking performance in each of these programs.
Excel showed excellent efficiency when running two simulations simultaneously (multitasking) in the server environments. As my research paper on Excel states:
“If you do prefer the more expensive dual processing solution, then the clear choice is the AMD Opteron for running Excel simulations similar to the one tested…the Opteron dominated the Xeon and required an average of only 64.2% as much time to complete the simulation as the Xeon…. If you are choosing the most cost effective solution, then dual processing seems a bit extravagant. In fact, you can build two independent desktops for approximately the same price as one dual processor machine. Performance for the single processor solution is excellent when running only one program.”10
Figure 4 graphically displays the time savings that dual core machines proffer when running two identical simulations simultaneously. Also take note of the Athlon64’s extreme loss of performance when running
VOLUME 16, NO 2, DECEMBER 2005
� PAGE 15
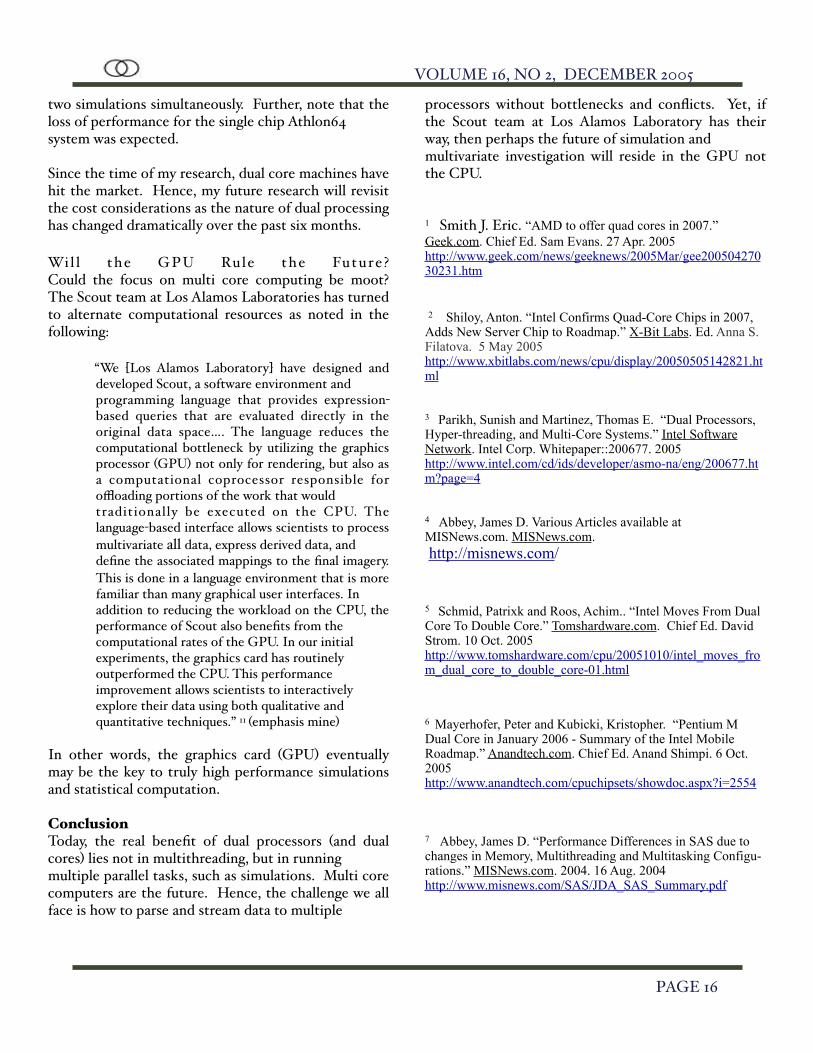
two simulations simultaneously. Further, note that the loss of performance for the single chip Athlon64 system was expected.
Since the time of my research, dual core machines have hit the market. Hence, my future research will revisit the cost considerations as the nature of dual processing has changed dramatically over the past six months.
Wi l l the GPU Rule the Future ?Could the focus on multi core computing be moot? The Scout team at Los Alamos Laboratories has turned to alternate computational resources as noted in the following:
“We [Los Alamos Laboratory] have designed and developed Scout, a software environment and programming language that provides expression-based queries that are evaluated directly in the original data space…. The language reduces the computational bottleneck by utilizing the graphics processor (GPU) not only for rendering, but also as a computational coprocessor responsible for offloading portions of the work that would traditionally be executed on the CPU. The language-based interface allows scientists to process multivariate all data, express derived data, and define the associated mappings to the final imagery. This is done in a language environment that is more familiar than many graphical user interfaces. In addition to reducing the workload on the CPU, the performance of Scout also benefits from the computational rates of the GPU. In our initial experiments, the graphics card has routinely outperformed the CPU. This performance improvement allows scientists to interactively explore their data using both qualitative and quantitative techniques.” 11 (emphasis mine)
In other words, the graphics card (GPU) eventually may be the key to truly high performance simulations and statistical computation.
ConclusionToday, the real benefit of dual processors (and dual cores) lies not in multithreading, but in running multiple parallel tasks, such as simulations. Multi core computers are the future. Hence, the challenge we all face is how to parse and stream data to multiple
processors without bottlenecks and conflicts. Yet, if the Scout team at Los Alamos Laboratory has their way, then perhaps the future of simulation and multivariate investigation will reside in the GPU not the CPU.
1 Smith J. Eric. “AMD to offer quad cores in 2007.” Geek.com. Chief Ed. Sam Evans. 27 Apr. 2005http://www.geek.com/news/geeknews/2005Mar/gee20050427030231.htm
2 Shiloy, Anton. “Intel Confirms Quad-Core Chips in 2007, Adds New Server Chip to Roadmap.” X-Bit Labs. Ed. Anna S. Filatova. 5 May 2005http://www.xbitlabs.com/news/cpu/display/20050505142821.html
3 Parikh, Sunish and Martinez, Thomas E. “Dual Processors, Hyper-threading, and Multi-Core Systems.” Intel Software Network. Intel Corp. Whitepaper::200677. 2005http://www.intel.com/cd/ids/developer/asmo-na/eng/200677.htm?page=4
4 Abbey, James D. Various Articles available at MISNews.com. MISNews.com. http://misnews.com/
5 Schmid, Patrixk and Roos, Achim.. “Intel Moves From Dual Core To Double Core.” Tomshardware.com. Chief Ed. David Strom. 10 Oct. 2005http://www.tomshardware.com/cpu/20051010/intel_moves_from_dual_core_to_double_core-01.html
6 Mayerhofer, Peter and Kubicki, Kristopher. “Pentium M Dual Core in January 2006 - Summary of the Intel Mobile Roadmap.” Anandtech.com. Chief Ed. Anand Shimpi. 6 Oct. 2005http://www.anandtech.com/cpuchipsets/showdoc.aspx?i=2554
7 Abbey, James D. “Performance Differences in SAS due to changes in Memory, Multithreading and Multitasking Configu-rations.” MISNews.com. 2004. 16 Aug. 2004http://www.misnews.com/SAS/JDA_SAS_Summary.pdf
VOLUME 16, NO 2, DECEMBER 2005
� PAGE 16
8 Abbey, James D. “Performance Differences in SAS due to changes in Memory, Multithreading and Multitasking Configu-rations.” MISNews.com. 2004. 16 Aug. 2004http://www.misnews.com/SAS/JDA_SAS_Summary.pdf
9 Excaliber, Senior Contributor. “Multithreading in VB.Net.” XTremeVBTalk.com. 10 Apr. 2004http://www.xtremevbtalk.com/showthread.php?t=159864
10 Abbey, James D. “Performance Differences in Excel Simula-tion due to Processor and Multitasking Configurations.” Page 12. MISNews.com. 27 Dec. 2004http://www.misnews.com/Excel1.pdf
11 McCormick, Patrick et al. “Scout: A Hardware-Accelerated Language for Data Visualization and Analysis.” CCS-1 Ad-vanced Computing Laboratory | Los Alamos National Labora-tory. 2004http://www.acl.lanl.gov/docs/ScoutFY04-1.pdf
________________________________________________
News clippings and Section Notices
ANNUAL COMPETITIONSCALL FOR ENTRIES
Jose PinheiroAwards officer 2005.
STUDENT PAPER COMPETITION 2006
The Statistical Computing and Statistical Graphics Sections of the American Statistical Association are co - sponsoring a student paper
competition on the topics of Statistical Computing and Statistical Graphics. Students are encouraged to submit a paper in one of these areas, which might be original methodological research, some novel computing or graphical application in statistics, or any other suitable contribution (for example, a software-related project). The selected winners will present their papers in a topic-contributed session at the 2006 Joint Statistical Meetings. The Sections will pay
registration fees for the winners as well as a substantial allowance for transportation to the meetings and lodging (which in most cases covers these expenses completely).
Anyone who i s a s tudent (graduate or undergraduate) on or after September 1, 2005 is eligible to participate. An entry must include an abstract, a six page manuscript (including figures, tables and references), a C.V., and a letter from a faculty member familiar with the studenťs work. The applicant must be the first author of the paper. The faculty letter must include a verification of the applicanťs student status and, in the case of joint authorship, should indicate what fraction of the contribution is attributable to the applicant. We prefer that electronic submissions of papers be in Postscript or PDF. All materials must be in English.
All application materials MUST BE RECEIVED by 5:00 PM EST, Monday, December 19, 2005 at the address below. They will be reviewed by the Student Paper Competition Award committee of the Statistical Computing and Graphics Sections. The selection criteria used by the committee will include innovation and significance of the contribution. Award announcements will be made in late January, 2006.
Additional important information on the competition can be accessed on the website of the S ta t i s t i ca l Comput ing Sect ion (www.statcomputing.org). A current pointer to the webs i te i s a va i l ab le f rom the ASA webs i te (www.amstat.org)Inquiries and application materials should be emailed or mailed to:
Student Paper Competitio%c/o Dr. Jose Pinheiro, Biostatistics, Novartis
PharmaceuticalsOne Health Plaza, Room 419/2115
East Hanover, NJ [email protected]&
VOLUME 16, NO 2, DECEMBER 2005
� PAGE 17
JOHN M. CHAMBERS STATISTICAL SOFTWARE AWARD
The Statistical Computing Section of the American Statistical Association announces the competition for the John M. Chambers Statistical Software Award. In 1998 the Association for Computing Machinery presented its Software System Award to John Chambers for the design and development of S. Dr. Chambers generously donated his award to the Statistical Computing Section to endow an annual prize for statistical software written by, or in collaboration with, an undergraduate or graduate student. The prize carries with it a cash award of $1000, plus a substantial allowance for travel to the annual Joint Statistical Meetings (JSM) where the award will be presented. Starting this year, teams of up to 3 people will be allowed to participate in the competition, with the cash award being split among the team members. The travel allowance will be given to just one individual in the team, who will be presented the award at JSM.
To be eligible, the team must have designed and implemented a piece of statistical software. The individual within the team indicated to receive the travel allowance must have begun the development while a student, and must either currently be a student, or have completed all requirements for her/his last degree after January 1, 2002. To apply for the award, teams must provide the following materials:
• Current CV’s of all team members. • A letter from a faculty mentor at the academic
institution of the individual indicated to receive the travel award. The letter should confirm that the individual had substantial participation in the development of the software, certify her/his student status when the software began to be developed (and either the current student status or the date of degree completion) , and briefly discuss the importance of the software to statistical practice.
• A brief, one to two page description of the software, summarizing what it does, how it does it, and why it is an important contribution. If the team member competing for the travel allowance has continued developing the software after finishing her/his studies, the description should indicate what was developed when the individual was a student and what has been added since.
• Access to the software by the award committee for their use on inputs of their choosing. Access to the software can consist of an executable file, Web-based access, macro code, or other appropriate form. Access shou ld be accompanied by enough information to allow the judges to effectively use and evaluate the software. This information can be provided in a variety of ways, including but not limited to a user manual (paper or electronic), a paper, a URL, online help to the system, and source code. In particular, the team must be prepared to provide complete source code for inspection by the committee if requested.
All materials must be in English. We prefer that electronic text be submitted in Postscript or PDF. The entries will be judged on a variety of dimensions, including the importance and relevance for statistical practice of the tasks performed by the software, ease of use, clarity of description, elegance and availability for use by the statistical community. Preference will be given to those entries that are grounded in software design rather than calculation. The decision of the award committee is final.
All application materials must be received by 5:00pm EST, Monday, February 27, 2006 at the address below. The winner will be announced in May and the award will be given at the 2006 Joint Statistical Meetings.
Information on the competition can also be accessed on the website of the Statistical Computing Section (www.statcomputing.org or see the ASA website, www.amstat.org for a pointer), including the names and contributions of previous winners. Inquiries and application materials should be emailed or mailed to:
Chambers So'ware Awardc/o Dr. Jose Pinheiro, Biostatistics, Novartis
PharmaceuticalsOne Health Plaza, Room 419/2115
East Hanover, NJ [email protected]&
VOLUME 16, NO 2, DECEMBER 2005
� PAGE 18

BEST CONTRIBUTED PAPER COMPETITION
The Best Contributed Paper award is determined on the basis of the evaluations filled out by the attendees of the Contributed and Topics Contributed sessions of JSM which have the Statistical Computing Section as first sponsor. All presenters in those sessions are automatically entered in the competition. The prize includes a US $100 cash award and a plaque presented at the 2006 JSM
________________________________________________
CALL FOR CONTRIBUTED ABSTRACTS FOR JSM 2006, SECTION ON STATISTICAL COM-PUTINGOnline submission of topic or regular contributed abstracts for JSM 2006 opens December 1, 2005, and closes February 1, 2006. (Mail-in submission closes January 16.) Please consider organizing a Topics Contributed session. A Topics Contributed session comprises five (or more) presentations on a common theme. The constraint of five presentations can be satisfied in various ways, e.g., five speakers, or four speakers plus one discussant, or three speakers plus two discussants.
If you plan to contribute an abstract, then there are two obvious advantages to organizing a Topics Contributed session. First, you ensure that you will speak in a session that is devoted to the subject of your talk. Second, speakers in Topics Contributed sessions typically have more time than the 15 minutes allocated to speakers in Contributed sessions.
If you have questions, then please contact the Statisti-cal Computing program chair, Michael Trosset ([email protected])
CALL FOR CONTRIBUTED ABSTRACTS FOR JSM 2006, SECTION ON STATISTICAL GRAPHICS Don’t miss the February 1, 2006 deadline for submission of topic or regular contributed abstracts for JSM 2006. Please consider organizing a Topics Contributed session. Topic contributed sessions
provide a wonderful opportunity to assemble a coherent set of presentations revolving around a specific theme while affording the speakers longer stretches of time to present their material than would be the case at a regular contributed session. The Statistical Graphics Section strongly encourages anybody interested in presenting their work in Seattle and willing to take charge of organizing one of these sessions to contact Juergen Symanzik ( [email protected]) to discuss what the (simple) logistical details are.
Data Expo 2006
The ASA Sections on Statistical Graphics, Statistical Computing, and Statistics and the Environment are sponsoring a Data Exposition for JSM 2006.
This competition provides a data set of geographic and atmospheric data from NASA and entrants are asked to provide a graphical summary of the important features of the data set. The emphasis is on graphical display, but the data set has time series, spatial, and multivariate features that allow the focus to be directed in a number of different ways.
Entries will be presented in a poster session at JSM 2006 and the best entries will receive cash prizes totalling $1700 plus NASA merchandise. Student and group entries are encouraged. The deadline for *entering* the competition is Feb 1 (entrants must submit a poster abstract). Of course, people only need to prepare their final poster for the JSM (August 2006) so they have lots more time to work on a poster after Feb 1.
For more information, please see the web site http://www.amstat-online.org/sections/graphics/dataexpo/2006.php.
We look forward to your participation!Paul Murrell (on behalf of the Data Expo
Organising team)
VOLUME 16, NO 2, DECEMBER 2005
� PAGE 19
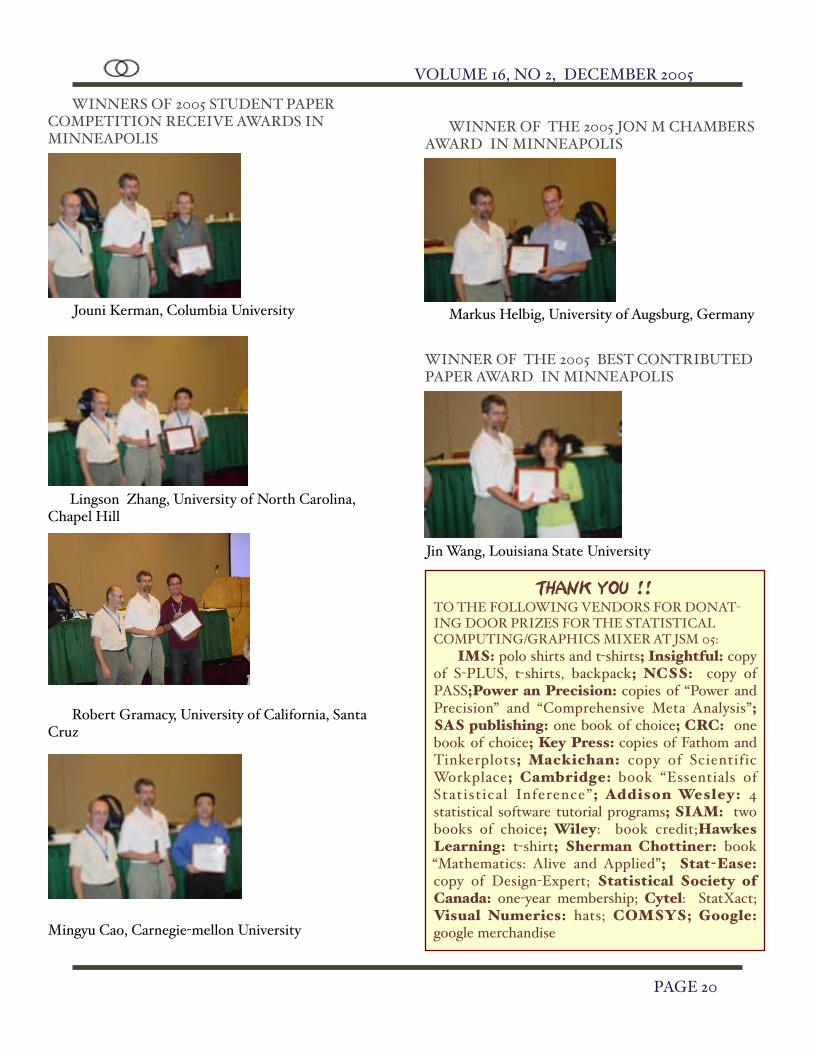
WINNERS OF 2005 STUDENT PAPER COMPETITION RECEIVE AWARDS IN MINNEAPOLIS
Jouni Kerman, Columbia University
Lingson Zhang, University of North Carolina, Chapel Hill
Robert Gramacy, University of California, Santa Cruz
Mingyu Cao, Carnegie-mellon University
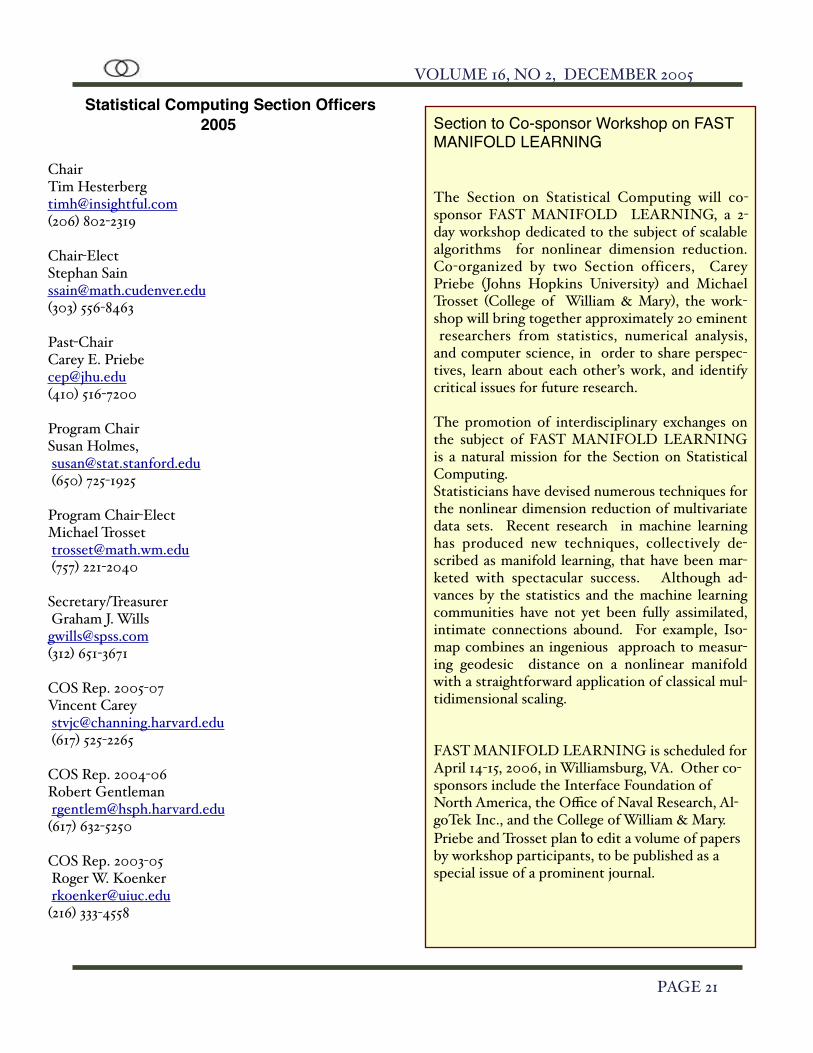
WINNER OF THE 2005 JON M CHAMBERS
AWARD IN MINNEAPOLIS
Markus Helbig, University of Augsburg, Germany
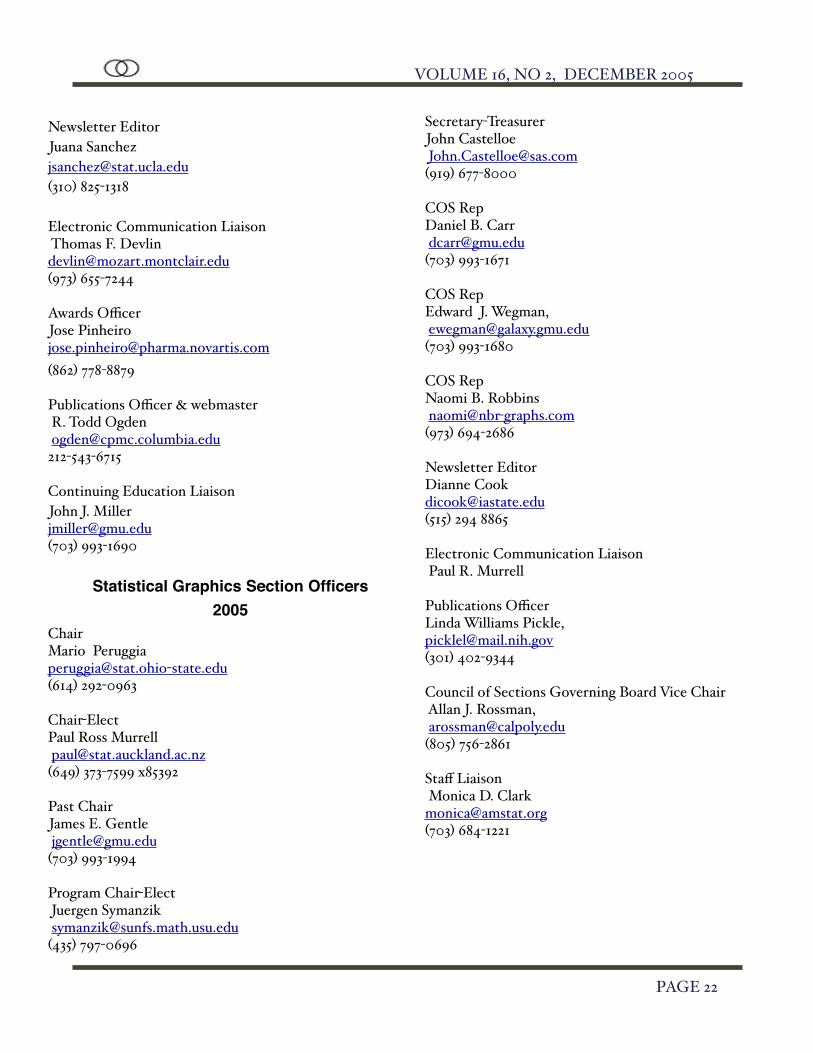
WINNER OF THE 2005 BEST CONTRIBUTED PAPER AWARD IN MINNEAPOLIS
Jin Wang, Louisiana State University
THANK YOU !!TO THE FOLLOWING VENDORS FOR DONAT-ING DOOR PRIZES FOR THE STATISTICAL COMPUTING/GRAPHICS MIXER AT JSM 05:
IMS: polo shirts and t-shirts; Insightful: copy of S-PLUS, t-shirts, backpack; NCSS: copy of PASS;Power an Precision: copies of “Power and Precision” and “Comprehensive Meta Analysis”; SAS publishing: one book of choice; CRC: one book of choice; Key Press: copies of Fathom and Tinkerplots; Mackichan: copy of Scientific Workplace; Cambridge: book “Essentials of Statistical Inference”; Addison Wesley: 4 statistical software tutorial programs; SIAM: two books of choice; Wiley: book credit;Hawkes Learning: t-shirt; Sherman Chottiner: book “Mathematics: Alive and Applied”; Stat-Ease: copy of Design-Expert; Statistical Society of Canada: one-year membership; Cytel: StatXact; Visual Numerics: hats; COMSYS; Google: google merchandise
VOLUME 16, NO 2, DECEMBER 2005
� PAGE 20
Statistical Computing Section Officers 2005
Chair Tim [email protected](206) 802-2319
Chair-Elect Stephan Sain [email protected] (303) 556-8463
Past-Chair Carey E. [email protected] (410) 516-7200
Program Chair Susan Holmes, [email protected] (650) 725-1925
Program Chair-Elect Michael Trosset [email protected] (757) 221-2040
Secretary/Treasurer Graham J. [email protected] (312) 651-3671
COS Rep. 2005-07 Vincent Carey [email protected] (617) 525-2265
COS Rep. 2004-06 Robert Gentleman [email protected] (617) 632-5250
COS Rep. 2003-05 Roger W. Koenker [email protected] (216) 333-4558
Section to Co-sponsor Workshop on FAST MANIFOLD LEARNING
The Section on Statistical Computing will co-sponsor FAST MANIFOLD LEARNING, a 2-day workshop dedicated to the subject of scalable algorithms for nonlinear dimension reduction. Co-organized by two Section officers, Carey Priebe (Johns Hopkins University) and Michael Trosset (College of William & Mary), the work-shop will bring together approximately 20 eminent researchers from statistics, numerical analysis, and computer science, in order to share perspec-tives, learn about each other’s work, and identify critical issues for future research.
The promotion of interdisciplinary exchanges on the subject of FAST MANIFOLD LEARNING is a natural mission for the Section on Statistical Computing. Statisticians have devised numerous techniques for the nonlinear dimension reduction of multivariate data sets. Recent research in machine learning has produced new techniques, collectively de-scribed as manifold learning, that have been mar-keted with spectacular success. Although ad-vances by the statistics and the machine learning communities have not yet been fully assimilated, intimate connections abound. For example, Iso-map combines an ingenious approach to measur-ing geodesic distance on a nonlinear manifold with a straightforward application of classical mul-tidimensional scaling.
FAST MANIFOLD LEARNING is scheduled for April 14-15, 2006, in Williamsburg, VA. Other co-sponsors include the Interface Foundation of North America, the Office of Naval Research, Al-goTek Inc., and the College of William & Mary. Priebe and Trosset plan to edit a volume of papers by workshop participants, to be published as a special issue of a prominent journal.
VOLUME 16, NO 2, DECEMBER 2005
� PAGE 21
Newsletter EditorJuana Sanchez [email protected] (310) 825-1318
Electronic Communication Liaison Thomas F. Devlin [email protected] (973) 655-7244
Awards Officer Jose Pinheiro [email protected] (862) 778-8879
Publications Officer & webmaster R. Todd Ogden [email protected]
Continuing Education LiaisonJohn J. Miller [email protected] (703) 993-1690
Statistical Graphics Section Officers 2005
ChairMario Peruggia [email protected] (614) 292-0963
Chair-Elect Paul Ross Murrell [email protected] (649) 373-7599 x85392
Past Chair James E. Gentle [email protected] (703) 993-1994
Program Chair-Elect Juergen Symanzik [email protected](435) 797-0696
Secretary-Treasurer John Castelloe [email protected] (919) 677-8000
COS Rep Daniel B. Carr [email protected] (703) 993-1671
COS Rep Edward J. Wegman, [email protected] (703) 993-1680
COS Rep Naomi B. Robbins [email protected] (973) 694-2686
Newsletter Editor Dianne [email protected] (515) 294 8865
Electronic Communication Liaison Paul R. Murrell
Publications Officer Linda Williams Pickle, [email protected] (301) 402-9344
Council of Sections Governing Board Vice Chair Allan J. Rossman, [email protected] (805) 756-2861
Staff Liaison Monica D. Clark [email protected](703) 684-1221
VOLUME 16, NO 2, DECEMBER 2005
� PAGE 22
T
The Statistical Computing & Statistical Graphics Newsletter is a publication of the Statistical Comput-ing and Statistical Graphics Sections of the ASA. All communications regarding the publication should be addressed to:
Dianne Cook, Editor Statistical Graphics Section. Department of Statistics Iowa State University, Ames, IA 50011-1210 (515) 294 8865 Fax: (515) 294 4040 [email protected] www.public.iastate.edu/~dicook
and
Juana Sanchez, Editor Statistical Computing Sec-tion. Department of Statistics University of Cali-fornia, 8125 MS Building, Los Angeles, CA90095 (310) 825-1218 [email protected] www.stat.ucla.edu/~jsanchez/index.html
All communications regarding ASA membership and the Statistical Computing and Statistical Graphics Section, including change of address, should be sent to American Statistical Association, 1429 Duke Street Alexandria, VA 22314-3402 USA (703)684-1221, fax (703)684-2036 [email protected]
VOLUME 16, NO 2, DECEMBER 2005
� PAGE 23