Embed Size (px)
Citation preview
www.woodmac.com
Delivering commercial insight
What is This Stuff Really Worth?
A Wood Mackenzie Presentation forThe Center for Energy EconomicsBureau of Economic Geology2010 Annual Meeting and Natural Gas Forum
Edward M. KellyVice President, N Am. Gas and Power
November 29, 2010
Delivering commercial insight
www.woodmac.com
© Wood Mackenzie 2
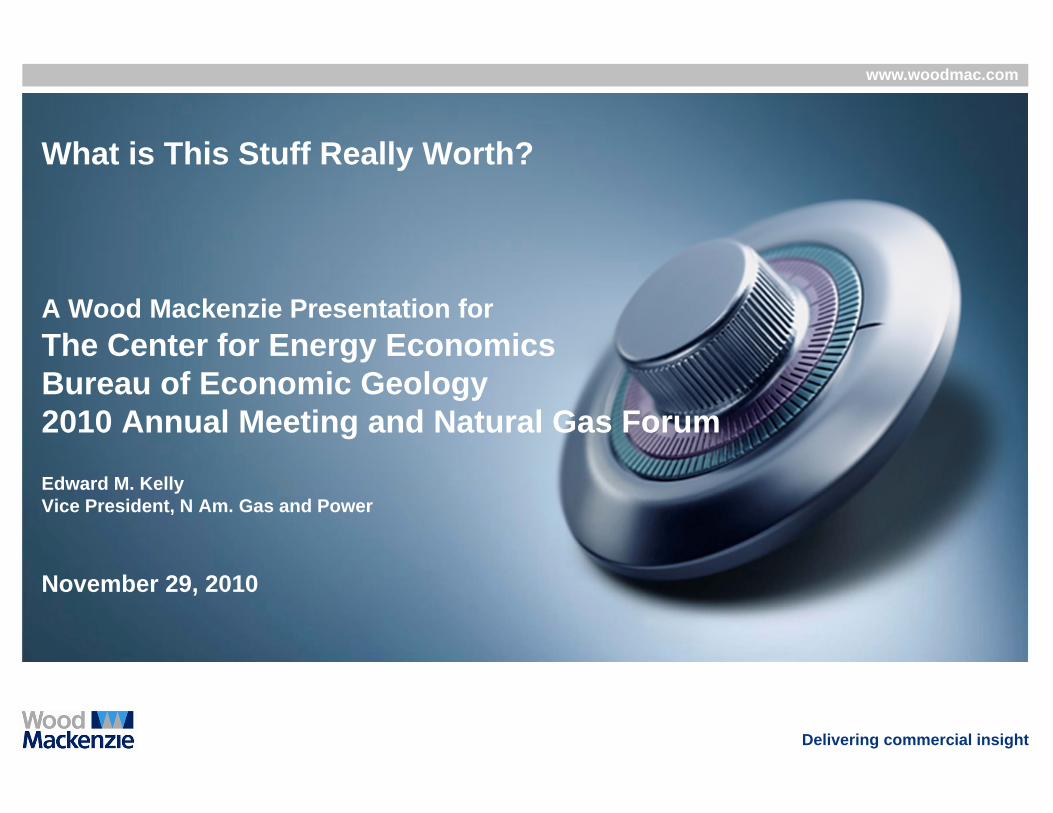
The New Big Picture—The Resource is There, But…Gas is Available in Any Feasible Quantity at a Moderate Price …But It’s Not $4.00.
Short-Term: Through early 2012• Weighted by sluggish economic recovery and supply strength; coal displacement continues to
influence the gas market
Mid-Term: Late 2012 - 2016• With an increasing call on production as demand growth resumes, there is potential for growing
pains as the market transitions from retrenchment to expansion; prices rise to the $5.75 - $7 range.
Long-Term: 2016 and Beyond• Consistent demand growth appears likely, with the pace of growth shaped by coal retirements,
potential carbon legislation and long-term US domestic resource strength.
• With the rebuilding of the upstream, pricing remains moderate: $6.50 - $7.50
Within this Base Case view of the North American market, policy and politics will become increasingly influential, and can shift the fundamentals
Delivering commercial insight
www.woodmac.com
© Wood Mackenzie 3
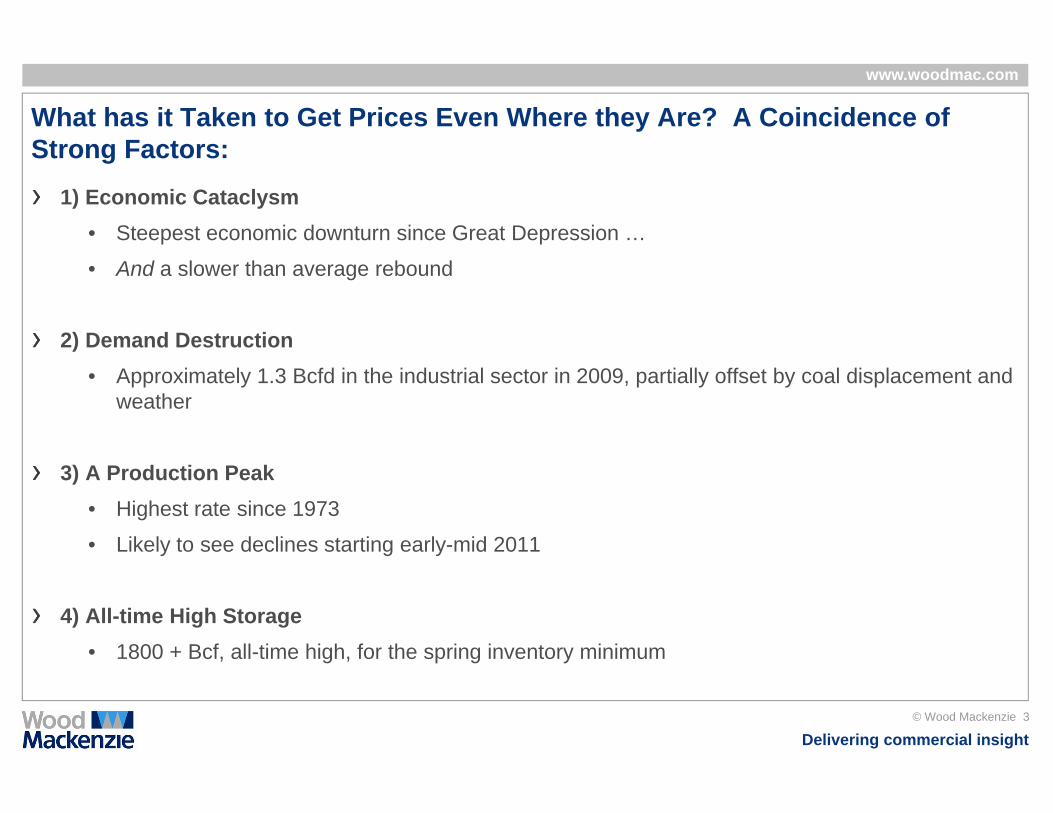
What has it Taken to Get Prices Even Where they Are? A Coincidence of Strong Factors:
1) Economic Cataclysm• Steepest economic downturn since Great Depression …
• And a slower than average rebound
2) Demand Destruction• Approximately 1.3 Bcfd in the industrial sector in 2009, partially offset by coal displacement and
weather
3) A Production Peak• Highest rate since 1973
• Likely to see declines starting early-mid 2011
4) All-time High Storage • 1800 + Bcf, all-time high, for the spring inventory minimum
Delivering commercial insight
www.woodmac.com
© Wood Mackenzie 4
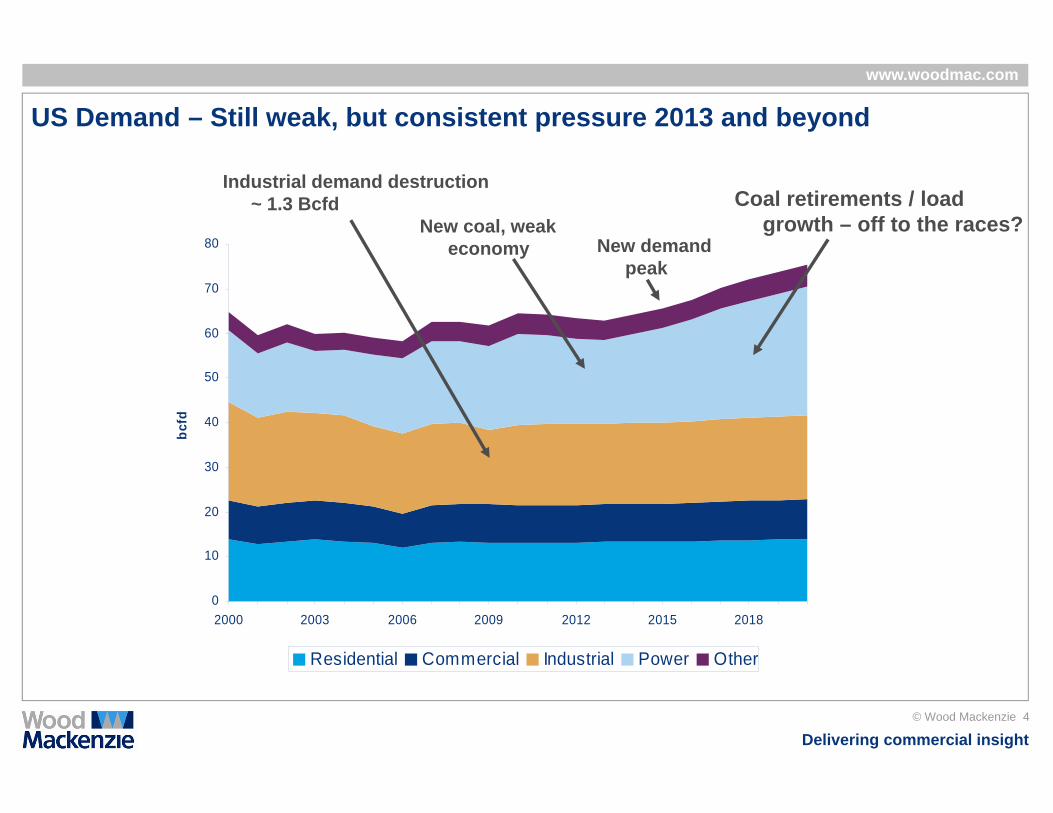
US Demand – Still weak, but consistent pressure 2013 and beyond
Industrial demand destruction ~ 1.3 Bcfd
0
10
20
30
40
50
60
70
80
2000 2003 2006 2009 2012 2015 2018
bcfd
Residential Commercial Industrial Power Other
New coal, weak economy
Coal retirements / load growth – off to the races?
New demand peak
Delivering commercial insight
www.woodmac.com
© Wood Mackenzie 5
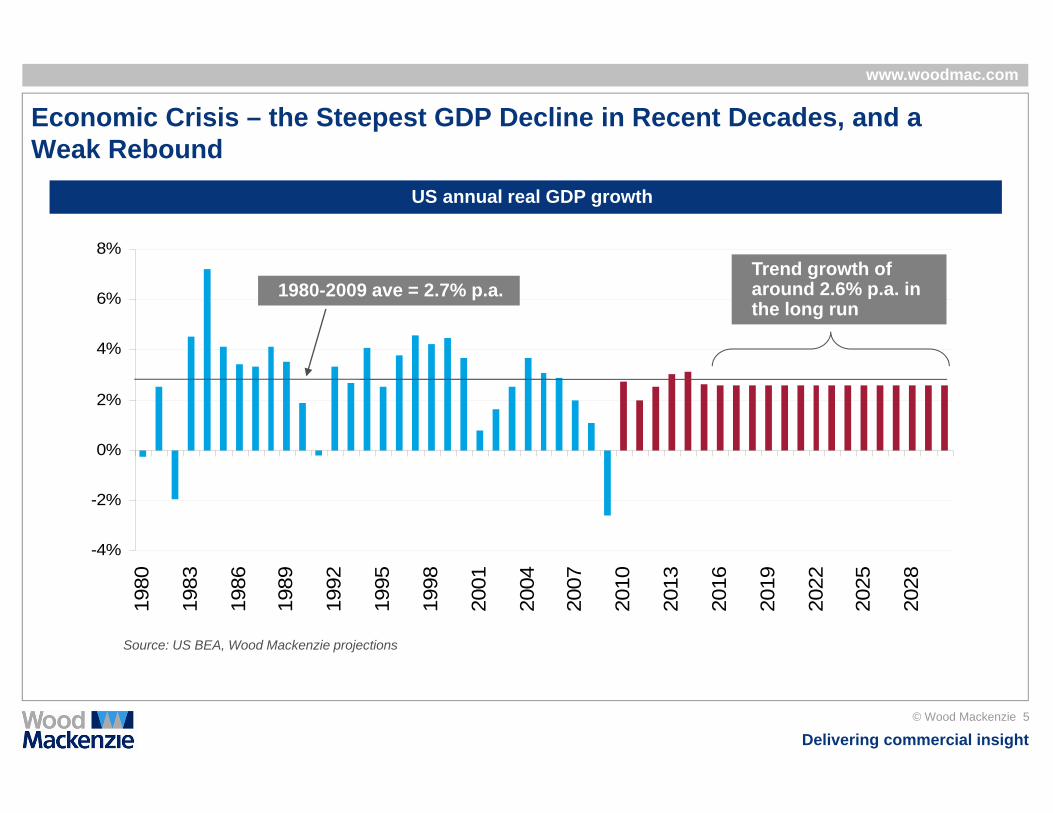
Economic Crisis – the Steepest GDP Decline in Recent Decades, and a Weak Rebound
Source: US BEA, Wood Mackenzie projections
US annual real GDP growth
-4%
-2%
0%
2%
4%
6%
8%
1980
1983
1986
1989
1992
1995
1998
2001
2004
2007
2010
2013
2016
2019
2022
2025
2028
Trend growth of around 2.6% p.a. in the long run
1980-2009 ave = 2.7% p.a.
Delivering commercial insight
www.woodmac.com
© Wood Mackenzie 6
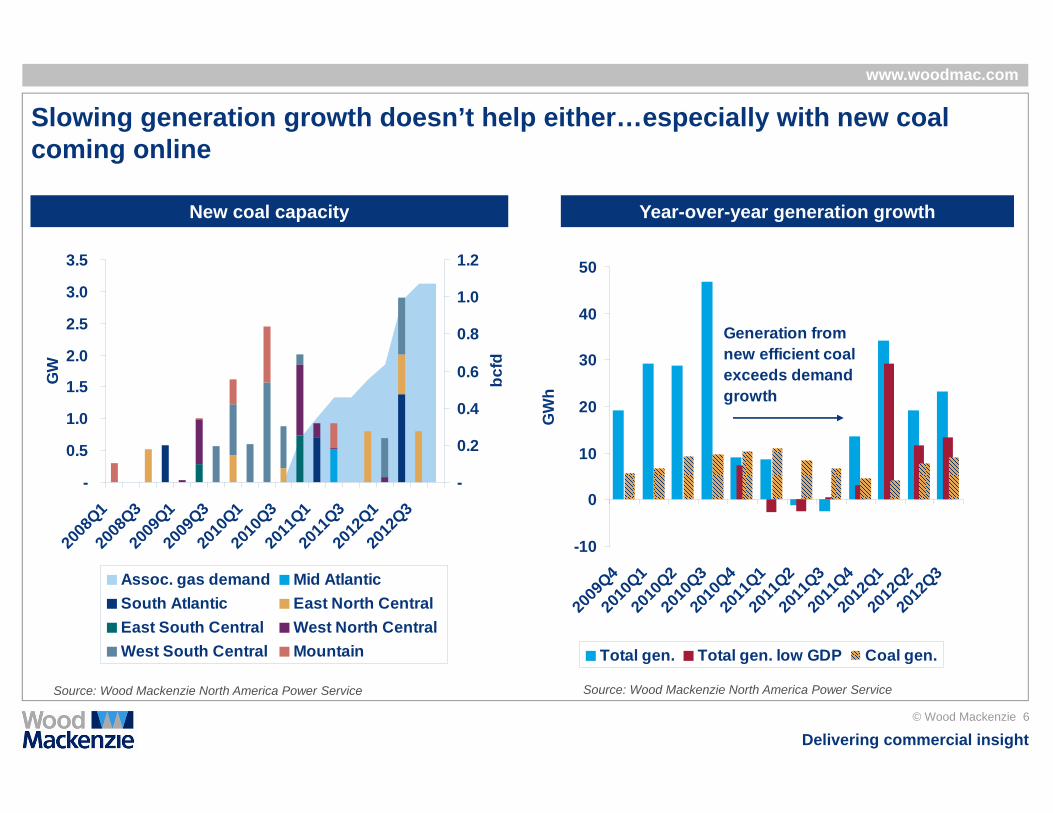
Slowing generation growth doesn’t help either…especially with new coal coming online
New coal capacity Year-over-year generation growth
-
0.5
1.0
1.5
2.0
2.5
3.0
3.5
2008
Q120
08Q3
2009
Q120
09Q3
2010
Q120
10Q3
2011
Q120
11Q3
2012
Q120
12Q3
GW
-
0.2
0.4
0.6
0.8
1.0
1.2
bcfd
Assoc. gas demand Mid AtlanticSouth Atlantic East North CentralEast South Central West North CentralWest South Central Mountain
-10
0
10
20
30
40
50
2009
Q420
10Q1
2010
Q220
10Q3
2010
Q420
11Q1
2011
Q220
11Q3
2011
Q420
12Q1
2012
Q220
12Q3
GW
h
Total gen. Total gen. low GDP Coal gen.
Generation from new efficient coal exceeds demand growth
Source: Wood Mackenzie North America Power Service Source: Wood Mackenzie North America Power Service
Delivering commercial insight
www.woodmac.com
© Wood Mackenzie 7
-0.51.01.52.02.53.03.54.04.55.0
Jan-09
Apr-09
Jul-0
9Oct-
09Ja
n-10Apr
-10Ju
l-10
Oct-10
Jan-11
Apr-11
Jul-1
1Oct-
11
bcfd
-2.5-2.0-1.5-1.0-0.5-0.51.01.5
$/m
mbt
u
Mid Atlantic South Atlantic East South CentralOther Coal-gas spread
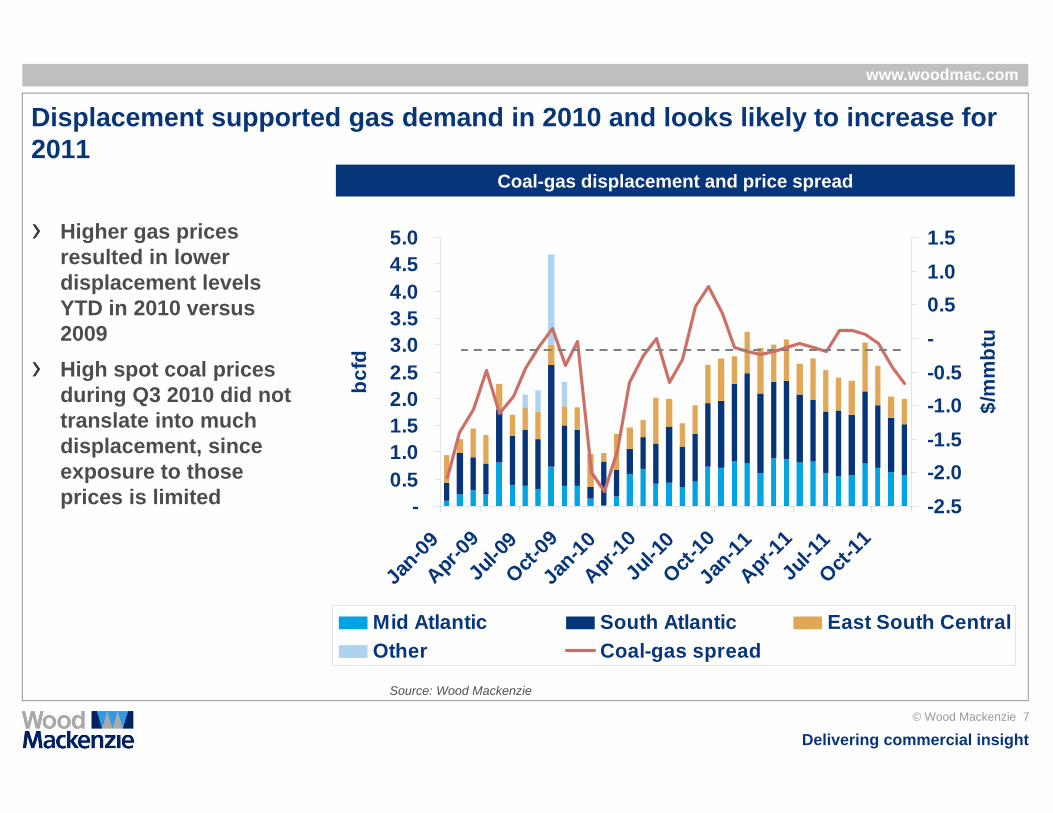
Displacement supported gas demand in 2010 and looks likely to increase for 2011
Higher gas prices resulted in lower displacement levels YTD in 2010 versus 2009High spot coal prices during Q3 2010 did not translate into much displacement, since exposure to those prices is limited
Coal-gas displacement and price spread
Source: Wood Mackenzie
Delivering commercial insight
www.woodmac.com
© Wood Mackenzie 8
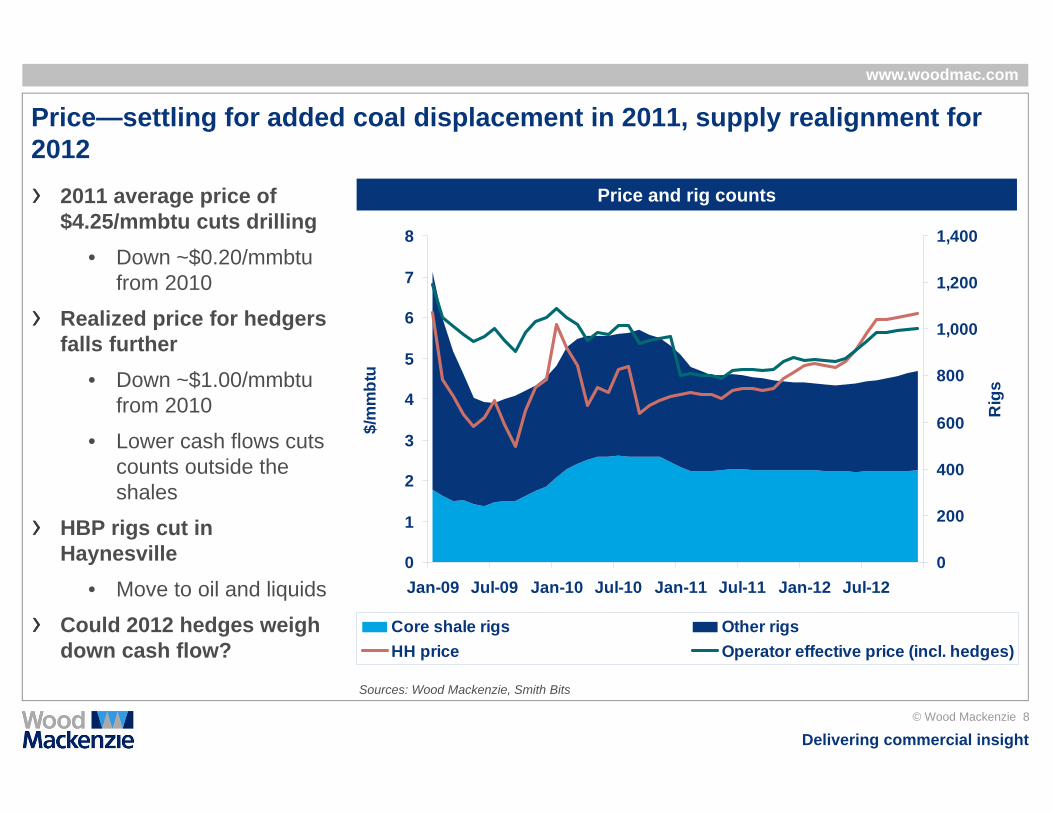
Price—settling for added coal displacement in 2011, supply realignment for 2012
2011 average price of $4.25/mmbtu cuts drilling
• Down ~$0.20/mmbtu from 2010
Realized price for hedgers falls further
• Down ~$1.00/mmbtu from 2010
• Lower cash flows cuts counts outside the shales
HBP rigs cut in Haynesville
• Move to oil and liquids
Could 2012 hedges weigh down cash flow?
Price and rig counts
0
1
2
3
4
5
6
7
8
Jan-09 Jul-09 Jan-10 Jul-10 Jan-11 Jul-11 Jan-12 Jul-12
$/m
mbt
u
0
200
400
600
800
1,000
1,200
1,400
Rig
s
Core shale rigs Other rigsHH price Operator effective price (incl. hedges)
Sources: Wood Mackenzie, Smith Bits
Delivering commercial insight
www.woodmac.com
© Wood Mackenzie 9
55.5
56.0
56.5
57.0
57.5
58.0
58.5
59.0
59.5
2009 2010 2011 2012 2013 2014
bcfd
0
100
200
300
400
500
600
US Production Key Shale Other Rigs
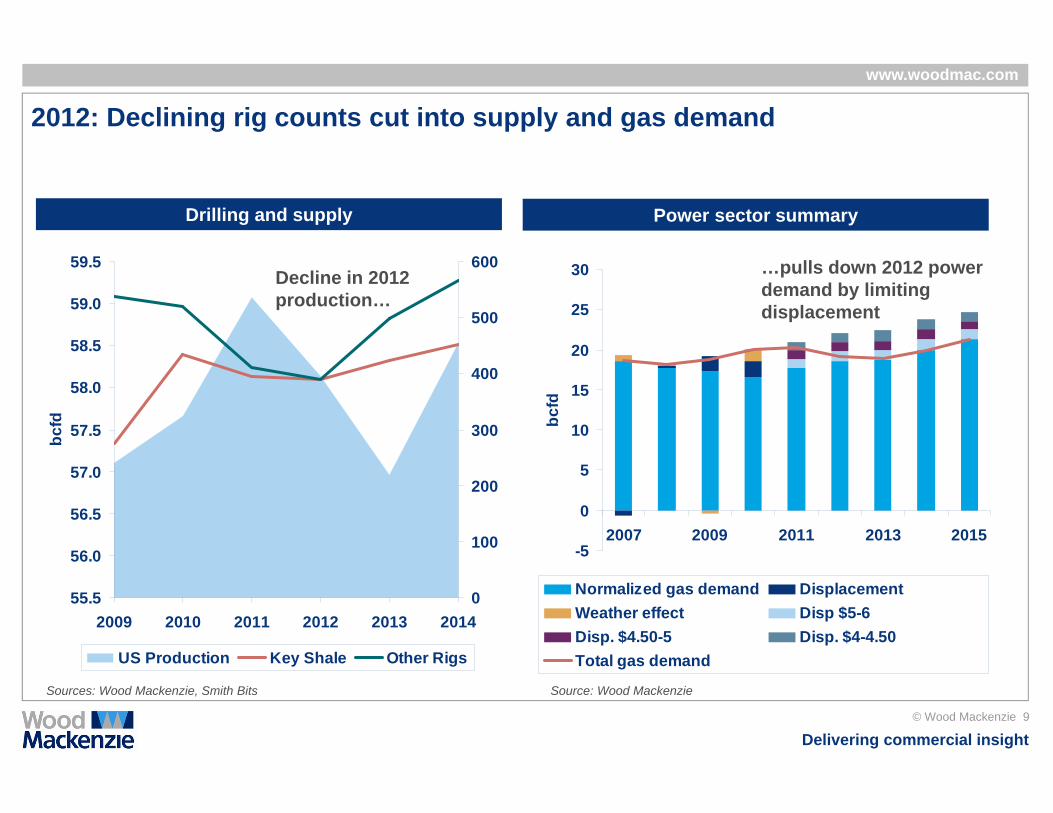
2012: Declining rig counts cut into supply and gas demand
Power sector summary
-5
0
5
10
15
20
25
30
2007 2009 2011 2013 2015bc
fd
Normalized gas demand DisplacementWeather effect Disp $5-6Disp. $4.50-5 Disp. $4-4.50Total gas demand
Drilling and supply
Decline in 2012 production…
…pulls down 2012 power demand by limiting displacement
Sources: Wood Mackenzie, Smith Bits Source: Wood Mackenzie
Delivering commercial insight
www.woodmac.com
© Wood Mackenzie 10
Drilling down the price: short-term market messages
Market soft again in 2011• Demand weakened by decelerating GDP, new coal
• Supply growth continues, but rig counts decline as HBPs, favorable hedges fade
• Added displacement balances the market
• Firming coal markets limit the price declines—Henry Hub price of $4.25/mmbtu
• Downside risk into upper $3/mmbtu from La Nina, coal market downshift, potential double-dip
2012-’13 markets transition to higher price levels• Demand potential increases, realized demand declines
• Supply drops off, competition with oil and liquids mutes rig increase as prices recover
• Henry Hub prices in the $5/mmbtu range, aligned drilling-price incentives reduce downside risk
Risks to outlook• Haynesville is key, higher-than-expected drilling levels or improved well performance would
hold price down
• How does oil play out?
Delivering commercial insight
www.woodmac.com
© Wood Mackenzie 11
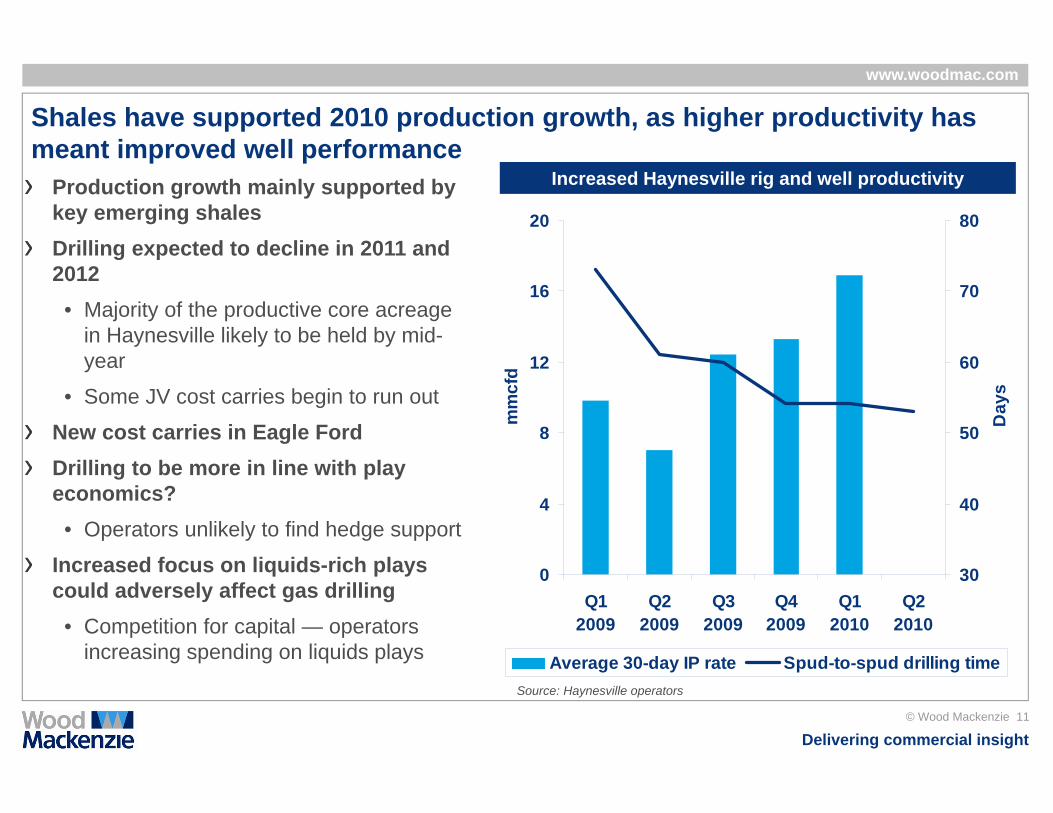
Shales have supported 2010 production growth, as higher productivity has meant improved well performance
Production growth mainly supported by key emerging shalesDrilling expected to decline in 2011 and 2012
• Majority of the productive core acreage in Haynesville likely to be held by mid-year
• Some JV cost carries begin to run out
New cost carries in Eagle FordDrilling to be more in line with play economics?
• Operators unlikely to find hedge support
Increased focus on liquids-rich plays could adversely affect gas drilling
• Competition for capital — operators increasing spending on liquids plays
Increased Haynesville rig and well productivity
0
4
8
12
16
20
Q12009
Q22009
Q32009
Q42009
Q12010
Q22010
mm
cfd
30
40
50
60
70
80
Day
s
Average 30-day IP rate Spud-to-spud drilling timeSource: Haynesville operators
Delivering commercial insight
www.woodmac.com
© Wood Mackenzie 12
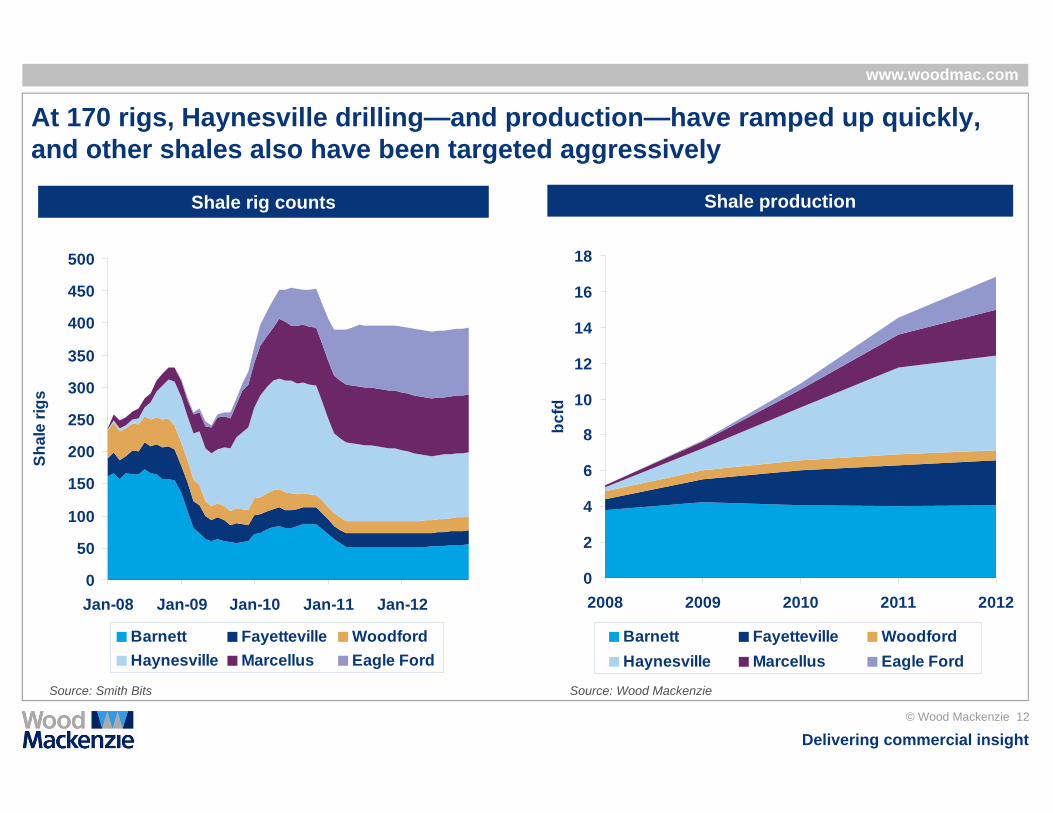
At 170 rigs, Haynesville drilling—and production—have ramped up quickly, and other shales also have been targeted aggressively
Shale rig counts Shale production
0
2
4
6
8
10
12
14
16
18
2008 2009 2010 2011 2012
bcfd
Barnett Fayetteville WoodfordHaynesville Marcellus Eagle Ford
Source: Wood MackenzieSource: Smith Bits
0
50
100
150
200
250
300
350
400
450
500
Jan-08 Jan-09 Jan-10 Jan-11 Jan-12
Shal
e rig
s
Barnett Fayetteville WoodfordHaynesville Marcellus Eagle Ford
Delivering commercial insight
www.woodmac.com
© Wood Mackenzie 13
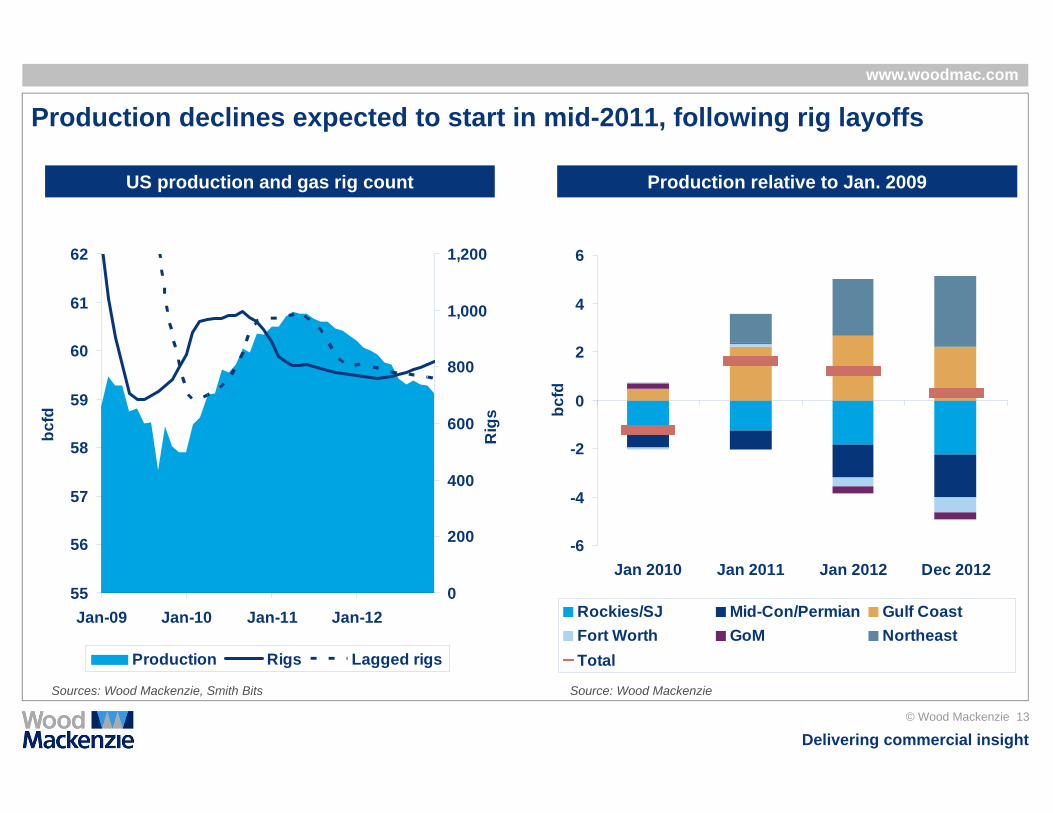
Production declines expected to start in mid-2011, following rig layoffs
Production relative to Jan. 2009US production and gas rig count
55
56
57
58
59
60
61
62
Jan-09 Jan-10 Jan-11 Jan-12
bcfd
0
200
400
600
800
1,000
1,200
Rig
s
Production Rigs Lagged rigs
-6
-4
-2
0
2
4
6
Jan 2010 Jan 2011 Jan 2012 Dec 2012bc
fd
Rockies/SJ Mid-Con/Permian Gulf CoastFort Worth GoM NortheastTotal
Source: Wood MackenzieSources: Wood Mackenzie, Smith Bits
Delivering commercial insight
www.woodmac.com
© Wood Mackenzie 14
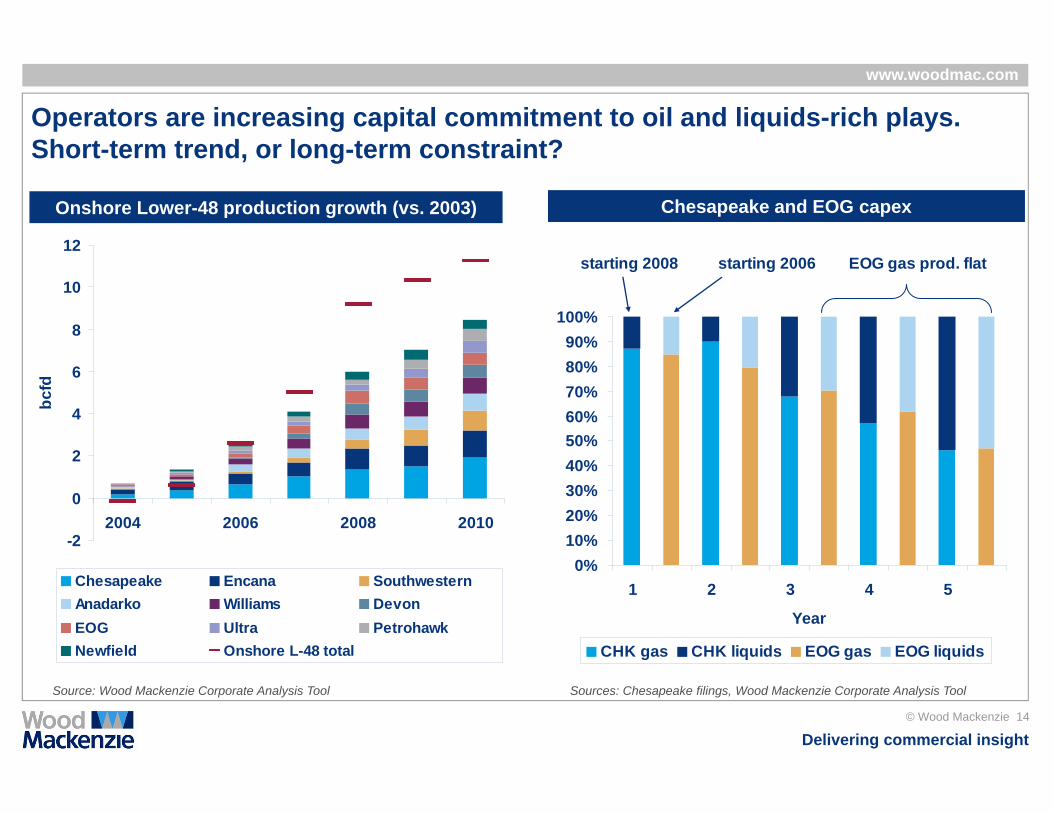
Operators are increasing capital commitment to oil and liquids-rich plays. Short-term trend, or long-term constraint?
Onshore Lower-48 production growth (vs. 2003) Chesapeake and EOG capex
-2
0
2
4
6
8
10
12
2004 2006 2008 2010
bcfd
Chesapeake Encana SouthwesternAnadarko Williams DevonEOG Ultra PetrohawkNewfield Onshore L-48 total
Sources: Chesapeake filings, Wood Mackenzie Corporate Analysis ToolSource: Wood Mackenzie Corporate Analysis Tool
0%10%20%30%40%50%60%70%80%90%
100%
1 2 3 4 5
Year
CHK gas CHK liquids EOG gas EOG liquids
starting 2008 starting 2006 EOG gas prod. flat
Delivering commercial insight
www.woodmac.com
© Wood Mackenzie 15
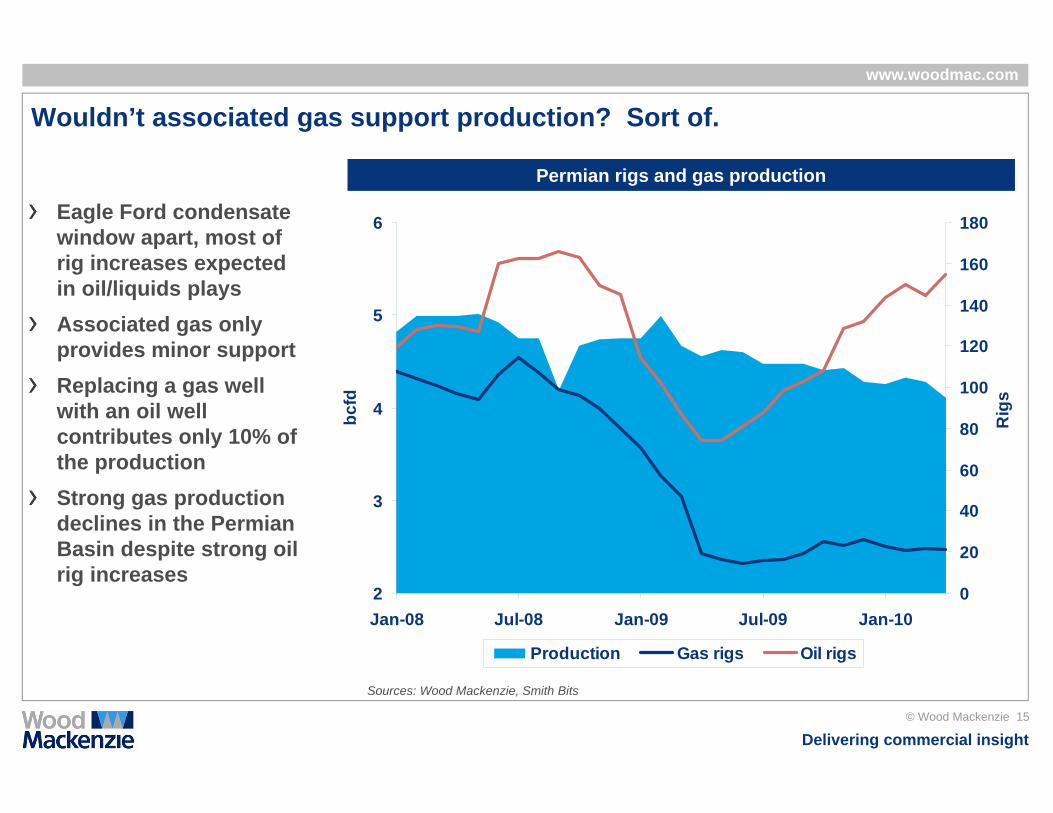
Wouldn’t associated gas support production? Sort of.
Eagle Ford condensate window apart, most of rig increases expected in oil/liquids playsAssociated gas only provides minor supportReplacing a gas well with an oil well contributes only 10% of the productionStrong gas production declines in the Permian Basin despite strong oil rig increases
Permian rigs and gas production
2
3
4
5
6
Jan-08 Jul-08 Jan-09 Jul-09 Jan-10
bcfd
0
20
40
60
80
100
120
140
160
180
Rig
s
Production Gas rigs Oil rigs
Sources: Wood Mackenzie, Smith Bits
Delivering commercial insight
www.woodmac.com
© Wood Mackenzie 16
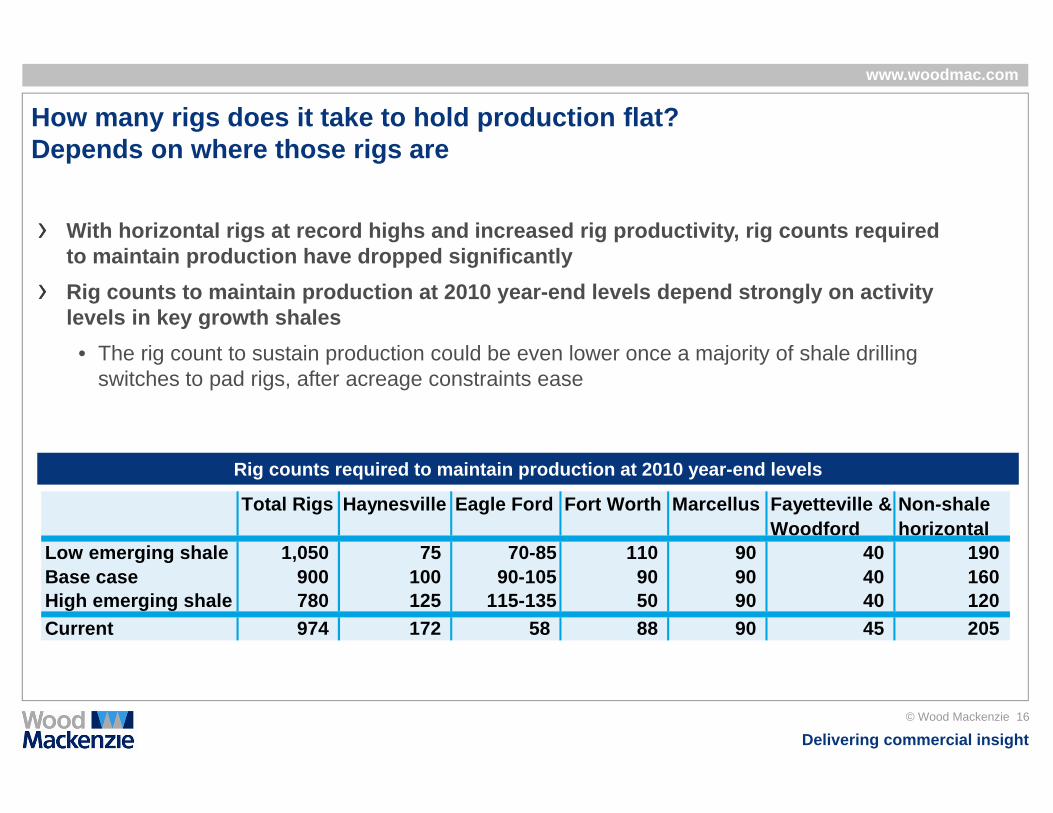
How many rigs does it take to hold production flat?Depends on where those rigs are
With horizontal rigs at record highs and increased rig productivity, rig counts required to maintain production have dropped significantlyRig counts to maintain production at 2010 year-end levels depend strongly on activity levels in key growth shales
• The rig count to sustain production could be even lower once a majority of shale drilling switches to pad rigs, after acreage constraints ease
Rig counts required to maintain production at 2010 year-end levels
Total Rigs Haynesville Eagle Ford Fort Worth Marcellus Fayetteville & Woodford
Non-shale horizontal
Low emerging shale 1,050 75 70-85 110 90 40 190Base case 900 100 90-105 90 90 40 160High emerging shale 780 125 115-135 50 90 40 120Current 974 172 58 88 90 45 205
Delivering commercial insight
www.woodmac.com
© Wood Mackenzie 17
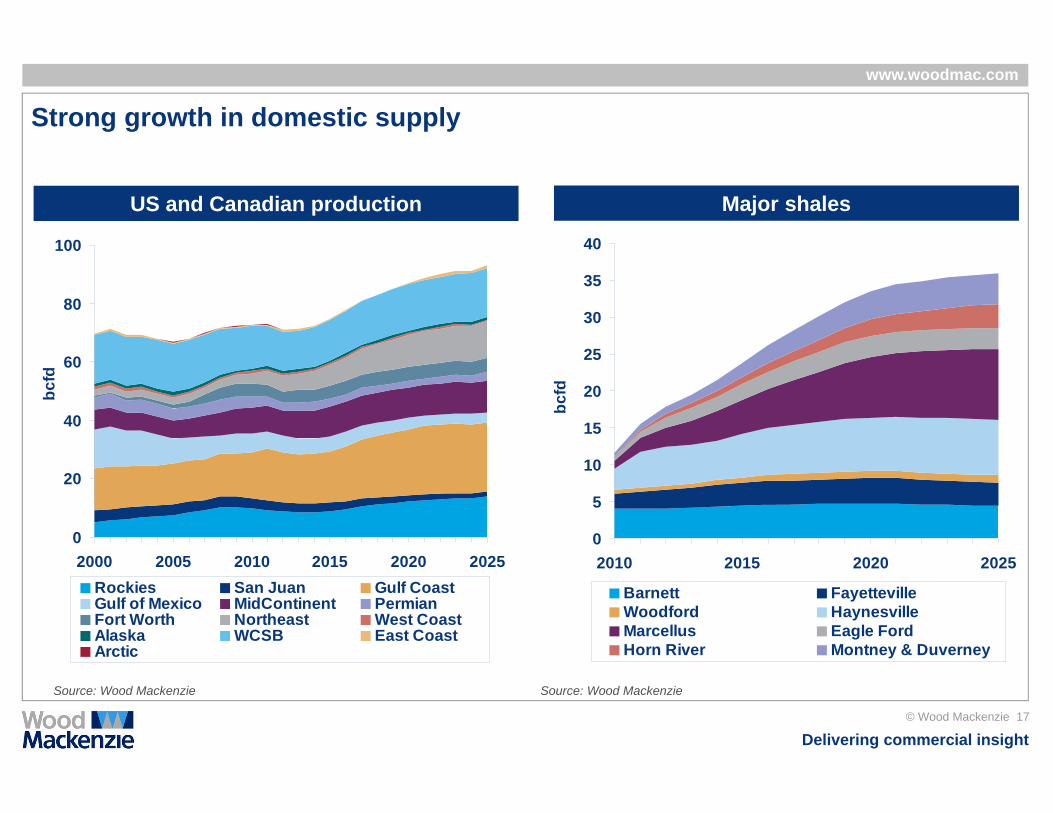
Strong growth in domestic supply
US and Canadian production Major shales
0
20
40
60
80
100
2000 2005 2010 2015 2020 2025
bcfd
Rockies San Juan Gulf CoastGulf of Mexico MidContinent PermianFort Worth Northeast West CoastAlaska WCSB East CoastArctic
0
5
10
15
20
25
30
35
40
2010 2015 2020 2025bc
fd
Barnett FayettevilleWoodford HaynesvilleMarcellus Eagle FordHorn River Montney & Duverney
Source: Wood MackenzieSource: Wood Mackenzie
Delivering commercial insight
www.woodmac.com
© Wood Mackenzie 18
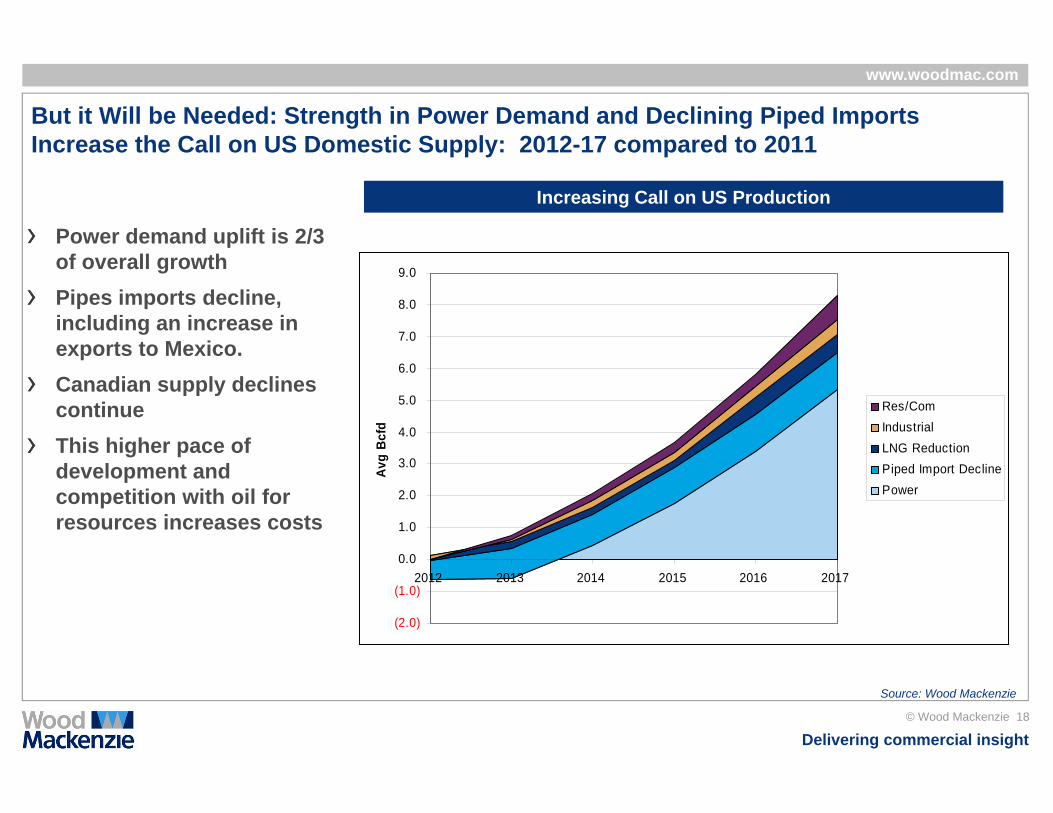
But it Will be Needed: Strength in Power Demand and Declining Piped Imports Increase the Call on US Domestic Supply: 2012-17 compared to 2011
Power demand uplift is 2/3 of overall growthPipes imports decline, including an increase in exports to Mexico.Canadian supply declines continueThis higher pace of development and competition with oil for resources increases costs
Increasing Call on US Production
Source: Wood Mackenzie
(2.0)
(1.0)
0.0
1.0
2.0
3.0
4.0
5.0
6.0
7.0
8.0
9.0
2012 2013 2014 2015 2016 2017
Avg
Bcfd
Res/ComIndustrialLNG ReductionPiped Import DeclinePower
Delivering commercial insight
www.woodmac.com
© Wood Mackenzie 19
30
35
40
45
50
55
60
65
70
75
80
2000 2004 2008 2012 2016 2020 2024
bcfd
Other Key Shale
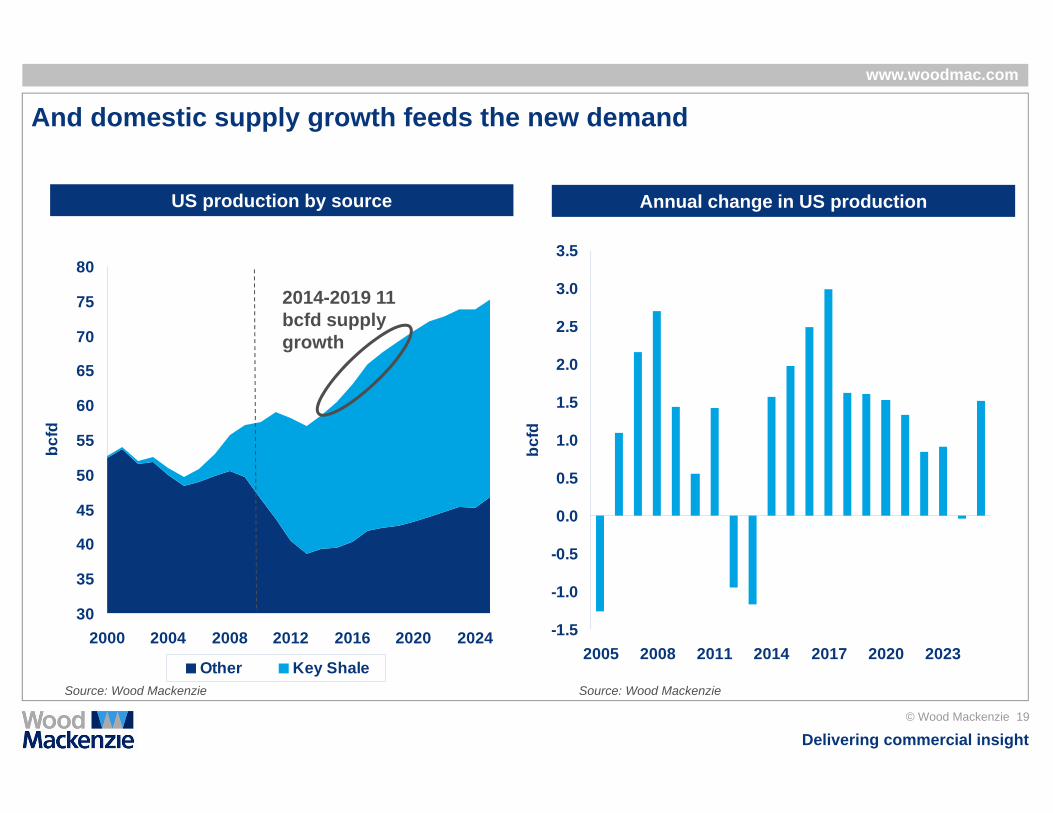
And domestic supply growth feeds the new demand
US production by source Annual change in US production
2014-2019 11 bcfd supply growth
-1.5
-1.0
-0.5
0.0
0.5
1.0
1.5
2.0
2.5
3.0
3.5
2005 2008 2011 2014 2017 2020 2023
bcfd
Source: Wood MackenzieSource: Wood Mackenzie
Delivering commercial insight
www.woodmac.com
© Wood Mackenzie 20
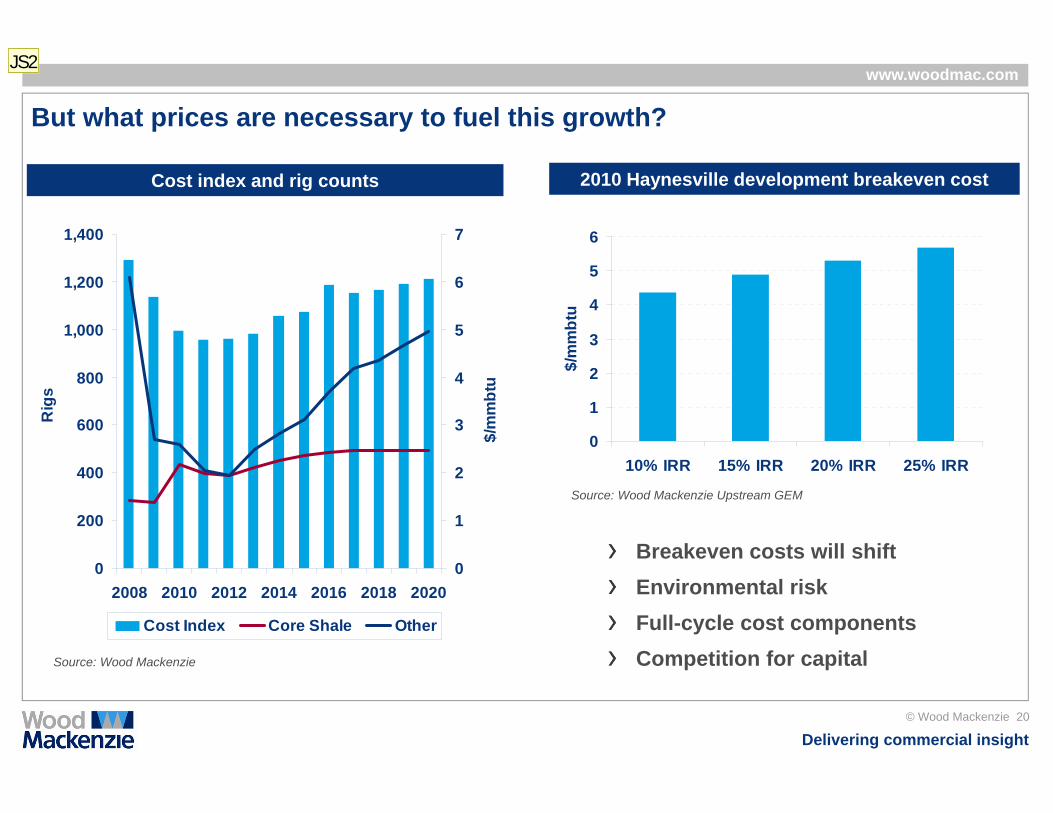
But what prices are necessary to fuel this growth?
Cost index and rig counts 2010 Haynesville development breakeven cost
Breakeven costs will shiftEnvironmental riskFull-cycle cost componentsCompetition for capital
0
200
400
600
800
1,000
1,200
1,400
2008 2010 2012 2014 2016 2018 2020
Rig
s
0
1
2
3
4
5
6
7
$/m
mbt
u
Cost Index Core Shale Other
0
1
2
3
4
5
6
10% IRR 15% IRR 20% IRR 25% IRR
$/m
mbt
u
Source: Wood Mackenzie
Source: Wood Mackenzie Upstream GEM
JS2

Slide 20
JS2 Jen Snyder, 10/12/2010
Delivering commercial insight
www.woodmac.com
© Wood Mackenzie 21
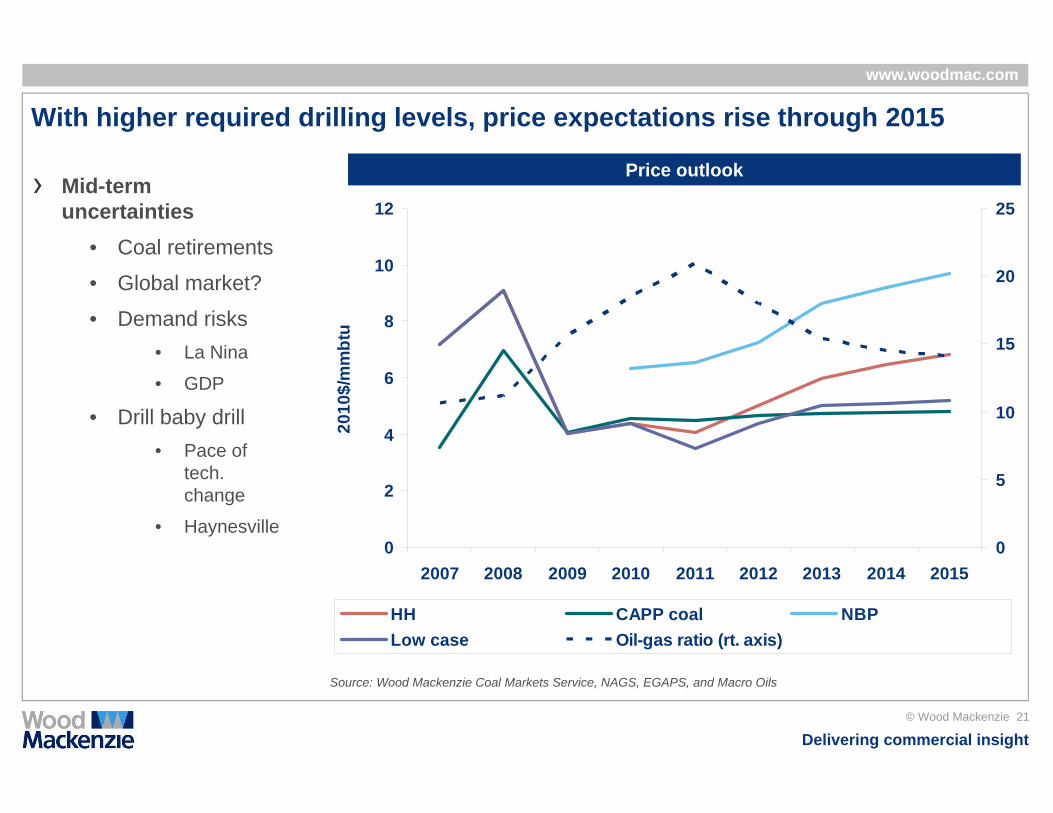
With higher required drilling levels, price expectations rise through 2015
Mid-term uncertainties
• Coal retirements
• Global market?
• Demand risks• La Nina
• GDP
• Drill baby drill• Pace of
tech. change
• Haynesville0
2
4
6
8
10
12
2007 2008 2009 2010 2011 2012 2013 2014 2015
2010
$/m
mbt
u
0
5
10
15
20
25
HH CAPP coal NBPLow case Oil-gas ratio (rt. axis)
Source: Wood Mackenzie Coal Markets Service, NAGS, EGAPS, and Macro Oils
Price outlook
Delivering commercial insight
www.woodmac.com
© Wood Mackenzie 22
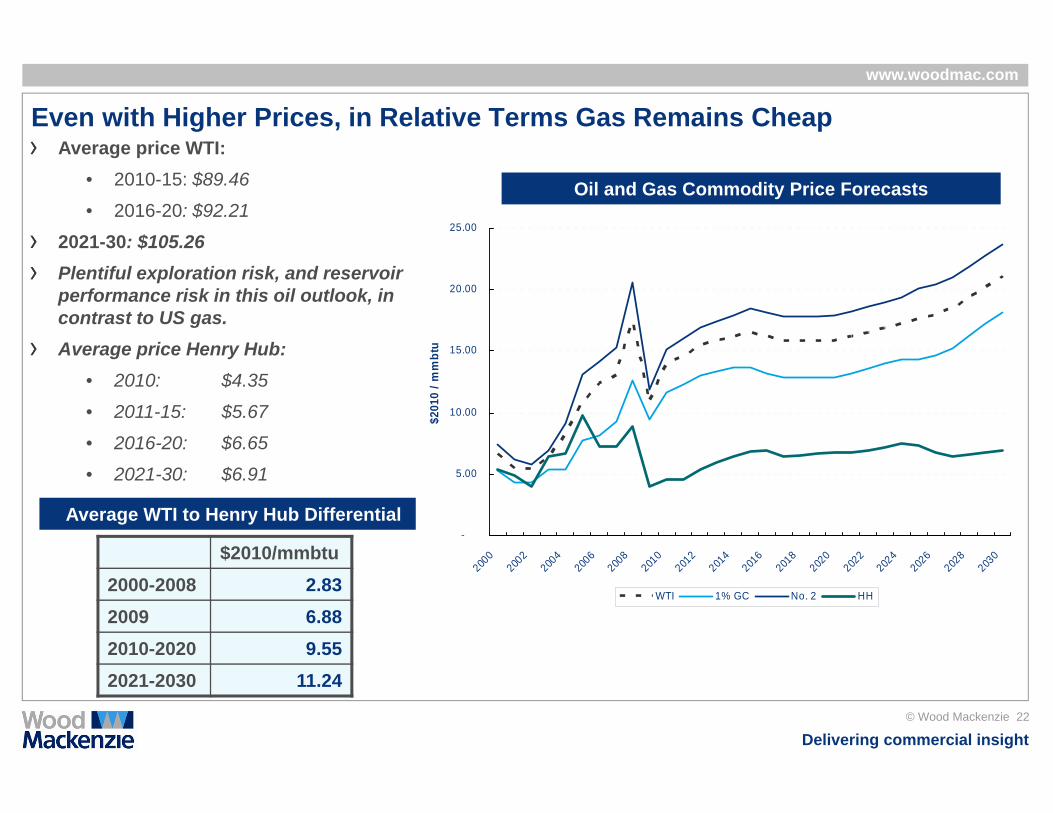
Even with Higher Prices, in Relative Terms Gas Remains Cheap
Oil and Gas Commodity Price Forecasts
Average price WTI:• 2010-15: $89.46
• 2016-20: $92.21
2021-30: $105.26Plentiful exploration risk, and reservoir performance risk in this oil outlook, in contrast to US gas.Average price Henry Hub:
• 2010: $4.35
• 2011-15: $5.67
• 2016-20: $6.65
• 2021-30: $6.91
$2010/mmbtu2000-2008 2.832009 6.882010-2020 9.552021-2030 11.24
Average WTI to Henry Hub Differential-
5.00
10.00
15.00
20.00
25.00
2000
2002
2004
2006
2008
2010
2012
2014
2016
2018
2020
2022
2024
2026
2028
2030
$20
10 /
mm
btu
WTI 1% GC No. 2 HH
Delivering commercial insight
www.woodmac.com
© Wood Mackenzie 23
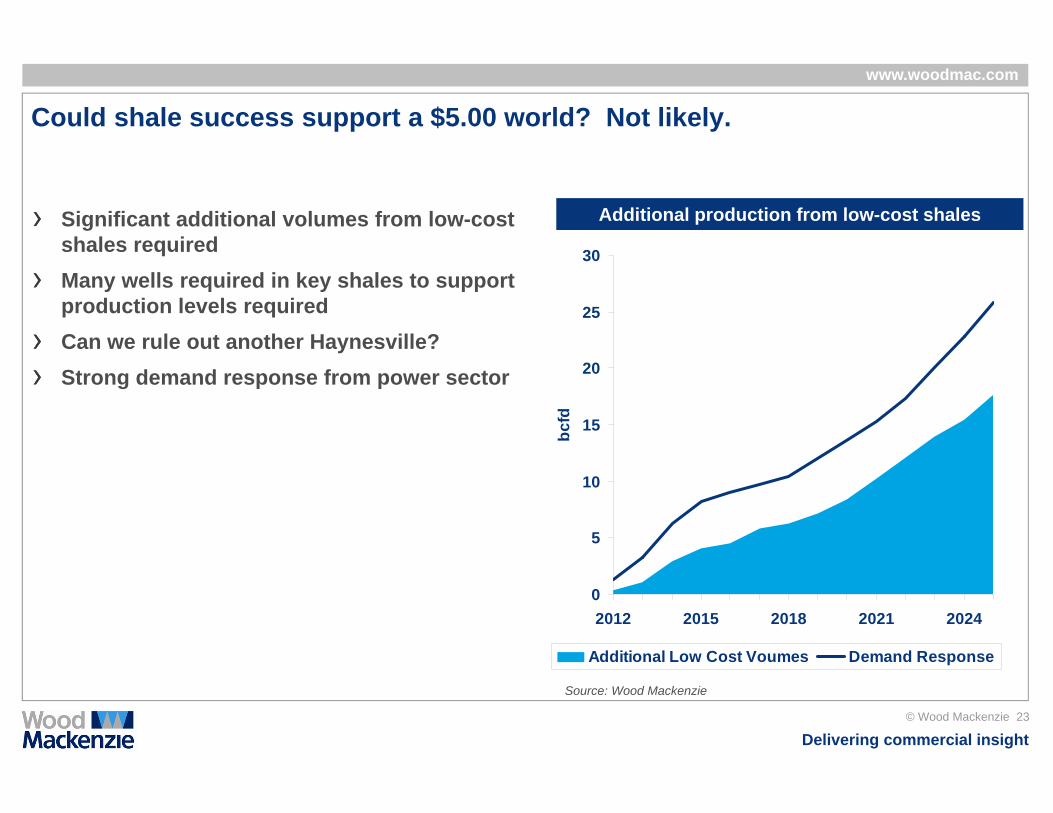
Could shale success support a $5.00 world? Not likely.
Significant additional volumes from low-cost shales requiredMany wells required in key shales to support production levels required Can we rule out another Haynesville?Strong demand response from power sector
Additional production from low-cost shales
0
5
10
15
20
25
30
2012 2015 2018 2021 2024
bcfd
Additional Low Cost Voumes Demand Response
Source: Wood Mackenzie
Delivering commercial insight
www.woodmac.com
© Wood Mackenzie 24
The Bottom Line
The Natural Gas Resource Base is There, But …
It’s Not a $4.00 - $5.00 Fuel
(Possibly $6-$7 though)
Source: Wood Mackenzie
Delivering commercial insight
www.woodmac.com
© Wood Mackenzie 25
Wood Mackenzie
Kintore House74-77 Queen StreetEdinburgh EH2 4NS
Global Contact Details
Europe +44 (0)131 243 4400Americas +1 713 470 1600Asia Pacific +65 6518 0800Email [email protected]
Global Offices
Australia - Canada - China - Japan - Malaysia - Russia - Singapore - South Africa - United Arab Emirates - United Kingdom - United States
Wood Mackenzie has been providing its unique range of research products and consulting services to the Energy industry for over 30 years. Wood Mackenzie provides forward-looking commercial insight that enables clients to make better business decisions. For more information visit: www.woodmac.com